I I I I I I I I I I I I - International Nuclear Information System (INIS)
Upload
independentCategory
view
3download
0
Plant Physiol. (1 996) 11 1 : 127-1 36
Photosystem I I Excitation Pressure and Photosynthetic Carbon Metabolism in Chlorella vulgark'
Leonid V. Savitch, Denis P. Maxwell', and Norman P. A. Huner*
Department of Plant Sciences, University of Western Ontario, London, Canada N6A 5B7
Ch/ore//a vulgaris grown at 5"C/l50 pmol m-' s-' mimics cells grown under high irradiance (27"C/2200 pmol m-' s-l). This has been rationalized through the suggestion that both populations of cells were exposed to comparable photosystem I1 (PSII) excitation pressures measured as the chlorophyll a fluorescence quenching parameter, 1 - qP (D.P. Maxwell, S. Falk, N.P.A. Huner [19951 Plant Physiol 107: 687-694). To asses the possible role($ of feed- back mechanisms on PSll excitation pressure, stromal and cytosolic carbon metabolism were examined. Sucrose phosphate synthase and fructose-l,6-bisphosphatase activities as well as the ratios of fructose-l,6-bisphosphate/fructose-6-phosphate and sucrose/starch indicated that cells grown at 27"C/2200 pmol m-'s -' appeared to exhibit a restriction in starch metabolism. In contrast, cells grown at S0C/l5O pmol m-* s-l appeared to exhibit a restriction in the sucrose metabolism based on decreased cytosolic fructose-l,6- bisphosphatase and sucrose phosphate synthase activities as well as a low sucrose/starch ratio. These metabolic restrictions may feed- back on photosynthetic electron transport and, thus, contribute to the observed PSll excitation pressure. We conclude that, although PSll excitation pressure may reflect redox regulation of photosyn- thetic acclimation to light and temperature in C. vulgaris, it cannot be considered the primary redox signal. Alternative metabolic sens- ing/signaling mechanisms are discussed.
Recently, we reported that growth of Chlorella vulgavis at 5°C and 150 pmol m-'s-l results in the development of greater tolerance to high light at low temperature (2000 pmol m-' s-l at 5°C) than cells grown at 27°C and 150 pmol m-'s-' (Maxwell et al., 1994, 1995a). Photosynthetic adjustment at the leve1 of pigment content and composi- tion, Chl alb, LHCII abundance, O, evolution, and in- creased tolerance to photoinhibition, which were assumed previously to be responses to low growth temperature, do not represent responses to growth temperature per se. Rather, these changes in the structure and composition of the photosynthetic apparatus reflect photosynthetic adjust- ment to growth under high PSII excitation. Excitation pres-
This research was supported by a Natural Sciences and Engi- neering Research Council of Canada (NSERCC) research grant to N.P.A.H. L.V.S. was supported, in part, by an NSERCC Interna- tional Scientific Exchange Award. D.P.M. was supported, in part, by an Ontario Graduate Scholarship.
Present address: Michigan State University (MSU)-Depart- ment of Energy Plant Research Laboratory, MSU, East Lansing, MI 48824-1312.
* Corresponding author; e-mail [email protected]; fax 1-519-661-3935.
127
sure is estimated as 1 - qP (Dietz et al., 1985; Demmig- Adams et al., 1990; Ogren, 1991), where qP is the photochemical quenching coefficient (Bradbury and Baker, 1981; van Kooten and Snel, 1990) and is an estimate of the proportion of QA in the reduced state [(QA)red/(QA)ox + (QA)red] in functional PSII units. Thus, photosynthetic ad- justment in C. vulgaris reflects a response to changes in the redox poise of intersystem electron transport. We reported that Chlovella grown at 5°C and an irradiance of 150 pmol m-2 s-l (5/150) were exposed to a predicted PSII excita- tion pressure that was equivalent to cells grown at 27°C and 2200 pmol m-' s-l (27/2200) (Maxwell et al., 1995a). Based on light response curves for C0,-saturated O, evo- lution, room temperature Chl a fluorescence, pigment con- tent and composition, LHCII abundance, and tolerance to photoinhibition, cells grown at 5°C and moderate irradi- ance were indeed equivalent to cells grown at high light and 27°C. Similarly, Chlorella grown at 5/20 were equiva- lent to cells grown at 27/150 (Maxwell et al., 1995a). Thus, we concluded that PSII excitation pressure, that is, the redox poise of intersystem electron transport, can be mod- ulated to a similar extent either by reducing the tempera- ture at a constant irradiance or by increasing irradiance at a constant temperature. Recently, we confirmed that higher plants (Gray et al., 1996) and cyanobacteria (S. Falk, D. Maxwell, N. Huner, and D. Laudenbach, unpublished data) also respond developmentally as well as photosyn- thetically to this altered redox poise. In addition, we have shown that regulation of cab mRNA abundance and LHCII apoprotein levels in Dunaliella salina are under similar re- dox control (Maxwell et al., 199513).
The redox poise of intersystem electron transport will change as a consequence of any imbalance between light energy absorbed through photochemistry and energy used through intersystem electron transport, photosynthetic car- bon metabolism, and photorespiration, as well as any other metabolic process that consumes ATP and / or NADPH.
Abbreviations: CABP, 2-carboxyarabinitol 1,5-bisphosphate; Chl, chlorophyll; dH,O, distilled H,O; FBPase, fructose-1,6- bisphosphatase; Fru-1,6-BP, fructose-1,6-bisphosphate; GAPDH, glyceraldehydephosphate dehydrogenase; Glc-6PDH, glucose-6- phosphate dehydrogenase; HEP, high PSII excitation pressure; HK, hexokinase; k,,,, catalytic turnover number for Rubisco; LEP, low PSII excitation pressure; LHCII, light-harvesting complex 11; PGA, 3-phosphoglycerate; PGI, phosphoglucoisomerase; QA, pri- mary electron accepting plastoquinone of PSII; RuBP, ribulose 1,s-bisphosphate; SI'S, sucrose phosphate synthase; triose-P, triose phosphate.
www.plant.org on May 24, 2015 - Published by www.plantphysiol.orgDownloaded from Copyright © 1996 American Society of Plant Biologists. All rights reserved.

128 Savitch et al. Plant Physiol. Vol. 11 1, 1996
Low temperature imposes thermodynamic constraints on the rates of biochemical reactions and, as a result, plants exposed to low temperature also exhibit reduced rates of photosynthesis. Short-term effects of low temperature on photosynthesis and carbon metabolism have been exam- ined in detail in higher plants (Leegood, 1985, 1995; Lee- good and Furbank, 1986; Stitt et al., 1987; Stitt and Grosse, 1988; Labate et al., 1990; Paul et al., 1990, 1992; Holaday et al., 1992; Guy et al., 1992). The general consensus appears to be that low temperature inhibition of photosynthesis, in the short term, reflects feedback regulation and is the result of low temperature limitations in Suc synthesis, which results in Pi limitation of the chloroplast. This limits the rate at which ATP can be biosynthesized, which, in turn, limits the regeneration of RuBP. However, Sheen (1994) has suggested that feedback regulation of photosynthesis re- flects metabolite regulation of gene expression.
During long-term exposure of cold-tolerant C, plants to growth at low temperature, the potential for imbalance between SUC synthesis and photosynthesis in the short term appears to be overcome as indicated by the recovery of the light-saturated rates of photosynthesis to control values (Hurry et al., 1995) or higher (Huner et al., 1993). This is coupled with the well-documented increases in Suc accumulation during cold hardening (Guy et al., 1992). This photosynthetic acclimation appears to be accom- plished by increasing the availability of Pi (Hurry et al., 1993) as well as increasing the total activity and activation states of key regulatory enzymes of the Calvin-Benson cycle (Hurry et al., 1995). These results are consistent with recent suggestions that alterations in enzyme capacity, through modulation of gene expression by photosynthetic end products, are important in the acclimation of higher plants to environmental stress (Leegood, 1995; Stitt et al., 1990). Sheen (1994) has suggested that Glc is a universal signal, which regulates metabolite-mediated signal trans- duction in prokaryotes as well as eukaryotes.
In this report, we extend our previous studies on the response of green algae (C. vulgaris and D. salina) to PSII excitation pressure (Maxwell et al., 1994, 1995a, 1995b) to an examination of photosynthetic carbon metabolism in C. vulgaris grown at various PSII excitation pressures. Restric- tions in photosynthetic carbon metabolism encountered as a consequence of growth of C. vulgaris at either low tem- perature or high irradiance may, through feedback mech- anisms, induce the observed high PSII excitation pressures.
MATERIALS AND METHODS
Growth Conditions
The unicellular green alga Cklorella vulgaris Beijer (Uni- versity of Texas Culture Collection strain UTEX 265) was grown axenically in Bold’s basal medium as previously described (Maxwell et al., 1994). A11 experiments were conducted using cells grown in 150-mL Pyrex glass tubes immersed in aquaria with the temperature maintained at either 27 2 1°C or 5 ? 1°C. Cultures grown at 5°C were exposed to continuous irradiance of either 20 pmol m-’ s-’ (5/20) or 150 pmol m-’ s-l (5/150). Cultures grown at
27°C were exposed to continuous irradiance of either 150 pmol m-’s-l (27/150) or 2200 pmol m-’s-’ (27/2200) (Maxwell et al., 1995a). The irradiance was measured from the middle of each culture tube using a quantum sensor (Model185A, Li-Cor, Lincoln, NE). Each tube was bubbled with sterile air (150 mL min-*) and maintained at Chl concentrations of 2 to 5 k g mL-l and in the exponential growth phase by dilution with fresh growth medium.
O, Evolution
C0,-saturated O, evolution was measured polarograph- ically using a temperature-controlled, aqueous phase, Clarke-type O, electrode (Hansatech Instruments, King’s Lynn, UK). Measurements were conducted at the respec- tive growth temperature as described in detail previously (Maxwell et al., 1994, 1995a).
PSll Excitation Pressure
A11 measurements were made using a pulse amplitude modulated fluorescence system (Heinz Walz, Effletrich, Germany) as described in detail by Maxwell et al. (1994). Excitation pressure was calculated as 1 - qP (Demmig- Adams et al., 1990; Ogren, 1991), where qP is the coefficient of photochemical quenching (Bradbury and Baker, 1981; van Kooten and Snel, 1990).
Enzyme Analyses
For a11 assays, exponentially growing cells were har- vested by centrifugation and kept at -80°C until used. After thawing, cells were passed three times through a French pressure cell at 2 x 10⁴ p.s.i. in the appropriate buffer, and aliquots of the cell extract were centrifuged at 1600g for 2 min. The supernatant was used immediately for enzyme assays.
FBPase was assayed spectrophotometrically according to the procedure of Sharkey et al. (1991b), with an extraction buffer of 20 mM Hepes-NaOH (pH 7.5), 125 mM NaCl, 400 p~ EDTA, O.O2%(w/v) BSA, and 2% (w/v) polyvinylpoly- pyrrolidone. Cytosolic FBPase activity was determined in a buffer containing 100 mM Hepes-NaOH (pH 7.5), 100 mM KC1, 4 mM MgCl,, 0.5 mM EDTA, 0.5 miu NADP, 2 units of PGI, and 1 unit of Glc-6-PDH. The reaction was initiated by the addition of 50 p~ Fru-1,6-BP. Stromal FBPase activity was measured in a buffer containing 100 mM Bicine (pH 829, 0.5 mM EDTA, 50 mM DTT, 0.5 mM NADP, 2 units of PGI, and 1 unit of Glc-6-PDH. The reaction was initiated by the addition of 0.4 mM Fru-1,6-BP and 10 mM MgCI,. The reduction of NADP was monitored at 340 nm, and the FBPase rates were determined 5 min after the start of the reaction.
SPS was assayed according to Vassey and Sharkey (1989). Cell samples were extracted with buffer containing 50 mM Hepes-NaOH (pH 7.5), 5 mM MgCl,, 1 mM EDTA, 2.5 mM of freshly added DTT, and 0.1% (v/v) Triton X-100. After centrifugation, the supernatant was mixed with 250 mg of Sephadex G-25, incubated on ice for 10 min, and subsequently centrifuged for 5 min. SI’S activity was mea- sured in the supernatant as the time-dependent formation
www.plant.org on May 24, 2015 - Published by www.plantphysiol.orgDownloaded from Copyright © 1996 American Society of Plant Biologists. All rights reserved.

Excitation Pressure and Carbon Metabolism 129
of Suc plus SUC-P from UDP-Glc and Fru-6-P, according to Huber et al. (1991). SPS activity was determined either by the "limiting assay," which included limiting substrate concentrations in the presence of the SPS inhibitor, Pi, or by the V,,, assay, which included saturating substrate con- centrations in the absence of Pi.
Rubisco activity was determined according to Sharkey et al. (1991a). Cell samples were extracted into 100 mM Bicine (pH 7.8), 5 mM MgCI,, 1 mM EDTA, 5 mM DTT, 1.5% (w / v) polyvinylpolypyrrolidone, and 0.02% (w / v) BSA. The ex- tract was centrifuged at 1600g for 2 min at 5"C, and 5 pL of the supernatant was immediately used to determine initial Rubisco activity. The total Rubisco activity was determined after incubation of 1 mL of extract for 10 min in 20 mM MgCI, and 10 mM NaHCO,. The carbamylation ratio was determined as initial Rubisco activity / total Rubisco activ- ity. Total Rubisco protein was determined by using CABP to inhibit Rubisco activity in the extract. Rubisco activity was plotted against CABP concentration to estimate the total number of Rubisco sites to which CABP was bound. This value was divided by 8 to give the total amount of Rubisco protein. The kcvt was estimated by dividing the total activity by the total amount of enzyme.
Rubisco activity was determined in 50 mM Bicine (pH &O), 15 mM MgCI,, 1 mM EDTA, 10 mM NaCl, 5 mM DTT, 10 mM NaHCO,, 5 mM phosphocreatine, and 5 mM ATP in a final volume of 750 pL. The following were added: 10 pL of 20 mM RuBP, 10 p L of 10 mM NADH, 10 units of GAPDH/ 3-phosphoglucokinase, and 2 units of creatine phosphokinase. The reaction was initiated by the addition of 5 pL of appropriate extract, and the oxidation of NADH was monitored at 334 - 405 nm.
Metabolite Analyses
Metabolites were extracted from cells in 3.5% HClO,. After centrifugation, the supernatant was neutralized with 2 N KOH in 0.15 mM Hepes and 10 mM KCI, and the precipitate was discarded after further centrifugation. The supernatant was used for the enzyme-linked photometric assay of metabolites as described by Loreto and Sharkey (1993).
Carbohydrate Analyses
Thawed cells were centrifuged at 12,OOOg for 10 min and then extracted in hot 80% ethanol until the cells were pigment free. After severa1 passes through the French pres- sure cell, this extract was centrifuged at 1,6008 for 10 min, and the pellet was washed twice with dH,O. The pellet, containing starch, was resuspended in 1 mL of 0.2 N KOH and incubated in a boiling water bath for 30 min. After cooling, the pH was adjusted to 5.5 with 200 pL of 1 N acetic acid. For starch digestion, 1 mL of dialyzed amylo- glucosidase (35 units of mL-' in 50 mM Na-acetate buffer, pH 4.5) was added, and samples were incubated at 559C for 30 min. After boiling for 1 min, the samples were centri- fuged and Glc content in the supernatant was determined enzymatically (Rufty and Huber, 1983). The aqueous phase was dried at 30°C and then resuspended in 400 pL of
dH,O. This fraction was used to determine Glc, Fru, and SUC. The assay buffer contained 360 mM Tris-HCI (pH 6.9), 0.4 mM NADP, 1 mM ATP, 5 mM MgCl,, 1 mM DTT, and 0.02% (w/v) BSA. In addition, the Glc assay mixture con- tained 1 unit of HK, the Fru assay contained 1 unit of HK and 5 units of PGI, the SUC assay contained 80 units of invertase in addition to the Fru reaction mixture. The re- action was started by adding 2 units of Glc-6-PDH, and the reduction of NADP was monitored at 340 nm.
Chl and Protein Determination
Chl concentration was calculated using the equations of Jeffrey and Humphrey (1975) after extraction into 90% (v/v) acetone, according to Maxwell et al. (1994). The cell extract was centrifuged at 100,OOOg for 1 h, and the soluble protein concentration of the supernatant was determined using the Bradford assay.
Electron Microscopy
Cells were prepared for transmission electron micros- copy by filtration on 0.45-pm Millipore membranes and subsequently were resuspended in 2% (w/v) agar at 45°C. Small agar blocks (1 mm") were fixed on ice in freshly prepared 1.5% (w/v) aqueous KMnO, for 45 min. Agar blocks containing cell samples were rinsed with dH,O and dehydrated in an ethanol series, infiltrated, and embedded in Epon-Araldite (EF Fullam, New York, NY). Samples were poststained with 5% (w/v) uranyl acetate for 20 min. Transmission electron microscopy was conducted on a Philips (Eindhoven, The Netherlands) CMlO at 80 kV.
RESULTS
Cell Ultrastructure
Previously, we reported that Chlorella grown at either 27/ 150 or 5/20 are exposed to comparable LEP (Maxwell et al., 1995a). Figure 1 illustrates that Chlorella grown at LEP at either 27/150 (Fig. 1A) or 5/20 (Fig. 1B) exhibited nor- mal, stacked thylakoid membranes. In contrast, cells ex- posed to HEP by growth at either 27/2200 (Fig. 1C) or 5/ 150 (Fig. 1D) exhibited significant disorganization in thylakoid membrane structure and an abundance of starch granules. Total Chl per cell for Chlorella grown at HEP was 4- to 5-fold lower than for cells grown at LEP (Table I). This was accompanied by a 2-fold higher Chl alb in cells grown at HEP than those grown at LEP (Table 1). Furthermore, growth at HEP at either 5 or 27°C resulted in comparable tolerance to photoinhibition but significantly greater toler- ante than cells grown at LEP (Table I). Thus, these data indicate that Chlorella grown at either 5/150 or 27/2200, that is, HEP, are not only comparable in their susceptibility to photoinhibition, they are similar ultrastructurally. In addition, cells grown at either 5/20 or 27/150, that is LEP, are also similarly susceptible to photoinhibition and are ultrastructurally comparable (Fig. 1) (Maxwell et al., 1994, 1995).
www.plant.org on May 24, 2015 - Published by www.plantphysiol.orgDownloaded from Copyright © 1996 American Society of Plant Biologists. All rights reserved.

130 Savitch et al. Plant Physiol. Vol. 111, 1996
Figure 1. Electron micrographs of C vulgaris grown at 27/150 (A), 5/20 (B), 27/2200 (C), and 5/150 (D). Bars represent 1^m. Arrowheads in A and B indicate thylakoid stacks. S, Starch.
www.plant.org on May 24, 2015 - Published by www.plantphysiol.orgDownloaded from Copyright © 1996 American Society of Plant Biologists. All rights reserved.

Excitation Pressure and Carbon Metabolism 131
A
Table 1. Characteristics of C. vulgaris grown under two conditions of HEP and LEP Data represent mean -t- S E , n = 4. Fv, Variable Chl a fluorescence with all PSll traps open; F,,,, maximal Chl a fluorescence with all PSll traps open.
Crowth Conditions
27/150 LEP 27/2200 HEP 5/20 LEP 5/150 HEP Parameters
Chl (a + b) (pg cell-') Chl a/Chl b Oxygen evolution, Pg
0.73 2 0.05 3.59 +- 0.08
701 i 97 77
FJF,,, (control) 0.74 i 0.01 FJF, (after photoinhibition) 0.07 i 0.02
(nmol 110' cellsJ-' h-') Dark respiration (% from Pg)
FJF, (% of control) 9.5
"C/pmo/ m-zs- ' 0.18 i 0.06 0.71 i 0.03 0.13 2 0.01 7.92 i 0.58 3.61 i 0.11 8.47 i 0.24
1159 i 54 115 i 16 98 i 11 18 52 36
0.61 i 0.02 0.75 i 0.01 0.70 2 0.02 0.32 2 0.02 0.15 -t- 0.03 0.46 i 0.02
52.5 20 65.7
O, Evolution
Previously, we reported that Chlorella grown at 51 150 exhibited similar rates of C0,-saturated O, evolution as cells grown at 27/2200 when calculated on a Chl basis and when both were compared at the same measuring temper- ature of either 27°C or 5°C (Maxwell et al., 1994, 1995a). However, when the photosynthetic light response curves were measured at the prevailing growth temperature (Fig. 2), cells grown and measured at 5"C, as expected, exhibited lower light-saturated rates of O, evolution than those grown and measured at 27"C, regardless of whether pho- tosynthesis was calculated on a per cell or on a Chl basis (Fig. 2, A and B). Furthermore, cells grown at LEP exhibited higher initial slopes than those grown at HEI' (Fig. 2B). However, Chlorella grown at 27/2200 were grown under light-saturated conditions in contrast to cells grown at either 51150 or 5/20.
Carbohydrate Accumulation
Chl cell-' varied dramatically upon growth at HEI' or LEP (Table I), so all photosynthetic end products and me- tabolite data are presented on a per cell basis for compar- ative purposes. We initiated our study of the effects of PSII excitation pressure on carbon metabolism by measuring the levels of the major end products of photosynthesis, SUC, and starch (Fig. 3). Irrespective of PSII excitation pressure, cells grown at 27°C generally exhibited higher levels of Glc, Fru, SUC, and starch compared with cells grown at 5°C (Fig. 3). However, when PSII excitation pressure was increased at 27"C, the Suc/ starch ratio increased 25-fold (Fig. 3E). This was due to an 18-fold increase in SUC (Fig. 3C) asso- ciated with a concomitant 25% decrease in starch content (Fig. 3D). In contrast, the Suc/starch ratio decreased by 23-fold when excitation pressure was increased at 5°C (Fig. 3E), which occurred as a consequence of a 7-fold decrease in Suc (Fig. 3C) with a concomitant doubling in the starch content (Fig. 3D).
Although cells grown at 5/20 and 27/150 exhibited sim- ilar PSII excitation pressures (Table I), the former exhibited a lower abundance of both Suc and starch (Fig. 3, C and D) and a 3-fold higher Suc/starch ratio than the latter (Fig. 3E). This indicates that Chlorella grown at 5°C and in light- limiting conditions experienced some limitation in carbon
metabolism relative to cells grown at 27/150, which is supported by the fact that the gross photosynthetic rate in Chlorella grown at 5°C was independent of irradiance when measured at the growth temperature, whereas the gross photosynthetic rate of Chlorella grown at 27°C exhibited the expected increase with increased irradiance (Table I).
r I L 1500
500
O
O 500 1000 1500 2000
-2 -1 PPFD (pmol m s )
Figure 2. lrradiance response curves for CO,-saturated O, evolu- tion. O, evolution calculated on a Chl basis (A) and on a per cell basis (B). Chlorella was grown at either LEP (27/150 [AI, 5/20 [O]), or HEP (27/2200 [AI, 5/150 [O]). All measurements were made at the respective growth temperatures. Data are averages of three to five experiments with error bars equal to or smaller than the symbols.
www.plant.org on May 24, 2015 - Published by www.plantphysiol.orgDownloaded from Copyright © 1996 American Society of Plant Biologists. All rights reserved.

132 Savitch et al. Plant Physiol. Vol. 11 1, 1996
12 200
10
2
1 O0
9
6 - 1 r
'A 'A m 3
b V O
- - m 9) 9)
O
- -
B Fructose w i
80
40
O
4.0 3.6 E Sucrose/storch ratio
3.2
< 0.4 5
0.2
0.0
Figure 3. Abundance of the major carbohydrates in C. vulgaris. Cells were grown at 27/150 (open bars), 27/2200 (horizontally hatched bars), 5/20 (diagonally hatched bars), and 5/150 (solid bars). All data represent the means of four measurements ? SE.
Enzyme Activities
We extended our investigation by examining severa1 stromal as well as cytosolic regulatory enzyme activities. At 27"C, cells grown at HEP exhibited a 23% lower Rubisco content than cells grown at LEP. However, total Rubisco activity, on a per cell basis, was not significantly different between cells grown at either 27/2200 or 27/150 (Table 11).
Both cytosolic and stromal FBPase activities were 40% lower in cells grown at 27/2200 than those grown at 27/ 150 (Table 11). SPS activity was 2.6-fold higher in Chlorella grown at 27/2200 than in cells grown at 27/150 (Table 11).
Cells grown at LEP at 5°C exhibited a 2.8-fold higher amount of Rubisco, a 2-fold higher Rubisco activity, and an enhanced potential for SUC synthesis as a consequence of a 1.7-fold higher SPS activity relative to cells grown at LEI' but at 27°C (Table 11). No limitations at the level of stromal FBPase were evident upon growth at LEP at either 5 or 27°C. However, cytosolic FBPase activity was 34% lower in cells grown at 5°C than 27°C and LEP, which indicates a potential restriction in Suc biosynthesis that could be fur- ther exacerbated by increased irradiance at 5°C. This is consistent with the data for Chlorella grown at 5°C and HEP, for which the total Rubisco activity was 38% lower, the relative cytosolic FBPase activity was 45% lower, and the SPS activity was 87% lower than cells grown at 5°C and LEI' (Table 11). Thus, it appears that increasing excitation pressure at 27°C results in a significant limitation at the level of stromal FBPase, whereas increasing excitation pres- sure at 5°C results in major limitations in cytosolic FBPase and SPS activity. Given that the carbamylation ratios for Rubisco and the activation states for SPS were comparable (Table II), we suggest that the limitations in enzyme activ- ities probably reflect differences in the amount of enzyme rather than differences in their catalytic properties.
Phosphorylated lntermediates
At 27"C, Chlorella grown at HEP exhibited 3- to 4-fold higher levels of both PGA and RuBP than cells grown at LEP (27/150) (Fig. 4, A and B). However, the ratios of RuBP/ PGA were comparable (Table 111). Triose-P levels were 3-fold higher in cells grown at 27/2200 than in those grown at 27/150 (Fig. 4E), but the ratios of triose-P/RuBP were not different (Table 111). Although the levels of Glc- 6-P (Fig. 4C) and Fru-1,6-BP (Fig. 4F) were comparable, the level of Fru-6-P was 38% lower in cells grown at 27/2200 than in those grown at 27/150 (Fig. 4D). As a result, the ratio of Fru-1,6-BP/Fru-6-P in cells grown at 2712200 was
Table 11. Effect of altered PSll excitation pressure on characteristics of the enzymes Rubisco, FBPase, and SPS in C. vulgaris Data represent mean + SE, n = 4.
Crowth Conditions
27/150 LEP 27/2200 HEP 5/20 LEP 5/150 HEP Enzyme
"C//"/ m-Zs-'
Rubisco Total activity (nmol [107 cellsl-' h-') Carbamylation ratio (%) Amount of Rubisco (pmol [107 cells])-' k,,,, s-'
Stromal (nmol [107 cellsl-' h-') Cytosolic (nmol [107 cellsl-' h-') Cytosolic ("6 of total)
V,,,,, assay (nmol [107 cellsl-' h-') Activation state (%)
FBPase activity
SPS activity
649 2 22 47
4.8 ? 0.4 39
1 6 2 t 16 51 + 4
24
37 ? 6 54
621 + 4 1 53
3.7 t 0.5 47
97 + 2 29 ? 2
23
96 t 10 49
1348" 101 45
13.5 2 0.9 28
190 t 19 34 t 1
15
63 + 7 48
840 " 48 49
7.2 2 0.7 33
200 t 17 18 ? 3
a
8 + 2 62
www.plant.org on May 24, 2015 - Published by www.plantphysiol.orgDownloaded from Copyright © 1996 American Society of Plant Biologists. All rights reserved.
Excitation Pressure and Carbon Metabolism 133
2.5 I 0.4 I I
0.3 2.0
1.5 0.2
1 .o 0.1 0.5
0.0 0.0
F ~ u 6-P 1.2 1.2 c Glc 6-P
T i 5 0.6 E Fru 1.6-BP
E t 0.4 0.4
0.2 0.2
0.0 0.0
H ADP 0.9 ATP 0.9
0.6 0.6
0.3 0.3
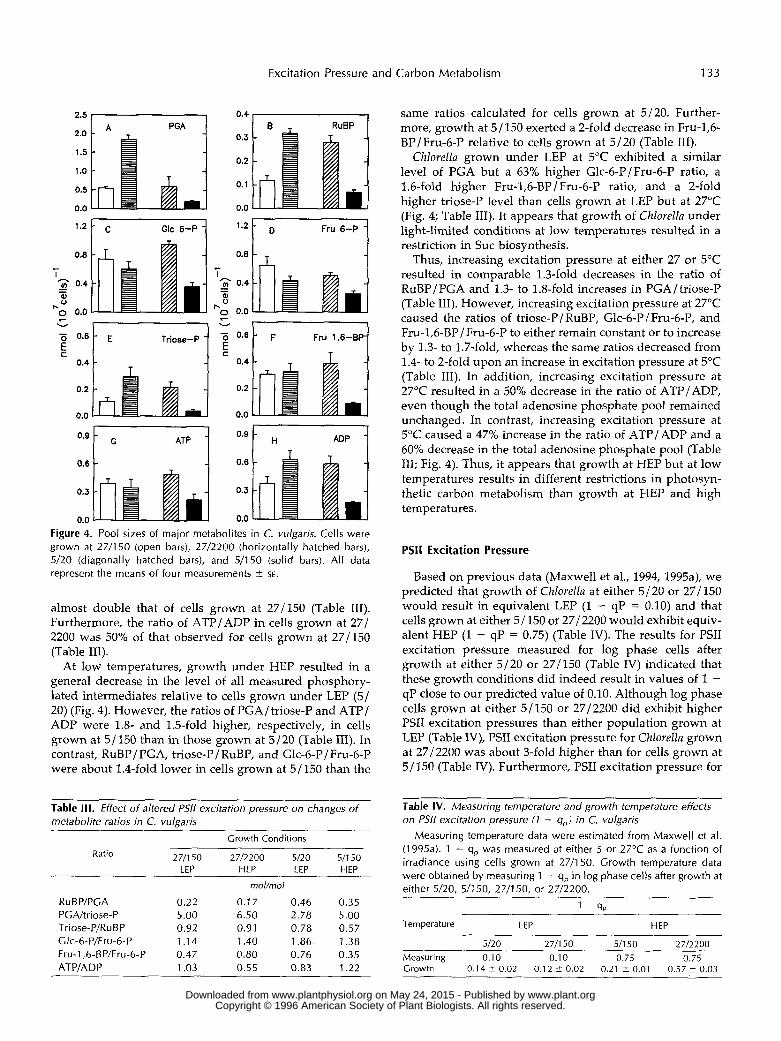
0.0 0.0 Figure 4. Pool sizes of major metabolites in C. vulgaris. Cells were grown at 2711 50 (open bars), 2712200 (horizontally hatched bars), 5/20 (diagonally hatched bars), and 511 50 (solid bars). All data represent the means of four measurements i SE.
almost double that of cells grown at 27/150 (Table 111). Furthermore, the ratio of ATP/ADP in cells grown at 27/ 2200 was 50% of that observed for cells grown at 27/150 (Table 111).
At low temperatures, growth under HEP resulted in a general decrease in the level of a11 measured phosphory- lated intermediates relative to cells grown under LEP (5/ 20) (Fig. 4). However, the ratios of PGA/triose-P and ATP/ ADP were 1.8- and 1.5-fold higher, respectively, in cells grown at 5J150 than in those grown at 5/20 (Table 111). In contrast, RuBP/ PGA, triose-P/RuBP, and Glc-6-P/ Fru-6-P were about 1.4-fold lower in cells grown at 5/150 than the
Table I I I . Effect o f altered PSll excitation pressure on changes o f metabolite ratios in C. vulgaris
Crowth Conditions
Ratio 271150 2712200 5/20 51150 LEP HEP LEP HEP
mo//mo/
RuBP/PGA 0.22 0.1 7 0.46 0.35 PCNtriose-P 5.00 6.50 2.78 5.00 Triose-P/RuBP 0.92 0.91 0.78 0.57 Clc-6-P/Fru-6-P 1.14 1.40 1.86 1.38 Fru-l,6-BP/Fru-6-P 0.47 0.80 0.76 0.35 ATPIADP 1 .O3 0.55 0.83 1 .22
same ratios calculated for cells grown at 5/20. Further- more, growth at 5 / 150 exerted a 2-fold decrease in Fru-1,6- BP/Fru-6-P relative to cells grown at 5/20 (Table 111).
Chlorella grown under LEP at 5°C exhibited a similar level of PGA but a 63% higher Glc-6-P/Fru-6-P ratio, a 1.6-fold higher Fru-1,6-BP JFru-6-P ratio, and a 2-fold higher triose-P level than cells grown at LEI' but at 27°C (Fig. 4; Table 111). It appears that growth of Chlorella under light-limited conditions at low temperatures resulted in a restriction in Suc biosynthesis.
Thus, increasing excitation pressure at either 27 or 5°C resulted in comparable 1.3-fold decreases in the ratio of RuBP/PGA and 1.3- to 1.8-fold increases in PGA/triose-P (Table 111). However, increasing excitation pressure at 27°C caused the ratios of triose-P J RuBP, Glc-6-P J Fru-6-P, and Fru-1,6-BP/ Fru-6-P to either remain constant or to increase by 1.3- to 1.7-fold, whereas the same ratios decreased from 1.4- to 2-fold upon an increase in excitation pressure at 5°C (Table 111). In addition, increasing excitation pressure at 27°C resulted in a 50% decrease in the ratio of ATP/ADP, even though the total adenosine phosphate pool remained unchanged. In contrast, increasing excitation pressure at 5°C caused a 47% increase in the ratio of ATP/ADP and a 60% decrease in the total adenosine phosphate pool (Table 111; Fig. 4). Thus, it appears that growth at HEP but at low temperatures results in different restrictions in photosyn- thetic carbon metabolism than growth at HEP and high temperatures.
PSll Excitation Pressure
Based on previous data (Maxwell et al., 1994, 1995a), we predicted that growth of Chlorella at either 5/20 or 27/150 would result in equivalent LEP (1 - qP = 0.10) and that cells grown at either 5 J 150 or 27 J 2200 would exhibit equiv- alent HEP (1 - qP = 0.75) (Table IV). The results for PSII excitation pressure measured for log phase cells after growth at either 5/20 or 27/150 (Table IV) indicated that these growth conditions did indeed result in values of 1 - qP close to our predicted value of 0.10. Although log phase cells grown at either 5/150 or 27/2200 did exhibit higher PSII excitation pressures than either population grown at LEP (Table IV), PSII excitation pressure for Chlorella grown at 27/2200 was about 3-fold higher than for cells grown at 5/ 150 (Table IV). Furthermore, PSII excitation pressure for
Table IV. Measuring temperature and growth temperature effects on PSll excitation pressure ( I - in C. vulgaris
Measuring temperature data were estimated from Maxwell et al. (1995a). 1 - q, was measured at either 5 or 27°C as a function of irradiance using cells grown at 2711 50. Crowth temperature data were obtained by measuring 1 - qp in log phase cells after growth at either 5/20, 5/150, 2711 50, or 2712200.
1 - q,
Temperature LEP HEP
512 O 2711 50 511 50 2 712 200 Measuring 0.10 0.1 o 0.75 0.75 Growth 0.14 2 0.02 0.12 5 0.02 0.21 2 0.01 0.57 5 0.03
www.plant.org on May 24, 2015 - Published by www.plantphysiol.orgDownloaded from Copyright © 1996 American Society of Plant Biologists. All rights reserved.

134 Savitch et al. Plant Physiol. Vol. 11 1 , 1996
cells grown at either 5/150 or 27/2200 was significantly lower than the predicted value of 0.75 (Maxwell et al., 1995a).
DISCUSSION
Photosynthetic acclimation to HEP, induced either by low temperature and moderate irradiance (5"C/ 150 pmol
) or moderate temperature and high irradiance m-z s-l
(27"C/2200 pmol m-2 s-'), is similar when examined at the levels of pigment content and composition, LHCII abundance, susceptibility to photoinhibition (Table I) (Maxwell et al., 1994, 1995a), cab mRNA abundance (Max- well et al., 1995b), as well as cell ultrastructure (Fig. 1). However, adjustment of photosynthetic carbon metabolism to HEP clearly is dependent on the manner in which the HEP is created. First, upon growth at HEP at 27°C (27/2200 versus 27/ 150), the Suc/ starch ratio increased 25-fold due to a 18-fold increase in Suc and a concomitant 25% decrease in starch content. In contrast, upon growth of Chlorella at HEI' at 5°C (5 / 150 versus 5 / 20), the Suc/ starch ratio de- creased 23-fold as a consequence of a 7-fold decrease in SUC and a concomitant doubling in the starch content. Second, growth at HEP at 27°C caused the ratios of triose-P/RuBP, Glc-6-P / Fru-6-P, and Fru-1,6-BP/ Fru-6-P to remain con- stant or to increase by 1.3- to 1.7-fold, whereas the same ratios decreased from 1.4- to 2-fold upon growth of Chlor- ella at HEI' at 5°C. Third, growth at HEI' at 27°C resulted in a 50% decrease in the ratio of ATP/ADP, even though the total adenosine phosphate pool remained unchanged. In contrast, a 47% increase in this ratio was accompanied by a 60% decrease in the total adenosine phosphate pool when ChZoreZZa was grown at HEP at 5°C. Thus, we conclude that increasing PSII excitation pressure at 27°C appeared to result in a significant restriction at the level of stromal FBPase, whereas increasing PSII excitation pressure at 5°C appeared to result in major limitations at the level of cyto- solic FBPase and SPS. We suggest that the HEP observed after growth at either 27/2200 or 5/150 is, at least in part, a consequence of these restrictions in carbon metabolism that feedback on photosynthetic electron transport and consequently increase PSII excitation pressure. Chlorella vulgaris grown at either 5/150 or 27/2200 appears unable to compensate for HEP through adjustments in carbon metabolism, so Chlorella responds by reducing its capacity to absorb light through down-regulation of cab genes and increased nonradiative dissipation through zeaxanthin to protect the photosynthetic apparatus from excessive radi- ation (Maxwell et al., 1995a, 199513).
In the present report, we demonstrate that Cklorella grown at low temperature exhibited rates of gross photo- synthesis that were 7- to 10-fold lower than the rates for cells grown at high temperature (Table I). This occurred even though 5°C-grown cells exhibited 2- to 3-fold higher amounts of Rubisco associated with high extractable Rubisco activities (Table 11), 2-fold higher ratios of RuBP/ PGA (Table 111), and comparable levels of ATP (Fig. 4G) relative to 27°C-grown cells. Such discrepancies in Chlorella have been noted previously (Kerimov et al., 1980; Demidov et al., 1978; Krupenko et al., 1978). The glycolate pathway
has been shown to exist in green algae (Bidwell, 1983), so we suggest that the discrepancy among the low rate of photosynthesis, the high levels of ATP, and the high RuBP/PGA ratio, with no apparent restriction at the level of Rubisco, may reflect stimulation of the glycolate path- way in Chlorella grown at low temperatures. This is pres- ently under investigation.
Why is there such a large discrepancy between the pre- dicted and the actual HEP experienced by Chlorella (Table IV)? Cells grown at 27/150 and exposed to measuring temperature of 27°C and an irradiance of 2200 pmol m-' s-' exhibited a PSII excitation pressure of about 0.75. To exhibit the same PSII excitation pressure at a measuring temperature of 5"C, Chlorella grown at 27/150 had to be exposed to an irradiance of only 150 pmol m-' s-' (Table IV). Thus, the comparable PSII excitation pressure elicited under measuring conditions of 5/150 and 27/2200 is the result of a thermodynamic constraint imposed upon inter- system electron transport and photosynthetic carbon me- tabolism. We suggest that the discrepancy between the predicted excitation pressure estimated through a specific temperature /light measuring regime and the excitation pressure actually observed after exposure to a specific tem- perature/light growth regime (Table IV) may be the result of differential photosynthetic restrictions at the level of carbon metabolism. The Suc/starch ratio for Chlorella grown under nonlimited conditions (27/ 150) is low, so this indicates that the starch biosynthetic pathway may be the major carbon sink in this green alga. Restrictions in this pathway may exert a greater negative feedback on photo- synthetic electron transport than cytosolic restrictions in Suc metabolism. Thus, restrictions in the starch pathway would cause a greater PSII excitation pressure than restric- tions in the SUC pathway. As a consequence, cells grown at 27/2200 would be expected to exhibit a higher PSII excita- tion pressure than those grown at 5 / 350. Based on the data for Rubisco, stromal and cytosolic FBPase, as well as SPS activities (Table 11), we suggest that these restrictions prob- ably reflect differential restrictions in the amounts of these enzymes due to gene repression rather than major changes in their kinetic properties. Further work on the regulation of ADP-Glc pyrophosphorylase, as well as a detailed ex- amination of the regulation of this enzyme and other pho- tosynthetic enzymes at the mRNA and protein levels, is required to substantiate this hypothesis.
Gene expression in green algae such as Chlorella and Euglena has been shown to be regulated by carbon metab- olites (Schiff and Schwartzbach, 1982; Hilgarth et al., 1991). Exposure of autotrophically grown C. kessleri to Glc results in increased expression of at least 10 genes involved in carbon and nitrogen metabolism (Cho et al., 1981; Hilgarth et al., 1991). Glc or its nonmetabolizable analog 6-deoxy- glucose can act as the inducer, so it has been suggested that the sugar itself acts as the primary signal for the increase in gene expression (Hilgarth et al., 1991). In contrast, Glc can also act to repress the expression of genes in Cklorella as well as higher plants (McCullough and John, 1972; Sem- enenko, 1978; Kuptsova and Semenenko, 1984,1987; Krapp et al., 1991, 1993; Krapp and Stitt, 1995; Sheen 1994; Jang
www.plant.org on May 24, 2015 - Published by www.plantphysiol.orgDownloaded from Copyright © 1996 American Society of Plant Biologists. All rights reserved.

Excitation Pressure and Carbon Metabolism 135
and Sheen, 1994; Graham et al., 1994). It has been suggested that hexokinase may be the principal sensor / signal com- ponent involved in Glc / hexose-mediated gene repression in higher plants. C. vulgaris grown at HEP that is either at 2712200 or 51150 exhibits a disruption in chloroplast ul- trastructure (Fig. l), a significant reduction in LHCII ap- oprotein content, and a 5-fold decrease in Chl content per cell (Table I). In addition, growth of D. salina at HEI' results in an 8-fold reduction in cab mRNA levels (Maxwell et al., 199513). Thus, it appears that growth at HEP mimics the "Glc bleaching effect" reported in Chlorella and higher plants (Kuptsova and Semenenko, 1984; Krapp et al., 1991).
However, our carbohydrate and metabolite data indicate that the proposed Glc/ hexose sensingf signaling mecha- nism cannot account for photosynthetic acclimation to HEP for the following reasons. First, although Chlorella grown at 2712200 and 51 150 exhibit comparable ultrastructure and pigmentation, endogenous Glc and Fru contents differed by at least 10-fold (Fig. 3), triose-P levels differed by 6-fold, and Glc-6-P and Fru-6-P contents were lower than for cells grown at LEP (Fig. 4). Second, Suc content can be ruled out as a signal in our case, because SUC content was at least 100-fold higher in cells grown at 27/2200 than in those grown at 51150 (Fig. 3), even though both populations of Chlorella exhibited similar ultrastructure and pigmentation. Thus, we conclude that the results of this report support our previous contention that photosynthetic acclimation of Chlorella can be rationalized best on the basis of chloroplas- tic redox control (Maxwell et al., 1995a, 1995b).
We have suggested that photosynthetic adjustment to temperature and light is similar in Chlorella (Maxwell et al., 1995a) and Dunaliella (Maxwell et al., 1995b) because both may reflect a common redox sensing 1 signaling mechanism that can be activated either thermodynamically or photo- dynamically. This is consistent with a recent report by Escoubas et al. (1995). However, Chlorella grown at 2712200 exhibited a PSII excitation pressure that was almost 3-fold higher than that of cells grown at 51 150, even though both populations were similar with respect to chloroplast ultra- structure (Fig. l), pigment content, Chl a/b (Table I), sus- ceptibility to photoinhibition, and LHCII apoprotein abun- dance (Maxwell et al., 1995a). Thus, if we assume a redox sensing/ signaling mechanism, the redox state of Q, cannot be the primary signal regulating photosynthetic adjust- ment to the combination of light and temperature. How- ever, we suggest that the redox state of Q, as reflected by PSII excitation pressure may be one component of a mul- ticomponent redox sensingl signaling pathway. Further- more, our approach to understanding photosynthetic accli- mation through a comparison of organisms grown at either HEI' or LEI' has allowed us to separate clearly acclimation processes regulated through redox poise from those regu- lated either solely by temperature, solely by light, or reg- ulated by light and temperature in an additive but inde- pendent manner (G.R. Gray, L.P. Chauvin, F. Sarhan, and N.P.A. Huner, unpublished results). Clearly, further work is required to elucidate the nature of the redox signal and the transduction pathway as well as their integration into other cellular signal-transduction pathways.
ACKNOWLEDCMENTS
The authors are grateful to R. Smith for his assistance with electron microscopy. We thank Dr. T. Sharkey for critically reading this manuscript and providing us with helpful suggestions.
Received October 10, 1995; accepted January 23, 1996. Copyright Clearance Center: 0032-0889/96/111/0127/ 10.
LITERATURE ClTED
Bidwell RGS (1983) Carbon nutrition of plants: photosynthesis and respiration. In FC Steward, ed, Plant Physiology: A Treatise, Vol VIL Academic Press, New York, pp 287-457
Bradbury M, Baker NR (1981) Analysis of the slow phases of the in vivo chlorophyll fluorescence induction curve. Changes in the redox state of photosystem I1 electron acceptors and fluores- cence emission from photosystems I and 11. Biochim Biophys Acta 63: 542-551
Cho B-H, Sauer N, Komor E, Tanner W (1981) Glucose induces two amino acid transport systems in Chlorella. Proc Natl Acad Sci USA 78: 3591-3594
Demidov ED, Kerimov S, Bell LN (1978) Connection between excretion of glycolic acid and energy provisioning of Chlorella cells under light. Fiziol Rast 25: 1089-1095
Demmig-Adams B, Adams WW, Czygan F-C, Schreiber U, Lange OL (1990) Differences in the capacity for radiationless energy dissipation in the photochemical apparatus of green and blue- green alga1 lichens associated with differences in carotenoid composition. Planta 180: 582-589
Dietz K-J, Schreiber U, Heber U (1985) The relation between the redox state of QA and photosynthesis in leaves at various car- bon-dioxide, oxygen and light regimes. Planta 166 219-226
Escoubas J-M, Lomas M, LaRoche J, Falkowski PG (1995) Light intensity regulates cab gene transcription via the redox state of the plastoquinone pool in the green alga, Dunaliella tertiolecta. Proc Natl Acad Sci USA 92: 10237-10241
Graham IA, Denby KJ, Leaver C (1994) Carbon catabolite repres- sion regulates glyoxylate cycle gene expression in cucumber. Plant Cell 6 761-772
Gray GR, Savitch LV, Ivanov AG, Huner NPA (1996) Photosys- tem I1 excitation pressure and development of resistance to photoinhibition. 11. Adjustment of photosynthetic capacity in winter wheat and winter rye. Plant Physiol 110: 61-71
Guy CL, Huber JLA, Huber SC (1992) Sucrose phosphate synthase and sucrose accumulation at low temperature. Plant Physiol100:
Hilgarth C, Sauer N, Tanner W (1991) Glucose increases the expression of the ATP/ ADP translocator and the glyceralde- hyde-3-phosphate dehydrogenase genes in Chlorella. J Biol Chem
Holaday AS, Martindale W, Alred R, Brooks AL, Leegood RC (1992) Changes in activities of enzymes of carbon metabolism in leaves during exposure to low temperature. Plant Physiol 98: 1105-1114
Huber JL, Hite DRC, Outlaw Jr WH, Huber SC (1991) Inactiva- tion of highly activated spinach leaf sucrose-phosphate synthase by dephosphorylation. Plant Physiol 95: 291-297
Huner NPA, Oquist G, Hurry VM, Krol M, Falk S, Griffith M (1993) Photosynthesis, photoinhibition and low temperature ac- climation in cold tolerant-glants. Photosyn Res 37: 19-39
Hurry VM, Gardestrom P, Oquist G (1993) Reduced sensitivity to photoinhibition following frost-hardening of winter rye is due to increased phosphate availability. Planta 190: 48+490
Hurry VM, Keerberg O, PBrnik T, Gardestrom P, Oquist G (1995) Cold-hardening results in increased activity of enzymes in- volved in carbon metabolism in leaves of winter rye (Secale cereale L.). Planta 195: 554-562
Jang J-C, Sheen J (1994) Sugar sensing in higher plants. Plant Cell
Jefkey SW, Humphrey GF (1975) New spectrophotometric equa- tions for determining chlorophyll a, b, cl, c2 in higher plants, algae and natural phytoplankton. Biochem Physiol Pflanz 167 191-194
502-508
266: 24044-24047
6: 1665-1679
www.plant.org on May 24, 2015 - Published by www.plantphysiol.orgDownloaded from Copyright © 1996 American Society of Plant Biologists. All rights reserved.

136 Savitch et al. Plant Physiol. Vol. 11 1, 1996
Kerimov S, Demidov ED, Maslov AI, Bell LN (1980) Conversion of glycolate and glycine in Chlorella cells. Fiziol Rast 27: 52-57
Krapp A, Hofmann B, Schafer C, Stitt M (1993) Regulation of the expression of rbcS and other photosynthetic genes by carbohy- drates: a mechanism for the “sink regulation” of photosynthesis. Plant J 3: 817-828
Krapp A, Quick WP, Stitt M (1991) Ribulose-1,5-bisphosphate carboxylase-oxygenase, other Calvin-cycle enzymes, and chlo- rophyll decrease when glucose is supplied to mature spinach leaves via the transpiration stream. Planta 186: 58-69
Krapp A, Stitt M (1995) An evaluation of direct and indirect mechanisms for the “sink regulation” of photosynthesis in spin- ach: enzyme activities and steady-state transcript levels after cold-girdling source leaves. Planta 195: 313-323
Krupenko AN, Ganago IB, Shuvalov NP, Bell LN (1978) Role of photooxidative processes in energetics of photosynthesizing Chlovella cells. Fiziol Rast 25: 471476
Kuptsova ES, Semenenko VE (1984) Relationship between struc- ture of glucose analogs and manifestation of their repressing action in the chloroplast. Fiziol Rast 30: 1006-1013
Kuptsova ES, Semenenko VE (1987) Repressing action of a glu- cose analog in the chloroplast as a function of spectral compo- sition of light. Fiziol Rast 33: 699-705
Labate CA, Adock MD, Leegood RC (1990) Effects of temperature on the regulation of photosynthetic carbon assimilation in leaves of maize and barley. Planta 181: 547-554
Leegood RC (1985) Regulation of photosynthetic C02-pathway enzymes by light and other factors. Photosynth Res 6: 247-259
Leegood RC (1995) Effects of temperature on photosynthesis and photorespiration. In N Smirnoff, ed, Environment and Plant Metabolism: Flexibility and Acclimation. Bios Scientific Publish- ers, Oxford, UK, pp 45-62
Leegood RC, Furbank RT (1986) Stimulation of photosynthesis by 2% 0 2 at low temperatures is restored by phosphate. Planta 168: 84-93
Loreto F, Sharkey TD (1993) On the relationship between isoprene emission and photosynthetic metabolites under different envi- ronmental conditions. Planta 189: 420424
Maxwell DP, Falk S, Huner NPA (1995a) Photosystem I1 excita- tion pressure and development of resistance to photoinhibition I. LHCII abundance and zeaxanthin content in Chlorella vulgauis. Plant Physiol107: 687-694
Maxwell DP, Falk S, Trick CG, Huner NPA (1994) Growth at low temperature mimics high-light acclimation in Chlorella vulgaris. Plant Physiol 105: 535-543
Maxwell DP, Laudenbach DE, Huner NPA (1995b) Redox regu- lation of light-harvesting complex I1 and cab mRNA abundance in Dunaliella salina. Plant Physiol 109: 787-795
McCullough W, John PCL (1972) Control of de novo isocitrate lyase synthesis in Chlovella. Nature 239: 402405
Ogren E (1991) Prediction of photoinhibition of photosynthesis from measurements of fluorescence quenching components. Planta 184: 538-544
Paul MJ, Driscoll SP, Lawlor DW (1992) Sink-regulation of pho- tosynthesis in relation to temperature in sunflower and rape. J Exp Bot 43: 147-153
Paul MJ, Lawlor DW, Driscoll SP (1990) The effect of temperature on photosynthesis and carbon fluxes in sunflower and rape. J Exp Bot 41: 547-555
Rufty TWI, Huber SC (1983) Changes in starch formation and activities of sucrose phosphate synthase and cytoplasmic fruc- tose-1,6-bisphosphatase in response to source-sink alterations. Plant Physiol 72: 474480
Schiff JA, Schwartzbach SD (1982) Photocontrol of chloroplast development in Euglena. In DE Buetow, ed, The Biology of Euglena, Vol 111. Academic Press, New York, pp 313-352
Semenenko VE (1978) Molecular-biological aspects of endogenous regulation of photosynthesis. Fiziol Rast 25: 903-921
Sharkey TD, Savitch LV, Butz N D (1991a) Photometric method for routine determination of k,,, and carbamylaton of rubisco. Photosynth Res 28: 41-48
Sharkey TD, Vassey TL, Vanderveer PJ, Viestra RD (1991b) Carbon metabolism enzymes and photosynthesis in transgenic tobacco (Nicotiana tabacum L.) having excess phytochrome. Planta 185: 287-296
Sheen J (1994) Feedback control of gene expression. Photosynth Res 39: 427438
Stitt M, Grosse H (1988) Interactions between sucrose synthesis and CO, fixation. IV. Temperature-dependent adjustment of the relation between sucrose synthesis and C02 fixation. J Plant Physiol 133: 392400
Stitt M, Huber S, Kerr P (1987) Control of photosynthetic sucrose formation. In Hatch MD, Boardman NK, eds, The Biochemistry of Plants, Photosynthesis. Academic Press, New York, pp 327409
Stitt M, von Schaewen A, Willmitzer L (1990) ”Sink” regulation of photosynthetic metabolism in transgenic tobacco plants express- ing yeast invertase in their cell wall involves a decrease of Calvin-cycle enzymes and an increase of glycolytic enzymes. Planta 183: 40-50
van Kooten O, Snel JFH (1990) The use of chlorophyll fluores- cence nomenclature in plant stress physiology. Photosynth Res 25: 147-150
Vassey TL, Sharkey TD (1989) Mild water stress of Phaseolus vulgavis plants leads to reduced starch synthesis and extractable sucrose phosphate synthase activity. Plant Physiol89: 1066-1070
www.plant.org on May 24, 2015 - Published by www.plantphysiol.orgDownloaded from Copyright © 1996 American Society of Plant Biologists. All rights reserved.
Copyright © 2022 FDOKUMEN