PhotoScope: visualizing spatiotemporal coverage of photos for construction management
10
PhotoScope: Visualizing Spatiotemporal Coverage of Photos for Construction Management Fuqu Wu Computer Science Dept., University of Victoria 3800 Finnerty Road, Victoria, BC, Canada V8W 3P6 [email protected] Melanie Tory Computer Science Dept., University of Victoria 3800 Finnerty Road, Victoria, BC, Canada V8W 3P6 [email protected] ABSTRACT PhotoScope visualizes the spatiotemporal coverage of photos in a photo collection. It extends the standard photo browsing paradigm in two main ways: visualizing spatial coverage of photos, and indexing photos by a combination of spatial coverage, time, and content specifications. This approach enables users to browse and search space- and time-indexed photos more effectively. We designed PhotoScope specifically to address challenges in the construction management industry, where large photo collections are amassed to document project progress. These ideas may also apply to any photo collection that is spatially constrained and must be searched using spatial, temporal, and content criteria. We describe the design choices made when developing PhotoScope and the results of user evaluation. Author Keywords Visualization, photo browser, construction management, spatiotemporal coverage. ACM Classification Keywords H1.2. User/Machine Systems; H4.1. Office Automation; H5.2. User Interfaces. INTRODUCTION Digital photos offer a simple and inexpensive way to document events and changes in a spatial area over time. For example, in construction management, photos are used to document the progress of activities involved in the construction of a building. In forestry, aerial and satellite photographs are commonly used to document the state of forests over time, revealing factors such as logging, reforestation, disease, and fire damage. In microscopy, images may document the state of cellular components as a cell undergoes changes such as cell division. We focus on photo collections in construction management. Construction is a process of assembling thousands of pieces to create a complete functioning structure and involves disciplines such as architecture, civil, mechanical, and electrical engineering. Due to the complexity of the process, construction claims and disputes often occur and the industry is prone to litigation. For example, imagine that a school hired a contractor to construct additional classroom space a year ago. Recently, the concrete floor in the hallways started to crack. The school owner might sue the contractor, claiming that the concrete construction was not executed appropriately. To avoid paying repair costs, the contractor would have to prove that the use and installation of concrete were appropriate. The litigation process often involves complex issues and is usually very expensive [10]. The industry has been struggling to find ways to equitably and economically resolve these issues [1]. Digital photos have become a common way to document construction site activities. They are gathered periodically, stored in central databases and utilized for project management tasks [5]. ‘Taking photos’ now is part of the routine work of the project monitoring process. The size of the photo archive expands quickly from hundreds to thousands as the scale of the project increases. If any claims and disputes happen at a later stage, searching through the entire photo archive for useful evidence can be a challenging and tedious process. To support managing, browsing and searching in a construction photo archive more easily and effectively, we designed and implemented PhotoScope, an interactive tool that visualizes the spatiotemporal scope of photo coverage. PhotoScope offers two novel ideas: (1) Indexing photos by space, time, and standardized content specifications, and (2) Showing spatial coverage of photos rather than camera positions, which emphasizes photo contents rather than mechanics of how the photo was taken. PhotoScope makes searching and browsing easier, and enables users to extract more useful and reliable information. In this paper, we discuss the design of PhotoScope and an evaluation we conducted to improve its usability and ferret out better design ideas. Permission to make digital or hard copies of all or part of this work for personal or classroom use is granted without fee provided that copies are not made or distributed for profit or commercial advantage and that copies bear this notice and the full citation on the first page. To copy otherwise, or republish, to post on servers or to redistribute to lists, requires prior specific permission and/or a fee. CHI 2009, April 3–9, 2009, Boston, MA, USA. Copyright 2009 ACM 978-1-60558-246-7/08/04…$5.00.
-
Upload
independent -
Category
Documents
-
view
7 -
download
0
Transcript of PhotoScope: visualizing spatiotemporal coverage of photos for construction management
PhotoScope: Visualizing Spatiotemporal Coverage of Photos for Construction Management
Fuqu Wu Computer Science Dept., University of Victoria
3800 Finnerty Road, Victoria, BC, Canada V8W 3P6
Melanie Tory Computer Science Dept., University of Victoria
3800 Finnerty Road, Victoria, BC, Canada V8W 3P6
ABSTRACT PhotoScope visualizes the spatiotemporal coverage of photos in a photo collection. It extends the standard photo browsing paradigm in two main ways: visualizing spatial coverage of photos, and indexing photos by a combination of spatial coverage, time, and content specifications. This approach enables users to browse and search space- and time-indexed photos more effectively. We designed PhotoScope specifically to address challenges in the construction management industry, where large photo collections are amassed to document project progress. These ideas may also apply to any photo collection that is spatially constrained and must be searched using spatial, temporal, and content criteria. We describe the design choices made when developing PhotoScope and the results of user evaluation.
Author Keywords Visualization, photo browser, construction management, spatiotemporal coverage.
ACM Classification Keywords H1.2. User/Machine Systems; H4.1. Office Automation; H5.2. User Interfaces.
INTRODUCTION Digital photos offer a simple and inexpensive way to document events and changes in a spatial area over time. For example, in construction management, photos are used to document the progress of activities involved in the construction of a building. In forestry, aerial and satellite photographs are commonly used to document the state of forests over time, revealing factors such as logging, reforestation, disease, and fire damage. In microscopy, images may document the state of cellular components as a
cell undergoes changes such as cell division.
We focus on photo collections in construction management. Construction is a process of assembling thousands of pieces to create a complete functioning structure and involves disciplines such as architecture, civil, mechanical, and electrical engineering. Due to the complexity of the process, construction claims and disputes often occur and the industry is prone to litigation. For example, imagine that a school hired a contractor to construct additional classroom space a year ago. Recently, the concrete floor in the hallways started to crack. The school owner might sue the contractor, claiming that the concrete construction was not executed appropriately. To avoid paying repair costs, the contractor would have to prove that the use and installation of concrete were appropriate. The litigation process often involves complex issues and is usually very expensive [10]. The industry has been struggling to find ways to equitably and economically resolve these issues [1].
Digital photos have become a common way to document construction site activities. They are gathered periodically, stored in central databases and utilized for project management tasks [5]. ‘Taking photos’ now is part of the routine work of the project monitoring process. The size of the photo archive expands quickly from hundreds to thousands as the scale of the project increases. If any claims and disputes happen at a later stage, searching through the entire photo archive for useful evidence can be a challenging and tedious process.
To support managing, browsing and searching in a construction photo archive more easily and effectively, we designed and implemented PhotoScope, an interactive tool that visualizes the spatiotemporal scope of photo coverage. PhotoScope offers two novel ideas: (1) Indexing photos by space, time, and standardized content specifications, and (2) Showing spatial coverage of photos rather than camera positions, which emphasizes photo contents rather than mechanics of how the photo was taken. PhotoScope makes searching and browsing easier, and enables users to extract more useful and reliable information. In this paper, we discuss the design of PhotoScope and an evaluation we conducted to improve its usability and ferret out better design ideas.
Permission to make digital or hard copies of all or part of this work for personal or classroom use is granted without fee provided that copies are not made or distributed for profit or commercial advantage and that copies bear this notice and the full citation on the first page. To copy otherwise, or republish, to post on servers or to redistribute to lists, requires prior specific permission and/or a fee. CHI 2009, April 3–9, 2009, Boston, MA, USA. Copyright 2009 ACM 978-1-60558-246-7/08/04…$5.00.
We begin by reviewing related work in both Construction Management and Information Visualization. We then describe the design and implementation of our prototype. Finally, we describe the usability study and then conclude with a discussion, design considerations, and future work.
LITERATURE REVIEW We consider three areas of related work: (1) Retrieving photos for construction claims and disputes. (2) Integrating space and time in visualization, and (3) Organizing photos and videos by space and/or time.
Retrieving Photos for Construction Claims and Disputes Research on managing construction photos focuses on search engines to retrieve information from construction photo databases. Most search engines integrate graphics and image processing techniques. Brilakis et al. have a series of work [5,6,7,8] on construction site image retrieval based on image content, materials and material cluster recognition. One of their goals was to generate methods that can index and retrieve images with minimal or no user intervention. By contrast, our goal was to create an interactive visualization tool that enables users to browse and search target photos by time and location. Nonetheless, we envision that these image processing oriented techniques could be easily embedded into PhotoScope.
PHOTO-NET II [1] links archived film clips to a project’s schedule and progress information. It stores digital images from up to four fixed-position cameras at a construction site, and uses the photos to create a film of the construction activities. However, the fixed camera perspectives limit what can be seen. We focus on photos taken by project coordinators when they walk around the site monitoring the project; photos may be taken from all locations within or around a building. These photos cannot be viewed as a movie using PHOTO-NET II. Additionally, PHOTO-NET II does not support tracking status for a construction activity at a specific location and time, nor to link the photos to spatial locations.
Another tool examines the difference between the actual situation at a job site and the design drawing by matching a photo image of the construction site and the modeled image in virtual reality [21]. PhotoScope was designed for a different purpose – enabling users to browse and search for photos with time and location criteria.
Integrating Space and Time in Visualization Tools Visualization is an external representation of data that enhances cognitive abilities [9]. Here we focus on visualizing spatiotemporal data. Shanbhag et al. [26] developed novel ways to visualize temporal changes, e.g. populations over geographical regions for efficient allocation of resources such as schools and care services. Wood et al. [31] applied visual encodings and interactions to assist exploratory visual analysis. Spatial representations such as a ‘tag cloud’ or ‘tag map’ were combined with other visual encodings to support selection of records by time and space. Although Shanbhag et
al. and Wood et al. both represent spatiotemporal datasets, their visualization techniques do not show spatial coverage of photos.
One common approach to integrate space and time is to use three dimensions (3-D). For example, GeoTime [20] represents events as points within an X, Y, Z coordinate space. The X,Y plane shows geographic space and the Z-axis represents time. We chose not to represent time in this way because the 3D space could become very cluttered with a large number of photos, and may not be the easiest interface for browsing and searching for photos.
Methods of building a 3D virtual space from related photos were presented by Anabuki and Ishii [3] and Tanaka et al. [28]. Spatial relations were found according to the same piece of information in different photos, and all photos were connected to form a virtual space. Camera parameters at the time of shooting were calculated and used for exploring spatial relationships. However, construction photos are unlikely to have enough information to build a 3-D virtual space. In addition, 3-D spaces are difficult to navigate.
The approach used in our prototype is to represent time and space in separate widgets, linked together through brushing. Similar ideas have also been used elsewhere. Yuri et al. [32] visualized a sensor field overlaid on a floor plan and a timeline showing the history of sensor activations. We extended their work by showing spatial and temporal coverage of photos, which requires extra work as shown later. Similarly, a Spatio-Temporal Visualization (STV) used to assist crime pattern recognition [11] included a GIS view to display incidents and a timeline to indicate crime density in the time dimension. We generalized and reused the segmented timeline to represent the ‘density’ of construction photos and also utilized the idea of indicating ‘incidents’ in the GIS view to show photo distribution on the floor plan. However, instead of using camera positions like STV, we show spatial coverage of photos on the floor plan, which provides more useful information.
Organizing Photos and Videos by Space and/or Time Photo collections and videos can be structured or viewed based on time and/or location. Harada et al. [17] associated a time line with album icons to indicate the time range that each album covered. Time Quilt [18] organized photo albums into wrapped vertical columns in a temporal order. The Calendar Browser [16] allowed users to view images from one single time granularity, e.g. months in a year, or days in one month. We extend these time-based album ideas by enabling users to manipulate the time coverage and retrieve corresponding photos within the time range.
Map-based storyboards [25] for tour videos and commercial geo-tagged photo sites such as Flickr [15] and Picasa [24] allow users to select video shots or photos and map them into their corresponding locations in the map view. However, storyboards do not facilitate search for a specific shot, and geo-tags could be very cluttered with construction photos

since the same locations might be photographed repeatedly to document the progress over time. Our application shows spatial coverage of photos instead of locations to avoid clutter and also to provide an overview showing which regions have been documented by photos.
Other ways to organize photos include PhotoSpread [19] and Photo Tourism [27]. PhotoSpread organizes biology field photos categorized by time, location, and other attributes in a spreadsheet format. However, for our application visualizing the specific spatial region within a floor plan is important. Photo Tourism is a 3D interface designed to browse many images of the same object. In construction management, activities usually rely on 2D floor plans, and objects vary over time (e.g., a wall might be framed and then have drywall installed). Photo Tourism does not address these issues. Our application allows users to select a region on the floor plan, and view photos that spatially cover the selected region.
DESIGN OF THE VISUALIZATION Our main design objective was to enable construction personnel to manage, browse and search construction photos more easily. This in turn will provide better support for construction control and management.
Scenarios and Design Goals We worked with a construction management expert to identify three main scenarios of use:
1) Construction Claim “The biggest scenario is the construction claim. When you are trying to figure out what actually happened, you go back through the photos … [for example] you have to prove the weather was bad, or there was a certain amount of time that you cannot work effectively [so your work is delayed]”.
2) Defect Inspection “Think of concrete as a good example. You find out that the concrete cannot handle the load it is supposed to handle, or it is already showing cracking that shouldn’t be cracking. You can go back through your photos… maybe you could see something about the way that the construction method that was executed, to figure out if there was some problem with working shift….”.
3) As-Built Story “We all keep records on our projects in the end of the day. You sort of end up with an archive, and photos are part of the archive. It is for future learning and for your own record keeping”.
Based on the information conceptualized from the scenarios, we present our design goals:
1. Support viewing historical data in photos: Provide accurate and specific historical information. Users can track project status at any time point by viewing photo archives of construction activities along the timeline.
2. Facilitate flexible navigation and exploration: Assist users to effectively navigate construction photos by providing maximum temporal and spatial context.
3. Provide a broad, overall view of the allocation of photos in building plans: Provide a big picture of the photo allocation on floor plans to help users have a better idea of what and where the work has been done.
Case Example Used in Our Prototype We have over 700 photos of a building project for a pharmaceutical company. Offices and labs were located on the main floor. They also built a mechanical platform between the main floor and the roof where large mechanical and electrical systems were installed. All photos were taken by a civil engineer who regularly monitored project status and took photos at the site.
We eliminated duplicate photos and created a spreadsheet of metadata (id, timestamp, engineer’s notes, etc.) for each photo. Ideally, spatial coverage of each photo could be calculated from camera parameters (e.g. position, orientation and focal length), similar to Anabuki and Ishii [3]. However, these parameters were not available in our photoset. In order to make use of this photoset, the project engineer who took all the photos worked with us to estimate each photo’s location coordinates and spatial coverage. We did this by manually mapping the photo to the floor plan based on photo contents (e.g. visible objects, layout, and construction features such as windows and equipment).
Three categories of metadata were encoded for each photo: (1) notes made by the project engineer, (2) codes from Master Format, (3) and codes from Uniformat [13]. These standard formats organize construction specifications. For example, a photo where construction workers were pouring concrete was linked to the code “concrete” and subcategories such as “Basic concrete materials and methods”, “Concrete reinforcement”, and so on.
Prototype We conducted three pilot studies to improve usability of our prototype before we reached the current stage. In this section, we describe PhotoScope in detail.
Overview The prototype’s main screen (Figure 1) consists of several components. An overview lies at the upper left corner, and the current floor plan is in the center. In our case example, the main floor is divided into five subareas. Generally, a floor plan could be subdivided according to the building layout. This allows us to implement detailed information in subareas at the second level (described in the next section). The border of the subarea is highlighted in orange both in the floor plan and the overview. The border of the room is highlighted in blue when the mouse rolls over a subarea/room and a tool tip also appears displaying the room number and name. Options such as tool tips and room names can be turned on and off via the option panel (item 3 in Figure 1). Alternate floorplans are shown at the right.
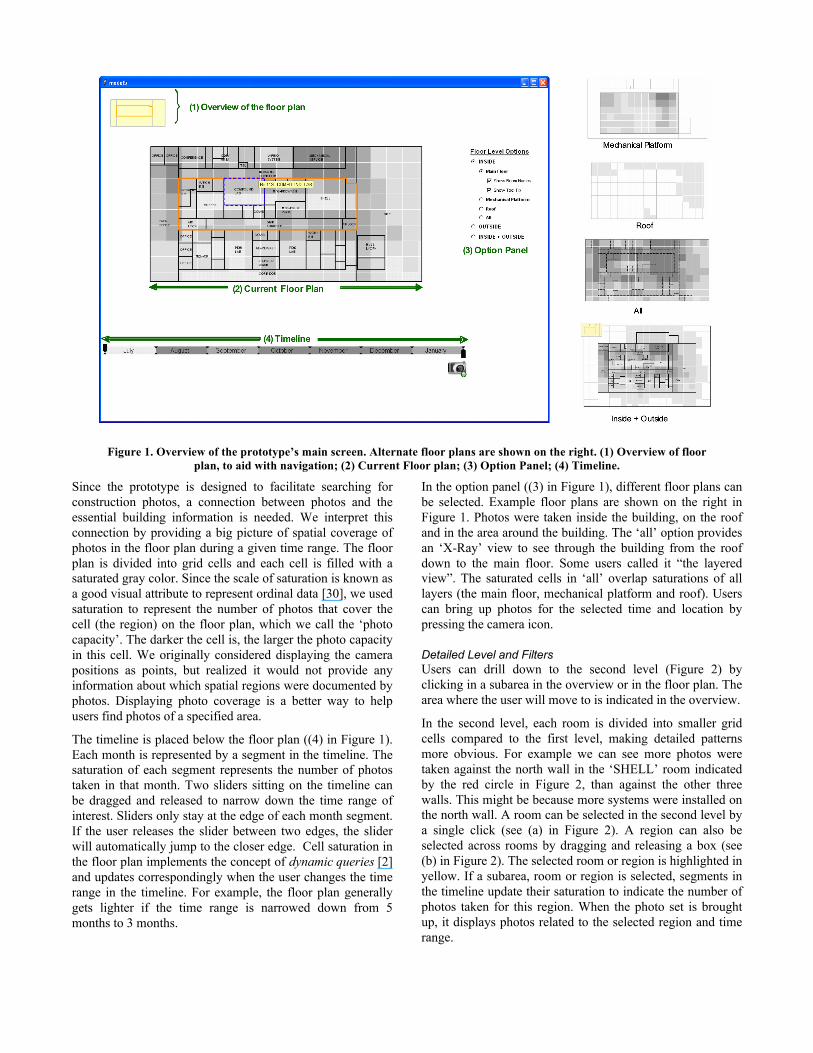
Since the prototype is designed to facilitate searching for construction photos, a connection between photos and the essential building information is needed. We interpret this connection by providing a big picture of spatial coverage of photos in the floor plan during a given time range. The floor plan is divided into grid cells and each cell is filled with a saturated gray color. Since the scale of saturation is known as a good visual attribute to represent ordinal data [30], we used saturation to represent the number of photos that cover the cell (the region) on the floor plan, which we call the ‘photo capacity’. The darker the cell is, the larger the photo capacity in this cell. We originally considered displaying the camera positions as points, but realized it would not provide any information about which spatial regions were documented by photos. Displaying photo coverage is a better way to help users find photos of a specified area.
The timeline is placed below the floor plan ((4) in Figure 1). Each month is represented by a segment in the timeline. The saturation of each segment represents the number of photos taken in that month. Two sliders sitting on the timeline can be dragged and released to narrow down the time range of interest. Sliders only stay at the edge of each month segment. If the user releases the slider between two edges, the slider will automatically jump to the closer edge. Cell saturation in the floor plan implements the concept of dynamic queries [2] and updates correspondingly when the user changes the time range in the timeline. For example, the floor plan generally gets lighter if the time range is narrowed down from 5 months to 3 months.
In the option panel ((3) in Figure 1), different floor plans can be selected. Example floor plans are shown on the right in Figure 1. Photos were taken inside the building, on the roof and in the area around the building. The ‘all’ option provides an ‘X-Ray’ view to see through the building from the roof down to the main floor. Some users called it “the layered view”. The saturated cells in ‘all’ overlap saturations of all layers (the main floor, mechanical platform and roof). Users can bring up photos for the selected time and location by pressing the camera icon.
Detailed Level and Filters Users can drill down to the second level (Figure 2) by clicking in a subarea in the overview or in the floor plan. The area where the user will move to is indicated in the overview.
In the second level, each room is divided into smaller grid cells compared to the first level, making detailed patterns more obvious. For example we can see more photos were taken against the north wall in the ‘SHELL’ room indicated by the red circle in Figure 2, than against the other three walls. This might be because more systems were installed on the north wall. A room can be selected in the second level by a single click (see (a) in Figure 2). A region can also be selected across rooms by dragging and releasing a box (see (b) in Figure 2). The selected room or region is highlighted in yellow. If a subarea, room or region is selected, segments in the timeline update their saturation to indicate the number of photos taken for this region. When the photo set is brought up, it displays photos related to the selected region and time range.
Figure 1. Overview of the prototype’s main screen. Alternate floor plans are shown on the right. (1) Overview of floor plan, to aid with navigation; (2) Current Floor plan; (3) Option Panel; (4) Timeline.

Filters are displayed with the photo set (see Figure 3) to help users narrow down photos based on photo contents. One common question is to find all photos that show the progress or status of an activity, e.g. “Can I see all the flooring photos on the main floor?” Filters accommodate this need.
Users could either select the existing keywords from the keyword list (in the callout in Figure 3) that includes categories in Master Format and Uniformat [13] or add their own keywords. Adding or removing keywords filters and updates the photo set. All photos are ordered by time and the total number of photos is displayed in the window title. A large version of a photo can be brought up by double clicking any thumbnail. The camera position and perspective are represented by a red dot with two angle lines in the floor plan where the photo was taken (see the enlarged version of the camera position and perspective at upper right corner in Figure 3).
ALGORITHMS To calculate a cell’s saturation level, we identify which photos cover the cell and then sum the number of photos. Three possible coverage cases occur (see Figure 4).
No Intersection vs. Intersection In Figure 4 (a) and (b), either the triangle contains the square or the square contains the triangle, indicating that the photo covers the cell. If any edges of the square and edges of the triangle are intersected, the cell is at least partially covered by this photo ((c) in Figure 4). We determined whether any pair of the triangle edges and square edges is intersected using the algorithm known as ‘Sweeping’ [14].
Special Case One additional case occurs, particularly in the corner of a room. If any vertex of the cell could form a convex hull together with vertices of triangle ∆ABC, and the vertex of the cell is between triangle vertices A and B in a convex hull (e.g. the convex hull is CAvB with v being the vertex of a cell), then the cell falls in the region S completely or partially (see (d) in Figure 4). Cells in region S are covered by the photo. We determine if any four points could form a convex hull using part of the ‘Graham’s Scan’ [4].
Saturation Scheme Mehler et al. [22] found that using absolute scales makes most heat effects on a heat map unobservable since very low values are unperceivable. Using a relative scale ensures a maximum contrast between the highest and lowest heat values. We therefore used a relative scale for saturating the cells to ensure low values are perceivable. We ordered the photo capacity for cells on each floor plan separately, and found the quintiles for each floor plan. We mapped each quintile to one of five gray colors in the gray scale.
EVALUATION We conducted laboratory study to (1) ensure validity of our approach before deployment, (2) learn strategies engineers use, and (3) discover design guidelines for future visualization technologies that could support construction management. We chose not to compare PhotoScope to current photo management methods because current practice in the construction industry is ad-hoc. Photos are usually organized in folders based on time in a standard file system, which we did not consider a useful comparison.
Participants We chose participants from various engineering disciplines involved in building design. Twelve regular participants (4
S A
B C
(a) (b) (c) (d)
Figure 2. An example of the detailed second level with a selected room and a selected region in the callouts. Red circle indicates SHELL room where most photos were
taken against the north wall.
Figure 4. Cells in the floor plan and spatial coverage of photos. Red dot and lines indicate camera position and orientation. (a)
and (b) no intersection; (c) intersection; (d) special case.
Figure 3. Photos and filters. (Callout) Keyword list. (Top right) Enlarged version of the corner of the
active floor plan.
civil, 4 mechanical and 4 electrical engineers) and one expert from construction management were recruited. Only the construction management expert was familiar with the photo set, since it was from a past project in a different city. All the civil engineers had extensive experience in the construction industry. They had been involved in various types of construction projects, and their roles varied from project manager, project engineer to contract administrator. Most mechanical/electrical engineers were students with more limited experience, mainly due to practicalities. All participants had used architectural design software such as AutoCAD, and most (9 out of 13) were familiar with photo browsers such as Picasa and Flickr. Participant ages ranged from 22 to 48 years old with a mean age of 31 years.
Apparatus The prototype was implemented in TCL/TK [29] with ActiveTcl version 8.4. Since the evaluation took place in two locations, the computers used were slightly different. Both displays were 19-inch LCD at 1280 by 1024 resolution. Participants interacted with the software using a standard mouse and keyboard.
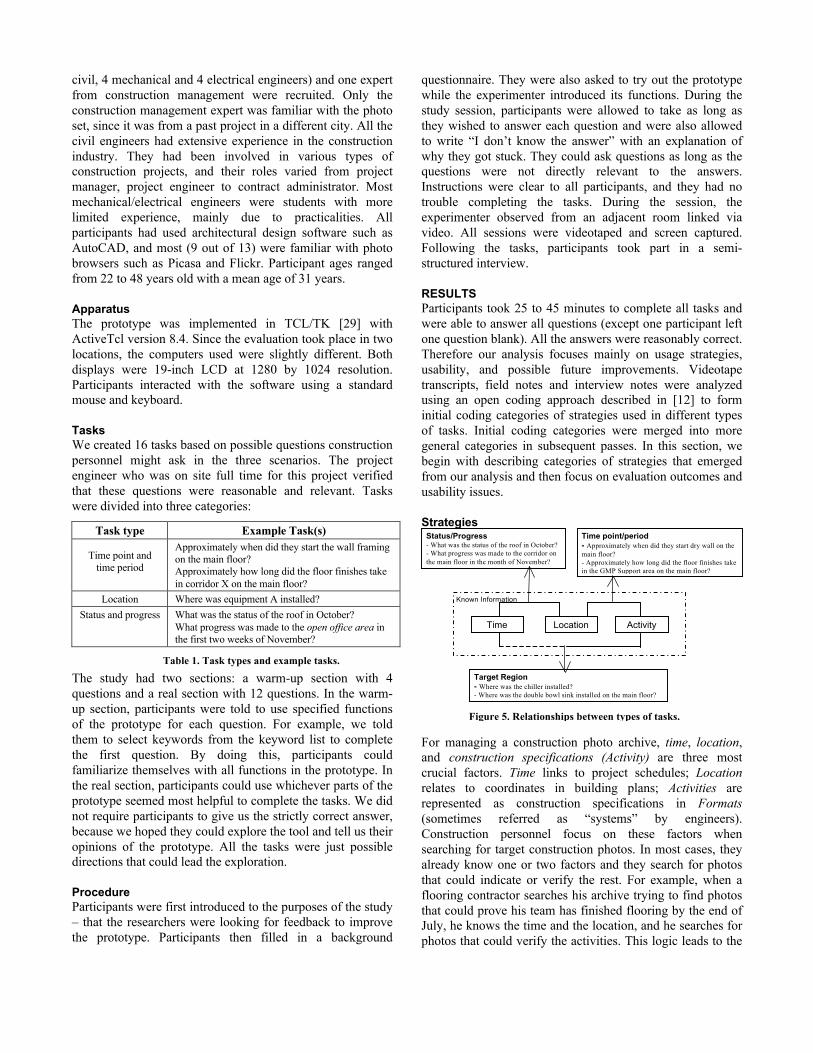
Tasks We created 16 tasks based on possible questions construction personnel might ask in the three scenarios. The project engineer who was on site full time for this project verified that these questions were reasonable and relevant. Tasks were divided into three categories:
Task type Example Task(s)
Time point and time period
Approximately when did they start the wall framing on the main floor? Approximately how long did the floor finishes take in corridor X on the main floor?
Location Where was equipment A installed? Status and progress What was the status of the roof in October?
What progress was made to the open office area in the first two weeks of November?
The study had two sections: a warm-up section with 4 questions and a real section with 12 questions. In the warm-up section, participants were told to use specified functions of the prototype for each question. For example, we told them to select keywords from the keyword list to complete the first question. By doing this, participants could familiarize themselves with all functions in the prototype. In the real section, participants could use whichever parts of the prototype seemed most helpful to complete the tasks. We did not require participants to give us the strictly correct answer, because we hoped they could explore the tool and tell us their opinions of the prototype. All the tasks were just possible directions that could lead the exploration.
Procedure Participants were first introduced to the purposes of the study – that the researchers were looking for feedback to improve the prototype. Participants then filled in a background
questionnaire. They were also asked to try out the prototype while the experimenter introduced its functions. During the study session, participants were allowed to take as long as they wished to answer each question and were also allowed to write “I don’t know the answer” with an explanation of why they got stuck. They could ask questions as long as the questions were not directly relevant to the answers. Instructions were clear to all participants, and they had no trouble completing the tasks. During the session, the experimenter observed from an adjacent room linked via video. All sessions were videotaped and screen captured. Following the tasks, participants took part in a semi-structured interview.
RESULTS Participants took 25 to 45 minutes to complete all tasks and were able to answer all questions (except one participant left one question blank). All the answers were reasonably correct. Therefore our analysis focuses mainly on usage strategies, usability, and possible future improvements. Videotape transcripts, field notes and interview notes were analyzed using an open coding approach described in [12] to form initial coding categories of strategies used in different types of tasks. Initial coding categories were merged into more general categories in subsequent passes. In this section, we begin with describing categories of strategies that emerged from our analysis and then focus on evaluation outcomes and usability issues.
Strategies
For managing a construction photo archive, time, location, and construction specifications (Activity) are three most crucial factors. Time links to project schedules; Location relates to coordinates in building plans; Activities are represented as construction specifications in Formats (sometimes referred as “systems” by engineers). Construction personnel focus on these factors when searching for target construction photos. In most cases, they already know one or two factors and they search for photos that could indicate or verify the rest. For example, when a flooring contractor searches his archive trying to find photos that could prove his team has finished flooring by the end of July, he knows the time and the location, and he searches for photos that could verify the activities. This logic leads to the
Time Location Activity
Status/Progress - What was the status of the roof in October? - What progress was made to the corridor on the main floor in the month of November?
Time point/period - Approximately when did they start dry wall on the main floor? - Approximately how long did the floor finishes take in the GMP Support area on the main floor?
Target Region - Where was the chiller installed? - Where was the double bowl sink installed on the main floor?
Known Information
Figure 5. Relationships between types of tasks.
Table 1. Task types and example tasks.
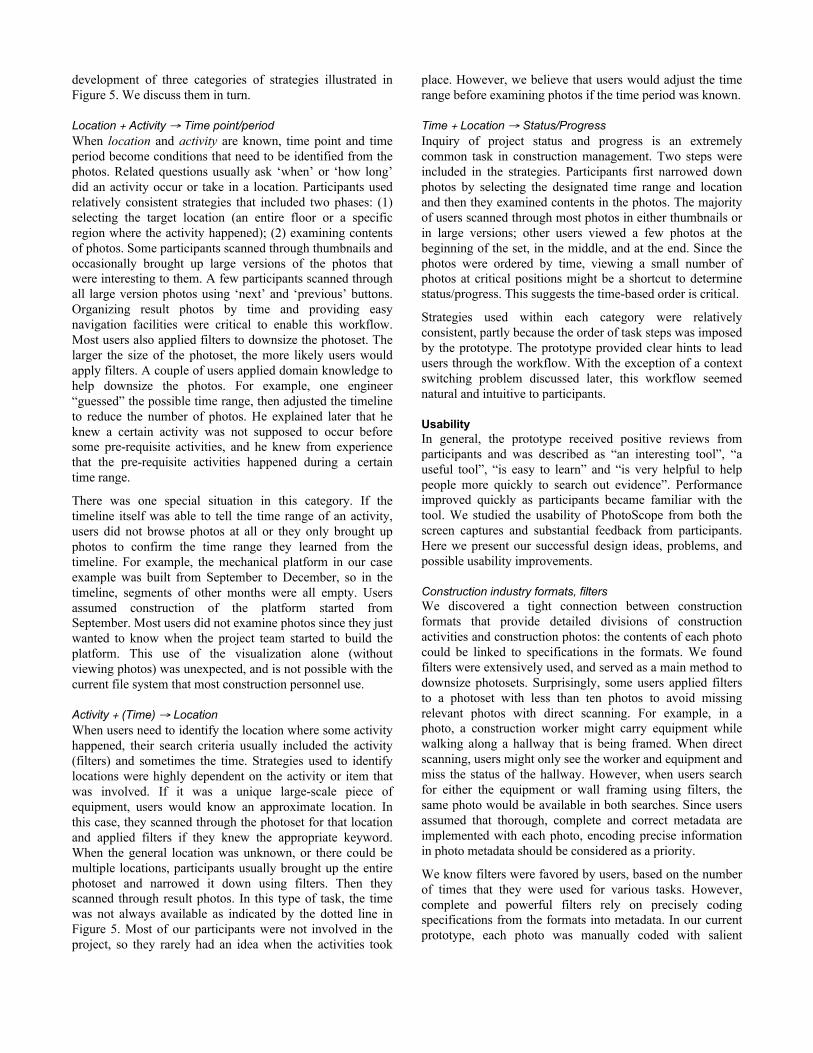
development of three categories of strategies illustrated in Figure 5. We discuss them in turn.
Location + Activity → Time point/period When location and activity are known, time point and time period become conditions that need to be identified from the photos. Related questions usually ask ‘when’ or ‘how long’ did an activity occur or take in a location. Participants used relatively consistent strategies that included two phases: (1) selecting the target location (an entire floor or a specific region where the activity happened); (2) examining contents of photos. Some participants scanned through thumbnails and occasionally brought up large versions of the photos that were interesting to them. A few participants scanned through all large version photos using ‘next’ and ‘previous’ buttons. Organizing result photos by time and providing easy navigation facilities were critical to enable this workflow. Most users also applied filters to downsize the photoset. The larger the size of the photoset, the more likely users would apply filters. A couple of users applied domain knowledge to help downsize the photos. For example, one engineer “guessed” the possible time range, then adjusted the timeline to reduce the number of photos. He explained later that he knew a certain activity was not supposed to occur before some pre-requisite activities, and he knew from experience that the pre-requisite activities happened during a certain time range.
There was one special situation in this category. If the timeline itself was able to tell the time range of an activity, users did not browse photos at all or they only brought up photos to confirm the time range they learned from the timeline. For example, the mechanical platform in our case example was built from September to December, so in the timeline, segments of other months were all empty. Users assumed construction of the platform started from September. Most users did not examine photos since they just wanted to know when the project team started to build the platform. This use of the visualization alone (without viewing photos) was unexpected, and is not possible with the current file system that most construction personnel use.
Activity + (Time) → Location When users need to identify the location where some activity happened, their search criteria usually included the activity (filters) and sometimes the time. Strategies used to identify locations were highly dependent on the activity or item that was involved. If it was a unique large-scale piece of equipment, users would know an approximate location. In this case, they scanned through the photoset for that location and applied filters if they knew the appropriate keyword. When the general location was unknown, or there could be multiple locations, participants usually brought up the entire photoset and narrowed it down using filters. Then they scanned through result photos. In this type of task, the time was not always available as indicated by the dotted line in Figure 5. Most of our participants were not involved in the project, so they rarely had an idea when the activities took
place. However, we believe that users would adjust the time range before examining photos if the time period was known.
Time + Location → Status/Progress Inquiry of project status and progress is an extremely common task in construction management. Two steps were included in the strategies. Participants first narrowed down photos by selecting the designated time range and location and then they examined contents in the photos. The majority of users scanned through most photos in either thumbnails or in large versions; other users viewed a few photos at the beginning of the set, in the middle, and at the end. Since the photos were ordered by time, viewing a small number of photos at critical positions might be a shortcut to determine status/progress. This suggests the time-based order is critical.
Strategies used within each category were relatively consistent, partly because the order of task steps was imposed by the prototype. The prototype provided clear hints to lead users through the workflow. With the exception of a context switching problem discussed later, this workflow seemed natural and intuitive to participants.
Usability In general, the prototype received positive reviews from participants and was described as “an interesting tool”, “a useful tool”, “is easy to learn” and “is very helpful to help people more quickly to search out evidence”. Performance improved quickly as participants became familiar with the tool. We studied the usability of PhotoScope from both the screen captures and substantial feedback from participants. Here we present our successful design ideas, problems, and possible usability improvements.
Construction industry formats, filters We discovered a tight connection between construction formats that provide detailed divisions of construction activities and construction photos: the contents of each photo could be linked to specifications in the formats. We found filters were extensively used, and served as a main method to downsize photosets. Surprisingly, some users applied filters to a photoset with less than ten photos to avoid missing relevant photos with direct scanning. For example, in a photo, a construction worker might carry equipment while walking along a hallway that is being framed. When direct scanning, users might only see the worker and equipment and miss the status of the hallway. However, when users search for either the equipment or wall framing using filters, the same photo would be available in both searches. Since users assumed that thorough, complete and correct metadata are implemented with each photo, encoding precise information in photo metadata should be considered as a priority.
We know filters were favored by users, based on the number of times that they were used for various tasks. However, complete and powerful filters rely on precisely coding specifications from the formats into metadata. In our current prototype, each photo was manually coded with salient

information. However, we envision that image processing oriented techniques presented in [5,6,7,8] could be used to detect contents of each photo and relate photos to corresponding categories from the formats.
Timeline Users’ opinions on the usability of the timeline fell into two categories. First, users interpreted the timeline saturation as construction progress and the timeline was considered to be an overview of the schedule. One good example was to find out when the construction team started building the mechanical platform (described in ‘Strategies’ section). The saturation of the timeline provides hints for the time range of an activity. Second, users pointed out that the timeline should have multiple granularities (e.g. so they could select a single day or from an exact date to another exact date).
Context Switch In the current prototype, floor plans and the timeline are displayed in the main window. Photos can be brought up along with filters in a separate window. We made this choice to increase the screen space available for photos. However, manipulating search widgets (time ranges and spatial regions) from the photo display window requires window switching. This context switching was described as “a disconnect” by participants. Users expected to be able to manipulate all search widgets while they examined a photoset, and did not like to “go back and forth”. From video observations, we found that when a user obtained an unexpected photoset (e.g. one that was empty or did not meet search criteria), they usually dragged the photo window away to check if they had selected the correct region. Minimizing this context switch could potentially improve performance by reducing memory load. One engineer pointed out that they would rather tolerate relatively small size photos, in exchange for having all search widgets available in a single window. Ideally, a larger screen would allow all widgets to be integrated without compromising photo size.
Assumptions about Cell Saturations In our prototype, each cell in the floor plan is filled with a saturated gray color representing the number of photos. We expected participants could see where most photos were taken across the building. All participants were able to understand the representation. However, one unexpected outcome was that engineers further interpreted the cell saturations to additional meanings based on their domain knowledge. Two main types of interpretations were assumed:
1. The darker the cell, the more photos, the more activities? Several engineers assumed more photos in an area meant there were more construction activities. Photos are usually taken by coordinators who monitor the project and keep records in case of future claims. They are likely to take photos to record the type and quality of activities happening at the time. This is not always the case; for example, if a project was delayed because of a heavy rain, construction workers might take many photos to explain why they could
not get to the site. Engineers agreed that more photos generally indicate more activities, but disagreed about whether the activities necessarily contributed to project progress. But for record keeping and construction claims, all kinds of activities are equally important.
2. The darker the cell, the more photos, the more problems? One engineer with specialty in diagnosing construction performance told us that if more photos were taken in one area, there might be more problems in this area. He pointed out that photos could be taken to capture the defects and used as evidence. In this case, more photos probably means more problems. Although this is an opinion from a single engineer, he represents a large number of construction personnel who work in the area of defect inspection.
Some participants did not assume any of the above, but they assumed “No photos, no work has been done”. Other participants used the cell colors to gain an overview of the progress. For example, at the beginning stage, the floor plan was only covered partially, and an engineer said “if I looked at this [prototype], if the color is there [in the floor plan]”, pointing to one side of the floor plan, “I could tell the work is going on in this side, and it gave me the indication that the work is going on in this area”. Cell saturations enable users to see progress in different areas.
We did not expect participants would make assumptions about cell saturations beyond the original meanings. To some extent, the further interpretation could be an unexpected benefit of our design. Users were able to relate the visual representation to concrete instances in their own problem domain, rather than conceive it as quantitative numbers. On the other hand, users could make false assumptions that lead them to incorrect conclusions. This is more likely to be a problem when viewing photos taken by another person, since the user may not know the reason why photos were taken.
DISCUSSION
Bridging time, location and construction specifications Time, location, and construction specifications (activities) are relatively loosely connected in a regular record keeping archive; however, construction claims usually require integrated information of all three components. Bridging these three crucial factors together into a single interactive tool enables users to more efficiently locate target construction photos. Participants were observed to have fairly clear logic using the timeline, floor plan and filters to refine search criteria. Our prototype is very different from conventional methods such as a file browser. A file browser could support viewing photos by time if photos were organized into folders based on time, but would only allow a linear search. Building design professionals often need to browse photos in a specific spatial region and manipulate the time range at the same time. PhotoScope provides more flexibility to enable users to browse and search in various ways. It also provides an overview of spatiotemporal coverage of photos in a collection, enabling users to see

trends in activity over time and space and to answer certain questions from the visualization alone.
Activity-Centered System We had a detailed interview with the construction management expert who took the photos in our example project. One of her suggestions was the next generation construction photo viewer she imagined – an activity-centered system that we believe is worth discussing.
Intelligently Identifying Construction Activities Ideally, when a photoset is displayed, the system could intelligently identify activities represented by that photoset. Activities could be reflected through the construction standards, the Formats. For example, the Formats could be a checked list with all associated activities checked for the selected floor plan and time range. To further narrow down the resulting photoset, users could turn on and off options in the list. Another suggestion from an electrical engineer was to use a Tag Cloud to indicate the rank of construction activities within the search criteria.
Activity Based Timeline In an activity-centered system, the timeline should reflect stages of construction activities. Both the engineer and the primary researcher realized that an activity-based timeline was similar to a Gantt chart [23]. When the engineer was asked if she would like a Gantt chart in the prototype, she said “I would like to see a Gantt chart. I can see time, then I can select activities”. However, a single building project could have several hundred activities. Integrating every stage of every single activity requires extensive metadata for each photo; moreover, including a complete Gantt chart with other search widgets in a single visualization is not practical. As an alternative, a brief summary of activities from a project’s schedule could be embedded into the timeline. The simplified timeline view could be linked to a separate Gantt chart window or a set of histograms with each bar representing one of the salient construction activities. These histograms could be displayed in a tool tip when the mouse rolls over a specific time range.
Extension to Other Domains Although PhotoScope was developed in direct response to difficulties that arose in managing construction photos to support claims, we believe many of our design ideas could be useful for representing photo collections in other problem domains. Spatial coverage could be applied to land survey photos to indicate how well geographical regions have been documented and could also indicate levels of interest in different regions. Similarly, in microscopy, spatial coverage could be used to indicate which parts of a sample have been imaged and which parts of a sample are shown in detailed photos. Linking photos to an adjustable timeline could be applied to microscope images or earth observation photos to emphasize change. Images retrieved from different time segments sustain features that only belong to that time period. Manipulating the timeline would make changes stand
out on the same geographical image/map. Saturations of time periods on the timeline could be used to represent how intensive the changes are within each time period. Users in our study also suggested that our system could be used as a surveillance system (e.g. in a shopping mall) assuming a number of cameras are installed in the building and take pictures based on activity frequency. Our visualization could provide an overview of activity allocation across the building in a given time period, which could accompany video surveillance.
CONCLUSION AND FUTURE WORK PhotoScope was designed to facilitate construction photo browsing and searching to better support claims and document management. It presents the novel idea of integrating a project timeline, building plans and specifications. Combining these three factors provides additional facilities for construction personnel to quickly locate related documents. The patterns of usage on using the visualization were consistent within each category of search. Performance improved quickly as participants became more familiar with the tool. Several of our outcomes may serve as more general design implications:
• Organizing photos based on time, spatial coverage, and content provides an efficient way to search photo collections. Some types of questions can be answered directly from time and spatial coverage visualizations.
• Time-based organization of photos supports visual scanning.
• Providing simple navigation facilities enables smooth workflow of information extraction. Even simple window switching actions can disrupt workflow.
• Users assume thorough, complete and correct metadata encoded with photos when they retrieve photos using keywords. Designs that involve photo searching based on metadata should consider encoding complete metadata as a priority.
• Users make unexpected assumptions about the meaning of cell saturations. Correct assumptions can help answer questions more easily, but incorrect ones might cause incorrect conclusions. Users should be warned about the risks of making such assumptions.
An “Activity based system”, the idea of the next generation construction photo viewer was the highlight of our study. Linking Gantt chart and other construction artifact systems to our visualization and intelligently identifying, connecting schedules, floor plans, documents and activities together would be possible directions of future research.
ACKNOWLEDGEMENTS This work was supported by the Natural Sciences and Engineering Research Council of Canada. We also thank our study participants for their time and valuable feedback.

REFERENCES 1. Abeid, J., Allouche, E., Arditi, D., and Hayman, M.
PHOTO-NET II: a computer-based monitoring system applied to project management. Automation in Construction, 12 (2003) 603-616.
2. Ahlberg, C., Williamson, C., and Shneiderman, B. 1992. Dynamic queries for information exploration: an implementation and evaluation. CHI 1992, 619-626.
3. Anabuki, M. and Ishii, H. 3D and Sequential Representations of Spatial Relationships among Photos. CHI 2006, 472-477.
4. de Berg, M., van Kreveld, M., Overmars, M. and Schwarzkopf, O. Computational Geometry. Second edition. Springer-Verlag Press, 2000, pp. 1-8.
5. Brilakis, I., and Soibelman, L. Content-Based Search Engines for construction image databases. Automation in Construction, 14 (2005), 537-550.
6. Brilakis, I., and Soibelman, L. Multimodal Image Retrieval from Construction Databases and Model-Based Systems. J. Construction Engineering and Management, 132, 7 (2006), 777-785.
7. Brilakis, I., Soibelman, L., and Shinagawa, Y. Material-Based Construction Site Image Retrieval. J. Computing in Civil Engineering, 19, 4 (2005), 341-355.
8. Brilakis, I.K., Soibelman, L., and Shinagawa, Y. Construction site image retrieval based on material cluster recognition. Advanced Engineering Informatics, 20 (2006), 443-452.
9. Card, S., Mackinlay, J., and Shneiderman, B. Readings in Information Visualization. Morgan Kaufman, 1999.
10. Chau, K.W. Application of a PSO-based neural network in analysis of outcomes of construction claims. Automation in Construction, 16 (2007), 642-646.
11. Chen, H., Atabakhsh, H., Tseng, C., Marshall, B., Kaza, S., Eggers, S., Gowda, H. Shah, A., Petersen, T. and Violette, C. Visualization in Law Enforcement. Posters, CHI 2005, 1268-1271.
12. Creswell, J.W. Educational Research: Planning, conducting, and evaluating quantitative and qualitative research. Second edition, pp. 202-230.
13. CSI: The Construction Specifications Institute. http://www.csinet.org.
14. Cormen, T.H., Leiserson, C.E. and Rivest, R.L. Introduction to Algorithms, pp. 887-897.
15. Flickr. http://www.flickr.com 16. Graham, A., Garcia-Molilna, H., Paepcke, A. And
Winograd, T. Time as Essence for Photo Browsing Through Personal Digital Libraries. JCDL’02.
17. Harada, S., Naaman, M., Song, Y.J., Wang, Q. and Paepcke, A. Lost in Memories: Interacting with Photo Collections on PDAs. JCDL ’04.
18. Huynh, D. F., Drucker, S. M., Baudisch, P., and Wong, C. Time quilt: scaling up zoomable photo browsers for large, unstructured photo collections. In CHI 2005 Extended Abstracts, 1937-1940.
19. Kandel, S., Abelson, E., Garcia-Molina, H., Paepcke, A. And TheoBald, M. PhotoSpread: A Spreadsheet for Managing Photos. In CHI 2008, 1749-1758.
20. Kapler, T. and Wright, W. GeoTime Information Visualization. IEEE Information Visualization 2004, 25-32.
21. Kim, H. and Kano, N. Comparison of construction photograph and VR image in construction progress. Automation in Construction, 17 (2008), 137-143.
22. Mehler, A., Bao, Y., Li, X., Wang, Y. and Skiena, S. Spatial Analysis of News Sources. In IEEE Trans. Visualization and Computer Graphics 12,5 (2006), 765-772.
23. Microsoft Office Project. http://office.microsoft.com/en-us/project
24. Picasa. http://picasa.google.com 25. Pongnumkul, S., Wang, J., and Cohen, M. Creating
map-based storyboards for browsing tour videos. In User interface Software and Technology (UIST) 2008.
26. Shanbhag, P., Rheingans, P. and desJardins, M. Temporal Visualization of Planning Polygons for Efficient Partitioning of Geo-Spatial Data. In IEEE Information Visualization 2005, 211-218.
27. Snavely, N., Seitz, S. M., and Szeliski, R. 2006. Photo tourism: exploring photo collections in 3D. In SIGGRAPH '06. ACM, 835-846.
28. Tanaka, H., Arikawa, M. and Shibasaki, R. A 3-D Photo Collage System for Spatial Navigations. Springer-Verlag Berlin Heidelberg, 2002, pp. 305-316.
29. TCL/TK. http://www.tcl.tk/ 30. Ware, C. Information Visualization: Perception for
Design. Second Edition. Elsevier, 2004, p. 129. 31. Wood, J., Dykes, J., Slingsby, A. and Clarke, K.
Interactive Visual Exploration of a Large Spatio-Temporal Dataset: Reflections on a Geovisualization Mashup. In IEEE Trans. Visualization and Computer Graphics 13,6 (2007), 1176-1183.
32. Yuri, A., Wren, C., Sorokin, A. and Kaur, I. Visualizing the History of Living Spaces. In IEEE Information Visualization, 13,6 (2007), 1153-1160.