Photoreceptor responses of fruitflies with normal and reduced arrestin content studied by...
13
ORIGINAL PAPER Photoreceptor responses of fruitflies with normal and reduced arrestin content studied by simultaneous measurements of visual pigment fluorescence and ERG Gregor Belus ˇic ˇ • Primoz ˇ Pirih • Doekele G. Stavenga Received: 6 July 2009 / Revised: 1 November 2009 / Accepted: 3 November 2009 / Published online: 19 November 2009 Ó The Author(s) 2009. This article is published with open access at Springerlink.com Abstract We have simultaneously measured the electro- retinogram (ERG) and the metarhodopsin content via fluorescence in white-eyed, wild-type Drosophila and the arrestin2 hypomorphic mutant (w - ;arr2 3 ) at a range of stimulus wavelengths and intensities. Photoreceptor response amplitude and termination (transition between full repolarization and prolonged depolarizing afterpoten- tial, PDA) were related to visual pigment conversions and arrestin concentration. The data were implemented in a kinetic model of the rhodopsin–arrestin cycle, allowing us to estimate the active metarhodopsin concentration as a function of effective light intensity and arrestin concen- tration. Arrestin reduction in the mutant modestly increased the light sensitivity and decreased the photoreceptor dynamic range. Compared to the wild type, in the mutant the transition between full repolarization and PDA occur- red at a lower metarhodopsin fraction and was more abrupt. We developed a steady-state stochastic model to interpret the dependence of the PDA on effective light intensity and arrestin content and to help deduce the arrestin to rho- dopsin ratio from the sensitivity and PDA data. The fea- sibility of different experimental methods for the estimation of arrestin content from ERG and PDA is discussed. Keywords Drosophila photoreceptor Arrestin PDA ERG Metarhodopsin fluorescence Introduction The phototransduction process of animal photoreceptors starts with the absorption of light by visual pigment mole- cules, which causes conversion of the native rhodopsin state into an active metarhodopsin state, resulting, after several biochemical steps, in a change in the membrane potential of the photoreceptor (Minke and Hardie 2000; Hardie and Raghu 2001). The temporal resolution of the visual process depends on the speed of the biochemical chain and on the lifetime of the active metarhodopsin state, the trigger of the phototransduction chain. Inactivation of the metarhodopsin state occurs on binding of an arrestin molecule. The arrestin binding constant and its concen- tration thus are crucial factors in determining the temporal resolution, as well as the time course and extent of light adaptation of the photoreceptor (Hardie 2001). The metarhodopsin state of vertebrate visual pigments is thermolabile, resulting in degradation of the metarhodopsin molecules and arrestin release. The metarhodopsin state of invertebrate visual pigments is, however, thermostable. This has led to the development of a different strategy of visual maintenance, as has become clear from extensive studies on the main photoreceptor class of the fruitfly, Drosophila, the R1-6 photoreceptors. On photon absorp- tion, their rhodopsin (Rh1), which absorbs maximally in the blue-green, converts into a metarhodopsin state that absorbs maximally in the orange wavelength range (Ostroy et al. 1974; Salcedo et al. 1999). Absorption of a photon by the metarhodopsin causes the reverse process, namely conversion of the metarhodopsin into the rhodopsin state. G. Belus ˇic ˇ(&) Department of Biology, Biotechnical Faculty, University of Ljubljana, Vec ˇna pot 111, 1000 Ljubljana, Slovenia e-mail: [email protected] P. Pirih D. G. Stavenga Department of Neurobiophysics, University of Groningen, Nijenborgh 4, 9747 AG Groningen, The Netherlands 123 J Comp Physiol A (2010) 196:23–35 DOI 10.1007/s00359-009-0489-5
Transcript of Photoreceptor responses of fruitflies with normal and reduced arrestin content studied by...

ORIGINAL PAPER
Photoreceptor responses of fruitflies with normal and reducedarrestin content studied by simultaneous measurementsof visual pigment fluorescence and ERG
Gregor Belusic • Primoz Pirih • Doekele G. Stavenga
Received: 6 July 2009 / Revised: 1 November 2009 / Accepted: 3 November 2009 / Published online: 19 November 2009
� The Author(s) 2009. This article is published with open access at Springerlink.com
Abstract We have simultaneously measured the electro-
retinogram (ERG) and the metarhodopsin content via
fluorescence in white-eyed, wild-type Drosophila and the
arrestin2 hypomorphic mutant (w-;arr23) at a range of
stimulus wavelengths and intensities. Photoreceptor
response amplitude and termination (transition between
full repolarization and prolonged depolarizing afterpoten-
tial, PDA) were related to visual pigment conversions and
arrestin concentration. The data were implemented in a
kinetic model of the rhodopsin–arrestin cycle, allowing us
to estimate the active metarhodopsin concentration as a
function of effective light intensity and arrestin concen-
tration. Arrestin reduction in the mutant modestly increased
the light sensitivity and decreased the photoreceptor
dynamic range. Compared to the wild type, in the mutant
the transition between full repolarization and PDA occur-
red at a lower metarhodopsin fraction and was more abrupt.
We developed a steady-state stochastic model to interpret
the dependence of the PDA on effective light intensity and
arrestin content and to help deduce the arrestin to rho-
dopsin ratio from the sensitivity and PDA data. The fea-
sibility of different experimental methods for the
estimation of arrestin content from ERG and PDA is
discussed.
Keywords Drosophila photoreceptor � Arrestin �PDA � ERG � Metarhodopsin fluorescence
Introduction
The phototransduction process of animal photoreceptors
starts with the absorption of light by visual pigment mole-
cules, which causes conversion of the native rhodopsin
state into an active metarhodopsin state, resulting, after
several biochemical steps, in a change in the membrane
potential of the photoreceptor (Minke and Hardie 2000;
Hardie and Raghu 2001). The temporal resolution of the
visual process depends on the speed of the biochemical
chain and on the lifetime of the active metarhodopsin state,
the trigger of the phototransduction chain. Inactivation of
the metarhodopsin state occurs on binding of an arrestin
molecule. The arrestin binding constant and its concen-
tration thus are crucial factors in determining the temporal
resolution, as well as the time course and extent of light
adaptation of the photoreceptor (Hardie 2001).
The metarhodopsin state of vertebrate visual pigments is
thermolabile, resulting in degradation of the metarhodopsin
molecules and arrestin release. The metarhodopsin state of
invertebrate visual pigments is, however, thermostable.
This has led to the development of a different strategy of
visual maintenance, as has become clear from extensive
studies on the main photoreceptor class of the fruitfly,
Drosophila, the R1-6 photoreceptors. On photon absorp-
tion, their rhodopsin (Rh1), which absorbs maximally in
the blue-green, converts into a metarhodopsin state that
absorbs maximally in the orange wavelength range (Ostroy
et al. 1974; Salcedo et al. 1999). Absorption of a photon by
the metarhodopsin causes the reverse process, namely
conversion of the metarhodopsin into the rhodopsin state.
G. Belusic (&)
Department of Biology, Biotechnical Faculty,
University of Ljubljana, Vecna pot 111,
1000 Ljubljana, Slovenia
e-mail: [email protected]
P. Pirih � D. G. Stavenga
Department of Neurobiophysics, University of Groningen,
Nijenborgh 4, 9747 AG Groningen, The Netherlands
123
J Comp Physiol A (2010) 196:23–35
DOI 10.1007/s00359-009-0489-5
In Drosophila and other higher dipterans, the conversion
direction from metarhodopsin to rhodopsin is under normal
light conditions augmented by the red screening pigment
(Stavenga 2002). Photoconversion of the metarhodopsin is
followed by arrestin release, after which the resulting
native rhodopsin is ready for another round of photo-
transduction (Byk et al. 1993; for a recent review, see
Hardie and Postma 2008).
If exposed to bright monochromatic blue light for a
sufficiently long period, fruitfly R1-6 photoreceptors
remain depolarized in the dark for hours (Cosens and
Briscoe 1972; Minke et al. 1975). The persisting electro-
physiological signal, a special phenomenon in the photo-
transduction process of Drosophila, has been named the
prolonged depolarizing afterpotential (PDA). More recent
studies on fruitfly mutants have clarified this finding: bright
blue light creates more metarhodopsin molecules than can
be blocked by the available arrestin, leaving a surplus of
active metarhodopsins that keep the phototransduction
process going, even in complete darkness (Byk et al. 1993;
Dolph et al. 1993). A PDA is readily created in white-eyed
fruitflies, which lack the blue light-absorbing screening
pigments, but it is realized also in red-eyed flies if short-
wavelength light of sufficient intensity and duration is
applied (Lo and Pak 1981).
A quantitative understanding of the phototransduction
process and its dependence on arrestin is strongly facili-
tated by the use of Drosophila mutants. Drosophila photo-
receptors express two arrestin forms, arrestin1 (Arr1) and
arrestin2 (Arr2), originally identified as phosrestin 2 and 1,
respectively (Matsumoto and Yamada 1991). Arrestin2 is
approximately sevenfold more abundantly expressed than
arrestin1 in the wild type. Arrestin2 is the functionally
more important form for the inactivation of metarhodopsin
(Dolph et al. 1993). Compared to the wild type, arr2
mutants have a log unit lower threshold for entering the
PDA state (Dolph et al. 1993; Vinos et al. 1997; rev. Hardie
and Postma 2008). The residual arrestin in w-;arr23 is
mostly arrestin1. In the absence of arrestin2, arrestin1 can
inactivate metarhodopsin, albeit less effectively, resulting
in a slow course of inactivation in the arr23 mutant (time
constant of current inactivation: wild type, s = 20 ms,
arr23 mutant, s = 167 ms; Ranganathan and Stevens
1995). Using the arr11 mutant, the absence of arrestin1 has
not been shown to confer a deactivation defect. The role of
arrestin1 in metarhodopsin inactivation has been shown
indirectly, through a severe deactivation defect in the
double arr11;arr23 mutant (Dolph et al. 1993). A recent
study by Satoh and Ready (2005) attributed an important
intracellular trafficking role to arrestin1.
Arrestin2 translocates on the subcellular level between
the microvilli and the soma in a light-dependent manner
(Lee et al. 2003). The assumption that its concentration in
the subcellular compartment is variable and regulated rai-
ses several questions: for instance, what is the adequate
arrestin concentration in wild-type flies under normal
environmental conditions, and how does the arrestin con-
centration determine the temporal resolution of fruitfly
photoreceptors? Here, we analyze the role of arrestin by
comparing the electrical responses of white-eyed fruitflies
(w-), where the photoreceptors have the normal, wild-type
phototransduction components, with the responses of
white-eyed hypomorphic arr23 mutants (w-;arr23), where
the photoreceptors have a reduced arrestin2 content. We
specifically study the transition to the PDA state in rela-
tionship with visual pigment conversions, which were
measured with the aid of metarhodopsin fluorescence.
Materials and methods
Experimental animals
Experiments were performed on two strains of fruitflies
(white-eyed wild type, w-; and white-eyed arrestin2
mutant, w-;arr23), donated by the Biosensorics Group of
the University of Hohenheim, Germany. The wild-type
flies were kept on a 12/12-h light/dark cycle, while the
arrestin mutants were kept in constant darkness, to avoid
retinal degeneration. The flies were reared on a standard
cornmeal diet at room temperature (20 �C). The experi-
ments were performed on 5 days old wild-type flies and on
1-day-old arrestin mutants at room temperature.
Preparation
The flies were immobilized with beeswax, fixed to a plastic
pipette tip and positioned in a miniature goniometer. A
chloridized silver wire (diameter 0.05 mm), inserted into
the thorax of the fly, served as the reference electrode.
After checking the viability of the preparation by inspect-
ing the dark trapezoidal pseudopupil under a dissecting
stereomicroscope, the preparation was transferred to the
stage of the microscope in the setup. The recording elec-
trode was inserted horizontally from the side of the
microscope stage, just beneath the cornea, under visual
control using a low power objective.
Optical and electrophysiological setup
The experimental setup for the light stimulation of the eye
and concurrent measurements of the fluorescence and the
electroretinogram (ERG) was built around a Leitz Ortho-
plan epi-illumination microscope. The objective was a 209
LWD, NA0.40 (Olympus, Japan). The light stimulator
consisted of a 75 W XBO lamp, a shutter and a
24 J Comp Physiol A (2010) 196:23–35
123

monochromator (1/8 m, Newport Oriel, USA) with a
bandpass (FWHM) of about 15 nm. The measurement path
for the fluorescence recordings consisted of an adjustable
field diaphragm, a red long-pass filter ([695 nm) and a
photomultiplier (PMT; R928, Hamamatsu, Japan). The
PMT signal was low-pass filtered at 10 Hz. The field dia-
phragm in the observation path was stepped down and
positioned to coincide with the image of the deep-pseudo-
pupil (DPP), to optimize the fluorescence signal to
background ratio. For ERG measurements, we used a
DAM-50 amplifier (WPI, USA) as the headstage. The
amplifier was operated in single-ended DC mode with 109
gain. The signal was further amplified and low-pass filtered
at 100 Hz with an AM502 plug-in amplifier (Tektronix,
USA). For the electrophysiological recordings, we used
borosilicate glass microelectrodes pulled from capillaries
(OD 1.5 mm, ID 0.7 mm, with filament) on a P97 puller
(Sutter, USA). The electrodes were filled with Insect
Ringer and had a resistance of \3 MX. The ERG magni-
tude at saturating light intensities was about 20 mV.
Stimulation protocol, acquisition and data analysis
The ERG and PMT signals were sampled at 1 kHz by a
CED1401plus laboratory interface, operated under the
control of the software package WinWCP (Strathclyde
Electrophysiology software version 4.0.5; Dempster 2001),
which also controlled the shutters and the monochromator.
First stage off-line analysis (measurements of ERG mag-
nitudes and fitting of fluorescence decay exponentials to
the PMT signals) was performed in the waveform mea-
surement and curve fitting module of WinWCP. The fitted
parameters were then transferred to Prism 4.0 (GraphPad,
USA), where further analysis was performed.
Visual pigment photochemistry and metarhodopsin
fluorescence measurements
The main visual pigment of Drosophila (Rh1) has two
thermostable states, rhodopsin (R) and metarhodopsin (M),
which are photointerconvertible. The photochemistry of
fruitfly visual pigment, therefore, is described by the
scheme R $ M, with rate constants kR and kM for the
photoconversions of R to M and of M to R, respectively
(see e.g., Stavenga and Schwemer 1984). The rate con-
stants are kR = bRI and kM = bMI, where I is the light
intensity, and bR and bM are the photosensitivities of the R
and M state, respectively. For the photosensitivity b = caholds, where c is the quantum efficiency for photoconver-
sion and a is the molecular absorption coefficient. The
quantum efficiencies are probably wavelength independent
for both the R and M state; photosensitivity and absorption
spectra are then proportional. The molecular absorption
coefficient and quantum efficiency of fruitfly visual pig-
ment is unknown, but presumably they are similar to the
values known for bovine rhodopsin, for which at the peak
wavelength (498 nm) amax = 1.56 9 10-16 cm2, and
c = 0.65, yielding a photosensitivity of b = 0.01 nm2
(Dartnall 1972; Kim et al. 2001). Illumination of bovine
rhodopsin causes photoconversion and bleaching with an
exponential time course, with time constant s = 1/(bI),
meaning that a light flux of 1016 photons cm-2 s-1 (at the
peak wavelength) results in a time constant of 1 s.
When a population of Drosophila visual pigment mole-
cules, initially in the rhodopsin state, is irradiated by
monochromatic light, the time course of the photoconver-
sion process is described by:
fMðtÞ ¼ fMð1Þ½1� expð�t=sÞ� ð1Þ
where fM(t) is the fraction of molecules in the
metarhodopsin state at time t; fM(?), the fraction of
metarhodopsin molecules in the photosteady state, at
t = ?, is a function of the ratio of the photosensitivities
of R and M:
fMð1Þ ¼ kR=ðkR=kMÞ ¼ bRðbR þ bMÞ ¼ ð1þ bM=bRÞ�1:
ð2Þ
The rhodopsin and metarhodopsin of the main visual
pigment of Drosophila (Rh1) absorb maximally at 486 and
566 nm, respectively (Fig. 1a; Salcedo et al. 1999). At the
isosbestic wavelength, kiso = 505 nm, the absorption
coefficients of rhodopsin and metarhodopsin are equal,
aR = aM. When the quantum efficiencies are also equal,
i.e., cR = cM, then bR = bM, and hence in the photosteady
state established by 505 nm light, fM(?) = 0.5 (Stavenga
and Schwemer 1984). In the blue wavelength range, bM/bR
is small, and thus illumination with blue light results in a
photosteady state with a high metarhodopsin content. In the
red wavelength range bM/bR is large, and therefore
prolonged red light results in a minimal metarhodopsin
fraction, or, a virtually 100% rhodopsin fraction (Fig. 1a).
The time constant of the photoconversion process,
s ¼ 1=ðkR þ kMÞ ¼ 1=½IðbR þ bMÞ� ð3Þ
is inversely proportional to the illumination intensity and
the sum of the photosensitivities of R and M,
brel = bR ? bM (Stavenga and Schwemer 1984; Sta-
venga et al. 2000). brel(k) is called the relaxation spectrum
(Fig. 1a, trace bR ? bM). Its value is virtually constant in
the range 490–550 nm, and therefore the time courses of
metarhodopsin creation, fM(t), in Fig. 1b (left) are very
similar.
The conversion processes due to various light intensities
I applied for a fixed period t0 result in metarhodopsin
fractions relative to the maximal value (Eq. 1):
J Comp Physiol A (2010) 196:23–35 25
123

f �MðIÞ ¼ fMðIÞ=fMð1Þ ¼ 1� expð�c=IÞ ð4Þ
where c = t0/brel.
When a population of visual pigment molecules has
initially a metarhodopsin fraction fM(0), illumination with
red light yields a time course of the metarhodopsin fraction
described by
fMðtÞ ¼ fMð0Þ expð�t=srÞ ð5Þ
where sr is the time constant for the red light (Fig. 1b,
right).
The time course of the metarhodopsin conversions can
be quite conveniently studied via fluorescence measure-
ments. Whereas the fluorescence of Drosophila rhodopsin
is negligible, the metarhodopsin strongly fluoresces, with a
high emission in the red wavelength range (Stavenga 1983;
Stavenga et al. 1984). The fluorescence measurements are
preferably applied in white-eyed mutants and are per-
formed with a microspectrophotometer where a diaphragm
isolates the fluorescence from the deep pseudopupil (Lee
et al. 1996; Stark and Thomas 2004). Other pigments than
Rh1 metarhodopsin contribute to the emission signal,
especially with blue excitation light. A substantial part of
the blue-induced fluorescence originates from pigments in
the corneal facet lenses and flavoproteins in the mito-
chondria (Stavenga 1995). Their contribution creates a
virtually constant background, on which exponential
changes are superimposed, reflecting the visual pigment
conversions. The changes in mitochondrial flavoprotein
fluorescence, which occur on photoreceptor stimulation
(Stavenga 1995), amount to less than 1% of the fluores-
cence signal (Zupancic personal communication).
The kinetic scheme of the rhodopsin/arrestin
photocycle
There are two different states for both rhodopsin and
metarhodopsin, namely the native, active state Ra, which
photoconverts into the active metarhodopsin state Ma, and
the inactive states Ri and Mi, which bind arrestin (Fig. 2).
Rapidly after the photoconversion of a native rhodopsin
molecule to the metarhodopsin state, it binds to arrestin.
While the arrestin–metarhodopsin complex is stable, the
a
b
Fig. 1 Spectral properties of the main visual pigment, Rh1, of
Drosophila. a The photosensitivities (b) of the two thermostable
states, rhodopsin (R) and metarhodopsin (M), normalized to the
rhodopsin peak, the relaxation spectrum (sum of photosensitivities
bR ? bM), and the metarhodopsin fraction in the photosteady state
created by monochromatic stimuli with wavelength k. The spectra
were calculated with the template functions of Govardovskii et al.
(2000) using peak wavelength values 486 and 566 nm for R and M,
respectively. b Time course of the metarhodopsin fraction due to
irradiating a visual pigment population, where initially all molecules
are in the rhodopsin state with monochromatic light (490–550 nm,
15 nm steps; left, 5 s pulse at t = 0 s), and the time course of the
different reconversions due to subsequent red light of 600 nm (right,
5 s pulse at t = 8 s). The intensity of the pulses is identical and set so
that the time constant of the photoconversion resembles the time
constants in the experiment of Fig. 3a. Since the sum of photosen-
sitivities bR ? bM hardly changes within the wavelength range
presented, the photoconversions show almost identical time courses
Fig. 2 Simplified diagram of the primary light-induced visual
pigment processes in Drosophila. Ra is the native, active rhodopsin,
which on photoconversion yields the active metarhodopsin state, Ma;
this state triggers the phototransduction chain resulting in a receptor
potential. By phosphorylation and binding of arrestin, Ma is
transformed into the inactive metarhodopsin state, Mi. Photoconver-
sion of Mi results in the inactive rhodopsin state, Ri, which transforms
back to the active rhodopsin state after arrestin release and
dephosphorylation (Hardie and Postma 2008). The rate constants
for the photoconversions are kR and kM, and those for arrestin binding
and dissociation are kb and kd, respectively
26 J Comp Physiol A (2010) 196:23–35
123

rhodopsin–arrestin complex dissociates after several sec-
onds (Fig. 2).
Clearly, the fraction of metarhodopsin molecules in the
Mi state is limited by the availability of arrestins. The Ma
state triggers the phototransduction process, and therefore
the phototransduction cascade will run continuously when
the concentration of metarhodopsin exceeds that of
arrestin.
Results
Visual pigment photochemistry measured
via metarhodopsin fluorescence
Using the property of metarhodopsin that it brightly fluo-
resces under red light excitation, we estimated the relative
visual pigment concentration in the intact eyes of two
strains of fruitflies, the white-eyed wild type, w-, and the
white-eyed mutant, w-;arr23. We measured the emission
above 695 nm induced by 600 nm excitation light. Pre-
adaptation with intense light stimuli at wavelengths
between 490 and 600 nm resulted in various steady-state
metarhodopsin fractions, depending on the ratio of the
rhodopsin and metarhodopsin photosensitivities (Eq. 2),
and subsequent illumination with 600 nm yielded a
decreasing emission due to photoconversion of the previ-
ously created metarhodopsin (Fig. 3a).
The final emission value, B, is due to background fluo-
rescence emerging from fluorescing non-visual pigments.
The difference between the initial and the final value of the
red-induced emission, A(k), is proportional to the previ-
ously created metarhodopsin fraction, fM(k); formally,
A(k) = p fM(k). The proportionality constant p depends on
the amount of visual pigment contributing to the fluores-
cence signal, and thus on pigment concentration and
measurement aperture. The relative size of the aperture,
which slightly varied among the experiments to optimize
the signal, was estimated from the background signal B.
Thus, we have normalized the metarhodopsin-dependent
fluorescence signal as /(k) = A(k)/B as an estimate for the
relative metarhodopsin content in individual specimens of
wild-type w- (n = 5) and w-;arr23 fruitflies (n = 4). The
obtained values for /(k) indicate that the visual pigment
content of the arrestin2 mutant was about 75% of the visual
pigment content of the wild type (Fig. 3b).
The dependence of the metarhodopsin fraction in the
photosteady state on adapting wavelength can be calculated
by noting that isosbestic wavelength light (kiso = 505 nm),
results in fM(kiso) = 0.5, so that A(kiso) = 0.5p. The meta-
rhodopsin fraction created by a pre-adaptation wave-
length k therefore can be calculated from A(k) with
fM(k) = 0.5A(k)/A(kiso); see Fig. 3b. The fM spectra for the
wild type and mutant Drosophila then appear to be iden-
tical within the measurement error.
ERG and metarhodopsin fluorescence elicited by bright
monochromatic light at a range of wavelengths
To correlate the visual pigment conversions with the elic-
ited electrophysiological signal, we measured the ERG
simultaneously with the fluorescence, using the same pro-
tocol as in Fig. 3a. The ERG responses elicited by the
adapting pulses at a range of wavelengths (490–600 nm)
were all approximately the same and about maximal
(Fig. 4), and the photochemical equilibrium state was
always reached.
The ERG during the subsequent darkness (the afterpo-
tential) strongly varied, however, clearly dependent on
the amount of metarhodopsin created by the adapting pulse,
a
b
Fig. 3 Metarhodopsin fluorescence as a function of wavelength. aFluorescence signals induced by a number of monochromatic light
pulses (wavelengths 490–550 nm) followed by a red (600 nm) light
pulse (Drosophila, w-). The values of the initial red-induced emission
due to the metarhodopsin, A, and the background value, B, were
measured. b The ratio / of A and B as a function of the wavelength of
the adapting light pulse (red symbols w-;arr23; black symbols w-;
error bars SEM). Curves expected for fM in the photosteady state
(Fig. 1a) were fitted to the data, yielding the two right-hand ordinates
J Comp Physiol A (2010) 196:23–35 27
123
and not on the effective light intensity. Therefore, the
experimental paradigm allowed to determine the depen-
dence of the afterpotentials on the metarhodopsin fraction,
fM. The response to the adapting pulses at long wave-
lengths, which created a low metarhodopsin fraction, was
followed by a repolarization, i.e., the afterpotential
returned to the dark level (Fig. 4a). This no longer occurred
after short-wavelength stimuli that created a high fM. The
ERG did not repolarize after the response, but was fol-
lowed by a prolonged depolarizing afterpotential (a PDA),
which could be reset with the subsequent red stimulus.
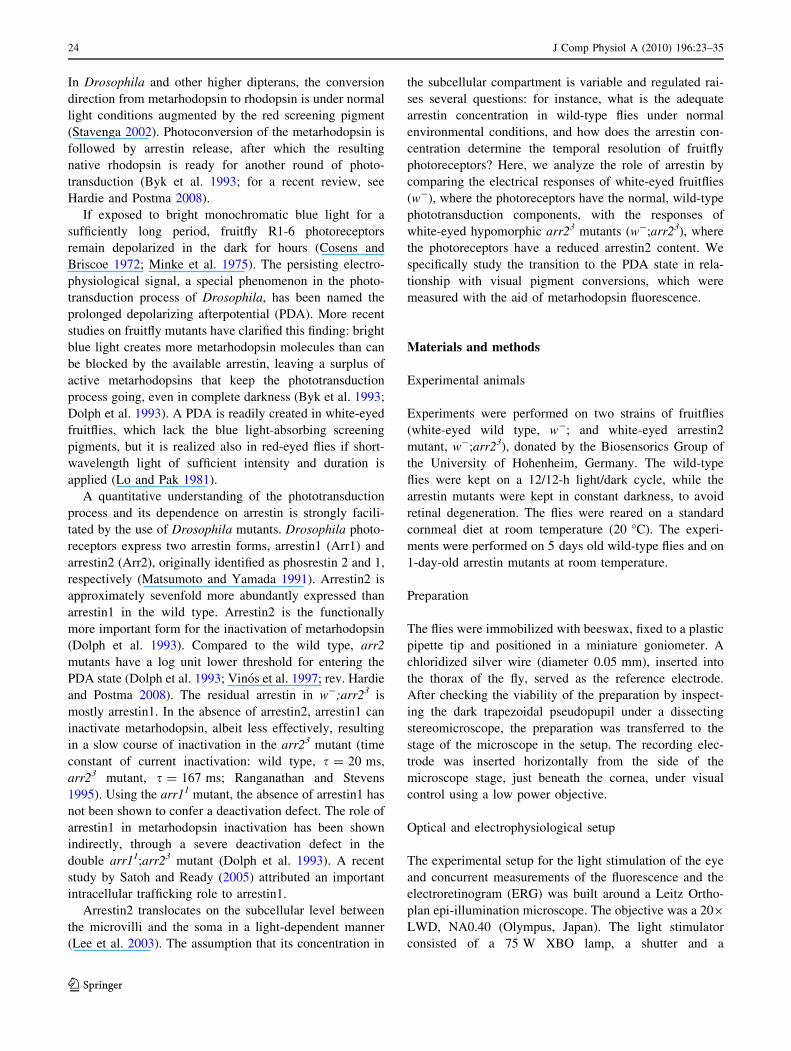
The PDA was quantified by measuring the amplitude of
the afterpotential at the end of the dark period, just before
the beginning of the red pulse, with respect to the ERG
level in the dark prior to the adapting pulse (arrow,
Fig. 4a). The time point of measurement, 7 s after the
adapting pulse, allowed for reasonably short experiments,
which avoided amplitude changes due to long-term adap-
tation of photoreceptors during the afterpotential.
Figure 5a shows the normalized amplitudes for both
the white-eyed wild-type Drosophila (w-, Fig. 4a) and the
mutant (w-;arr23; Fig. 4b), plotted as a function of the
adapting wavelength. The same data are presented in
Fig. 5b, however, as a function of the created metarho-
dopsin fraction, derived by using the data of Fig. 3b. The
values of the afterpotential amplitude as a function of fMwere fitted with a Hill sigmoid:
a
b
Fig. 4 The ERG during a stimulus sequence similar to that in Fig. 3a
measured in (a) the wild type (w-) and (b) the arrestin mutant
(w-;arr23). A number of monochromatic light pulses, indicated by
their peak wavelengths, duration 5 s, were followed by 7-s darkness
and a 5-s red (600 nm) pulse. Note the slow return to the dark level of
the ERG in the arrestin mutant. The arrow in a marks the time point at
which the afterpotentials were measured
a
b
Fig. 5 The dependence of the afterpotential on adapting wavelength
and metarhodopsin fraction. a The normalized afterpotential at the
end of the 7-s dark period with respect to the ERG level in darkness
(see Fig. 4), as a function of the adapting wavelength. b The
normalized afterpotential values as a function of the created
metarhodopsin fraction, derived by using Fig. 3b, fitted with Hill
functions (error bars, SEM)
28 J Comp Physiol A (2010) 196:23–35
123

VðfMÞ ¼ f hM= f h
M;50 þ f hM
� �ð6Þ
where fM,50 is the metarhodopsin fraction needed for a half-
maximal response. The transition to the PDA state (10–
90% PDA) occurred at a distinctly higher fM in the wild
type (0.16 \ fM \ 0.29) than in the arrestin2 mutant
(0.01 \ fM \ 0.07). The fM values corresponding to a half-
maximal PDA are fM,50 = 0.23 for the wild type (w-) and
fM,50 = 0.022 in the arrestin2 mutant (w-;arr23).
ERG and metarhodopsin fluorescence at graded
intensities of blue light
The dependence of the electrophysiological response on
the adapting light intensity at a fixed wavelength was
investigated by applying a graded series of blue stimuli
(490 nm) in both the white-eyed wild type (w-) and the
arrestin2 mutant (w-;arr23; Fig. 6). To monitor the created
metarhodopsin fraction, each blue stimulus (intensity
between -6 \ log I \ 0) was followed by a 5-s bright red
stimulus (600 nm), which reconverted the metarhodopsin
molecules into the rhodopsin state. The metarhodopsin
fluorescence signal A (Fig. 6a, b), measured as before, was
normalized, plotted as function of log I (Fig. 7a) and fitted
with Eq. 4. At saturation fM* = 1, which corresponds to
the equilibrium value for 490 nm light, fM = 0.62. The fits
for fM*(I) were identical for both strains within experi-
mental error.
We evaluated the blue light-induced ERG by measuring
the response value at the end of the 5-s stimulus with
respect to the baseline in the dark (Fig. 7). The slope of the
stimulus–response curve in the arrestin2 mutant was stee-
per and shifted toward lower light intensities (Fig. 7b;
w-;arr23, Hill slope h = 0.62, logI50 = -3.44) than in the
wild type (Fig. 7b; w-, Hill slope h = 0.49, logI50 =
-3.04). This corresponds to an about 2.5-fold increase in
light sensitivity in the mid-intensity range in the mutant.
The stimulus–afterpotential curves (analogous to the
stimulus–response curve) of the two strains were spaced
further apart (PDA in Fig. 7b; w-, logI50 = -0.84;
w-;arr23, logI50 = -2.2, a more than 20-fold intensity
difference) than the stimulus–response curves. In the wild
type, the intensities to reach half-ERG response and half-
PDA were 2.2 log units apart, while in the mutant the
difference was 1.2 log units.
Finally, we plotted the dependence of the afterpotential
on the metarhodopsin fraction created by the graded
intensity blue pulse. We plotted the normalized afterpo-
tential, V, as a function of the metarhodopsin fraction, fM.
We fitted the data with a Hill function (Eq. 6; Fig. 7c).
Here, the fM,50 values for the two strains also differed
strongly (w-: fM,50 = 0.29; w-;arr23: fM,50 = 0.01).
Kinetic model of the rhodopsin cycle
According to Eq. 1, the normalized metarhodopsin fraction
after an illumination period t0 is described by fM* (t0) =
a b
c d
Fig. 6 Simultaneous
measurements of the
metarhodopsin fluorescence (a,
b) and electroretinogram (c, d)
from the eyes of a wild-type
Drosophila, w- (a, c) and the
arrestin mutant w-;arr23 (b, d)
elicited by monochromatic blue
pulses of 490 nm followed by
red pulses (600 nm). Blue
pulses with intensities log I [-3 created a measurable
metarhodopsin fraction as
witnessed by the red-induced
fluorescence signal
(fluorescence decay induced by
the 600 nm pulse)
J Comp Physiol A (2010) 196:23–35 29
123
fM(t0) / fM(?) = [1 - exp(-t0/s)]. With t0 = 5 s and
using s = 1/(brelI) a fit to the fluorescence data of Fig. 7a
yielded brel = bR ? bM = 1.73 (in inverse normalized
intensity units). We can use this value to assess the rate of
visual pigment conversions associated with the measured
ERG values. It follows from the template values (Fig. 1) that
for 490-nm light fM(?) = bR/(bR ? bM) = 0.61, and thus
bR ? bM = 1.73 yields bR = 1.05 and bM = 0.68. The
conversion rate of active rhodopsin to metarhodopsin is
given by (Fig. 2):
q ¼ df ½Ra ! Ma�=dt ¼ kRfRa ¼ bRfRa I ð7Þ
where fRa is the fraction of visual pigment molecules in the
active rhodopsin state. We thus obtain that q = 1.05fRaI.
Figure 7 shows for intensities where logI \ -2, fM & 0,
or fRa & 1, i.e., virtually all visual pigment molecules are
in the rhodopsin state. Then q & 1.05I, or, the Ra ? Ma
conversion rate q and the applied normalized light intensity
I (in inverse normalized intensity units) have about the
same numerical value. It thus follows that at logI = -3.04,
where the ERG of the wild type (w-) is half-maximal, the
Ra ? Ma conversion rate is 9.6 9 10-4 s-1, meaning that
in a microvillus with 1,000 visual pigment molecules on
average, one Ra ? Ma conversion occurs per 1.04 s. In the
arrestin2 mutant, a half-maximal response is reached at
logI = -3.44 (Fig. 7b), corresponding to an Ra ? Ma
conversion rate of 3.86 9 10-4 s-1. The arrestin2 mutant
has 75% of the visual pigment of the wild type and,
therefore, in a microvillus with 750 visual pigment mole-
cules, at half-maximal ERG response, one Ra ? Ma con-
version occurs per 3.5 s.
In the next step, we assessed the active (unarrested)
metarhodopsin (Ma) concentrations present during the ERG
responses of Fig. 6. The created active metarhodopsins are
short-lived, because of rapid binding to arrestin, if available.
The time constant of metarhodopsin inactivation is 1/kb[A],
where kb is the binding constant of arrestin to metarhodopsin,
and [A] is the arrestin concentration (see Fig. 2). In the wild-
type fruitfly, for weak light pulses, this time constant is
23 ms (Liu et al. 2008), or kb[A] = 43 s-1. At the end of the
5 s of illumination applied in our experiments (Figs. 3, 4, 6),
a steady state will therefore be fully reached. In the steady
state, the active metarhodopsin fraction is constant, or dfMa/
dt = kRfRa – kb[A]fMa = 0. At low intensities, where
fRa & 1, then fMa = kR/(kb[A]) = bRI/(kb[A]) = 1.05I/
43 = 0.024I. This means that at an intensity I = 10-3.04,
which creates a half-maximal ERG response in the wild type,
fMa = 2.2 9 10-5. A wild-type Drosophila R1-6 photo-
receptor contains 30,000 microvilli with 1,000 visual pigment
molecules, or, the number of visual pigment molecules in a
photoreceptor is *3 9 107 (Hardie 2001). At half-maximal
a
b
c
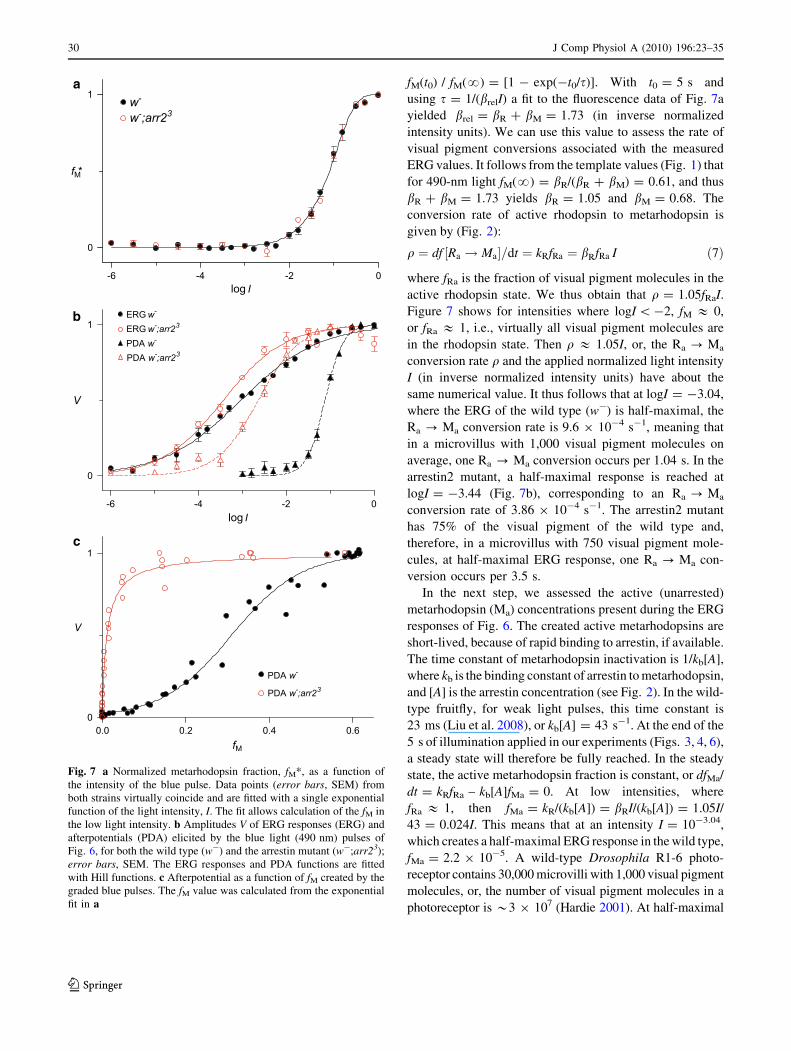
Fig. 7 a Normalized metarhodopsin fraction, fM*, as a function of
the intensity of the blue pulse. Data points (error bars, SEM) from
both strains virtually coincide and are fitted with a single exponential
function of the light intensity, I. The fit allows calculation of the fM in
the low light intensity. b Amplitudes V of ERG responses (ERG) and
afterpotentials (PDA) elicited by the blue light (490 nm) pulses of
Fig. 6, for both the wild type (w-) and the arrestin mutant (w-;arr23);
error bars, SEM. The ERG responses and PDA functions are fitted
with Hill functions. c Afterpotential as a function of fM created by the
graded blue pulses. The fM value was calculated from the exponential
fit in a
30 J Comp Physiol A (2010) 196:23–35
123
ERG response, *2.2 9 10-5 9 3 9 107 & 660 molecules
of visual pigment, thus, are in the active metarhodopsin state.
Assuming a Poisson distribution of photon catch among the
microvilli (Hochstrate and Hamdorf 1990), this results in 650
active microvilli at half-maximal depolarization, i.e., of the
650 microvilli, ten received double photon hits.
In the arrestin2 mutant, the time constant of meta-
rhodopsin inactivation, mediated by arrestin1, has not been
measured directly, but can be estimated from the current
deactivation in isolated w-;arr23 ommatidia, s = 167 ms
(Ranganathan and Stevens 1995); or, kb[A] = 6 s-1. At
half-maximal response, where logI = -3.44, we obtain
that fMa = bRI/(kb[A]) = bRIs = 1.05 9 10-3.44 9 0.167 =
6.1 9 10-5. Because the number of visual pigment mole-
cules in the mutant is *2.25 9 107, the corresponding
number of active metarhodopsin molecules at half-maxi-
mal depolarization is *6.1 9 10-5 9 2.25�107 & 1,370,
residing in 1,350 active microvilli.
The steady-state PDA model
According to a deterministic view of the phototransduction
process, a single-compartment photoreceptor would
abruptly enter a PDA state as soon as the number of meta-
rhodopsin molecules surpassed the number of arrestin
molecules. However, our measurements showed that the
afterpotential is not a stepwise, but a smooth function of
the metarhodopsin fraction (Figs. 5b, 7c). Several factors
can be accounted for the smoothing: the stochastics of
photon absorption, that of the molecular distribution and
the compartmentalization of the photoreceptors into
microvilli. To quantitatively investigate the smoothing
process, we have developed a steady-state stochastic
model, based on binomial statistics, using the same logic as
applied to ion channel clutter noise.
We treated four cases with different arrestin concen-
trations, where the mean number of arrestin molecules per
microvillus was hNAi = 20, 100, 200 and 300, respectively
(the bracket notation in this section denotes ensemble
means). The cases hNAi = 20 and 200 correspond roughly
to the w-;arr23 mutant and the wild-type w-, respectively.
We modeled 5,000 microvilli, with the mean number of
visual pigment molecules per microvillus, in all four cases
set to hNPi = 1,000. To account for the dispersion of
microvillar size and other stochastic factors that influence
the number of visual pigment and arrestin molecules in
each microvillus, both counts were drawn from a Poisson
distribution. The count of visual pigment molecules in the
metarhodopsin state for each microvillus, NM, was then
determined using binomial statistics.
The important parameter for the creation of a PDA is the
amount of microvilli where the metarhodopsin molecules
outnumber the arrestins, that is the amount of microvilli
with a metarhodopsin surplus DN = NM - NA [ 0. In the
four cases in our model, a microvillus with NP = 1,000
visual pigment molecules reached the threshold DN = 0 at
fM = 0.02, 0.1, 0.2 and 0.3, respectively (because
NM = NA yields fM = NM/NP = NA/NP). The steady-state
probability distributions of DN following from our model
for the population of 5,000 microvilli are shown in Fig. 8a
for two cases where the mean metarhodopsin fraction,
hfMi = 0.02 and 0.2. Figure 8b shows the distributions as a
function of hfMi in the range 0.1–0.4 for the four cases of
hNAi. Figure 8c presents the fraction of microvilli with a
surplus of active metarhodopsin, P, as a function of the
mean metarhodopsin fraction, hfMi. For instance, when
hNAi = 200, the transition range is 0.15 \ fM \ 0.25, and
the value P = 0.5 (half of the microvilli have a meta-
rhodopsin surplus) is reached at hfMi & 0.2. We note that
all four curves of Fig. 8c could be tightly fitted with a
cumulative beta distribution function, a general, two-
parameter continuous distribution defined in the range [0,1]
(Weisstein 2009).
The metarhodopsin molecules activate the phototrans-
duction process, which results in a receptor potential
described by a Hill function. Accordingly, we transformed
the P(hfMi) function with the sigmoid function
VðPÞ ¼ CPs=ðPs þ ðP50ÞsÞ ð8Þ
where s is the slope parameter, and P50 is the fraction of
non-arrested microvilli yielding a half-maximal afterpo-
tential; the normalization constant C = 1 ? P50s is intro-
duced here to achieve V(1) = 1. We implemented s = 0.5,
a value commonly found for V(logI) curves in ERG
experiments (h = 0.49; Fig. 7b) and P50 = 0.022, because
of 650 active microvilli at half-maximal depolarization.
The afterpotential function V(hfMi) following from Fig. 8c
with Eq. 8 could be well fitted with a Hill function
(Fig. 8d). We note that the sigmoidally transformed
cumulative beta distribution fits were virtually indistin-
guishable from the Hill function fits (not shown). The
model results show that the afterpotential function becomes
steeper when the arrestin fraction decreases. The same
trend was observed in the experiments with monochro-
matic light stimuli (Fig. 5b) and varying intensities of
490 nm light (Fig. 7c). We have included the experimen-
tally obtained V(hfMi) curves in Fig. 8d, for direct
comparison.
Discussion
Visual pigment content
We estimated the relative visual pigment content of wild-
type flies and arrestin mutants in vivo by measuring the
J Comp Physiol A (2010) 196:23–35 31
123
metarhodopsin fluorescence and found that the visual pig-
ment content of the arrestin mutant was about 75% of that
in the wild-type flies (Fig. 3). This difference may be
attributed to the age, 1 day (w-;arr23) and 5 days (w-),
respectively. Alternatively, the difference may be related to
the mutation, because the visual pigment content measured
in various Drosophila ninaC mutants with the same fluo-
rescence method yielded distinctly lower visual pigment
contents, depending on the mutant isoform (Hofstee et al.
1996).
Kinetics of visual pigment conversions
For a receptor with 3 9 107 visual pigment molecules, the
Ra ? Ma conversion rate of q = 9.6 9 10-4 s-1, derived
above for a half-maximal ERG response in the wild type,
means per photoreceptor 2.9 9 104 rhodopsin conversions
per second. From measurements of quantum bumps with
intracellular recordings in R1-6 photoreceptors in white-
eyed Drosophila, Wu and Pak (1978) derived a rhodopsin
conversion rate of ca. 104 s-1 at half-maximal depolari-
zation. Our value, obtained from ERG measurements, is
thus about a factor 3 higher. The main cause for the dis-
crepancy is probably due to the different electrophysio-
logical methods. While the previous authors recorded from
single photoreceptor cells and calibrated their response
according to single bumps in dim light, we have recorded
from a population of many thousands of photoreceptors,
which were not uniformly illuminated, because we used a
0.4 numerical aperture objective, which means that only
part of the photoreceptors had their visual field within the
illumination aperture, while the rest was stimulated by light
scattered in the eye. The stimulus–response curves, thus,
were obtained from a large population of non-equally
excited photoreceptors. Indeed, while intracellular record-
ings reveal that Drosophila R1-6 receptors operate over a
4–5 log unit intensity range (Wu and Pak 1978; Juusola and
Hardie 2001), we find for the ERG that about 5–6 log units
separate the threshold from saturation.
∆N 0
< N A >=2 0
100
200
300
0 0.1 0.2 0.3 0.4
−200
−100
100
200
0 0.1 0.2 0.3 0.4
0.2
0.4
0.6
0.8
P 300 100 200 < N
A >=2 0
0 0.1 0.2 0.3 0.4
0.2
0.4
0.6
0.8
V
< f M
>
−100 0 100 0
100
200
300
400
500
< N A >=2 0
∆ N
M
−100 0 100 0
100
200
300
400
500
< N A >=200
0.00 0.02 0.04
0.18 0.20 0.22
a
b
c
d
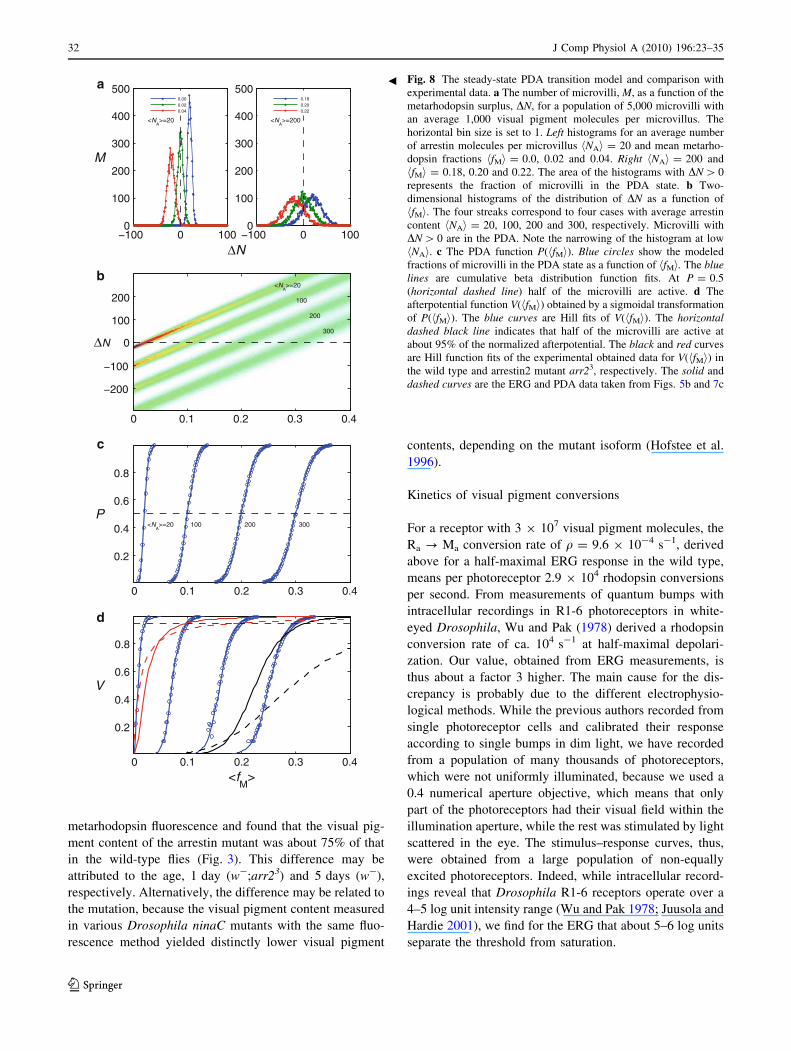
Fig. 8 The steady-state PDA transition model and comparison with
experimental data. a The number of microvilli, M, as a function of the
metarhodopsin surplus, DN, for a population of 5,000 microvilli with
an average 1,000 visual pigment molecules per microvillus. The
horizontal bin size is set to 1. Left histograms for an average number
of arrestin molecules per microvillus hNAi = 20 and mean metarho-
dopsin fractions hfMi = 0.0, 0.02 and 0.04. Right hNAi = 200 and
hfMi = 0.18, 0.20 and 0.22. The area of the histograms with DN [ 0
represents the fraction of microvilli in the PDA state. b Two-
dimensional histograms of the distribution of DN as a function of
hfMi. The four streaks correspond to four cases with average arrestin
content hNAi = 20, 100, 200 and 300, respectively. Microvilli with
DN [ 0 are in the PDA. Note the narrowing of the histogram at low
hNAi. c The PDA function P(hfMi). Blue circles show the modeled
fractions of microvilli in the PDA state as a function of hfMi. The bluelines are cumulative beta distribution function fits. At P = 0.5
(horizontal dashed line) half of the microvilli are active. d The
afterpotential function V(hfMi) obtained by a sigmoidal transformation
of P(hfMi). The blue curves are Hill fits of V(hfMi). The horizontaldashed black line indicates that half of the microvilli are active at
about 95% of the normalized afterpotential. The black and red curves
are Hill function fits of the experimental obtained data for V(hfMi) in
the wild type and arrestin2 mutant arr23, respectively. The solid and
dashed curves are the ERG and PDA data taken from Figs. 5b and 7c
b
32 J Comp Physiol A (2010) 196:23–35
123
Arrestin and phototransduction
The ERG stimulus–response curve of the arrestin2 hypo-
morphic mutant arr23 is shifted toward lower intensities over
0.4 log units with respect to the stimulus–response curve of
the wild type (Fig. 7). Taking into account the difference in
rhodopsin content, this yields a 3.3-fold difference in light
sensitivity. Assuming that an ERG response in the mid-
intensity range (around log I50) is fully determined by the
number of active metarhodopsin molecules in both the wild
type and the arrestin mutant, this shift would mean that the
arr23 mutant has 3.3 times less functional arrestin than the
wild type. This value seems to be in conflict with previous
biochemical data, which indicated that in the arr23 mutant
arrestin 2 is reduced 100-fold (Dolph et al. 1993). Consid-
ering that in the wild type the arrestin1 to arrestin2 ratio is 1:7
(Dolph et al. 1993), and that metarhodopsin deactivation by
arrestin1 is less effective than by arrestin2 (Ranganathan and
Stevens 1995), the deactivation in arr23 should be at least
eightfold less effective. Our findings of a 3.3-fold increased
light sensitivity in the mutant could therefore indicate that
the mutation has been partially compensated by an increased
amount of arrestin1.
While the response curve of the arrestin2 mutant is
steeper and its midpoint value indicates an increased sen-
sitivity, the mutant and the wild-type responses coincide in
the low intensity range, meaning that at low intensities, the
photoreceptor sensitivity is arrestin independent. This is in
agreement with a recent study by Liu et al. (2008), who
demonstrated that in dim light, where sporadic single
photon absorptions dominate the receptor potential gene-
ration, arrestin will not bind to metarhodopsin unless the
latter triggers the signaling cascade.
Arrestin2 binding to metarhodopsin is calcium depen-
dent (Liu et al. 2008). With increasing light intensity,
[Ca2?]i increases (Hardie and Postma 2008) and therefore
arrestin will progressively reduce phototransduction gain.
This feedback action explains the steeper stimulus–
response curve in the arrestin mutant compared to the wild
type. The shift of the stimulus response curve of 0.4 log
unit is quite moderate, which suggests that the variation in
arrestin content only modestly contributes to light adapta-
tion in Drosophila photoreceptors.
Relating the model to the experimental data
We have shown in the model that the functional arrestin
fraction, hfAi, numerically coincides with the hfMi that acti-
vates half of the microvilli. As follows from Eq. 8, with
s = 0.5 and P50 = 0.022, half activation of the microvilli
(P = 0.5) almost saturates the receptor potential at*95% of
the maximal amplitude. To estimate hfAi from hfMi at near
saturating levels of the receptor potential with a reverse Hill
transformation is, however, quite inaccurate and thus
impractical.
We, therefore, applied an alternative approach, which
uses the parameter fM,50, the metarhodopsin fraction nee-
ded for a half-maximal response, of the Hill function
(Eq. 6) fitted to the V(hfMi) curves of Fig. 8d. Figure 9
presents the values of the functional arrestin fraction, hfAi,which correspond to the four modeled V(hfMi) curves as a
function of the fM,50-values following from the Hill func-
tion fit (open circles) to the modeled data. The relation was
well fitted by a power function hfAi = (fM,50)0.87 (Fig. 9).
The experiment with the saturating light pulses with dif-
ferent wavelengths (Figs. 5b, 8d) yielded fM,50 = 0.23 for
the wild type and fM,50 = 0.022 for the w-;arr23 mutant.
We thus read from Fig. 9 that hfAi = 0.28 for the wild type
and hfAi = 0.036 for the mutant. In other words, the 1,000
visual pigment molecules per microvillus in the wild type
are accompanied by about 280 functional arrestins, and the
750 visual pigment molecules per microvillus in the mutant
are assisted by 27 functional arrestins. We thus conclude
that the arrestin2 mutant, arr23, compared to the wild type,
contains about one-tenth of functional arrestin, in line with
previous results (Dolph et al. 1993; Ranganathan and Ste-
vens 1995; Vinos et al. 1997).
Comparison of experimental paradigms
In the present study, we examined three paradigms of
fruitfly electroretinography that can be used to assess the
rhodopsin–arrestin ratio. In the first paradigm, which is
based on the assumption that the light sensitivity is a
function of the arrestin content, the photoreceptor
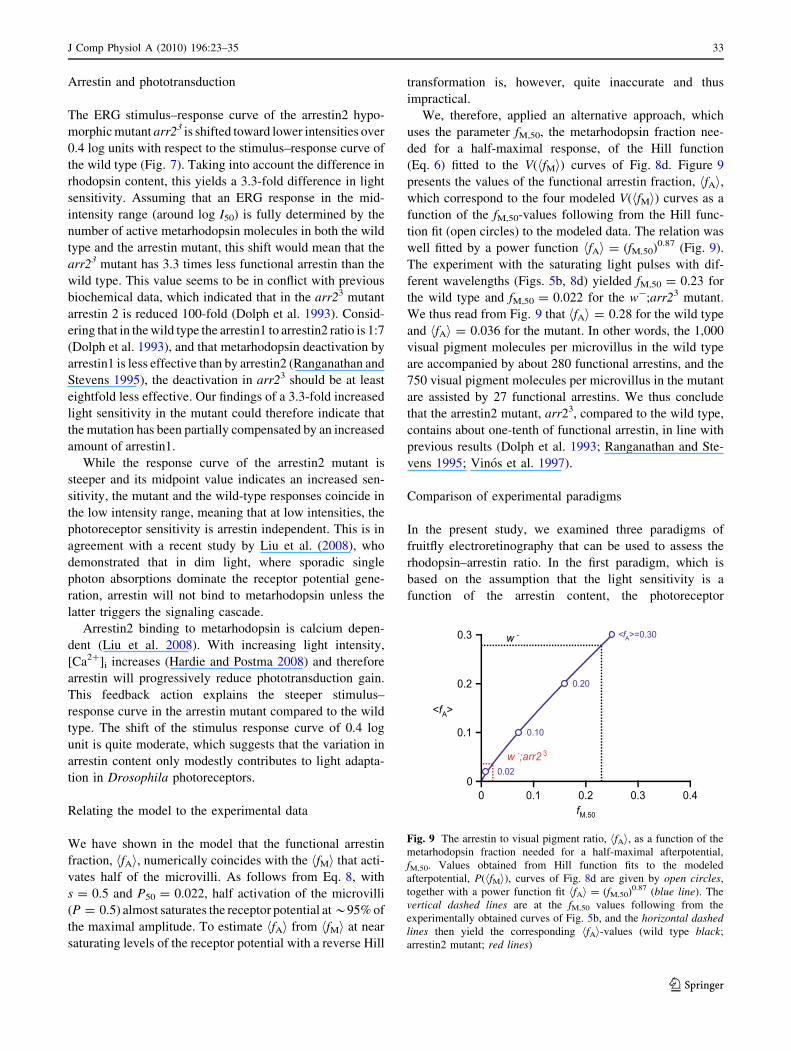
Fig. 9 The arrestin to visual pigment ratio, hfAi, as a function of the
metarhodopsin fraction needed for a half-maximal afterpotential,
fM,50. Values obtained from Hill function fits to the modeled
afterpotential, P(hfMi), curves of Fig. 8d are given by open circles,
together with a power function fit hfAi = (fM,50)0.87 (blue line). The
vertical dashed lines are at the fM,50 values following from the
experimentally obtained curves of Fig. 5b, and the horizontal dashedlines then yield the corresponding hfAi-values (wild type black;
arrestin2 mutant; red lines)
J Comp Physiol A (2010) 196:23–35 33
123
sensitivity is measured. The arrestin content estimated with
this method deviated strongly from biochemical data
(Dolph et al. 1993). We suggest that this is due to intensity-
dependent, Ca2?-mediated activation of arrestin, which
essentially renders the wild type and the arrestin strain
much more alike under dim than under bright illumination.
We assume that comparing the light sensitivity of the wild
type and the arrestin mutant is not fully reliable, since it
does not allow proper control of the rhabdomeric arrestin
content during the experiment.
The other two paradigms used were the assessment of
the transition to PDA with experimentally set metarho-
dopsin fractions. The PDA paradigms yielded a rhodopsin–
arrestin ratio similar to values derived previously (Dolph
et al. 1993; Ranganathan and Stevens 1995; Vinos et al.
1997). The transition to PDA was elicited at extreme light
intensities, where most of the, if not all available, arrestin
was concentrated in the rhabdomere as well as fully acti-
vated by Ca2?; its activity remained maximal throughout
the entire transition window. Therefore, we suggest that the
two PDA paradigms are more reliable than the sensitivity
measurement.
The first PDA paradigm where a series of blue pulses of
graded intensity was applied, to monitor the transition from
full repolarization of the ERG to the PDA, has been
extensively used before (Dolph et al. 1993; Ranganathan
and Stevens 1995; Vinos et al. 1997), but only in con-
junction with the measurement of M-potential (Minke and
Kirschfeld 1979). In the second paradigm, the metarho-
dopsin fraction was set by saturating monochromatic light
pulses. Compared to the experimental results of the first
paradigm, the results of the second paradigm conform more
closely with the predictions of the model, which suggest
that the latter method is less sensitive to adverse adaptation
and feedback effects. We also note that the second,
wavelength paradigm will in general be more easily
adapted to non-white-eyed fruitflies and other insect spe-
cies where measurements of metarhodopsin fluorescence
may be cumbersome.
Acknowledgments We thank R. C. Hardie, D. Ready and
P. Gonzalez Bellido for useful suggestions and comments. AFOSR/
EOARD provided financial support (Grant no. FA8655-08-1-3012).
Open Access This article is distributed under the terms of the
Creative Commons Attribution Noncommercial License which per-
mits any noncommercial use, distribution, and reproduction in any
medium, provided the original author(s) and source are credited.
References
Byk T, Bar-Yaacov M, Doza YN, Minke B, Selinger Z (1993)
Regulatory arrestin cycle secures the fidelity and maintenance of
the fly photoreceptor cell. Proc Natl Acad Sci USA 90:1907–
1911
Cosens DJ, Briscoe D (1972) A switch phenomenon in the compound
eye of the white-eyed mutant of Drosophila melanogaster.
J Insect Physiol 18:627–632
Dartnall HJA (1972) Photosensitivity. In: Dartnall HJA (ed) Hand-
book of sensory physiology, vol VII/1. Springer, Berlin, pp 122–
145
Dempster J (2001) The laboratory computer: a guide for neurosci-
entists and physiologists, Academic Press, New York
Dolph PJ, Ranganathan R, Colley NJ, Hardy RW, Socolich M et al
(1993) Arrestin function in inactivation of G-Protein coupled
receptor rhodopsin in vivo. Science 260:1910–1916
Govardovskii VI, Fyhrquist N, Reuter T, Kuzmin DG, Donner K
(2000) In search of the visual pigment template. Vis Neurosci
17:509–528
Hardie RC (2001) Phototransduction in Drosophila melanogaster.
J Exp Biol 204:3403–3409
Hardie RC, Postma M (2008) Phototransduction in microvillar
photoreceptors of Drosophila and other invertebrates. In:
Basbaum AI et al (eds) The senses: a comprehensive reference,
vol 1, Vision I. Academic Press, San Diego, pp 77–130
Hardie RC, Raghu P (2001) Visual transduction in Drosophila.
Nature 413:186–193
Hochstrate P, Hamdorf K (1990) Microvillar components of light
adaptation in blowflies. J Gen Physiol 95:891–910
Hofstee CA, Henderson S, Hardie RC, Stavenga DG (1996)
Differential effects of NINAC proteins (p132 and p174) on
light- activated currents and pupil mechanism in Drosophilaphotoreceptors. Vis Neurosci 13:897–906
Juusola M, Hardie RC (2001) Light adaptation in Drosophilaphotoreceptors: I. Response dynamics and signaling efficiency
at 25�C. J Gen Physiol 117:3–25
Kim JE, Tauber MJ, Mathies RA (2001) Wavelength dependent cis–trans isomerization in vision. Biochemistry 40:13774–13778
Lee RD, Thomas CF, Marietta RG, Stark WS (1996) Vitamin A,
visual pigments, and visual receptors in Drosophila. Microsc Res
Tech 35:418–430
Lee SJ, Xu H, Kang LW, Amzel LM, Montell C (2003) Light
adaptation through phosphoinositide-regulated translocation of
Drosophila visual arrestin. Neuron 39:121–132
Liu CH, Satoh AK, Postma M, Huang J, Ready DF, Hardie RC (2008)
Ca2?-dependent metarhodopsin inactivation mediated by cal-
modulin and NINAC myosin III. Neuron 59:778–789
Lo MVC, Pak WL (1981) Light-induced pigment granule migration
in the retinular cells of Drosophila melanogaster: comparison of
wild type with ERG-defective mutants. J Gen Physiol 77:155–
175
Matsumoto H, Yamada T (1991) Phosrestins I and II: arrestin
homologs which undergo differential light-induced phosphory-
lation in the Drosophila photoreceptor in vivo. Biochem Biophys
Res Commun 177:1306–1312
Minke B, Hardie RC (2000) Genetic dissection of Drosophilaphototransduction. In: Stavenga DG, DeGrip WJ, Pugh EN Jr
(eds) Molecular mechanisms in visual transduction. Handbook of
biological physics, vol 3. Elsevier, Amsterdam, pp 449–525
Minke B, Kirschfeld K (1979) The contribution of a sensitizing
pigment to the photosensitivity spectra of fly rhodopsin and
metarhodopsin. J Gen Physiol 73:517–540
Minke B, Wu CF, Pak WL (1975) Isolation of light-induced response
of the central retinula cells from the electroretinogram of
Drosophila. J Comp Physiol 98:345–355
Ostroy SE, Wilson M, Pak WL (1974) Drosophila rhodopsin:
photochemistry, extraction and differences in the norpAP12
phototransduction mutant. Biochem Biophys Res Commun
59:960–966
34 J Comp Physiol A (2010) 196:23–35
123

Ranganathan R, Stevens CF (1995) Arrestin binding determines the
rate of inactivation of the G-protein-coupled receptor rhodopsin
in vivo. Cell 81:841–848
Salcedo E, Huber A, Henrich S, Chadwell LV, Chou WH, Paulsen R,
Britt SG (1999) Blue- and green-absorbing visual pigments of
Drosophila: ectopic expression and physiological characteriza-
tion of the R8 photoreceptor cell-specific Rh5 and Rh6
rhodopsins. J Neurosci 19:10716–10726
Satoh AK, Ready DF (2005) Arrestin1 mediates light-dependent
rhodopsin endocytosis and cell survival. Curr Biol 15:1722–1733
Stark WS, Thomas CF (2004) Microscopy of multiple visual receptor
types in Drosophila. Mol Vis 10:943–955
Stavenga DG (1983) Fluorescence of blowfly metarhodopsin. Bio-
phys Struct Mech 9:309–317
Stavenga DG (1995) Insect retinal pigments: spectral characteristics
and physiological functions. Prog Retin Eye Res 15:231–259
Stavenga DG (2002) Colour in the eyes of insects. J Comp Physiol A
188:337–348
Stavenga DG, Schwemer J (1984) Visual pigments of invertebrates.
In: Ali MA (ed) Photoreception and vision of invertebrates.
Plenum, New York, pp 11–61
Stavenga DG, Franceschini N, Kirschfeld K (1984) Fluorescence of
housefly visual pigment. Photochem Photobiol 40:653–659
Stavenga DG, Oberwinkler J, Postma M (2000) Modeling primary
visual processes in insect photoreceptors. In: Stavenga DG,
DeGrip WJ, Pugh EN Jr (eds) Molecular mechanisms in visual
transduction. Handbook of biological physics, vol 3. Elsevier,
Amsterdam, pp 527–574
Vinos J, Jalink K, Hardy RW, Britt SG, Zuker CS (1997) A G protein-
coupled receptor phosphatase required for rhodopsin function.
Science 277:687–690
Weisstein EW (2009) Beta distribution. From Mathworld—A
wolfram web resource. http://mathworld.wolfram.com/Beta
Distribution.html
Wu CF, Pak WL (1978) Light-induced voltage noise in photoreceptor
of Drosophila melanogaster. J Gen Physiol 3:249–268
J Comp Physiol A (2010) 196:23–35 35
123