PHOTOLUMINESCENCE AND ELECTROLUMINESCENCE OF ...
194
PHOTOLUMINESCENCE AND ELECTROLUMINESCENCE OF NEAR-INFRARED EMITTING LANTHANIDE COMPLEXES IN CONJUGATED POLYMER HOSTS By BENJAMIN SCOTT HARRISON A DISSERTATION PRESENTED TO THE GRADUATE SCHOOL OF THE UNIVERSITY OF FLORIDA IN PARTIAL FULFILLMENT OF THE REQUIREMENTS FOR THE DEGREE OF DOCTOR OF PHILOSOPHY UNIVERSITY OF FLORIDA 2003 Reproduced with permission of the copyright owner. Further reproduction prohibited without permission.
-
Upload
khangminh22 -
Category
Documents
-
view
1 -
download
0
Transcript of PHOTOLUMINESCENCE AND ELECTROLUMINESCENCE OF ...

PHOTOLUMINESCENCE AND ELECTROLUMINESCENCE OF NEAR-INFRARED EMITTING LANTHANIDE COMPLEXES IN CONJUGATED POLYMER HOSTS
By
BENJAMIN SCOTT HARRISON
A DISSERTATION PRESENTED TO THE GRADUATE SCHOOL OF THE UNIVERSITY OF FLORIDA IN PARTIAL FULFILLMENT
OF THE REQUIREMENTS FOR THE DEGREE OF DOCTOR OF PHILOSOPHY
UNIVERSITY OF FLORIDA
2003
Reproduced with permission o f the copyright owner. Further reproduction prohibited w ithout permission.

UMI Number: 3096625
UMIUMI Microform 3096625
Copyright 2003 by ProQuest Information and Learning Company.
All rights reserved. This microform edition is protected against
unauthorized copying under Title 17, United States Code.
ProQuest Information and Learning Company 300 North Zeeb Road
P.O. Box 1346 Ann Arbor, Ml 48106-1346
Reproduced with permission o f the copyright owner. Further reproduction prohibited w ithout permission.

You are worthy, Jehovah, even our God, to receive the glory and the honor and the power, because you created all things, and because of your will they existed and were
created.”—Revelation 4:11.
Reproduced with permission o f the copyright owner. Further reproduction prohibited w ithout permission.

ACKNOWLEDGMENTS
There are numerous people who deserve to be acknowledged because so many
supported me in the mental, physical, spiritual and emotional sense and it would nearly
take the length of this dissertation to completely relate all the support I have received.
My experience in graduate school can be likened to living on a ship. For the past
four years, my advisor Professor “Captain” Kirk Schanze has taken me from deck hand to
commanding the boat. He allowed me to navigate the waters of science will little
interference. I worked on an amazing project which has sailed several seas found in
science including physics and material science. Occasionally, I report back to shore to
report to my other advisors that have helped me to navigate the waters safely including
Prof. John Reynolds, Prof. James Boncella, Prof. David Tanner and Prof. Paul Holloway.
Others have been instrumental including some of my crew such as first mate Dr.
Tae-Sik Kang and the other deck hands Nisha Ananthakrishnan, Garry Cunningham and
Joonbo Shim. There were others that have closely assisted me in my work many times
giving me the necessary tools to chart unexplored regions. They include Tim Foley,
Alison Knefely, and Mohammed Bougetteya.
Besides my shipmates, many others have gained my deep respect at UF such as Dr.
Khalil Abboud who gave me the privilege of special training in the art of x-ray
crystallography. Also, Prof. Haniph Latchman provided me much useful guidance in
many aspects of my life.
iii
Reproduced with permission o f the copyright owner. Further reproduction prohibited w ithout permission.

Dr. Schanze has always complemented his fleet with talent postdoctoral researchers
that have helped me along the way including Mauricio Pinto, Yao Liu, Yibing “Ben”
Shen, and Shujun Jiang. Also, he possesses a complement of talented graduate students
that have aided me including those that have already moved on to other places such as
Keith Walters, Joanne Bedlek-Anslow, Ed Whittle, Kevin Ley, and Yiting Li and those
who come after me including Chunyan Tan, Ksenija Haskins-Glusac, Thomas
Cardolaccia, Eric Silverman, Boris Kristal, Shengxia Liu, and Erkan Kose.
But even sailors come home once in a while. There the most patient person to
tolerate me, my wife, Patty is there to greet me. She has been there to support me
through the trials and tribulations of graduate school and parenthood. With her support
and the support of our families, we have survived to the end. There are many, many
other friends I would like to thank who have supported me. Finally, I must acknowledge
Julie Walters who was the first real person I met in Gainesville and has ever since been a
close supportive friend of Patty and me.
iv
Reproduced with permission o f the copyright owner. Further reproduction prohibited w ithout permission.

TABLE OF CONTENTSPage
ACKNOWLEDGMENTS...................................................................................................... Iii
LIST OF TABLES............................................................................................ viii
LIST OF FIGURES.................. ix
ABSTRACT............................................................................................................................. 15
CHAPTER
1 SOLUTION PHOTOPHYSICS OF NEAR-INFRARED EMITTING LANTHANIDE COMPLEXES............................ 1
Background................................................................... 1Neodymium /ra-(3-Diketonates........................................................................... 4Macrocyclics as the Coordinating Ligand for Near-Infrared Emitting
Lanthanides....................................................................... 6Near-Infrared Emitting Lanthanides Coordinated to Porphyrins............................9Synthesis of Lanthanide Monoporphyrinates ......................................... 11
Photophysical Properties of Lanthanide fra-p-Diketonates......................................... 14Absorption Properties of Lanthanide tm-p-Diketonates.............................................. 15Photoluminescent Properties of Lanthanide tra-p-Diketonates...................................16Photophysical Properties of Lanthanide Monoporphyrinates in Solution...................19Axial Ligand Effects on the Absorption Properties of Ln(TPP)L.......................... 19Metal Center Effects on the Absorption Properties of Ln(TPP)L ................... 21Near-Infrared Emission from Lanthanide Monoporphyrinates in CH2 CI2 ................. 22Visible Emission from Ln(TPP)L in CH2 CI2 .................................................... 28Solvent Effects on Near-Infrared Quantum Yield of Yb(TPP)L................................. 34Near-Infrared Emission from Other Lanthanide Porphyrin Emitters .....................38Transient Absorption Spectroscopy of Ln(TPP)L Complexes............. 40Conclusion............................................... 43Experimental................................................... 43
2 NEAR-INFRARED EMISSION FROM LANTHANIDE COMPLEXES BLENDED INTO CONJUGATED POLYMER FILM S............................................ 45
Background........................................................................ 45Energy Transfer between Conjugated Polymers and Visible Emitting Lanthanide
Complexes in Polymer Blends ................. 48
v
Reproduced with permission o f the copyright owner. Further reproduction prohibited w ithout permission.

Near-Infrared Emission from Lanthanide fro-P-Diketonates Complexes Blendedin PPP-R10 Films..................................... 55
Near-Infrared Emission from Yb tra-p-Diketonate Complexes Blended inPPP-OR11 Films........................................................ 58
Quenching of PPP-OR11 Fluorescence by Lanthanide MonoporphyrinateComplexes .............. 60
Near-Infrared Emission from Lanthanide Monoporphyrinate ComplexesBlended in PPP-OR11 Film s................. 64
Discussion............................................................................... 67Conclusion..................................................... 70Experimental.................................................................................................................... 70
3 NEAR-INFRARED ELECTROLUMINESCENCE OF LANTHANIDE COMPLEXES IN CONJUGATED POLYMER BLENDS.........................................72
Background.......................................................................................................................72Polyfl ,4-phenylenevinylene)s as Electroluminescent Emitters...........................73Polyfl ,4-phenylene)s as Electroluminescent Emitters..........................................75Electroluminescence Mechanisms...................... 75
Lanthanide Complexes as Electroluminescent Emitters.................... 78Near-Infrared Emitting Lanthanide Based Devices...................................................... 80Electroluminescence from Lanthanide tra-p-Diketonates Blended in MEH-PPV ....81 Concentration Effects of Yb(TPP)acac Blended into MEH-PPV on Device
Performance................................................................... 85Near-Infrared Emission from Yb(TPP)acac as the Only Component in the Active
Layer......................................... 89Near-Infrared Emission from Er(TPP)acac in MEH-PPV............................................91Electroluminescence of PPP-OR11 ............ 92Near-Infrared Electroluminescence of Yb(TPP)TP Blended into PPP-OR11 ...........95Near-Infrared Electroluminescence of Yb(TPP)L(OEt) 3 Blended into
PPP-OR11.......................................................... 102Near-Infrared Emission from Ln(TPP)L in Polystyrene............................................ 107Near-Infrared Electroluminescence from Other Lanthanide TPP Complexes 109Visible Emission of Lanthanide Complexes in Polystyrene................... 112Dual Emitting Near-Infrared Devices ........................................................114Discussion ........ 115Conclusion...................................................................................................................... 124Experimental................................................................................................................... 124
ITO Etching............................. 125Cleaning ITO............................. 126Spin Coating Hole Transport and Active Layers ................................ .127Metal Electrode Deposition...................... 127Electroluminescent Device Measurements.............................. 129
4 CONCLUSIONS................ 131
Near-infrared Photoluminescence............................... 131
vi
Reproduced with permission o f the copyright owner. Further reproduction prohibited w ithout permission.

Near-Infrared Electroluminescence 133
APPENDIX
A CALCULATION OF EXTERNAL ELECTROLUMINESCENT QUANTUMEFFICIENCIES ................... 134
Preparing the Detector............................... 134Calibrating the Detector................ 135Measuring the Irradiance of an Electroluminescent Device..................... 138Electroluminescence Quantum Efficiency.................................................................. 140
B DRAWINGS ............................................................. 142
C ELECTROLUMINESCENT DATA PROCESSING.................................................147
Worksheet: RawDataExtract...................................................................... 149Worksheet: Radiance D ata ............................ 150Worksheet: Photon Data................. 150Worksheet: Radiance Integrator................. 151Worksheet: Photon Integrator........................................................ 151Worksheet: Correction Factors........................................................................ 152Worksheet: Table Summary..........................................................................................153Macro: DataExtractor.................................................................................................... 154Macro: DataExtractorlntegrator............................................................................... 156Macro: TableSummary.................................................................................................. 157
LIST OF REFERENCES.................. 160
BIOGRAPHICAL SKETCH............................................................................... 175
Reproduced with permission o f the copyright owner. Further reproduction prohibited w ithout permission.

LIST OF TABLES
Table page
1-1. Near-infrared quantum yields and lifetimes of lanthanide tm-p-diketonates .......4
1-2. Structures of Yanagida’s ligands coordinated to lanthanides......................................5
1 -3. Selected near-infrared quantum yields reported in the literature............................ .....5
1-4. Natural radiative lifetimes and rates for lanthanides....................................................6
1-5. Emission transitions of lanthanide fra-p-diketonates in benzene........................ 17
1-6. Photophysical properties of Ln(TPP)TP measured in CH2 CI2 .................................. 20
1-7. Photophysical properties of Ln(TPP)L(OEt) 3 measured in CH2 CI2 .............. 20
1 -8. Near-infrared peak positions of Yb(TPP)TP at 5 nm resolution................... 27
1 -9. Solvent effects on the near-infrared quantum yields of Yb(TPP)acac andYb(TPP)TP................................... 35
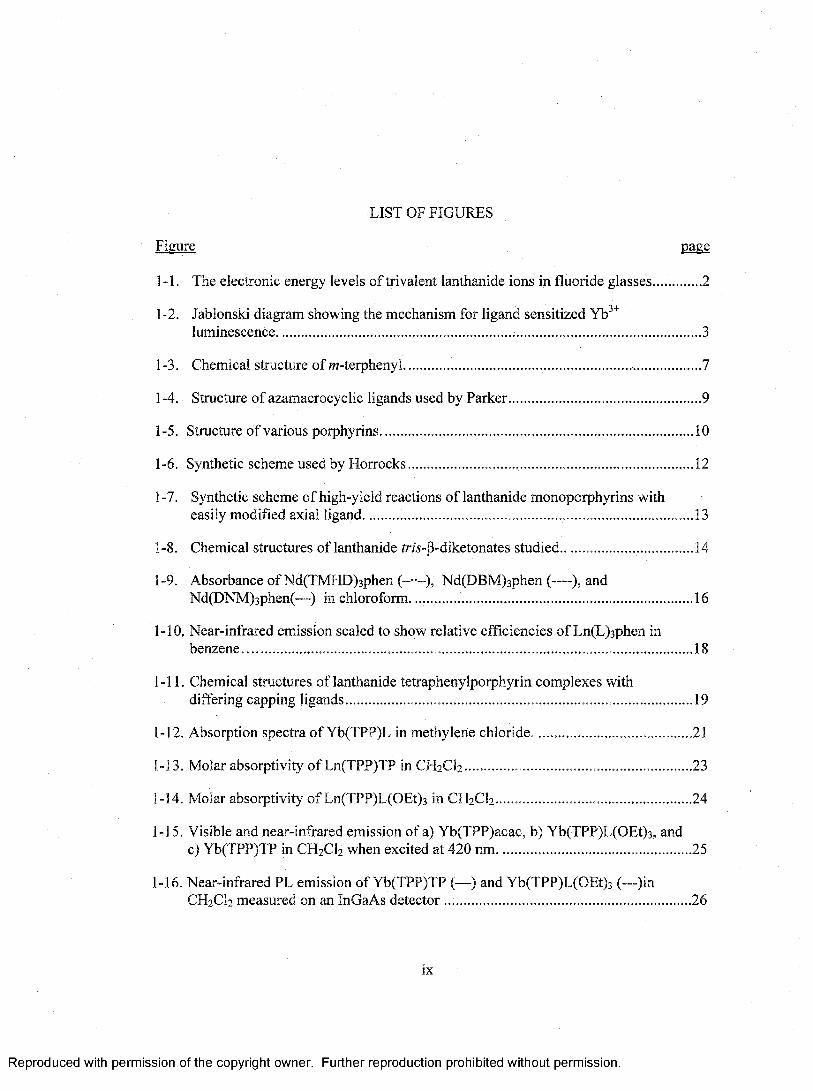
2-1. Critical Forster distances for lanthanide/conjugated polymer systems....................70
3-1. Near-infrared external EL efficiencies of 5, 10, 15 mol% concentrations ofYb(TPP)TP blended into PPP-OR11 at various current densities.............................99
3-2. Near-infrared external EL efficiencies of 5, 10, 15 mol% concentrations ofYb(TPP)L(OEt) 3 blended into PPP-OR11 at various current densities .......... 105
3-3. Maximum near-infrared external and internal EL efficiencies of PPP-OR11 andYb(TPP)L blended into PPP-OR11 or PS ................. 116
3-4. Apparent fraction of electron-hole recombination of PPP-OR11 and Yb(TPP)Lblended into PPP-OR11 or PS................... 117
3-5. Summary of electroluminescent device fabrication.................................................129
viii
Reproduced with permission o f the copyright owner. Further reproduction prohibited w ithout permission.
LIST OF FIGURES
Figure page
1-1. The electronic energy levels of trivalent lanthanide ions in fluoride glasses............. 2
1-2. Jablonski diagram showing the mechanism for ligand sensitized Yb3+luminescence. .............. 3
1-3. Chemical structure of m-terphenyl ............................... 7
1-4. Structure of azamacrocyclic ligands used by Parker.................................................... 9
1-5. Structure of various porphyrins .......................... 10
1 -6. Synthetic scheme used by Horrocks.............................................................................. 12
1-7. Synthetic scheme of high-yield reactions of lanthanide monoporphyrins witheasily modified axial ligand...........................................................................................13
1-8. Chemical structures of lanthanide fra-p-diketonates studied.. .................... 14
1-9. Absorbance of Nd(TMHD)3phen (-••-), Nd(DBM)3phen (— ), andNd(DNM)3phen(—) in chloroform..............................................................................16
1-10. Near-infrared emission scaled to show relative efficiencies of Ln(L)3phen inbenzene........................................................................................................................... 18
1-11. Chemical structures of lanthanide tetraphenylporphyrin complexes withdiffering capping ligands................. 19
1-12. Absorption spectra of Yb(TPP)L in methylene chloride.......................... 21
1-13. Molar absorptivity o f Ln(TPP)TP in CH2 CI2 ..............................................................23
1-14. Molar absorptivity o f Ln(TPP)L(OEt) 3 in CH2 CI2 ................ 24
1-15. Visible and near-infrared emission of a) Yb(TPP)acac, b) Yb(TPP)L(OEt)3 , and c) Yb(TPP)TP in CH2 CI2 when excited at 420 nm..................................................... 25
1-16. Near-infrared PL emission of Yb(TPP)TP (—) and Yb(TPP)L(OEt) 3 (—)inCH2 CI2 measured on an InGaAs detector .................. 26
ix
Reproduced with permission o f the copyright owner. Further reproduction prohibited w ithout permission.

1-17. Photoluminescence of Yb(TPP)TP in CH2 CI2 upon 420 nm excitation at 5 nmresolution......................................................................................................... 27
1-18. Visible emission of Ln(TPP)L(OEt) 3 in CH2 CI2 upon 420 nm excitation................29
1-19. Excitation spectra of Yb(TPP)L(OEt) 3 in CH2 CI2 .............................. 30
1-20. Excitation spectra of Er(TPP)L(OEt) 3 in CH2 CI2 ..................... 31
1-21. Excitation spectra o f Ho(TPP)L(OEt) 3 in CH2 CI2 ....................... 32
1-22. Excitation spectra of Tm(TPP)L(OEt) 3 in CH2 CI2 ............................................ 33
1-23. Visible emission from Ho(TPP)L(OEt) 3 upon 330 nm emission.............................. 34
1-24. Representation of the radiative transition energies of Yb3+, Nd3+, and Er3+ andthe vibrational energies of common bonds found in organic systems ......38
1-25. Near-infrared emission of a) Er(TPP)TP and b)Er(TPP)L(OEt) 3 in CH2 CI2
upon exciting at 420 nm uncorrected for detector response.......................................39
1-26. Near-infrared emission of Nd(TPP)TP in CH2 CI2 upon exciting at 420 nm............ 39
1-27. Transient absorptions of Ln(TPP)L............................................................... 42
2-1. Structures of the conjugated poly(p-phenylene) polymers and the lanthanide complexes blended into the polymers....................................................... 47
2-2. Absorbance (solid line) and fluorescence (dashed line) of a) PPP-R10 andb) PPP-OR11 in chloroform............................. 49
2-3. Absorption of films on quartz substrates of 0, 1, 2, 5, and 10 mol% ofEu(DBM)3batho blended into PPP-R10......................... 51
2-4. Emission of polymer films that contain 0, 1,2, 5, and 10 mol% Eu(DBM)3batho in PPP-R10 upon excitation at 315 nm........................................................................ 51
2-5. Normalized excitation spectra of 5Do-»7F2 of Eu(DBM)3batho (solid line)and PPP-R10 film containing 10 mol% Eu(DBM)3batho (dashed line)................... 52
2-6. Absorption of spin cast films on quartz substrates of 0, 1, 2, 5, and 10 mol% ofEu(DNM)3phen blended into PPP-R10........................................ 53
2-7. Emission of polymer films that contain 0, 1,2, 5, and 10 mol% Eu(DNM)3phenin PPP-R10 upon excitation at 315 nm......................................... 54
2-8. Normalized excitation spectra of 5Do—»7F2 emission of 1% (—) 2% (—), 5% (-■•-■•-), and 10% (-------) Eu(DNM)3phen in PPP-R10.................... ...54
x
Reproduced with permission o f the copyright owner. Further reproduction prohibited w ithout permission.

2-9. Near-infrared emission from spin-coated films of 10 mol% blends of thelanthanide complex with PPP-R10...............................................................................56
2-10. Visible emission from the 'D 2 —»3H4 transition of Pr3+ when a film of 10 mol%Pr(DNM)3phen blended with PPP-R10 is excited at 327 nm.. ......................57
2-11. The electronic levels of trivalent lanthanide ions in fluoride glasses ................ 58
2-12. PL of films of PPP-OR11 blended with 0, 1,2, 5, 10, 15, and 20 mol%................. 59
2-13. Fraction of PPP-OR11 fluorescence quenched by (#)Yb(DBM)3phen and (A)Yb(DNM)3phen in spin-coated films prepared by blending the lanthanide complex into the polymer................................... 59
2-14. Absorbance of spin cast films of Ln(TPP)TP blended into PPP-OR11....... ...61
2-15. Visible emission of spin cast films of 0, 1, 2, 5, 10, 15, and 20 mol% of a)Er(TPP)TP and c) Ho(TPP)TP in PPP-OR11 when excited at 367 nm ................... 62
2-16. Visible emission of spin cast films of 0, 1, 2, 5, 10, 15, and 20 mol% of a)Tm(TPP)TP and c) Yb(TPP)TP in PPP-OR11 when excited at 367 nm ................. 63
2-17. Fraction of PPP emission quenched by ( • ) Ho(TPP)TP, (▼) Er(TPP)TP, (■)Tm(TPP)TP, and (♦) Yb(TPP)TP............................................................... 63
2-18. Near-infrared emission of 1, 2, 5, 10, 15, and 20 mol% Yb(TPP)TP inPPP-OR11 upon excitation at 367 nm.................................................................... 65
2-19. Excitation spectra of 977 nm emission of 1, 2, 5, 10, 15, and 20 mol%Yb(TPP)TP in PPP-OR11 normalized to the PPP-OR11 intensity maximum 6 6
2-20. Near-infrared emission of 20 mol% Er(TPP)TP in PPP-OR11 ................................ 6 6
2-21. Spectral overlap of PPP-OR11 emission (—) and the absorption of a) Ln(DBM)3phen, b) Ln(DNM)3phen and c) Ln(TPP)TP (—) . ................................ 69
3-1. Chemical structure of aluminum fm -(8 -hydroxyquinolinate) (AIQ3) and a single-layer device architecture............... 73
3-2. Chemical structures of three common poly(p-phenylenevinylene)s .................. 74
3-3. Sulphonium prepolymer route to PPV.......................................................... 74
3-5. Structure of a multilayer light emitting diode............................................................. 77
3-6. Examples of small-molecule hole transport materials................................................ 78
3-7. Structure of hole transporting polythiophene PEDOT-PSS .............................79
xi
with permission o f the copyright owner. Further reproduction prohibited w ithout permission.

3-8. Host polymer structures....................................................................................... 81
3-9. Structure of EL device: glass/ITO/PEDOT-PSS (40 nm) / lanthanide complexand polymer host / Ca (5 nm) / A1 (200 nm).................. 82
3-10. Electroluminescence spectrum of ITO/PEDOT-PSS/MEH-PPV/Ca/Al recordedat 9 V ...................................................................................................... 82
3-11. Structures of Yb tris-f3-diketonates complexes blended into MEH-PPV .........83
3-12. Electroluminescence spectrum at 9 V for 1:2 weight ratio of Yb(TTFA)3phen toMEH-PPV device.................................................................. 84
3-13. Electroluminescence spectrum at 9 V for 1:1 weight ratio of Yb(DNM)3phen toMEH-PPV device.......................................................................................................... 85
3-14. Chemical structure of lanthanide tetraphenylmonoporphyrinate acetylacetonate. ..86
3-15. Electroluminescence spectra of Yb(TPP)acac in MEH-PPV....................................87
3-16. Current response of electroluminescent devices at different voltages................. ....90
3-17. Electroluminescence spectra of ITO/PEDOT/Yb(TPP)acac/Ca/Al devive............. 91
3-18. Electroluminescence spectrum of 1:2 (weight ratio) Er(TPP)acacMEH-PPV 92
3-19. Electroluminescence spectrum of PPP-OR11 at 6 V.............. 93
3-20. Current density (circles) and irradiance (triangles) of PPP-OR11 at differentapplied voltages................................................. 94
3-21. Efficiencies of ITO/PEDOT-PSS/PPP-OR11/Ca/Al devices verses currentdensity.............................................................................................. 94
3-22 Chemical structures of lanthanide tetraphenylporphyrin complexes Ln(TPP)with differing capping ligands...................................................................................... 95
3-23. Electroluminescence spectra measured from 4 to 10 V in 1 V increments........... ...98
3-24. Current and radiance profiles of devices consisting of Yb(TPP)TP inPPP-OR11..................................................... 99
3-25. Log-log plot of near-infrared efficiency of a) 5 mol%, b) 10 mol%, andc) 15 mol% Yb(TPP)TP in PPP-OR11 verses current density............................... .100
3-26. Log-log plot of near-infrared power output of a) 5 mol%, b) 10 mol%, andc) 15 mol% Yb(TPP)TP in PPP-OR11 verses input power..................................... 101
xii
Reproduced with permission o f the copyright owner. Further reproduction prohibited w ithout permission.

3-27. Electroluminescence spectra of 15 mol% Yb(TPP)L(OEt) 3 in PPP-OR11 from5 to 12 V in 1 volt increments.....................................................................................103
3-28. Current and radiance profiles of devices consisting of Yb(TPP)L(OEt) 3 inPPP-OR11...... 104
3-29. Log-log plot of near-infrared efficiency of a) 5 mol%, b) 10 mol%, andc) 15 mol% Yb(TPP)L(OEt) 3 in PPP-OR11 verses current density .....105
3-30. Log-log plot of near-infrared power output of a) 5 mol%, b) 10 mol%, andc) 15 mol% Yb(TPP)L(OEt) 3 in PPP-OR11 verses input power.............................106
3-31. Current density (circles) and near-infrared irradiance (triangles) of 10 mol%Yb(TPP)L(OEt) 3 in polystyrene (Mn: 280,000)........................................................108
3-32. Electroluminescence from 6 V to 10 V for 10 mol% Yb(TPP)L(OEt) 3 inpolystyrene................... 108
3-33. The electronic energy levels of Pr3+, Nd3+, Ho3+, Er3+, and Tm3+ ions in fluorideglasses........................................................................................................................... 109
3-34. Electroluminescence of other near-infrared emitting lanthanides........................... 111
3-35. Visible EL at 9 V of 1:1 weight ratio of Ln(TPP)L(OEt)3 in PS: a) Er3+ b) Ho3+c) Nd3+ and d)Pr3+.....................................................................................................113
3-36. Electroluminescence of 10 mol% Yb(TPP)L(OEt) 3 and 10 mol%Er(TPP)L(OEt)3 in PPP-OR11 at 7 V....................... ................................................ 115
3-37. When Ln(TPP)L is dispersed into PPP-OR11, it may aggregate allowing charge hopping between Ln(TPP)L complexes to occur at lower concentrations (5 mol%) than estimated (15 mol%)................................................. 121
3-38. Darker areas indicated areas where ITO will be etched away when exposed toaqua regia vapors......................................................................... 125
3-39. Masked ITO is suspended over aqua regia vapors for 6 minutes to etch awaythe exposed ITO............................................................................................................126
3-40. ITO coated with polymer layers are placed face up on the inverted stage forelectrode deposition......................................................................................................128
3-41. Front and side view of device holder mounted on XY stage setup for EL device measurements on the Triax 180/CCD system............................................................ 130
4-1. Proposed ligands for coordination to lanthanides......................................................133
A -l. Irradiance (solid circles) at 50 cm from the detector of a 100 W QTH (S/N:EH-156) calibrated on September 18, 2002..... 135
xiii
Reproduced with permission o f the copyright owner. Further reproduction prohibited w ithout permission.

A-2. Fractional transmittance of 1 % neutral density filter............................. 136
A-3. Raw data collected by the CCD detector of 100 W QTH Lamp placed 250 cmaway from 0.1 mm entrance slit width of monochromater.................................. ....137
A-4. Correction factors for ISA-SPEX Triax 180 spectrograph equipped with aliquid N2 cooled CCD detector................................................................................... 138
B -l. Dimensions of a Teflon holder for ITO glass during cleaning ..............................142
B-2. Mounting stage for metal vapor deposition........................................... 143
B-3. Drawing of EL device holder......................................................................................144
B-4. Mount for device holder to XY stage......................................................................... 145
B-5. Mask for metal deposition of electrodes.................... .............................................. 146
xiv
Reproduced with permission o f the copyright owner. Further reproduction prohibited w ithout permission.

Abstract of Dissertation Presented to the Graduate School of the University of Florida in Partial Fulfillment o f the Requirements for the Degree of Doctor of Philosophy
PHOTOLUMINESCENCE AND ELECTROLUMINESCENCE OF NEAR-INFRARED EMITTING LANTHANIDE COMPLEXES IN CONJUGATED POLYMER HOSTS
By
Benjamin Scott Harrison
May 2003
Chair: Kirk S. Schanze Major Department: Chemistry
The photoluminescent and electroluminescent properties of near-infrared emitting
lanthanide monoporphyrinate complexes blended into conjugated polymers were
investigated. The lanthanide monoporphyrinate complexes, Ln(TPP)L consisted of a
lanthanide (Ln= Er3+, Nd3+, Pr3+, Tm3+, Yb3+) coordinated to 5,10, 15, 20-
tetraphenylporphyrin (TPP) and a capping ligand, L. The capping ligand was either an
acetylacetonate (acac), /ra-pyrazoylborate (TP), or (cyclopentadienyl)
tris(diethoxyphosphito-P)cobaltate) (L(OEt)3 ) anion. The optical absorption properties of
these complexes resembled “regular” metalloporphyrin absorption which was not
significantly influenced with different coordinated lanthanide ions or capping ligands.
The photoluminescent properties showed quenching of the porphyrin emission and
O I ^ *> 1 A A
sensitized near-infrared emission from Yb ( Fs/2 -> F7/2 , [977 nm]); Nd ( F3/2 —> I 11/2 ,
xv
Reproduced with permission o f the copyright owner. Further reproduction prohibited w ithout permission.

[880 nm]), %sa [1060 nm], 4F3/2-> %sn [1330 nm]); and Er3+ (4 1,3/2^ 15/2 , [1520
nm]) was observed in CH2 CI2 . The photoluminescent quantum yields o f the Yb(TPP)TP
and Yb(TPP)(LOEt) 3 were 3.2% and 2.4%, respectively.
Photoluminescent studies of Ln(TPP)L blended into a bis-alkoxy
poly(p-phenylene) (PPP-OR11) host show that energy transfer from the host to the
lanthanide complex does occur resulting in sensitized near-infrared emission.
Electroluminescence (EL) was observed from films containing Ln(TPP)L in PPP-OR11.
In all devices, the visible emission from the host was strongly suppressed. For devices
where Ln(TPP)L was Yb3+, Nd3+, or Er3+, near-infrared emission was observed. For
electroluminescent devices made with Yb(TPP)TP in PPP-OR11, the external quantum
efficiencies were typically 10'4. Substituting PPP-OR11 with polystyrene improved the
external quantum efficiencies to 10‘3 suggesting that charge hopping between Ln(TPP)TP
may be more important than Forster energy transfer from polymer host to Ln(TPP).
xvi
Reproduced with permission o f the copyright owner. Further reproduction prohibited w ithout permission.

CHAPTER 1 SOLUTION PHOTOPHYSICS OF
NEAR-INFRARED EMITTING LANTHANIDE COMPLEXES
Background
Lanthanides are unique among the elements found on the periodic table because of
their similar chemical reactivities yet diverse optical and magnetic properties. Their
optical properties are different from other ions and molecular species because they absorb
and emit light over narrow wavelength ranges. These unique optical properties arise
because the inner-shell 4 /orbitals are shielded by filled 5s and 5p valence orbitals.
Effective shielding of 4f orbitals minimizes interactions with the surrounding
environment, (i.e. ligands, solvent) also results in other optical properties including weak
transition intensities, long lifetimes and transitions energies that are relatively insensitive
to the coordinating ligands.
The wide variety of ultra-violet, visible, and near-infrared transitions of lanthanides
were first described by Dieke.1 Figure 1-1 shows an example of the energy states
observed for lanthanide fluoride glasses.2 The electronic structure observed results from
spin-orbit coupling and crystal field effects on the lanthanide electronic states. A more
detailed explanations of the complexities of 4f->4f transitions can be found in an
excellent reference work on lanthanide chemistry edited by Gschneidner and Eyring.3
The forbidden nature off —>f transitions makes direct excitation difficult. The
molar absorptivities off —r f transitions are typically 1-10 M '1 cm"1 compared with d—>d
transitions (103 M"1 cm"1) of transition metals and allowed transitions (104-105 M"1
1
Reproduced with permission o f the copyright owner. Further reproduction prohibited w ithout permission.

cm’1). However, Weissman discovered in 1942 that when organic ligands were chelated
to Eu3+ and then irradiated at the 7t—»7t* transition of the chelated ligands, sensitized
4/—>4/"emission from Eu3+ resulted.4
40
35
30
*r”
E 25 o
I s 20TT"X >»E? 15 a>c LU
10
5
0
Ce Pr Nd Pm Sm Eu Gd Tb Dy Ho Er Tm Yb
Figure 1-1.The electronic energy levels of trivalent lanthanide ions in fluoride glasses.
A generally accepted mechanism has been proposed to explain this phenomenon as
shown in Figure 1-2.
1. The ligand is excited from the singlet ground state to a singlet excited state(S0-*Sn).
2. The Sn state decays into the lowest energy singlet excited state (Sn-»Si) on the ligand.
3. The singlet state intersystem crosses into the ligand-based triplet state (Si—>Ti).
4. Energy transfer to the lanthanide then occurs.
Reproduced with permission o f the copyright owner. Further reproduction prohibited w ithout permission.

3
5. The energy on the lanthanide can then undergo radiative decay resulting in lanthanide-centered luminescence.
\ ( 4)
(5)
J _ ±
'5/2
7/2
Figure 1-2. Jablonski diagram showing the mechanism for ligand sensitized Yb3+ luminescence. Solid lines indicate radiative transitions. Dashed lines represent non-radiative transitions.
Since this important discovery about ligand-sensitized lanthanide
photoluminescence, intensive efforts have been put forth to improve lanthanide
luminescent quantum efficiencies. For example, many groups have used p-diketonates as
sensitizing ligands for lanthanides. Typically, three anionic p-diketonates coordinate
through the carbonyl oxygen to the lanthanide. Commonly, lanthanide complexes have
coordination numbers of seven to nine; therefore, to complete the coordination sphere,
either water or another neutral coordinating ligand such as phenanthroline is coordinated
to the lanthanide.
Most research in luminescent organolanthanide complexes has focused on visible
emitters such as Eu3+ and Tb3+ for their use as inorganic phosphors in display
technologies. Significantly less effort has been expended towards improving the
Reproduced with permission o f the copyright owner. Further reproduction prohibited w ithout permission.

quantum efficiencies of near-infrared emitting lanthanides.5'8 Table 1-1 and Table 1-3
are compilations from the literature of near-infrared quantum yields and lifetimes of
simple lanthanide fm-P-diketonates in their respective solvents. The next section gives a
brief overview of significant work in near-infrared emitting lanthanide complexes.
Table 1-1. Near-infrared quantum yields and lifetimes of lanthanide fra-P-diketonates
Compound 7,/nm 0> T / pS Solvent
Yb(TTFA)3 977 3.5 x 10'4 5.7 Toluene
Yb(TTFA)3phen 977 11.0 x 10⁻⁴ 10.4 Toluene
Yb(DBM)3phen 977 1.3 x 10'3 9 Toluene
Pr(TTA)3«2H20 1000 1.8 x 10'4 — DMSO
______ • 1 J J J? .. TT..3+ ...... J t y 1 ■ 1................... ■ "1.11 xq j i
Values for Yb complexes are from references 9 and 10. Quantum yield data for Pr complex can be found in reference 11.
Neodymium tra-p-Diketonates
Yanagida and co-workers have investigated the near-infrared luminescence of
small molecule Nd3+ complexes for use in lasers.12 In particular, they have focused on
fluorinated ligands and other ligands that lack many high-frequency vibrational modes,
such as found in C-H and O-H bonds, which contribute to non-radiative decay of excited
states. Table 1-2 shows the structures of the coordinating anionic ligands used by
Yanagida. Table 1-3 shows the quantum yield and lifetimes for these compounds in
various solvents.13 The quantum yield represents the ratio of photons emitted to photons
absorbed. The photoluminescent quantum yield can also be expressed as the ratio of the
radiative rate, kr to the sum of the radiative and non-radiative rates (knr) as shown in
equation 1-1.
Reproduced with permission o f the copyright owner. Further reproduction prohibited w ithout permission.

5
€>=-k + k 1-1
Table 1-2. Structures of Yanagida’s ligands coordinated to lanthanidesLigand Abbreviation R
o pms CF3
c r ^ R pes C2F5
ft pbs C4F9
11 "R ^ no pos CgFno
^ 11 0 O -S-Rms CF3
O OS CgF]7
dfa CF3
pom C7F 15
Table 1-3. Selected near-infrared quantum yields reported in the literature.Q.Y. (%) DMSO-^6
Q.Y. (%) Acetone-</6
Q.Y. (%) acetone
Lifetime (jis) acetone-i/6
Nd(pos) 3 3.3 3.2 3.0 13.0
Nd(pbs)3 3.3 2.5 0.8 2.0
Nd(pes)3-2H20 3.3 1.0 <0.01 —
Nd(pms)3-2H20 3.3 0.8 <0.01 —
Nd(bama) 3 3.3 1.1 0.8 2.0
Nd(os)3'6H20 3.3 1.1 <0.01 2.0
Nd(ms)3 -6 H2 0 3.3 1.1 <0.01 4.0
Nd(pom)3-H20 3.2 0.8 <0.01 —
Nd(dfa)3-2H20 1.1 0.3 <0.01 1.7
Nd(N03)3-6H20 3.3 <0.01 <0.01 <0.1
Comparing the lifetimes in Table 1-1 and Table 1-3 to the natural radiative
lifetimes of the lanthanide ion in Table 1-4, it is evident that non-radiative pathways
Reproduced with permission o f the copyright owner. Further reproduction prohibited w ithout permission.

dominate the deactivation of the excited state. The natural radiative rate of the
near-infrared emitting lanthanide is in the order of milliseconds compared to the
microsecond lifetimes observed in the lanthanide complexes.
Table 1-4. Natural radiative lifetimes and rates for lanthanides.Ln t (ms) M s ’1)
Yb3+ 2.0 500
Er3+ 14.0 71
Nd3+ 0.25 4000
Macrocyclics as the Coordinating Ligand for Near-Infrared Emitting Lanthanides
Although europium-based materials continue to be one of the most studied
lanthanide systems, several groups have worked on macrocyclic systems containing
near-infrared emitting lanthanides. These groups hoped to decrease non-radiative losses
by designing ligands that minimize quenching by O-H and N-H oscillators with the view
of use such molecules as biological probes or optical amplifiers.
Balzani and co-workers have shown that a dendritic antenna can be used to
sensitize near-infrared emitting lanthanide ions.14 For example a solution containing a
dendrimer bearing three branches of eight 5-dimethylamino-1 -naphthalenesulphonamdio
(dansyl) units was titrated by Nd(N03)3. Quenching of the dansyl units’ fluorescence and
emission from Nd3+ was observed. The near-infrared quantum yield was measured to be
2.7 x 10'3 in acetonitrile: dichloromethane (5:1) solution.14 Since Nd3+ and Er3+ both emit
when coordinated to the dansyl units, and neither ion can easily participate in electron
transfer reactions then energy transfer from the dendrimer was invoked to explain the
near-infrared emission. However, for Yb3+ there is no spectral overlap of the dendrimer
emission with a Yb3+ energy accepting level. To explain the observed near-infrared
Reproduced with permission o f the copyright owner. Further reproduction prohibited w ithout permission.

7
emission, it was proposed that an electron transfers from the dendrimer and reduces Yb3+
to Yb2+. Since the Yb2+ charge-transfer state lies above the Yb3+ 2Vsri state, upon back
electron transfer Yb3+ can either be in the 2Vsri excited state or 2¥m state.15 Interestingly,
in the case of Eu3+, which could participate in both electron and energy transfer
quenching of the dansyl fluorophore, Eu3+ emission is not observed. This is explained as
either a fast electron transfer processes (no redox transient species were observed) via a
non-emissive Eu2+ state or energy transfer followed by a faster electron transfer
process.15
Van Veggel and co-workers published a number of papers on lanthanide containing
complexes coordinated with m-terphenyl based ligands.16"20 Their attempts to improve
lanthanide luminescence efficiency are based on the premise that encapsulation of the
lanthanide ion prevents easy access of solvent from reaching the lanthanide. The basic
structure of the m-terphenyl based ligand is shown in Figure 1-3. With a triplet energy of
24,600 cm'1, this ligand is capable of sensitizing visible and near-infrared emission from
nearly all of the lanthanides that luminesce.
Ln
Figure 1-3. Chemical structure of m-terphenyl.
Focusing on the near-infrared complexes prepared containing Er3+, Yb3+, or Nd3+,
their lanthanide m-terphenyl complexes possessed lifetimes of 2.1, 1.2, and 9.1 psec in
Reproduced with permission o f the copyright owner. Further reproduction prohibited w ithout permission.

DMSO, respectively. Upon deuteration of the solvent these lifetimes increased to 3.5,
19.9, and 2.5 psec, respectively, which corresponds to photo luminescence quantum
yields o f 2 x 10'4, 7.8 x 1 O'3, and 8.4 x 10'3 respectively.18 Deuteration of the ligand
improved the quantum efficiencies to 4 x 10' for Er , 3 x 1 0 ' for Yb , and 2 x 10' for
Nd3+ in DMSO-rfd.16 Others have examined similar calixarenes coordinated to Er3+,
Yb3+, or Nd3+ and found the quantum yields to be approximately a order of magnitude
lower in non-deuterated solvents such as ethanol.21'27 On the basis of their findings and
others, the luminescence lifetimes, and hence the luminescence quantum yields, are
significantly influenced by non-radiative deactivation by vibronic coupling of the 4 f
electronic states and high-energy oscillators in the local environment and deuteration of
the ligand increases photoluminescence quantum efficiencies. Interestingly, several
hetrobinuclear complexes exhibit near-infrared quantum yields as high as 6.1 x 10'3 in
ethanol.28
The importance of near-infrared emitting lanthanide for probing biological systems
is evident in Parker’s work who has studied lanthanide containing azamacrocyclic ligands
based on cyclen (1,4,7,10-tetraazacyclododecane).29'34 Examples of these structures are
shown in Figure 1-4. By functionalizing the arms of the macrocycle, in addition to
modifying the compound’s interactive properties with biological systems, the effects of
the arms on lanthanide luminescence can be studied. Those studies confirmed that O-H
oscillators as coordinated H2O readily deactivate the excited states of Yb3+ and Nd3+.
The lifetime of Yb3+ containing azamacrocycles average about 0.8 psec in H2 O and
increases 2-10 times when measured in D2 O. The lifetimes of the analogous Nd3+
complexes increases from 0.16 to 0.33 psec when going from H2 O to D2 O. This increase
Reproduced with permission o f the copyright owner. Further reproduction prohibited w ithout permission.

9
in lifetime is attributed to the removal of coordinated water molecules, i.e. O-H
oscillators, from the inner coordination sphere of the lanthanide by D2 O.
R
Figure 1-4. Structure of azamacrocyclic ligands used by Parker et. al.
Near-Infrared Emitting Lanthanides Coordinated to Porphyrins
Porphyrins are promising ligands for efficient energy transfer to near-infrared
emitting lanthanide ions because their intense Soret bands lead to facile excitation and
their low energy triplet states can readily excite the near-infrared emitting states of the
lanthanide ions. Examples of porphyrins that have been coordinated to Ln3+ are shown in
Figure 1-5. While porphyrin complexes of transition metals have been studied
extensively, far fewer studies of porphyrins containing lanthanides have been published
after their first appearance in 1976.35
There have been scattered reports through the literature of near-infrared sensitized
emission from lanthanide porphyrins.31’36,37 However, Tsviko, Solovev and Kachura
launched a major effort to study the photophysical properties of lanthanide complexes of
benzoporphyins and etioporphyrins with an emphasis on investigation of their fast
electronic relaxations.38'42 They showed that the coordinated lanthanide rapidly
deactivates the S2 and Si excited states of the porphyrin via intersystem crossing to the
Reproduced with permission o f the copyright owner. Further reproduction prohibited w ithout permission.

triplet state. This rapid intersystem crossing is due to spin-orbit coupling induced from
the heavy atom effect of the lanthanides. As a result of fast intersystem crossing, visible
emission from the porphyrin is quenched. However, the quenching is not 100%
complete. It has been shown that weak emission arising from the S2—»So and Si~»So
transitions does occur.41 The quantum yields for the near-infrared emission of Yb3+
etioporphyrin and Yb3+ benzoporphyrin where the axial ligand is either acetylacetonate or
chloride have both been reported to be 5 x 10"3 with a lifetime o f 12 psec in benzene 43
porphyrin
benzoporphyrin (TBP)
tetraphenylporphyrin (TPP)
ethioporphyrin
Figure 1-5. Structure of various porphyrins.
Solovev and Kachura also prepared Nd3+ containing tetra-meso-(/?-tolyl)-porphyrin
which upon visible excitation luminesced from the (875-940 nm) and the
Reproduced with permission o f the copyright owner. Further reproduction prohibited w ithout permission.

4F3/2 ^ 4Ii 1/2 transitions (1060 ran) of Nd3+. The quantum yield of that complex was 2.4 x
10'4 in toluene.44
For lanthanides whose energy accepting states are too high to accept energy from
the porphyrin (Lu, Gd, La), the transient absorption shows similar transient profiles to
Zn2+ and Pd2+ porphyrins with similar lifetimes thus showing that the triplet state is the2 i i
lowest energy state in lanthanide-containing porphyrins. For Eu , Tb , Dy , Ho ,
Er3+, and Tm3+ coordinated to etioporphyrin, the transient absorption matched the
transient absorption of the non-energy accepting porphyrins mentioned above only with
significantly shorter lifetimes. Thus, it was concluded that energy was efficiently
transferred away from the porphyrin to the lanthanide. Quenching of the porphyrin
emission by an energy transfer mechanism was not expected for Eu3+ since the energy
accepting state of Eu3+ is too high in energy. However, the presence o f a charge transfer
deactivation pathway is a possibility since ligand-to-metal charge transfer quenching has
been observed for Eu3+45 Interestingly, an unusual transient absorption for Yb3+
containing porphyrins which had a derivative shape in the Q-band region was reported.38
The lifetime of the transient was not dependant on oxygen concentration, but deuteration
of the solvent did increase its lifetime. In addition the transient lifetime corresponded to
the lifetime of the Yb3+ 2Fs/2 —»2F7 /2 emission. Taken together the observations suggested
■2-1
that the transient absorption was due to the Yb based excited state.
Synthesis of Lanthanide Monoporphyrinates
While the porphyrin ligand is ideal for use as an efficient sensitizer of near-infrared
emitters, the initial synthesis of the lanthanide porphyrin complexes resulted in low
yields. The first reported synthesis of lanthanide monoporphyrinates involved distillation
Reproduced with permission o f the copyright owner. Further reproduction prohibited w ithout permission.

12
at 220°C of acetylacetone from Ln(acac) 3 in the presence of tetraphenylporphyrin to give
lanthanide monoporphyrinate acetylacetonate complexes in 10-30% yield as shown in
lengthy chromatography times needed to isolate the products. This method effectively
limits the choice of axial ligand to acac. The coordinated diketonate could be replaced by
subsequent reactions, but even higher boiling solvents are required and low isolated
and other porphyrin complexes have focused on amine elimination reactions of neutral
Figure 1 -6 . Synthetic scheme used by Horrocks et al.
Recently, a high-yield synthesis of a series of lanthanide (III) chloride
tetraphenylporphyrinate complexes via nucleophilic displacement of Cl- from anhydrous
LnCb by the TPP dianion was reported. 56 Using these Ln(TPP)Cl complexes as synthons
a series of sterically saturated monoporphyrinate compounds were synthesized and
characterized (Figure 1-7).
Figure 1-6.3 5 ,4 6 ,4 7 The low yields arise because the complexes hydrolyze during the
product yields result.4 8 ' 50 More recently, efforts to form lanthanide tetraphenylporphyrins
lanthanide amides or alkyls with free base porphyrins5 1 ,5 2 or similar reactions between
Li{Ln[N(SiMe3)2 ]3Cl} and substituted tetraphenylporphyrins. 5 3 ' 55
+ Ln(acac)31,2,4-trichlorobenzene
4 Hr, reflux @ 215 °C
Ln(TPP)acac
Reproduced with permission o f the copyright owner. Further reproduction prohibited w ithout permission.

13
2( Li DME)
+ LnCl3 '3 THF
©
4 Hr, reflux
Toluene
Ln= Yb,Tm, Er, HoLnTPPCl (DME)
™ X= Cl for Yb, Tm, Er, HoX= I for Nd, Pr
Figure 1-7. Synthetic scheme of high-yield reactions of lanthanide monoporphyrins with easily modified axial ligand.
Generation of near-infrared luminescence from metal complexes by photoexcitation
or by application of an electric field has been area of growing interest. 17 ,57 ' 60
Near-infrared sources have potential uses in both for biological and biomedical
applications such as glucose monitoring61 ' 63 and immunoassay64 ,6 5 and for
telecommunications. In this chapter, an overview of photophysical properties of
near-infrared lanthanide emitters in solution is presented with the goal of incorporating
these emitters in electroluminescent devices. We began by examine the photophysical
properties of near-infrared emitting lanthanide /ra-p-diketonate complexes followed by a
Reproduced with permission o f the copyright owner. Further reproduction prohibited w ithout permission.

14
new series of lanthanide tetraphenylporphyrin complexes, Ln(TPP)L. The effects of
different axial ligands and lanthanide metal centers on the optical properties (absorption,
transient absorption, visible and near-infrared photoluminescence) of Ln(TPP)L were
thoroughly examined.
Photophysical Properties of Lanthanide tm-p-Diketonates
This work began by examining the basic photophysical properties of
tm-P-diketonate complexes coordinated to near-infrared emitting lanthanides. Structures
of the lanthanide /ra-J3-diketonates complexes studied consisted of three anionic
1,3-diketone ligands bound in a bidentate fashion to the lanthanide ion. Their structures
are shown in Figure 1-8. To complete the coordination sphere of the lanthanide,
phenanthroline was used. Phenanthroline helps prevent water from directly binding to
the lanthanide. The structures of the complexes used are shown in Figure 1-8.
I_n(acac)3phen Ln(TTFA)3phen
Ln(DNM)3phen Ln(DBM)3phen
Figure 1-8. Chemical structures of lanthanide Zra-|3-diketonates studied. The lanthanide metal center was either Pr3+, Nd3+, Er3+, or Yb3l\
Reproduced with permission o f the copyright owner. Further reproduction prohibited w ithout permission.

15
Absorption Properties of Lanthanide tm-p-Diketonates
All absorption measurements were made in dilute solutions of CH2 CI2 or CHCI3
unless otherwise indicated. Figure 1-9 shows the UV/VTS absorptions of three Nd3+
fra-P-diketonates monophenanthroline complexes. The molar absorptivities (e, M ^cm'1)
were calculated using equation 1-2. A is the absorbance, c is the molar concentration (M)
of the solution, and I is the cell path length (usually 1 cm).
A = e d 1-2
The absorption spectra are dominated by the 7i—»7c* transitions of the ligands
surrounding the lanthanide. The absorption corresponds very strongly with the
P-diketonate ligand (not the phenanthroline ligand) because three P-diketonate ligands
surround the metal as opposed to only one phenanthroline. It is observed, as expected,
that increasing conjugation of the ligand red shifts the absorption of the complex. The
4 f-> 4 f transitions of Nd3+ or any of the lanthanides complexes prepared are not observed
because of the low molar absorptivities (1-10 M‘1cm'1) of these transitions. Substituting
Nd3+ for other trivalent lanthanides such as Eu3+, Er3+, Pr3+, or Yb3+, has little influence
on the transitions of the complexes. This indicates that the lanthanide metal center
has little to no orbital interactions with the ligand other than electrostatic effects
generated by the trivalent charge of each ion. This is reasonable to conclude because the
4 /orbitals are well shielded by filled 5s and 5p orbitals.
Reproduced with permission o f the copyright owner. Further reproduction prohibited w ithout permission.

16
Eo
X
om
mo
10
8
6
4
02 7 5 3 0 0 3 2 5 3 5 0 3 7 5 4 0 0 4 2 5 4 5 0
W avelength I nm
Figure 1-9. Absorbance of Nd(TMHD)3phen (-•■-), Nd(DBM)3phen (— ), and Nd(DNM)3phen(—) in chloroform.
Photoluminescent Properties of Lanthanide fra-p-Diketonates
The photoluminescence emission spectra of eight different complexes in CH2 CI2
with identical absorbance when excited at 315 nm are shown in Figure 1-10. All
emission spectra were collected from optically dilute solutions of CH2CI2 or CHCI3
unless otherwise indicated. A summary of the near-infrared transitions observed are
shown in Table 1-5 including the quantum yields of these complexes.
Photoluminescence quantum yields (Os) in solution were calculated using the equation
1-3 where Are/a n d A s are the absorbance of the relative standard and sample, respectively,
n is the refractive index of the solvent; Fref and Fs are the integrated area of the
luminescence of the reference and sample, respectively; Ore/ is the quantum yield of the
standard used. Ruthenium (II) tra-bypridine dichloride, Ru(bpy) 3 in water (O = 0.0379)
was used as a relative quantum yield standard for ytterbium complexes. The quantum
yield measured for Yb(TTFA)3phen (O - 1 x 10'3, benzene) using a CCD detector was
Reproduced with permission o f the copyright owner. Further reproduction prohibited w ithout permission.

17
then used as a relative standard for other near-infrared emitters measured using an
InGaAs detector.
The quantum yields for the complexes are generally low but comparable to other
reported values for lanthanide /m-P-diketonates (see Table 1-1). There is a decrease in
quantum efficiency going from TTFA > DBM > DNM. This trend holds true regardless
of metal center.
Table 1-5. Emission transitions of lanthanide fra-P-diketonates in benzene. Thenumbers in parentheses are the relative intensities of multiple peaks of the
_______ near-infrared spectrum. _______________________________________Complex Transitions Itmx nm ^PL
Er(DNM)3phen 4113/2—>4115/2 3 1531 a 4.3 x 10'6a
Er(TTFA)3phen 4It3/2—>4IlS/2 3 1531a 1 . 0 x 1 0 '5a
4F3/2—> 4Il 1/2 878 (0.7)
Nd(DNM)3phen 4F 3/2 t 4113/2
4F 3/2 y "l 15/2
1061 ( 1 .0 0 )
1332 (0.15)
1 . 6 x 1 0 ’5
4F3/2 4Ill/2 878 (0.60), 900 (0.54)
Nd(DBM)3phen 4F 3/2 4113/2
4P 3/2 4115/2
1061 ( 1 .0 0 )
1332(0.12)
4.9 x IQ' 5
4F3/2-» 4111/2 877 (0.69), 894 (0.51)
Nd(TTFA)3phen 4F3/2-^ 4Il3/24f 3/2—» 4j 15/2
1061 ( 1 .0 0 )
1332 (0.12)
1.9 x 10"4
Pr(DNM)3phen 3P0— (j4 or1d 2 ->3f 4
1016(0.62), 1062(1.00) 3.4 x 10"6
Yb(DNM)3phen 2p5/2->2p7/2 977(1.00), 1008(0.73), 1034 (0.69) 2 . 1 x 10'4
Yb(TTFA)3phen 2F5/2 2Pin 977(1.00), 1007(0.99), 1032(0.95) l.Ox 10' 3
Opl were measured relative to Ru(bpy)3 (0=0.0379, air saturated water)
a Lower Limit. Values may be higher due to fall off in InGaAs detector response for wavelengths greater than 1550 nm.
Reproduced with permission o f the copyright owner. Further reproduction prohibited w ithout permission.

18
0 .0 5
0 .0 4
0 .0 3
0.02
0.01
0.00
0 .5
Nd0 .4
0 .3 -
0.2
0.00.0020
.3+£ 0 . 0 0 1 5
■= 0.0010
0 .0 0 0 5
0.00003 .0
2 .5Yb
2.0
0 .5
0.08 5 0 9 0 0 9 5 0 1 0 0 0 1 0 5 0 1 1 0 0 1 1 5 0 1 2 0 0 1 2 5 0 1 3 0 0 1 3 5 0 1 4 0 0 1 4 5 0 1 5 0 0 1 5 5 0
Wavelength I nm
Figure 1-10. Near-infrared emission scaled to show relative efficiencies of Ln(L)3phen in benzene where L= (—) DNM, (-")DBM S (—)TTFA.
Reproduced with permission o f the copyright owner. Further reproduction prohibited w ithout permission.

19
Photophysical Properties of Lanthanide Monoporphyrinates in Solution
Lanthanide porphyrins are markedly different in structure and optical properties
than lanthanide /m-P-diketonates. Figure 1-11 shows the structures of the lanthanide
complexes studied in the present work. Each complex synthesized by Tim Foley or
Alison Knefely has a lanthanide (Ln = Pr3+, Nd3+, Hq3+, Er3+, Tm3+, or Yb3+) coordinated
to the four pyrrole nitrogens of the TPP ligand. A monoanionic bidentate or tridentate
capping ligand completes the coordination sphere of the lanthanide ion. Summaries of
the absorption, luminescence and near-infrared quantum yields of the Ln(TPP)TP and
Ln(TPP)L(OEt) 3 complexes are presented in Table 1-6 and Table 1-7. All measurements
were carried out in methylene chloride.
Figure 1-11. Chemical structures of lanthanide tetraphenylporphyrin complexes with differing capping ligands where acac is acetylacetonate, TP is fra-pyrazoylborate, and L(OEt) 3 is (cyclopentadienyl)tra-(diethoxyphosphito-P)cobaltate).
Axial Ligand Effects on the Absorption Properties of Ln(TPP)L
The axial ligands of transition metal metalloporphyrins are known to affect the
metal’s electronic properties. 66 Thus, the effect of axial ligand on the spectroscopy of the
lanthanide porphyrins was examined. Figure 1-12 shows the absorption spectra of the
Ln(TPP)acac Ln(TPP)TP Ln(TPP)L(OEt)3
Reproduced with permission o f the copyright owner. Further reproduction prohibited w ithout permission.

20
Table 1-6. Photophysical properties of Ln(TPP)TP measured in CH2CI2 .Ln A,abs /nm (log e) A,em /nm NIR Opl
H o3+ 402s(4.55)423(5.69), 510(3.54), 552(4.27), 590(3.61), 627(3.32)
649, 715 ““
Pr3+ 402s(4.87), 425(5.71), 450(3.94), 482(3.40), 515(4.03), 554(4.31), 593(3.86), 649(3.49)
652,717
Tm3+ 402s(4.65), 423(5.80), 513(3.55), 551(4.43), 588(3.70), 626(3.28)
652,718 —
Nd3+ 402s(4.67),424(5.74), 516(3.66), 553(4.32), 592(3.76), 624(2.95)
651,717,882, 900, 932, 1069,1111, 1324, 1354
2.4 x 10‘ 3
Er3+ 402s(4.68), 422(5.60), 514(3.71), 551(4.21), 590(3.63), 648(3.30)
653,717, 1485, 1531 9 x 1 0 ' 4
Yb3+ 402s(4.85), 421(5.72), 513(3.58), 551(4.41), 588(3.77), 624(3.46)
652,718, 932, 954, 977,990, 1002, 1014, 1022, 1037
3 .2x1 O' 2
Quantum yields were measured relative to ZnTPP (® = 0.033, CH2CI2)
Table 1-7. Photophysical properties of Ln(TPP)L(OEt) 3 measured in CH2 CI2 .Xabs /nm (log s) A*m/nm NIR €>pl
Ho3+ 405s(4.63), 427(5.72), 519(3.58), 597(3.85), 626(3.40), 649(3.31)
614, 656,717 —
Pr3+ 409s(4.78), 428(5.81), 520(3.67), 561(4.32), 600(4.01)
656,717 --
Tm3+ 405s(4.62), 426(5.71), 517(3.48), 557(4.27), 595(3.76), 624(3.15)
611,655,717 --
Nd3+ 409s(4.69), 429(5.76), 520(3.57), 561(4.39), 600(3.93)
655,718, 829, 896, 947, 1069, 113, 1317, 1350, 1429
2 x 1 0 ‘3
Er3+ 406s(4.68), 427(5.68), 521(3.51), 558(4.34), 596(3.79), 625(3.06)
611,655,720,1480,1517,1537
1 x 1 0 ’3
Yb3+ 406s(4.60), 427(5.73), 521(3.67), 559(4.30), 596(3.76), 628(3.15)
612, 655, 719, 923, 956, 977, 1003, 1023, 1046
2.4 x 10' 2
Quantum yields were measured relative to ZnTPP (<D = 0.033, CH2CI2)
Reproduced with permission o f the copyright owner. Further reproduction prohibited w ithout permission.

21
ytterbium porphyrin complexes with the different axial ligands: acac, TP, and L(OEt)3 .
The absorption spectra exhibit the typical porphyrin features including the Soret band
(-420 nm) and the correspondingly weaker Q-bands (-500-600 nm). Upon coordination
of the lanthanide to the porphyrin, the Soret band shifts from 412 nm in the free base
porphyrin to -425 nm in the complex. Overall, the absorption spectrum resembles a
“regular” metalloporphyrin absorption spectrum such as Zn(TPP) . 6 7 The absorption
spectra of the acac and TP coordinated complexes are virtually identical. Coordination of
the L(OEt) 3 ligand does cause a 3 nm red shift in the absorption spectrum. A red-shift in
the metalloporphyrin absorption can indicate the basicity of the ligands coordinated to the
metal. Regardless, the capping ligand serves as an ancillary ligand with little affect on
perturbing the n electron system of the porphyrin ring.
1.0
Wavelength / nm0.2
0.03 0 0 4 0 0 5 0 0 6 0 0 7 0 0 8 0 0
W avelength I nm
Figure 1-12. Absorption spectra of Yb(TPP)L in methylene chloride. The axial ligand, L is acac (■••), TP (-••-), or L(OEt) 3 (—),
Metal Center Effects on the Absorption Properties of Ln(TPP)L
Unlike transition metals, which can greatly affect the absorption properties of
porphyrins, there is little change in the absorption bands between Ln(TPP)L complexes
Reproduced with permission o f the copyright owner. Further reproduction prohibited w ithout permission.

as the lanthanide metal is varied. Figure 1-13 and Figure 1-14 show the absorption
spectra of Ln(TPP)TP and Ln(TPP)L(OEt)3 where the lanthanide metal center is either
Er3+, Ho3+, Nd3+, Pr3+, Tm3+, or Yb3+. The absorption spectra of both ligand sets feature a
sharp intense absorption around 420 nm corresponding to the porphyrin Soret band and a
series of weaker absorbing Q bands between 500 and 650 nm. There is some variation in
the intensity of the Q-bands upon changing metal center. The ratio of the Q(1,0) (-550
nm) to Q(0,0) (-600 nm) does increase along the lanthanide series. No 4/-»4/transitions
were observed since the Soret band is five orders of magnitude more intense than typical
4f—»4f transitions. Thus, the lanthanide has little effect on the absorption properties of
the complex, and the porphyrin ligand plays the dominant role in controlling the optical
absorption properties of the complexes.
Near-Infrared Emission from Lanthanide Monoporphyrinates in CH2CI2
The near-infrared photoluminescence properties are noticeably different and varied
compared to the absorption properties. Figure 1-15 shows the near-infrared emission of
Yb(TPP)L compounds. The near-infrared region consists of a sharp peak at 977 nm with
additional broad bands of each side of the peak. In the broad peaks there are well defined
peaks observed near 930 nm for Yb(TPP)TP and slightly bluer for Yb(TPP)L(OEt) 3
while this feature appears as shoulder in Yb(TPP)acac. However, many of the low
energy features (>1000 nm) of Yb3+ emission are attenuated due to the low sensitivity of
the silicon based CCD detector. Figure 1-16 shows the PL emission of Yb(TPP)TP and
Yb(TPP)L(OEt) 3 recorded on an InGaAs detector which has improved sensitivity in the
near-infrared region.
Reproduced with permission o f the copyright owner. Further reproduction prohibited w ithout permission.

Mol
ar A
bsor
ptiv
ity
/ x
100,
000
M'1c
m
23
6
0.25 0.2550.20 0.20
4 0.15 0.15
0.10 0.10
30.05 0.05
2 0.00 0.00450 500 550 600 650
Wavelength / nm450 500 550 600 650
Wavelength / nm
1
0
60.25 0.25
5 0.20 0.20
0.15 0.15
40.10 0.10
3 0.05 0.05
0.00 0.00450 500 550 600 650
Wavelength / nm450 500 550 600 650
Wavelength / nm2
1
0
60.250.2550.200.20
4 0.150.15
0.100.10
30.050.05
0.00 0.002 450 500 550 600 650Wavelength / nm
450 500 550 600 650Wavelength / nm
1
o350 400 450 500 550 600 650 350 400 450 500 550 600 650
Wavelength / nm
Figure 1-13. Molar absorptivity of Ln(TPP)TP in CH2 CI2 where Ln is a) Er3+ b) Ho3+ c) Nd3+ d) Pr3+ e) Tm3+ f) Yb3+
Reproduced with permission o f the copyright owner. Further reproduction prohibited w ithout permission.

Mol
ar A
bsor
ptiv
ity
/ x
100,
000
M cm
24
60.250.25
5 0.200.20
0.150.154
0.100.10
3 0.050.05
0.000.00450 500 550 600 650
Wavelength I nm450 500 550 600 650
Wavelength / nm2
1
0
60.250.25
5 0.200.20
0.150.154
0.100.10
3 0.050.05
0.000.00450 500 550 600 650
Wavelength I nm450 500 550 600 650
Wavelength I nm2
1
0
60.250.25
50.200.20
0.150.1540.100.10
3 0.050.05
0.000.002 450 500 550 600 650
Wavelength / nm450 500 550 600 650
Wavelength I nm
1
o350 400 450 500 550 600 650 350 400 450 500 550 600 650
Wavelength I nm
Figure 1-14. Molar absorptivity of Ln(TPP)L(OEt) 3 in CH2 CI2 where Ln is a) Er3+ b) Ho3+ c) Nd3+ d) Pr3+ e) Tm3+ f) Yb3+
Reproduced with permission o f the copyright owner. Further reproduction prohibited w ithout permission.

25
0.8
0 .4
0.2
0.0
XW| 0 8 c
1 06«£ 0 .4
oc_j 0 2 Q.
0.0
0.8
0.6
0 .4 ■
0.2
0.05 0 0 6 0 0 7 0 0 8 0 0 9 0 0 1000 1100
Wavelength I nm
Figure 1-15. Visible and near-infrared emission of a) Yb(TPP)acac, b) Yb(TPP)L(OEt)3 , and c) Yb(TPP)TP in CH2 CI2 when excited at 420 nm.
The near-infrared quantum yields of Yb3+ porphyrins are generally higher than the
Yb3+ tm-p-diketonate complexes. While the near-infrared quantum yield of
Yb(TPP)acac is 1.6 x IQ'3 in CH2 C12, Yb(TPP)TP (<DPL - 3.2 x 10'2)and Yb(TPP)L(OEt)3
(Opl - 2.4 x 10' ) possess significantly higher quantum yields in solution than other many
Yb3+ porphyrin complexes reported in the literature, e.g. (Yb(benzoporphine) ® = 5 x
Reproduced with permission o f the copyright owner. Further reproduction prohibited w ithout permission.

26
10' 3 in benzene, x=12 psec).43* The higher quantum yield in solution is due to the steric
bulk introduced by the TP and L(OEt) 3 ligand preventing solvent from reaching the metal
center and deactivating the excited state. Still, the quantum yields are much lower than
unity showing that even with increased steric bulk non-radiative processes predominate
in excited state deactivation.
Pmc<DC_lQ.
900 950 1000 1050 1100Wavelength I nm
Figure 1-16. Near-infrared PL emission of Yb(TPP)TP (—) and Yb(TPP)L(OEt) 3 (—)in CH2 CI2 measured on an InGaAs detector. Excitation was at 420 nm and the emission slits were set at 5 nm band pass.
Additional emission peaks can be seen by recording the emission spectrum at
higher resolution. Figure 1-17 shows the photoluminescence of Yb(TPP)TP scanned at 5
nm resolution. It is apparent that the 2F5/2 —»2F7 /2 transition is actually composed of 8
different peaks. The positions of these peaks are shown in Table 1-8. Early
spectroscopic work into lanthanide P-diketonates deduced that the structured emission
originated from crystal field splitting effects which is calculated to be in the order of
hundreds of cm' 1 . 6 8 Variable temperature work by others has shown that the higher
*While the ligand in the axial position was not reported, chloride or an acteylacetonate ligands was
probably coordinated to Yb3+ based on other articles published by the authors.
Reproduced with permission o f the copyright owner. Further reproduction prohibited w ithout permission.

27
crystal field state can be thermally populated at room temperature when the lifetime of
the excited state is long enough. 53 ,69 Thus peaks 1 and 3 may originate from different
excited state energy levels but terminate to the same ground state energy level. This
means that the 2Vsa state is split into at least two levels of 500 cm ' 1 apart in energy.
However, this does not fully explain all the emission peaks observed since not all peaks
have a matching peak with an energy difference of 500 cm '1. For Yb3+ doped crystals,
the splitting of Yb3+ has been attributed to both crystal field and vibronic bands. 70 ,71
Thus, the origin of the low energy peaks may be a combination of crystal field effects and
coupling to Ln-N vibrational modes.
&'1ac_3CL
Figure 1-17. Photoluminescence of Yb(TPP)TP in CH2 CI2 upon 420 nm excitation at 5 nm resolution.
Table 1-8. Near-infrared peak positions of Yb(TPP)TP at 5 nm resolution._________Peak X(nm) v(cm ') Peak A.(nm) v(cm ')
1 932 10730
2 954 10480
3 977 10235
4 990 10100
5 1002 9980
6 1014 9860
7 1022 9780
8 1037 9640
1 0 5 09 0 0 9 5 0 1000
Wavelength I nm
Reproduced with permission o f the copyright owner. Further reproduction prohibited w ithout permission.

28
Visible Emission from Ln(TPP)L in CH2CI2
Excitation of the Ln(TPP)L complexes in the Soret or Q-bands of the complexes
resulted in both visible and near-infrared emissions as previously shown in Figure 1-15.
In the visible region from 600 to 750 nm, there are three emission bands. The weak (<&pl
< 10'5) visible fluorescence at 645 and 719 nm matches the visible fluorescence of
free-base tetraphenylporphyrin. 72 The excited state lifetime of 8 ns supports the
assignment that these two bands come from free TPP.
A weak emission band at 610 nm was observed in all the Ln(TPP)L(OEt) 3
complexes prepared as shown in Figure 1-18. The excitation spectra of all three emission
bands help identify the origin of each emissive transition. The excitation spectra of the
three visible emission peaks of Yb(TPP)L(OEt)3 , Er(TPP)L(OEt)3 , Ho(TPP)L(OEt)3 , and
Tm(TPP)L(OEt)3 are shown in Figure 1-19 through Figure 1-22. Comparison of the
Soret bands observed in the excitation spectra show that the 610 nm emissions are red
shifted 13 nm from the excitation spectra of the other emission bands. This is similar to
the UV-VIS absorption band shift that occurs when TPP is coordinated to a metal. Also,
the 720 nm band of Tm(TPP)L(OEt) 3 shows two peaks in the Soret region with a peak at
425 and 458 nm. This suggests that a more complex structure such as an aggregate is
emitting. Thus the visible emitting bands at 654 and 720 nm correspond to the presence
of a free base impurity while the emission band at 610 nm corresponds to emission from
the lanthanide porphyrin.
Under higher energy excitation, additional weak emission bands can be seen from
Ln(TPP)L. For example, Figure 1-23 shows emission bands from Ho(TPP)L(OEt) 3 upon
Reproduced with permission o f the copyright owner. Further reproduction prohibited w ithout permission.

excitation at 330 nm at 370 and 445 nm. The 445 nm emission band is the mirror image
of the Soret band absorption. Similar bands have been observed in Er(OEt)TPP and
Gd(TBP) complexes.41,73 In both cases, this transition has been ascribed to fluorescence
from the S2 —»So of the metalloporphyrin. Normally, S2 —»So emission is not observed in
organics because the non-radiative rate for S2 - 4 S1 is large. However, S2 -»So can be
observed if the radiative rate of the transition and/or the energy gap between S2 and Si is
large. For example, S2 —»So emission was observed in Zn(TBP) with a radiative rate of
1.5 x IQ9 sec'1 and has been described as a n->n* excited state based on emission
polarization studies.74,75 Therefore it is reasonable to conclude that the band at 445 nm is
S2 —»So emission from the metalloporphyrin ring.
5 0 0 5 5 0 6 0 0 6 5 0 7 0 0 7 5 0 6 0 0 5 5 0 6 0 0 6 5 0 7 0 0 7 5 0
W avelength I nm W avelength / nm
Figure 1-18. Visible emission of Ln(TPP)L(OEt) 3 in CH2 CI2 upon 420 nm excitation.Ln is a) Er3+ b) Ho3+ c) Tm3+ and d) Yb3+.
Reproduced with permission o f the copyright owner. Further reproduction prohibited w ithout permission.

30
300 350 400 450 500 550 600 650
X- 610 nm
Ramanscattering
X em. 654 nm
mcoc
300 350 400 450 500 550 600 650
Wavelength I nm
Figure 1-19. Excitation spectra of Yb(TPP)L(OEt) 3 in CH2 CI2 .
Reproduced with permission o f the copyright owner. Further reproduction prohibited w ithout permission.

31
300 350 400 450 500 550 600 650
Ramanscattering
Km- 6 5 4 nm
£mca>c
A-em: 720 nm
300 350 400 450 500 550 600 650
W avelength / nm
Figure 1-20. Excitation spectra of Er(TPP)L(OEt) 3 in CH2 CI2 .
Reproduced with permission o f the copyright owner. Further reproduction prohibited w ithout permission.

32
300 350 400 450 500 550 600 650 700
^ em: 610 nm
X em: 654 nm
"3c0 )C
A,em: 720 nm
300 350 400 450 500 550 600 650 700
Wavelength I nm
Figure 1-21. Excitation spectra of Ho(TPP)L(OEt) 3 in CH2 CI2 .
Reproduced with permission o f the copyright owner. Further reproduction prohibited w ithout permission.

33
300 350 400 450 500 550 600 650 700
X- 610 nm
X' 655 nm
>»"mcfl>■«-«c
300 350 400 450 500 550 600 650 700
Wavelength / nm
Figure 1-22. Excitation spectra of Tm(TPP)L(OEt) 3 in CH2 CI2 .
Reproduced with permission o f the copyright owner. Further reproduction prohibited w ithout permission.

34
mc3jaL _(0 0.8
£mc®c
0.6
0.4c0w 0.2 w
1
w 0.0360 380 400 420 440 460 480 500
Wavelength I nm
Figure 1-23. Visible emission from Ho(TPP)L(OEt) 3 upon 330 nm emission. Additional bands were observed at 653 and 719 nm as described previously.
The identity of the emission feature at 370 nm is unknown. Others who have made
similar observations have suggested in the case of Ln(TBP)acac and Er(OEt)TPP that it is
phosphorescence from the coordinate 1,3-diketone, such as 1,3-pentadione. 7 3 ’76 Since the
L(OEt) 3 ligand also possesses a small conjugated ring, it would seem reasonable to
conclude that the phosphorescence of the L(OEt) 3 ligand would be in UV region.
However, the absorption of cobalt cyclopentadiene dicarbonyl complexes absorb at 370
nm and thus phosphorescence from L(OEt) 3 would be unexpected.
Solvent Effects on Near-Infrared Quantum Yield of Yb(TPP)L
Solvents can play a significant role in the optical properties of compounds, and so
the solvent effects on the absorption and emission properties of lanthanide TPP
complexes were examined. The absorption properties of Yb(TPP)acac and Yb(TPP)TP
are similar in various solvents. For both complexes the Soret peak gradually red-shifts
Reproduced with permission o f the copyright owner. Further reproduction prohibited w ithout permission.

35
six nanometers when the solvent changes from CH3CN to THF to CH2 CI2 to toluene, and
finally to DMSO.
While the absorbance of Yb(TPP)acac varies by a few nanometers in different
solvents, the solvent used have a more prominent effect on the near-infrared PL quantum
yield of Yb(TPP)acac and Yb(TPP)TP. Table 1-9 shows the quantum yields of
Yb(TPP)acac and Yb(TPP)TP in several solvents. Generally, the quantum yields are low
(< 1 0 %) because not only solvents but other non-radiative pathways deactivate the excited
state. While solvents do play a role in deactivating the excited state, there was no
correlation found between the number of C-H or O-H bonds of the solvent molecule and
the photoluminescence quantum yield. Yb(TPP)acac photo luminescence appears more
efficient in polar coordinating solvents such as DMSO as opposed to Yb(TPP)TP which
has higher photoluminescence quantum efficiencies in non-polar, non-coordinating
solvents such as CH2 CI2 and toluene.
Table 1-9. Solvent effects on the near-infrared quantum yields of Yb(TPP)acac andYb(TPP)TP.
Solvent Yb(TPP)acac 0>PL(%) Yb(TPP)TP <J>PL (%)
Toluene 0.14 5.3
Acetonitrile 0.39 1.3
Methanol 0.14 —
CH2 CI2 0.16 3.2
Acetone 0.43 —
THF 0.77 0.79
DMSO 2 . 1 2 . 0
Since the lanthanide is positioned above the ring of the porphyrin center, there
remain several coordination sites where a solvent molecule can access the lanthanide ion.
Yb(TPP)acac has a relatively small axial ligand which may allow trace amounts of water
Reproduced with permission o f the copyright owner. Further reproduction prohibited w ithout permission.

36
present in the solvent to coordinate with the lanthanide metal center, which in turn lowers
the radiative quantum yield. Coordination of water is known to play a role in
deactivating the excited states of lanthanide ion by coupling to non-radiative O-H
vibrational modes. However, in coordinating solvents, the solvent displaces the water
thus removing the O-H oscillators from the proximity of the lanthanide therefore
lowering the non-radiative rate.
Coordination of O-H and C-H oscillators to the lanthanide ion will increase the
non-radiative rates of the lanthanide excited states particularly as the energy of the
near-infrared transitions decrease. This is because the non-radiative rate increases
exponentially as the energy gap decreases. Using Siebrand’s approach for deriving the
energy gap law for lanthanides, the non-radiative rate can be found using equation 1-4. 77
k. = ' 2 ^Pn, NpJ M p 6 ) p
v 2ft ,FP 1-4
In equation 1-4, pm is the density of final vibrational states, J is the electronic
coupling constant due to nuclear motion, Mp C0 p/2 ft measures the coupling to the
promoting modes, Np is the number o f modes and Fp is the Frank-Condon factor. The
Frank-Condon factor can be described by equation 1-5.
exp(-—kA2)(— kA2)u F F 2 2 1-5
p ' v!
Reproduced with permission o f the copyright owner. Further reproduction prohibited w ithout permission.

37
In equation 1-5, A: is a constant, A is the difference in positions of the final and
initial vibrational states and u is composed of the energy between two states, AEo and
maximum the oscillator of highest energy, o)max as shown in equation 1 -6 .
M o ,v = ------ 1 1 - 62 h m „
Using Sterlings’ approximation to expand the factorial in equation 1-5 and the
approximations described by van Dijk and Schuurman for energy gaps o f lanthanides
corresponding to 1 to 3 vibrational quanta of the host, the non-radiative rate can be
expressed by equation 1-7.
K = fi exp[-(A£ 0 - 2ho)m3x)a] 1 -7
The a and J3 terms vary little between hosts. Thus, as the radiative energy gap
decreases, the non-radiative rate increases exponentially. Figure 1-24 shows that the
infrared emissive transitions of Yb3+, Nd3+, and Er3+ are within 2 to 3 vibrational quanta
of common organic bonds. Therefore, it is not surprising that the quantum yields are low
and the use of C-H bonds may limit greatly improving the quantum yields o f these ions.
From Figure 1-24 it is clear that solvents containing O-H bonds will rapidly
deactivate the excited states of the lanthanides. Since the lanthanide center is well
shielded in Yb(TPP)TP by the TPP and TP ligand, water cannot readily access the
excited lanthanide ion. Thus the PL quantum yield of Yb(TPP)TP in non-polar,
non-coordinating solvents is larger compared to Yb(TPP)acac. However, the quantum
Reproduced with permission o f the copyright owner. Further reproduction prohibited w ithout permission.

38
yields of the two complexes remain approximately the same in coordinating solvents.
Therefore, the use of bulky ligands should help to improve the photoluminescence
quantum efficiencies of near-infrared emitters, particularly in polar environments such as
biological systems.
o
-2000
- 4 0 0 0
° - 6 0 0 0
141° - 8 0 0 0
Lif-10000
-12000
- 1 4 0 0 0
Figure 1-24. Representation of the radiative transition energies of Yb3+, Nd3+, and Er3+ and the vibrational energies of common bonds found in organic systems.
Near-Infrared Emission from Other Lanthanide Porphyrin Emitters
Figure 1-25 shows the 4 Ii3/2 —>4 Iis/2 Er3+ transition of Er(TPP)TP and
Er(TPP)L(OEt)3 . Some structure is observed in the Er3+ emission which may be due to
crystal field splitting effects. The emission is similar in shape to other Er3+ PL emissions
reported however the low energy side appears attenuated. This is probably due to the fall
off in sensitivity of the InGaAs detector. For Er(TPP)TP there are two peaks at 1485 and
1531 nm. No other Er3+ based emission was observed from the 760-1600 nm.
Neodymium emission in the near-infrared was observed from the Nd(TPP)TP
complex. Figure 1-26 shows the near-infrared PL emission of Nd(TPP)TP in CH2 CI2 . In
Zjp 4 p 4i5/2 3/2 13
V = 1
v = 2
v = 3 —
_i___________1___________1___________L-
Yb Nd Er O-H C-H C-D C -0 C-C
Reproduced with permission o f the copyright owner. Further reproduction prohibited w ithout permission.

39
1 4 0 0 1 4 5 0 1 5 0 0 1 5 5 0
W avelength I nm
Figure 1-25. Near-infrared emission of a) Er(TPP)TP and b)Er(TPP)L(OEt) 3 in CH2 CI2
upon exciting at 420 nm uncorrected for detector response.
2 *(0c<u«w»c
CL
9 0 0 1 0 0 0 1 1 0 0 1 2 0 0 1 3 0 0 1 4 0 0 1 5 0 0
W avelength I nm
Figure 1-26. Near-infrared emission of Nd(TPP)TP in CH2 CI2 upon exciting at 420 nm.
Reproduced with permission o f the copyright owner. Further reproduction prohibited w ithout permission.

40
solution, three transitions are observed from Nd3+: 4p 3/2—»4In /2 (890 nm), 4F3/2-»4Ii3/2
(1060 nm), 4F3/2->4Ii5 /2 (1340 nm).
No photoluminescence near-infrared emissions from Tm(TPP)L, Ho(TPP)L, or
Pr(TPP)TP have been observed in solution or in the solid state.
Transient Absorption Spectroscopy of Ln(TPP)L Complexes
Kachura and co-workers examined the transient absorptions (TA) of several
lanthanide containing tetra(p-tolyl)porphyrin (TTP)39 and benzoporphyrin (TBP)
complexes.41 From their observations, they divided the lanthanides porphyrin complexes
into three different classes based on their transient absorptions. The first class consisted
of lanthanides which cannot accept energy from the porphyrin ligand, i.e. Gd3+ and Lu3+.
The TA of these complexes mimicked the transient profile of Zn(TTP),78 Therefore, the
long-lived (30 psec) and broad transient from 600-800 nm which is observed is assigned
to triplet-triplet absorption of the TTP ligand. The second class consisted of lanthanides,
Tm3+, Dy3+, Ho3+, and Er3+, which can accept energy from TTP. This class of complexes
is characterized by short-lived transient absorptions (<2 nsec). The third class is Yb3+
coordinated to TTP which has a long lived transient that equals the 2F 5/2-»2F7/2 emission
lifetime of Yb(TTP)acac. Yb(TTP)acac complexes also differ from other lanthanide
complexes because of the derivative shaped TA observed in the Q-bands region.
However, no satisfying explanation was given by the authors to explain the long-lived
transient absorption of the Yb complexes.
Transient absorption spectra for Yb(TPP)L and Nd(TPP)TP measured in
argon-degassed CH2 CI2 are shown in Figure 1-27. The transient absorptions of
Yb(TPP)TP, Yb(TPP)L(OEt)3, and Nd(TPP)TP all show a bleaching of the Soret band at
Reproduced with permission o f the copyright owner. Further reproduction prohibited w ithout permission.

41
420 nm (not shown) and a net absorption around 440 nm. The transient lifetimes for the
-3 .Yb porphyrin complexes are x = 57 psec. The Q-band region shows a
derivative-shaped TA. The transient absorption of Nd(TPP)TP is also similar in profile
and lifetime to the Yb3+ analogs. Interestingly, the lifetime of Yb(TPP)L(OEt) 3 of 40
psec is within a factor of 2 of the transient absorption lifetime. Thus, transient absorption
spectroscopy may at least for Yb3+ complexes provide a way of estimating the lifetime of
the Yb3+ excited state. Besides Nd3+ and Yb3+ porphyrin complexes, no transient
absorptions in the nanosecond timescale were detected for Er(TPP)L, Tm(TPP)L, and
Ho(TPP)L.
In all cases, coordination of a lanthanide to TPP results in rapid intersystem
crossing of the So~»Ti state of TPP followed by energy transfer to the lanthanide.
Er(TPP)L, Tm(TPP)L, and Ho(TPP)TP showed no long lived TA indicating that once the
energy transferred to the lanthanide, it was rapidly deactivated by vibrational relaxation.
This is reasonable since all three lanthanides have transitions that are roughly equal to a
C-H bond vibration: Er3+ (4I1I/2->4Ii3/2 , 3700 cm'1), Tm3+ (3H4 ~>3H5, 4300 cm'1), and
Ho3+ (5I6—>sI7, 3500 cm'1). The TA of Yb(TPP)L and Nd(TPP)L complexes all show a
long lifetime and derivative shaped region between 600-800 nm. While an electron
transfer mechanism involving a Yb3+/Yb2+ redox process has been postulated to explain
puzzling results for Yb3+ sensitization, Nd3+, which cannot be reduced, also shows a TA
absorption similar to Yb(TPP)L complexes.79 Thus electron transfer cannot account for
the observed behavior. Yb3+ or Nd3+ in their respective excited states may simply be
exerting a different electronic influence of the % electron system of the porphyrin which
Reproduced with permission o f the copyright owner. Further reproduction prohibited w ithout permission.

42
would account in a shift in the absorption of the excited lanthanide porphyrin complex
rather than bleaching of the absorption upon laser excitation.
0 2 0
0 1 5
0 1 0
0 0 5
0 0 0
0 0 5
0 1 0
0 0 4
0 0 0
0 0 4
0 0 8
0 6
0 4
02
00
02
4 5 0 500 5 5 0 6 00 6 5 0 7 0 0 7 5 0W a v e l e n g t h / n m
Figure 1-27. Transient absorptions of Ln(TPP)L. a) Yb(TPP)L(OEt) 3 (Transients are 8 psec after laser pulse) b) Yb(TPP)TP (Transients are 8 psec after laser pulse) c) Nd(TPP)TP (Transients are 16 psec after laser pulse). The first transient was recorded immediately after the laser pulse. All measurements were made in argon degassed CH2 CI2 .
Reproduced with permission o f the copyright owner. Further reproduction prohibited w ithout permission.

43
Conclusion
Lanthanide complexes containing Yb3+, Nd3+, and Er3+ have been shown to
photoluminescence in the near-infrared. In general, lanthanide tetraphenylporphyrin
complexes have higher near-infrared quantum yields than their P-diketonate analogs. The
porphyrin ligand plays the lead role in controlling the absorption properties o f the
complexes while the lanthanide directs the emissive properties by accepting energy from
the porphyrin ligand and generating near-infrared luminescence.
Improvement of the near-infrared quantum efficiency is achieved by effectively
protecting the metal center from the surrounding environment. While not significantly
affecting the absorption properties, the TP and L(OEt) 3 capping ligand serve to
effectively shield the metal center from coordinating water resulting in improved
near-infrared quantum yields for Yb complexes on the order of 2 to 3 percent. In the
future the near-infrared efficiency could be further improved if synthetic efforts are taken
to remove C-H bonds from close proximity to the lanthanide ion such as deuteration or
fluorination of the porphyrin and capping ligands.
Experimental
All photophysical studies were conducted in 1 cm square quartz cuvettes unless
otherwise noted. All absorption, emission, and lifetime measurements were made in
CH2C12 unless otherwise noted. Absorption spectra were obtained on a double-beam
Cary-100 UV-visible spectrometer. Fluorescence spectra were measured on a SPEX
Fluorolog-2 equipped with a water-cooled PMT detector or on a spectrometer consisting
of an ISA-SPEX Triax 180 spectrograph equipped with a liquid N 2 cooled CCD detector
(Hamamatsu CCD, EEV 1024x128 pixel, 400-1 lOOnm). Near-infrared measurements
Reproduced with permission o f the copyright owner. Further reproduction prohibited w ithout permission.

were measured on a SPEX Fluorolog-2 equipped with an LN2 InGaAs detector
(800-1600nm). All measurements were corrected for detector response. Emission
quantum yields for the Yb complexes were measured by relative actinometry against
H2TPP (0=1.1 x 10'1, CH2C12) or ZnTPP (0= 3.3 x 10'2, CH2C12). For the near-infrared
emitters beyond 1,000 nm, Yb(TPP)TP was used as the standard (<t>=3.2 x 10'2,
CH2Cl2).Time-resolved emission decays were obtained by time-correlated single photon
counting on an instrument that was constructed in-house. Excitation was effected by
using either a pulsed LED source or a blue-pulsed diode laser (IBH instruments,
Edinburgh, Scotland). The pulsed LED and diode laser sources have pulse widths of ca.
1 ns. Time-resolved emission was collected using a red sensitive, photon-counting PMT
(Hamamatsu R928), and the light was filtered using 10 nm band-pass interference filters.
Lifetimes were determined from the observed decays by using fluorescence lifetime
deconvolution software. Nanosecond transient absorption spectra measurements were
obtained on previously described instrumentation,80 with the third harmonic of a
Nd:YAG laser (355 nm, 10 ns fwhm, 5 mJ pulse'1) as the excitation source. Samples
were thoroughly degassed with argon. Primary factor analysis followed by first order
(A-» B) least-squares fits of the transient absorption data was accomplished with
SPECFIT global analysis software (Spectrum Software Associates).
Reproduced with permission o f the copyright owner. Further reproduction prohibited w ithout permission.

CHAPTER 2NEAR-INFRARED EMISSION FROM LANTHANIDE COMPLEXES BLENDED
INTO CONJUGATED POLYMER FILMS
Background
Intense efforts have been put forth to understand energy transfer processes in
polymers such as saturated polymer backbones with pendent chromophores,81,82 polymers
with main-chain polychromophores, ' and fully conjugated polymers ' . Also, there
is increasing interest in studying the energy transfer processes in conjugated polymers
and in blends of small molecules with conjugated polymers93 such as poly(phenylene
vinylenes),94 poly(phenylene ethynylenes)95 and poly(p-phenylenes).96 With a greater
understanding of the energy transfer properties these blend systems can be a useful guide
for their use in electroluminescent devices.
Small molecules have also been blended with conjugated polymers in order to tune
the electroluminescent (EL) emission wavelengths and improve EL device efficiencies.
In these applications, the role of the conjugated polymer is to transport charge and funnel
energy to the dopant. This idea has been used by McGehee et. al. by blending europium
trA-J3-diketonates in a cyano derivitized poly(p-phenylene) (PPP-CN).97 Using the
concept of spectral overlap of the PPP-CN emission with the absorption of the europium
complex, they showed that energy transfer from polymer to lanthanide complex occurs.
Expanding on this idea, we have carried out investigations in which a series of near-
infrared emitting lanthanide tm-p-diketonates and monoporphyrinates were blended with
45
Reproduced with permission o f the copyright owner. Further reproduction prohibited w ithout permission.

alkyl or alkoxy substituted poly (p-phenylenes). The structures of these materials used are
shown in Figure 2-1. Before preparing electroluminescence devices using the
polymer/lanthanide blends, blends were prepared where the energy transfer from the
polymer to the lanthanide complex could be monitored by quenching of the PPP
fluorescence and the resulting sensitization of the lanthanide luminescence by the
polymer. These photoluminescence-based experiments served as a guide for determining
the concentrations of the lanthanide complexes to be blended into the conjugated polymer
for fabricating near-infrared emitting electroluminescent devices. This chapter provides
an overview of this work where we fully characterized the UV, visible, and near-infrared
PL properties of spin-coated thin films consisting of conjugated polymers blended with
various types can concentrations of lanthanide complexes.
The two conjugated poly(p-phenylenes) used in this work have the same backbone
structure but differ in the side chain that is directly bonded to the backbone. For PPP-
R10 and PPP-OR11, the first atom of the 10 and 11 atom-long side chain is carbon and
oxygen, respectively. The absorption and fluorescence properties of the two polymers in
chloroform are shown iri Figure 2-2. The alkyl substituted PPP-R10 has an absorption
maximum at 310 nm and the emission maximum peaks in the UV at 370 nm. For PPP-
OR11, the absorption maxima occur at 290 and 340 nm with a fluorescence maximum at
410 nm. The red-shift in the absorption and fluorescence of PPP-OR11 relative to PPP-
R10 indicates that the HOMO-LUMO gap (i.e. the band gap) is small in the former.
Comparative studies of 2,5-dialkyl and 2,5-dialkoxy poly(p-phenylene) have shown that
regardless of the nature of the length («-C4 , n-C%, n-Cn, i-Cs) the electronic properties of
OSthe polymer depend on the atom directly attached to the backbone. Thus, the HOMO-
Reproduced with permission o f the copyright owner. Further reproduction prohibited w ithout permission.

47
o\W
o
PPP-R10 P P P -0R 11
iV . _
Ln(DBM)3batho
Ln(TPP)TP
-O '
\
ao P -EtO .C o p-OEtEtO^\ EtO J /O E t/
~ P 0
Ln(TPP)L(OEt)3
Figure 2-1. Structures of the conjugated poly(p-phenylene) polymers and the lanthanide complexes blended into the polymers.
LUMO gap decreases in energy from dialkyl to dialkoxy substitution has been explained
in terms of increased planarity in the dialkoxy-substituted polymer resulting from
reduced steric hindrance between phenylene rings bearing ether linkages relative to rings
carrying alkyl linkages. This explanation has also been used to explain observations in
polymers containing 1,4-bis(2-thienyl)phenylene and 1,4-bis(2-furanyl)phenylene repeat
units." Also for PPP-OR11, the electron-donating oxygen atoms serve to raise the
Reproduced with permission o f the copyright owner. Further reproduction prohibited w ithout permission.

48
energy of the highest occupied molecular orbital (HOMO) thus decreasing the energy gap
of the polymer. The difference in the band gap between PPP-OR11 and PPP-R10, which
results in a significant difference in fluorescence wavelength, affords the opportunity to
use these two polymers in comparative studies of energy transfer to lanthanide
complexes. Specifically, we are able to examine the effect of spectral overlap between
the polymer fluorescence and the lanthanide complex absorption on the energy transfer
exchange.
Lanthanide tro-p-diketonates were used because their absorption properties have
some spectral overlap with the fluorescence of the PPP polymers, particularly PPP-R10.
Therefore, energy transfer from polymer to lanthanide complex is expected to occur. In
addition, P-diketonates are known to sensitize the emitting states of europium, which
emits in the visible region, thus it was expected that these ligands could also sensitize the
near-infrared emission energy states of other lanthanides.
Energy Transfer between Conjugated Polymers and Visible Emitting Lanthanide Complexes in Polymer Blends
In initial experiments, visible emitting europium tm-P-diketonate complexes were
blended into the conjugated polymers. While we waited for the arrival of an InGaAs
detector that could be used for near-infrared measurements, these measurements were
carried out on a spectrophotometer that operates only in the UV and visible. This
approach provided us with the advantage of being able to simultaneously monitor
quenching of the polymer emission and sensitization of the lanthanide complex. This
allows one to easily compare the relative photoluminescence (PL) efficiencies of the
emitting species in the film.
Reproduced with permission o f the copyright owner. Further reproduction prohibited w ithout permission.

49
8cffi€01=ffioz
u.
5 0 03 0 0 3 5 0 4 0 0 4 5 0 5 5 0
W avelength I nm
Figure 2-2. Absorbance (solid line) and fluorescence (dashed line) of a) PPP-R10 and b) PPP-OR11 in chloroform.
Films were prepared by first dissolving the polymer into chloroform and dividing
the stock solution into five separate vials. To four of the vials, aliquots of varying size of
the Eu(DBM)3batho complex (concentration ~3 mM), also dissolved in chloroform, were
pipetted into the polymer solution. Each of the resulting solutions was spin cast at 1000
rpm onto quartz slides. Quartz slides were used because the absorption of PPP-R10
would be obscured by the absorption of borosilicate glass which absorbs strongly below
300 nm. Concentrations used relate the number of molar equivalents of lanthanide
complex relative to the molar equivalents of the polymer repeat unit.
Reproduced with permission o f the copyright owner. Further reproduction prohibited w ithout permission.

50
The absorption spectra of the lanthanide polymer blends, corrected for absorption
of the quartz substrate, are shown in Figure 2-3. For PPP-R10 a single absorption band
corresponding to the transition of the polymer is observed at 311 nm. However,
below this wavelength, the absorption of the quartz attenuates the absorption signal and
consequently additional polymer absorption features below 300 nm could be discerned.
When the concentration of the lanthanide complex reaches 5 mol%, a new absorption
band appears at approximately 360 nm. This absorption band corresponds to the n->n*
absorption band of the DBM ligand.
The photoluminescence of these films upon excitation at 315 nm are shown in
Figure 2-4. Excitation at 315 nm was chosen because it gave the highest PL signal
intensity, since the intensity of the xenon excitation lamp decreases sharply below this
wavelength. As Eu(DBM)3batho is blended into the film, the PPP-R10 fluorescence
centered at 380 nm decreases and a series of peaks, the most intense of which is centered
at 612 nm, appear in the 550-700 nm region. These new peaks correspond to the
5Do-»7Fn transitions of Eu3+, where n is 0 to 4. Quenching of the polymer fluorescence
and emergence of the lanthanide emission upon increased lanthanide concentration
indicates energy transfer from the polymer to the lanthanide is occurring in these polymer
blends.
This premise is confirmed by the PL excitation spectra while monitoring the
5Do—»7F2 transition of Eu3+. Figure 2-5 shows the excitation spectra of Eu(DBM)3batho
in the solid state and Eu(DBM)3batho blended with PPP-R10 at a loading of 10 mol%.
The polymer blend shows a blue shift of the Eu(DBM)3batho n—>jc* absorption transition
which suggests the polymer decreases the tc- t i stacking between the lanthanide
Reproduced with permission o f the copyright owner. Further reproduction prohibited w ithout permission.

51
complexes. In addition, a new band at 330 nm is seen in the excitation spectrum (see
arrow in Figure 2-5) which corresponds to the ji—»ti* absorption band of PPP-R10. This
band is significant because it demonstrates that light absorbed by the polymer results in
light emission from Eu3+, which proves that energy transfer occurs.
0.7
0.6
0.5Q>O§ 0.4*S8 0.3* »,
0.1
0.0450 500300 350 400
Wavelength I nm
Figure 2-3. Absorption of films on quartz substrates of 0, 1, 2, 5, and 10 mol% ofEu(DBM)3batho blended into PPP-R10. The absorbance at 370 nm increases with increases concentration of the lanthanide complex.
mao
&c
2.5e+6
2.0e+6
1.5e+6 -
— 1,0e+6 -c.2"m% 5.0e+5
0.0400 600 700500
Wavelength I nmFigure 2-4. Emission of polymer films that contain 0, 1,2, 5, and 10 mol%
Eu(DBM)3batho in PPP-R10 upon excitation at 315 nm. PPP-R10 fluroescence at 380 nm decreases and the Eu3+ emission increases at 612 nm with increasing dopant concentration.
Reproduced with permission o f the copyright owner. Further reproduction prohibited w ithout permission.

52
£mc5cco
300 350 400 450 500
Wavelength I nm
Figure 2-5. Normalized excitation spectra of 5Do~»7F2 of Eu(DBM)3batho (solid line) and PPP-R10 film containing 10 mol% Eu(DBM)3batho (dashed line).
Next, we examined films that contained Eu(DNM)3phen blended into PPP-R10.
Because of the more extended n electron system of the DNM ligand relative to DBM,
Eu(DNM)3phen has a lower energy absorption than the DBM analog. This affords
improved greater spectral overlap between the PPP-R10 fluorescence and the
Eu(DNM)3phen absorption and based on Forster energy transfer theory, improved
spectral overlap is expected to lead to more efficient energy transfer. These films were
prepared in a similar manner to the blended films of Eu(DBM)3batho including spin
casting onto quartz substrates. Figure 2-6 shows the absorption spectra of these films. In
these films, the DNM absorption at 370 nm is also detectable at 5 mol% concentration.
Figure 2-7 shows the emission spectra of these films upon excitation into the
polymer 7r—>7t* band at 315 nm. As Eu(DNM)3phen is blended into the film, the PPP-
R10 fluorescence centered at 380 nm is quenched and the characteristic emission peaks
of Eu3+ appear in the 550-700 nm region. Nearly complete quenching of the PPP-R10 PL
occurs when the Eu(DNM)3phen concentration is 10 mol%. Although, Eu(DNM)3phen
Reproduced with permission o f the copyright owner. Further reproduction prohibited w ithout permission.

53
quenches PPP-R10 fluorescence more effectively than Eu(DBM)3batho, the Eu3+
emission from 10 mol% Eu(DNM)3phen blended into PPP-R10 is only about one-half of
the intensity of the same concentration of Eu(DBM)3batho in PPP-R10. The decreased
PL intensity is due to the lower quantum efficiency of Eu(DNM)3phen compared to
Eu(DBM)3batho.
0.7
0.6
0.5sS 0.4 €3 0.3
*
0.0300 350 450 500400
Wavelength I nm
Figure 2-6. Absorption of spin cast films on quartz substrates of 0, 1, 2, 5, and 10 mol% ofEu(DNM)3phen blended into PPP-R10. The absorbance at 370 nm increases with increases concentration of the lanthanide complex.
Excitation spectra of the Eu(DNM)3phen/PPP-R10 films show a band at 320 nm
arising from PPP-R10 indicating that energy transfer from the polymer to the lanthanide
complex occurs (See arrow in Figure 2-8). Compared to the neat metal complex film, the
Eu complex-polymer blend shows a slight blue shift of the Eu(DNM)3phen n->n*
transition. This is not surprising since the polymer likely decreases aggregation of the
complex by effectively diluting its concentration. Interestingly, the relative intensity of
the polymer band to the Eu band in the excitation spectrum decreases as the concentration
ofEu(DNM)3phen increases. A change in the ratio is expected, since absorption by the
Reproduced with permission o f the copyright owner. Further reproduction prohibited w ithout permission.

54
lanthanide increases as loading increases. There is also a small red-shift in the PPP-R10
band when the concentration is greater than lmol%. However, it blue shifts again at 10
mol%. This may indicate that the Eu complex induces a morphology change in the
polymer as the dopant concentration changes.
2.5e+6
(0Q.o 2.0e+6
1.5e+6
cc 1.0e+6 O'5mg 5.0e+5m
o.o350 400 450 500 550 600 650 700
Wavelength I nm
Figure 2-7. Emission of polymer films that contain 0, 1, 2, 5, and 10 mol%Eu(DNM)3phen in PPP-R10 upon excitation at 315 nm. PPP-R10 fluorescence at 380 nm decreases and the Eu3+ emission increases at 612 nm with increasing dopant concentration.
cScI
z300 350 400 450 500 550
Wavelength I nmFigure 2-8. Normalized excitation spectra of 5Do—»7F2 emission of 1% (••■) 2% (—), 5%
and 10% (— —) Eu(DNM)3phen in PPP-R10. In addition a neat film ofEu(DNM)3phen (solid line) was inspected. The new band at 330 nm which is seen in the polymer blends but not in pure Eu(DNM)3phen, indicates that polymer to lanthanide energy transfer occurs.
Reproduced with permission o f the copyright owner. Further reproduction prohibited w ithout permission.

55
Near-Infrared Emission from Lanthanide fm-P-Diketonates Complexes Blended in PPP-R10 Films
In the work described in the preceding sections, we demonstrated that visible
emitting lanthanide complexes to participate in energy transfer from poly(phenylene)
polymers. By analogy it was expected that PPP-R10, or PPP polymers in general, could
be blended with near-infrared emitting lanthanide complexes to sensitize long wavelength
emission. In an effort to address this issue a series of blends were prepared in which
near-infrared emitting lanthanide tra-P-diketonate complexes at 10 mol% concentration
were blended with PPP-R10. The photoluminescence of spin cast films of the blends was
examined by exciting at 315 nm. The PPP-R10 fluorescence was efficiently quenched by
the lanthanide complexes and resulted in sensitization of the lanthanide-based emission.
Figure 2-9 shows the near-infrared emission spectra of PPP-R10 films that contained 10
mol% Ln(DNM)3phen.
Near-infrared emission was observed for Er3+ at 1520 nm (4Ii3/2 —>4Ii5/2) and Yb3+ at
977 nm (2Fs/2 -»2F7/2 ). Three near-infrared transitions of Nd3+ were observed at 880,
1060, and 1333 nm which correspond to the 4F3/2—»4113/2, and 4F3/2—>4Ii5/2,
respectively. Figure 2-9b shows the near-infrared emission from Nd(DBM)3phen, and
Nd(DNM)3phen. From the graph it can be seen that the diketonate ligand does not
perturb the emission energy of Nd3+ however, the PL from DBM complex films is more
intense, suggesting that the quantum efficiency is higher for this complex. The greater
quantum efficiency of the PL from the Nd(DBM)3phen films must arise because of
Nd(DBM)3phen higher PL quantum yield and not Forster energy transfer from PPP-
OR11 because spectral overlap is poorer in the Nd(DBM)3phen/PPP-ORl 1 blends than
Nd(DNM)3phen/PPP-Rl 0 blends.
Reproduced with permission o f the copyright owner. Further reproduction prohibited w ithout permission.

56
0 .0 0 5
0 .0 0 4
£ 0 .0 0 3
0.002
0.000
1 4 0 0 1 4 5 0 1 5 0 0 1 5 5 0 1 6 0 0
Wavelength / nm
0 .0 7
0 .0 6
£-■ | 0 .0 5
J 0 .0 4
. 2 0 .0 3
8E 0.02 UJ
0.01
W avelength / nm
0.001000 1200 1 4 0 0
Wavelength I nm0.6
0.5£(Acac
0 .4
0.3co"35(AEUJ
0.09 0 0 950 1000 1 0 5 0 1100 1 1 5 0
Wavelength I nm
Figure 2-9. Near-infrared emission from spin-coated films of 10 mol% blends of the lanthanide complex with PPP-R10. a) Er(DNM)3phen b) Nd(DNM)3phen (—) and Nd(DBM)3phen (—) and c) Yb(DNM) 3phen upon excitation at 327nm.
Reproduced with permission o f the copyright owner. Further reproduction prohibited w ithout permission.

57
Blends of Pr(DNM)3phen in PPP-R10 did not exhibit detectable near-infrared
emission at 1000 or 1300 nm, even though complete quenching of the polymer emission
occurred. This was surprising since Pr(DNM)3phen in CH2 CI2 was found to emitting in
the near-infrared at 1000 and 1050 nm from Pr3+ 1D2 —»3F4 transition. Instead of near-
infrared, red emission from ]D2-» 3H4 dominates at 635 nm (Figure 2-10). Since the !D2
is known to be the emitting level of several near-infrared transitions for Pr3+ (*D2 —»3F2 at
850 nm, 1D2 -»3F4 at 1000 nm, and at 1350 nm), near-infrared is expected.
Thus in PPP-R10 films, near-infrared emission from Pr(DNM)3phen is too weak to be
observed. (The 3Po-»3H6 and 3Po->3H5 transitions of Pr3+ also emit approximately at 630
nm, however, the triplet energy of the DNM ligand is lower in energy than the 3Po state
and thus sensitization of the 3Po state is not expected. See Figure 2-11.)
£mc8cco8E
U i
550 575 600 625 650 675 700Wavelength / nm
Figure 2-10. Visible emission from the 1D2 —»3H4 transition of Pr3+ when a film of 10 mol% Pr(DNM)3phen blended with PPP-R10 is excited at 327 nm.
Reproduced with permission o f the copyright owner. Further reproduction prohibited w ithout permission.

58
Near-Infrared Emission from Yb fris-p-Diketonate Complexes Blended in PPP-OR11 Films
Yb(DBM)3phen and Yb(DNM)3phen were blended into PPP-OR11 at various
concentrations to examine the quenching effectiveness of films of PPP-OR11 with the
lanthanide complexes. Figure 2-12 shows the quenching of PPP-OR11 fluorescence by
Yb(DBM)3phen and Yb(DNM)3phen.
Due to the improved spectral overlap between the PPP-OR11 fluorescence and the
absorption of Yb(DNM)3phen compared to Yb(DBM)3phen, energy transfer is more
efficient for Yb(DNM)3phen. This is clearly seen in Figure 2-13 which shows that
Yb(DNM)3phen quenches PPP-OR11 more efficiently, and hence participates in more
efficient energy transfer. Even at 5 mol% concentration, Yb(DNM)3phen quenches 95%
of PPP-OR11 fluorescence, but for Yb(DBM)3phen the quenching is incomplete at even
20 mol% concentration.
40
35
30
25
o"o 2 0EPS 15
10
5
0
Figure 2-11. The electronic levels of trivalent lanthanide ions in fluoride glasses. The dotted line indicates the triplet energy of DNM.
DNM
Reproduced with permission o f the copyright owner. Further reproduction prohibited w ithout permission.

59
Figure 2-12.
Figure 2-13.
3e+6
2e+6
£mc&c 1e+6
4e+6
aO 3e+6
&c 2e+6
I
a. 1e+6 -
400 450 500 550 600 650Wavelength I nm
PL of films of PPP-0R11 blended with 0, 1, 2, 5, 10, 15, 20 mol% of a) Yb(DBM)3phen and b) Yb(DNM)3phen upon excitation at 330 nm.
0)e 10 0)30"C 0.8O«ME»a.a 0.4an _Oco"8E
0.2
0.0a o 5 10 15 20mol% Yb complex
Fraction of PPP-OR11 fluorescence quenched by (®)Yb(DBM)3phen and ( A)Yb(DNM)3phen in spin-coated films prepared by blending the lanthanide complex into the polymer.
Reproduced with permission o f the copyright owner. Further reproduction prohibited w ithout permission.

60
Quenching of PPP-OR11 Fluorescence by Lanthanide Monoporphyrinate Complexes
The spectral overlap between the emission of PPP-OR11 and the absorption of
lanthanide tetraphenylporphyrin complexes, Ln(TPP)L is excellent and thus energy
transfer is expected to be more efficient using Ln(TPP)L complexes than lanthanide tris-
P-diketonates. In order to test this concept, spin-coated films were prepared by blending
the desired concentration of lanthanide complex in a solution of PPP-OR11 dissolved in
chloroform. The films were spin cast at 1000 rpm onto glass substrates. Figure 2-14
shows the absorption spectra of films of PPP-OR11 blended with Ln(TPP)TP at various
concentrations.
In the film of pure PPP-OR11, absorption occurs at 330 nm (Figure 2-14a). Below
330 nm absorption of the substrate prevents any further details to be observed. By
blending Ln(TPP)L into the polymer host, several new absorptions could be observed
which correspond to the porphyrin Soret band at 427 nm and several weaker Q-bands at
554 and 591 nm. The Soret band gradually shifts from 427 nm at lower concentrations to
429 nm at 20 mol% suggesting some aggregation of the porphyrin may occur at high
loading concentrations.
The polymer absorption band shows variations in intensity at different loading
levels. This variation is due to differences in film thickness during spin coating. There is
a linear correlation between the ratio of the two absorption bands and the concentration.
Thus, the Ln(TPP)L to polymer ratio is not affected by the spin coating process and
variations in polymer absorption are due to film thickness.
Quenching of the PPP-OR11 fluorescence by Ln(TPP)TP in the spin-coated blends
is shown in Figure 2-15 and Figure 2-16. As the concentration of the lanthanide complex
Reproduced with permission o f the copyright owner. Further reproduction prohibited w ithout permission.

61
0.14
0.12a»oc«3»_
0.10
0.08
» 0.06 jQ< 0 .04
0.02
0.000.14 -- e0.12
fflocraX J
0.10
0.08
w 0 .06X30.04
0.02
0.000.14 600400 500
Wavelength / nm700 800
0.120)o 0.10 n■fi 0 08 oa o.o6< 0.04
0.02
0.00500 600400 700 800
Wavelength I nm
Figure 2-14. Absorbance of spin cast films of Ln(TPP)TP blended into PPP-OR11. a) PPP-OR11 on a glass substrate. Other graphs show the absorbance of Ln(TPP)TP blended in 1, 2, 5, 10, 15, and 20 mol% concentration with PPP-OR11: b) Ho(TPP)TP c) Yb(TPP)TP d) Er(TPP)TP e)Tm(TPP)TP.
is increased, there is a pronounced decrease in the PPP-OR11 fluorescence. At 5 mol%
concentration, more than 95% of PPP-OR11 fluorescence is quenched by all Ln(TPP)TP
complexes (Figure 2-17). The efficient quenching of the polymer fluorescence is
believed to arise from the good spectral overlap of the PPP-OR11 fluorescence and the
Reproduced with permission o f the copyright owner. Further reproduction prohibited w ithout permission.

62
absorption of the TPP ligand. The metal does not affect the efficiency of the quenching.
However, even at the highest concentration of Ln(TPP)TP studied, some fluorescence
from 400-500 nm is still observed from the film.
Aggregation of PPP-OR11 may account for the incomplete quenching. Balanda
reported that PPP-OR11 aggregates in solutions used for GPC studies.100 Thus it would
not be surprising that in the solid state some of the PPP-OR11 polymer chains aggregate
and thus cannot be quenched by Ln(TPP)TP. Coupled with a short lifetime, there may be
insufficient time for energy transfer to the lanthanide to occur, and thus a small amount of
unquenched polymer fluorescence occurs. 93
± 0.6£03 0.4
1UJ0.2
0.0
0.08
£| 0.06
|0 0.04
1U 0.02
0.00400 450 500 550 600 650 700 750 400 450 500 550 600 650 700 750
Wavelength I nm Wavelength I nm
Figure 2-15. Visible emission of spin cast films of 0, 1, 2, 5, 10, 15, and 20 mol% of a) Er(TPP)TP and c) Ho(TPP)TP in PPP-OR11 when excited at 367 nm. Expansions of b) Er(TPP)TP and d) Ho(TPP)TP are also shown to highlight the increasing porphyrin emission. The arrows indicate the emission band intensity with increasing Ln(TPP)TP.
Reproduced with permission o f the copyright owner. Further reproduction prohibited w ithout permission.

63
0.8 -
0.6 -
0.4
0.2 -
0.0
0.08
C 0.06
o 0.04
0.02
0.00400 450 500 550 600 650 700 750 400 450 500 550 600 650 700 750
W avelength / nm Wavelength / nm
Figure 2-16. Visible emission of spin cast films of 0, 1, 2, 5, 10, 15, and 20 mol% of a) Tm(TPP)TP and c) Yb(TPP)TP in PPP-OR11 when excited at 367 nm. Expansions of b) Tm(TPP)TP and d) Yb(TPP)TP are also shown to highlight the increasing porphyrin emission. The arrows indicate the emission band intensity with increasing Ln(TPP)TP.
I 1.0 ©3ac 0.8 O'35 •| 0.6LU
& o.4 0L
©C 0 . 2 o
4-»u2u.
0.01 !■
0 205 10 1 5
mol% Ln(TPP)TP
Figure 2-17. Fraction of PPP emission quenched by (•) Ho(TPP)TP, (▼) Er(TPP)TP, (■) Tm(TPP)TP, and (♦) Yb(TPP)TP.
Reproduced with permission o f the copyright owner. Further reproduction prohibited w ithout permission.

64
The high energy fluorescence band appears to split at Ln(TPP)TP concentrations
greater than 5 mol%. The So~>S2 absorption of the lanthanide porphyrin occurs in this
region and is likely to cause the apparent splitting. Also noticeable at higher lanthanide
porphyrin concentrations are two emission bands at 630 and 719 nm. These bands
increase with increasing lanthanide concentration and originate from a non-metallated
TPP impurity present with the Ln(TPP)TP complex.
Near-Infrared Emission from Lanthanide Monoporphyrinate Complexes Blended in PPP-OR11 Films
Quenching of the polymer fluorescence is accompanied by the appearance of near
infrared emission from several of the lanthanide complexes. Near-infrared emission from
Yb(TPP)TP was observed when blended into PPP-OR11 at as little as 2 mol% as is
shown in Figure 2-18. The central transition at 977 nm corresponding to the 2Fs/2 —»2F7/2
is clearly observed. Additionally, high and low energy bands resulting from crystal field
splitting of the 2F5/2 -»2F7/2 states are also observed. The near-infrared intensity increases
linearly with concentration as shown in inset of Figure 2-18 which indicates that
concentration quenching is not observed over this concentration range. This is contrary
to many inorganic solid-state materials where self-quenching of lanthanides is observed
at relatively low concentrations.101
The PL excitation spectra of the blends also confirm that energy transfer to the
lanthanide complex occurs when the polymer is excited (Figure 2-19). The two bands at
420 and 550 nm correspond to the Soret and Q-band absorption of the TPP ligand,
respectively. The band at 360 nm corresponds to the n—>n* absorption band of PPP-
Reproduced with permission o f the copyright owner. Further reproduction prohibited w ithout permission.

65
0R 11, thus supporting the idea that energy transfer from the polymer chain to the
porphyrin ligand occurs and eventually sensitizes near-infrared emission of Yb3+.
Near-infrared photoluminescence from Er(TPP)TP in PPP-OR11 required much
higher concentrations of Er(TPP)TP than Yb(TPP)TP. In the film with the highest
concentration of Er(TPP)TP (20 mol%) used, a weak emission of the 4Ii3/2 —>4Ixs/2
transition at 1517 nm was observed as shown in Figure 2-20. Even though PPP-OR11
quenching by Er(TPP)TP was comparable to Yb(TPP)TP, higher concentrations of
Er(TPP)TP are required because the photoluminescence quantum efficiency of
Er(TPP)TP is considerably lower compared to its Yb3+ analog (see Table 1-6) and also
because of poor sensitivity InGaAs detector in the 1500-1600 nm region.
2.5
42 2.0
£* 1.0« c0)I 0-5
0.0900 950 1000 1050
Wavelength I nm
Figure 2-18. Near-infrared emission of 1, 2, 5, 10, 15, and 20 mol% Yb(TPP)TP in PPP- OR11 upon excitation at 367 nm. The inset shows that the lanthanide intensity increases linearly with concentration.
Photoluminescence in the near-infrared region was not detected from Ho(TPP)TP
or Tm(TPP)TP blended into PPP-OR11 films. Near-infrared emission from Ho3+
5I6—>5Is, (1-2 pm) or 3Hs->3H6 (1.2 pm) was not observed in the spectral regions that
could be detected. There are several other near-infrared transitions of Ho3+ i.e. 5l7—>5Ig,
Yb(TPP)TP mol %
Reproduced with permission o f the copyright owner. Further reproduction prohibited w ithout permission.

66
(2.0 pm), and 5Ig—>5l7 (2.8 pm), and Tm3+ i.e. *F4 —»3H6 (1.8 pm) and 3H4 -*3H5 (2.3 jam),
which are beyond the wavelength range of our InGaAs detector and thus could not be
observed.
1.6
1 .4
0.8c0.6
0 . 4
0.2
0.03 0 0 3 5 0 4 0 0 4 5 0 5 0 0 5 5 0 6 0 0 6 5 0 7 0 0
Wavelength I nmFigure 2-19. Excitation spectra of 977 nm emission of 1, 2, 5, 10, 15, and 20 mol%
Yb(TPP)TP in PPP-OR11 normalized to the PPP-OR11 intensity maximum. The TPP absorption bands increased with increased loading of Yb(TPP)TP.
mcVc
Q.
1 4 0 0 1 4 2 0 1 4 4 0 1 4 6 0 1 4 8 0 1 5 0 0 1 5 2 0 1 5 4 0 1 5 6 0
Wavelength I nm
Figure 2-20. Near-infrared emission of 20 mol% Er(TPP)TP in PPP-OR11 excited at 367 nm.
Reproduced with permission o f the copyright owner. Further reproduction prohibited w ithout permission.

67
Discussion
In general, the mechanism of energy transfer from the polymer to the lanthanide
complex followed by near-infrared emission is believed to occur as follows: Light
absorption produces the PPP-OR11 singlet exciton which is then transferred to the |3-
diketonate or TPP ligand exciting it to the 17t—» n* state. Intersystem crossing occurs
producing the state of the ligand, which subsequently induces the lanthanide-
based excited state which then relaxes via emission of a visible or near-infrared photon.
Visible and near-infrared emissions have been observed in films of the lanthanide
complexes blended in conjugated polymers. Forster energy transfer theory can be used to
analyze the energy transfer efficiency.102 Figure 2-21 shows the spectral overlap between
the absorption of three different lanthanide complexes with the fluorescence spectrum of
PPP-OR11. Qualitatively, the spectral overlap increases from Ln(DBM)3 L <
LnfDNMLL < Ln(TPP)L in PPP-OR11. Quantitatively, the extent of Forster transfer
between a donor and an acceptor can be determined by examining the Forster radius, Ro,
which is the distance between the donor and acceptor where the efficiency of energy
transfer is 50%. Ro can be calculated using the following equation:
0 5 2 9 1 ^
»x
where k2 is an orientation factor (2/3 for a randomly oriented molecules), n is the
refractive index of the medium (assumed to be 1.7 for P P P ), Na is Avogadro’s number,
®d is the PL efficiency of the donor, and O is the spectral overlap integral defined by:
Reproduced with permission o f the copyright owner. Further reproduction prohibited w ithout permission.

68
Q = f ^ (A)FD(A)A4dsI 2-2
where &a(X) is the molar absorptivity spectrum of the acceptor, X is wavelength, and Fd(X)
is the normalized emission spectrum as shown in equation 2-3.
^ F D(A)dA = l 2 ' 3
The Ro for the systems studied are shown in Table 2-1. The Ro values show that
PPP-OR11 blended with Ln(TPP)L should provide the most efficient Forster energy
transfer for a given concentration in the blend. The Ro value of 4.6 nm computed for the
Ln(TPP)L/PPP-ORl 1 blend agrees well with 4.8 nm reported for TPP dispersed in
poly(9,9-dioctylfluorene) (PFO ) . 9 6 The calculated RO value of 2.6 nm for Ln(TPP)L
blended in MEH-PPV also compares well with 2.5 nm reported for TPP blended in
MEH-PPV . 103
However, the Ro values calculated using Forster energy transfer theory assumes
only long-range dipole-dipole interactions. It is expected that it would underestimate the
energy transfer distances in these systems, because singlet excitons in the PPP material
can rapidly diffuse from their point of formation. For example, Holmes et. al. have
suggested that excitons formed on poly(phenylene vinylene) can migrate up to 8 nm from
the point of formation . 9 4 Thus, the exciton can migrate very rapidly throughout the
conjugated polymer backbone. Since a much higher concentration than expected is
necessary to quenched PPP fluorescence compared to others work with PFO and TPP,
this may be an indication that the Yb(TPP)TP is not homogenously dispersed throughout
Reproduced with permission o f the copyright owner. Further reproduction prohibited w ithout permission.

69
the polymer film . 96 Aggregation of Ln(TPP)TP was not readily observed in PPP-OR11
using fluorescence microscopy. Further work using TEM may more accurately
determine if aggregation of Yb(TPP)TP occurs in the polymer host.
5 0 0 5 5 0 6 0 03 5 0 4 0 0 4 5 0 6 5 0 7 0 0
Wavelength I nm
Figure 2-21. Spectral overlap of PPP-OR11 emission (—) and the absorption of a)Ln(DBM)3phen, b) Ln(DNM)3phen and c) Ln(TPP)TP (—). The shaded region indicates the area of spectral overlap.
Reproduced with permission o f the copyright owner. Further reproduction prohibited w ithout permission.
70
TABLE 2-1. CRITICAL FORSTER DISTANCES FORLANTHANIDE/CONJUGATED POLYMER SYSTEMS.
Blend Composition Ro / nm
PPP-R10/ Ln(DBM)3phen 2.7
PPP-R10/ Ln(DNM)3phen 3.1
PPP-OR11/Ln(DBM)3phen 1.4
PPP-OR11/ Ln(DNM)3phen 2.7
PPP-R10/ Ln(TPP)L 3.7
PPP-OR11/ Ln(TPPL) 4.6
MEH-PPV/ Ln(TPP)L 2 . 6
Conclusion
Concepts of spectral overlap and Forster energy transfer can be used as a guide for
preparing materials which should have improved electroluminescent properties. Using
this approach it shows that the most efficient energy transfer should occur in
PPP-OR1 l/Ln(TPP) blend systems. Photoluminescence work indicates that by blending
5 mol% or higher concentration of lanthanide TPP or DNM ligand results in complete
quenching (>95% quenching) of the polymer fluorescence.
Experimental
Films of the conjugated polymers and lanthanide complexes were prepared by first
dissolving the polymer in chloroform (2 mg/mL) and then adding aliquots of a solution of
the lanthanide complex also dissolved in chloroform. The resulting solutions were spin
Reproduced with permission o f the copyright owner. Further reproduction prohibited w ithout permission.

71
cast onto glass or quartz substrates at 800 rpm for 30 sec and the films were allowed to
air dry overnight.
Absorption spectra recorded were the average of 3-5 scans measured on different
areas of the film. Emission spectra were measured by exciting the film perpendicular to
the glass substrate and collecting the emission using front-face geometry. Emission
spectra were the average of 5 measurements recorded on different areas of the film. A
PMT detector was used for visible measurements and an InGaAs detector was used for
near-infrared measurements. Detailed descriptions of the instruments used are described
in Chapter 1.
Reproduced with permission o f the copyright owner. Further reproduction prohibited w ithout permission.
CHAPTER 3NEAR-INFRARED ELECTROLUMINESCENCE OF LANTHANIDE COMPLEXES
IN CONJUGATED POLYMER BLENDS
Background
Differing from photoluminescence, where photons are absorbed and emitted by
molecules, electroluminescence (EL) is a process where an applied electric field
generates an excited species which upon relaxation emits photons. Electroluminescence
was first described by Destriau using microcrystals of ZnS suspended in an insulating
medium sandwiched between two electrodes. 104 105 Since then a multitude of inorganic
materials have been prepared and commercialized which are capable of producing a wide
variety of wavelengths of light.
Electroluminescence of organic materials was first described in anthracene crystals
in 1963.106,107 However because of the low efficiencies and high-field strengths required,
research into organic based electroluminescent materials waned until Tang and Van
Slyke prepared single-layer devices by vapor depositing aluminum tris-(8 -
hydroxyquinolinate) (AIQ3) (Figure 3-1) onto indium-tin-oxide (ITO) followed by vapor
deposition of an aluminum electrode. 108 Upon application of an electric field, green
emission from AIQ3 was observed.
Another significant milestone in organic based LEDs was the fabrication of the first
polymer light-emitting diode (PLED) in 1990. 109 The Cambridge group prepared a thin
film of poly(p-phenylenevinylene) (PPV) and sandwiched it between two electrodes
72
Reproduced with permission o f the copyright owner. Further reproduction prohibited w ithout permission.

73
A I / A I 2 O 3 and A1 to produce a yellow green light when a voltage was applied. Their work
has since triggered an explosion of interest into polymeric LEDs particularly in two
conjugated polymer types: poly(p-phenylene vinylenejs (PPVs) and poly(p-phenylene)s
(PPPs). Since then there has been extensive research on PLEDs and these devices are at
the point of commercialization. 110-113
Substrate
Emitting Layer / AIQ3 Anode / ITO
Cathode / Aluminium
Figure 3-1. Chemical structure of aluminum tra -(8 -hydroxyquinolinate) (AIQ3) and a single-layer device architecture.
Poly(l,4-phenylenevinylene)s as Electroluminescent Emitters
Poly(l ,4-plienylenevinylene)s (PPV) are one of the most studied classes of
conjugated polymers (Figure 3-2). Upon photoexcitation, PPVs generally fluoresce in
the 500 to 700 nm region giving an orange to red colored emission. The
photoluminescence spectrum of PPV generally matches the electroluminescence
spectrum suggesting that the emitting excited state produced in PPV is the same
regardless of the method of excitation.
Without any substituents on its backbone, PPV is an insoluble and unprocessable
polymer. Thus PPV is typically deposited onto the substrate as a polymer precusor which
is soluble in organic solvents. The precursor is converted to PPV upon heating as shown
in Figure 3-3. Substituting the PPV backbone is also an effective way to affect its
Reproduced with permission o f the copyright owner. Further reproduction prohibited w ithout permission.

74
solubility properties. For example, poly(2-(2’-ethylhexyloxy-)-5-methoxy-l,4-phenylene
vinylene) (MEH-PPV), an orange emitter, possesses side chains which allows the
polymer to be dissolved in common organic solvents such as CHCI3 and toluene and can
be spin coated into a thin film.114,115 Chemical modification can also affect its electronic
properties. For example, by attaching electron withdrawing cyano groups to the vinylene
bonds of a substituted PPV, a red emitting polymer (CN-PPV) was obtained which when
incorporated into an electroluminescent device showed internal quantum efficiencies up
to 4% . 116
n
PPV MEH-PPV CN-PPV
Figure 3-2. Chemical structures of three common poly(p-phenylenevinylene)s.
150°C, 2-3 hr
inert atm
prepolymer PPV
Figure 3-3. Sulphonium prepolymer route to PPV.
^ J + HCI
Reproduced with permission o f the copyright owner. Further reproduction prohibited w ithout permission.

75
Poly(1,4-phenylene)s as Electroluminescent Emitters
Blue emitting polymer LEDs have been a particularly attractive area of interest
because of the difficulty in producing blue emitting inorganic semiconductors. Poly(p-
phenylene)s possess band gaps of 2.7-3.0 eV and are known blue PL emitters making
them ideal candidates for use in blue emitting LEDs. In fact, the first example of a blue
emitting PLED reported used poly(p-phenylene) (PPP) (Figure 3-4) . 1 1 7 ,1 1 8 Unsubstituted
PPP like unsubstituted PPV has poor processing characteristics. Substitution of alkyl or
alkoxy sidechains improves the solubility of the polymer as well as altering the electronic
properties of the polymer. 100 Substituted poly(fluorene)s (PFO) are also interesting
variations of PPP with promising properties such as efficient quantum efficiencies, high
charge-carrier mobilities, and good processability . 119
Figure 3-4. Examples of blue emitting electroluminescent poly(p-phenylene)s
Electroluminescence Mechanisms
While electroluminescence is in its simplest form the conversion of electrons into
photons, the process of electroluminescence can be broken into four steps: ( 1 )
introduction of energy into the device, (2) movement of the carriers, (3) excitation of the
radiative material and (4) radiative relaxation of the excited material. There are several
possible mechanisms proposed which account for electroluminescence. One such
PPP PPP-OR11 PFO
Reproduced with permission o f the copyright owner. Further reproduction prohibited w ithout permission.

76
mechanism requires accelerating electrons with enough kinetic energy to cause excitation
of the molecule by impact of hot carriers. This is known as intrinsic electroluminescence
which has been demonstrated by Bemanose120 in organic containing cellophane films and
in perylene and anthracene crystals. 121 However, it is difficult to generate intrinsic
electroluminescence in organic materials because high ac voltages are usually required,
which often leads to electrical breakdown before electroluminescence is obtained.
A more common method of introducing charge carriers into organic materials is to
sandwich the electroactive material between electrodes, which upon application of an
electric field inject charge into the material. The cathode usually consists of a low work
function material which can easily inject electrons into the lowest unoccupied molecular
orbital (LUMO), which is analogous to the conduction band (Ec) in semiconductors, of
the electroactive material. In chemical terms, injection of electrons reduces the
electroactive material. Usually, the cathode is made of calcium, magnesium, or
aluminum. Once electrons are injected, they drift to the electrode of more positive
potential. At the same time, the anode injects holes into the highest occupied molecular
orbital (HOMO) of the active material, which is analogous to the valence band (Ey) in
semiconductors. Injection of holes actually corresponds to the removal of electrons from
the electroactive material, i.e. oxidation of the electroactive material. Once injected,
holes drift toward the more negative cathode. Commonly, the anode is indium tin oxide
(ITO) because of its high work function and good transmission properties in the visible
region. Electrons and holes recombine in the active material producing an excited state
on the emitting material which can decay radiatively or non-radiatively.
Reproduced with permission o f the copyright owner. Further reproduction prohibited w ithout permission.

Recombination of electrons with holes can cause the electron configuration of the
excited material to be either in a singlet state (S= lA) or triplet state (S= 1). According to
simple spin statistics 25% of the excitons produced are in the singlet state and the
remaining 75% will be in triplet states. This means that electroluminescent devices with
fluorescent emitters (i.e. emission from the singlet) are limited to a maximum of 25%
efficiency, since radiative decay requires the excited species be in a singlet state.
Intersystem crossing from the triplet- to singlet-state can be neglected in most organic
materials due to a low transition probability, thus fluorescent emitters can only use singlet
states formed upon electron hole recombination. Yet, emissive materials which can use
the triplet states could theoretically allow device efficiency to reach 1 0 0 %.
Electronic configuration of the excited state alone is not the only obstacle which
must be overcome to maximize device efficiency. It is important that the electron and
hole mobilities be nearly equal in the device to effectively recombine on the desired
material. However, in most organic materials, the hole mobility typically far exceeds the
electron mobility. Therefore, more complicated device architectures can be used to
increase or retard carrier mobilities. An example o f this is shown Figure 3-5.
Cathode
Electron Transport Layer / ETL
Emitting Layer
Hole Transport Layer / HTL
Anode
Substrate
Figure 3-5. Structure of a multilayer light emitting diode
Reproduced with permission o f the copyright owner. Further reproduction prohibited w ithout permission.

78
Electron transport layers (ETL) and hole transport layers (HTL) serve to improve
the electron and hole mobility to the device, respectively, while at the same time
impeding the transport of the opposite carrier. The hole transport layer usually consists
of small molecules typically containing amines with low ionization potentials and a small
electron affinity associated with a large energy gap. These properties allow hole
transport to occur while at the same time blocking electrons from migrating to the anode.
Examples of small molecule hole transporters are shown in Figure 3-6. These molecules
typically are vapor deposited onto the anode. For polymer based HTL, the most
commonly used polymer is poly(3,4-ethylenedioxy-thiophene) doped with polystyrene
sulfonic acid whose chemical structure is shown in Figure 3-7. This polymer can be
purchased commercially as an aqueous suspension which can easily be spin coated onto
Figure 3-6. Examples of small-molecule hole transport materials. TP A istriphenylamine and TPD is (N, N ’-diphenyl-N,N’-bis(3-methylphenyl)l,l’- biphenyl-4,4 ’-diamine.
Lanthanide Complexes as Electroluminescent Emitters
A typical characteristic of OLEDs, particularly in polymer based devices, is broad
emission. This is because the excited state can decay into a multitude of ground state
vibrational levels resulting in a broad emission. For polymers, other factors such as intra-
or interchain interactions can further broaden the emission characteristics. Broad
ITO.
TPA TPD
Reproduced with permission o f the copyright owner. Further reproduction prohibited w ithout permission.

79
emission can be undesirable because it prevents good color purity needed for certain
applications such as displays. Tuning the EL emission properties via chemically
modifying the emitting material can be difficult and time consuming since chemical
modification can affect (possibly adversely), the processing properties, carrier mobilities,
or device efficiencies. While elaborate device architectures have been used to improve
color purity and device efficiency, lanthanide emitters blended into conjugated polymers
are promising alternatives. For example McGehee et al. showed that devices prepared
with visible emitting europium fro-p-diketonates can be blended into a blue emitting
poly(p-phenylene) giving line-like Eu3+ emission.97 In those devices energy transfer from
PPP to Eu3+ was invoked as an explanation of the quenching of polymer fluorescence and
sensitization of Eu3+ luminescence. Energy transfer has been demonstrated to be ane n ro q<tt i
important factor in metal complex doped conjugated polymer systems. ’ ’ ’ Efficient
Forster energy transfer from a conjugated polymer host to a lanthanide complex dopant
requires sufficient spectral overlap between the emission spectrum of the polymer and the
absorption spectra of the lanthanide complex. 123 ' 127
S 0 3-
m
SO3H
Figure 3-7. Structure of hole transporting polythiophene PEDOT-PSS
Reproduced with permission o f the copyright owner. Further reproduction prohibited w ithout permission.

80
Lanthanide metal ions are unique in that their 4 /orbitals are shielded by filled 5s
and 5p orbitals. This shielding prevents the 4f orbitals from interacting with the
environment thus allowing the lanthanide to maintain its atomic-like emission properties
even in the solid state which is an advantage compared to broadly emitting polymers for
display technologies. An additional advantage of lanthanides is that efficient excitation
of the lanthanide occurs through the triplet state of the surrounding ligands. This allows
the possibility of using both singlet and triplet excitons created by electron-hole
recombination to be used in radiative processes.
Near-Infrared Emitting Lanthanide Based Devices
Although most previous investigations have focused on electroluminescent devices
that emit in the visible region, there is considerable potential for LEDs that emit in the
near-infrared and mid-infrared spectral regions; in particular for optical
178 170 1 7f) 171 177communication, ’ medical and biological, ’ and sensor applications. Lanthanide
ions such as Nd3+, Er3+ and Yb3+ are known near-infrared emitters having excellent
luminescence properties due to the characteristics of the f - f transitions, which include
specific, narrow bandwidth emission in the 800 - 1600 nm region. Previously, near-
infrared emitting materials and devices have been prepared using lanthanide compounds,
such as small molecule lanthanide complexes133 and blends of conjugated polymers with
lanthanide chelates. 5 7 Near-infrared electroluminescent (EL) devices using molecular
lanthanide complex films, which were fabricated by vacuum deposition, have been
constructed and shown to emit light at the wavelengths characteristic of the lanthanide
Reproduced with permission o f the copyright owner. Further reproduction prohibited w ithout permission.

Using the concepts mentioned, this chapter presents a summary of work done
preparing electroluminescent devices consisting of near-infrared emitting Ln(III)
complexes blended into MEH-PPV or an oligoether functionalized poly(p-phenylene) as
shown in Figure 3-8. It will be shown that while Forster energy transfer between the
polymer host and lanthanide complex may occur, charge hopping between lanthanide
porphyrin complexes may be the dominant charge transporting pathway in these devices.
Figure 3-8. Host polymer structures
Electroluminescence from Lanthanide tm-fi-Diketonates Blended in MEH-PPV
Before the lanthanide complexes were blended with MEH-PPV, a device was
were prepared by spin coating a thin layer of PEDOT-PSS (Bayer Baytron P VP 4083)
onto cleaned ITO. The device was subsequently dried in vacuo at 150°C for 4 hours to
remove any residual solvent. Then the active layer was spin-coated followed by
deposition of Ca and A1 and finally encapsulation with a commercially purchased epoxy
material. The device architecture is shown in Figure 3-9.
MEH-PPV PPP-OR11 PS
prepared to show the EL properties of the host polymer. Electroluminescent devices
Reproduced with permission o f the copyright owner. Further reproduction prohibited w ithout permission.

82
Ca
Ln complex + Polymer PEDOT-PSS
J I Q .
glass
Figure 3-9. Structure of EL device: glass/ITO/PEDOT-PSS (40 nm) / lanthanide complex and polymer host / Ca (5 nm) / A1 (200 nm).
Figure 3-10 shows the electroluminescence emission of a pure 750A thick MEH-
PPV device at 9 V. The device showed a broad orange emission peak at 560 nm which
corresponds to the MEH-PPV fluorescence peak in the photoluminescence spectrum.
While the EL spectrum of MEH-PPV tails into the near-infrared region (>770 nm), there
is no emission detected at 980 nm where the first near-infrared emitting complex emitted.
C 0.8 3
w 0.6
£mca>*»
0.4
C0.2
1U
0.0600 700 1000500 800 900
Wavelength I nm
Figure 3-10. Electroluminescence spectrum of ITO/PEDOT-PSS/MEH-PPV/Ca/Al recorded at 9 V. Tum-on voltage was 3 V for this 75 0A film.
Reproduced with permission o f the copyright owner. Further reproduction prohibited w ithout permission.

83
Ytterbium containing P-diketonates complexes were initially blended into MEH-
PPV because they emit in the near-infrared at 977 nm which could be conveniently
recorded using a CCD detector. The structures of the lanthanide complexes used are
shown in Figure 3-11. First, devices were prepared with Yb(TTFA)3phen blended with
MEH-PPV. Yb(TTFA)3phen has one of the highest photoluminescence quantum yields
known for Yb complexes (©=0.003) but its absorption spectrum does not overlap with
the emission spectrum of MEH-PPV. Therefore, no energy transfer from the host
polymer to the lanthanide complex was expected.
Figure 3-11. Structures of Yb tris-P-diketonates complexes blended into MEH-PPV.
Figure 3-12 shows the EL spectrum recorded at 9 V of 1:2 weight ratio of
Yb(TTFA)3phen:MEH-PPV. The MEH-PPV fluorescence dominates the emission
peaking at 560nm. A weak emission from Yb(TTFA)3phen is observed at 977 nm. Since
there is no spectral overlap, Forster energy transfer from MEH-PPV to Yb(TTFA)3phen
was not expected to occur. The electroluminescence spectrum supports this with a large
host emission and weak near-infrared emission. The Yb3+ emission observed probably
results from electron-hole recombination that occurs directly on Yb(TTFA)3phen.
Ln(TTFA)3phen Ln(DNM)3phen
Reproduced with permission o f the copyright owner. Further reproduction prohibited w ithout permission.

84
Next, Yb(DNM)3phen was blended into MEH-PPV. Yb(DNM)3phen possesses a
more conjugated ring system and thus absorbs light at longer wavelengths. Figure 3-13
shows the electroluminescence of Yb(DNM)3phen blended into MEH-PPV. Even though
some spectral overlap occurs between MEH-PPV and the lanthanide complex and the
doping level of the lanthanide complex is high ( 1 : 1 weight ratio), the electroluminescence
is still dominated by host polymer emission with a visible radiance output 27 times the
near-infrared radiance.
40c3
8
C®cuu
10
8
6
4
2
0 t= 400 700 800 1000500 600 900
Wavelength I nm
Figure 3-12. Electroluminescence spectrum at 9 V for 1:2 weight ratio ofYb(TTFA)3phen to MEH-PPV device. MEH-PPV emission dominates with a relatively small amount of 2F5/2—»2F7 /2 emission from Yb3+ observed at 977 nm.
While the near-infrared EL is low, the Yb(DNM)3phen devices shows more near-
infrared emission relative to the visible emission than MEH-PPV/Yb(TTFA)3phen
devices. This is significant because the photoluminescence quantum yield of
Yb(DNM)3phen is 5 times lower than Yb(TTFA)3phen. Thus if the complexes were
equally excited by an electric field, Yb(DNM)3phen should emit with significantly lower
efficiency than Yb(TTFA)3phen. Two possibilities can account for this; either more
Reproduced with permission o f the copyright owner. Further reproduction prohibited w ithout permission.

85
efficient Forster energy transfer from MEH-PPV to Yb(DNM)3phen occurs because of
improved spectral overlap or improved charge trapping by the DNM ligand occurs thus
enhancing electron/hole recombination. 136
1600
s1400VI
2c3
1200
8 1000
- 800
£mc600
a>+>*c400
_jUJ
200
0
MEH-PPV Emission (Visible Emission)
Yb(DNM)3phen Emission (NIR Emission)'
A500 550 600 650 700 750 800 850 900 950
Wavelength I nm
Figure 3-13. Electroluminescence spectrum at 9 V for 1:1 weight ratio ofYb(DNM)3phen to MEH-PPV device. MEH-PPV emission dominates with a relatively small amount of 2F5/2 —> ^ 7 /2 emission from Yb3+ observed at 977 nm.
Concentration Effects of Yb(TPP)acac Blended into MEH-PPV on Device Performance
Since the porphyrin ligand has Q-bands near 600 nm which overlap with the
emission of MEH-PPV, it is expected that more efficient energy transfer from the
polymer to the TPP ligand compared to simple P-diketonate ligands would occur. To
explore this idea Ln(TPP)acac was prepared according to published procedures35,56 137 and
blended at several different concentrations into MEH-PPV. The structure of
Ln(TPP)acac is shown in Figure 3-14.
Reproduced with permission o f the copyright owner. Further reproduction prohibited w ithout permission.
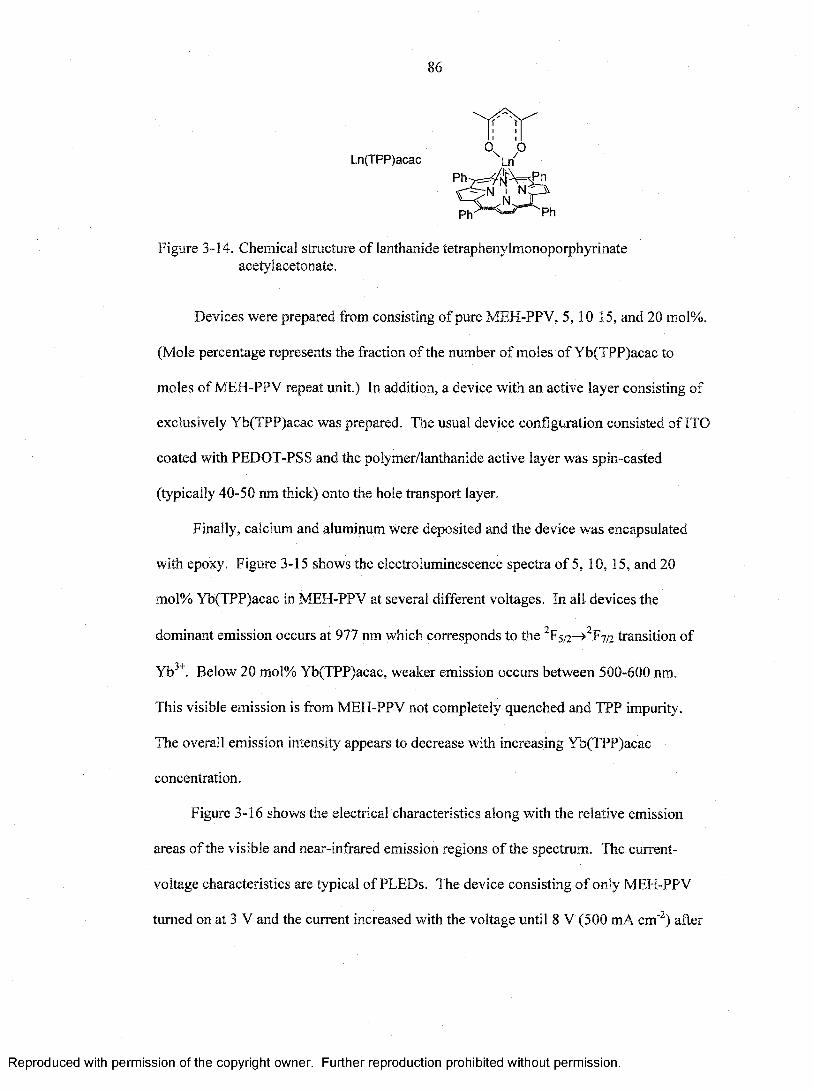
o. PLn(TPP)acac
ph^ —W ^ Rh
Figure 3-14. Chemical structure of lanthanide tetraphenylmonoporphyrinate acetylacetonate.
Devices were prepared from consisting of pure MEH-PPV, 5, 10 15, and 20 mol%.
(Mole percentage represents the fraction of the number of moles of Yb(TPP)acac to
moles of MEH-PPV repeat unit.) In addition, a device with an active layer consisting of
exclusively Yb(TPP)acac was prepared. The usual device configuration consisted of ITO
coated with PEDOT-PSS and the polymer/lanthanide active layer was spin-casted
(typically 40-50 nm thick) onto the hole transport layer.
Finally, calcium and aluminum were deposited and the device was encapsulated
with epoxy. Figure 3-15 shows the electroluminescence spectra of 5, 10, 15, and 20
mol% Yb(TPP)acac in MEH-PPV at several different voltages. In all devices the
dominant emission occurs at 977 nm which corresponds to the 2F5/2 -» 2 F7/2 transition of
Yb3+. Below 20 mol% Yb(TPP)acac, weaker emission occurs between 500-600 nm.
This visible emission is from MEH-PPV not completely quenched and TPP impurity.
The overall emission intensity appears to decrease with increasing Yb(TPP)acac
concentration.
Figure 3-16 shows the electrical characteristics along with the relative emission
areas of the visible and near-infrared emission regions of the spectrum. The current-
voltage characteristics are typical of PLEDs. The device consisting of only MEH-PPV
turned on at 3 V and the current increased with the voltage until 8 V (500 mA cm'2) after
Reproduced with permission o f the copyright owner. Further reproduction prohibited w ithout permission.

87
4000
3000
C 2000
1000
1200
1000
800
600
400
200
500
400
300
200
100
600
500
400
300
200
100
500 600 700 800 900 1000
Wavelength I nm
Figure 3-15. Electroluminescence spectra of Yb(TPP)acac in MEH-PPV. a) 5 mol%, b) 10 mol%, c) 15 mol%, and d) 20 mol% Yb(TPP)acac in MEH-PPV at 3,4,5,7,9, and 11 volts.
Reproduced with permission o f the copyright owner. Further reproduction prohibited w ithout permission.
88
which the current began to gradually increase beyond this voltage. The visible radiance
was detectable at 3 V and began to increase in parallel with the current. After reaching 8
V, the visible radiance decreased even though the current continued to increase.
For 5 mol% Yb(TPP)acac/MEH-PPV the current profile is similar to MEH-PPV.
Visible emission appears at 4 V and near-infrared emission is detected at 3 V. As the
concentration of Yb(TPP)acac increases, there is an increase in the turn on voltage for
near-infrared emission from 4 V for 5 mol% to 5 V for 20 mol%. This is accompanied
by an increase in the applied potential needed to reach comparable current densities. For
a current density of 100 mA cm'2, the voltage rises from 4 V for MEH-PPV only to 5 V
for 5 and 10 mol% then to 6 V for 15 mol%, and finally 8 V for 20 mol%. This indicates
that the resistance of the film increases and suggests that TPP plays a role in the charge
transport through the polymer film.
As the concentration of Yb(TPP)acac increases, the ratio of near-infrared to visible
radiance increases and the voltage at which visible light is detected increases from 4 V to
10 V for 5 to 20 mol%, respectively. The increase in the voltage required for visible light
to be detected is due to excitons or charge carriers formed on the polymer being
transferred from MEH-PPV to Yb(TPP)acac instead of being utilized for polymer
fluorescence.
The decrease in the visible and near-infrared radiances at high current densities is
due to device degradation. Lowering the voltage does not regain the previous emission
intensities. Since a large number of triplet excitons are formed from electron-hole
recombination, it is not surprising that photochemical changes of the device material can
occur in these devices thus leading to undesirable effects such as carbonyl formation and
Reproduced with permission o f the copyright owner. Further reproduction prohibited w ithout permission.

89
1 9 R 1 'IQother defects in the film. ’ Upon increasing the current density, there is a
hypsochromic shift in the MEH-PPV emission peak position. The emission peak position
does not return to its original X.max upon lowering the current suggesting that permanent
chemical changes such as reduction in conjugation length by defect formation are
occurring.
Near-Infrared Emission from Yb(TPP)acac as the Only Component in the Active Layer
Since Yb(TPP)acac plays a role in controlling charge transport, a device was
prepared by spin casting Yb(TPP)acac as the only active layer. While the film quality
was poorer than films of polymer blends, the spin cast film of Yb(TPP)acac was of
sufficient quality to prepare an EL device. Figure 3-17 shows the electroluminescence
spectra of this device as a function of voltage. The device has the following device
architecture: ITO/PEDOT-PSS/Yb(TPP)acac/Ca/Al. The i-V and radiance characteristics
of the Yb(TPP)acac only devices are shown in Figure 3-16f. At 5 V, a weak near-
9 9infrared emission was observed at 977 nm, which corresponds to the F 5 / 2 —» F 7 /2
transition of Yb3+, which peaks in intensity around 12 V. Near-infrared emission is the
dominant emission from these devices, There is no visible emission from the free TPP
impurity which is observed when Yb(TPP)acac is blended with a polymer.
Since no polymer is present, charge hopping from one porphyrin ring to another
must account for the EL observed. This is not surprising since vapor deposited OLEDs
must use a similar mechanism for charge transport. While the polymer may not be
necessary for near-infrared electroluminescence, it still plays a role in enhancing the
device efficiency. Since this device was prepared in conjugation with devices containing
Reproduced with permission o f the copyright owner. Further reproduction prohibited w ithout permission.

Cur
rent
D
ensi
ty
I tog
(m
A m
m'2
)
Yb(TPP)acac blended into MEH-PPV, a comparison between the relative intensities can
be drawn. Overall, the devices with 5 to 10 mol% Yb(TPP)acac in MEH-PPV had
greater near-infrared outputs than the pure device.
10
1
0.1
0.01
1
0.1
0.01
10
0.1
0.01
10 1 10
V oltage / log(V) V oltage / log(V)
Figure 3-16. Current response of electroluminescent devices at different voltages.Current density data are triangles, a) MEH-PPV, b) 5 mol%, c) 10 mol%, d) 15 mol%, e) 20 mol%, and f) pure Yb(TPP)acac film with Ca/Al electrodes. Relative visible (filled circles) and near-infrared emission (empty circles) area are also indicated.
Reproduced with permission o f the copyright owner. Further reproduction prohibited w ithout permission.
Norm
alized E
mission
Rad
iances

Increasing the concentration of Yb(TPP)acac in MEH-PPV to 15 mol%, reached a
minimum in near-infrared irradiance. The neat film only produced 20% of the near-
infrared intensity of the 5 mol% device. This suggests that one way the host enhances
near-infrared emission is by minimizing self-quenching effects. Therefore, while Forster
energy transfer of excitons formed on MEH-PPV is a feasible method of exciting
Yb(TPP)acac, this experiment has shown that it is not the only possible pathway for
Yb(TPP)acac sensitization.
8 0 0
42c3 6 0 0
8
£ 4 0 0 ' wE3J= 200 -
Ul
5 0 0 6 0 0 7 0 0 8 0 0 9 0 0 1000Wavelength I nm
Figure 3-17. Electroluminescence spectra o f ITO/PEDOT/Yb(TPP)acac/Ca/Al device from 6-12 V.
Near-Infrared Emission from Er(TPP)acac in MEH-PPV
Other near-infrared wavelengths can be achieved by substituting the lanthanide
coordinated to TPP. A device containing 1:2 weight ratio of Er(TPP)acac blended into
MEH-PPV was prepared in a similar fashion as to devices containing Yb(TPP)acac
blended into MEH-PPV. Upon application of an electric field near-infrared emission was
observed at 1520 nm corresponding to the 4Ii3/2 —>4Ii5 /2 transition of Er3+ (Figure 3-18).
Reproduced with permission o f the copyright owner. Further reproduction prohibited w ithout permission.

92
No other Er3+ based emission was observed. A visible red emission was observed by eye,
corresponding to the fluorescence of free-base tetraphenylporphyrin impurities present.
tnc1LU
1000 1200 1 4 0 0 1 6 0 0
Wavelength I nm
Figure 3-18. Electroluminescence spectrum of 1:2 (weight ratio) Er(TPP)acacMEH- PPV at 9 V. A red emission was also seen. No other Er + based emissions were observed.
Electroluminescence of PPP-OR11
Photoluminescence studies suggested that good spectral overlap of the emission
from PPP-OR11 with the absorption of the porphyrin ligand should result in more
efficient energy transfer from polymer to lanthanide complex resulting in less residual
visible fluorescence. Before electroluminescence studies could be carried out on blends
of PPP-OR11 with lanthanide complexes, the electrical and EL properties of the polymer
itself were studied. Devices were prepared with the following architecture: ITO/PEDOT-
PSS/PPP-OR11/Ca/Al with approximately 50 nm thickness. Once the device tums-on, a
blue emission was observed peaking at 420 nm as shown in Figure 3-19. This blue
emission matches closely the photoluminescence spectrum of PPP-OR11 films. Thus the
electroluminescence observed results from a similar singlet tc— excited state which
Reproduced with permission o f the copyright owner. Further reproduction prohibited w ithout permission.

93
can be created by photoexcitation. The emission intensity of the device increases with
increasing voltage and peaks at 9 V followed by a decrease in emission at higher
voltages. Figure 3-20 shows the z'-V and irradiance characteristics of devices made with
PPP-OR11 as the active layer. The current initially increases slowly, presumably due to
leakage current, but at 6 V, the current increases rapidly with increasing voltage. Upon
turning on at 5 V, the irradiance was 4 pW cm' , and by 9 V the average irradiance
reaches 70 pW cm ' 2 at 140 mA cm'2.
The electroluminescence efficiency of the PPP-OR11 device as a function of
current density is shown in Figure 3-21. From the graph it is apparent that the efficiency
increases until approximately 30 mA cm ' 2 peaking at 2.6 x 10"3 after which the efficiency
remains constant until about 100 mA cm' 2 and then rapidly decreases possible through
photo-oxidation of PPP or other irreversible degradation pathways. 140
&(0c<Dc
_ JUJ
500 600400 700 800
Wavelength I nm
Figure 3-19. Electroluminescence spectrum of PPP-OR11 at 6 V.
Reproduced with permission o f the copyright owner. Further reproduction prohibited w ithout permission.

94
250 100
w 200 <E
150
&m§ 100 a
60
*fr>0cfi 20
2 4 6 8 10
«V
' Itsc<0'■v
Voltage I V
Figure 3-20. Current density (circles) and irradiance (triangles) of PPP-OR11 atdifferent applied voltages. The error bars represent the standard deviations of five measurements.
1,0e-2
1.0e-3ca>!§
j j j u 1.0e-4
1.0e-50.1 1 10 100
Current Density I mA cm'2
Figure 3-21. Efficiencies of ITO/PEDOT-PSS/PPP-OR11/Ca/Al devices verses current density.
n t ? i ------i— i— r—m
i : '•Tr4
l , I__
Reproduced with permission o f the copyright owner. Further reproduction prohibited w ithout permission.

95
Near-Infrared Electroluminescence of Yb(TPP)TP Blended into PPP-OR11
Devices were prepared with Yb(TPP)TP (Figure 3-22) blended into PPP-OR11.
Yb(TPP)TP is expected to give higher external electroluminescence efficiency because
the photoluminescence quantum yield of Yb(TPP)TP is higher than that of Yb(TPP)acac
(See Table 1-9). This is significant because the electroluminescence quantum yield is
directly proportional to the photoluminescent quantum yield . 141 Therefore, devices were
prepared with Yb(TPP)TP blended into PPP-OR11. In addition, the concentration of
Yb(TPP)TP was varied from 5, 10, and 15 mol% to observe the effects of dopant
concentration on device performance.
EtON /-,N N
N'N N/ n
EtO-^EtoJ/OEtl
N I N
Ln(TPP)TP Ln(TPP)L(OEt)3
Figure 3-22 Chemical structures of lanthanide tetraphenylporphyrin complexes Ln(TPP) with differing capping ligands TP = tris-pyrazoylborate or L(OEt) 3 = (cyclopentadienyl) fra(diethoxyphosphito-P)cobaltate.
Electroluminescence spectra of devices containing Yb(TPP)TP blended into PPP-
OR11 are shown in Figure 3-23. At all concentrations, Yb3+ is the predominate emitter in
the devices with a near-infrared emission at 977 nm. As the concentration of Yb(TPP)TP
in PPP-OR11 increases, the spectral shape of the Yb3+ begins to show a defined emission
band at 920 nm. The 2Fs/2 energy state of Yb3+ in a non-symmetric environment is split
into three crystal field states. The splitting of these states is on the order of a few hunder
wavenumbers. With a sufficiently long excited state lifetime at room temperature,
Reproduced with permission o f the copyright owner. Further reproduction prohibited w ithout permission.

96
thermal equilibrium is established between the lowest excited and second lowest excited
states which results in emission of a higher energy band at 920 nm.
Emission in the visible region is significantly weaker than the near-infrared
emission, but there are interesting features when closely examined. At 5 mol% a very
weak emission from PPP-OR11 is observed from 400-500 nm. At higher Yb(TPP)TP
concentration, this band disappears indicating that emission from PPP-OR11 is
completely quenched at concentrations at 10 mol% or above. Very weak bands between
550 and 620 nm in the 15 mol% are probably ring fluorescence from the metallated
porphyrin. Between 620 and 800 nm, several things may be contributing to the
luminescence including aggregate fluorescence from a free base porphyrin impurity
present or phosphorescence from the metallated porphyrin ring. Yb(OEP)OH (OEP=
36octaethylporphyrin) has been shown to phosphoresce at 710 nm. The analogous Gd
complex shows phosphorescence at 710, 740 and 790 nm.36 (The extra phosphorescence
bands arise due to the fact that energy accepting levels of Gd3+ are much higher in energy
that the triplet energy of porphyrin ligand preventing energy transfer to occur. In
addition, Gd3+ enhances intersystem crossing from the porphryin singlet to triplet state
due to the heavy atom effect.) Therefore, the additional features observed between 620
and 800 nm in the electroluminescence spectrum may be due to ring phosphorescence
from the Yb(TPP)TP complex.
The current-voltage (/-V) profiles and irradiances of the devices are shown in
Figure 3-24 along with the current-voltage profile of the host material itself. The turn-on
voltages for the devices are 6 V for the PPP-OR11 only, 5 and 10 mol% devices. The 15
mol% device has a tum-on voltage of 4 V. Devices with increasing amounts of
Reproduced with permission o f the copyright owner. Further reproduction prohibited w ithout permission.

97
Yb(TPP)TP exhibit lower resistivity, as reflected by the fact that the current density
increases with increasing Yb(TPP)TP at the same voltage. This strongly suggests that the
porphyrin complex plays an important role in charge transport in the device.
The near-infrared irradiance of the devices increases with Yb(TPP)TP
concentration. For example, at 9 V the 5 mol% devices emit with a near-infrared
irradiance of 1. 6 pW cm ' 2 and passing an average current of 100 mA cm'2. At 10 mol%,
2 2the irradiance and current increase to 5.0 pW cm' and 160 mA cm' at 9 V, respectively.
Finally, at 15 mol%, devices emit 10.0 pW cm' with a current of 315 mA cm' at 9 V.
Overall, the increase in near-infrared radiance is accompanied by a corresponding
increase in current.
The near-infrared efficiencies at 5, 10, and 15 mol% Yb(TPP)TP in PPP-OR11 at
several selected current densities are shown in Table 3-1. Additional efficiency verses
current density data are plotted in Figure 3-25. At 5 mol% the efficiency of the device is
approximately 3 x 10'5. There is a significant amount of scatter in the device data at this
concentration, however, as the concentration is increased, the scatter decreases. At 10
mol% the near-infrared efficiency peaks at approximately 10 mA cm' with a value of 1.8
x 10' 4 and decreases with increasing current. For 15 mol% the near-infrared efficiency
peaks between 30-50 mA cm' 2 with a value of 1.3 x 10'4. Above 100 mA cm'2, there is a
decrease in the near-infrared efficiency which can partially be attributed to device
degradation.
Reproduced with permission o f the copyright owner. Further reproduction prohibited w ithout permission.

98
5e+11
4e+11
3e+11
2e+11
Wavelength I1e+11
8e+11
6e+11
4e+11
2e+11
,2e+12
1.0e+12
8 .0e+11 £ 1.09+10
^ \6.0e+11
4 .0e+ 11
2.0e+11
0.0800 900 1000400 500 600 700
Wavelength I nm
Figure 3-23. Electroluminescence spectra measured from 4 to 10 V in 1 V increments, a) 5 mol%, b)10 mol%, and c) 15 mol% Yb(TPP)TP in PPP-OR11. The insets are expansions of the visible region. The intensity increases with increasing voltage.
Reproduced with permission o f the copyright owner. Further reproduction prohibited w ithout permission.

99
Table 3-1. Near-infrared external EL efficiencies of 5, 10, 15 mol% concentrations of _________ Yb(TPP)TP blended into PPP-OR11 at various current densities.
F T T a T 1 A A C A A 1 A A ™ A........ ........ ..... 7 ..
5 mA cm' 10 mA cm ' 2 30 mA cm' 2 50 mA cm ' 2 100 mA cm ' 2
5 mol% 2.4 x lO ' 5 1.4 x 10' 5 2.4 x 10' 1 5.0 x 10'i 5.2 x 10'^
1 0 mol% 1 . 2 x 1 0 ' 4 1 . 8 x 1 0 " 4 1 . 6 x 1 0 ' 4 1 .0 x 1 0 '4 8 .0 x 1 0 ‘5
15 mol% 4.5 x 10' 5 6 . 1 x 1 0 ‘ 5 1.3 x lO ' 4 1.3 x 10' 4 1 . 2 x 1 0 " 4
g 400
300
5 200Voltage / V
e 100
0 1 2 3 4 5 6 7 8 9 10Voltage / V
Figure 3-24. Current and radiance profiles of devices consisting of Yb(TPP)TP in PPP-OR11. a) Current density of 5 (squares), 10 (triangles), 15 (circles) mol% of Yb(TPP)TP in PPP-OR11 with the i-V profile of PPP-OR11 (diamonds) included. Inset shows the log(current) verses voltage, b) Near-infrared irradiance of 5 (squares), 10 (triangles), 15 (circles) mol% of Yb(TPP)TP in PPP-OR11.
Reproduced with permission o f the copyright owner. Further reproduction prohibited w ithout permission.

100
Power output verses power input plots of these devices are shown in Figure 3-26.
Power input increases linearly until 2000 mW cm'2. After 2000 mW cm'2, the output
power increased sublinearly.
1e-4 r
1e-5
>0 c1 1 e- 6
5EUJE 1e-43c «3a
UJ
15cw0
sUJ 1e-6
I •
nl I I . . . . . . i . ......... i „ 1-
u %* X \
H 1---------------------- 1-------1---- i I I I I I [------------1-------1---- H
1e-4
1e-5 r
# > "■■■ * %wmm
.
1e-610 1 0 0
-2Current Density / mA cm
Figure 3-25. Log-log plot of near-infrared efficiency of a) 5 mol%, b) 10 mol%, and c) 15 mol% Yb(TPP)TP in PPP-OR11 verses current density.
Reproduced with permission o f the copyright owner. Further reproduction prohibited w ithout permission.

101
Input Power / mW cm'
Figure 3-26. Log-log plot of near-infrared power output of a) 5 mol%, b) 10 mol%, and c) 15 mol% Yb(TPP)TP in PPP-OR11 verses input power.
The power efficiency of the devices is on the order of 10' . Commerical GaAs
LEDs emitting at similar wavelengths typically have power efficiencies of 10' 2 . 142 Thus
Reproduced with permission o f the copyright owner. Further reproduction prohibited w ithout permission.

102
inorganic near-infrared emitting LEDs have a significantly higher power efficiencies than
organic LEDs.
Near-Infrared Electroluminescence of Yb(TPP)L(OEt)3 Blended into PPP-ORI1
Devices were next prepared by blending Yb(TPP)L(OEt) 3 (Figure 3-22) with PPP-
OR11. The concentration of Yb(TPP)L(OEt) 3 was varied from 5, 10, and 15 mol%. An
example of the electroluminescence spectra of a device containing 15 mol%
Yb(TPP)L(OEt) 3 in PPP-OR11 is shown in Figure 3-27. Graphs of the current and
irradiance verses applied potential are shown in Figure 3-28. The electroluminescence
spectra at this concentration show complete quenching of the PPP-OR11 emission and
3+ 2 2predominately near-infrared emission from Yb at 977 nm. The F5/2 —> F7 /2 emission of
Yb(TPP)L(OEt)3, like Yb(TPP)TP, is split into several peaks due to crystal field effects.
Between 600 and 800 nm there are several bands observed. These bands are composed
of Yb(TPP)L(OEt) 3 ring fluorescence and phosphorescence and fluorescence from a free
base TPP impurity. The feature at 440 nm is attributed to the S2 —»So transition of the
porphyrin ring. The turn-on voltages for the devices are 6 V for the 5 mol% and 4 V for
the 10 mol% and 15 mol% devices. Devices that contain increasing amounts of
Yb(TPP)L(OEt) 3 exhibit lower resistivity, as shown by the fact that the current density
increases with increasing Yb(TPP)L(OEt) 3 concentration at the same voltage. This
strongly suggests that the porphyrin ligand plays a controlling role as a charge carrier in
the device. The current densities of Yb(TPP)L(OEt) 3 devices however are similar to the
devices prepared with Yb(TPP)TP. This suggests that the axial ligand has little influence
on charge transport in the device.
Reproduced with permission o f the copyright owner. Further reproduction prohibited w ithout permission.

103
(A4-1
4a 0.8
.1? 0.6mc0
Q 0 4co4-4ox:o.
LU
Wavelength I nm
0.2
0.0800 900 1000400 500 600 700
Wavelength I nm
Figure 3-27. Electroluminescence spectra of 15 mol% Yb(TPP)L(OEt) 3 in PPP-OR11 from 5 to 12 V in 1 volt increments.
The efficiencies of devices made with Yb(TPP)L(OEt) 3 blended in PPP-OR11 peak
between 30-50 mA as shown in Table 3-2 and Figure 3-29. The electroluminescence
efficiencies of the near-infrared emission increase with increasing concentration of
Yb(TPP)L(OEt) 3 with values of 2.3 x 10'5, 3.5 x 10'5, and 8.0 x 10' 5 at 30 mA cm ' 2 for 5,
10 and 15 mol%, respectively. They peak around 30 mA cm ' 2 and decrease with
increasing current density. Similar to Yb(TPP)TP blended into PPP-OR11, there is a
significant amount of scatter in the efficiency data at low concentrations of
Yb(TPP)L(OEt)3 . However, as the concentration of Yb(TPP)L(OEt) 3 increases, the
scatter in the data begins to decrease and becomes apparent that the near-infrared
efficiency decreases with increasing current density. Thus the L(OEt) 3 ligand may
prevent the aggregation necessary for charge hopping to occur.
The decrease in near-infrared efficiency with increasing current density is due to
two possible factors. First, because the lifetime of the lanthanide excited state is long,
approximately 40 psec for Yb(TPP)L(OEt)3 , at very high current densities saturation of
Reproduced with permission o f the copyright owner. Further reproduction prohibited w ithout permission.

104
the emissive sites can occur. 53 Work by others has shown that the decrease in efficiency,
which occurs at a much lower current density than saturation, is due to triplet-triplet
annihilation. 143 A second possibility is permanent degradation of the device through
chemical reactions.
600
< 10
4 00
*? 300
Q 200 Voltage I V
1 0 0
O i l
0 11--------® ® M .......... Hi1" 1 11 'T —-----1----------1----------1----------1----------1---------X
0 1 2 3 4 5 6 7 8 9 10 11 12
Voltage I V
Figure 3-28. Current and radiance profiles of devices consisting of Yb(TPP)L(OEt) 3 in PPP-OR11. a) i-V plot with various 5 (squares), 10 (triangles), 15 (circles) mol% of Yb(TPP)L(OEt) 3 in PPP-OR11. b) near-infrared radiance of 5 (squares), 10 (triangles), 15 (circles) mol% of Yb(TPP)L(OEt) 3 in PPP- OR11.
Reproduced with permission o f the copyright owner. Further reproduction prohibited w ithout permission.

105
Table 3-2. Near-infrared external EL efficiencies of 5, 10, 15 mol% concentrations of _________ Yb(TPP)L(OEt) 3 blended into PPP-OR11 at various current densities.
5 mA cm 10 mA cm'2 30 mA cm' 2 50 mA cm'2 100 mA cm'2
_ _ _ _ _ 23 x 10-e 5 . 1 x 10'6 2.3 x 10_i 2.9 x 10‘S 2.5 x \ 0 4
10 mol% 1.4 x 10‘ 5 2.7 x lO '5 3.5 x lO ’5 3.5 x 10'5 3.2 x lO '515 mol% 1.6 x 10⁻⁴ 1.3 x lO '4 8.0 x lO '5 7.2 x lO '5 4.8 x lO '5
1e-4 r
1e-5
1e-6
• * •® • . ®• • • •
• •;
75 1e-7
>»oc.©‘oSEHiE3*4cto
1e-4 r
1e-5 r
♦ ♦
UJ15 1e-6s©sUJIS z
1e-7 ;-----------1— f—i...h--i - h -H----------- 1— i— i i i - h H---------- 1— i— h
1e-4 -
1e-5
1e-6
1e-7
<h
10 1 0 0
-2Current Density I mA cm
Figure 3-29. Log-log plot of near-infrared efficiency of a) 5 mol%, b) 10 mol%, and c) 15 mol% Yb(TPP)L(OEt) 3 in PPP-OR11 verses current density.
Reproduced with permission o f the copyright owner. Further reproduction prohibited w ithout permission.

The power efficiencies of these devices, a typical value used by engineers, are low,
generally around 10'6. A plot of output power verse input power shows that most of the
input energy is not converted into near-infrared light but is non-radiatively dissipated.
1000 2000 3000 4000 5000
Input Power / mW cm ' 2
Figure 3-30. Log-log plot of near-infrared power output of a) 5 mol%, b) 10 mol%, and c) 15 mol% Yb(TPP)L(OEt) 3 in PPP-OR11 verses input power.
Reproduced with permission o f the copyright owner. Further reproduction prohibited w ithout permission.

107
Near-Infrared Emission from Ln(TPP)L in Polystyrene
Better insight into the role Ln(TPP) plays in the device was gathered by replacing
PPP-OR11 with a non-electroactive and non-fluorescent polymer. Polystyrene (PS)
(Aldrich, Mn 280,000) was chosen for comparison with PPP-OR11 because instead of the
conjugated phenylene rings ofPPP-O Rll, PS possesses phenyl rings that are not
conjugated between rings. PS is a wide-bandgap material and is generally considered to
be an electrical insulator. By contrast, due to the relatively narrower band-gap PPP-
OR11 is a semiconductor. Figure 3-31 shows the i-V and near-infrared irradiance of a
device consisting of Yb(TPP)L(OEt) 3 blended into PS. The device begins to pass current
with detectable near-infrared emission at 6 V. Above 7 V the current increases rapidly
and the near-infrared irradiance follows suit. The irradiance peaks at 22 pW cm"2 at 220
mA cm"2. The current passing through the device is much lower than devices prepared
with PPP-OR11 has the host.
The EL spectra of this device are shown in Figure 3-32 and near-infrared emission
from Yb(TPP)L(OEt) 3 is clearly observed at 977 nm. The near-infrared emission arises
from the 2F5/2 -» 2F7/2 transition of Yb3+. Visible emission is also observed at 430 nm and
between 600-750 nm which is the result of weak porphyrin ring fluorescence or a free
TPP impurity. The average EL efficiency of this unoptimized device was 3.1 x 10"4.
This experiment clearly shows that porphyrins play a very significant—if not the
dominant role—in charge transport in the PPP-OR11 device. 144
Reproduced with permission o f the copyright owner. Further reproduction prohibited w ithout permission.

108
£200
150
50
O 0 02 3 4 5 8 9 100 1 6 7
I\
®oc(6=5m
O '2
Voltage / V
Figure 3-31. Current density (circles) and near-infrared irradiance (triangles) of 10 mol% Yb(TPP)L(OEt) 3 in polystyrene (Mn: 280,000)
0.8
0.6
i i.
S 0.4
1000400 500 600 700 800 900Wavelength I nm
Figure 3-32. Electroluminescence from 6 V to 10 V for 10 mol% Yb(TPP)L(OEt) 3 in polystyrene.
Reproduced with permission o f the copyright owner. Further reproduction prohibited w ithout permission.
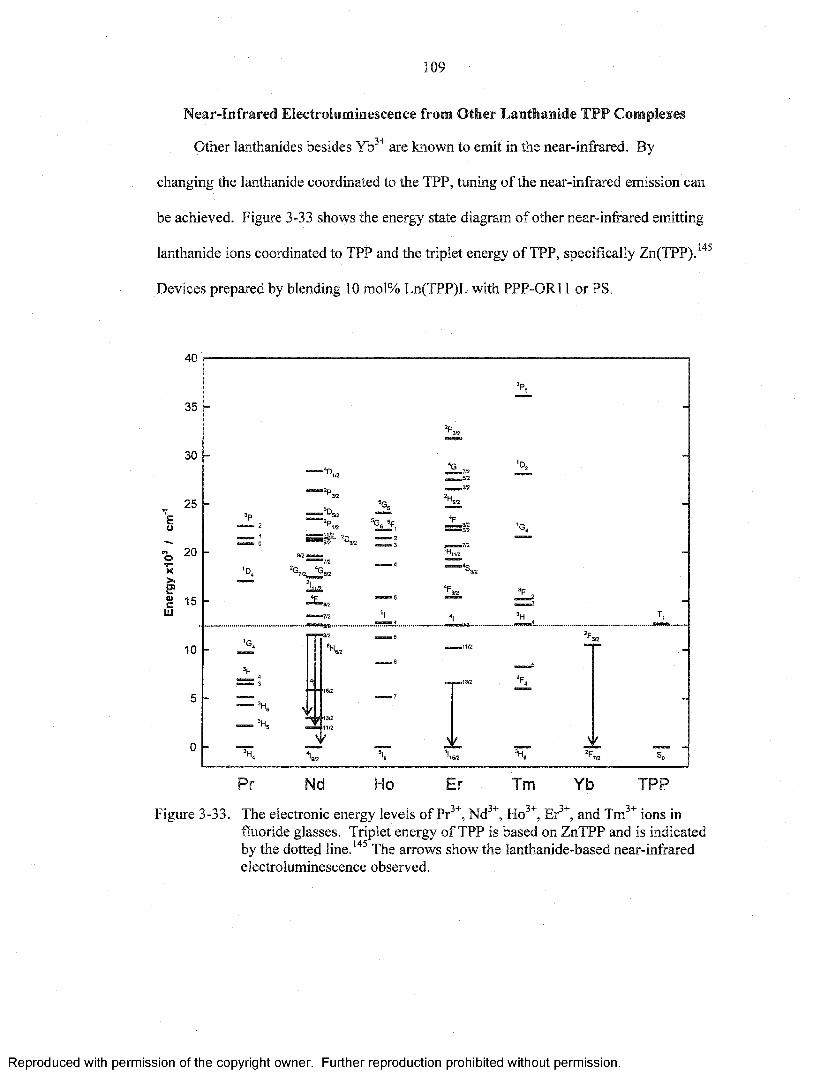
109
Near-Infrared Electroluminescence from Other Lanthanide TPP Complexes
Other lanthanides besides Yb3+ are known to emit in the near-infrared. By
changing the lanthanide coordinated to the TPP, tuning of the near-infrared emission can
be achieved. Figure 3-33 shows the energy state diagram of other near-infrared emitting
lanthanide ions coordinated to TPP and the triplet energy of TPP, specifically Zn(TPP) . 145
Devices prepared by blending 10 mol% Ln(TPP)L with PPP-OR11 or PS.
Pr Nd Ho Er Tm Yb TP P
Figure 3-33. The electronic energy levels of Pr3+, Nd3+, Ho3+, Er3+, and Tm3+ ions influoride glasses. Triplet energy of TPP is based on ZnTPP and is indicated by the dotted line. 145 The arrows show the lanthanide-based near-infrared electroluminescence observed.
Reproduced with permission o f the copyright owner. Further reproduction prohibited w ithout permission.

Nd(TPP)L(0 Et) 3 blended into polystyrene shows three near-infrared transitions
which include emission at 880 nm (4 F3/2 -> Ahn), 1060 nm (4F3/2 -> 4Ii 1/2 ), and 1300 nm
(4F3/2—> 4Ii 3/2) (Figure 3-34a). Near-infrared emission was detected at as little as 6 V.
Er(TPP)L(OEt) 3 blended in PS shows a single emission peak at 1520 nm corresponding
to the 4 Ii3/2 —>4 Ii5 /2 transition of Er3+ (Figure 3-34b). The shape of the lower energy side
of the Er3+ emission may be affected because the rapid drop off in sensitivity of the
InGaAs detector used at 1560 nm. Also, no other near-infrared Er3+ emissions were
detected. This is surprising since the A\\m energy state matches well with the TPP triplet
level (12,700 cm'1) and 4In/2 ->4Ii5/2 transition at 970 nm is a known emissive transition.
No near-infrared emission was detected for Pr(TPP)TP at 1,000 or 1,300 nm. For near-
infrared emission from Pr3+ to occur either, the ^ 2 or *G4 state must be populated (see
the energy diagram above).Energy transferred from the porphyrin ligand would populate
the !G4 state. Since the ^ 4 state is within 3000 cm ' 1 of the 3F4 state, rapid deactivation
via coupling to vibrational modes of C-H bonds can prevent the ^ 4 state from emitting
in the near-infrared. The Tm3+ transition in the near-infrared at 1800 nm is too far in the
near-infrared to be detected using our liquid nitrogen cooled InGaAs detector. However,
in the regions that electroluminescence could be detected, other Tm3+ based
luminescence, such as the 3He—»3Hs transition, at 1 2 0 0 nm was not observed.
Ho(TPP)TP in PPP-OR11 emitted a very weak emission at 1,200 nm. (Figure 3-34c) The
weakness of the emission arises from the % state rapidly relaxing to the SI7 state which is
only 2,000 cm' 1 lower in energy. 5I7-»5Ig is the transition from the lowest excited state
which would have an emission at 2 , 0 0 0 nm which is far beyond the sensitivity range of
our detectors.
Reproduced with permission o f the copyright owner. Further reproduction prohibited w ithout permission.

I l l
250
■O 2 0 0 c
1 5 0
§L
o£.Q.
9 0 0 1000 1100 1200 1 3 0 0 1 4 0 0
Wavelength I nm
amcoox:
CL
8 0
6 0
20
0
9 0 0 1 0 0 0 1 1 0 0 1 2 0 0 1 3 0 0 1 4 0 0 1 5 0 0
Wavelength / nm
■o£oowu ,osam£Oo
J Za.
1 3 0 0 1 4 0 01200 1 5 0 0
Wavelength / nm
Figure 3-34. Electroluminescence of other near-infrared emitting lanthanides, a) 10 mol% Nd(TPP)TP in polystyrene at 9 V. b) 10 mol% Er(TPP)TP in polystyrene at 12 V c) 20 mol% Ho(TPP)TP in PPP-OR11 at 9 V
Reproduced with permission o f the copyright owner. Further reproduction prohibited w ithout permission.

112
Visible Emission of Lanthanide Complexes in Polystyrene
While near-infrared electroluminescence has been the main area o f interest, usually
these devices emit in the visible region also. The visible electroluminescence spectra at 9
V for 1:1 weight ratio Ln(TPP)TP blended into polystyrene are shown in Figure 3-35.
All four complexes show a series of emission peaks between 550 and 750 nm which
come from the porphyrin dopant itself since the host does not emit. For Er(TPP)L(OEt)3
in PS (Figure 3-35a), there are four bands observed with peak maxima occurring at 453,
617, 639, 662, and 725 nm. The peaks at 662 and 725 nm are from an impurity of free
base TPP. The other peaks at 617 and 639 nm are emission from the metalloporphyrin
ring, since none of the transitions correspond with Er3+/ —»/transitions and are similar to
the fluorescence observed from closed shell transition metal metalloporphyrin such as
ZnTPP. The very weak emission peak at 453 nm is the S2 -»So transition from the
porphyrin.
The electroluminescence of Ho(TPP)L(OEt) 3 in polystyrene (Figure 3-35b) shows
a very different emission pattern than the other complexes with peaks at 450 nm, a
shoulder at 608 nm, and 633 nm with a shoulder at 658 nm. The band at 715 nm which is
found in all the other complexes is missing. The position of the band suggests metallated
porphyrin fluorescence, however, the photoluminescence emission of Ho(TPP)L(OEt)3 in
this region is similar to the fluorescence of the other lanthanide porphyrins. This visible
emission may be from the 5Fs->5Ig transition of Ho3+ which would occur at 645 nm,
which is in the same region where this new emission band occurs. Transient
electroluminescence lifetime measurements should confirm if this band is lanthanide
based because the lifetime would be in the microsecond timescale. Interestingly, this
Reproduced with permission o f the copyright owner. Further reproduction prohibited w ithout permission.

113
3000
2500
2000
1500
■a 1000
I<j> 500
mc
500iJC300
200
100
500
400
300
200■O100
k .0)a.2oZ. e
1600
1400
a.1200
1000
800
600
400
200
900 1000600 700 800300 500400
Wavelength / nm
Figure 3-35. Visible EL at 9 V of 1:1 weight ratio of Ln(TPP)L(OEt) 3 in PS: a) Er3+ b) H o3+ c) Nd3+ and d)Pr3+
Reproduced with permission o f the copyright owner. Further reproduction prohibited w ithout permission.

114
emission band is -4,000 cm' 1 above the lowest energy triplet of the porphyrin. Thus,
direct excitation of Ho3+ 5Fg through the porphyrin’s lowest energy triplet probably does
not occur.
Nd(TPP)L(OEt) 3 in polystyrene (Figure 3-35c) has similar peak pattern to
Er(TPP)L(OEt) 3 and Pr(TPP)L(OEt) 3 except three peaks at 814, 878, and 930 nm. These
peaks correspond to the AVy2~ ^ h a transition of Nd3+. This transition is split by crystal
field effects for similar reasons to the splitting observed in Yb3+. In this case the %/2
state splits into a maximum of five crystal field states of which three are clearly observed.
Pr(TPP)L(OEt) 3 in polystyrene (Figure 3-35d) has EL emission peaks at 448, 610,
653, and 718 nm. No other Pr3+ based emission is observed.
Dual Emitting Near-Infrared Devices
A common method of enhancing Er3+ emission at 1550 nm is energy transfer from
Yb3 + . 146 ,147 A device was prepared by blending 10 mol% of Yb(TPP)L(OEt) 3 and 10
mol% Er(TPP)L(OEt) 3 into PPP-OR11. The electroluminescence spectrum from the
visible to near-infrared region as shown in Figure 3-36 is a composite of spectra recorded
by a CCD detector (400-1100 nm) and an InGaAs detector (1000-1550 nm). The visible
region consists of four peaks. The highest energy peak found at 430 nm is the weak
S2 ~»So emission from the metalloporphyrin. The next peak found at 602 nm is Si->So
fluorescence from the metallated porphyrin ring. The two peaks at 649 and 719 nm are
the fluorescence from a small amount of free base tetraphenylporphyrin impurity.
At 977 nm 2Fs/2 —»2F7 /2 emission of Yb3+ with an external quantum efficiency of 4.4
x 10' 5 is observed. At 1520 nm the EL emission from Er3+ has an external quantum
efficiency of 7.8 x 10'7. These quantum efficiencies underestimate the true external
Reproduced with permission o f the copyright owner. Further reproduction prohibited w ithout permission.
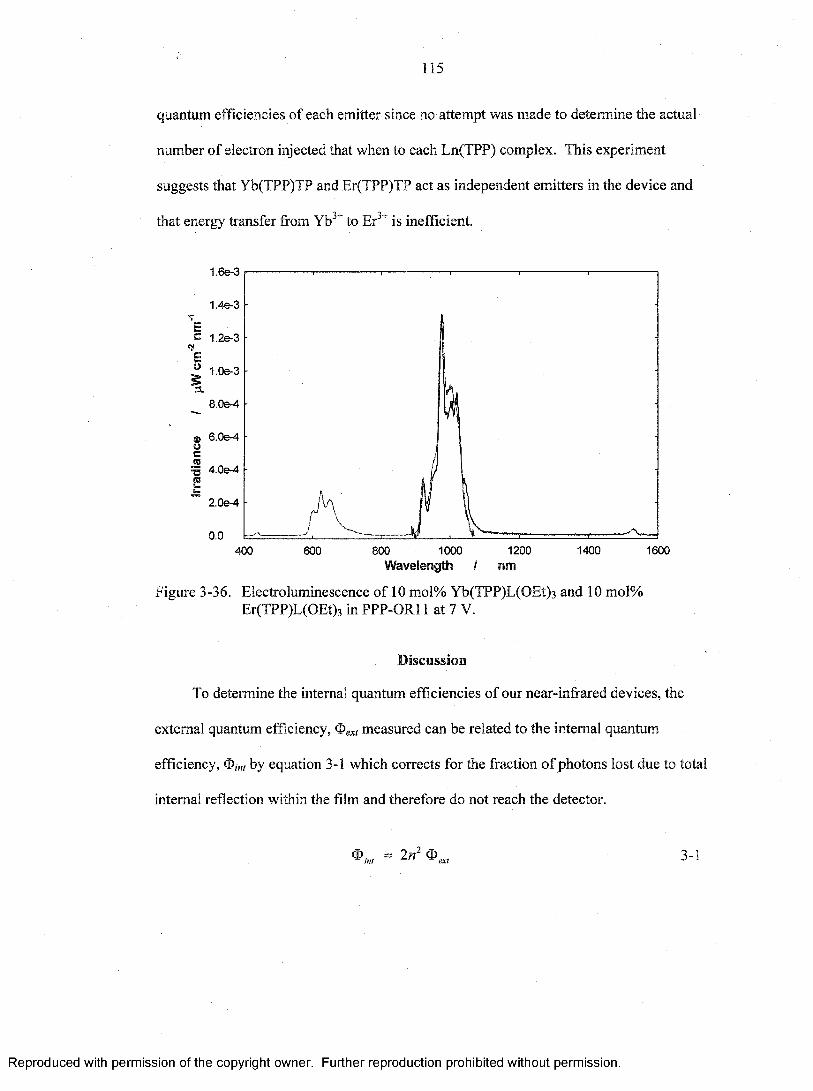
115
quantum efficiencies of each emitter since no attempt was made to determine the actual
number of electron injected that when to each Ln(TPP) complex. This experiment
suggests that Yb(TPP)TP and Er(TPP)TP act as independent emitters in the device and
that energy transfer from Yb3+ to E r 3 + is inefficient.
1.6e-3
1.4e-3
= 1.2e-3
° 1.0e-3
8.0e-4
6.0e-4
4.0e-4
400 600 800 1000 1200Wavelength I n m
1400 1600
Figure 3-36. Electroluminescence of 10 mol% Yb(TPP)L(OEt) 3 and 10 mol% Er(TPP)L(OEt) 3 in PPP-OR11 at 7 V.
Discussion
To determine the internal quantum efficiencies of our near-infrared devices, the
external quantum efficiency, <t>ext measured can be related to the internal quantum
efficiency, <f>inl by equation 3-1 which corrects for the fraction of photons lost due to total
internal reflection within the film and therefore do not reach the detector.
<E> = 2n ®int ext 3-1
Reproduced with permission o f the copyright owner. Further reproduction prohibited w ithout permission.

116
Assuming a refractive index, n, of 1.6 for a PPP polymer, 148 the internal EL
efficiencies of the Yb(TPP)L devices are tabulated in Table 3-3. The internal efficiencies
are on the order of 10' 4 to 10' 3 for the devices containing Yb(TPP)L in PPP-OR11. This
compares well with the external efficiency of 3 x 10"4 estimated for a vapor deposited
Yb(DBM)3phen device59 and 1.5 x IQ’4 reported for device consisting of a near-infrared
emitting ionic dye (LDS 821) in PVK . 149
Table 3-3. Maximum near-infrared external and internal EL efficiencies of PPP-OR11and Yb(TPP)L blended into PPP-OR11 or PS.
Concentration Yb(TPP)TPExternal
Yb(TPP)TPInternal
Yb(TPP)L(OEt) 3
ExternalYb(TPP)L(OEt) 3
Internal5 mol% in PPP 5.2 x 10_i 2.7 x 10' 4 2.9 x IQ' 5 1.5 x 10' 4
10 mol% in PPP 1.8 x IQ' 4 9.2 x 10' 4 3.5 x 10' 5 1 . 8 x 1 0 ' 4
15 mol% in PPP 1 . 2 x 1 0 ' 4 6.7 x 1C4 1 . 6 x 1 0 ' 4 8 . 2 x 1 0 ' 4
1 0 mol% (relative to PPP) in PS
- ~ 3.1 x 10' 4 1 . 6 x 1 0 ' 3
. . . . . ------------------- - .
Visible EL Efficiency of PPP-OR11 Only: External: 1.2 x 10' Internal: 6.1 x 10'
Equation 3-1 can be modified to calculate the fraction of useful electron and hole
recombinations that occur by relating the internal quantum efficiency to the fraction of
electrons and holes which recombine on the active species, qe/h and the
photoluminescence quantum efficiency of the emitter, ®pl. as shown in equation 3-2 to
give equation 3-3.
® i n t ~ % / h ^ P L 3.2
Reproduced with permission o f the copyright owner. Further reproduction prohibited w ithout permission.

117
4>„ 3-3
If the photoluminescence efficiencies of the lanthanide complexes in the polymer
films are similar to the values determined in solution (Table 1-6 and Table 1-7), then the
fraction o f electron-hole pair recombination can be calculated as reported in Table 3-4.
These numbers represent the apparent fraction of electrons and holes that recombine to
produce useful excited states. For PPP-OR11 due to spin statistics 75% of the electron-
hole recombination events that occur on the polymer is believed to result in triplet
excitons which do not contribute to light output from the device. From the table it is
apparent that as the porphyrin concentration increases, the probability o f useful electron-
hole recombination increases.
Table 3-4. Apparent fraction of electron-hole recombination of PPP-OR11 andYb(TPP)L blended into PPP-OR11 or PS.
Concentration Yb(TPP)TP (<Dpi = 3.2 x IQ'2) Yb(TPP)L(OEt) 3 (Opl = 2.4 x 10'2)
5 mol% in PPP 8.4 x 10' 3 6.3 x 10"3
10 mol% in PPP 2.9 x 10' 2 7.5 x 10' 3
15 mol% in PPP 2.1 x IQ' 2 3.4 x 10' 2
1 0 mol%(relative to PPP) in PS
— 6.7 x 10' 2
Q>pl of PPP-OR11 was determined to be 0.8 in the solid state thus the fraction of charge recombination for PPP-OR11 only is 7.6 x 1 O'3.
Charge injected into the active layer will probably be transported along the PPP-
OR11 chains at low concentration of Yb(TPP)L. There are three possible fates of the
charge while on PPP-OR11. First, the charge bridges the two electrodes and is
annihilated at the opposite electrode. This is the most likely scenario because hole
Reproduced with permission o f the copyright owner. Further reproduction prohibited w ithout permission.

118
transport is more rapid than electron transport in conjugated polymers. For example, the
hole and electron mobilities of polyfluorene, a blue emitting conjugated polymer that is
A ^ 1 1 0 1
structurally similar to PPP-OR11, are approximately 10' cm V' sec" and 10' cm V"
sec'1, respectively. 150 This shows that hole transport mobility in the polymer is about
1000 greater than electron mobility. Although the carrier mobilities of PPP-OR11 have
not been measured for PPP-OR11, it is likely that similar results would be obtained.
Thus for PPP-OR11, the majority of holes are annihilated at the cathode before
encountering an electron with the host. A second possible fate of carriers in PPP-OR11 is
the charge recombines with the opposite carrier and excites the polymer, after which the
exciton formed can either radiatively decay or transfers to a nearby Ln(TPP)L complex.
The third scenario involves the charge being trapped by the lanthanide porphyrin
complex. The Ln(TPP)L molecules are excited by direct charge trapping of the holes on
Ln(TPP)L followed by electron capture and recombination on Ln(TPP)L instead of
exciton formation on the host followed by energy transfer. This conclusion was drawn
for EL devices involving platinum (II) 2, 3, 7, 8 , 12, 13, 17, 18-octaethyl-21H, 23H-
porphyrin Pt(OEP) blended into poly(9,9-dioctylfluorene) (PFO) . 151 Thus, as the
concentration of Ln(TPP)L increases, more charge can be trapped by the TPP. This is
observed in the turn-on voltages of devices of Yb(TPP)acac blended in MEH-PPV which
increases from 4 to 5 V in 5 mol% to 20 mol% Yb(TPP)acac, respectively. This is a clear
indication of charge trapping in the doped system. However, the opposite trend is
observed in devices made with Yb(TPP)L blended in PPP-OR11 where the turn-on
voltage decreases from 6 V to 4 V for 5 mol% and 15 mol% Yb(TPP)TP in PPP-OR11,
respectively. This may simply be the due to the detector sensitivity since devices
Reproduced with permission o f the copyright owner. Further reproduction prohibited w ithout permission.
119
containing a large amount of Yb(TPP)TP irradiate more near-infrared output at a given
voltage. Further studies using longer detector integration times may clarify this
observation.
Charge hopping between lanthanide porphyrin complexes is another possibility for
charge transport if the lanthanide complexes are in close proximity to each other. It has
been shown for ZnTPP complexes dispersed in poly(2-vinylpyridine) that charges hop
between ZnTPP complexes when the average separation between complexes is 1.1 nm . 152
To estimate the spacing between lanthanide porphyrin complexes in PPP-OR11, the
following equation was used:
D1
K 3-4
. Z n V n + Q - Z n W p p p .
where %ls the mole fraction of the molecule and V is its volume. This equation assumes
a random dispersion of the Ln(TPP)L complex. Wegner determined that the interchain
spacing of poly(2 ,5-di-n-dodecyl-1 ,4-phenylene) in solid films was 6.9 A.153 Assuming
this is the radius of a sphere of a PPP-OR11 repeat unit, the volume of a PPP-OR11
repeat unit is 1375 A3. (This is an overestimation of the true volume.) From x-ray
crystallography data, the volume of Yb(TPP)TP is 3203 A3. Therefore, at 5 and 15 mol%
concentration, it is estimated that each Yb(TPP)TP molecule is separated on an average
of 1.5 and 1.1 nm, respectively. Since electrochemical data of largely conjugated guest
dyes suggest that charge transport would be a more significant driving force than Forster
energy transfer on EL device efficiency, it is suspected that charge transport between
lanthanide porphyrin complexes occurs in the 15 mol% Ln(TPP)L/PPP-ORl 1 devices.
Reproduced with permission o f the copyright owner. Further reproduction prohibited w ithout permission.

Recently, the energy transfer processes of devices containing tris(2-phenylpyridine)
iridium [Ir(ppy)3] or PtOEP blended into poly[9,9’di-tt-hexyl-2,7-fluorene-alt-l,4-(2,5-di-
«-hexyloxy)phenylene] (PFHP), a polymer with a similar structure to PPP-OR11, have
been explored. 154 It was shown that PFHP readily aggregated preventing dopant
molecules from being in close proximity with host molecules thereby inhibiting singlet
and triplet energy transfer processes. The EL spectra of 2wt% Ir(ppy) 3 in PFHP was
dominated by PFHP emission. When the Ir(ppy) 3 concentration was increased to 8 wt%
EL emission from Ir(ppy) 3 dominated In addition, TEM showed aggregates of Ir(ppy) 3
in PFHP. (Films containing 8 wt% Ir(ppy) 3 in PVK lacked such aggregates.) Thus direct
charge trapping and recombination on the dye molecule was suspected.
For the 5 mol% Yb(TPP)L/PPP-OR 11 device, even though the estimated separation
between porphyrin molecules is greater than 1 . 1 nm, charge transport between lanthanide
porphyrin complexes may occur due to aggregation in the film. As stated earlier, the
equation used that the lanthanide porphyrin complexes are non-interacting spheres
homogenous dispersed in the polymer matrix. In reality, aggregation of PPP-OR11 or
Yb(TPP)L or both may play an important role in the device efficiency. At the
concentrations that Yb(TPP)L is blended into PPP-OR11, it is probable that either
aggregation ofPPP-ORl 1 and Yb(TPP)L occurs (Figure 3-37). TEM images of the films
could show if Yb(TPP)L is aggregated. Thus, the average distance between Yb(TPP)L
may be smaller than originally estimated and charge hopping between Yb(TPP)L
molecules may occur.
Reproduced with permission o f the copyright owner. Further reproduction prohibited w ithout permission.
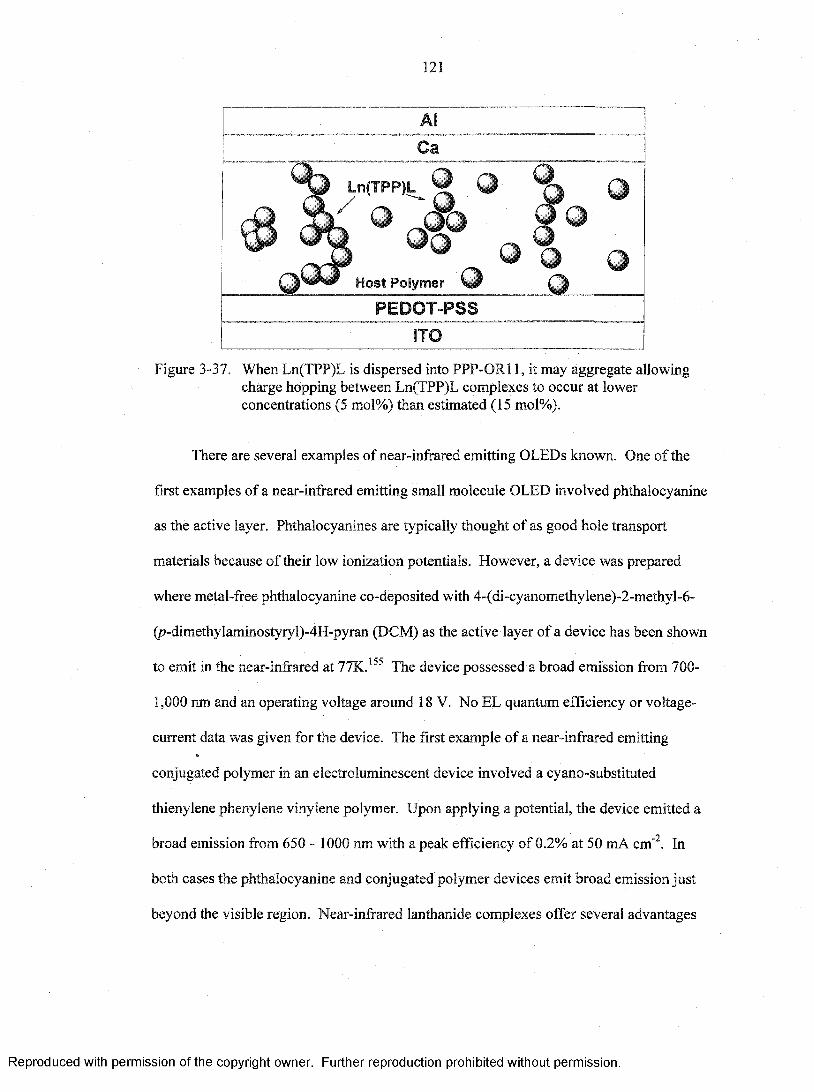
121
AlC a"
^ Ln(TPP)L ® Q(TPP)L^ p i ^ Qo J 6 9 0
° ° o ° o
Host Polymer Ojl
PEDOT-PSS
ITO
Figure 3-37. When Ln(TPP)L is dispersed into PPP-0R11, it may aggregate allowing charge hopping between Ln(TPP)L complexes to occur at lower concentrations (5 mol%) than estimated (15 mol%).
There are several examples of near-infrared emitting OLEDs known. One of the
first examples of a near-infrared emitting small molecule OLED involved phthalocyanine
as the active layer. Phthalocyanines are typically thought of as good hole transport
materials because of their low ionization potentials. However, a device was prepared
where metal-free phthalocyanine co-deposited with 4-(di-cyanomethylene)-2-methyl-6-
(p-dimethylaminostyryl)-4H-pyran (DCM) as the active layer of a device has been shown
to emit in the near-infrared at 77K . 155 The device possessed a broad emission from 700-
1,000 nm and an operating voltage around 18 V. No EL quantum efficiency or voltage-
current data was given for the device. The first example of a near-infrared emitting
conjugated polymer in an electroluminescent device involved a cyano-substituted
thienylene phenylene vinylene polymer. Upon applying a potential, the device emitted a
broad emission from 650 - 1000 nm with a peak efficiency of 0.2% at 50 mA cm'2. In
both cases the phthalocyanine and conjugated polymer devices emit broad emission just
beyond the visible region. Near-infrared lanthanide complexes offer several advantages
Reproduced with permission o f the copyright owner. Further reproduction prohibited w ithout permission.

122
over purely organic materials including sharp spectral transitions and emission well
beyond 1 0 0 0 nm.
Several groups including ours have fabricated near-infrared OLEDs containing
Nd3+, Er3+, Yb3+ ions. Some of the earliest work erbium work used the Er3+ analog of
A I Q 3 to generate near-infrared emission at 1.5 pm at room temperature. 1 3 5 ,1 5 6 These
vapor-deposited devices were characterized with turn-on voltages of 12 V but possessed
irreproducible electroluminescence spectra. Epstein and others prepared a device made
of Er(acac)3phen (phen = 1,10-phenanthroline) blended with poly(7V-vinylcarbazole),
poly(methyl-methacrylate) or poly[2-methoxy, 5-(3 ’,7 ’ -dimethy 1-octyloxy)]-p-
phenylenevinylene which showed near-infrared emission from Er3+ at 1.54 pm with a
turn-on voltage of approximately 10 V . 1 5 7 ,158 Our attempts of near-infrared
electroluminescent devices consisted of Er(TPP)acac in MEH-PPV devices which
displayed near-infrared emission at 1.5 pm, similar turn-on voltages to others EL devices
(-13 V) and good reproducibility. No quantitative data has yet been reported however it
is expected to be low. The low quantum yield of Er3+ complexes, both EL and PL, is
mainly attributed to rapid deactivation of the excited state by vibronic coupling to C-H
bonds. To increase the EL efficiency, this fundamental problem could be lessened by
moving the C-H bonds away from the lanthanide and binding the lanthanide to atoms
with low vibrational bond energies. Since near-infrared emission of GaAs doped with
Er3+ is known, the possibility exists that blending Er:GaAs nanocrystals with a
conjugated polymer may provide a new and more efficient methods of near-infrared
electroluminescence. 159 A similar idea using a combination of InAs-ZnSe semiconductor
Reproduced with permission o f the copyright owner. Further reproduction prohibited w ithout permission.

123
nanocrystals and conjugated polymers has been reported where a tunable near-infrared
PLEDs was created which exhibit external quantum efficiencies approaching 0.5 % . 160
Neodymium emission has been observed by several investigators. Usually Nd-
containing small molecules are vapor deposited onto ITO as the active layer. For
example, a vapor deposited neodymium-containing /ra -( 8 -hydroxyquinoline) complex
sandwiched between ITO and Mg/Ag began emitting at the three near-infrared emissive
transitions of Nd3+ (4F3/2 —> %/2 , 4F3/2 —> and 4F3/2 —> 4 Ii3/2 ) when 13 V was applied.
161 A neodymium containing near-infrared device has also been fabricated using a blend
of poly(dioctylfluorene-co-benzothiadiazole) and lissamine-functionalized Nd3+
complex. 58 It produced a weak near-infrared emission at 850 nm which has been
ascribed to the Nd3+ transition when a large voltage was applied (31 V). Our group has
shown that near-infrared emission from Nd(TPP)TP in PPP-OR11 can be generated at
little as 6 V. The improved performance of our devices is possibly due to the improved
charge transporting properties of the porphyrin ligand compared to the lissamine-
functionalized Nd3+ complex used.
Yanagida et al. vapor deposited Er3+, Nd3+, or Yb3+ fm-(dibenzoylmethanato)
monobathophenanthronline complexes to prepare near-infrared devices. 59 ,133 Their work
is one of the few that has estimated the near-infrared efficiencies of lanthanide containing
OLEDs. The quantum yields reported were based on comparisons to analogous Eu3+
devices with EL quantum efficiencies of 3 x 10'4, 7 x 10‘5, and 1 x 10' 6 for Yb3+, Nd3+,T I
and Er containing devices, respectively. We have been able to directly measure the
Yb(TPP)L devices directly using a calibrated silicon CCD and a calibrated silicon
photodiode and report near-infrared efficiencies up to 3 x 1 O' 4 for unoptimized devices of
Reproduced with permission o f the copyright owner. Further reproduction prohibited w ithout permission.

124
Yb(TPP)TP in polystyrene. (Recent work of Garry Cunningham has shown that device
efficiencies up to 1.3 x 10"3 can be obtained by blending AIQ3 with Yb(TPP)L(OEt) 3 into
polystyrene.)
Conclusion
Electroluminescent devices have been prepared by blending near-infrared emitting
lanthanide complexes into conjugated and non-conjugated polymer hosts. The
wavelengths of near-infrared electroluminescence can be varied by changing the
lanthanide metal center. In addition, mixing two different near-infrared emitters allows
for greater variations in near-infrared luminescence. In general, devices prepared using
lanthanide porphyrin complexes perform better in terms of near-infrared power output
(~10 pW cm'2) and quantum efficiencies (~3 x 10‘4) than devices prepared with
lanthanide tra-|3-diketonates. 136 The comparison of devices prepared using MEH-PPV to
PPP-OR11 indicates that spectral overlap between the polymer fluorescence and the
dopant’s absorption spectra may play an important role in device performance.
Experiments with polystyrene show that charge transport along the porphyrin ring,
particularly at high dopant concentrations, plays a major role in carrier transport,
trapping, and recombination.
Experimental
Lanthanide fra-P-diketonate and tetraphenylporphyrin complexes were prepared by
Tim Foley or Alison Knefley according to literature procedures .5 3 ,5 6 ’162 MEH-PPV was
either provided by Prof S. Ramakrishnan or purchased from R. W. Sands and used as
received. PPP-OR11 was synthesized by Mohammed Bouguettaya.
Reproduced with permission o f the copyright owner. Further reproduction prohibited w ithout permission.

125
ITO Etching
Electroluminescent devices were prepared by masking, then etching the ITO glass
(Delta Technologies, Rs = 8-12/D) by exposure to aqua regia vapor. The ITO glass was
first cut into 1 inch by 1 inch squares using a diamond tipped glass cutter. The ITO glass
was rinsed with isopropyl alcohol to remove any fingerprints or other residual oils and
then was allowed to air-dry. Scotch™ packing tape was placed over the entire piece of
ITO glass. Care was taken to prevent any bubbles or ridges in the tape. Using a black
marker, the areas where tape would be removed were drawn on the ITO as shown in
(Figure 3-38).
12 mm
5 mm
25 mm
Figure 3-38. Darker areas indicated areas where ITO will be etched away when exposed to aqua regia vapors. Lighter areas represent areas masked by Scotch™ packing tape.
After marking the tape, a razor blade was used to gently cut the tape along the
marked edges. A metal spatula was then used to gently remove the small rectangular
pieces of tape. The remaining edges were pressed to ensure good contact between the
ITO and tape. Now, the masked ITO glass was placed onto a beaker which contained a
freshly prepared aqua regia (3:1 v:v HChHNOs) solution. A 25 mL beaker was cut to
Reproduced with permission o f the copyright owner. Further reproduction prohibited w ithout permission.

126
approximately 2 inches in height to minimize the amount of aqua regia used (~5 mL).
The masked ITO was exposed to the aqua regia vapors for 6 minutes then removed.
After removal, a cotton-tipped stick was wiped across the exposed area and then an
ohmmeter was used to check the resistivity. There should be very high (>lMO)
resistance. If a lower resistance is measured, then the ITO was exposed for 4 additional
minutes. After the ITO has been etched, the tape was removed revealing a sharp contrast
between the colorless etched regions and purple unetched regions of ITO. The ITO was
immediately rinsed multiple times with isopropyl alcohol to remove the dissolved ITO
and aqua regia present.
Masked ITO isexposed to aqua regia vapors for 6 minutes.
Aqua Regia
Figure 3-39. Masked ITO is suspended over aqua regia vapors for 6 minutes to etch away the exposed ITO.
Cleaning ITO
The etched ITO slide was then placed into a custom built holder for cleaning in a
sonicator. The teflon holder as shown in Appendix Figure B-l prevented multiple pieces
of ITO from rubbing against one another. The ITO glass in the holder was sequentially
cleaned by sonication for ten minutes in each of the following solvents: a solution of 2 0
Reproduced with permission o f the copyright owner. Further reproduction prohibited w ithout permission.

127
mg sodium dodecyl sulfate (SDS) per 500 mL water (SDS, Fisher), Milli-Q water,
acetone, and isopropyl alcohol. After rinsing the ITO glass was air-dried.
Spin Coating Hole Transport and Active Layers
PEDOT-PSS (Bayer Baytron P VP A1 4083) was used as a hole transport layer.
The PEDOT-PSS was first filtered through a 0.2 micron polysulfone filter to remove any
particulate matter. Approximately 0.5 mL of PEDOT-PSS was then spin-coated onto 1
inch by 1 inch squares of ITO coated Si0 2 (Delta Technologies, Product Number CG-
50IN-1515) at 4000 rpm and subsequently dried in a vacuum oven at 150°C for 4 hr to
remove residual water.
Solutions of desired concentration of the Ln complexes were pipetted in solutions
containing 2 mg MEH-PPV or PPP-OR11 dissolved in 1 mL CHCfi. Lanthanide
complex concentrations ranged from 1 mol% to 20 mol%. The concentration (mol%) of
the lanthanide complex dissolved in PPP-OR11 is the based on the mole ratio of the
lanthanide complex relative to the polymer repeat unit. These solutions were spin coated
onto the substrate at 800 rpm.
Metal Electrode Deposition
The films were placed glass side down onto the inverted stage built for the thermal
metal evaporator as shown in Figure 3-40. The stage was custom design to fit into the
chamber of the Denton Vacuum DV-502A system. (Appendix Figure B-2). The ITO was
then covered with a stainless steel mask with the pattern of the electrodes desired. The
masked devices is then placed in the thermal metal evaporator chamber and pumped
down to 10' 6 torr for a minimum of 4 hours at room temperature.
Reproduced with permission o f the copyright owner. Further reproduction prohibited w ithout permission.

128
MaskSchematic'''''''''--*-
▼
ITO substrate and polymer layers facing
s - - . . ^ r
r f ' -
Figure 3-40. ITO coated with polymer layers are placed face up on the inverted stage for electrode deposition. A stainless steel mask is placed squarely onto the polymer film and held in place with a paper binder clip.
Calcium and aluminum layers were sequentially deposited by thermal evaporation
thicknesses of the Ca and A 1 layers were determined to be 50 A and 2 0 0 0 A, respectively,
using an oscillating quartz crystal thickness monitor. After 30 minutes, the chamber is
purged with nitrogen and the devices were encapsulated with epoxy (Loctite quick set
epoxy) under an argon atmosphere in order to minimize exposure to oxygen and
moisture.
The process of fabricating a device can be summarized in five steps shown in Table
3-5. After the metal deposition step, devices can be tested with or without an
encapsulating layer. If an encapsulating layer is used, the epoxy covers the circular
electrode and the bridge up to the square portion of the electrode.
at 1-10 x IQ-6 torr without breaking the vacuum between metal depositions. The
Reproduced with permission o f the copyright owner. Further reproduction prohibited w ithout permission.

Table 3-5. Summary of electroluminescent device fabrication.
Step Top View Side View
1 . A clean 1 inch by 1 inch square of ITO on a glass substrate is used for etching.
ITO is etched. Lighter areas indicate area where ITO was removed (See ITO Etching). The ITO is then cleaned (See Cleaning ITO).
PEDOT-PSS is spin coated onto the etched ITO surface and then vacuum dried (See Spin Coating Hole Transport and Active Layers).
The lanthanide/polymer blend is spin coated on top of the PEDOT-PSS layer (See Spin Coating Hole Transport and Active Layers).
The metal electrodes are vapor deposited on top of the lanthanide/polymer blend (See Metal Electrode Deposition).
Electroluminescent Device Measurements
Visible and near-infrared (up to 1100 nm) electroluminescence spectra were
recorded on an ISA-SPEX Triax 180 spectrograph fitted with a liquid N 2 cooled CCD
detector (EEV CCD, 1024 x 128 pixels, 400 - 1100 nm). To accomplish this a freshly
prepared device was placed into the EL device holder such that electrical contact between
Reproduced with permission o f the copyright owner. Further reproduction prohibited w ithout permission.

130
the vapor deposited electrodes and the gold pins of the device were made and then
mounted on a stage attached to a x-y stage as shown in Figure 3-41. (See Appendix
Figure B-3 and B-4 for device holder schematics.)
Figure 3-41. Front and side view of device holder mounted on XY stage setup for EL device measurements on the Triax 180/CCD system.
The device was placed as close as possible to the Triax 180. At this distance, the
device is 4.8 cm from the entrance slit of the monochromater. Using the x-y stage, the
electrode to be measured is aligned with the center of the monochromater opening.
Power for electroluminescence measurements was supplied using a Keithley 228
voltage/current source. Positive bias was applied to one of the four comers of the device.
Negative bias was applied to the metal electrode. A primary standard tungsten lamp was
used to calibrate the CCD detector. The details of calibration and quantitative calculation
of the external quantum efficiencies can be found in Appendix A. For measurements in
the 1000-1550 nm region, a Fluorolog-2 fluorescence spectrophotometer (Jobin Yvon
Inc.) equipped with a liquid N2 cooled InGaAs photodiode was used. It is important that
the room lights are off when using the InGaAs detector to minimize stray light. Also, an
RG850 filter in the emission path helps to minimize second order scattering. For very
weak signals from EL devices, the xenon lamp may need to be turned off.
Reproduced with permission o f the copyright owner. Further reproduction prohibited w ithout permission.

CHAPTER 4 CONCLUSIONS
In the previous chapters, detailed examinations of several near-infrared emitting
systems were presented. Several general conclusions and highlights from which future
experiments may yield interesting results will be presented.
Near-Infrared Photoluminescence
Near-infrared emitting lanthanides complexes containing Yb3+, Nd3+, and Er3+ have
been shown to photoluminescence in the near-infrared. The porphyrin ligand plays the
lead role in controlling the absorption properties of the complexes while the lanthanide
directs the emissive properties by accepting energy from the porphyrin ligand and
generating near-infrared luminescence. In general, lanthanide tetraphenylporphyrin
complexes have higher near-infrared quantum yields than their (3-diketonate analogs. For
example, Yb(TPP)TP has been shown to have a quantum yield of 3 .2xl0 ' 2 which is ten
times larger than Yb(TTFA)3 phen that is considered to be one of the most efficient near-
infrared lanthanide frzs-P-diketonate complexes known. This improvement in quantum
efficiency may be due to the lower triplet energy of the porphyrin and the effective
shielding of the axial capping ligand from water molecules. Figure 3-1 shows two
proposed ligands which may improve the quantum efficiency. The first proposed ligand
shown in Figure 3-1 is a tripodal amine tetrafluoronated phenol ligand which would
coordinate first to zinc through the four nitrogen atoms. The remaining three oxygen
131
Reproduced with permission o f the copyright owner. Further reproduction prohibited w ithout permission.

132
atoms would coordinate to the lanthanide and two of them would also be shared with
zinc. This podand-framework would protect the lanthanide from solvent accessing the
metal and should help to improve the quantum efficiency.
A general trend observed is that the quantum yields of the near-infrared
photoluminescence decreases with increasing emission wavelength. This is due to the
excited state energies of the lanthanide more closely matching the non-radiative
vibrational modes of C-H bonds. In addition there is strong support in the literature that
O-H and C-H bonds in close proximity to the lanthanide metal center result in higher
non-radiative decay rates of the lanthanide excited state. One possibility to combat this
problem is to bond the lanthanide to atoms with lower bond vibrational energies. The
second ligand shown in Figure 3-1 is analogous to the j3-diketonate ligands previously
used and should coordinate in a similar manner once the nitrogen proton is removed.
Replacing C =0 and C-H bonds with S=0 and C-F bonds should reduce the non-radiative
rate via bond vibrational deactivation significantly resulting in improved
photoluminescent quantum yields.
F F
F OH F
Figure 4-1. Proposed ligands for coordination to lanthanides.
Reproduced with permission o f the copyright owner. Further reproduction prohibited w ithout permission.

133
Near-Infrared Electroluminescence
Near-infrared electroluminescent devices were prepared using near-infrared
emitting lanthanide complexes blended into conjugated and non-conjugated polymer
hosts. The near-infrared wavelength can be tuned by changing the lanthanide metal
center. In addition, mixing two different near-infrared emitters allows for greater
variations in near-infrared luminescence. In general, devices prepared using lanthanide
porphyrin complexes perform better in terms of near-infrared power output
(approximately 10 fiW cm'2) and quantum efficiencies (~3 x 10'4) than devices prepared
with lanthanide fra-p-diketonates.
While photoluminescence studies of lanthanide/polymer blends suggested that
Forster energy transfer was occurring, the electroluminescence data supported another
dominant mechanism for charge transfer. Experiments with polystyrene show that charge
transport along the porphyrin ring, particularly at high dopant concentrations, plays a
major role in carrier transport, trapping, and recombination. Thus, if more efficient
improvements in near-infrared output or quantum efficiency are desired, then exploring
the chemistry of the lanthanide complexes may be a more productive pursuit. This could
be done by changing the redox properties of the porphyrin ring and see the effect on the
electroluminescence quantum efficiency.
Since the electroluminescence (EL) quantum efficiency is the product of the
electron-hole recombination and the photoluminescence quantum yield, increasing either
factor will improve the EL quantum efficiency. Ideas for improving the
photoluminescence quantum yields were discussed either. Improving the electron-hole
injection balance could be done by blending in electron transport materials such as AIQ3 .
Reproduced with permission o f the copyright owner. Further reproduction prohibited w ithout permission.

134
APPENDIX ACALCULATION OF EXTERNAL
ELECTROLUMINESCENT QUANTUM EFFICIENCIES
This appendix outlines the experimental steps and calculations needed to
quantitatively measure the energy and photon output of an electroluminescent (EL)
device. Before measuring the energy output of an EL device, the responsivity of the
detector must be measured.
Preparing the Detector
6 . Turn on the Triax 180 Monochromater and CCD controller.
7. Start SPECTRAMAX on the computer.
8 . After initialization is complete, select Experiment mode in the Instrument ControlCenter.
9. Select from the menubar, Experiment. .. RTD. This will finish the initialization ofthe CCD detector.
10. In the Instrument Control Center, select Visual Instrument Setup
11. Click on the box labeled CCD. The temperature of the CCD is shown in degrees Kelvin.
12. Warning! Liquid nitrogen is extremely cold. Take protective measures to prevent contact with liquid nitrogen during transfer between dewars. Fill the CCD dewar with approximately 1 L of liquid nitrogen to cool the CCD to 140 K. The cooling process should take 45-60 minutes.
13. Place a mercury vapor lamp along the optical axis of the Triax 180 250 cm from the entrance slit.
14. In the Real Time Display (RTD), set the following experiment parameters:
Reproduced with permission o f the copyright owner. Further reproduction prohibited w ithout permission.

135
a. Wavelength: 700 nm
b. Integration Time: 0.1 sec
c . Entrance Slit: 0.1 mm
15. Measure the spectrum of the lamp. A sharp peak at 546±1 should be observed which corresponds with the 546.074 nm spectral line of mercury. If it not at the correct wavelength, see Appendix A of the SPECTRAMAX manual under the subheading E n te r in g Y o u r System’s Parameters for the procedure to wavelength calibrate the detector.
Calibrating the Detector
The method developed for calibrating the CCD detector is based on a procedure in
the literature. 163 A 100 W quartz tungsten halogen (QTH) lamp of known irradiance was
used to determine the responsivity of the detector. The QTH lamp was purchased from
The Eppley Laboratory, Inc. (Serial Number EH-156; Calibrated on September 18,
2002). The irradiance values supplied by the manufacturer are graphically displayed in
Figure A-l along with the photon irradiance plotted using the supplied data.
1.8e+143.5
1.6e+14| 3.0
2.51.2e+14
\ 2.0 1.0e+14
8.0e+13
sC 1.0 RJ'■U<0 0.5
6.0e+13
4.0e+13
2.0e+13
0.00.02000500 1000 1500
Ec
*8m
3o
Wavelength I nm
Figure A-l. Irradiance (solid circles) at 50 cm from the detector of a 100 W QTH (S/N: EH-156) calibrated on September 18, 2002. Photon irradiance (open squares) was calculated using the irradiance values and equation A -l.
Reproduced with permission o f the copyright owner. Further reproduction prohibited w ithout permission.

136
To convert the irradiance values, Eo(X), supplied by the manufacturer to photonic
units, NP(X), equation A-l was used.
E 0(A )ANP(X) ■■h e
A-l
16. Place the QTH Lamp 250 cm along the optical axis from the entrance slit. Note: NIST and Eppley Laboratory recommend the lamp be placed 50 cm from the detector. Because of the extremely sensitive nature of the detector, this distance is too small and will saturate the detector. Moving the lamp to 250 cm will decrease the lamp intensity by 1/25 according to the inverse square law.
17. Place a 1% transmittance filter to further attenuate the lamp intensity. The fraction of light transmitted by the filter is shown in Figure A-2.
0 . 0 1 8
0 . 0 1 6
0 . 0 1 4
Emcsh-«fr-oco32u.
0.012
0.010
0 . 0 0 8
0 . 0 0 6
0 . 0 0 4
0.002
0.0003 0 0 4 0 0 5 0 0 6 0 0 7 0 0 8 0 0 9 0 0 1 0 0 0 1 1 0 0
W avelength / nm
Figure A-2. Fractional transmittance of 1% neutral density filter.
18. In the Experiment Setup, set the following experiment parameters:
a. Wavelength: 700 nm
b. Integration Time: 0.1 sec
Reproduced with permission o f the copyright owner. Further reproduction prohibited w ithout permission.

137
c. Entrance Slit: 0.1 mm
19. Collect the emission spectrum of the 100 W QTH Lamp. An example of the lamp intensity is shown in Figure A-3.
XJcoo®toh.®Q.mc3Oo
mc®
1.8e+5
1.6e+5
1.4e+5
1.2e+5
1.0e+5
8.0e+4
6.0e+4
4.0e+4
2.0e+4
0.0300 400 500 600 700 800 900 1000 1100
Wavelength I nm
Figure A-3. Raw data collected by the CCD detector of 100 W QTH Lamp placed 250 cm away from 0.1 mm entrance slit width of monochromater. A 1% transmittance filter was placed immediately before the entrance slit.
Placing the lamp at 250 cm from the entrance slit and a 1% transmittance filter
between the lamp and entrance slit attenuates the lamp irradiance. Therefore, the energy,
E(X) entering the entrance slit can be calculated using equation A-2, where A is the area
of the entrance slit, do is 50 cm, d is the distance from the lamp to the entrance slit, F(X)
is the fraction transmittance of the neutral density filter, and Eo(X) is the irradiance of the
100 W QTH lamp.
E{X) = A F(A)E0(A) A-2\ y
Reproduced with permission o f the copyright owner. Further reproduction prohibited w ithout permission.

138
The responsivity, S(^) of the detector can be found using equation A-3 where E(k)
is the irradiance of the lamp and 1(A) is the response of the detector. The responsivities of
the CCD detector in pwatts count' 1 and photons sec' 1 count' 1 are shown in Figure A-4.
E{X)S(X) = A-3
4e-9 20000
180003e-10 1000
160003e-9 3e-10 800 14000
2e-10600 12000
2e-10O 2e-9 10000400
1e-1080002005e-116000
1e-9 400 500 600Waviength I nm
700 800 900 4000
2000
400 500 600 700 800 900 1000
3OotowwcooJ=a.
Wavelength / nm
Figure A-4. Correction factors for ISA-SPEX Triax 180 spectrograph equipped with a liquid N2 cooled CCD detector (Hamamatsu CCD, 1024x64 pixel, 400- 1 lOOnm). Correction factors for power (solid line) and photon density (dashed line) are shown.
Measuring the Irradiance of an Electroluminescent Device
1. Place the device in the device holder flush against the external cover of themonochromater entrance slit. This corresponds to 4.8 cm from the entrance slit ofthe Triax 180.
2. Center the emitting electrode at the entrance slit of the Triax 180.
3. Attach the positive electrode from the power supply to the contact that connects with ITO.
4. Attach the negative electrode from the power supply to the contact that contacts the metal electrode.
Reproduced with permission o f the copyright owner. Further reproduction prohibited w ithout permission.

139
5. Cover the device with a black cloth to minimize stray light.
6 . Apply the desired voltage.
7. Record the emission spectrum using the following experimental parameters:
a. Wavelength: 700 nm
b. Entrance Slit: 0.2 mm
c. Integration Time: 0.1, 1.0, or 10.0 sec depending on the expected intensity of the EL device.
Assuming the EL device emits isotropically, the irradiance should be equal at all
points along a hemispherical distance from the EL device. 164 (A hemisphere is used
rather than a sphere because it is assumed that no light is emitted from the backside of the
device.) In reality only a small portion of the EL device emission is collected by the
detector. This is accounted for by determining the fraction of the sphere sampled by the
detector.
Placing the device a distance, r, (4.8 cm as mention in step 1) from the slit, the
fraction of light collected by an entrance slit with an area, ASHt, of 0.02 cm2 is 1.38 x 10' 4
Fraction o f Light Collected = —" A-42 nr
The radiant power of the EL device, P(X) can be determined by equation A-5.
P ( X ) = '^ lL S (X)i(X) a -5An,
Reproduced with permission o f the copyright owner. Further reproduction prohibited w ithout permission.

140
The total power output of the device, P, can be calculated by integrating the radiant
power as shown in equation A - 6
p = ~ r ~ a -6slit
The irradiance of the device, E, (commonly reported in units of pW cm ' 2 or mW
cm'2) can then be calculated by dividing the total power measured by the physical area of
the EL device, Ad (Equation A-7). (For a circular electrode of 0.3 cm in diameter, the
area is 0.0707 cm2.)
£ = - f A-7
Electroluminescence Quantum Efficiency
By definition, the external electroluminescence quantum efficiency, <I>el is the
number of photons emitted by the device, NP, divided by the total number of electrons
injected (Equation A-8 ) where is / is the current in amps and C is the charge of an
electron (1.602x10'19C).
N P® E L = — — A-8
J /C
Reproduced with permission o f the copyright owner. Further reproduction prohibited w ithout permission.

141
The number of photons emitted can be calculated using the radiant power of the
device. Thus, the number of photons, NP, emitted by the device can be calculated using
equation A-9.
f W U A _ 9
A,,, 1
Reproduced with permission o f the copyright owner. Further reproduction prohibited w ithout permission.

APPENDIX BDRAWINGS
* 16 slots per side Grove width: 1.5 mm Space between groves: 2mm
Grove
70 mm40 mm
40 mm
Figure B-l. Dimensions of a Teflon holder for ITO glass during cleaning. The holder was made of five separate sides held together by screws. The groves were 1.5 mm wide (width enough to accommodate the ITO glass). There was 5 mm of Teflon between each grove.
142
Reproduced with permission o f the copyright owner. Further reproduction prohibited w ithout permission.

143
100 mm
5 mm v each
20 10 8 24 8 10 20
'*a p”100 mm
Two screw holesfor mounting to the DV-502A.
— 100 mm
1 4.9 mm
40 mm
Figure B-2. Mounting stage for metal vapor deposition. All pieces are made ofaluminum. Part B is attached to the two mounting screws in the DV-502A. Part A will slide over Part B. (Note: Overtime It has been found that these two pieces start stick together. Making Part B out of Teflon might alleviate the problem.)
Reproduced with permission o f the copyright owner. Further reproduction prohibited w ithout permission.

144
PART AMaterial: Acetal
Screw
PART B
Material: Stainless SteelScrew
Hole
4.5
41.5
Front Side View
■
Front
6 0.5
Side View
Figure B-3. Drawing of EL device holder. In each hole of part A, receptacles(Interconnect Devices, Inc.; Part Number 300106-000-5000, Description: R- SS-100-WW .420) and gold contact pins (Interconnect Devices, Inc.; Part Number 100165-003-952, Description: GSS-3-3.8-G S/C W/Hole) were used.
Reproduced with permission o f the copyright owner. Further reproduction prohibited w ithout permission.

145
Depth = 5 mm
41.5 mm
* Screw holes to fix to the XY stage
6 mm
8 m n 25.5 mm
6 mm
3 mm
25.5 mm
5 mm
30 mm
11 mm
Figure B-4. Mount for device holder to XY stage. A 5 mm grove is made into the device holder in Figure B-3 as shown at the top of this figure. The mount was made of aluminum.
Reproduced with permission o f the copyright owner. Further reproduction prohibited w ithout permission.

146
35
3 I;,! 3
0.5 1.5
Diameter: 3
Figure B-5. Mask for metal deposition of electrodes. The mask is made of stainless steel and is 1 mm thick. All dimensions are in millimeters.
1111
Reproduced with permission o f the copyright owner. Further reproduction prohibited w ithout permission.

APPENDIX C ELECTROLUMINESCENT DATA PROCESSING
Because of the large amount of data produced while characterizing the
electroluminescent devices prepared, an Excel workbook was prepared to expedite the
data processing portion of electroluminescent device analysis. In order to use this
workbook, the user must have the data in sequentially numbered files in the ASCII
format. The Excel file, ELCalculator.xls, contains seven worksheets: RawDataExtract,
Table Summary, Radiance Integrator, Photon Integrator, Radiance Data, Photon Data,
Correction Factors. In addition to the worksheets, three macros were prepared to
automatic the data extraction and processing.
Using the RawDataExtract worksheet, the user enters the directory where the files
can be found. (Data that the user must supply is blue in color.) Next, any file name text
that remains constant which precedes the incrementing variable is included. The start and
ending numbers are next entered. Finally, any constant text and filename extensions after
the incrementing numbers are entered in their respective boxes. Once everything is
entered, the user simply presses the Step 1 box.
Step 1 runs the macro labeled DataExtractor. This macro extracts the data from
the file and places it into the excel spreadsheet eventually making a single X and many Y
table of raw data. (See Worksheet: RawDataExtract for an example. The macro then
generates the equations for multiplying the raw data by two different correction factors
147
Reproduced with permission o f the copyright owner. Further reproduction prohibited w ithout permission.

148
which are found on worksheet CorrectionFactors. The calibrated radiance and photon
data can be found on worksheets labeled RadianceData and PhotonData, respectively.
Step 2 runs the macro labeled DataExtracterIntegrator. Numerical integration of
the data is done using Simpson’s Rule. Simpson’s rule can be used for approximating the
area under the curve within a given interval [a,b] as shown in equation C-l. This method
requires an even number, n, of evenly spaced intervals, Ax. Examples of the numerical
integration are shown in worksheets Radiance Integrator and Photon Integrator. The
total area of the entire spectrum is also shown on the worksheet.
fb A x n / 2 —1
[ f ( x ) d x * — [ f (x0) + 4(/(X _,) + 2 / 0 „ ) + 2 £ 2 / 0 2JM) + f ( x 2k)] C-l4 *=i
Step 3 compiles the data into a table by running the macro TableSummary. This
table has the most commonly used values for data analysis including irradiance and
external electroluminescence efficiency. (The user must enter in the rows labeled voltage
and current their data to complete efficiency data.) The visible radiance and
electroluminescence efficiency cover the spectral region from 350 to 850 nm. The near-
infrared radiance and efficiency encompass the spectral region from 800-1050 nm.
Reproduced with permission o f the copyright owner. Further reproduction prohibited w ithout permission.

149
Worksheet: RawDataExtract
Example____________________________ ______________
15Yb4-4 15Yb4-5 15Yb4-6273.08 -0.2 0.7 1.6
Location 273.91 0.4 0.9 3.0c:\useri2002\101102\ 274.75 0.0 0.8 2.0
275.59 0.1 0.9 3.4Example 276.42 0.6 0.6 2.8d:\usr\bsh\030101\ 277.26 0.2 0.5 3.6'i\ccd\c\usr\bsh\030101\ 278.09 -0.2 0.6 1.8
278.93 -0.2 1.0 2.8Filename Before Numbers 279.77 0.1 0.7 2.615Yb4- 280.6 0.3 0.4 3.2
281.44 0.3 0.9 1.6Beginning Number 282.27 0.1 0.8 2.4
283.11 0.5 0.9 2.6283.94 0.3 0.5 2.8
Ending Number 284.78 0.5 0.8 2.011 285.62 -0.1 1.1 1.2
286.45 0.1 1-2 2.4After Numbers (leave blank if nothing) 287.29 0.0 0.7 1.4
288.12 0.1 0.9 2.0288.96 0.2 0.9 2.2
Extension 289.79 0.3 0.9 2.0290.63 0.4 0.6 2.2291.47 0.1 0.8 2.2292.3 0.3 0.9 2.4
293.14 0.1 0.3 1.8293.97 0.1 0.8 2.4294.81 0.3 0.9 2.2
Number of Data Points 295.65 -0.2 0.7 1.61024 296.48 0.5 0.8 1.4
Number of Data Sets 297.32 0.3 0.5 2.2298.15 -0.2 0.7 1.6
Step 1. Click Here to Extract the Data
298.99 0.2 0.5 2.0299.82 0.6 0.4 2.0300.66 0.3 0.8 1.6
Step 2. Click Here to Integrate the Data
301.5 -0.3 0.5 1.4302.33 0.2 0.7 2.0303.17 0.1 0.5 1.4
304 0.1 0.6 1.4
Step 3. Click Here to Create a Table Summary of the Data
304.84 0.2 0.9 1.6305.67 0.1 0.8 1.8306.51 0.2 0.3 1.4307.35 0.3 0.9 2.2
Reproduced with permission o f the copyright owner. Further reproduction prohibited w ithout permission.

150
Worksheet: Radiance Data
Example15Yb4-4 15Yb4-5 15 Yb4-6
273.08 -5.6E-09 -2.8E-09 1.41E-12THIS DATA IS IN 273.91 4.01E-10 0 2.81 E-09RADIANCE UNITS 274.75 -5.6E-10 -2.8E-10 1.12E-09
275.59 -2.6E-10 0 4.73E-09276.42 1.24E-09 -9.3E-10 3.71 E-09
uWcm-2 nm-1 277.26 2.97E-14 -1.2E-09 5.93E-09278.09 -1.3E-09 -1E-09 6.69E-10278.93 -1.4E-09 3.49E-10 4.19E-09279.77 -3.5E-10 -6.9E-10 3.46E-09
280.6 3.74E-10 -1.9E-09 5.98E-09
Worksheet: Photon Data
Example15Yb4-4 15Yb4-5 15Yb4-6
273.08 -7719.6 -3860.19 1.929996273.91 550.479 0 3853.435274.75 -771.211 -385.625 1542.885275.59 -363.278 0 6539.535276.42 1711.461 -1283.64 5134.811
Photons cm-2 sec-1 nm-1 277.26 0.04121 -1648.4 8241.991278.09 -1865.47 -1399.22 933.2464278.93 -1954.43 488.6308 5864.059279.77 -484.968 -970.081 4850.163280.6 525.7382 -2628.43 8411.495
Reproduced with permission o f the copyright owner. Further reproduction prohibited w ithout permission.

151
Formula: Delta x:
Example
Formula: Delta x:
Example
Worksheet: Radiance Integrator
-Radiance Data'!B2+4*'Radiance Data'!B3+'Radiance Data'!B4 -C3-C2
Formula 0 273.08 -4.6E-09 -3.1 E-09 1.23E-08Delta x 0.83 273.91
274.75 -3.8E-10 -1.2E-09 2.38E-08Total 275.59
Col 1 0.0962 276.42 -1E-10 -6.7E-09 2.81 E-08Col 2 0.4745 277.26Col 3 1.1146 278.09 -7.3E-09 -3E-10 2.09E-08
278.93279.77 1.56E-09 -8.2E-09 2.74E-08280.6
Worksheet: Photon Integrator
-Photon Data'IB2+4 *'Photon Data'!B3+'Photon Data'!B4 =C3-C2
Formula 0 273.08 -6288.89 -4245.81 16958.56Delta x 0.83 273.91
274.75 -512.864 -1669.26 32835.84Total 275.59
Col 1 4.74E+11 276.42 -153.841 -9276.45 39036.02Col 2 2.33E+12 277.26Col 3 4.50E+12 278.09 -10168.1 -414.774 29239.64
278.93279.77 2195.292 -11483.8 38496.14280.6
Reproduced with permission o f the copyright owner. Further reproduction prohibited w ithout permission.

Reproduced with
permission
of the copyright owner.
Further reproduction prohibited
without permission.
Worksheet: Correction Factors
Example
Energy Correction nmuW cm«2 sr-1 sec-1 count-1 Photon Correction
........ .....-nm
photons em-2 count- i sr-t sec-1
Factor for CCD 272.27 1 40991E-08 Factor for CCD 272.27 1.93E+04273.1 2.00448E-09 Factor 273.1 2.75E+03
to Convert 273.94 2.79991 E-09 to Convert 273.94 3.86E+03Counts/sec 274.77 2.6299E-09 Counts/sec 274.77 3.63E+03into 275.61 3.08778E-09 into 275.61 4.28E+03uW cm-2 sec-1 276.44 2.96508E-09 photons cm-2 sec-1 276.44 4.12E+03
277.28 3.34553E-09! 277.28 4.66E+03278.11 3.49461 E-09^ 278.11 4.89E+03
Assuming 278.95 3.45832 b-09; Assuming 278.95 4.85E+03device area of 279.78 3.73718E-09i device area of 279.78 5.26E+030.0707 cm2 280.62 4.09147E-09j 0.0707 cm2 280.62 5.77E+03
281.45 4.09493E-09 281.45 5.79E+03Slit of 1cm x 0.02cm 282.29 4.45258E-09 iililllf:Slit of 1cm x 0.02cm 282.29 6.32E+03
283.1^ 4.55924E-09— 283.13 6.49E+03These Correction 283.96 4.85186E-09 These Correction 283.96 6.93E+03Factors were lasted 284.8 4.9187E-09 Factors were lasted 284.8 7.04E+03changed 285.63 5.00163E-09 changed 285.63 7.18E+0310/10/2002 286.47 5.48351 E-09 10/10/2002 286.47 7.90E+03
287.3 5.75494E-09 287.3 8.31 E+03288.14 5.85876E-09 288.14 8.49E+03288.97 6.08041 E-09 288.97 8.83E+03289.81 6.44134E-09 — 289.81 9.39E+03290.65 6.91394E-09 290.69 1.Q1E+04291.48 7.11838E-09 291.48 1.04E+04292.32 7.43535E-09 292.32 1.09E+04293.15 8.10093E-09 293.15 1.19E+04

153
Worksheet: Table Summary
Example
File Name 15Yb4-4 15Yb4-5 15Yb4-6Voltage {V> 4 C 6Current {rnA) 1.11 2.6 6.1Current Density (mA cm-2) 15 70014 **6.77511 86.28000Electron Denshy {electrons c~i-2) 9.8E+16 2 3E+"7 5.39E+17Visible Ftearancs fcW cm-2) OC-O'SCG 0 00765 0.G240S6V;sio!e Photon Density (ohotcns cn-2 s-1) 2 92E-1C '.&8=tV. 5.21 E-11Visible G.E 7 98F. 0? ? 32E-07 9 66E-07NiR Radiance (uW cx-2) 0.0949'. 9 C.466S2" 1 090591NiR Proton Density {photons cm-2 s-■ ') 2 95E+13 1.45E-1-13 3.39E*13NiRQ.E. 3.01 E-05 5.32E-05 6 29E-C5|||||||||||||l|||: ||||||||: |l|||: ||l|||||||||l|||||: |||l||ll
V/!sib>s Power Efficiency ? 36F.-03 4.18E-08 4.S5E-Q8NiR Power Efficiency 1 51E-03 2 54E-C6 2 1‘E-Ce
Total Irradiance (uW cm-2) 0.09621 0 474526 1 11457Total Photon Density (uW cm-2 sr-1) 2.98E+12 3.44E+13Total Q.E. 3.04E-05 6 39E-05 6.39E-05]Total Power Efficiency 0.001532 0.002581 0.002153
Reproduced with permission o f the copyright owner. Further reproduction prohibited w ithout permission.

154
Macro: DataExtractor
Sub DataExtractorQI
' Data Extractor' Macro written 3/14/2001 by Benjamin Harrison!
i = Range("A14")Directory = Range("A4")Filename = Range("Al 1")Aftemumbers = Range("A20") extension = Range("A23")
For i = Range("A17") To Range("A14”) + 1 Step -1filelocation = Directory & Filename & i & Aftemumbers & & extension
With Active Sheet. QueryT ables. Add(Connection := _"TEXT;" & filelocation, Destination:=Range("C2")) .TextFileColumnDataTypes = Array(9, 1).Refresh BackgroundQuery :=False
Range("Cl") = Filename & i & Aftemumbers End With
Next i
i = Range("A14")filelocation = Directory & Filename & i & Aftemumbers & & extensionWith ActiveSheet.QueryTables.Add(Connection:= _
"TEXT;" & filelocation, Destination:=Range("C2")).Refresh BackgroundQuery :=F alse Range("Dl") = Filename & i & Aftemumbers
End With
Range("C1026") = Null 'removes the character at the end of the first column 'this assumes there is only 1024 points of data
Range("A30") = "=COUNT(R2C4:R2000C4)"Range("A32") = "=COUNT(R2C4:R2000C21 )/COUNT(R2C4 :R2000C4)"
Let datapoints = Sheets("RawDataExtract") .Range("A3 0") + 1 Let datasets = Sheets("RawDataExtract").Range("A32")
'For PL Data
Reproduced with permission o f the copyright owner. Further reproduction prohibited w ithout permission.

155
Sheets("RawDataExtract").Select Range("C2", "C" & datapoints).Select Selection.Copy Sheets("Photon Data").Select Range("C2").Select Active SheetPaste
Sheets("RawDataExtract").Select Range(Cells(l, 4), Cells(l, datasets + 3)).Copy Sheets("Photon Data").SelectRange(Cells(l, 4), Cells(l, datasets + 3)).PasteSpecial
For J = 1 To datasetsCells(2, J + 3).FormulaRlCl - '-(RawDataExtract!RC-
RawDataExtract! R40C) * 'Correction Factors'!RC8" 'Added baseline correction 2/19/03 Next J
Range(Cells(2, 4), Cells(2, datasets + 3)).Copy Range(Cells(2, 4), Cells(datapoints, datasets + 3)).PasteSpecial
'For EL Data
Sheets("RawDataExtract").Select Range("C2", "C" & datapoints).Select Selection.CopySheets("Radiance Data").Select Range("C2").Select ActiveSheet.Paste
Sheets("RawDataExtract").SelectRange(Cells(l, 4), Cells(l, datasets + 3)).CopySheets("Radiance Data"). SelectRange(Cells(l, 4), Cells(l, datasets + 3)).PasteSpecial
For J = 1 To datasetsCells(2, J + 3).FormulaRlCl = ' -(RawDataExtractlRC-
RawDataExtract! R40C) * 'Correction Factors'!RC4" 'Added baseline correction 2/19/03 Next J
Range(Cells(2, 4), Cells(2, datasets + 3)).Copy Range(Cells(2, 4), Cells(datapoints, datasets + 3)).PasteSpecial
Sheets("RawDataExtract").Select End Sub
Reproduced with permission o f the copyright owner. Further reproduction prohibited w ithout permission.

156
Macro: DataExtractorlntegrator
Sub DataExtractorlntegratorO »
' Data Extractor' Macro written 10/10/2002 by Benjamin HarrisonI
Let datapoints = Sheets("RawDataExtract").Range("A30") + 1 Let datasets = Sheets("RawDataExtract").Range("A32")
Sheets("Radiance Data").Select Range("C2", "C" & datapoints).Select Selection.CopySheets("Radiance Integrator").Select Range("C2").Select Active Sheet.Paste
Sheets("Radiance Integrator").Range("B2").Select Selection.CopyRange(Cells(2, 4), Cells(2, datasets + 3)).Select Range(Cells(2,4), Cells(2, datasets + 3)).PasteSpecial
Range(Cells(2, 4), Cells(3, datasets + 3)).Copy Range(Cells(2, 4), Cells(datapoints, datasets + 3)).PasteSpecial
Sheets("Photon Data").Select Range("C2", "C" & datapoints).Select Selection.CopySheets("Photon Integrator"). Select Range("C2").Select ActiveSheet.Paste
Sheets("Photon Integrator").Range("B2").Select Selection.CopyRange(Cells(2,4), Cells(2, datasets + 3)).Select Range(Cells(2, 4), Cells(2, datasets + 3)).PasteSpecial
Range(Cells(2, 4), Cells(3, datasets + 3)).Copy Range(Cells(2, 4), Cells(datapoints, datasets + 3)).PasteSpecial
Sheets("RawDataExtract").Select
End Sub
Reproduced with permission o f the copyright owner. Further reproduction prohibited w ithout permission.

157
Macro: TableSummary
Sub TableSummaiy01
' Table SummaryO' Macro written 10/10/2002 by Benjamin Harrisonf
Let datapoints = Sheets("RawDataExtract").Range("A30") + 1 Let datasets = Sheets("RawDataExtract").Range("A32")
Sheets("Table Summary").Select
Range("B3").Formula = '-'Radiance Data'IDl"Range("B 6 ") .F ormula = "=B5/0.0707"Range("B7").Formula = "=0.001*B6/1.602176e-19"Range("B8").Formula = "=SUM(’Radiance Integrator'!D96:D694) *(’Radiance Integrator'! $B$3/3)"Range("B9").Formula = "=2*3.1415*SUM('Photon Integrator'!D96:D694)*('Photon Integrator'!$B$3/3)"Range("B 10").Formula = "=B9/B7"
Range("B 11 ").Formula = "=SUM('Radiance Integrator'!D694:D 1024)*('RadianceIntegrator'!$B$3/3)"Range("B 12").Formula = "=2*3.1415*SUM(’Photon Integrator’!D694:D1024)*('Photon Integrator'!$B$3/3)"Range("B 13").Formula = "=B12/B7"
Range("B 16").Formula = "=(0.001 *B8)/(B4*B6)" Range("B 17").Formula = "=(0.001 *B11)/(B4*B6)"
Range("B20").Formula = "=SUM('Radiance Integrator'!D2:D 1024)*('Radiance Integrator'! $B$3/3)"Range("B21 ").Formula = "=2*3.1415* SUM('Photon Integrator' !D2 :D 1024) * ('Photon Integrator'!$B$3/3)"Range("B22").Formula = "=B21/B7"Range("B23 ") .F ormula = ”=B20/(B6*B4)"
Range("B3").Copy Range(Cells(3, 2), Cells(3, datasets + l)).PasteSpecial
Range("B6:B23").Copy
Reproduced with permission o f the copyright owner. Further reproduction prohibited w ithout permission.

158
Range(Cells(6, 3), Cells(23, datasets + l)).PasteSpecial
'Formats Table with Color
'Yellow for File NameRange(Cells(3, 1), Cells(3, datasets + 1)). Select With Selection.Interior
.Colorlndex = 6
.Pattern = xlSolid
.PattemColorlndex = xlAutomatic End With
With Selection.Font .Name = "Arial".FontStyle = "Bold"
End With
'Blue for user data to be entered Range(Cells(4, 1), Cells(5, datasets + 1)).Select With Selection.Interior
.Colorlndex = 37
.Pattern = xlSolid
.PattemColorlndex = xlAutomatic End With
'Grey and White for Data For x = 6 To 22 Step 2Range(Cells(x, 1), Cells(x, datasets + 1)).Select
With Selection.Interior .Colorlndex =15 .Pattern = xlSolid .PattemColorlndex = xlAutomatic
End With Nextx
'Put Grids AroundRange(Cells(3, 1), Cells(23, datasets + 1)).Select Selection.Borders(xlDiagonalDown).LineStyle = xlNone Selection.Borders(xlDiagonalUp).LineStyle = xlNone With Selection.Borders(xlEdgeLeft)
.LineStyle = xlContinuous
.Weight = xlThin
.Colorlndex = xlAutomatic End With
Reproduced with permission o f the copyright owner. Further reproduction prohibited w ithout permission.

159
With Selection.Borders(xlEdgeTop) .LineStyle = xlContinuous .Weight = xlThin .Colorlndex = xlAutomatic
End WithWith Selection.Borders(xlEdgeBottom)
.LineStyle = xlContinuous
.Weight = xlThin
.Colorlndex = xlAutomatic End WithWith Selection.Borders(xlEdgeRight)
.LineStyle = xlContinuous
.Weight = xlThin
.Colorlndex = xlAutomatic End WithWith Selection.Borders(xlInsideVertical)
.LineStyle = xlContinuous
.Weight = xlThin
.Colorlndex = xlAutomatic End WithWith Selection.Borders(xlInsideHorizontal)
.LineStyle = xlContinuous
.Weight = xlThin
.Colorlndex = xlAutomatic End With
End Sub
Reproduced with permission o f the copyright owner. Further reproduction prohibited w ithout permission.

LIST OF REFERENCES
1. Dieke, G. H. Spectra and Energy Levels o f Rare Earth Ions in Crystals', Interscience: New York, 1968.
2. France, P. W. In Fluoride Glass Optical Fibers', France, P. W., Ed.; CRC Press: Boca Raton, FL, 1990, pp 132-185.
3. Gorller-Walrand, C.; Binnemans, K. In Handbook on the Physics and Chemistry o f Rare Earths', Gschneidner, K. A., Eyring, L., Eds.; Elsevier North-Holland: New York, 1998; Vol. 25, pp 101-262.
4. Weissman, S. I . " Intramolecular Energy Transfer. The Fluorescence of Complexes of Europium" J. Chem. Phys. 1942,10, 214-217.
5. de Sa, G. F.; Malta, O. L.; Donega, C. D.; Simas, A. M.; Longo, R. L.; Santa-Cruz, P. A.; da Silva, E. F. "Spectroscopic Properties and Design of Highly Luminescent Lanthanide Coordination Complexes" Coord. Chem. Rev. 2000,196, 165-195.
6. Veiopoulou, C. J.; Lianidou, E. S.; Ioannou, P. C.; Efstathiou, C. E. "Comparative Study of Fluorescent Ternary Terbium Complexes. Application in Enzyme Amplified FIuorimetric Immunoassay for Alpha-Fetoprotein" Anal. Chim. Acta 1996,3 3 5 ,177-184.
7. Gao, X. C.; Cao, H.; Huang, C. H.; Umitani, S.; Chen, G. Q.; Jiang, P. "Photoluminescence and Electroluminescence of a Series of Terbium Complexes" Synth. Met. 1999, 99, 127-132.
8. Edwards, A.; Claude, C.; Sokolik, I ; Chu, T. Y.; Okamoto, Y.; Dorsinville, R. "Photoluminescence and electroluminescence of new lanthanide- (methoxybenzoyl)benzoate complexes" J. Appl. Phys. 1997, 8 2 ,1841-1846.
9. Meshhova, S. B.; Topilova, Z. M.; Bolshoy, D. V.; Beltyukova, S. V.; Tsvirko, M. P.; Venchikov, V. Y. "Quantum Efficiency of the Luminescence of Ytterbium(III) beta-Diketonates" Acta Physica Polonica A 1999, 9 5 , 983-990.
10. Tsvirko, M. P.; Meshhova, S. B.; Venchikov, V. Y.; Bolshoy, D. V."Determination of Contributions of Various Molecular Groups to Nonradiative Deactivation of Electronic Excitation Energy in beta-Diketonate Complexes ofYtterbium(ffl)" Opt. Spec. 1999, 90, 669-673.
160
Reproduced with permission o f the copyright owner. Further reproduction prohibited w ithout permission.

161
11. Voloshin, A. I.; Sahavaleev, N. M.; Kazakov, V. P. "Luminescence of Praseodymium (III) Chelates from Two Excited States (3Po and ^ 2) and its Dependence on Ligand Triplet State Energy" Journal o f Luminescence 2001, 93, 199-204.
12. Yanagida, S.; Hasegawa, Y.; Murakoshi, K.; Wada, Y.; Nakashima, N.;Yamanaka, T. "Strategies for Enhancing Photoluminescence of Nd(III) in Liquid Media" Coord. Chem. Rev. 1998,171, 461-480.
13. Yanagida, S.; Hasegawa, Y.; Iwamuro, M.; Kawamura, Y.; Wada, Y. "Luminescence of Neodymium(III) in Organic Media: Ligand Designs for the Remarkable Luminescence and Their Evolution" J Syn Org Chem Jpn 2000, 58, 945-955.
14. Vogtle, P.; Gorka, M.; Vincelli, V.; Ceroni, P.; Maestri, M.; Balzani, V. "A Dendritic Antenna for Near-Infrared Emission ofNd(III) Ions" Chem. Phys. Chem. 2001, 769-773.
15. Vicinelli, V.; Ceroni, P.; Maestri, M.; Balzani, V.; Gorka, M.; Vogtle, F. "Luminescence Lanthanide Ions Hosted in a Fluorescent Polylysin Dendrimer. Antenna-Like Sensitization of Visible and Near-Infrared Emission" J. Am. Chem. Soc. 2002,124, 6461-6488.
16. Hebbink, G. A.; Reinhoudt, D. N.; van Veggel, F. C. J. M. "Increased Luminescent Lifetimes of Ln(III) Complexes Emitting in the Near-Infrared as a Result of Deutration" Eur. J. Org. Chem. 2001, 4101-4106.
17. Klink, S. I.; Alink, P. O.; Grave, L.; Peters, F. G. A.; Hofstraat, J. W.; Geurts, F.; van Veggel, F. C. J. M. "Fluorescent Dyes as Efficient Photosensitizers for Near- infrared Nd(III) Emission" Perkin Trans. 2 2001, 363-372.
18. Klink, S. I.; Hebbink, G. A.; Grave, L.; Peters, F. G. A.; van Veggel, F. C. J. M.; Reinhoudt, D. N.; Hofstraat, J. W. "Near-Infrared and Visible Luminescence from Terphenyl-Based Lanthanide(III) Complexes Bearing Amido and Sulfonamido Pendant Arms" Eur. J. Org. Chem. 2000,10, 1923-1931.
19. Klink, S. I.; Keizer, H.; Hofstraat, H. W.; van Veggel, F. C. J. M. "Transition Metal Complexes as a New Class of Photosensitizers for Near-Infrared Lanthanide Luminescence" Synth. Met. 2002,127, 213-216.
20. Klink, S. I.; Grave, L.; Reinhoudt, D. N.; van Veggel, F. C. J. M.; Werts, M. H.; Geurts, F. A. J.; Hofstraat, J. W. "A Systematic Study of the Photophysical Processes in Polydentate Triphenylene-Functionalized Eu(III), Tb(III), Nd(III), Yb(III), and Er(III), Complexes" J. Phys. Chem. A 2000,104, 5457-5468.
Reproduced with permission o f the copyright owner. Further reproduction prohibited w ithout permission.

162
21. Wolbers, M. P. O.; van Veggel, F. C. J. M.; Peters, F. G. A.; van Beelen, E. S. E.; Hofstraat, J. W.; Geurts, F.; Reinhoudt, D. N. "Sensitized Near-Infrared Emission from Nd(III) and Er(III) Complexes of Fluorescein-Bearing Calix[4]arene Cages" Chem. Eur. J. 1998, 4, 772-780.
22. Hofstraat, J. W.; Wolbers, M. P. O.; van Veggel, F. C. J. M.; Reinhoudt, D. N.; Werts, M. H.; Verhoeven, J. W. "Near-IR Luminescence Rare Earth Ion-Sensitizer Complexes" J. Fluorescence 1998, 8, 301-308.
23. Sato, S.; Shinkai, S. "Energy-Transfer Luminescence of Lanthanide Ions Encapsulated in Sensitizer-Modified Calix[N]Arenes" Perkin Trans. 2 1993, 621- 624.
24. Shevchuk, S. V.; Rusakova, N. V.; Turianskaya, A. M.; Korovin, Y.; Nazarenko, N. A.; Gren, A. I.; Shapiro, Y. E. "Novel Ytterbium Complexes of Two Calix[4]resorcinarenes" Anal. Commum. 1997, 34, 201-203.
25. Shevchuk, S. V.; Rusakova, N.; Turianskaya, A. M.; Korovin, Y.; Nazarenko, N. A.; Gren, A. I. "Infrared Luminescence of Ytterbium Ion in Complexes with Calix[4]resorcinarenes" J. Fluorescence 1998, 8, 225-228.
26. Shevchuk, S. V.; Rusakova, N. V.; Turianskaya, A. M.; Korovin, Y. V.;Nazarenko, N. A.; Gren, A. I. "Luminescence of Neodymium Ion in Complexes with Calix [4] resorcinarenes" Asian. J. Spec. 2000, 3, 155-160.
27. Korovin, Y.; Rusakova, N. "Infrared 4f-luminescence of Lanthanides in the Complexes with Macrocyclic Ligands" Rev. Inorg. Chem. 2001, 21, 299-329.
28. Korovin, Y. U.; Shevchuk, S. V.; Bacherikov, V. A.; Rusakova, N. V.; Alexeeva,E. A.; Gren, A. I. "Sensitization of Infrared Luminescence of Neodymium and Ytterbium Ions in Binuclear Complexes with 4-tert-Butylcalix[8]arene" Russ. J. Inorg. Chem 2000, 45, 1383-1387.
29. Dickins, R. S.; Aime, S.; Batsanov, A. S.; Beeby, A.; Botta, M.; Bruce, J.; Howard, J. A. K.; Love, C. S.; Parker, D.; Peacock, R. D.; Puschmann, H. "Structural, Luminescence, and NMR Studies of the Reversible Binding of Acetate, Lactate, Citrate, and Selected Amino Acids to Chiral Diaqua Ytterbium, Gadolinium, and Europium Complexes" Journal o f the American Chemical Society 2002,124, 12697-12705.
30. Beeby, A.; Faulkner, S.; Parker, D.; Williams, J. A. G. "Sensitised luminescence from phenanthridine appended lanthanide complexes: analysis of triplet mediated energy transfer processes in terbium, europium and neodymium complexes" Perkins Trans. 2 2001, 1268-1273.
Reproduced with permission o f the copyright owner. Further reproduction prohibited w ithout permission.
163
31. Beeby, A.; Dickins, R. S.; Fitzgerald, S.; Govenlock, L. J.; Maupin, C. L.; Parker,D.; Riehl, J. P.; Siligardi, G.; Williams, J. A. G. "Porphyrin Sensitization of Circularly Polarised Near-IR Lanthanide LuminescenceL Enhanced Emission with Nucleic Acid Binding" Chem. Comm. 2000, 1183-1184.
32. Beeby, A.; Dickins, R. S.; Faulkner, S.; Parker, D.; Williams, J. A. G. "Luminescence from ytterbium(III) and its complexes in solution" Chem Commun 1997, 1401-1402.
33. Beeby, A.; Clarkson, I. ML; Dickins, R. S.; Faulkner, S.; Parker, D.; Royle, L.; de Sousa, A. S.; Williams, J. A. G.; Woods, M. "Non-radiative deactivation of the excited states of europium, terbium and ytterbium complexes by proximate energy- matched OH, NH and CH oscillators: an improved luminescence method for establishing solution hydration states" Perkin Trans. 2 1999, 493-503.
34. Batsanov, A. S.; Beeby, A.; Bruce, J. I.; Howard, J. A. K.; Kenwright, A. M.; Parker, D. "Direct NMR and luminescence observation of water exchange at cationic ytterbium and europium centres" Chem Commun 1999, 1011-1012.
35. Horrocks, W. D.; Wong, C. P. "Lanthanide Porphyrin Complexes: Evaluation of Nuclear Magnetic Resonance Dipolar Probe and Shift-Reagent Capabilities" J. Am. Chem. Soc. 1976, 98, 7157-7162.
36. Gouterman, M.; Schumaker, C. D.; Srivastava, T. S.; Yonetani, T. "Absorption and Luminescence of Yttrium and Lanthanide Octaethylporphyrin Complexes" Chem. Phys. Lett. 1976, 40, 456-461.
37. Korovin, Y.; Zhilina, Z.; Rusakova, N.; Kuz'min, V.; Vodzinsky, S.; Ishkov, Y." Spectral-Luminescent Effects in Heterometallic Complexes of Crown- Porphyrins" J. Porphyrins Phthalocyanines 2001, 5, 481-485.
38. Pyatosin, V. E.; Tsvirko, M. P.; Solovev, K. N.; Kachura, T. F. "Laser Photophysics of Complexes of Etioporphyrin I with Rare-Earth Elements" Zh.Prik. Spek. 1981, 35, 268-271.
39. Pyatosin, V. E.; Tsvirko, M. P.; Solovev, K. N.; Kachura, T. F. "Study of the Photophysics of Complexes of Porphyrins with the Lanthanides by Nanosecond Absorption Spectroscopy" Opt Spektrosk+ 1982, 52, 269-275.
40. Tsvirko, M. P.; Soloviev, K. N.; Piskarskas, A. S.; Piatosin, V. E.; Krasauskas, V. V.; Kachura, T. F. "Pico-Second Kinetics of Intramolecular Energy-Transfer in Porphyrin Complexes of Rare-Earth Elements" Dokl Akad Nauk Sssr+ 1984, 279, 1118-1122.
Reproduced with permission o f the copyright owner. Further reproduction prohibited w ithout permission.

164
41. Tsvirko, M. P.; Stelmakh, G. F.; Pyatosin, V. E.; Solovyov, K. N.; Kachura, T. F.; Piskarskas, A. S.; Gadonas, R. A. "Fast Electronic Relaxation in Lanthanide Porphyrins" Chem. Phys. 1986,106, 467-476.
42. Solovev, K. N.; Tsvirko, M. P.; Pyatosin, V. E.; Kachura, T. F. "Studying the Mechanism of Photophysical Processes in Complexes of Rare-Earth Elements by Methods of Luminescence and Kinetic Absorption-Spectroscopy" Izv an Sssr Fiz+ 1982, 46, 242-248.
43. Solovev, K. N.; Tsvirko, M. P.; Kachura, T. F. "Intramolecular Energy Migration in Complexes of Lanthanides with Porphyrins" Opt Spektrosk+ 1976, 40, 684-690.
44. Shushkevich, I. K.; Dvornikov, S. S.; Kachura, T. F.; Solovev, K. N. "Spectral Luminescence Properties of Porphyrin Complexes of Neodymium and Ytterbium" Zh. Prik. Spek. 1981, 35, 647-653.
45. An, Y.; Schramm, G. E.; Berry, M. T. "Ligand-to-Metal Charge-Transfer Quenching of the Eu(III) (5Di) State in Europium-Doped tris(2,2,6,6-tetramethyl- 3,5-heptanedionato)Gadolinium (III)" J. Lumin. 2002, 97, 7-12.
46. Wong, C. P.; Venteicher, R.; Horrocks, W. D. "Lanthanide Porphyrin Complexes - Potential New Class of Nuclear Magnetic-Resonance Dipolar Probe" J. Am. Chem. Soc. 1974, 96, 7149-7150.
47. Wong, C. P. In Inorg. Syn., 1983; Vol. 22, p 156.
48. Spyroulias, G. A.; de Montauzon, D.; Maisonat, A.; Poilblanc, R.; Coutsolelos, A. G. "Synthesis, UV-visible and electrochemical studies of lipophilic and hydrophilic lanthanide(III) bis(porphyrinates)" Inorg. Chem. Acta 1998, 276, 182- 191.
49. Spyroulias, G. A.; Coutsolelos, A. G.; Raptopoulou, C. P.; Terzis, A. "Synthesis, Characterization, and X-Ray Study of a Heteroleptic Samarium(III) Porphyrin Double-Decker Complex" Inorg. Chem. 1995, 34, 2476-2479.
50. Jiang, J. Z.; Mak, T. C. W.; Ng, D. K. P. "Isolation and Spectroscopic Characterization of Heteroleptic, Anionic and Neutral (phthalocyaninato)(tetra-4- pyridylporphyrinato)lanthanide(III) Double-deckers" Chem. Ber. 1996,129, 933- 936.
51. Schaverien, C. J. "Octaethylporphyrin-Yttrium-Methyl Chemistry: Preparation and Selective Activation of Dioxygen by (OEP)Y(Mu-Me)2AlMe2 n Chem. Comm.1991, 458-460.
Reproduced with permission o f the copyright owner. Further reproduction prohibited w ithout permission.

165
52. Schaverien, C. J.; Orpen, A. G. "Chemistry of (Octaethylporphyrinato)Lutetium and (Octaethylporphyrinato)Yttrium Complexes - Synthesis and Reactivity of (Oep)Mx Derivatives and the Selective Activation of O2 by (Oep)Y(Mu- Me)2 alme2 M Inorg. Chem. 1991, 30, 4968-4978.
53. Wong, W. K.; Hou, A. X.; Guo, J. P.; He, H. S.; Zhang, L. L.; Wong, W. Y.; Li, K.F.; Cheah, K. W.; Xue, F.; Mak, T. C. W. "Synthesis, Structure and Near-infrared Luminescence of Neutral 3 d-4f Bi-metallic Monoporphyrinate Complexes" Dalton Trans. 2001, 3092-3098.
54. Wong, W. K.; Zhang, L.; Xue, F.; Mak, T. C. W. "Synthesis, Characterization and Crystal Structures of Neutral Mono- and Di-nuclear Lanthanide(III) Porphyrinate Complexes" Dalton Trans. 1999, 3053-3062.
55. Wong, W. K.; Zhang, L. L.; Wong, W. T.; Xue, F.; Mak, T. C. W. "Synthesis and Crystal Structures of Cationic Lanthanide(III) Monoporphyrinate Complexes" Dalton Trans. 1999, 615-622.
56. Foley, T. J.; Abboud, K. A.; Boncella, J. M. "Synthesis of Ln(III) Chloride Tetraphenylporphyrin Complexes" Inorg. Chem. 2002, 41, 1704-1706.
57. Harrison, B. S.; Foley, T. J.; Bouguettaya, M.; Boncella, J. M.; Reynolds, J. R.; Schanze, K. S.; Shim, J.; Holloway, P. H.; Padmanaban, G.; Ramakrishnan, S. "Near-infrared Electroluminescence from Conjugated Polymer/lanthanide Porphyrin Blends" Appl. Phys. Lett. 2001, 79, 3770-3772.
58. Slooff, L. H.; Polman, A.; Cacialli, F.; Friend, R. H.; Hebbink, G. A.; van Veggel,F. C. J. M.; Reinhoudt, D. N. "Near-Infrared Electroluminescence of Polymer Light-Emitting Diodes Doped with a Lissamine-Sensitized Nd(III) Complex" Appl. Phys. Lett. 2001, 78, 2122-2124.
59. Kawamura, Y.; Wada, Y.; Yanagida, S. "Near-Infrared Photoluminescence and Electroluminescence ofNeodymium(III), Erbium(III), and Ytterbium(III) complexes" Jpn. J. Apl. Phys. 2001, 40, 350-356.
60. Hong, Z. R.; Liang, C. J.; Li, R. G.; Zang, F. X.; Fan, D.; Li, W. L.; Hung, L. S.; Lee, S. T. "Infrared and visible emission from organic electroluminescent devices based on praseodymium complex" Appl. Phys. Lett. 2001, 79, 1942-1944.
61. Henry, C. M. "Noninvasive Glucose Monitoring" C & E News 2002, 80, 41-43.
62. Burmeister, J. J.; Arnold, M. A.; Small, G. W. "Noninvasive Blood Glucose Measurements by Near-infrared Transmission Spectroscopy Across Human Tongues" Diabetes Technology & Therapeutics 2000, 2, 5-16.
Reproduced with permission o f the copyright owner. Further reproduction prohibited w ithout permission.

166
63. Zhang, L.; Small, G. W.; Arnold, M. A. "Calibration Standardization Algorithm for Partial Least-Squares Regression: Application to the Determination of Physiological Levels of Glucose by Near-Infrared Spectroscopy." Anal. Chem. 2002, 74, 4097-4108.
64. Boyer, A. E.; Lipowska, M.; Zen, J. M.; Patonay, G.; Tsang, V. C. W. "Evaluation o f Near Infrared Dyes as Labels for Immunoassays Utilizing Laser Diode Detection: Development of Near Infrared Dye Immunoassay (NIRDLA)" Anal. Lett. 1992, 25, 415-428.
65. Daneshvar, M. I.; Peralta, J. M.; Casay, G. A.; Narayanan, N.; Evans, L.; Patonay,G.; Strekowski, L. "Detection of Biomolecules in the Near-Infrared Spectral Region via a Fiber-Optic Immunosensor" Immun. Meth. 1999, 226, 119-128.
66. Chien, J. C. W. "Correlation of Electronic Spectra of Metalloporphyrins and Metalloproteins" J. Am. Chem. Soc. 1978,100, 1310-1313.
67. Gouterman, M. In The Porphyrins', Dolphin, D., Ed.; Academic Press: New York, 1978; Vol. 3, pp 1-169.
68. Crosby, G. A.; Kasha, M. "Intramolecular Energy Transfer in Ytterbium Organic Chelates" Spectrochim. Acta 1958,10, 377-382.
69. Asano-Someda, M.; Kaizu, Y. "Hot bands of (f, f*) emission from ytterbium(III) porphyrins in solution" J. Photochem. Photobiol. A 2001,139, 161-165.
70. Auzel, F. "A Relationship for Crystal Field Strength Along the Lanthanide Series; Application to the Prediction of the ( ¥ 7/2 ) Yb(III) Maximum Splitting" Opt.Mater. 2002,19, 89-94.
71. Goldner, P.; Pelle, F.; Meichenin, D.; Auzel, F. "Cooperative Luminescence in Ytterbium-doped CsCdBrs" J. Lumin. 1997, 71.
72. Quimby, D. J.; Longo, F. "Luminescence Studies on Several Tetra-arylporphyrins and their Zinc Derivatives" J. Am. Chem. Soc. 1975, 97, 5111-5117.
73. Kaizu, Y.; Asano, M.; Kobayashi, H. "Dual Fluorescence from Two Erbium (III) Porphyrins" J. Phys. Chem. 1986, 90, 3906-3910.
74. Bajema, L.; Gouterman, M.; Rose, C. B. "Porphyrins 23. Fluorescence of Second Excited Singlet and Qasiline Structure of Zinc Tetrabenzporphrin" J. Mol. Spectrosc. 1971, 39, 421-.
75. Zalesski, I. E.; Kotlo, V. N.; Sevchenk, A. N.; Solovev, K. N.; Shkirman, S. F. "Polarization of Fluorescence due to Transitions from Upper Excited-Levels" Dokl AkadNauk Sssr+ 1974, 218, 324-327.
Reproduced with permission o f the copyright owner. Further reproduction prohibited w ithout permission.

167
76. Tsvirko, M. P.; Stelmakh, G. F.; Pyatosin, V. E.; Solovyov, K. N.; Kachura, T. F. "Fluorescence from Upper Pi-Pi-Star Electronic States of Lanthanide-Porphyrin Complexes" Chem. Phys. Lett. 1980, 73, 80-83.
77. Siebrand, W. "Radiationless Transitions in Polyatomic Molecules I. Calculation of Franck-Condon Factors" J. Chem. Phys. 1967, 46, 440.
78. Pekkarinen, L.; Linschitz, H. "Studies on Metastable States of Porphyrins. II. Spectra and Decay Kinetics of Tetraphenylporphine, Zinc Tetraphenylporphine and Bacteriochlorophyll" J. Am. Chem. Soc. 1960, 82, 2407-2411.
79. Horrocks, W. D.; Bolendar, P. J.; Smith, W. D.; Supkowski, R. M."Photosensitized Near Infrared Luminescence of Ytterbium(III) in Proteins and Complexes Occurs via an Internal Redox Process" J. Am. Chem. Soc. 1997,119, 5972-5973.
80. Wang, Y. S.; Schanze, K. S. "Photochemical Probes of Intramolecular Electron and Energy-Transfer" Chem. Phys. 1993,176, 305-319.
81. Fox, R. B.; Price, T. R.; Cozzens, R. F.; Echols, W. H. "Photophysical Processes in Polymers. VII. Electronic Energy Migration and Trapping in Alternating Copolymers" Macromolecules 1974, 7, 937-941.
82. Guillet, J. Polymer Photophysics and Photochemistry: An Introduction to the Study o f Photoprocesses in Macromolecules; Cambridge University Press: Cambridge,U. K., 1987.
83. Miao, Y.-J.; Bazan, G. C. "Photophysics of Main-chain Polychromophores by Acyclic Diene Metathesis Polymerization" Macromolecules 1997, 30, 7414-7418.
84. Bazan, G. C.; Miao, Y.-J.; Renak, M. L.; Sun, B. J. "Fluorescence Quantum Yield of Poly(p-phenylenevinylene) Prepared via the Paracyclophene Route: Effect of Chain Length and Interchain Contacts" J. Am. Chem. Soc. 1996,118,2618-2624.
85. Peng, K.-Y.; Chen, S.-A.; Fann, W.-S. "Efficient Light Harvesting by Sequential Energy Transfer across Aggregates in Polymers o f Finite Conjugational Segments with Short Aliphatic Linkages" J. Am. Chem. Soc. 2001,123, 11388-11397.
86. Jenekhe, S. A.; Osaheni, J. A. "Excimers and Exciplexes of Conjugated Polymers" Science 1994, 265, 765-768.
87. Nguyen, T.-Q.; Doan, V.; Schwartz, B. J. "Conjugated Polymer Aggregates in Solution: Control of Interchain Interactions" J. Chem. Phys. 1999,110, 4068-4078.
Reproduced with permission o f the copyright owner. Further reproduction prohibited w ithout permission.

168
88. Blatchford, J. W.; Gustafson, T. L.; Epstein, A. J.; Vanden Bout, D. A.; Kerimo, J.;Higgins, D. A.; Barbara, P. F.; Fu, D.-K.; Swager, T. ML; MacDiarmid, A. G. "Spatially and Temporally Resolved Emission from Aggregates in Conjugated Polymers" Phys. Rev. B 1996, 54, R3683-R3686.
89. Blatchford, J. W.; Jessen, S. W.; Lin, L.-B.; Gustafson, T. L.; Fu, D.-K.; Wang, H.- L.; Swager, T. M.; MacDiarmid, A. G.; Epstein, A. J. "Photoluminescence in Pyridine-based Polymers: Role of Aggregates" Phys. Rev. B 1996, 54, 9180-9189.
90. Halkyard, C. E.; Rampey, M. E.; Kloppenburg, L.; Studer-Martinez, S. L.; Bunz,U. H. F. "Evidence of Aggregate Formation of 2,5-Dialkyl(p- phenyleneethynylenes) in Solution and Thin Films" Macromolecules 1998, 31, 8655-8659.
91. Lemmer, U.; Heun, S.; Mahrt, R. F.; Scherf, U.; Hopmeier, M.; Siegner, U.; Gobel,E. O.; Mullen, K.; Bassler, H. "Aggregate Fluorescence in Conjugated Polymers" Chem. Phys. Lett. 1995, 240, 373-378.
92. Kohler, A.; Gruner, J.; Friend, R. H.; Mullen, K.; Scherf, U. "Photocurrent Measurements on Aggregates in Ladder-Type Poly(p-phenylene)" Chem. Phys. Lett. 1995, 243, 456-461.
93. Brunner, K.; van Haare, J. A. E. H.; Langeveld-Voss, B. M. W.; Schoo, H. F. M.; Hofstraat, J. W.; van Dijken, A. "Mechanistic Study of Excitation Energy Transfer in Dye-Doped PPV Polymers" J. Phys. Chem. B. 2002,106, 6834-6841.
94. Halls, J. J. M.; Pichler, K.; Friend, R. H.; Moratti, S. C.; Holmes, A. B. "Exciton Dissociation at a Poly(p-phenylenevinylene) C-60 Heterojunction" Synth. Met. 1996, 77, 277-280.
95. Levitsky, I. A.; Kim, J.; Swager, T. M. "Energy Migration in a Poly(phenylene ethynylene): Determination of Interpolymer Transport in Anisotropic Langmuir- Blodgett Films" J. Am. Chem. Soc. 1999,121, 1466-1472.
96. Virgili, T.; Lidzey, D. G.; Bradley, D. D. "Efficient Energy Transfer from Blue to Red in Tetraphenylporphyrin-Doped Poly(9,9-dioctylfluorene) Light-Emitting Diodes" Adv. Mater. 2000,12, 58-62.
97. McGehee, M. D.; Bergstedt, T.; Zhang, C.; Saab, A. P.; O'Regan, M. B.; Bazan, G. C.; Srdanov, V. I.; Heeger, A. J. "Narrow Bandwidth Luminescence from Blends with Energy Transfer from Semiconducting Conjugated Polymers to Europium Complexes" Adv. Mater. 1999,11, 1349-1354.
98. Vahlenkamp, T.; Wegner, G. "Poly(2,5-Dialkoxy-p-phenylene)s - Synthesis and Properties" Macromol. Chem. Phys. 1994,195, 1933-1952.
Reproduced with permission o f the copyright owner. Further reproduction prohibited w ithout permission.

169
99. Child, A. D.; Sankaran, B.; Larmat, F.; Reynolds, J. R. "Charge-carrier Evolution in Electrically Conducting Substituted Polymers Containing Diheterocycle p- Phenylene Repeat Units" Macromolecules 1995, 28, 6571-6578.
100. Balanda, P. B. In Department o f Chemistry, University of Florida:Gainesville, 1997, p 243.
101. Miniscalco, W. J. In Rare Earth Doped Fiber Lasers and Amplifiers', Digonnet, M. J. F., Ed.; Marcel Dekker, Inc.: New York, 1993, pp 48-50.
102. Forster, T. "Zwischenmolekulare Energiewanderung und Fluoreszenz" Ann. Phys. 1948, 2, 55.
103. Morgado, J.; Cacialli, F.; Iqbal, R.; Moratti, S. C.; Holmes, A. B.; Yahioglu, G.; Milgrom, L. R.; Friend, R. H. "Forster Energy Transfer and Control o f the Luminescence in Blends of an Orange-Emitting Poly(p-phenylenevinylene) and a Red-Emitting Tetraphenylporphyrin" J. Mater. Chem. 2001,11.
104. Destriau, G.; Ivey, H. F. In Proceedings IRE, 1955; Vol. 43, pp 1911-1940.
105. Destriau, G. J. Chim. Phys. 1936, 33, 587.
106. Helfrich, W.; Schneider, W. G. "Recombination Radiation in Anthracene Crystals" Phys. Rev. Lett. 1965,17, 229-231.
107. Pope, M.; Magnante, P.; Kallmann, H. P. "Electroluminescence in Organic Crystals" J. Chem. Phys. 1963, 38, 2042.
108. Tang, C. W.; Van Slyke, S. A. "Organic Electroluminescence Diodes" Appl. Phys. Lett. 1987, 51, 913-915.
109. Burroughes, J. H.; Bradley, D. D.; Brown, A. R.; Marks, R. N.; Mackay, K.;Friend, R. H.; Bums, P. L.; Holmes, A. B. "Light-Emitting-Diodes Based on Conjugated Polymers" Nature 1990, 347, 539-541.
110. Cao, Y.; Parker, I. D.; Yu, G.; Zhang, C.; Heeger, A. J. "Improved Quantum Efficiency for Electro luminescence in Semiconducting Polymers" Nature 1998,397, 414-417.
111. Friend, R. H.; Gymer, R. W.; Holmes, A. B.; Burroughes, J. H.; Marks, R. N.; Taliani, C.; Bradley, D. D. C.; Dos Santos, D. A.; Bredas, J. L.; Logdlund, M.; Salaneck, W. R. "Electroluminescence in conjugated polymers" Nature 1999, 397, 121-128.
112. Dodabalapur, A. "Organic Light Emitting Diodes" Solid State Commun. 1997,102, 259.
Reproduced with permission o f the copyright owner. Further reproduction prohibited w ithout permission.
170
113. Braun, D.; Heeger, A. J. "Visible-Light Emission From Semiconduction Polymer Diodes" Appl. Phys. Lett. 1991, 58, 1982-1984.
114. Bum, P. L.; Kraft, A.; Baigent, D. R.; Baigent, D. R.; Bradley, D. D. C.; Brown, A. R.; Friend, R. H.; Gymer, D. A.; Holmes, A. B.; Jackson, R. W. J. "Chemical tuning of the electronic properties of poly(p-phenylenevinylene)-based copolymers" J. Am. Chem. Soc. 1993,115, 10117-10124.
115. Bum, P. L.; Bradley, D. D. Friend, R. H.; Halliday, D. A.; Holmes, A. B.; Jackson, R. W.; Kraft, A. "Precusor Route Chemistry and Electronic-Properties of Poly(p-phenylene-vinylene), Poly[(2,5-dimethyl-p-phenylene)vinylene] and Poly[(2,5-dimethoxy-p-phenylene)vinylene]" Perkin Trans. 1 1992, 3225-3231.
116. Greenham, N. C.; Moratti, S. C.; Bradley, D. D. C.; Friend, R. H.; Holmes, A. B. "Efficient Light-Emitting-Diodes Based on Polymers with High Electron- Affinities" Nature 1993, 365, 628-630.
117. Grem, G.; Leditzky, G.; Ullrich, B.; Leising, G. "Blue Electroluminescent Device Based on a Conjugated Polymer" Synth. Met. 1992, 51, 383-389.
118. Grem, G.; Leditzky, G.; Ullrich, B.; Leising, G. "Realization of a Blue-Light- Emitting Device Using Poly(para-phenylene)" Adv. Mater. 1992, 4, 36-37.
119. Scherf, U.; List, E. J. W. "Semiconducting Polyfluorenes—Towards Reliable Stmcture—Property Relationships" Adv. Mater. 2002,14, 477-487.
120. Bemanose, A.; Compte, M.; Vouaux, P. J. Chim. Phys. 1953, 50, 64.
121. Kaneto, K.; Yoshino, K.; Kao, K.; Inuishi, Y. "Electroluminescence in Polyethylene Terphthalate" Jpn. J. Apl. Phys. 1974,13, 1023-1024.
122. Wang, D. K.; Hong, Z., Y.; Ma, D. G.; Zhao, X. J.; Wang, L. X.; Lu, S.; Minami, N.; Takada, N.; Ichino, Y.; Yase, K.; Jing, X. B.; Wang, F. S. "Luminescence Enhancement by Blending PVK with Blue PPV Copolymer" Synth. Met. 1999,102, 1132-1134.
123. Forster, T. Discuss. Faraday Soc. 1959, 27, 7.
124. Dogariu, A.; Gupta, R.; Heeger, A. J.; Wang, H. "Time-Resolved Forster Energy Transfer in Polymer Blends" Synth. Met. 1999,100, 95-100.
125. Barigelletti, F.; Flamigni, L. "Photoactive Molecular Wires Based on Metal Complexes" Chem. Soc. Rev. 2000, 29, 1-12.
Reproduced with permission o f the copyright owner. Further reproduction prohibited w ithout permission.

171
126. Fume, M.; Yoshida, T.; Nozakura, S.; Kamachi, M. "Intramolecular Energy- Transfer in Covalently Linked Polypyrindine Ruthenium(II)/Osmium(II) Binuclear Complexes- Ru(II)(Bpy)MeBpy-(CH2)N-MeBpyOs(II)(Bpy)2 (N=2, 3, 5, and 7)" Bull. Chem. Soc. Jpn. 1991, 64, 1632-1640.
127. Gholamkhass, B.; Nozaki, K.; Ohno, T. "Evaluation of Electronic Interaction in Matrix Elements for Photo induced Electron Transfer Processes within Mixed- Valence Complexes" J. Phys. Chem. B 1997,101, 9010-9021.
128. Krishnan, C. S. S.; Pamidighantam, R.; Tan, W.-S. Proceedings o/SPIE Optical Wireless Communications IV 2001, 104.
129. Tanaka, Y.; Tomioka, K.; Takano, M.; Nakagawa, M. "Wireless CATV Uplink System with Subcarrier Modulation Using Infrared Communications for Apartment Houses" IEICE Transactions on Communications 2001, E84B(12), 3235-3242.
130. Porumb, G. G.; Sterian, A. G.; Spulber, O.; Piscureanu, M. C. Proceedings o f SPIE ROMOPTO 2000 - Sixth Conference on Optics 2000, 674.
131. Wemara, L.; Kaoru, S.; Yuxiao, X.; Huangcong, X. Proceedings o f SPIE Optical Sensing, Imaging, and Manipulation fo r Biological and Biomedical Applications 2000, 34.
132. Liddiard, K. C. Proceedings o f SPIE Infrared Technology and Applications XXVI 2000, 119.
133. Kawamura, Y.; Wada, Y.; Iwamuro, M.; Kitamura, T.; Yanagida, S. "Near- infrared Electroluminescence from Ytterbium(III) Complex" Chem Lett 2000, 280- 281.
134. Hong, Z. R.; Liang, C. J.; Li, R. G.; Zhao, D.; Fan, D.; Li, W. L. "Infrared Electroluminescence of Ytterbium Complexes in Organic Light Emitting Diodes" Thin Solid Films 2001, 391, 122-125.
135. Curry, R. J.; Gillian, W. P. "Infra-red and Visible Electoluminescence from ErQ based OLEDs" Synth. Met. 2000,111-112, 35-38.
136. Kang, T.-S.; Harrison, B. S.; Bouguettaya, M.; Foley, T. J.; Boncella, J. M.; Schanze, K. S.; Reynolds, J. R. "Near-IR LEDs Based on Poly(phenylene)/Yb-tra- beta-Diketonate Complexes" Adv. Funct. Mater., In Press.
137. Foley, T. J.; Harrison, B. S.; Knefely, A. S.; Reynolds, J. R.; Schanze, K. S.; Boncella, J. M. Inorg. Chem., Submitted.
Reproduced with permission o f the copyright owner. Further reproduction prohibited w ithout permission.

172
138. Hale, G. D.; Oldenburg, S. J.; Halas, N. J. "Effects of Photo-Oxidation on Conjugated Polymer Films" Appl. Phys. Lett. 1997, 71, 1483-1485.
139. Nguyen, T.-Q.; Schwartz, B. J.; Schaller, R. D.; Johnson, J. C.; Lee, L. F.; Haber, L. H.; Saykally, R. J. "Near-Field Scanning Optical Microscopy (NSOM) Studies of the Relationship between Interchain Interactions, Morphology, Photodamage, and Energy Transport in Conjugated Polymer Films." J. Phys. Chem. B 2001,105, 5153-5160.
140. Shin, S.-H.; Park, J.-S.; Park, J.-W.; Kim, H. K. "Poly(p-phenylene)-based Materials for Light-emitting Diodes: Electroluminescence and Photo-oxidation" Synth. Met. 1999,102, 1060-1062.
141. Nguyen, T.-P.; Destruel, P.; Molinie, P. In Handbook o f Advanced Electronic and Photonic Materials and Devices', Nalwa, H. S., Ed.; Academic Press: San Diego, 2000; Vol. 10.
142. http://www.roithner-laser.com/All_Datasheets/LEDs/LED970-06.pdf. (accessed March 7,2003).
143. Baldo, M. A.; Adachi, C.; Forrest, S. R. "Transient Analysis of Organic Electrophosphorescence. II. Transient Analysis of Triplet-triplet Annihilation." Phys. Rev. £2000, 62, 10967-10977.
144. Kang, T.-S.; Harrison, B. S.; Foley, T. J.; Knefely, A. S.; Boncella, J. M.; Reynolds, J. R.; Schanze, K. S. "Near-Infrared Electroluminescence from Lanthanide Tetraphenylporphyrin:Polystyrene Blends" Adv. Mater. 2002, Submitted.
145. Walters, V. A.; de Paula, J. C.; Jackson, B.; Nutaitis, C.; Hall, K.; Lind, J.; Cardozo, K.; Chandran, K.; Raible, D.; Phillips, C. M. "Electronic Structure of Triplet States of Zinc(II) Tetraphenylporphyrins" J. Phys. Chem. 1995, 99, 1166- 1171.
146. Taccheo, S.; Laporta, P.; Longhi, S.; Svelto, O.; Svelto, C. "Diode-Pumped Bulk Erbium-Ytterbium Lasers" Appl. Phys. B 1996, B63, 425-436.
147. Scheps, R. "Upconversion Laser Processes" Progress in Quantum Electronics 1996, 20, 271-358.
148. Samoc, M.; Samoc, A.; Luther-Davies, B.; Scherf, U. "Linear and Nonlinear Optical Properties of a Ladder Poly(p-phenylene) Polymer" Synth. Met. 1997, 87, 197-200.
149. Suzuki, H. "Self-enhancement in the Electroluminescence of a Near-infrared Ionic Dye" Appl. Phys. Lett. 2000, 76, 1543-1545.
Reproduced with permission o f the copyright owner. Further reproduction prohibited w ithout permission.

173
150. Pinner, D. J.; Friend, R. H.; Tessler, N. "Analysis of Polymer-based Devices"Synth. Met. 2001,124, 41-43.
151. Lane, P. A.; Palilis, L. C.; O'Brien, D. F.; Giebeler, C.; Cadby, A. J.; Lidzey, D.G.; Campbell, A. J.; Blau, W.; Bradley, D. D. C. "Origin of electrophosphorescence from a Doped Polymer Light Emitting Diode" Phys. Rev.B 2001, 63,235206.
152. Zhang, J.; Abe, T.; Kaneko, M. "Charge Transfer of Tetraphenylporphyrin Zinc Complexes Incorporated in a poly(2-vinylpyridine) Matrix" J. Porphyrins Phthalocyanines 1998, 2, 93-99.
153. McCarthy, T. F.; Witteler, H.; Pakula, T.; Werts, M. H. "Structure and Properties of Poly(2,5-di-n-dodecyl-l ,4-phenylene) Depending on Chain Length" Macromolecules 1995, 28, 8350-8362.
154. Noh, Y.-Y.; Lee, C.-L.; Kim, J.-J.; Yase, K. "Energy Transfer and Device Performance in Phosphorescent Dye Doped Polymer Light Emitting Diodes" J. Chem. Phys. 2003,118, 2853-2864.
155. Fujii, A.; Ohmori, Y.; Yoshino, K. "An Organic Infrared Electroluminescent Diode Utilizing a Phthalocyanine Film" IEEE Trans. Elec. Devices 1997, 44, 1204-1207.
156. Curry, R. J.; Gillian, W. P. "1.54 urn Electroluminescence from Erbium (III) tris(8- hydroxyquinoline) (ErQ)-based Organic Light-Emitting Diodes" Appl. Phys. Lett. 1999, 75, 1380-1382.
157. Sun, R. G.; Wang, Y. Z.; Zhang, Q. B.; Zhang, H. J.; Epstein, A. J. "1.54 pm Infrared Photoluminescence and Electroluminescence from an Erbium Organic Compound" J. Appl. Phys. 2000, 87, 7589-7591.
158. Koppe, M.; Brabec, C. J.; Saricifci, N. S.; Eichen, Y.; Nakhmanovich, G.; Ehrenfreund, E.; Epstein, O.; Heiss, W. "Er(III) Emission from Organic Complexes Embedded in Thin Polymer Films" Synth. Met. 2001,121, 1511-1512.
159. Ennen, H.; Schneider, J.; Pomrenke, G.; Axmann, A. "1.54-um Luminescence of Erbium-Implanted III-V Semiconductors and Silicon" Appl. Phys. Lett. 1983, 43, 943-945.
160. Tessler, N.; Medvedev, V.; Kazaes, M.; Kan, S.; Banin, U. "Efficient Near- Infrared Polymer Nanocrystalline Light-Emitting Diodes" Science 2002, 295, 1506-1508.
Reproduced with permission o f the copyright owner. Further reproduction prohibited w ithout permission.

174
161. Khreis, O. M.; Curry, R. J.; Somerton, M.; Gillian, W. P. "Infrared Organic Light Emitting Diodes Using Neodymium tris-(8-hydroxyquinoline)" J. Appl. Phys. 2000, 88, 777-780.
162. Joshi, K. C.; Pathak, V. N. "Studies in Fluorinated Beta-Diketonates and Related Compounds 3. Synthesis of Some New Piperidinium Tetrakis Rare-Earth 1, 3- Diketonates and Their Fluorescence and Infrared Spectral Studies" J. Inorg. Nucl. Chem. 1973, 35, 3161-3170.
163. He, Y.; Hattori, R.; Kanicki, J. "Light Output Measurements of the Organic Light- Emitting Devices" Rev. Sci. Instrum. 2000, 71, 2104-2107.
164. Greenham, N. C.; Friend, R. H.; Bradley, D. D. "Angular-Dependence of the Emission from a Conjugated Polymer Light-Emitting Diode — Implications for Efficiency Calculations" Adv. Mater. 1994, 491-494.
Reproduced with permission o f the copyright owner. Further reproduction prohibited w ithout permission.

BIOGRAPHICAL SKETCH
Benjamin Scott Harrison was bom April 10,1977 in Pensacola, Florida, as the first
of three children of Jeremiah and Glenda Harrison. Two years later he was joined by his
brother Micah; and another three years later by his sister Melissa. Ben spent most of his
life living just north of Pensacola, Florida in an area that is even now losing its rural
characteristics.
Beginning in high school, Ben set his sights on becoming an electrical engineer.
However, a brief meeting with Ed Webster changed his thinking. Ed was then a
chemistry student at the University of West Florida (UWF) and later received a Ph.D. in
chemistry at the University of Florida (UF). Ed’s praise of the experience he received at
UWF inspired Ben to pursue chemistry at UWF. Ben excelled in the chemistry program,
eventually winning the department’s highest honor—the Solutia Award (formerly the
Monsanto Award), and the Top Undergraduate Award in the College of Science and
Technology. Chemistry was not the only thing at UWF that came to Ben’s attention. In
Organic Chemistry and Calculus III classes, a bright-eyed and cheery girl named Patty
Gore introduced herself to Ben. Three years later they were married.
After receiving his B.S. degree, Ben continued his studies at UF to pursue a Ph.D.
in Inorganic Chemistry in 1998. On May 13, 2000, Ben and Patty were married in
Patty’s hometown of Americus, GA. On May 16, 2001, Patty gave birth to their first
child, Jackson David. Jackson is a wonderful child with a cute smile and laugh that
175
Reproduced with permission o f the copyright owner. Further reproduction prohibited w ithout permission.

people cannot resist. But one was not enough because on February 24, 2003, their
daughter Theda Frances was bom.
Upon graduation, Ben will be leaving the traditional chemistry field for a while.
He and his family are planning to move to Clemson University where Ben will work
under the direction of Physics/Materials Science Professor Dave Carroll as a postdoctoral
associate. Beyond then, the future has not been written.
Reproduced with permission o f the copyright owner. Further reproduction prohibited w ithout permission.

I certify that I have read this study and that in my opinion it conforms to acceptable standards of scholarly presentation and is fully adequate, in scope and quality, as a dissertation for the degree of Doctor of Philosophy.
K jIaA, ^ OKirk S. Schanze, Chairman Professor of Chemistry
I certify that I have read this study and that in my opinion it conforms to acceptable standards of scholarly presentation and is fully adequate, in scope and quality, as a dissertation for the degree of Doctor of Philosophy. j /j
. . . .........; / ..7
“JohtifR. Reynolds PrMessor of Chemistry
I certify that I have read this study and that in my opinion it conforms to acceptable standards of scholarly presentation and is fully adequate, in scope and quality, as a dissertation for the degree of Doctor of Philosophy.
David E. Richardson Professor of Chemistry
I certify that I have read this study and that in my opinion it conforms to acceptable standards of scholarly presentation and is fully adequate, in scope and quality, as a dissertation for the degree of Doctor of Philosophy.
Daniel R. Talham Professor of Chemistry
I certify that I have read this study and that in my opinion it conforms to acceptable standards of scholarly presentation and is fully adequate, in scope and quality, as a dissertation for the degree of Doctor of Philosophy. ____ _____
~*~"Harfiph A. LatchmanAssociate Professor of Electrical and Computer Engineering
This dissertation was submitted to the Graduate Faculty of the Department of English in the College of Liberal Arts and Sciences and to the Graduate School and was accepted as partial fulfillment of the requirements for the degree of Doctor of Philosophy.
May 2003Dean, Graduate School
Reproduced with permission o f the copyright owner. Further reproduction prohibited w ithout permission.