EBTAX: The Conversion of Ethane to Aromatics via Catalytic ...
Upload
unishivajiCategory
view
2download
0
Spectrochimica Acta Part A: Molecular and Biomolecular Spectroscopy 145 (2015) 98–109
Contents lists available at ScienceDirect
Spectrochimica Acta Part A: Molecular andBiomolecular Spectroscopy
journal homepage: www.elsevier .com/locate /saa
Synthesis, spectral characterization, thermal behaviour,antibacterial activity and DFT calculation on N0-[bis(methylsulfanyl)methylene]-2-hydroxybenzohydrazide and N0-(4-methoxy benzoyl)-hydrazinecarbodithioic acid ethyl ester
http://dx.doi.org/10.1016/j.saa.2015.02.0551386-1425/� 2015 Elsevier B.V. All rights reserved.
⇑ Corresponding authors. Tel.: +91 542 6702447.E-mail addresses: [email protected] (M.K. Bharty), [email protected] (N.K. Singh).
M.K. Bharty a,⇑, R.K. Dani a, S.K. Kushawaha a, Om Prakash b, Ranjan K. Singh b, V.K. Sharma c,R.N. Kharwar c, N.K. Singh a,⇑a Department of Chemistry, Banaras Hindu University, Varanasi 221005, Indiab Department of Physics, Banaras Hindu University, Varanasi 221005, Indiac Department of Botany, Banaras Hindu University, Varanasi 221005, India
h i g h l i g h t s
� Two new N-aroyl-hydrazinecarbodithioic acid estershave been reported.� Both compounds show NLO
behaviour better than the urea.� Structural data from X-ray are
corroborated well with DFTcalculations.� Compound 2 shows antibacterial
activity but lower than the standarddrugs.� These compounds may be potentially
used against weak bacterialpathogens.
g r a p h i c a l a b s t r a c t
Two new compounds N0-[bis(methylsulfanyl) methylene]-2-hydroxybenzohydrazide {Hbmshb (1)} andN0-(4-methoxy benzoyl)-hydrazinecarbodithioic acid ethyl ester {H2mbhce (2)} have been synthesized.Inter and intra molecular hydrogen bonding link two molecules and provide linear chain structure. Inaddition to this, compound 2 is stabilized by CH� � �p and NH� � �p interactions. Molecular geometry fromX-ray analysis, geometry optimization, charge distribution, bond analysis, frontier molecular orbital(FMO) analysis and non-linear optical (NLO) effects have been performed using the density functionaltheory (DFT) with the B3LYP functional. The bioefficacy of compounds has been examined against thegrowth of bacteria to evaluate their anti-microbial potential.
a r t i c l e i n f o
Article history:Received 21 October 2014Received in revised form 15 February 2015Accepted 16 February 2015Available online 21 February 2015
Keywords:Crystal structureHydrogen bonding
a b s t r a c t
Two new compounds N0-[bis(methylsulfanyl) methylene]-2-hydroxybenzohydrazide {Hbmshb (1)} andN0-(4-methoxy benzoyl)-hydrazinecarbodithioic acid ethyl ester {H2mbhce (2)} have been synthesizedand characterized with the aid of elemental analyses, IR, NMR and single crystal X-ray diffraction data.Compounds 1 and 2 crystallize in orthorhombic and monoclinic systems with space group Pna21 andP21/n, respectively. Inter and intra molecular hydrogen bonding link two molecules and provide linearchain structure. In addition to this, compound 2 is stabilized by CH� � �p and NH� � �p interactions.Molecular geometry from X-ray analysis, geometry optimization, charge distribution, bond analysis, fron-tier molecular orbital (FMO) analysis and non-linear optical (NLO) effects have been performed using the

M.K. Bharty et al. / Spectrochimica Acta Part A: Molecular and Biomolecular Spectroscopy 145 (2015) 98–109 99
Antibacterial propertyThermal stabilityDFT calculationNLO property
density functional theory (DFT) with the B3LYP functional. The bioefficacy of compounds has been exam-ined against the growth of bacteria to evaluate their anti-microbial potential. Compounds 1 and 2 arethermally stable and show NLO behaviour better than the urea crystal.
� 2015 Elsevier B.V. All rights reserved.
Introduction
The chemistry of nitrogen–sulphur containing compounds isvery interesting from the viewpoint of their electrical conductivity,molecular magnetism, electrochemical, biological and optoelec-tronic properties [1–5]. Metal complexes derived from N-aroylhydrazinecarbodithioic alkyl esters or dithiocarbazic acid estershave been studied [6–10] not only because of their intriguing coor-dination chemistry, but also because of their pronounced biologicalactivities against microbes, viruses and cancer cells [11–13]. Thepotassium salts of N-(aroyl)-hydrazine carbodithioates are notvery stable since they undergo intramolecular cyclization withelimination of H2S forming 1,3,4-oxadiazole-2-thiones in the pres-ence of acid or base [14] or on complexation [15,16]. The maininterest in the synthesis of esters is that they are much stable thanthe potassium salt and do not undergo cyclization to form oxa-diazole derivatives. These S-alkyl/aryl hydrazine carbodithioic acidesters form complexes with a wide number of metal cations andshow promising biological activity. A survey of literature showsthat several papers are available on the syntheses and spectralcharacterization of substituted dithiocarbazates but there is verylittle work reported on the dithioester of N-acyl hydrazide,RC(O)NH-NH-C(S)SR which contains a similar ANHAC(@S) moietyas the S- alkyl esters of dithiocarbazic acid [11–13,17,18].Following our interest in the synthesis and structural studies ofcompounds containing the HANAC@S moiety responsible for bio-logical activity, we report herein the preparation of N0-[bis(methyl-sulfanyl) methylene]-2-hydroxybenzohydrazide (Hbmshb) and N0-(4-methoxy benzoyl)-hydrazine carbodithioic acid ethyl ester(H2mbhce) and their structural characterization, microbicidalproperties and DFT calculation.
Experimental section
Materials, physical measurements and method
Commercial reagents were used without further purificationand all experiments were carried out in open atmosphere.Methyl salicylate and methyl 4-methoxybenzoate (SigmaAldrich), CS2 (S D Fine chemicals, India) and KOH (Qualigens) wereused as received. Salicylic acid hydrazide was prepared by thereported method [19]. All the solvents were dried and distilledbefore use following the standard procedure. Carbon, hydrogen,nitrogen and sulphur contents were estimated on a CHN ModelCE-440 Analyser and on an Elementar Vario EL III Carlo Erba1108. IR spectra were recorded in the 4000–400 cm�1 region asKBr pellets on a Varian Excalibur 3100 FT-IR spectrophotometer.1H and 13C NMR spectra were recorded in DMSO-d6 on a JEOLAL300 FT NMR spectrometer using TMS as an internal reference.Five human bacterial pathogens Salmonella typhi (MTCC 3216),Shigella flexneri (ATCC 12022), Staphylococcus aureus (ATCC25323), Aeromonas hydrophila (ATCC 7966) and Enterococcus faecaliswere used to test the antibacterial activity of compounds 1 and 2.Commercial antibacterial drugs, streptomycin sulfate and neomycinsulfate (Himedia) at the same concentrations (5–50 lg/disc) wereused to compare effectiveness of the test compounds.
Synthesis
Synthesis of N2-[bis(methylsulfanyl) methylene]-2-hydroxybenzohydrazide (Hbmshb, 1)
Potassium N0-(2-hydroxy benzoyl)-hydrazine carbodithioate[K+(H2L)�] was prepared by adding CS2 (1.5 mL, 20 mmol) drop-wise to a suspension of salicylic acid hydrazide (3.042 g, 20 mmol)in methanol (30 mL) in the presence of potassium hydroxide(1.12 g, 20 mmol) and the reaction mixture was stirred con-tinuously for 30 min. A white solid [K+(H2L)�] which separatedwas filtered, washed with EtOH and dried. Methyl iodide (1.2 mL,20 mmol) was added dropwise to the methanol suspension of theabove freshly prepared [K+(H2L)�] (2.660 g, 10 mmol) and stirredcontinuously for 2 h at room temperature. The resulting yellowsolution was concentrated and acidified with dilute CH3COOH(20% v/v) which yielded a yellow precipitate of N2-[bis(methylsul-fanyl) methylene]-2-hydroxybenzohydrazide. This was filtered,washed with water and dried in vacuo. The precipitate was dis-solved in methanol filtered and kept for crystallization whichformed yellow crystals of compound 1. Yield: 60%. M.p. 185 �C.Anal. Calc. for C10H12O2N2S2 (256.36): C, 46.83; H, 4.68; N, 10.91;S, 24.98. Found: C, 46.84; H, 4.70; N, 10.86; S, 25.02%. IR (cm�1,KBr): m(OH) 3301 m, m(NH) 3169 m; m(C@O) 1634s; m(N–N)1069; m(C@S) 828. 1H NMR (DMSO-d6; d ppm): 11.80 (s, 1H, OH),9.70 (s, 1H, NH), 7.5-6.8 (m, 4H aromatic ring), 1.65 (s, 3H,–CH3). 13C NMR (DMSO-d6; d ppm): 203.12 (>C–S), 163.98(>C@O), 158.97 (C1), 134.41 (C3), 128.58 (C5), 119.69 (C6),117.32 (C4), 115.27 (C2), 16.85 (C9, C10).
Synthesis of N0-(4-methoxy benzoyl)-hydrazinecarbodithioic acidethyl ester (H2mbhce, 2)
[K+(H2L0)�] was prepared as described above for the synthesis ofpotassium N0-(2-hydroxybenzoyl)-hydrazine carbodithioate[K+(H2L)�]. N0-(4-methoxy benzoyl)-hydrazinecarbodithioic acidethyl ester (H2mbhce) was synthesized by adding ethyl iodide(1 mL, 10 mmol) dropwise to a methanol suspension of freshly pre-pared potassium [N0-(4-methoxy benzoyl) hydrazine] carbod-ithioate [K+(H2L0)�] (2.804 g, 10 mmol) and stirring the reactionmixture for 2 h at room temperature. The resulting solution wasfiltered off and kept for crystallization which yielded colourlesscrystals of compound 2 suitable for X-ray analyses after 10 days.Yield: 50%. M.p. 235 �C. Anal. Calc. for C11H14N2S2O2 (270.36): C,48.82; H, 5.18; N, 10.36; S 23.67. Found: C, 48.90; H, 5.22; N,10.35; S, 23.59%. IR (m, cm�1, KBr): (NH) 3240 m, (C@O) 1698s;(N–N) 1051; (C@S) 982. 1H NMR (DMSO-d6; d ppm): 11.75, 11.43(s, 2H, NH), 7.96-6.98 (m, 4H aromatic ring), 3.34 (–OCH3), 2.58(q, 2H). 2.47 (t, 3H). 13C NMR (DMSO-d6; d ppm): 187.81 (C9@S),163.85 (C8@O), 162.42 (C2-O), 128.41 (C6, C4), 125.05 (C5),114.42 (C3, C7), 55.40 (-OCH3), 39.26 (C10), 36.68 (C11).
Antibacterial assay
The antibacterial assay was done according to the reportedmethod with slight modifications [20,21]. The test compoundswere dissolved in DMSO to a final concentration of 5 mg/mL.Sterilized Whatman No. 1 filter paper discs (5 mm) were impreg-nated with different volumes (1, 2, 4, 6, 8 and 10 lL) of compounds

100 M.K. Bharty et al. / Spectrochimica Acta Part A: Molecular and Biomolecular Spectroscopy 145 (2015) 98–109
to get a final concentration of 5, 10, 20, 30, 40 and 50 lg per disc.Sterilized paper disc loaded with the 10 lL of DMSO was taken as acontrol. The bacterial test pathogens were spread on fresh MuellerHinton Agar (MHA) plates with the help of cotton swabs to form aneven lawn of the test bacteria. The filter paper disc impregnatedwith the test compounds were placed on the surface of the MHAplates seeded with test bacteria and the plates were incubated ina B. O. D. incubator (Caltan-152, Narang Scientific Works, NewDelhi, India) for 24 h at 37 ± 2 �C. The inhibition zone around eachdisc was measured after 24 h of incubation. Inhibitory concentra-tions (IC50) of compounds 1 and 2 were determined using brothdilution method by MTT (3-(4,5-dimethylthiazol-2-yl)-2,5-diphenyltetrazolium bromide) assay. The test compounds weredissolved in DMSO to a final concentration of 2 mg/ml. The testcompounds were diluted to various concentrations (2, 4, 8, 16,32, 64, and 100 lg/mL) in 5 mL culture tube containing 2 mLMueller–Hinton broth. One drop of exponentially growing cultureof test bacterium was inoculated in each concentration of com-pounds and incubated at 37 ± 2 �C for 24 h. A control was preparedusing test bacterium and equal volume of the DMSO (100 lL) inMueller–hinton broth without test compound. After incubationperiod, 200 lL MTT solution (5 mg/ml) prepared in phosphate sal-ine buffer (PBS) was added to each vial and incubated at 37 ± 2 �Cfor one hour. The culture was centrifuged at 10,000 rpm for 10 minand absorbance was observed at 570 nm. Minimum concentrationof compounds which was able to inhibit 50% activity of bacteria isconsidered as IC50.
Crystal structure determination
Crystals suitable for X-ray analyses of the compounds weregrown at room temperature. The crystal data were collected onan Oxford Gemini diffractometer equipped with a CrysAlis CCDsoftware using a graphite mono-chromated Mo Ka (k = 0.71073 Å) radiation source at 293 and 150 K for compounds 1 and 2,respectively. Multi scan absorption correction was applied to theX-ray data collection for all the compounds. The structure wassolved by direct methods (SHELXS-08) and refined against all databy full matrix least-square on F2 using anisotropic displacementparameters for all non-hydrogen atoms. All hydrogen atoms wereincluded in the refinement at geometrically ideal position andrefined with a riding model [22]. The MERCURY package andORTEP-3 for Windows program were used for generating struc-tures [23,24].
Results and discussion
Two new compounds N0-[bis(methylsulfanyl) methylene]-2-hydroxybenzohydrazide (1) and N0-(4-methoxy benzoyl)-
O
NH
N
SCH3
SCH3
Reflux 4 h,
C
OH
O
OCH3
OH
N2H4.H2O
12
3
456
78
9
10
65
Scheme 1. Synthesis of N2-[bis(methylsulfany
hydrazinecarbodithioic acid ethyl ester (2) have been preparedby the reaction of methyl/ethyl iodide with potassium N-(aroyl)hydrazinecarbodithioate. The compounds are stable towards airand moisture and are soluble in methanol and ethanol fromwhich they have been crystallized to get single crystals.Schemes 1 and 2 depict the formation of these compounds. TheX-ray diffraction studies of compound 1 indicate that carbodithioate[–NHNHC(S)S�] moiety has undergone thioenolization and thedithiol form reacted with methyl iodide to yield bis(methylsul-fanyl) methylene group and both sulphur are bonded with methylgroup. In the case of compound 2, only one ethyl group is attachedto carbodithioate moiety without undergoing thioenolization.
IR spectra
The IR spectrum of N2-[bis(methylsulfanyl) methylene]-2-hy-droxy benzohydrazide (1) in KBr shows absorptions (cm�1) dueto the stretching modes of OH (3301), NH (3169), CH (2905),C@O (1634), N–N (1069) and C–S (828). The IR spectrum of N0-(4-methoxy benzoyl)-hydrazinecarbodithioic acid ethyl ester (2)shows absorptions (cm�1) due to the stretching modes of NH(3240 m), C@O (1698s), N–N (1051) and C@S (982) indicating thepresence of –C(O)NH–NH–C(S)– group [25].
1H and 13C NMR spectraThe 1H NMR spectrum of Hbmshb (1) in DMSO-d6 shows two
signals at d 11.80 and 9.70 ppm due the phenolic (OH) and hydra-zinic (NH) protons, respectively. The aromatic protons appear asmultiplet in the region of d 7.5–6.8 ppm. The methyl protons areobserved at 1.65 ppm. The 13C NMR spectrum of Hbmshb showssignals at d 203.12, 163.98, 158.97 ppm due to the C@S, C@O andC–O (phenolic) carbons, respectively. The phenyl ring carbonsappear at d 134.41 (C3), 128.58 (C5), 119.69 (C6), 117.32 (C4),115.27 (C2) ppm while both methyl carbons are observed at d16.85 ppm. The 1H NMR spectrum of H2mbhce in DMSO-d6 showssignals at d 11.75, 11.43 and 3.34 ppm for the amide, thioamideand –OCH3 protons, respectively. Four protons of the phenyl ringappear as multiplet in the range d 7.96–6.98 ppm and methyleneand methyl protons of ethyl group appear at d 2.58 and2.47 ppm, respectively. The 13C NMR spectrum of H2mbhce showssignals at d 187.81, 163.85 and 162.42 ppm due to the C@S, C@Oand C–O (methoxy phenyl) carbons, respectively. The methyleneand methyl carbons appear at d 39.26 and 36.68 ppm, respectivelywhile other methoxy phenyl carbons appear at d 128.41 (C6, C4),125.05 (C5), 114.42 (C3, C7) ppm. The methoxy –OCH3 carbon isobserved at d 55.40 ppm.
O
NH
NH2
CS2KOH
O
NH
HN
SK
SH3I
OH
OH12
3
45
6 78
°C
l) methylene]-2-hydroxybenzohydrazide.

O
NH
HN
SCH2CH3
S
O
OCH3
O
NH
NH2
CS2KOH
Reflux 4h, 65 CH3CO H3CO
H3CO
C2H5I
°
O
NH
HN
SK
S
H3CO
N2H4.H2O
12
3
4
56
7 8 9
10 111
23
4
56
7 89
Scheme 2. Synthesis of N0-(4-methoxy benzoyl)-hydrazinecarbodithioic acid ethyl ester.
Fig. 1a. Thermograms of compounds 1 and 2.
Fig. 1b. DTA curve of compounds 1 and 2.
M.K. Bharty et al. / Spectrochimica Acta Part A: Molecular and Biomolecular Spectroscopy 145 (2015) 98–109 101
Thermal behaviour
The thermal stability of compounds 1 and 2 was studied by TGand DTA in the temperature range 30–950 �C under a nitrogenatmosphere by controlling the heating rate of 10 �C per minuteusing Perkin-Elmer simultaneous thermal analyser (STA 6000).The thermograms (TG and DTA curves) reveal that the compoundsare stable up to 180 �C and indicate the absence of water moleculein crystalline phase [26]. Compounds 1 and 2 decompose in thetemperature range 190–700 and 240–600 �C, respectively(Fig. 1a) and the weight loss could be due to loss of organic moi-eties in the form of gaseous products through breaking of bonds.The later stage is slower and corresponds to the oxidation or vapor-ization of intermediate products in the temperature range 350–550 �C indicating that thermolysis is exothermic in nature.Heating of samples above 700 �C leaves no residue. The stabilityof these compounds is decided by the hydrogen bonding whichis one of the most important non-covalent interactions and playsa vital role in building the supramolecular structures, making agreat contribution to thermal stabilities. The presence of moreintermolecular hydrogen bonding along with NH� � �p and CH� � �pinteractions, compound 2 is more stable and this may be aprobable reason that compound 1 decomposes earlier thancompound 2.
Compound 1 has a lower thermal stability due to low dimen-sionality since it melts between 184 and196 �C and absence ofany thermal change before this temperature range indicates thatsample restructuring does not take place before the degradationprocesses begins. Comparing the TG and DTA curves, it is observed
that the major weight loss process starts after the melting tem-perature of the compounds. The DTA curve shows an endothermicpeak (at 190 �C) just after exothermic peak (at 180 �C) in com-pound 1 which implies melting with slow decomposition, leadingto volatilization upon heating further [27]. The DTA curve indicatesthat compound 2 undergoes an irreversible endothermic transitionat 230 �C, where melting begins and the endothermic peak

Table 1Antibacterial assay of the compounds 1, 2 and standard drugs against different human bacterial pathogens.
Test pathogen Concentration ofcompound (lg/disc)
Compounds Standard drug Control(DMSO 10 ll/disc)
1 2 Streptomycin sulfate Neomycin sulfateResults of zone inhibition (cm)*
Salmonella typhi (MTCC 3216) 5 – 0.8 2.4 1.8 –10 – 0.9 2.5 1.920 0.5 1.0 2.7 2.030 0.6 1.5 2.8 2.140 0.8 1.8 2.9 2.250 0.9 2.3 3.0 2.4
Shigella flexneri (ATCC 12022) 5 0.7 – 0.8 1.5 –10 0.8 – 1.0 1.820 0.9 0.8 1.6 2.030 1.2 1.0 2.0 2.140 1.6 1.2 2.3 2.250 1.7 1.3 2.5 2.5
Staphylococcus aureus (ATCC 25323) 5 – – 1.8 1.75 –10 – – 2.0 1.820 – – 2.3 1.930 0.6 0.7 2.4 2.140 0.9 0.8 2.5 2.250 1.1 1.0 2.8 2.3
Aeromonas hydrophila (ATCC 7966) 5 – – 2.5 1.75 –10 0.5 – 2.6 2.020 0.7 0.6 2.7 2.1530 0.8 0.7 2.8 2.340 0.9 0.8 2.9 2.450 0.9 0.9 3.0 2.6
Enterococcus faecalis 5 0.5 0.7 1.9 1.8 –10 0.6 0.8 2.2 1.920 0.7 1.0 2.5 2.030 0.9 1.2 2.6 2.140 1.0 1.3 3.0 2.350 1.0 1.4 3.2 2.5
– No zone was observed.* Inhibition zone is the average of the diameter of zone from two sides in cm.
Fig. 2a. Mechanism of antibacterial activity for compounds 1 and 2.
102 M.K. Bharty et al. / Spectrochimica Acta Part A: Molecular and Biomolecular Spectroscopy 145 (2015) 98–109
represents the temperature at which the melting terminates at itsmelting point of 235 �C. The sharpness of the peak in DTA curve ofcompound 1 indicates its good degree of crystallinity, purity and
indicates that no phase transition occurs before melting. The DTAcurves of compounds 1 and 2 show that after 350 and 450 �C(Fig. 1b), respectively slow oxidation of the products takes place.

Table 2IC50 of compounds 1 and 2 against different human bacterial pathogens.
Test bacterium IC50 (lg/mL)
Compound 1 Compound 2
Salmonella typhi (MTCC 3216) 49.26 30.64Shigella flexneri (ATCC 12022) 32.38 15.07Staphylococcus aureus (ATCC 25323) 37.98 37.23Aeromonas hydrophila (ATCC 7966) 105.41 91.38Enterococcus faecalis 37.26 30.80
Fig. 2b. Inhibitory concentration (IC50) for compounds 1 and 2.
Table 3Crystallographic data for the compounds 1 and 2.
Parameters 1 2
Formula weight 256.36 270.36Crystal system Orthorhombic MonoclinicSpace group Pna21 P21/nT (K) 293(2) 150(2)k, Mo Ka (Å) 0.71073 0.71073a (Å) 15.661(3) 6.3667(12)b (Å) 12.829(17) 9.8412(18)c (Å) 12.031(2) 20.783(3)a (�) 90 90b (�) 90 92.213(15)c (�) 90 90V, (Å3) 2417.2(7) 1301.2(4)Z 8 4qcalcd (g/cm3) 1.409 1.380l (mm�1) 0.427 0.401F(000) 1072 568Crystal size (mm3) 0.25 � 0.23 � 0.18 0.23 � 0.18 � 0.15h range for data collections (�) 3.05–29.20 3.18–32.58Index ranges �21 6 h 6 21
�16 6 k 6 17�16 6 l 6 16
�7 6 h 6 7�11 6 k 6 11�24 6 l 6 24
No. of reflections collected 6937 9205No. of independent reflections
(Rint)4013 2285
No. of data/restrains/parameters 6554/0/2899 2285/0/164Goodness-of-fit on F2 1.234 0.981R1, wR2
a,b [(I > 2r(I))] 0.0615, 0.1751 0.0645, 0.1624R1, wR2
a,b (all data) 0.1086, 0.2122 0.0921, 0.1760Largest difference in peak/hole
(e.�3)1.368, �0.360 0.464, �0.461
a R1 = R||Fo| – |Fc||R|Fo|.b R2 = [Rw (|F2
o| – |F2c|)2/Rw|F2
o|2]1/2.
M.K. Bharty et al. / Spectrochimica Acta Part A: Molecular and Biomolecular Spectroscopy 145 (2015) 98–109 103
Antibacterial activity
Antibacterial activity of compounds 1, 2 and commercialantibacterial drugs streptomycin sulfate and neomycin sulfatewere tested against five human bacterial pathogens S. typhi(MTCC 3216), S. flexneri (ATCC 12022), S. aureus (ATCC 25323),A. hydrophila (ATCC 7966) and E. faecalis. A clear zone around the discindicates the inhibitory activity of the compound on the organism.The results are given in Table 1 which indicates that the inhibitionsby compounds are lower as compared to the standard drugs. Theactivity increases with increasing concentration of the compoundand compound 2 is more active as compared to compound 1. Thehighest zone of inhibition (2.3 cm) was recorded against S. typhiat 40 and 50 lg/disc and minimum zone of inhibition was recordedin all cases at 5–20 lg/disc. Both the compounds are active againstE. faecalis at all concentration ranges. It is clear that the zone ofinhibition area is somewhat larger for compound 2 than 1. Theincreased activity of compound 2 may be due to the presence offree HNCS moiety which is absent in compound 1 (Fig. 2a).Furthermore, free HNCS moiety increases the delocalization of p-electrons over the molecule of compound 2 and enhances the lipo-philicity which leads to the breakdown of the permeability barrierof the cell and thus retards the normal cell processes. The possiblereason for the antibacterial action of compound 2 may be that itbinds to the membranes of microorganisms through the hydrogenbonding with sulphur, prolonging the lag phase of the growth cycleand increasing the generation time of the organisms so that eachorganism takes more time to complete cell division. Althoughantibacterial activities of the compounds are lower as comparedto the standard drugs streptomycin sulfate and neomycin sulfatebut these compounds could be potentially used against weak bac-terial pathogens.
Compound 2 is most effective against S. flexneri with IC50 valueof 15.07 lg/mL followed by S. typhi (30.64 lg/mL), E. faecalis(30.80 lg/ml), S. aureus (37.23 lg/mL) and least effective againstA. hydrophila (91.38 lg/ml). Similar trend (Table 2) is also observedfor compound 1 with 32.38 lg/ml IC50 value for S. flexneri,49.26 lg/mL for S. typhi, 37.26 lg/mL for E. faecalis, 37.98 lg/mLfor S. aureus and 105.41 lg/ml for A. hydrophila. Fig. 2b shows thatcompound 2 is required in less amounts to inhibit the growth ofbacteria as compared to compound 1. Compound 2 shows impres-sively good activity against S. flexneri and S. typhi with about 2.1and 1.6-fold less IC50 values, respectively than compound 1.
Crystal structure description of compounds 1 and 2
The molecular structures of compounds Hbmshb (1) andH2mbhce (2) have been determined by single crystal X-ray diffrac-tion data. The details of data collection, structure solution andrefinement are listed in Table 3. Molecular structure diagrams forcompounds 1 and 2 with atom numbering schemes are shown inFigs. 3 and 4, respectively. Selected bond lengths and angles aregiven in Tables 4 and 5. Weak intermolecular interactions are listedin Tables 6 and 7. In compound 2, the C-S bond distances of1.704(4) and 1.707(4) Å agree well with those in related com-pounds, being intermediate between 1.82 Å for a C-S single bondand 1.56 Å for a C@S double bond [28,29] whereas for compound1 the C-S bond distances of 1.758(9) and 1.774(14) Å indicate theirsingle bond character. The distances and angles for Hbmshb (1)and H2mbhce (2) are close to those reported earlier [30,31]. Inthe solid state, compound 1 is stabilized via intermolecular C–H� � �O interaction between carbonyl oxygen and CH hydrogenatoms of aromatic ring and O–H� � �O interaction between hydroxylhydrogen and carbonyl oxygen of a nearby molecule leading to theformation of linear chain (Fig. 5). The structure of compound 2 isstabilized via intermolecular N–H� � �O and C–H� � �O interactions
occurring between carbonyl oxygen and hydrogen atoms of hydra-zine (–NH), –OCH3 and phenyl ring of a nearby molecule whichleads to the formation of linear chains, whereas the C–H� � �S inter-action between thione sulphur and hydrogen atoms of the phenylring also contribute to the linear chain structure (Fig. 6). The

Fig. 3. Molecular structure of N2-[bis(methylsulfanyl) methylene]-2-hydroxyben-zohydrazide (1).
Fig. 4. Molecular structure of N0-(4-methoxy benzoyl)-hydrazinecarbodithioic acidethyl ester (2).
Table 4Bond length (Å) and angles (�) for compound 1.
Bond length (Å) Bond angles (�)
(Exp.) (Cal.) (Exp.) (Cal.)
N1–N2 1.358(14) 1.356 C8–S1–C9 104.7(7) 102.3N1–C7 1.364(14) 1.382 C8–S2–C10 101.6(6) 100.8N2–C8 1.248(15) 1.275 N2–C8–S1 124.8(10) 126.5S1–C8 1.758(9) 1.813 N2–C8–S2 118.8(8) 120.6S2–C8 1.774(14) 1.771 S1–C8–S2 116.4(8) 113.1S2–C10 1.779(12) 1.823 C8–N2–N1 115.8(10) 119.6S1–C9 1.759(13) 1.839 N2–N1–C7 118.9(10) 119.4C7–O1 1.215(13) 1.215 O1–C7–N1 121.7(11) 122.4C2–O2 1.381(13) 1.375 N1–C7–C1 117.3(10) 116.2
Table 5Bond length (Å) and angles (�) for compound 2.
Bond length (Å) Bond angles (�)
(Exp.) (Cal.) (Exp.) (Cal.)
O1–C1 1.435(5) 1.424 C9–S2–C10 99.4(2) 109.63O1–C2 1.405(5) 1.355 C9–N2–N1 125.0(3) 121.93O2–C8 1.239(4) 1.215 C3–C2–O1 115.5(4) 155.66N1–C8 1.381(5) 1.401 O2–C8–N1 118.2(4) 120.75N1–N2 1.424(5) 1.391 O2–C8–C5 123.2(3) 124.04N2–C9 1.358(5) 1.364 N1–C8–C5 118.6(3) 115.19S1–C9 1.704(4) 1.658 N2–C9–S1 124.2(3) 120.74S2–C9 1.707(4) 1.782 N2–C9–S2 107.9(3) 112.33S2–C10 1.827(5) 1.834 S1–C9–S2 127.9(3) 126.89
Table 6Hydrogen bond parameters [Å and �] for compound 1.
Intermolecular hydrogen bonding
D–H� � �A d(D–H) d(H� � �A) d(D� � �A) <(DHA)
C12–H12� � �O1 0.930 2.614 3.254 126.51O4–H4A� � �O1 0.820 2.670 2.570 172.78O2–H2� � �O3 0.830 1.813 3.279 158.86
Table 7Hydrogen bond parameters [Å and �] for compound 2.
Intermolecular hydrogen bonding
D–H� � �A d(D–H) d(H� � �A) d(D� � �A) <(DHA)
C7–H7� � �S1 0.950 2.027 3.717 141.33C6H6� � �O2 0.950 2.675 3.568 157.02N1–H1–O2 0.777 2.067 2.767 149.78
Fig. 5. O–H� � �O and C–H� � �O interactions leading to linear structure in Hbmshb (1).
Fig. 6. C–H� � �O, N–H� � �O and C–H� � �S hydrogen bonding and NH� � �p and CH� � �pinteractions in H2mbhce (2).
104 M.K. Bharty et al. / Spectrochimica Acta Part A: Molecular and Biomolecular Spectroscopy 145 (2015) 98–109
crystal structure of compound 2 is also stabilized via NH� � �p andCH� � �p interactions between the p electrons of phenyl ring andthe hydrogens of hydrazine and methyl group, respectively.
Quantum chemical calculations
Optimization of geometryAll calculations and the geometry optimization for N2-
[bis(methylsulfanyl) methylene]-2-hydroxybenzohydrazide (1)and N0-(4-methoxy benzoyl)-hydrazine carbodithioic acid ethylester (2) have been performed with Gaussian 03 and Gauss View4.1 [32] program packages using DFT method with functional
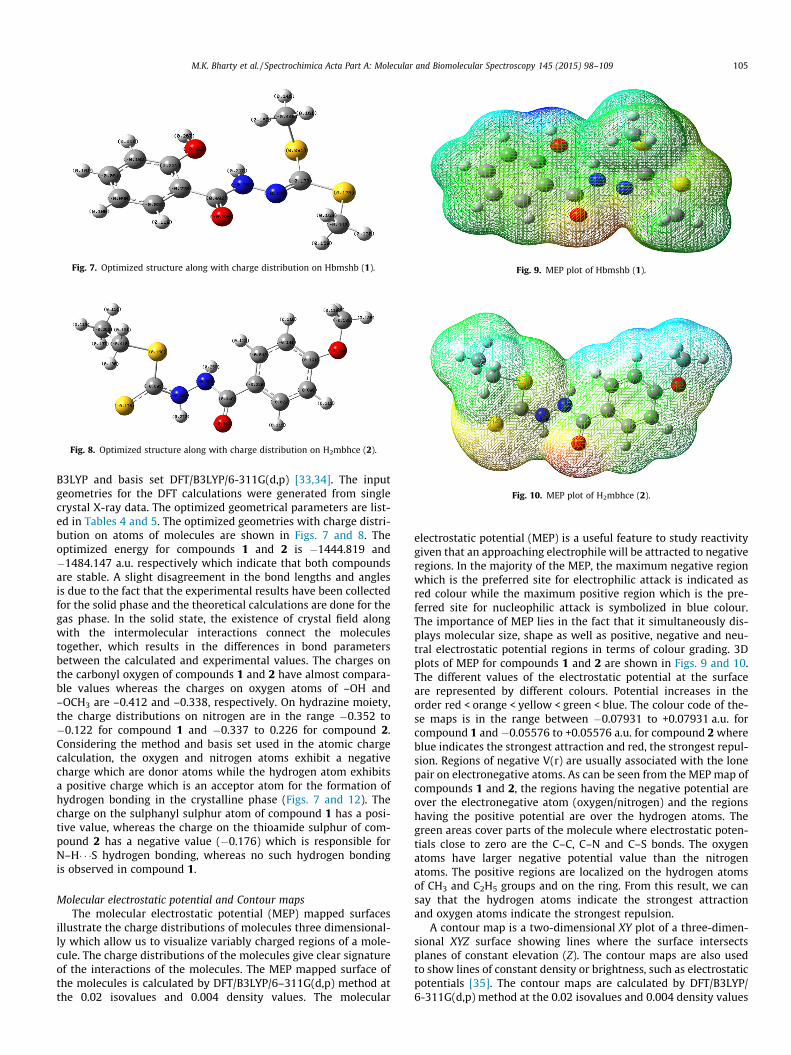
Fig. 7. Optimized structure along with charge distribution on Hbmshb (1).
Fig. 8. Optimized structure along with charge distribution on H2mbhce (2).
Fig. 9. MEP plot of Hbmshb (1).
Fig. 10. MEP plot of H2mbhce (2).
M.K. Bharty et al. / Spectrochimica Acta Part A: Molecular and Biomolecular Spectroscopy 145 (2015) 98–109 105
B3LYP and basis set DFT/B3LYP/6-311G(d,p) [33,34]. The inputgeometries for the DFT calculations were generated from singlecrystal X-ray data. The optimized geometrical parameters are list-ed in Tables 4 and 5. The optimized geometries with charge distri-bution on atoms of molecules are shown in Figs. 7 and 8. Theoptimized energy for compounds 1 and 2 is �1444.819 and�1484.147 a.u. respectively which indicate that both compoundsare stable. A slight disagreement in the bond lengths and anglesis due to the fact that the experimental results have been collectedfor the solid phase and the theoretical calculations are done for thegas phase. In the solid state, the existence of crystal field alongwith the intermolecular interactions connect the moleculestogether, which results in the differences in bond parametersbetween the calculated and experimental values. The charges onthe carbonyl oxygen of compounds 1 and 2 have almost compara-ble values whereas the charges on oxygen atoms of –OH and–OCH3 are –0.412 and –0.338, respectively. On hydrazine moiety,the charge distributions on nitrogen are in the range �0.352 to�0.122 for compound 1 and �0.337 to 0.226 for compound 2.Considering the method and basis set used in the atomic chargecalculation, the oxygen and nitrogen atoms exhibit a negativecharge which are donor atoms while the hydrogen atom exhibitsa positive charge which is an acceptor atom for the formation ofhydrogen bonding in the crystalline phase (Figs. 7 and 12). Thecharge on the sulphanyl sulphur atom of compound 1 has a posi-tive value, whereas the charge on the thioamide sulphur of com-pound 2 has a negative value (�0.176) which is responsible forN–H� � �S hydrogen bonding, whereas no such hydrogen bondingis observed in compound 1.
Molecular electrostatic potential and Contour mapsThe molecular electrostatic potential (MEP) mapped surfaces
illustrate the charge distributions of molecules three dimensional-ly which allow us to visualize variably charged regions of a mole-cule. The charge distributions of the molecules give clear signatureof the interactions of the molecules. The MEP mapped surface ofthe molecules is calculated by DFT/B3LYP/6–311G(d,p) method atthe 0.02 isovalues and 0.004 density values. The molecular
electrostatic potential (MEP) is a useful feature to study reactivitygiven that an approaching electrophile will be attracted to negativeregions. In the majority of the MEP, the maximum negative regionwhich is the preferred site for electrophilic attack is indicated asred colour while the maximum positive region which is the pre-ferred site for nucleophilic attack is symbolized in blue colour.The importance of MEP lies in the fact that it simultaneously dis-plays molecular size, shape as well as positive, negative and neu-tral electrostatic potential regions in terms of colour grading. 3Dplots of MEP for compounds 1 and 2 are shown in Figs. 9 and 10.The different values of the electrostatic potential at the surfaceare represented by different colours. Potential increases in theorder red < orange < yellow < green < blue. The colour code of the-se maps is in the range between �0.07931 to +0.07931 a.u. forcompound 1 and �0.05576 to +0.05576 a.u. for compound 2 whereblue indicates the strongest attraction and red, the strongest repul-sion. Regions of negative V(r) are usually associated with the lonepair on electronegative atoms. As can be seen from the MEP map ofcompounds 1 and 2, the regions having the negative potential areover the electronegative atom (oxygen/nitrogen) and the regionshaving the positive potential are over the hydrogen atoms. Thegreen areas cover parts of the molecule where electrostatic poten-tials close to zero are the C–C, C–N and C–S bonds. The oxygenatoms have larger negative potential value than the nitrogenatoms. The positive regions are localized on the hydrogen atomsof CH3 and C2H5 groups and on the ring. From this result, we cansay that the hydrogen atoms indicate the strongest attractionand oxygen atoms indicate the strongest repulsion.
A contour map is a two-dimensional XY plot of a three-dimen-sional XYZ surface showing lines where the surface intersectsplanes of constant elevation (Z). The contour maps are also usedto show lines of constant density or brightness, such as electrostaticpotentials [35]. The contour maps are calculated by DFT/B3LYP/6-311G(d,p) method at the 0.02 isovalues and 0.004 density values

Fig. 11. Contour map of Hbmshb (1).
Fig. 12. Contour map of H2mbhce (2).
Table 8Frontier molecular orbital energy for compounds 1 and 2.
Energy 1 2
Optimized energy ETOTAL (a.u) �1444.819186 �1484.147049EHOMO (eV) �5.933989 �6.113048ELUMO (eV) �1.533362 �1.537172ELUMO–EHOMO (eV) 4.400627 4.575876g (eV) 2.2003135 2.287938I (eV) 5.933989 6.113048A (eV) 1.533362 1.537172v (eV) 3.733675 3.871911l (eV) �3.733675 �3.871911S (eV)�1 12.367047 11.823127x (eV) 6.337317 6.513592Dipole moment (Debye) 5.0301 7.2718
106 M.K. Bharty et al. / Spectrochimica Acta Part A: Molecular and Biomolecular Spectroscopy 145 (2015) 98–109
at the same level of calculations of the MEP mapped surface of themolecules. The electron rich red lines are around oxygen and nitro-gen whereas electron deficient regions are shown by greenish-yellow lines. Both have similar patterns of contour map as shownin Figs. 11 and 12.
Frontier molecular orbital (FMO) analysisThe HOMO energy characterizes the ability of electron transfer
while the LUMO characterizes the ability of electron acceptance,and the gap between HOMO and LUMO characterizes the molecu-lar chemical stability [36]. The HOMO–LUMO energy and the ener-gy gap (DE) for the compounds have been calculated at DFT/B3LYP/6–311G(d,p) level and the results are given in Table 8. 3D plots ofthe HOMO and LUMO for compounds 1 and 2 are shown in Fig. 13.It can be seen that the HOMO orbital is mainly located at the HNCSmoiety of the compound as a result of the electron withdrawingeffect of the OH and OCH3 group, which in turn causes an increasein the LUMO electronic density as located on the aromatic ring.Methoxy phenyl and hydroxyl phenyl rings do not make any con-tribution to electron density of HOMO, whereas in LUMO the entiremolecule contributes to form frontier molecular orbitals. The val-ues of the energy separation between the HOMO and LUMO are4.400627 and 4.575876 eV for compounds 1 and 2, respectively.The small HOMO–LUMO energy gap means low excitation energy,a good stability and a low chemical hardness for the compound.The electronic transition from the ground state to the excited statedue to transfer of electrons from the HOMO to LUMO level is main-ly a p� � �p transition. The chemical hardness of a molecule isdefined by the formula [37]
g ¼ f�EHOMO þ ELUMOg=2
where EHOMO and ELUMO are the energies of the HOMO and LUMOmolecular orbitals. The values of g for compounds 1 and 2 are2.2003135 and 2.287938 eV, respectively which indicate that theyare hard materials and compound 2 is harder than compound 1.The above results indicate that compound 2 has a better chemicalactivity and may effectively undergo intramolecular charge transferupon excitation. The above results show that smaller the HOMO–LUMO energy gap, the larger the hyperpolarizability (see below)and compound 1 which has a substituted imine group (C@N doublebond) may have potential applications in the development of NLOmaterials [38].
Global reactivity descriptorsThe chemical reactivity and site selectivity of the molecular sys-
tems have been determined by the conceptual density functionaltheory [39]. Electronegativity (v), chemical potential (l), globalhardness (g), global softness (S) and electrophilicity index (x)are global reactivity descriptors and are highly successful in pre-dicting global reactivity trends. On the basis of Koopman’s theorem[36], global reactivity descriptors are calculated using the energiesof
Frontier molecular orbitals EHOMO, ELUMO and given byEqs. (a)–(e) [40–44]:
v ¼ �ðEHOMO þ ELUMOÞ=2 ¼ ðI þ AÞ=2 ðaÞ
l ¼ �v ¼ ðEHOMO þ ELUMOÞ=2 ¼ �ðI þ AÞ=2 ðbÞ
g ¼ ð�EHOMO þ ELUMOÞ=2 ¼ ðI � AÞ=2 ðcÞ
where A and I are the ionization potential and electron affinity ofthe compounds respectively. Electron affinity refers to the capa-bility of a ligand to accept precisely one electron from a donor.However, in many kinds of bonding viz. covalent hydrogen bonding,partial charge transfer takes place. Softness is a property of a com-pound that measures the extent of chemical reactivity and is thereciprocal of hardness:
S ¼ 1=g ðdÞ
Recently, Parr et al. [45] have defined a new descriptor to quan-tify the global electrophilic power of the compound as elec-trophilicity index (x), which defines a quantitative classificationof the global electrophilic nature of a compound. Parr et al. haveproposed electrophilicity index (x x) as a measure of energy low-ering due to maximal electron flow between donor and acceptor.They have defined electrophilicity index (x) as follows
x ¼ l2S ¼ l2=g ðeÞ

Fig. 13. Frontier molecular orbitals of molecule 1 and 2.
M.K. Bharty et al. / Spectrochimica Acta Part A: Molecular and Biomolecular Spectroscopy 145 (2015) 98–109 107
This is positive and definite quantity and measures the stabi-lization in energy when the system acquires an additional elec-tronic charge (DN) from the environment. The direction of thecharge transfer is completely determined by the electronic chemi-cal potential of the molecule because an electrophile is a chemicalspecies capable of accepting electrons from the environments; itsenergy must decrease upon accepting electronic charge.Therefore its electronic chemical potential must be negative.When two molecules react, which one will act as an electrophile(nucleophile) will depend upon higher (lower) value of elec-trophilicity index. The high value of electrophilicity index showsthat the compound is a strong electrophile. The usefulness of thisnew reactivity quantity has been recently demonstrated in under-standing the toxicity of various pollutants in terms of their reac-tivity and site selectivity [46]. The calculated value ofelectrophilicity index describes the biological activity of com-pounds. The energies of frontier molecular orbitals (EHOMO,ELUMO), energy band gap (EHOMO – ELUMO), electronegativity (v),ionization potential (A), electron affinity (I), chemical potential(l), global hardness (g), global softness (S) and global elec-trophilicity index (x) for 1 and 2 are listed in Table 8.
Non-linear optical effectNon-linear optical (NLO) effects arise from the interactions of
electromagnetic fields in various media to produce new fieldsaltered in phase, frequency, amplitude or other propagation char-acteristics from the incident fields [47]. NLO is at the forefront ofcurrent research because of its importance in providing the keyfunctions of frequency shifting, optical modulation, optical switch-ing, optical logic, and optical memory for the emerging technolo-gies in areas such as telecommunications, signal processing, andoptical interconnections [48,49].
Second harmonic generation test was performed in order to findthe NLO property of the grown crystal by using Kurtz-Perry tech-nique [37]. Samples were prepared by crushing crystalline powder
of compounds between two transparent glass plates and thenexposed to picoseconds laser radiation at a wavelength of1.907 lm. The second harmonic wave of 632 and 542 nm generat-ed from the samples 1 and 2, respectively was detected by photo-multiplier tube after eliminating the pump light with a colour filterand converted into electrical signal which was displayed on anoscilloscope and the signal amplitude in volts indicates the SHGefficiency of the samples. Urea crystals were used as the referencematerial and it was found that the SHG efficiency of compounds 1and 2 is 8.3 and 7.1 times that of urea.
To support experimentally observed NLO property we have per-formed DFT calculation. The calculations of the mean linear polariz-ability (atot) and the mean first hyperpolarizability (btot) from theGaussian output have been explained in detail previously [50], andDFT has been extensively used as an effective method to investigatethe organic NLO materials [51]. The calculated total moleculardipole moment (ltot), linear polarizability (atot) and first-order
hyperpolarizability (btot) are 5.0301 D, 25.469 ÅA03 and 4.7653
� 10�30 cm5/esu and 7.2718 D, 23.842 ÅA03 and 3.942 � 10�30 cm5/
esu for compounds 1 and 2, respectively. Urea is one of the proto-typical compounds used in the study of the NLO properties of mole-cular systems. Therefore it was used frequently as a threshold valuefor comparative purposes [37]. The values of ltot, atot and btot for
urea are 3.53 D, 4.1446 ÅA03 and 0.5883 � 10�30 cm5/esu, obtained
at the 6–311G (d,p). Theoretically, the first-order hyperpolariz-ability for compounds 1 and 2 is 8.1 and 6.7 times the magnitudeof urea. These results indicate that the compounds are good candi-date as NLO material and may be used for application as non-linearoptical material. Theoretical and experimental values are in agree-ment with each other.
The presence of various types of hydrogen bonding interactionin compounds makes the electron delocalization easier anddecreases the value of the energy gap, as a result of which theabsorption bands in the electronic spectrum may shift to the

108 M.K. Bharty et al. / Spectrochimica Acta Part A: Molecular and Biomolecular Spectroscopy 145 (2015) 98–109
visible region and consequently, increases the nonlinear opticalproperties. The O–H� � �O and C–H� � �O interactions in compound 1and N–H� � �O and C–H� � �O in compound 2 play an important rolein making the structural unit, which enhances the overall electrontransfer between donor and acceptor groups. The O–H� � �O hydro-gen bond is known to have specific effects upon crystal packingand plays a very important role in NLO contributions to the totalnonlinearity [52]. The O–H� � �O hydrogen bond consists of twotypes of bonds: the shorter O–H bond and the longer H� � �O bond,which are dependent on each other. Due to the presence of abovehydrogen bonding interaction, compound 1 shows more non linearoptical effects than compound 2 and may be used as optoelectronicmaterial. The presence of hydrogen bonds on optical nonlinearitiesof organic crystals has important implications in the structuraldesign. Calculated and experimentally observed results show us,in the process of the material designing, that if we can optimizegeometry of hydrogen bonds in crystals to the optimum spacedirections, excellent NLO crystals may be obtained and this givesus a useful clue that the crystal engineering should construct oroptimize the space geometrical configures of hydrogen bonds withthe optimum bond directions, and their potential NLO characteris-tics can be displayed up to the maximum.
Conclusion
This paper reports the syntheses, spectral, structural investiga-tions and DFT calculations of N2-[bis(methylsulfanyl) methylene]-2-hydroxybenzohydrazide (1) and N0-(4-methoxy benzoyl)-hydrazinecarbodithioic acid ethyl ester (2). In the solid state, bothcompounds are stabilized by various types of hydrogen bondingsuch as C–H� � �O, N–H� � �O and C–H� � �S. In addition, compound 2involves CH� � �p and NH� � �p interactions. Antibacterial activity ofcompounds 1 and 2 was tested against five human bacterial patho-gens which showed that the activity increases with concentrationof the compounds. Compound 2 has better activity than compound1 but lower than the standard drugs, streptomycin sulfate and neo-mycin sulfate. Compound 2 shows impressively good activityagainst S. flexneri and S. typhi with about 2.1 and 1.6-fold lessIC50 values respectively than compound 1. The geometries of thecompounds are optimized at B3LYP density functional theory levelwhich corroborate with the experimental data. The second har-monic generation (SHG) efficiency of the crystals was obtainedby classical powder technique and it was found that the SHG effi-ciency of compounds 1 and 2 is 8.3 and 7.1 times that of urea. TheNLO properties of the thermally stable compounds are muchgreater than those of urea which indicates that these compoundsare good candidates as second-order NLO material. Due to thepresence of O–H� � �O hydrogen bonding interaction, compound 1shows more non linear optical effects than compound 2 and maybe used as optoelectronic material.
Acknowledgements
One of the authors R.K. Dani thanks UGC, New Delhi for theaward of RGNF (SRF). Dr. S.K. Kushawaha is thankful to theDepartment of Science and Technology, New Delhi, India forthe award of a Young Scientist Project (No. SR/FT/CS-110/2011).
Appendix A. Supplementary data
CCDC 942774 and 960471 contain the supplementary crystallo-graphic data for compounds. These data can be obtained free ofcharge from the Cambridge Crystallographic Data Center viawww.ccdc.cam.ac.uk/data_request/cif.
Supplementary data associated with this article can be found, inthe online version, at http://dx.doi.org/10.1016/j.saa.2015.02.055.
References
[1] A.M. Bond, A.R. Hendrickson, R.L. Martin, J.E. Moir, D.R. Page, Inorg. Chem. 22(1983) 3440–3446.
[2] N. Robertson, L. Cronin, Coord. Chem. Rev. 227 (2002) 93–127.[3] M. Bousseau, L. Valade, J.-P. Legros, P. Cassoux, M. Garbaukas, L.V. Interrante, J.
Am. Chem. Soc. 108 (1986) 1908–1916.[4] A.T. Coomber, D. Beljonne, R.H. Friend, J.L. Bredas, A. Charlton, N. Robertson,
A.E. Underhill, Nature 380 (1996) 144–146.[5] N. Singh, A. Kumar, Synth. Met. 158 (2008) 442–446.[6] M.A. Ali, M.T.H. Tarafder, J. Inorg. Nucl. Chem. 39 (1977) 1785–1791.[7] M. Nazimuddin, M.A. Ali, F.E. Smith, M.A. Mridha, Transition Met. Chem. 17
(1992) 74–78.[8] M.A. Ali, M.H. Kabir, M. Nazimuddin, S.M.M.H. Majumder, M.T.H. Tarafder, M.A.
Khair, Ind. J. Chem. 27A (1988) 1064–1067.[9] M.T.H. Tarafder, M.A. Ali, D.J. Wee, K. Azahari, S. Silong, D.A. Crouse, Transition
Met. Chem. 25 (2000) 456–460.[10] S. Gou, X. You, Z. Xu, Z. Zhou, K. Yu, Polyhedron 10 (1991) 1363–1366.[11] M.A. Ali, C.M. Haroon, M. Nazimuddin, S.M.M.H. Majumder, M.T.H. Tarafder,
M.A. Khair, Transition Met. Chem. 17 (1992) 133–136.[12] M.E. Hossain, M.N. Alam, J. Begum, M.A. Ali, M. Nazimuddin, F.E. Smith, R.C.
Hynes, Inorg. Chim. Acta 249 (1996) 207–213.[13] M.E. Hossain, J. Begum, M.N. Alam, M. Nazimuddin, M.A. Ali, Transition Met.
Chem. 18 (1993) 497–500.[14] J.R. Reid, N.D. Heindel, J. Heterocycl. Chem. 13 (1976) 925–926.[15] M.K. Bharty, A. Bharti, R.K. Dani, R. Dulare, P. Bharati, N.K. Singh, J. Mol. Struct.
1011 (2012) 34–41.[16] N.K. Singh, S.K. Kushawaha, M.K. Bharty, Ram Dulare, R.J. Butcher, J. Mol.
Struct. 936 (2009) 257–263.[17] A. Mitra, T. Banerjee, P. Roychowdhury, S. Chaudhuri, P. Bera, N. Saha,
Polyhedron 16 (1997) 3735–3742.[18] X.-H. Zhu, S.-H. Liu, Y.-J. Liu, J. Ma, C.-Y. Duan, X.-Z. You, Y.-P. Tian, F.-X. Xie, S.-
S. Ni, Polyhedron 18 (1998) 181–185.[19] N.K. Singh, A.K. Pandey, M. Singh, M.K. Bharty, R.J. Butcher, Acta Cryst. E 63
(2007) 4327.[20] A.W. Bauer, W.M. Kirby, J.C. Sherries, M. Turck, Am. J. Clin. Pathol. 45 (1966)
493–496.[21] S.K. Gond, A. Mishra, V.K. Sharma, S.K. Verma, J. Kumar, R.N. Kharwar, A.
Kumar, Mycoscience 53 (2012) 113–121.[22] G.M. Sheldrick, Acta Cryst. A64 (2008) 112–122.[23] I.J. Bruno, J.C. Cole, P.R. Edgington, M. Kessler, C.F. Macrae, P. McCabe, J.
Pearson, R. Taylor, Acta Cryst. Sec. B58 (2002) 389–397.[24] L.J. Farrugia, J. Appl. Cryst. 45 (2012) 849–854.[25] N.K. Singh, M.K. Bharty, S.K. Kushawaha, U.P. Singh, Pooja Tyagi, Polyhedron 29
(2010) 1902–1909.[26] A.H. Kianfar, L. Keramat, M. Dostani, M. Shamsipur, M. Roushani, F. Nikpour,
Spectrochem. Acta A 77 (2010) 424–429.[27] M. Arshada, S.A. Saeed-ur-Rehman, K. Khan, N. Masud, A. Arshad, Ghani,
Thermochim. Acta 364 (2000) 143–153.[28] T.S. Lobana, G. Bawa, A. Castineiras, R.J. Butcher, Inorg. Chem. Commun. 10
(2007) 506–509.[29] T.S. Lobana, P. Kumari, R.J. Butcher, T. Akitsu, Y. Aritake, J. Perles, F.J. Fernandez,
M.C. Vega, J. Organomet. Chem. 701 (2012) 17–26.[30] J.P. Jasinski, R.J. Butcher, S.K. Kushawaha, M.K. Bharty, N.K. Singh, Acta Cryst. E
66 (2010) 1899.[31] M.K. Bharty, A.K. Srivastava, R. Dulare, R.J. Butcher, N.K. Singh, Polyhedron 30
(2011) 990–996.[32] M.J. Frisch, G.W. Trucks, H.B. Schlegel, G.E. Scuseria, M.A. Robb, J.R. Cheeseman,
V.G. Zakrzewski, J.A. Montgomery, Jr. R.E. Stratmann, J.C. Burant, S. Dapprich,J.M. Millam, A.D. Daniels, K.N. Kudin, M.C. Strain, O. Farkas, J.B.V. Tomasi, M.Cossi, R. Cammi, B. Mennucci, C. Pomelli, C. Adamo, S. Clifford, J. Ochterski, G.A.Petersson, P.Y. Ayala, Q. Cui, D.K. Morokuma, A.D. Malick, K. Rabuck, J.B.Raghavachari, J. Foresman, J. Cioslowski, J.V. Ortiz, A.G. Baboul, B.B. Stefanov,G.L.A. Liu, P. Piskorz, I. Komaromi, R. Gomperts, R.L. Martin, D.J. Fox, T. Keith,M.A. Al-Laham, C.Y. Peng, A. Nanayakkara, M. Challacombe, P.M.W. Gill,B.Johnson, W. Chen, M.W. Wong, J.L. Andres, C. Gonzalez, M. Head-Gordon, E.S.Replogle, J.A. Pople, Gaussian 03, Revision A.1, Gaussian Inc., Pittsburgh, 2003.
[33] A.D. Becke, J. Chem. Phys. 98 (1993) 5648–5652.[34] C. Lee, W. Yang, R.G. Parr, Phys. Rev. B. 37 (1988) 785–789.[35] R.K. Dani, M.K. Bharty, S.K. Kushawaha, Om Prakash, R.K. Singh, N.K. Singh,
Polyhedron 65 (2013) 31–41.[36] K. Fukui, Science 218 (1982) 747–754.[37] G.A. Babu, P. Ramasamy, Curr. Appl. Phys. 10 (2010) 214–220.[38] G. Tang, J. Zhaoa, Z. Jiang, S. Kou, X. Ju, C. Wei, Opt. Spectrosc. 113 (2012) 240–
258.[39] R.G. Parr, W. Yang, Density Functional Theory of Atoms and Molecules, Oxford
University Press, Oxford, New York, 1989.[40] R.G. Pearson, J. Org. Chem. 54 (1989) 1430–1432.[41] R.G. Parr, R.G. Pearson, J. Am. Chem. Soc. 105 (1983) 7512–7516.[42] P. Geerlings, F. De Proft, W. Langenaeker, Chem. Rev. 103 (2003) 1793–1873.[43] R.G. Parr, L. Szentpály, S. Liu, J. Am. Chem. Soc. 121 (1999) 1922–1924.[44] P.K. Chattaraj, U. Sarkar, D.R. Roy, Chem. Rev. 106 (2006) 2065–2091.

M.K. Bharty et al. / Spectrochimica Acta Part A: Molecular and Biomolecular Spectroscopy 145 (2015) 98–109 109
[45] J. Padmanabhan, R. Parthasarathi, V. Subramaniaan, P.K. Chattaraj, J. Phys.Chem. A 111 (2007) 1358–1361.
[46] R. John Xavier, P. Dinesh, Spectrochim. Acta A 113 (2013) 171–181.[47] Y.-X. Sun, Q.-L. Hao, W.-X. Wei, Z.-X. Yu, L.-D. Lu, X. Wang, Y.-S. Wang, J. Mol.
Struct. Theochem. 904 (2009) 74–82.[48] V.M. Geskin, C. Lambert, J.-L. Bredas, J. Am. Chem. Soc. 125 (2003) 15651–
15658.
[49] D. Sajan, H. Joe, V.S. Jayakumar, J. Zaleski, J. Mol. Struct. 785 (2006) 43–53.[50] Y.-X. Sun, Q.-L. Hao, Z.-X. Yu, W.-X. Wei, L.-D. Lu, X. Wang, Mol. Phys. 107
(2009) 223–235.[51] S.K. Kurtz, T.T. Perry, J. Appl. Phys. 39 (1968) 3798–3813.[52] D. Xue, S. Zhang, Chem. Phys. Lett. 301 (1999) 449–452.
Copyright © 2022 FDOKUMEN