Photochemically induced changes in bioavailable carbon and nitrogen pools in a boreal watershed
10
Vol. 19: 47-56.1999 AQUATIC MICROBIAL ECOLOGY Aquat Microb Ecol Published September 6 Photochemically induced changes in bioavailable carbon and nitrogen pools in a boreal watershed Stefan Bertilsson', Ramunas stepanauskas2, Rocio ~uadros-~ansson~, Wilhelm ~raneli', Johan wikner3, Lars ~ranvik~l* 'Dept. of Water and Environmental Studies, Linkoping University. 58183 Linkoping, Sweden 'Dept. of Ecology, Limnology. Lund University, 22362 Lund, Sweden 'Umel Marine Science Center, Box 10124,90010 Umeb, Sweden 4Dept. of Limnology, Uppsala University, Norbyvagen 20, 75236 Uppsala, Sweden ABSTRACT. In several recent studies, a net stimulation of bacterial growth has been demonstrated after exposing humic surface waters to solar radiation or artificial ultraviolet radiation. This stimulation has been attributed to a photochemical release of bioavailable carbon or nitrogen compounds (ammo- nium). In a synoptic experiment, we exposed 0.2 pm filtered water from 12 different habitats in a river system, dominated by allochthonous carbon input, to mild artificial UV radiation. A significant photo- chemical release of carboxylic acids of low molecular weight occurred. Furthermore, the exposure increased carbon-limited bacterial yield on average by a factor of 1.7. No photochemical production of free ammonium could be detected, which was in accordance with the lack of effects of radiation on bac- terial growth yield under nitrogen-limited conditions. We conctude that, in boreal systems dolilinated by allochthonous carbon input, phctochemical production of bioavailable carbon rather than nitrogen compounds is likely to positively influence the total substrate pool available for bacterial utilization. KEY WORDS. UV radiation . DOC . DON. Bacterial bioassays . Carboxylic acids . Ammonium INTRODUCTION Heterotrophic bacteria form an important link between dissolved organic matter (DOM) as well as particulate organic matter and higher trophic levels in aquatic ecosystems (Fenchel & Jsrgensen 1977). These bacteria obtain both energy and nutrients by utiliza- tion of DOM. The growth efficiency, i.e. the fraction of metabolized substrate-carbon that is incorporated into bacterial biomass, is a function of the quality of the DOM, the energy demands associated with the utiliza- tion, and extrinsic factors such as temperature, avail- ability of nutrients and effective electron acceptors (e.g. Vallino et al. 1996, del Giorgio et al. 1997, Reche et al. 1999). The main fraction of bulk DOM in boreal surface waters consists of polymeric molecules of poorly 'Addressee for correspondence. E-mail: [email protected] defined structure. These organic compounds have generally been considered to be poor substrates since they must be degraded to substances of low molecular weight (LMW) prior to uptake and utilization (Azam & Cho 1987, Lancelot et al. 1989). In addition to strictly biological degradation of these high molecular weight (HMW) compounds (Geller 1986, Moran & Hodson 1990, Tranvik 1990, Miinster et al. 1992), solar radia- tion has also been shown to render the total organic carbon pool in humic waters more available for bacter- ial utilization (Geller 1986, Lindell et al. 1995). This is in agreement with recent observations of a substantial, photochemically induced degradation of heteroge- neous HMW DOM into structurally defined LMW organic compounds which are then used as bacterial substrates (Kieber et al. 1990, Wetzel et al. 1995, Bertilsson & Allard 1996, Bertilsson & Tranvik 1998). In addition to these reports of photochemical alterations in the quality of dissolved organic carbon (DOC), Bushaw et al. (1996) demonstrated a significant photo- Q Inter-Research 1999
Transcript of Photochemically induced changes in bioavailable carbon and nitrogen pools in a boreal watershed
Vol. 19: 47-56.1999 AQUATIC MICROBIAL ECOLOGY
Aquat Microb Ecol Published September 6
Photochemically induced changes in bioavailable carbon and nitrogen pools in a boreal watershed
Stefan Bertilsson', Ramunas stepanauskas2, Rocio ~ u a d r o s - ~ a n s s o n ~ , Wilhelm ~raneli', Johan wikner3, Lars ~ranvik~l*
'Dept. of Water and Environmental Studies, Linkoping University. 58183 Linkoping, Sweden 'Dept. of Ecology, Limnology. Lund University, 22362 Lund, Sweden
'Umel Marine Science Center, Box 10124,90010 Umeb, Sweden 4Dept. of Limnology, Uppsala University, Norbyvagen 20, 75236 Uppsala, Sweden
ABSTRACT. In several recent studies, a net stimulation of bacterial growth has been demonstrated after exposing humic surface waters to solar radiation or artificial ultraviolet radiation. This stimulation has been attributed to a photochemical release of bioavailable carbon or nitrogen compounds (ammo- nium). In a synoptic experiment, we exposed 0.2 pm filtered water from 12 different habitats in a river system, dominated by allochthonous carbon input, to mild artificial UV radiation. A significant photo- chemical release of carboxylic acids of low molecular weight occurred. Furthermore, the exposure increased carbon-limited bacterial yield on average by a factor of 1.7. No photochemical production of free ammonium could be detected, which was in accordance with the lack of effects of radiation on bac- terial growth yield under nitrogen-limited conditions. We conctude that, in boreal systems dolilinated by allochthonous carbon input, phctochemical production of bioavailable carbon rather than nitrogen compounds is likely to positively influence the total substrate pool available for bacterial utilization.
KEY WORDS. UV radiation . DOC . D O N . Bacterial bioassays . Carboxylic acids . Ammonium
INTRODUCTION
Heterotrophic bacteria form an important link between dissolved organic matter (DOM) as well as particulate organic matter and higher trophic levels in aquatic ecosystems (Fenchel & Jsrgensen 1977). These bacteria obtain both energy and nutrients by utiliza- tion of DOM. The growth efficiency, i.e. the fraction of metabolized substrate-carbon that is incorporated into bacterial biomass, is a function of the quality of the DOM, the energy demands associated with the utiliza- tion, and extrinsic factors such as temperature, avail- ability of nutrients and effective electron acceptors (e.g. Vallino et al. 1996, del Giorgio et al. 1997, Reche et al. 1999).
The main fraction of bulk DOM in boreal surface waters consists of polymeric molecules of poorly
'Addressee for correspondence. E-mail: [email protected]
defined structure. These organic compounds have generally been considered to be poor substrates since they must be degraded to substances of low molecular weight (LMW) prior to uptake and utilization (Azam & Cho 1987, Lancelot et al. 1989). In addition to strictly biological degradation of these high molecular weight (HMW) compounds (Geller 1986, Moran & Hodson 1990, Tranvik 1990, Miinster et al. 1992), solar radia- tion has also been shown to render the total organic carbon pool in humic waters more available for bacter- ial utilization (Geller 1986, Lindell et al. 1995). This is in agreement with recent observations of a substantial, photochemically induced degradation of heteroge- neous HMW DOM into structurally defined LMW organic compounds which are then used as bacterial substrates (Kieber et al. 1990, Wetzel et al. 1995, Bertilsson & Allard 1996, Bertilsson & Tranvik 1998). In addition to these reports of photochemical alterations in the quality of dissolved organic carbon (DOC), Bushaw et al. (1996) demonstrated a significant photo-
Q Inter-Research 1999

4 8 Aquat Microb Ecol 19: 47-56, 1999
ation on total substrate availability in natural systems. Hence, we performed a synoptic study in natural water
Svartberget from a boreal watershed with sampling sites ranging cathment from groundwater and first order streams to a near-
estuarine river site.
G;] Mire We studied the influence of UV irradiation on the - Perennial stream --- lntcrminolt s r n
production of ammonium, dissolved inorganic carbon Drainage ditch (DIG), and some previously identified, quantitatively
important organic photoproducts (oxalic, formic, mal- onic and acetic acid). Furthermore, we assessed the influence of the photochemically altered pool of total available substrates on bacterial growth under carbon- or nitrogen-limited conditions in order to study the net effect of irradiation on both carbon and nitrogen bioavailability.
Fig. 1 Map of the River Ore and Svartberget catchments with sampling Stns A to L marked according to Table 1
chemical production of free ammonium in several North American surface waters with high humic con- tent, as well as in aqueous solutions of isolated humic substances. In parallel, they also observed a photo- chemically induced increase in bacterial protein syn- thesis in both carbon- and nitrogen-limited bioassay experiments, using an aqueous solution of an isolated fulvic acid as substrate. They suggested that the photo- chemical ammonification makes humic nitrogen more available for subsequent bacterial utilization, and that this could be an important regulator of dissolved organic nitrogen. (DON) dynamics.
It is still uncertain whether these photochemical and combined photochemical-microbial reactions of ter- rigenous DOM are ubiquitous in aquatic ecosystems. Furthermore, any use of isolated humic substances in bioassay experiments only addresses photochemical alteration of a limited fraction of the total DOM pool, obscuring the interpretation of net effects of solar radi-
MATERIAL AND METHODS
Sampling and experimental design. Surface water was collected during August 1997. We sampled 8 sites within the River Ore catchment in northern Sweden. The catchment is 2940 km2, sparsely populated and dominated by productive forestland (65%; mostly spruce and pine) and mires (20%). There is no major influence from anthropogenic point sources. In addi- tion, 2 groundwater and 2 streamwater sites were sam- pled in the closely situated Svartberget catchment area, also dominated by mires and coniferous forests. The catchments are described in more detail in Ivars- son & Jansson (1994) and Bishop (1991) Water sam- pling sites were selected to represent a variety of qual- itatively different humic waters, ranging from ground- and headwaters to lakes, rivers and the near-estuarine environment (Fig 1). All waters had low conductivity (20 to 45 PS cm-') and low to neutral pH (5.1 to 7.1). In situ temperature varied from 6 to 18°C.
From each of the 12 sampling stations, 4 replicates of at least 10 1 each were collected in acid-washed poly- ethylene or polypropylene bottles. Samples were immediately transported to the laboratory and were separately filtered through a 25 pm pore size glass- fiber filter (Gamma-12, Whatman) and a 0.2 pm pore size Supor filter (Suporcap 100, Gelman Sc~ences) pre- viously flushed with Milli-Q grade water. Preliminary tests showed no significant leakage of bloavailable carbon or nitrogen from the filters (results not shown). Two 2 l aliquots from each sterile filtered replicate water sample were poured into acid-washed, UV- transparent polypropylene plastic bags (Fig. 2) which were then thermally sealed. One of these duplicate bags was kept dark in a flow-through aquarium at 15"C, whlle the other one was kept under similar con- ditions, but exposed to artificial UV radiation (UVA- 340, Q-Panel Co., USA] for 12 h, receiving 2.1 W m-2 of

Bertilsson et al.. UV effects on DOC and DON 49
UV-B (280 to 320 nm), 20 W m-' of UV-A (320 to 400 nm), and 5 W m-' of PAR (400 to 750 nm) at the surface. The UV radiation emitted from the lamps is of similar intensity as the solar radia- tion on a clear summer day in southern Sweden but with an overrepresentation of radiation at lower wavelengths, particularly in the UV-A p
E range (Fig. 2 ) . PAR, on the other hand, consti- c , 0.6 tutes less than 2 % of the radiation emitted by E the sun. The irradiance was measured with 2 an IL-1400 A radiometer (International Light), 8
5 0.4 equipped with broad band sensors for UV-B, .-
UV-A and PAR. The broad band sensors were g calibrated using an Optronics Model 752 spec- troradiometer. The average radiation path
0.2 length of the bags was approximately 4 cm and the distance to the lamps was 30 cm. Parallel to the irradiation of water samples in bags, similar irradiations of the filter-sterilized water samples were also performed in 50 m1 acid-washed quartz tubes with gas-tight ground stoppers for measurements of photochemical production of DIC (Graneli et al. 1996) as well as LMW car-
280 320 360 400 Wavelength (nm)
boxylic acids and ammonium. Irradiation path lengths and transmission curves were similar Fig. 2. Spectral characteristics of the artificial radiation source (Q-
panel UV-A340) in comparison to summer solstice natural solar radia- for tubes and bags (Fig. 2 ) . tion, as well as transmission curves for the plastic bags and quartz
Immediately after the irradiation, a site-spe- tubes used in the experiment cific bacterial inoculum, prepared by filtering a water sample from each site through a precom- busted Whatman GF/F filter, was added to the irradi- ated bags and the dark controls to a final inoculum concentration of 10%. After mixing, each inoculated sample was split into 2 batches and 2 types of cultures were prepared, one under nitrogen-limited conditions (1.2 mM Pod3- and 1.25 mM glucose added), and one under carbon-limited conditions (1.2 mM Pod3- and 300 pM No3- ). The high Pod3- concentration chosen was to account for the potential binding to abundant ~ e ~ ' , other cations and humic substances in the water. These dilution cultures were then incubated in the dark for a total of 8 d, with the aim to measure the bioavailable fraction of the total DOC and the potential growth of bacteria in various waters (Tranvik 1998). The temperature during the incubation ranged from 15.8 to 16.7"C. The bacterial growth yield was deter- mined as the bacterial biomass in the plateau phase, appearing after the exponential growth phase in the cultures. The plateau phase was in most cases entered between 6 and 8 d after the initiation of the cultures. In a few cases where declines of bacteria occurred towards the end of the plateau phase, the maximum bacterial abundance was used to calculate the yield. This decline could be due to viral infection and subse- quent lysis or bacterivore grazing. Indeed, at the end of the incubations, we observed a small number of flagel-
lates in a few of the cultures. Microscopic monitoring of autofluorescent picocyanobacteria, excited at wave- lengths between 450 and 565 nm (Andersson et al. 1996), did not indicate any presence of such cells in the cultures.
Water for an initial chemical characterization (DOC, fluorescence, absorbance, XAD 8/4 fractionation, pH, total nitrogen, nitrate, nitrite, and ammonium concen- trations) was sampled and analyzed immediately after filtration in 2 replicates from each sampling site. DIC concentration was measured in the quartz tubes imme- diately after the irradiation (Graneli et al. 1996). Sub- sequently, aliquots for ammonium and LMW car- boxylic acid analyses were sampled and frozen (-20°C) until analysis. Bacterial samples were taken from the inoculated cultures each day during the 8 d incubation, and were preserved by adding 0.2 pm filtered sodium tetraborate-buffered formaldehyde to a final concen- tration of 2%. These samples were kept at 4°C until analysis. In addition, samples for DOC analyses were also taken at the end of the inoculated cultures for esti- mating the fraction of total bioavailable DOC.
Bacterial analyses. Bacterial cell numbers were measured flow-cytometrically (del Giorgio et al. 1996). Syto 13 stain (50 pM, Molecular Probes) and Fluores- brite Carboxy YG microspheres (1.58 pm diameter,

50 Aquat Microb Ecol
between 3 and 9 X 10⁵ ml-', Polysciences) were added to 1 m1 subsamples and were analysed with either a Becton Dickinson FACSort (nitrogen-limited cultures) or a FACSCalibur (carbon-limited cultures) flow cytometer at a low sample flow-rate (about 12 p1 min-l). The cytometers were controlled with the Cell- Quest 1.2 software. Bacterial cells and microspheres were separated in a log-log scattergram of green fluo- rescence intensity (FLY) and side scattering (SSC). Voltages for these parameters were set to 560 and 400, respectively. Samples were run for 1 min or until a minimum of 5000 cells was counted. Bacterial cell con- centrations in the samples were calculated using microspheres as an internal standard. The density of the microspheres in a stock solution was analyzed by epifluorescence microscopy on a weekly basis. Selec- ted samples were also counted microscopically after staining with DAPI (Porter & Feig 1980). At least 20 flelds or 200 cells were counted. Flow cytometric counts did not differ significantly from microscopic counts (paired t-test, df = 9, p > 0.1), and had a high subsample reproducability with a coefficient of varia- tion not exceeding 5 %.
Cell size was determined by image-analyzed fluo- rescence microscopy of acridine-orange-stained cells (Hobbie et al. 1977), using a cooled, slow-scan charge- coupled device camera, CCD (C4742 Hamamatsu) . An Axioplan microscope was used with a 100x Neofluar objective. Acquired images were calibrated in the camera controller and transmitted to a digital frame grabber program (IQBase ver. 1.20). A neural network- based image analysis procedure was initiated from processing and analysis software (LabView ver. 2.0).
The length (1) and area (A) of 70 to 500 focused cells were recorded. Cell volumes ( V ) were calculated according to the formula V = 4(nr3/3 + (l-2r) nr2, which approximates the form of each cell by assuming it is a cylinder with hemispherical end caps. Bio-volumes were converted to bacterial carbon bi'omass by assum- ing that carbon comprised 50% of the bacterial dry weight and using a volume to dry weight relationship (Loferer-Kronbacher et al. 1998): m, = 435 X
where mb is the dry weight of the bacterial cell (fg cell-'), V is the bacterial volume (pm3), taking into account that the carbon denslty increases with decreasing cell volume (Simon & Azam 1989).
Chemical analyses. NH,, NO2, NO3, and total nitro- gen (Tot-N) in initial samples were analyzed with an autoanalyzer (Technicon TRAACS 800) according to methods described by Grasshoff et al. (1983). Fifty m1 of the subsamples were transferred to acid-rinsed polypropylene test tubes and kept at +4'C until further analysis (less than 24 h) . DON was determined by the difference between Tot-N in the 0.2 pm fraction (cellu- lose acetate filter, Sartorius), and the sum of inorganic
nitrogen. The detection limit for NH4 and NO3 was 0.07, and 0.05 pM, respectively.
Water samples for DOC analysis were filtered trough 0.2 pm Gelman Supor filters using sterile syringes and filterholders according to Zweifel et al. (1993). 7.5 m1 of filtered water was collected in 15 m1 polypropylene test tubes and was immediately acidified with 100 1-11 of 1.2 M HCl to remove inorganic carbon. The samples were stored cold (+4"C) until analysis. The analysis was done within 24 h. All material coming into contact with the samples was carefully rinsed with 1 M HCl and washed with ultra-pure water (Millipore Milli-Q). DOC was measured with the high temperature cat- alytic oxidation method (HTCO) using a Shimadzu TOC-5000 instrument, which has been subjected to international intercalibration (Peltzer et al. 1996). Samples of 150 p1 were injected in triplicate showing standard deviations of 0 to 2 %. Calculations of carbon concentrations were made from standard solutions of potassium hydrogen phthalate. The detection limit of the applied DOC protocol was 17 pM.
Absorbance at 250 and 365 nm was measured in a 1 cm quartz glass cuvette using a Shimadzu MPS-2000 spectrophotometer. Hurnic substance fluorescence was determined using a Perkin Elmer LS30 spectrofluo- rometer at 350 nm excitation and 450 nm emission wavelength. Fluorescence was determined twice for each subsample. H2SO4 (0.5 M) was used as a blank. Values were normalized to the fluorescence of quinine sulphate using standard solutions, with 1 quinine sul- phate unit being equal to the fluorescence of a 1 pg I-' solution in 0.5 M H2SO4.
Tandem isolation of XAD-8 and XAD-4 adsorbable compounds was performed to quantify the amount of humic (XAD-8) and moderately hydrophilic (XAD-4) acids in the different water samples (Malcolm & Mac- Carthy 1992). Briefly, 7 to 800 m1 of filter-sterilized water was acidified to pH 1.9 by HCl additions. Sam- ples were applied to tandem-coupled columns (35 m1 bed volume), containing XAD-8 and XAD-4 resins, at a flow rate of about 4 m1 min-l. Adsorbed compounds were eluted with 0.1 M NaOH that was flushed through each column in the reversed direction and subsequently passed through a cation exchange resin in the H+ form. DOC was measured in the initial, adsorbed, and unadsorbed fractions.
LMW carboxylic acids were analysed using a prevl- ously described capillary ion electrophoresis method (Dahlen et al. 1996). Analytes were separated on a fused silica capillary using a 5 mM 1, 2, 4-benzene tri-carboxylic acid buffer (pH 7.9) containing 0.5 mM of an electroosmotic flow modifier (OFM-BT, Waters) and a separation voltage of 15 kV. Analytes were injected using electrokinetic preconcentration (45 S at 5 kV) and detection was by indlrect UV absorption at

Bertilsson et al. UV effects on DOC and DON 5 1
254 nm. Molybdate was added to all samples as an internal standard, and identification and quantifica- tion of the analytes were achieved by carboxylic acid standard additions for every sampling station. The added concentrations covered the range of observed concentrations in the experiment. Standard curves for concentration estimates were obtained by linear regressions (r2 > 0.99 for all acids and water samples, n = 4).
DIC was analysed by direct injection of sample from incubated quartz-tubes into a Shimadzu TOC-5000 total carbon analyzer (Graneli et al. 1996). At least 3 injections were made resulting in a coefficient of vari- ation of less than 2%. Standard procedures were fol- lowed for measurements of ammonium (Chaney &
Marbach 1962). The effects of radiation treatment (non-irradiated,
UV-A exposed) on individual biological and chemical response parameters were evaluated by 2-way ANOVA, with sampling station as the second factor. Prior to analysis, data were log-transformed,
RESULTS
Concentration of DOC in the sampled waters was high, from 600 to 2192 pM, except for Stn A ground- water which had only 200 pM DOC (Table 1). All waters were characterized by a high content of humic substances (between 49 and 87% of total DOC was adsorbed on XAD-8). The content of moderately hydrophilic organic acids (XAD-4 adsorbable DOC) was typically low (below 10%; Table 1). The DOC/DON ratio in the River Ore system (Stns E to L) varied little with an average of 46 + 3. The ratio was significantly higher in Svartberget streams (58 and 59,
Stns C to D), while it was extremely low (4.3) in the sandy groundwater (Stn A) and intermediate in the more humic groundwater (Stn B) (Table 1). DON was the dominant nitrogen forin conlprising 66 to 99% of the total dissolved N in the sampled waters.
In bacterial regrowth cultures, the maximum nuin- ber of cells reached under nitrogen limitation was not significantly affected by the irradiation (ANOVA, p > 0.05, Fig. 3A). This result is in agreement with the absence of photochemical production of ammonium (ANOVA, p > 0.05, Table 2). Contrasting results were obtained under C-limited conditions, where DOM irra- diation significantly enhanced bacterial growth yield (ANOVA, p < 0.001), on average by a factor of 1.7 (Fig. 3B).
The average volun~e of individual bacterial cells in N-limited cultures (0.138 * 0.038 pm3) was somewhat higher than in C-limited cultures (0.104 ? 0.017 pm3, ANOVA, p < 0.001) and differed among the sampling stations (p < 0.001). However, there were no significant differences in average cell volume between the dark and the irradiated samples, neither in N- nor in C-lim- ited cultures (p > 0.05). Since the image analysis showed that bacterial cell sizes were similar in dark and irradiated cultures, we assume that bioassay results derived from the more analytically robust flow- cytometric cell counts adequately reflect the effect of irradiation on bacterial biomass development in the cultures.
The decrease in DOC in carbon-limited bacterial incubations, measured by HTCO, ranged from 31 to 227 pM C 1-' for the different stations (Stns A to L) and treatments (irradiatedhon-irradiated). The decrease corresponded to between 4.4 and 27% of the initial DOC for all the different stations except for the sandy groundwater station (Stn A), where this fraction was
Table 1. Characterization of dissolved organic carbon (DOC) and nitrogen (DON) in the sterile-filtered water. Presented values are means of 2 replicates or single measurements ( M D - 8 and M D - 4 analyses). na: not analyzed. Fluor. fluorescence of DOM in quinine sulphate units (QSU), A: absorbance at indicated wavelength, XAD-8/-4: fraction of total DOC being adsorbed to respec-
tive resin, and DIN: dissolved inorganic nitrogen
Sampling station DOC DON DIN DOC/ XAD-8 XAD-4 Fluor/DOC A365/DOC A250/365 PM PM PM DON %of DOC %of DOC QSU/mMC pMC-' cm-'
-- - -
A Groundwater 1 200 47 0.7 4.3 87 4 60 5 9.0 B Groundwater 2 850 19 3 .0 45 na na 529 5 3 5.8 C Forest stream 1308 22 3.4 59 67 4 380 155 4.0 D Mire stream 2192 38 19.4 58 na na 338 128 4 .1 E Bjorntjarn inflow 1558 33 2.2 47 80 5 401 161 4.0 F Bjorntjdrn outflow 1971 40 1.8 50 66 4 457 176 4.1 G 0ravan 600 14 0.5 42 63 7 475 73 5.4 H Ortrdsk inflow 683 16 0.5 42 51 9 574 101 5 .1 I Ortrdst outflow 1154 24 1 .5 49 62 5 585 117 4.8 J Ortrdsk hypol. 992 21 4.0 47 62 4 598 121 4 .7 K Tallbergsbron 954 20 1.4 47 4 9 4 570 116 4.8 L Stromsor 783 18 0.8 44 56 6 609 133 4.7
52 Aquat Microb Ecol 19: 47-56, 1999
1:1 line A 10 -
0 2 4 6 8 10 12
DIC production (PM C h-')
(A) N - limited cultures
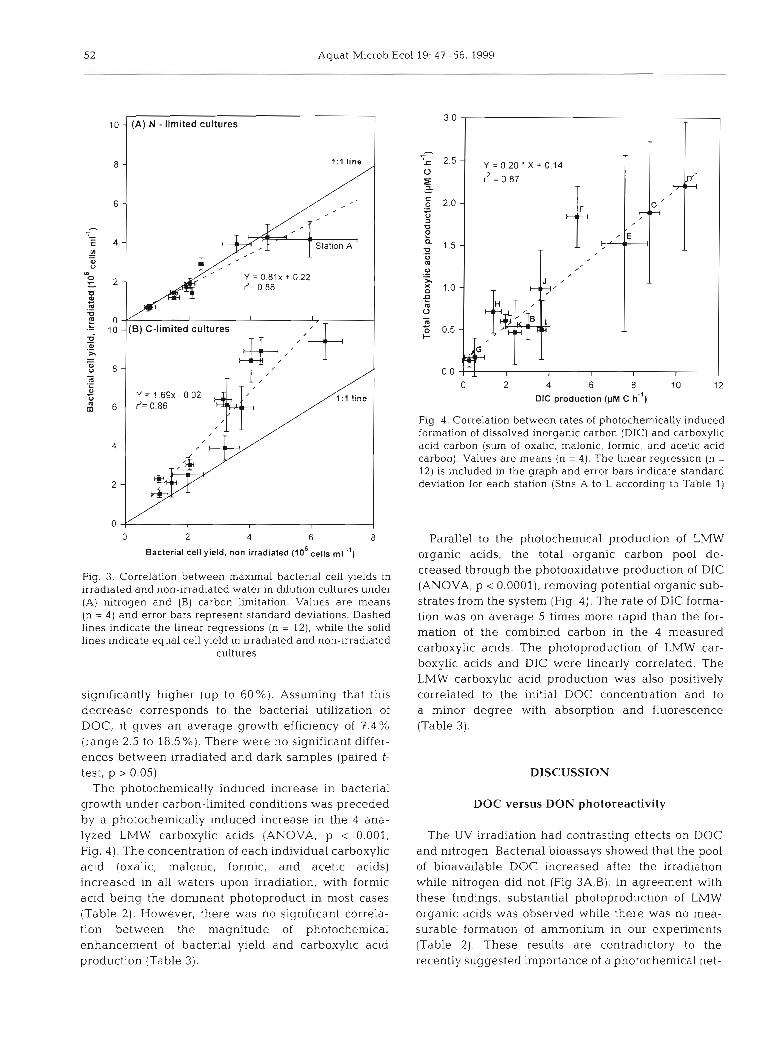
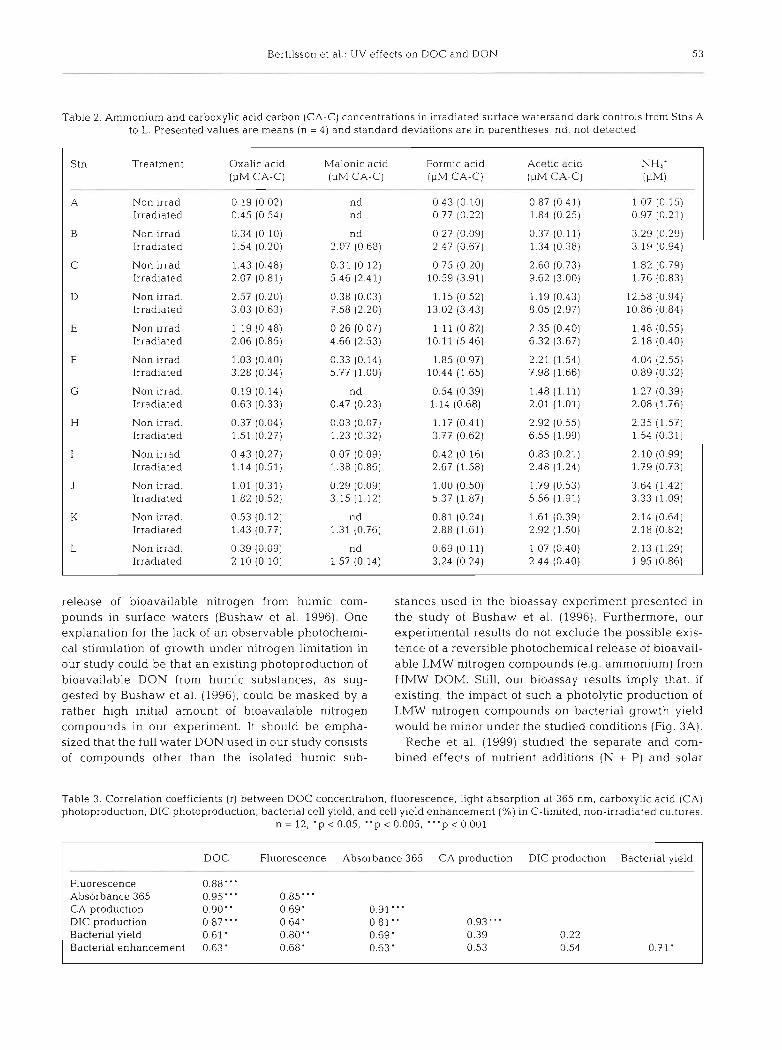
Fig. 4. Correlation between rates of photochemically induced formation of dissolved inorganic carbon (DIC) and carboxylic acid carbon (sum of oxalic, malonic, formic, and acetic acid carbon) Values are means (n = 4). The linear regression (n = 12) is lncluded in the graph and error bars indicate standard deviation for each station (Stns A to L according to Table 1)
0
0 2 4 6 8
Bacterial cell yield, non irradiated (106 cells m l .l)
Fig. 3. Correlation between maximal bacterial cell yields in irradiated and non-irradiated water in dilution cultures under (A) nltrogen and (B) carbon l i t a t i o n . Values are means (n = 4) and error bars represent standard deviations. Dashed lines indicate the linear regressions (n = 12), while the solid lines indicate equal cell yield in irradiated and non-irradiated
cultures
significantly higher (up to 60%). Assuming that this decrease corresponds to the bacterial utilization of DOC, it gives an average growth efficiency of 7 . 4 % (range 2.5 to 18.5 %). There were no significant differ- ences between irradiated and dark samples (paired t- test, p > 0.05).
The photochemically induced increase in bacterial growth under carbon-limited conditions was preceded by a photochemically induced increase in the 4 ana- lyzed LMW carboxylic acids (ANOVA, p < 0.001, Fig. 4) . The concentration of each individual carboxylic acid (oxalic, malonic, formic, and acetic acids) increased in all waters upon irradiation, with formic a c ~ d being the dominant photoproduct in most cases (Table 2). However, there was no significant correla- tion between the magnitude of photochemical enhancement of bacterial yield and carboxylic acid production (Table 3 ) .
Parallel to the photochemical production of LMW organic acids, the total organic carbon pool de- creased through the photooxidative production of DIC (ANOVA, p < 0.0001). removing potential organic sub- strates from the system (Fig. 4). The rate of DIC forma- tion was on average 5 times more rapid than the for- mation of the combined carbon in the 4 measured carboxylic acids. The photoproduction of LMW car- boxylic acids and DIC were linearly correlated. The LMW carboxylic acid production was also positively correlated to the initial DOC concentration and to a minor degree with absorption and fluorescence (Table 3).
DISCUSSION
DOC versus DON photoreactivity
The UV irradiation had contrasting effects on DOC and nitrogen. Bacterial bioassays showed that the pool of bioavailable DOC increased after the irradiation while nitrogen did not (Fig 3A,B). In agreement with these findings, substantial photoproduction of LMW organic acids was observed while there was no mea- surable formation of ammonium in our experiments (Table 2) . These results are contradictory to the recently suggested importance of a photochemical net-
Bertilsson et a1 . UV effects on DOC and DON 5 3
- -
Table 2. Ammonium and carboxylic acid carbon (CA-C) concentrations in irradiated surface watersand dark controls from Stns A to L. Presented values are means (n = 4) and standard deviations are in parentheses nd not detected
Stn Treatment Oxalic acid lvlalonic a c ~ d Formic acid Acetic dcid NH,' (PM CA-C) (PM CA-C) (PM CA-C) (PM CA-C) (PM)
A Non irrad. 0 19 (0 02) nd 0 43 (0.10) 0 87 (0 41) 1.07 (0 15) Irradiated 0 45 (0.54) n d 0 77 (0.22) 1 84 (0 25) 0 97 (0 21)
B Non irrad 0 34 (0 10) nd 0 27 (0 09) 0.37 (0.11) 3.29 (0.29) Irradiated 1 54 (0.20) 2.07 (0 68) 2 47 (0.67) 1 34 (0 38) 3.19 (0.94)
C Non irrad 1.43 (0.48) 0.31 (0.12) 0.75 (0.20) 2.60 (0.73) 1.82 (0.79) Irrad~ated 2.07 (0.81) 5 46 (2.41) 10.59 (3.91) 9.62 (3.00) 1.76 (0.83)
D Non irrad. 2.57 (0 20) 0 38 (0.03) 1.15 (0 52) 1 19 (0.43) 12.58 (0.94) Irradiated 3.03 (0.63) 7.58 (2.20) 13.02 (3.43) 8 05 (2.97) 10.86 (0.84)
E Non m a d . 1.19 (0 48) 0 26 (0.07) 1.11 (0 82) 2 35 (0.40) 1.48 (0.55) Irradiated 2.06 (0 85) 4 66 (2.53) 10.11 (5 46) 6 32 (3.67) 2 18 (0.40)
F Non irrad. 1.03 (0.40) 0.33 (0.14) l .85 (0 97) 2.21 (1.54) 4.04 (2.55) Irradiated 3.28 (0.34) 5.77 (1 00) 10 44 (1 65) 7 98 (1.66) 0.89 (0.32)
G Non irrad. 0.19 (0.14) nd 0.54 (0.39) 1.48 (1.11) 1.27 (0.39) Irradiated 0.63 (0.33) 0.47 (0.23) 1.14 (0.68) 2.01 (1.01) 2.08 (1.76)
H Non irrad. 0.37 (0.04) 0.03 (0.07) 1 17 (0.41) 2.92 (0 55) 2 35 (1.57) Irradiated 1.51 (0.27) 1.23 (0.32) 3 77 (0.62) 6.55 (1.99) 154 (0.31)
I Non irrad. 0 43 (0.27) 0 07 (0.09) 0.42 (0.16) 0.83 (0.21) 2.10 (0 99) Irradiated 1.14 (0.51) 1.38 (0.86) 2.67 (1.58) 2.48 (1.24) 1.79 (0 73)
J Non irrad. 1 0 1 (0.31) 0.29 (0.09) 1.00 (0.50) 1.79 (0.53) 3.64 (1.42) Irrad~ated 1 82 (0.52) 3.15 (1.12) 5.37 (1.87) 5.56 (1.91) 3.33 (1.09)
K Non irrad. 0.53 (0.12) nd 0.81 (0.24) 1.61 (0 39) 2.14 (0.64) Irrad~ated 1.43 (0.77) 1.31 (0.76) 2.88 (1.61) 2.92 (1 50) 2.18 (0.82)
L Non irrad. 0.39 (0.09) nd 0.69 (0 11) 1.07 (0.40) 2.13 (1.29) Irradiated 2.10 (0.10) 1.57 (0.14) 3.24 (0.24) 2.44 (0.40) 1 95 (0.86)
release of bioavailable nitrogen from humic com- pounds in surface waters (Bushaw et al. 1996). One explanation for the lack of an observable photochemi- cal stimulation of growth under nitrogen limitation in our study could be that an existing photoproduction of bioavailable DON from humic substances, as sug- gested by Bushaw et al. (1996), could be masked by a rather high initial amount of bioavailable nitrogen compounds in our experiment. It should be empha- sized that the full water DON used in our study consists of compounds other than the isolated humic sub-
stances used in the bioassay experiment presented in the study of Bushaw et al. (1996). Furthermore, our experimental results do not exclude the possible exis- tence of a reversible photochen~ical release of bioavail- able LMW nitrogen compounds (e.g. ammonium) from HMW DOM. Still, our bioassay results imply that, if existing, the impact of such a photolytic production of LMW nitrogen compounds on bacterial growth yield would be ininor under the studied conditions (Fig. 3A).
Reche et al. (1999) studied the separate and com- bined effects of nutrient additions ( N + P) and solar
Table 3. Correlation coefficients (r) between DOC concentration, fluorescence, light absorption at 365 nm, carboxyl~c acid (CA) photoproduction, DIC photoproduction, bacterial cell yield, and cell yield enhancement 1%) in C-limited, non-~rradiated cultures
n = 12, ' p < 0.05, "p < 0.005, " 'p < 0.001
DOC Fluorescence Absorbance 365 CA production DIC production Bacter~al yield -
Fluorescence 0.88"' Absorbance 365 0.95"' 0.85"' CA production 0.90 ' 0.69' 0 91"' DIC production 0.87"' 0.64 ' 0 81" 0.93 m m '
Bacterial yleld 0.61 ' 0.80" 0 69' 0.39 0.22 Bactenal enhancement 0.63' 0.68' 0.63 ' 0.53 0.54 0.71'
54 Aquat Microb Ecol 19: 47-56. 1999
irradiation on bacterial growth yield in humic surface water. Their experiments did not address the question of whether or not the amount of bioavailable nutrients was influenced by irradiation, but did show that bacte- rial growth yield was limited by nutrients irrespective of irradiation treatment. Furthermore, they showed that the bacterial growth efficiency was positively influenced by both irradiation and nutrient additions in their cultures. We did not observe any significant effects of irradiation on growth efficiency, but it should be noted that Reche et al. (1999) also include direct effects of radiation on bacteria, which could influence this parameter.
Between 4.4 and 27% of the total DOC appeared to be directly utilized by bacteria in our bioassay cultures. The relative size of this bioavailable fraction is in agreement with previous observations from various aquatic systems with a dominant input of allochtho- nous carbon (Tranvik 1988, Wikner et al. 1999). In gen- eral, bulk DOM quality was similar in water from the different sampling stations, except for the groundwa- ter obtained from the mainly inorganic sandy soil (Stn A). This water had both a low total DOC, and a low DOC-specific absorptivity and humic substance fluorescence, as well as a very low DOC to DON ratio. These chemical differences in DOM were also reflected in a high bacterial growth yield under nitro- gen-limited conditions. These results indicate the pres- ence of a substantial fraction of labile, nitrogen-con- taining DOM of high substrate quality in the water (e.g. amino acids).
Carboxylic acid photoproduction and bacterial growth enhancement
Parallel to the photochemically induced increase in bacterial growth yield, there was a substantial abiotic production of LMW organic acids. Concentrations of oxalic, malonic, formic and acetic acids were markedly higher in sterile filtered and irradiated samples com- pared to non-irradiated controls. Several studies have demonstrated the existence of such a photochemical production of LMW carboxylic acids in humic surface waters or in aqueous solutions of humic or fulvic acids (Allard et al. 1994, Wetzel et al. 1995, Bertilsson & Allard 1996). These substrates are directly available for heterotrophic bacterial utilization in surface waters (Hobbie & Crawford 1969, Robinson et al. 1973, Vallino et al. 1996), and even though they have a rather low energy content per mole, photochemically produced carboxylic acids have been shown to act as important substrates for bacterioplankton growth and activity in a humic lake (Bertilsson & Tranvik 1998). Thus, the photochemical increase in the pool of LMW carboxylic
acids could partially explain the positive influence of irradiation on bacterial growth yield.
Assuming a 10% bacterial growth efficiency on the observed, photochemically produced carboxylic acids, these compounds could account for between 9.8 and 72 % (average 33 %) of the photochemically induced stimulation of bacterial biomass yield observed in the cultures (Table 2) . Thus, in combination with the weak correlation between the measured carboxylic acid photoproduction and the photoinduced stimulation of carbon-limited bacterial growth yield (Table 3), these results indicate the significance of other effects of irra- diation on the organic substrate pool being available for bacterial utilization. Photoproduction of several LMW organic substrates such as pyruvate, glyoxylate, glutaraldehyde, formaldehyde, glyoxal and carbon monoxide has been demonstrated (reviewed by Moran & Zepp 1997), but reported formation rates have gen- erally been much lower than what was observed for the carboxylic acids measured in the present study.
Coupling between carboxylic acid and DIC photoproduction
Parallel to the production of LMW organic com- pounds, there was a decrease in the total DOC pool, measured as photooxidative DIC formation. Photooxi- dation has previously been identified as an important DOM removal mechanism in several freshwater sys- tems (Graneli et al. 1996, Moran & Zepp 1997). We observed a strong correlation between DIC and car- boxylic acid photoproduction in the present study (Fig. 4, Table 3). Thus, the relative importance of these compounds as photoproducts does not appear to vary between the studied waters.
The parallel photooxidation of organic carbon and photoinduced increase in carbon-limited bacterial growth yleld is not surprising per se, as it is in accor- dance with earlier findings (Lindell et al. 1995, Graneli et al. 1996). However, since this process results in a transformation of organic carbon into inorganic forms, the fraction being removed either has to be of low sub- strate quality, or could alternatively be masked by a parallel, larger increase in the pool of bioavailable car- bon substrates, e.g. LMW carboxylic acids.
CONCLUSIONS
In conclusion, both bioassays and chemical analyses of LMW compounds showed that a photochemically induced production of bioavailable carbon occurred in water from stations along a wide transect in a boreal watershed. No correspondin.g increase in the bioavail-

Bertilsson et al.: UV effects on DOC and DON
abihty of nitrogen could be observed. Therefore, we suggest that there was a potential for a photochemi- cally induced stimulation of bacterial growth yield due to alterations in the available carbon pool rather than in the available nitrogen pool. This response was found in all the studied water samples obtained from various sampling points in the river system. The results may therefore be relevant for a wide range of freshwaters with a high input of allochthonous carbon.
Acknowledgements. This study was financed by grant 13596- 322 from The Swedish Natural Research Council (NFR) for the global biogeochemistry project 'Aquatic transport and transformation of organic carbon-links in the carbon trans- fer from land to sea'. Financial support for the study was also provided by other grants from NFR, the Foundation for Strate- gic Environn~ental Research (MISTRA), and the foundation Oscar och L& Lamrns Minne. A.-K. Bergstrom, K. Bishop, B. Bramberg, B. Marcal de Falia, M. Jansson, A. Jonsson, and S. Kohler are acknowledged for participation in the laboratory work as well as for constructive comments and help dunng various stages of the work.
LITERATURE CITED
Allard B, Boren H, Pettersson C, Zhang G (1994) Degradation of humic substances by UV-irradiation. Environ Int 20: 97-101
Andersson A, Hajdu S, Haecky P, Kuparinen J and Wikner J (1996) Succession and growth limitation of phytoplankton in the Gulf of Bothnia (Baltic Sea). Mar Biol 126:791-801
Azam F, Cho BC (1987) Bacterial utilization of organic matter in the sea In: Fletcher M, Gray TRG, Jones JG (eds) Ecol- ogy of Microbial Communities Cambridge University Press, Cambridge, p 261-281
Bertilsson S, Allard B (1996) Sequential photochemical and microbial degradation of refractory dissolved organic mat- ter in a humic freshwater system. Arch HydrobioVAdv Limnol48:133-141
Bertilsson S, Tranvik W (1998) Photochemically produced carboxylic acids as substrates for freshwater bacterio- plankton. Limnol Oceanogr 43(5):885-895
Bishop KH (1991) Episodic increase in stream acidity, catch- ment flow pathways and hydrograph separation. PhD thesis, Cambridge University, Cambridge
Blackburn N, Hagstrom A, Wikner J , Cuadros Hansson R. Bjarnsen PK (1998) Automatic counting, measurement. morphology, and growth rate estimates of bacteria in aquatic samples by image analysis. Appl Environ Mlcro- biol 64(9):3246-3255
Bushaw KL, Zepp RG, Tarr MA, Schulz-Janders D, Bourbon- niere RA, Hodson RE, Miller WL, Bronk DA, Moran MA (1996) Photochemical release of biologically available nitrogen from aquatic dissolved organic matter. Nature 381:404-407
Chaney A, Marbach EP (1962) Modified reagents for determi- nation of urea and ammonia. Clin Chem 8:130-132
Dahlen J , Bertilsson S, and Pettersson C (1996) Effects of UV- A irradiation on dissolved organic matter in humic surface waters. Environ Int 22(5):501-506
del Giorgio PA, Bird DF, Prairie YT, Planas D (1996) The flow cytometric determination of bacterial abundance in lake plankton with the green nucleic acid stain SYTO 13. Lim- no1 Oceanogr 41:783-789
del Giorgio PA, Cole JJ , Clmbleris A (1997) Respiration rates in bacteria exceed phytoplankton production in unpro- ductive systems. Nature, 385:148-151
Fenchel TM, Jsrgensen BB (1977) Detritus food chains of aquatic ecosystems: the role of bacteria. Adv Microb Ecol 1:l-58
Geller A (1986) Comparison of mechanisms enhancing biodegradability of refractory lake water constituents. Limnol Oceanogr 31:755-764
Graneli W, Lindell MJ. Tranvik LJ (1996) Photooxidative CO2 production in lakes of different humic content. Limnol Oceanogr 41 (4):698-706
Grasshoff K, Ehrhardt M, Kremling K (1983) Methods of sea- water analysis. Verlag Chemie Weinheim, Weinheim
Hobbie JE, Crawford CS (1969) Respiration corrections for bacterial uptake of dissolved organic compounds in nat- ural waters. Limnol Oceanogr 14:528-533
Hobbie JE, Daley RJ, Jasper S (1977) Use of nuclepore filters for counting bacteria by fluorescence microscopy. Appl Environ Microbiol33:1225-1228
Ivarsson H, Jansson M (1994) Temporal variations of organic carbon in the River Ore, Northern Sweden. Verh Int Verein Limnol25:1522-1525
Kieber RJ, Zho X, Mopper K (1990) Formation of carbonyl compounds from UV-induced photodegradation of humic substances in natural waters: fate of rivering carbon in the sea. Limnol Oceanogr 35: 1503-1515
Lancelot C, Billen G, and Mathot S (1989) Ecophysiology of phyto- and bacterioplankton growth in the Southern Ocean. In: S Caschetto (ed) Plankton ecology, Vol 1. Sci- ence Policy Office, Brussels, p 4-92
Lindell MJ, Graneli W, Tranvik W (1995) Enhanced bacterial growth in response to photochemical transformation of dissolved organic matter. Linlnol Oceanogr 40(1):195-199
Loferer-KroBbacher M, Klima J , Psenner R (1998) Determina- tion of bacterial cell dry mass by transmisson electron microscopy and densiometnc image analysis. Appl Envi- ron Microbiol64(2):688-694
Malcolm RL, Maccarthy P (1992) Quantitative evaluation of XAD-8 and XAD-4 resins used in tandem for removing organic solutes from water. Environ Int 18:59?-607
Moran MA, Hodson RE (1990) Bacterial production on humic and nonhumic components of dissolved organic carbon. Limnol Oceanogr 35: 1744-1756
Moran MA, Zepp RG (1997) Role of photoreactions in the for- mation of biologically labile compounds from dissolved organic matter. Limnol Oceanogr 42(6):130?-1316
Miinster U, Einio P, Nurminen J , Overbeck J (1992) Extracel- lular enzymes in a polyhumic lake: important regulators in detritus processing. Hydroblologia 229:225-238
Peltzer ET, Fry B, Doering PH, McKenna JH, Norrman B, Zweifel UL (1996) A comparison of methods for the mea- surement of disolved organic carbon in natural waters. Mar Chem 54:85-96
Porter KG, Feig YS (1980) The use of DAPI for identifying and counting aquatic microflora. Limnol Oceanogr 25943-948
Reche I, Pace ML, Cole J J (1999) Interactions of photobleach- ing and inorganic nutrients in determining bacterial growth on colored dissolved organic carbon. Microb Ecol 36:270-280
Robinson GGC, Hendzel LL. Giues~ie DC 119731 A relation- . ,
ship between heterotrophic utilization of organic acids and bacterial ~ o ~ u l a t i o n s in West Blue Lake. Manitoba. Limnol 0ceanog; 18:264-269
Simon M, Azam F (1989) Protein content and protein synthe- sis rates of planktonic marine bacteria. Mar Ecol Progr Ser 51:201-213

56 Aquat Microb Ecol 19: 47-56, 1999
Tranvik L (1988) Availability of dissolved organic carbon for planktonic bacteria in oligotrophic lakes of differing humic content. Microb Ecol 16:311-322
Tranvik L (1990) Bacterioplankton growth on different molec- ular weight fractions of dissolved organic carbon from humic and clear waters. Appl Environ Microbiol 56: 1672-1677
Tranvik L (1998) Degradation of dissolved organic matter in hurnic waters by bacteria. In: Hessen DO, Tranvik LJ (eds) Aquatic humic substances-ecology and biogeochem- istry. Springer. Berlin, p 259-283
Vallino JJ , Hopkinson CS, Hobbie J (1996) Modeling bacter- ial utilization of dissolved organic matter: optimization
Editorial responsibrlity: Karel Simek, Ceske Budtrjovice, Czech Republic
replaces Monod growth kinetics. Limnol Oceanogr 41. 1591-1609
Wetzel RG, Hatcher PG, Bianchi TS (1995) Natural photolysis by ultraviolet irradiance of recalcitrant dissolved organic matter to simple substrates for rapid bacterial metabolism. Lirnnol Oceanogr 40:1369-1380
Wikner J, Cuadros R, Jansson IM (1999) Differences in con- sumption of allochthonous DOC under limnic and estuar- ine cond~tions in a watershed. Aquat M~crob Ecol l ? : 289-299
Zweifel UL, Norrman B, Hagstrom A (1993) Consumption of dissolved organic carbon by marine bactena and demand for inorganic nutnents. Mar Ecol Prog Ser 101:23-32
Submitted: October 26, 1998; Accepted: March 10, 1999 Proofs received from author(s)r August 25, 1999