Iron-Zinc Co-Doped Titania Nanocomposite: Photocatalytic ...
Upload
independentCategory
view
0download
0
t
tion kineticscted in thece of watern products
c model fitvalues. Thead higher
tonitrile andl
with the
Journal of Catalysis 235 (2005) 209–220
www.elsevier.com/locate/jca
Photocatalytic oxidation of acetonitrile in gas–solidand liquid–solid regimes
Maurizio Addamoa, Vincenzo Augugliaroa, Salvatore Colucciab,Maria Giulia Fagab,c, Elisa García-Lópeza, Vittorio Loddoa,
Giuseppe Marcìa, Gianmario Martrab, Leonardo Palmisanoa,∗
a Dipartimento di Ingegneria Chimica dei Processi e dei Materiali, Università degli Studi di Palermo, Viale delle Scienze, 90128 Palermo andUdR Palermo 1 Interuniversity Consortium “Chemistry for the Environment” – INCA, Italy
b Dipartimento di Chimica IFM – NIS Center of Excellence, Università degli Studi di Torino, Via Pietro Giuria 7, 10125 Torino andUdR Torino 1 Interuniversity Consortium “Chemistry for the Environment” – INCA, Italy
c CNR – Istituto di Scienza e Tecnologia dei Materiali Ceramici, Strada delle Cacce 73, 10135 Torino, Italy
Received 17 May 2005; revised 12 July 2005; accepted 7 August 2005
Abstract
Photocatalytic degradation of acetonitrile was carried out in both gas–solid and liquid–solid regimes using two commercial TiO2 catalysts(Merck and Degussa P25). For the gas–solid regime, a continuous annular photoreactor was used. The influence on photodegradaof the gas flow rate and concentrations of acetonitrile, oxygen, and water was investigated. Acetonitrile degradation products detegas phase included carbon dioxide and hydrogen cyanide. The same photoactivity was exhibited in the presence and in the absenvapour. The liquid–solid regime used a batch photoreactor with an immersed lamp (the same as for the gas–solid regime). The oxidatiodetected in the solution were cyanide, cyanate, nitrite, nitrate, methanoate, and carbonate ions. The Langmuir–Hinshelwood kinetithe photoreactivity data obtained in both regimes and allowed us to determine the rate constant and equilibrium adsorption constantadsorption constant and kinetic constant value were lower in the liquid–solid regime than in the gas–solid regime. The Merck catalyst hvalues of these parameters for both regimes than the Degussa P25 catalyst. An evaluation of the possible competition between acewater molecules for the surface sites of the photocatalyst (Ti4+ ions and hydroxyl groups) revealed that for high H2O/CH3CN ratios, as is typicafor the photo-oxidation process carried out in a liquid/solid regime, acetonitrile molecules were not able to provide a specific interactionsurface sites of TiO2, remaining dissolved in the interface water molecular layers. In contrast, for low H2O/CH3CN ratios, as is typical for thephoto-oxidation process carried out in a gas–solid regime, acetonitrile could win the competition with water for surface hydroxyls. 2005 Elsevier Inc. All rights reserved.
Keywords: Acetonitrile degradation; Heterogeneous photocatalysis; TiO2; IR investigation
iron dxid
civ
rilee offorhoto-luble
isiesdif-
d
1. Introduction
Among the advanced oxidation processes aimed at envmental remediation, basic and applied research has beevoted to heterogeneous photocatalysis, especially for the otion of organic pollutants in water or in air[1–3]. Acetonitrile isan extremely stable and toxic molecule present in various
* Corresponding author. Fax: +39-91-6567280.E-mail addresses: [email protected](G. Martra),
[email protected](L. Palmisano).
0021-9517/$ – see front matter 2005 Elsevier Inc. All rights reserved.doi:10.1016/j.jcat.2005.08.005
n-e-
a-
il
and industrial wastewaters; air in contact with liquid acetonitcan be easily contaminated with acetonitrile vapour becausits low boiling temperature. It is widely used as an eluentHPLC analyses and is commonly used in heterogeneous pcatalysis research as a solvent for molecules that are insoin water. Apart from its environmental hazards, acetonitrilea very interesting molecule for use in photo-oxidation studbecause it has alkyl and cyanide groups that may undergoferent oxidation routes.
Lichtin and Avudaithai[4] reported the feasibility of thephotocatalytic oxidation of acetonitrile in both liquid an

210 M. Addamo et al. / Journal of Catalysis 235 (2005) 209–220
dtheth
n.letiogobw
phprohi
oliecent tgr
tioneretiong oene
tio
ce ofs in
tioning-flu-ki-
thistainntsin-andtheter-ter
IR
an-
ther-
se
vapour phases using near-UV irradiated TiO2 Degussa P25 anO2. They found that acetonitrile was much more reactive ingas phase than in the liquid phase. In a gas–solid regime,found, along with CO2 and NO2, cyanogen [(CN)2], indicatingthe formation of CN· radicals with subsequent dimerizatioZhuang et al.[5] performed FTIR investigation of acetonitriphoto-oxidation in a gas–solid system and found the oxidaproducts CO2, H2O, and CO3
2− on the catalyst surface, alonwith isocyanate as a partially oxidized species. They did notserve hydrogen cyanide, probably because this compoundnot present in adsorbed phase but was released to the gasThey claimed breakage of the acetonitrile C–C bond andposed a reaction mechanism onto the catalyst surface in wthe principal products are CO2 and N2. Augugliaro et al.[6]studied the kinetics of acetonitrile degradation in a gas–sregime using two different continuous photoreactors to chwhether the specific setup used for the reactivity experimaffected the photoprocess performance. They reported thaLangmuir–Hinshelwood model adequately described the dedation kinetics, and that the values of equilibrium adsorpconstants were independent of the used photoreactor, whthe kinetic constant values depended on the radiation condiof the photoreactor. Sunlight has been also used for carryinthe photocatalytic oxidation of acetonitrile in aqueous suspsions of TiO2 Degussa P25[7]. For that system, the influencof a strong oxidant species (H2O2, S2O8
2−, ClO−) on acetoni-trile abatement was also investigated. The acetonitrile oxida
ey
n
-asase.-
ch
dktshea-
ass
ut-
n
products were isocyanate and/or cyanate ions, the presenwhich was a strong clue to the formation of cyanide speciethe course of acetonitrile degradation.
The present paper deals with acetonitrile photodegradacarried out in both gas–solid and liquid–solid regimes ustwo commercial polycrystalline TiO2 catalysts (Merck and Degussa P25). This investigation focused on studying the inence of the reaction medium (liquid or gaseous) on thenetics and mechanisms of acetonitrile oxidation. Towardgoal, the photoreactivity experiments were planned to obthe values of the kinetic and equilibrium adsorption constainvolved in the acetonitrile degradation process. To obtainformation about the reaction mechanism, the intermediatefinal species appearing in the reaction environment duringphotocatalytic process were identified and quantitatively demined. In addition, the competition in the dark between waand acetonitrile for TiO2 adsorbing sites was explored byspectroscopy.
2. Experimental
2.1. Gas–solid regime
The reactivity runs were carried out using a continuousnular Pyrex photoreactor (Fig. 1A). The vertically positionedphotoreactor was provided with inlet and outlet ports forreacting mixture. TiO2 Merck (100% anatase; BET specific suface area= ca. 10 m2 g−1) and TiO2 Degussa P25 (80% anata
Fig. 1. Photoreactors set-up: (A) Gas–solid system; (B) liquid–solid system.
M. Addamo et al. / Journal of Catalysis 235 (2005) 209–220 211
hewall)
l).ly;terthedi-oniO
itroeragaceur,tco
dieveeacphhroith
asro-g th-
eod-
wa) in
oniepedx).
froingtio
ate
-etr0–fo
ndl
ofdinletmea-ratussureer-
erelysty
ace-Fornly
ngeo 11ledper-
heds foralsthe
lter
con-ro-
hend (ex-MEth acedined
innoutdzu
non-
el--dual
situ.er-o-
lefter
ter
and 20% rutile; BET specific surface area= ca. 50 m2 g−1)were used with no preliminary treatment. A thin layer of tcatalyst (1 g for both photocatalysts) covered the internalof the outer tube of the annulus (6.5 cm i.d., 32.0 cm taIn these conditions, the light transmitted by the TiO2 layerwas negligible, as checked with a radiometer (UVX DigitaA 500 W medium-pressure Hg lamp (Helios Italquartz, Itahighest emission at 365 nm), equipped with a Pyrex wacooling thimble (5.4 cm o.d.), constituted the inner part ofannulus. The Pyrex thimble, which is completely blind to raation with wavelength<300 nm, guaranteed that the radiatiinside the photoreactor would be absorbed only by the T2
catalyst.The gas fed to the photoreactor consisted of oxygen, n
gen, acetonitrile, and water. Liquid acetonitrile and water wadded to the gas flow through an infusion pump (Orion Spump M 361). The concentrations used were as follows:tonitrile, 0.1–1.1 mM; oxygen, 4–40 mM; and water vapo0.0–0.3 mM. A gas flow rate of 2.58 cm3 s−1 was used for mosof the runs. The temperature of the system at steady-stateditions was 303± 2 K.
The run procedure was the same through the study. Irration was begun only after steady-state conditions were achiin the system, that is, after about 1 h from the start of photortor feeding. The runs lasted 4.0 h, and the gas leaving thetoreactor was analysed periodically using an on-line gas cmatograph (Hewlett-Packard GC 6890 system) equipped wmethyl siloxane column (30 m× 320 µm× 0.25 µm; Hewlett-Packard HP-1) and an FID detector, using grade heliumcarrier. Gravimetric determination of the carbon dioxide pduced was done for selected runs by bubbling the gas exitinphotoreactor in a saturated Ba(OH)2 aqueous solution; the total amount of CO2 was determined as BaCO3. For each run, thegas at the outlet of the photoreactor was bubbled in an aqusolution of NaOH (0.1 M) to trap acetonitrile degradation proucts. Quantitative determination of trapped cyanide ionsperformed by an ion-sensitive electrode (Orion model 94-06an expandable ion analyser (Orion EA 920) and that of anispecies (e.g., cyanate, nitrate and methanoate) was doning an ionic chromatograph system (Dionex DX 120) equipwith an Ion Pac AS14 4-mm column (250 mm long, DioneAqueous solution of NaHCO3 (8 mM) and Na2CO3 (1 mM)were used as eluents at a flow rate of 1.67× 10⁻² cm3 s−1.
At the end of each run, the used catalyst was scrapedthe photoreactor wall and put in water for 1 h; the resultsolution was analysed by ionic chromatography after separaof the solid by filtration through a 0.45-µm cellulose acetfilter (HA, Millipore).
The ferrioxalate actinometric method[8] was used to measure the photon flow emitted by the lamp. The used actinomsolution, which absorbs light wavelengths only in the 30400 nm range, filled the photoreactor and was irradiated20 s. The measurements were repeated several times, aaverage value of 7.2 × 10⁻⁵ Einstein s−1 was determined. Alof the reagents were of analytical grade (Aldrich).
ll.
-
-ee-
n-
a-d-
o--a
a
e
us
s
cus-
m
n
ic
ran
2.2. Liquid–solid regime
A cylindrical Pyrex batch photoreactor containing 1.5 Laqueous suspension (Fig. 1B) was used for the liquid–soliregime. This photoreactor has ports in its upper section forand outlet gases, for sampling, and for pH and temperaturesurement. This photoreactor had the same irradiating appaused in the gas–solid regime, that is, a 500 W medium-presHg lamp (Helios Italquartz, Italy) equipped with a Pyrex watcooling thimble.
The same TiO2 catalysts used in the gas–solid regime wused here as well. In all experiments, the amount of catawas 0.4 g l−1. In this condition, the photon flow transmitted bthe suspension was negligible for both catalysts. The initialtonitrile concentration was varied in the range 0.24–24 mM.some photoreactivity runs, the starting solution contained ocyanate ions, whose initial concentration varied in the ra0.45–1.45 mM. The pH of the suspension was adjusted tby adding NaOH. Pure oxygen or air was continuously bubbinto the suspension before and during the runs. The temature inside the reactor during the runs was 300± 2 K. Thephotoreactivity runs lasted 5 h; before the lamp was switcon, the system was held at the imposed operative condition0.5 h. Samples (5 mL) were withdrawn at fixed time intervfor analysis. The catalyst was immediately separated fromsolution by filtration through a 0.45-µm cellulose acetate fi(HA, Millipore).
The quantitative determination of CH3CN was routinely per-formed with the same gas chromatograph, column, andditions used for the gas–solid experiments following this pcedure: first, 1 mL of sample was placed in a vial, and tthe compounds present in the vapour phase were extractetraction time, 5 min) using a 75-µm carboxen-PDMS SP(Solid Phase Micro Extraction) fibre assembly (Supelco) wifibre holder for manual sampling. The holder was then plain the split/splitless injector of a gas chromatograph maintaat 523 K. The oven temperature was 310 K for the first 3 mand thereafter increased to 523 K at a ramp rate of 60 K mi−1.The quantitative determination of ionic species was carriedas described for the gas–solid experiments. A 5000A Shimatotal organic carbon analyser was used to determine thepurgeable organic carbon (NPOC) content of the samples.
2.3. IR measurements
TiO2 powder was pressed in the form of self-supporting plets (40 mg cm−2). The IR quartz cell, equipped with KBr windows, was connected to a conventional vacuum line (resipressure= 1.00× 10⁻⁶ Torr; 1 Torr= 133.33 Pa) allowing theperformance of all adsorption–desorption experiments inCD3CN (99.8%, Aldrich) was used for the adsorption expiments instead of CH3CN, to keep bands due to Fermi resnance from perturbing theν(CN) mode of the probe molecu[9]. Acetonitrile and water were admitted onto the sample aseveral freeze–pump–thaw cycles. FTIR spectra (4 cm−1 res-olution) were recorded with a Bruker Vector 22 spectromeequipped with a DTGS detector.
212 M. Addamo et al. / Journal of Catalysis 235 (2005) 209–220
estuseataese-
asns-n rarstsystnt
thealue p
tsta
by
tion. I
s-ost
gasthe
andd intoni-thed at
ure.enti-rileh wetctiv-nedns
theoni-itionon-not
hisbs in
rra-ilede-
ace-. Noingity).
3. Results
For both the gas–solid and liquid–solid regimes, blank twere performed under the same experimental conditionsfor the photoreactivity experiments but in the absence of clyst, oxygen, or light. No reactivity was observed in any of thcases. The contemporary presence of O2, catalyst, and irradiation was needed for the acetonitrile degradation process.
3.1. Photoreactivity in the gas–solid regime
Preliminary photoreactivity tests were performed at increing flow rate values, with the aim of minimising mass traport resistances on the photocatalytic process. The reactioenhanced for flow rate by�1.1 cm3 s−1, whereas for highevalues it did not change significantly for either photocatalyThese findings indicate that mass transfer resistance plaimportant role for flow rates < 1.1 cm3 s−1. Based on this, iwas decided to carry out all of the photocatalytic experimeof acetonitrile degradation at a flow rate equal to 2.58 cm3 s−1.
The acetonitrile concentrations at the inlet and outlet ofphotoreactor were measured. The knowledge of these vallowed us to determine the acetonitrile disappearance ratunit of catalyst surface area, (−rS), by applying the followingmass balance on the whole photoreactor:
(1)(−rS) = W
S(CAN,I − CAN,O)
whereW is the volumetric gas flow rate,S is the total surfacearea of catalyst, andCAN,I andCAN,O are the inlet and outleacetonitrile molar concentrations, respectively, at steady-conditions.
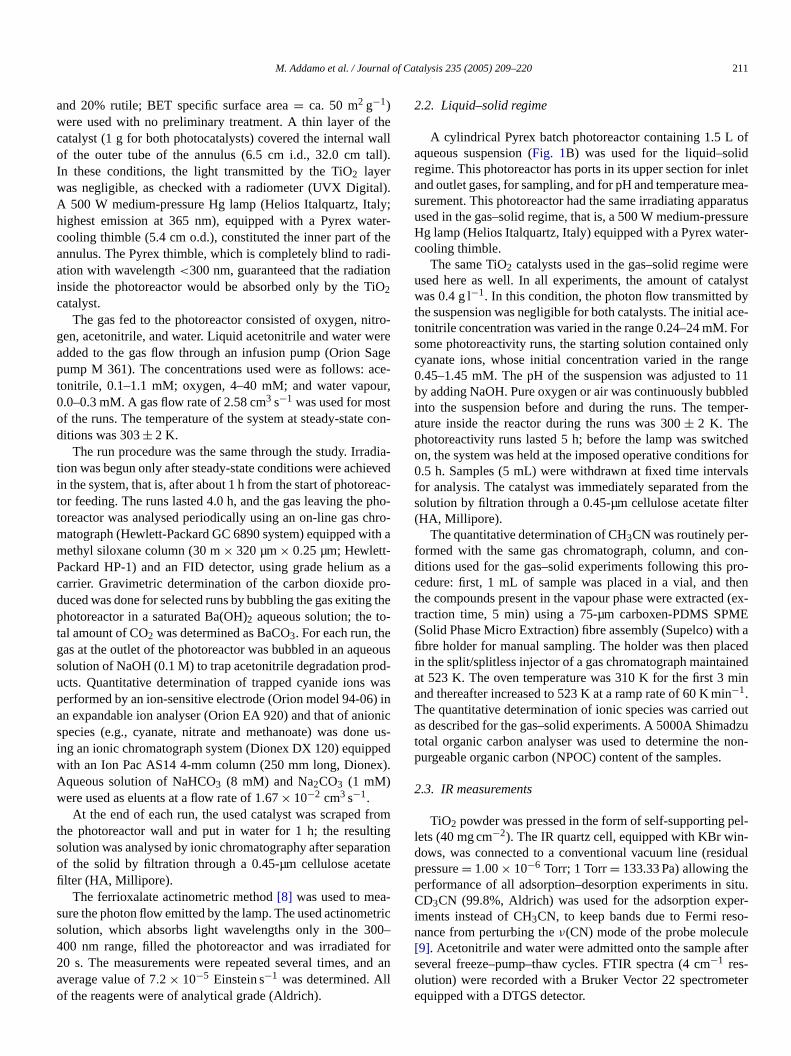
For both catalysts,Fig. 2a reports (−rS) data obtained fromruns in which the inlet acetonitrile concentration was variedkeeping the inlet oxygen concentration constant.Fig. 2b reports(−rS) data obtained by varying the inlet oxygen concentrawhile maintaining a constant inlet acetonitrile concentration
sd-
-
te
.an
s
eser
te
t
can be observed that the (−rS) values increased with increaing inlet acetonitrile or oxygen concentration up to an almconstant value.
For all runs, the degradation products revealed in thephase were carbon dioxide and hydrogen cyanide, whileionic species found in the alkaline trap were cyanide ionstraces of methanoate ions. The moles of cyanide ions founthe alkaline trap were equal to the moles of degraded acetrile. Traces of nitrate and methanoate ions were found inaqueous solution in which the used catalysts were washethe end of the photocatalytic run.
Some runs were carried out using a dry reacting mixtThe observed values of the reaction rate were almost idcal to those obtained with a wet reacting mixture. Acetonitdegradation products were the same as those obtained witreacting mixtures. Both catalysts also exhibited constant aity for long runs (72 h); in these runs, the catalysts maintaitheir initial white colour, indicating that no coloured poisoaccumulated on the irradiated surface.
3.2. Photoreactivity in the liquid–solid regime
Preliminary experiments were carried out to investigateadsorption of acetonitrile onto the catalyst surface. Acettrile concentration was measured before and after the addof TiO2 powder to the aqueous solution. Even after long ctact times (48 h), the acetonitrile concentration values weresignificantly different than those of the starting solution. Tindicates that acetonitrile dissolved in water scarcely adsorthe dark on the TiO2 surface.
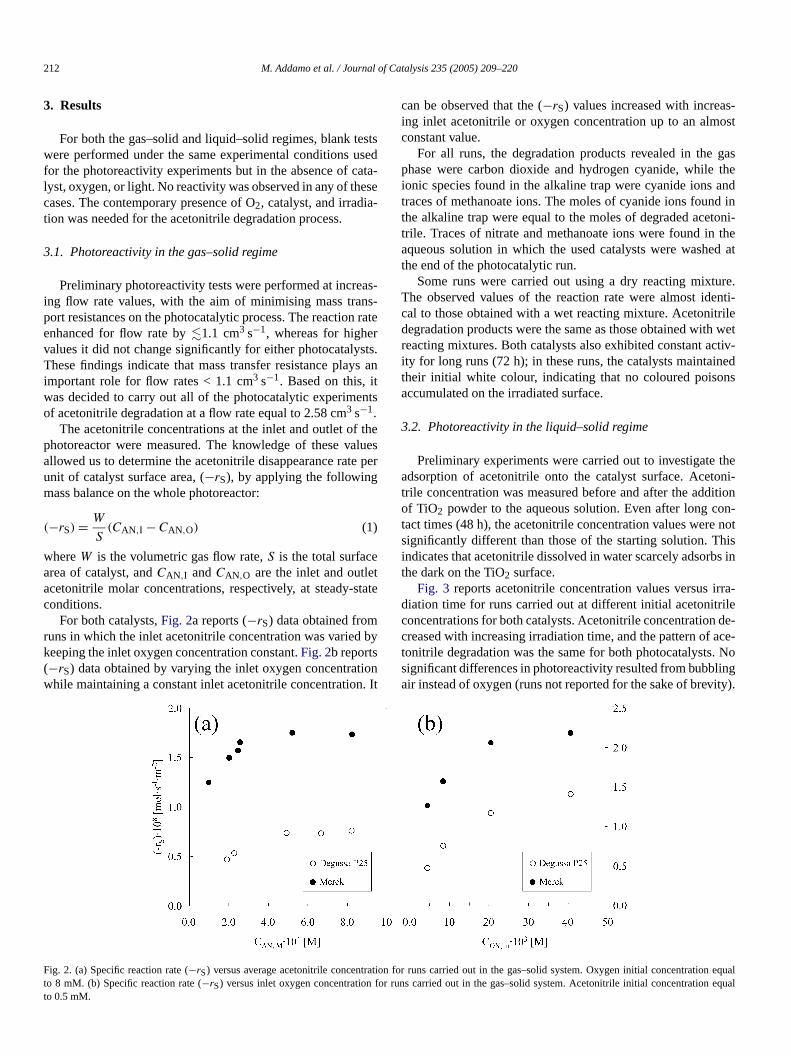
Fig. 3 reports acetonitrile concentration values versus idiation time for runs carried out at different initial acetonitrconcentrations for both catalysts. Acetonitrile concentrationcreased with increasing irradiation time, and the pattern oftonitrile degradation was the same for both photocatalystssignificant differences in photoreactivity resulted from bubblair instead of oxygen (runs not reported for the sake of brev
ion equaln equal
Fig. 2. (a) Specific reaction rate (−rS) versus average acetonitrile concentration for runs carried out in the gas–solid system. Oxygen initial concentratto 8 mM. (b) Specific reaction rate (−rS) versus inlet oxygen concentration for runs carried out in the gas–solid system. Acetonitrile initial concentratioto 0.5 mM.
M. Addamo et al. / Journal of Catalysis 235 (2005) 209–220 213
t in
r ale aonoluateadingacensevecieidel nhae o
d in
ada-ionsoni-ednatear-am-es
ata-
tingtwodel
theon
ites
andlyticallyfor
ur-
t ina 3:1tlych ausossi-ni-
Fig. 3. Acetonitrile concentration versus irradiation time for runs carried outhe liquid–solid system.
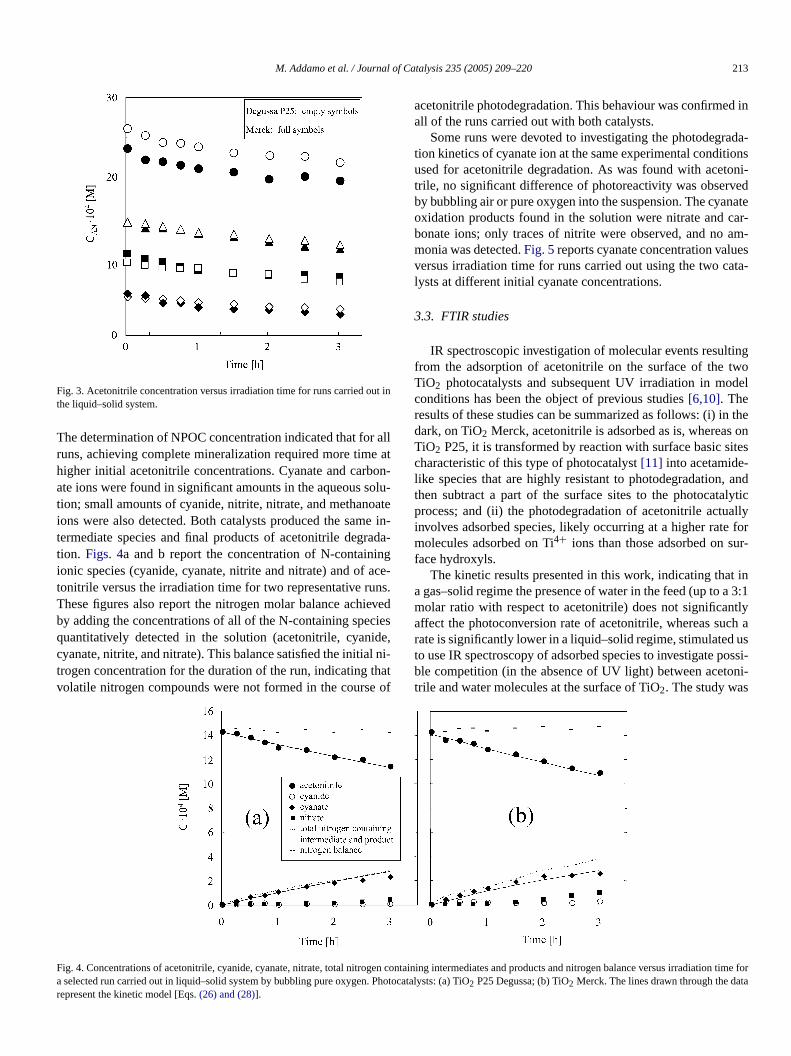
The determination of NPOC concentration indicated that foruns, achieving complete mineralization required more timhigher initial acetonitrile concentrations. Cyanate and carbate ions were found in significant amounts in the aqueous stion; small amounts of cyanide, nitrite, nitrate, and methanoions were also detected. Both catalysts produced the samtermediate species and final products of acetonitrile degrtion. Figs. 4a and b report the concentration of N-containionic species (cyanide, cyanate, nitrite and nitrate) and oftonitrile versus the irradiation time for two representative ruThese figures also report the nitrogen molar balance achiby adding the concentrations of all of the N-containing spequantitatively detected in the solution (acetonitrile, cyancyanate, nitrite, and nitrate). This balance satisfied the initiatrogen concentration for the duration of the run, indicating tvolatile nitrogen compounds were not formed in the cours
lt--
ein-a-
-.d
s,i-tf
acetonitrile photodegradation. This behaviour was confirmeall of the runs carried out with both catalysts.
Some runs were devoted to investigating the photodegrtion kinetics of cyanate ion at the same experimental conditused for acetonitrile degradation. As was found with acettrile, no significant difference of photoreactivity was observby bubbling air or pure oxygen into the suspension. The cyaoxidation products found in the solution were nitrate and cbonate ions; only traces of nitrite were observed, and nomonia was detected.Fig. 5reports cyanate concentration valuversus irradiation time for runs carried out using the two clysts at different initial cyanate concentrations.
3.3. FTIR studies
IR spectroscopic investigation of molecular events resulfrom the adsorption of acetonitrile on the surface of theTiO2 photocatalysts and subsequent UV irradiation in moconditions has been the object of previous studies[6,10]. Theresults of these studies can be summarized as follows: (i) indark, on TiO2 Merck, acetonitrile is adsorbed as is, whereasTiO2 P25, it is transformed by reaction with surface basic scharacteristic of this type of photocatalyst[11] into acetamide-like species that are highly resistant to photodegradation,then subtract a part of the surface sites to the photocataprocess; and (ii) the photodegradation of acetonitrile actuinvolves adsorbed species, likely occurring at a higher ratemolecules adsorbed on Ti4+ ions than those adsorbed on sface hydroxyls.
The kinetic results presented in this work, indicating thaa gas–solid regime the presence of water in the feed (up tomolar ratio with respect to acetonitrile) does not significanaffect the photoconversion rate of acetonitrile, whereas surate is significantly lower in a liquid–solid regime, stimulatedto use IR spectroscopy of adsorbed species to investigate pble competition (in the absence of UV light) between acetotrile and water molecules at the surface of TiO2. The study was
ta
Fig. 4. Concentrations of acetonitrile, cyanide, cyanate, nitrate, total nitrogen containing intermediates and products and nitrogen balance versus irradiation time fora selected run carried out in liquid–solid system by bubbling pure oxygen. Photocatalysts: (a) TiO2 P25 Degussa; (b) TiO2 Merck. The lines drawn through the darepresent the kinetic model [Eqs.(26) and (28)].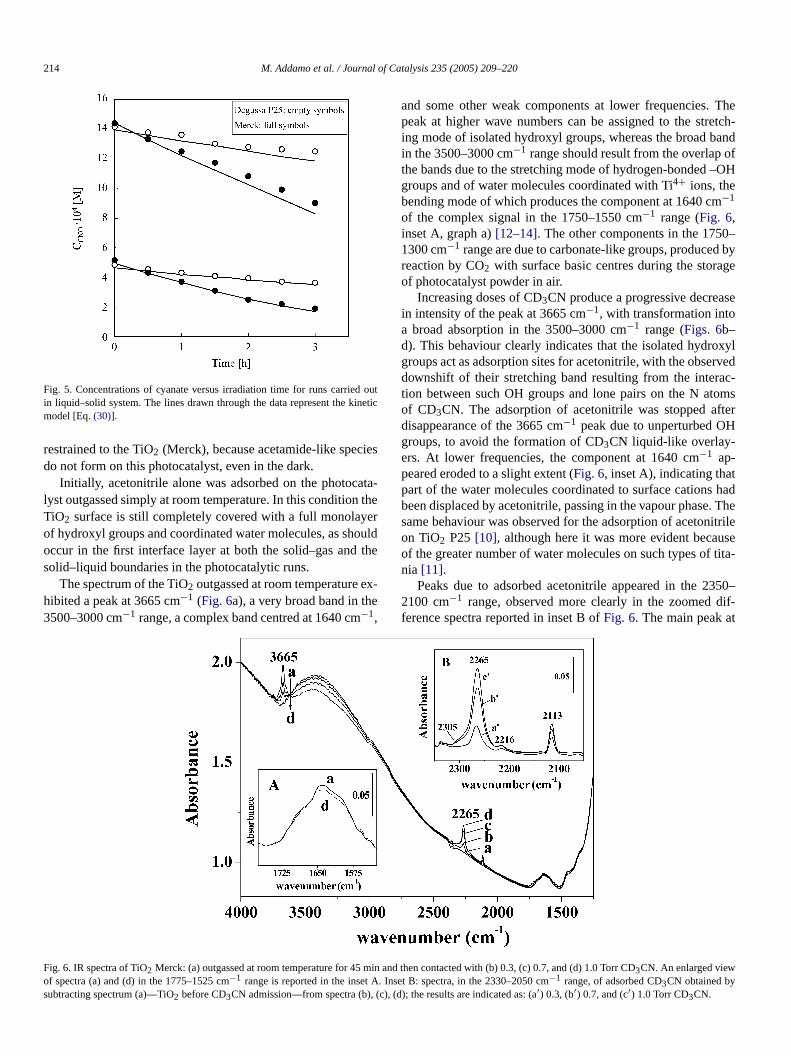
214 M. Addamo et al. / Journal of Catalysis 235 (2005) 209–220
ounet
ies
atatherouth
x-e
Theetch-andof–OH
m
0–d byge
se
xylrvedac-omsfterH
thad
. Theitrile
usetita-
350–dif-t
Fig. 5. Concentrations of cyanate versus irradiation time for runs carriedin liquid–solid system. The lines drawn through the data represent the kimodel [Eq.(30)].
restrained to the TiO2 (Merck), because acetamide-like specdo not form on this photocatalyst, even in the dark.
Initially, acetonitrile alone was adsorbed on the photoclyst outgassed simply at room temperature. In this conditionTiO2 surface is still completely covered with a full monolayof hydroxyl groups and coordinated water molecules, as shoccur in the first interface layer at both the solid–gas andsolid–liquid boundaries in the photocatalytic runs.
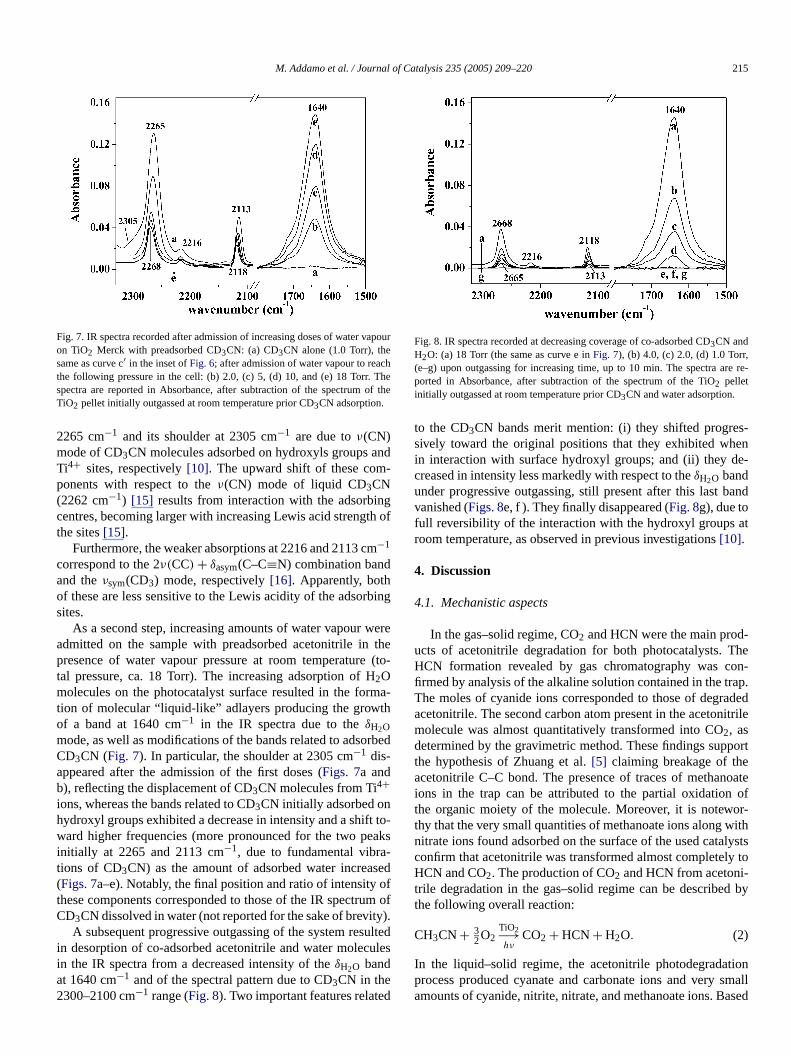
The spectrum of the TiO2 outgassed at room temperature ehibited a peak at 3665 cm−1 (Fig. 6a), a very broad band in th3500–3000 cm−1 range, a complex band centred at 1640 cm−1,
tic
-e
lde
and some other weak components at lower frequencies.peak at higher wave numbers can be assigned to the string mode of isolated hydroxyl groups, whereas the broad bin the 3500–3000 cm−1 range should result from the overlapthe bands due to the stretching mode of hydrogen-bondedgroups and of water molecules coordinated with Ti4+ ions, thebending mode of which produces the component at 1640 c−1
of the complex signal in the 1750–1550 cm−1 range (Fig. 6,inset A, graph a)[12–14]. The other components in the 1751300 cm−1 range are due to carbonate-like groups, producereaction by CO2 with surface basic centres during the storaof photocatalyst powder in air.
Increasing doses of CD3CN produce a progressive decreain intensity of the peak at 3665 cm−1, with transformation intoa broad absorption in the 3500–3000 cm−1 range (Figs. 6b–d). This behaviour clearly indicates that the isolated hydrogroups act as adsorption sites for acetonitrile, with the obsedownshift of their stretching band resulting from the intertion between such OH groups and lone pairs on the N atof CD3CN. The adsorption of acetonitrile was stopped adisappearance of the 3665 cm−1 peak due to unperturbed Ogroups, to avoid the formation of CD3CN liquid-like overlay-ers. At lower frequencies, the component at 1640 cm−1 ap-peared eroded to a slight extent (Fig. 6, inset A), indicating thapart of the water molecules coordinated to surface cationsbeen displaced by acetonitrile, passing in the vapour phasesame behaviour was observed for the adsorption of acetonon TiO2 P25[10], although here it was more evident becaof the greater number of water molecules on such types ofnia [11].
Peaks due to adsorbed acetonitrile appeared in the 22100 cm−1 range, observed more clearly in the zoomedference spectra reported in inset B ofFig. 6. The main peak a
Fig. 6. IR spectra of TiO2 Merck: (a) outgassed at room temperature for 45 min and then contacted with (b) 0.3, (c) 0.7, and (d) 1.0 Torr CD3CN. An enlarged viewof spectra (a) and (d) in the 1775–1525 cm−1 range is reported in the inset A. Inset B: spectra, in the 2330–2050 cm−1 range, of adsorbed CD3CN obtained bysubtracting spectrum (a)—TiO2 before CD3CN admission—from spectra (b), (c), (d); the results are indicated as: (a′) 0.3, (b′) 0.7, and (c′) 1.0 Torr CD3CN.
M. Addamo et al. / Journal of Catalysis 235 (2005) 209–220 215
apo
chTheof t
nd-
gh o
m
bin
weth(t
rmath
rb
t toak-seofm
ty)ultule
d
,re re-
s-ene-
and
at
-Theon-ap.adeditrile
porteoateof
or-withlystsy to-d by
ionsmallased
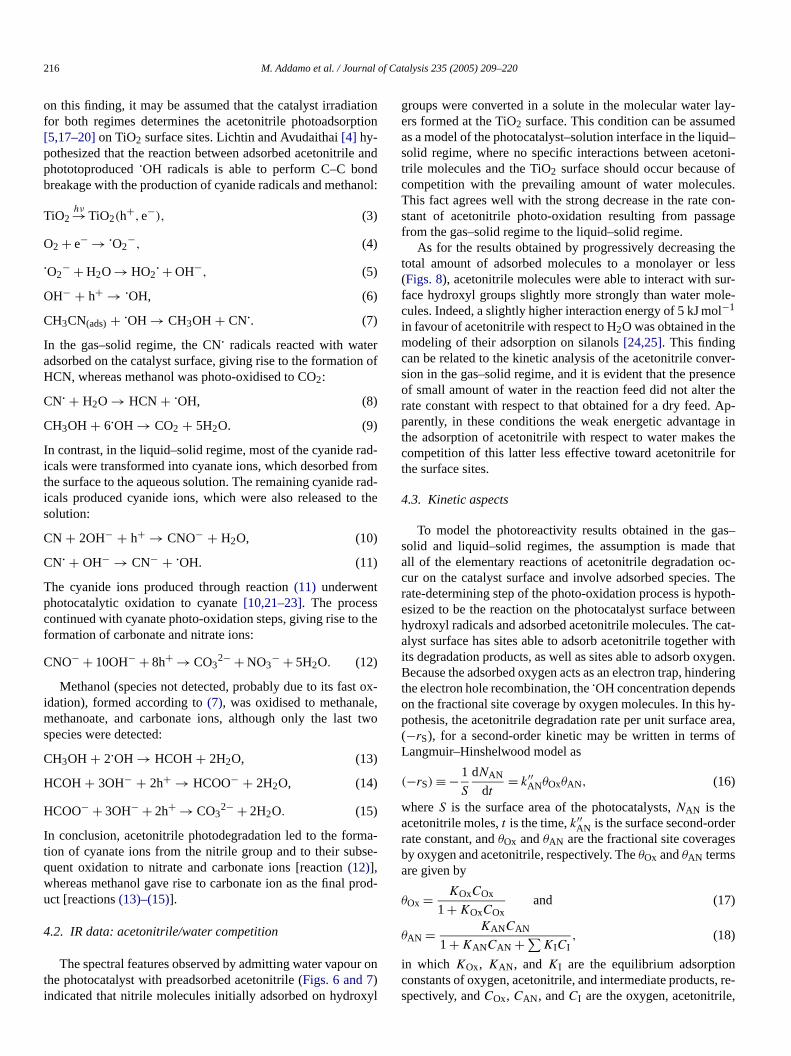
Fig. 7. IR spectra recorded after admission of increasing doses of water von TiO2 Merck with preadsorbed CD3CN: (a) CD3CN alone (1.0 Torr), thesame as curve c′ in the inset ofFig. 6; after admission of water vapour to reathe following pressure in the cell: (b) 2.0, (c) 5, (d) 10, and (e) 18 Torr.spectra are reported in Absorbance, after subtraction of the spectrumTiO2 pellet initially outgassed at room temperature prior CD3CN adsorption.
2265 cm−1 and its shoulder at 2305 cm−1 are due toν(CN)mode of CD3CN molecules adsorbed on hydroxyls groups aTi4+ sites, respectively[10]. The upward shift of these components with respect to theν(CN) mode of liquid CD3CN(2262 cm−1) [15] results from interaction with the adsorbincentres, becoming larger with increasing Lewis acid strengtthe sites[15].
Furthermore, the weaker absorptions at 2216 and 2113 c−1
correspond to the 2ν(CC) + δasym(C–C≡N) combination bandand theνsym(CD3) mode, respectively[16]. Apparently, bothof these are less sensitive to the Lewis acidity of the adsorsites.
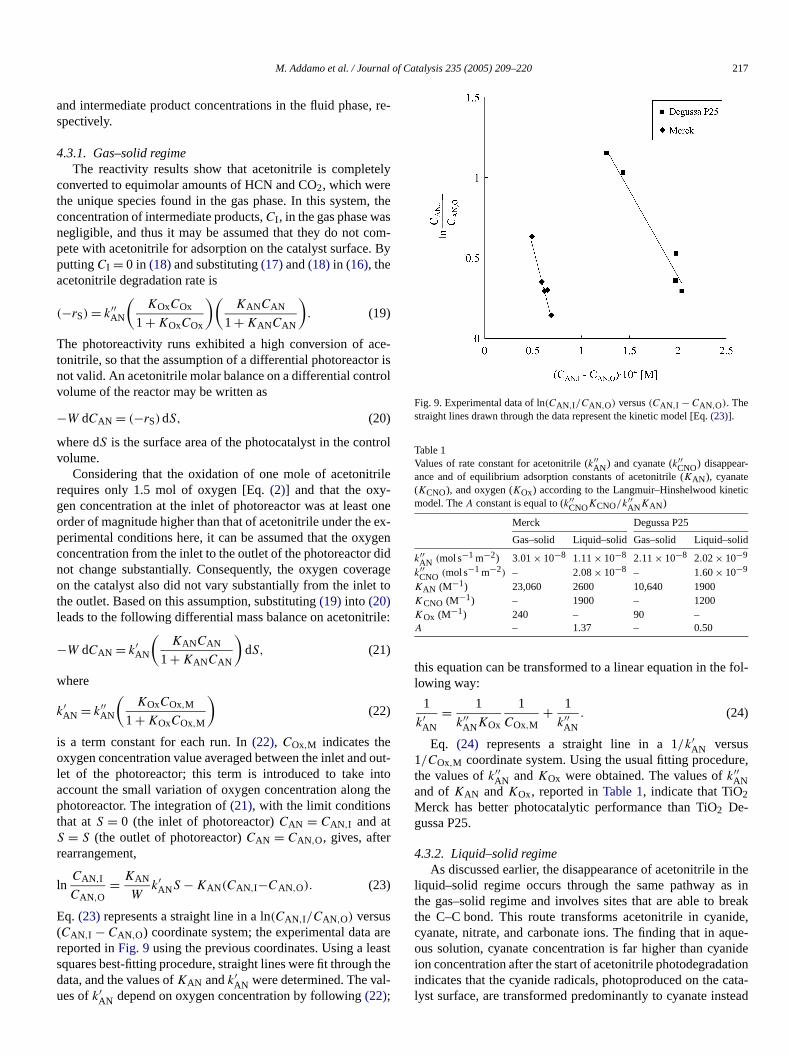
As a second step, increasing amounts of water vapouradmitted on the sample with preadsorbed acetonitrile inpresence of water vapour pressure at room temperaturetal pressure, ca. 18 Torr). The increasing adsorption of H2Omolecules on the photocatalyst surface resulted in the fotion of molecular “liquid-like” adlayers producing the growof a band at 1640 cm−1 in the IR spectra due to theδH2Omode, as well as modifications of the bands related to adsoCD3CN (Fig. 7). In particular, the shoulder at 2305 cm−1 dis-appeared after the admission of the first doses (Figs. 7a andb), reflecting the displacement of CD3CN molecules from Ti4+ions, whereas the bands related to CD3CN initially adsorbed onhydroxyl groups exhibited a decrease in intensity and a shifward higher frequencies (more pronounced for the two peinitially at 2265 and 2113 cm−1, due to fundamental vibrations of CD3CN) as the amount of adsorbed water increa(Figs. 7a–e). Notably, the final position and ratio of intensitythese components corresponded to those of the IR spectruCD3CN dissolved in water (not reported for the sake of brevi
A subsequent progressive outgassing of the system resin desorption of co-adsorbed acetonitrile and water molecin the IR spectra from a decreased intensity of theδH2O bandat 1640 cm−1 and of the spectral pattern due to CD3CN in the2300–2100 cm−1 range (Fig. 8). Two important features relate
ur
he
f
g
reeo-
-
ed
-s
d
of.eds
Fig. 8. IR spectra recorded at decreasing coverage of co-adsorbed CD3CN andH2O: (a) 18 Torr (the same as curve e inFig. 7), (b) 4.0, (c) 2.0, (d) 1.0 Torr(e–g) upon outgassing for increasing time, up to 10 min. The spectra aported in Absorbance, after subtraction of the spectrum of the TiO2 pelletinitially outgassed at room temperature prior CD3CN and water adsorption.
to the CD3CN bands merit mention: (i) they shifted progresively toward the original positions that they exhibited whin interaction with surface hydroxyl groups; and (ii) they dcreased in intensity less markedly with respect to theδH2O bandunder progressive outgassing, still present after this last bvanished (Figs. 8e, f ). They finally disappeared (Fig. 8g), due tofull reversibility of the interaction with the hydroxyl groupsroom temperature, as observed in previous investigations[10].
4. Discussion
4.1. Mechanistic aspects
In the gas–solid regime, CO2 and HCN were the main products of acetonitrile degradation for both photocatalysts.HCN formation revealed by gas chromatography was cfirmed by analysis of the alkaline solution contained in the trThe moles of cyanide ions corresponded to those of degracetonitrile. The second carbon atom present in the acetonmolecule was almost quantitatively transformed into CO2, asdetermined by the gravimetric method. These findings supthe hypothesis of Zhuang et al.[5] claiming breakage of thacetonitrile C–C bond. The presence of traces of methanions in the trap can be attributed to the partial oxidationthe organic moiety of the molecule. Moreover, it is notewthy that the very small quantities of methanoate ions alongnitrate ions found adsorbed on the surface of the used cataconfirm that acetonitrile was transformed almost completelHCN and CO2. The production of CO2 and HCN from acetonitrile degradation in the gas–solid regime can be describethe following overall reaction:
(2)CH3CN+ 32O2
TiO2−→hν
CO2 + HCN+ H2O.
In the liquid–solid regime, the acetonitrile photodegradatprocess produced cyanate and carbonate ions and veryamounts of cyanide, nitrite, nitrate, and methanoate ions. B
216 M. Addamo et al. / Journal of Catalysis 235 (2005) 209–220
tiotio
adno
rn o
adfromrath
th
oxe,
tw
mase
ro
r o
xyl
lay-edid–
toni-ofes.con-age
thelessur-le-l
ver-encetheAp-e inthe
for
as–thatoc-
. Theoth-weencat-withgen.eringshy-
area,of
eres
n, re-,
on this finding, it may be assumed that the catalyst irradiafor both regimes determines the acetonitrile photoadsorp[5,17–20]on TiO2 surface sites. Lichtin and Avudaithai[4] hy-pothesized that the reaction between adsorbed acetonitrilephototoproduced·OH radicals is able to perform C–C bonbreakage with the production of cyanide radicals and metha
(3)TiO2hν→TiO2(h
+,e−),
(4)O2 + e− → ·O2−,
(5)·O2− + H2O→ HO2
· + OH−,
OH− + h+ → ·OH, (6)
CH3CN(ads)+ ·OH → CH3OH + CN·. (7)
In the gas–solid regime, the CN· radicals reacted with wateadsorbed on the catalyst surface, giving rise to the formatioHCN, whereas methanol was photo-oxidised to CO2:
CN· + H2O → HCN + ·OH, (8)
CH3OH + 6·OH → CO2 + 5H2O. (9)
In contrast, in the liquid–solid regime, most of the cyanide ricals were transformed into cyanate ions, which desorbedthe surface to the aqueous solution. The remaining cyanideicals produced cyanide ions, which were also released tosolution:
CN + 2OH− + h+ → CNO− + H2O, (10)
CN· + OH− → CN− + ·OH. (11)
The cyanide ions produced through reaction(11) underwentphotocatalytic oxidation to cyanate[10,21–23]. The processcontinued with cyanate photo-oxidation steps, giving rise toformation of carbonate and nitrate ions:
(12)CNO− + 10OH− + 8h+ → CO32− + NO3
− + 5H2O.
Methanol (species not detected, probably due to its fastidation), formed according to(7), was oxidised to methanalmethanoate, and carbonate ions, although only the lastspecies were detected:
CH3OH + 2·OH → HCOH+ 2H2O, (13)
HCOH+ 3OH− + 2h+ → HCOO− + 2H2O, (14)
(15)HCOO− + 3OH− + 2h+ → CO32− + 2H2O.
In conclusion, acetonitrile photodegradation led to the fortion of cyanate ions from the nitrile group and to their subquent oxidation to nitrate and carbonate ions [reaction(12)],whereas methanol gave rise to carbonate ion as the final puct [reactions(13)–(15)].
4.2. IR data: acetonitrile/water competition
The spectral features observed by admitting water vapouthe photocatalyst with preadsorbed acetonitrile (Figs. 6 and 7)indicated that nitrile molecules initially adsorbed on hydro
nn
nd
l:
f
-
d-e
e
-
o
--
d-
n
groups were converted in a solute in the molecular waterers formed at the TiO2 surface. This condition can be assumas a model of the photocatalyst–solution interface in the liqusolid regime, where no specific interactions between acetrile molecules and the TiO2 surface should occur becausecompetition with the prevailing amount of water moleculThis fact agrees well with the strong decrease in the ratestant of acetonitrile photo-oxidation resulting from passfrom the gas–solid regime to the liquid–solid regime.
As for the results obtained by progressively decreasingtotal amount of adsorbed molecules to a monolayer or(Figs. 8), acetonitrile molecules were able to interact with sface hydroxyl groups slightly more strongly than water mocules. Indeed, a slightly higher interaction energy of 5 kJ mo−1
in favour of acetonitrile with respect to H2O was obtained in themodeling of their adsorption on silanols[24,25]. This findingcan be related to the kinetic analysis of the acetonitrile consion in the gas–solid regime, and it is evident that the presof small amount of water in the reaction feed did not alterrate constant with respect to that obtained for a dry feed.parently, in these conditions the weak energetic advantagthe adsorption of acetonitrile with respect to water makescompetition of this latter less effective toward acetonitrilethe surface sites.
4.3. Kinetic aspects
To model the photoreactivity results obtained in the gsolid and liquid–solid regimes, the assumption is madeall of the elementary reactions of acetonitrile degradationcur on the catalyst surface and involve adsorbed speciesrate-determining step of the photo-oxidation process is hypesized to be the reaction on the photocatalyst surface bethydroxyl radicals and adsorbed acetonitrile molecules. Thealyst surface has sites able to adsorb acetonitrile togetherits degradation products, as well as sites able to adsorb oxyBecause the adsorbed oxygen acts as an electron trap, hindthe electron hole recombination, the·OH concentration dependon the fractional site coverage by oxygen molecules. In thispothesis, the acetonitrile degradation rate per unit surface(−rS), for a second-order kinetic may be written in termsLangmuir–Hinshelwood model as
(16)(−rS) ≡ − 1
S
dNAN
dt= k′′
ANθOxθAN,
whereS is the surface area of the photocatalysts,NAN is theacetonitrile moles,t is the time,k′′
AN is the surface second-ordrate constant, andθOx andθAN are the fractional site coveragby oxygen and acetonitrile, respectively. TheθOx andθAN termsare given by
(17)θOx = KOxCOx
1+ KOxCOxand
(18)θAN = KANCAN
1+ KANCAN + ∑KICI
,
in which KOx, KAN, and KI are the equilibrium adsorptioconstants of oxygen, acetonitrile, and intermediate productsspectively, andCOx, CAN, andCI are the oxygen, acetonitrile
M. Addamo et al. / Journal of Catalysis 235 (2005) 209–220 217
, r
ely
, tsom. B
cer irol
tro
rile
onex
ygedidragt to
rile
ountoth
areasth
l-
ic
id
fol-
re,
thes inreakide,que-nidetioncata-tead
and intermediate product concentrations in the fluid phasespectively.
4.3.1. Gas–solid regimeThe reactivity results show that acetonitrile is complet
converted to equimolar amounts of HCN and CO2, which werethe unique species found in the gas phase. In this systemconcentration of intermediate products,CI , in the gas phase wanegligible, and thus it may be assumed that they do not cpete with acetonitrile for adsorption on the catalyst surfaceputtingCI = 0 in (18)and substituting(17)and(18) in (16), theacetonitrile degradation rate is
(19)(−rS) = k′′AN
(KOxCOx
1+ KOxCOx
)(KANCAN
1+ KANCAN
).
The photoreactivity runs exhibited a high conversion of atonitrile, so that the assumption of a differential photoreactonot valid. An acetonitrile molar balance on a differential contvolume of the reactor may be written as
(20)−W dCAN = (−rS)dS,
where dS is the surface area of the photocatalyst in the convolume.
Considering that the oxidation of one mole of acetonitrequires only 1.5 mol of oxygen [Eq.(2)] and that the oxy-gen concentration at the inlet of photoreactor was at leastorder of magnitude higher than that of acetonitrile under theperimental conditions here, it can be assumed that the oxconcentration from the inlet to the outlet of the photoreactornot change substantially. Consequently, the oxygen coveon the catalyst also did not vary substantially from the inlethe outlet. Based on this assumption, substituting(19) into (20)leads to the following differential mass balance on acetonit
(21)−W dCAN = k′AN
(KANCAN
1+ KANCAN
)dS,
where
(22)k′AN = k′′
AN
(KOxCOx,M
1+ KOxCOx,M
)
is a term constant for each run. In(22), COx,M indicates theoxygen concentration value averaged between the inlet andlet of the photoreactor; this term is introduced to take iaccount the small variation of oxygen concentration alongphotoreactor. The integration of(21), with the limit conditionsthat atS = 0 (the inlet of photoreactor)CAN = CAN,I and atS = S (the outlet of photoreactor)CAN = CAN,O, gives, afterrearrangement,
(23)lnCAN,I
CAN,O= KAN
Wk′
ANS − KAN(CAN,I−CAN,O).
Eq. (23) represents a straight line in a ln(CAN,I/CAN,O) versus(CAN,I − CAN,O) coordinate system; the experimental datareported inFig. 9using the previous coordinates. Using a lesquares best-fitting procedure, straight lines were fit throughdata, and the values ofKAN andk′
AN were determined. The vaues ofk′ depend on oxygen concentration by following(22);
ANe-
he
-y
-s
l
e-n
e
:
t-
e
te
Fig. 9. Experimental data of ln(CAN,I/CAN,O) versus(CAN,I − CAN,O). Thestraight lines drawn through the data represent the kinetic model [Eq.(23)].
Table 1Values of rate constant for acetonitrile (k′′
AN) and cyanate (k′′CNO) disappear-
ance and of equilibrium adsorption constants of acetonitrile (KAN), cyanate(KCNO), and oxygen (KOx) according to the Langmuir–Hinshelwood kinetmodel. TheA constant is equal to (k′′
CNOKCNO/k′′ANKAN)
Merck Degussa P25
Gas–solid Liquid–solid Gas–solid Liquid–sol
k′′AN (mol s−1 m−2) 3.01× 10⁻⁸ 1.11× 10⁻⁸ 2.11× 10⁻⁸ 2.02× 10⁻⁹
k′′CNO (mol s−1 m−2) – 2.08× 10⁻⁸ – 1.60× 10⁻⁹
KAN (M−1) 23,060 2600 10,640 1900KCNO (M−1) – 1900 – 1200KOx (M−1) 240 – 90 –A – 1.37 – 0.50
this equation can be transformed to a linear equation in thelowing way:
(24)1
k′AN
= 1
k′′ANKOx
1
COx,M+ 1
k′′AN
.
Eq. (24) represents a straight line in a 1/k′AN versus
1/COx,M coordinate system. Using the usual fitting proceduthe values ofk′′
AN andKOx were obtained. The values ofk′′AN
and ofKAN andKOx, reported inTable 1, indicate that TiO2Merck has better photocatalytic performance than TiO2 De-gussa P25.
4.3.2. Liquid–solid regimeAs discussed earlier, the disappearance of acetonitrile in
liquid–solid regime occurs through the same pathway athe gas–solid regime and involves sites that are able to bthe C–C bond. This route transforms acetonitrile in cyancyanate, nitrate, and carbonate ions. The finding that in aous solution, cyanate concentration is far higher than cyaion concentration after the start of acetonitrile photodegradaindicates that the cyanide radicals, photoproduced on thelyst surface, are transformed predominantly to cyanate ins
218 M. Addamo et al. / Journal of Catalysis 235 (2005) 209–220
tiocte
nsteubntlttace-gendinit
ex-o
ea-
sse
uctotong
te
atet-tha
adana
thgrarattrile
ndintt
eow
ut
e ofear-wing
t ofialp
alues
ry
a-
dure;-st the
ic
–icaun-ateter-fts.-lodel
de-k
of cyanide ions. Based on this finding, we make the assumpthat the parallel route producing cyanide ions can be neglefor the kinetic modeling of acetonitrile photodegradation.
It is useful to keep in mind that all of the photoreactivity ruin the liquid–solid regime with either acetonitrile or cyanaion were carried out in a batch reactor by continuously bbling oxygen or air into the reacting suspension. Consequethe fractional site coverage by oxygen,θOx, remained constanthroughout the photoreactivity run. Moreover, for both calysts, no significant difference in photoreactivity toward atonitrile or cyanate ion was observed by bubbling pure oxyor air. This finding indicates that under the experimental cotions, the fractional site coverage by oxygen was equal to ufor all of the reactivity runs, that is,θOx = 1.
For modeling the photoreactivity results, it is useful topress the kinetic law as a function of the concentrationdissolved acetonitrile,CAN, because it was the parameter msured experimentally. Introducing the reaction volume,V , inthe definition of the reaction rate [see(16)] and the unit valueof θOx, the kinetics of acetonitrile disappearance are expreas
(25)(−rS) ≡ − 1
S
dNAN
dt= −V
S
dCAN
dt= k′′
ANθAN .
As far as theθAN term is concerned, the intermediate prodof acetonitrile degradation is cyanate ion, which may be phcatalytically transformed to nitrate ion. Based on this findiin (18) the
∑KICI term is equal toKCNOCCNO, whereKCNO
is the equilibrium adsorption constant andCCNO is the con-centration of cyanate ion. Therefore, the disappearance raacetonitrile is
(26)−V
S
dCAN
dt= k′′
ANKANCAN
1+ KANCAN + KCNOCCNO.
Solving (26) requires determining the dependence of cyanconcentration on irradiation time, that is, modeling the kinics of cyanate photo-oxidation. The assumption is madethe second-order kinetic model used for acetonitrile degrtion also holds for cyanate photodegradation; that is, the cyadegradation rate per unit surface area,−rCNO, depends onthe cyanate and oxygen fractional coverages. Consideringcyanate ion is produced in the first step of acetonitrile dedation but is consumed by its subsequent oxidation to nition, the rate of cyanate formation in the course of acetonidegradation is given by the following equation:
rCNO ≡ 1
S
dNCNO
dt= V
S
dCCNO
dt
(27)= k′′ANθANθOx − k′′
CNOθCNOθOx,
in whichk′′CNO andθCNO are the second-order rate constant a
fractional site coverage of cyanate ion, respectively. Takingaccount that the value ofθOx is 1, substitution of the expliciexpressions ofθAN andθCNO in (27)yields
(28)V
S
dCCNO
dt= k′′
ANKANCAN − k′′CNOKCNOCCNO
1+ KANCAN + KCNOCCNO.
The differential Eqs.(26) and (28)are coupled, so they must bsolved simultaneously. These equations contain four unkn
nd
-y,
-
n-y
f
d
-,
of
e
t-te
at-e
o
n
parameters:k′′AN, k′′
CNO, KAN, andKCNO. The values ofk′′CNO
and KCNO may be determined by reactivity runs carried owith suspensions containing only cyanate ions (seeFig. 5).Assuming that the kinetic model, adopted in the presencacetonitrile, is also valid for cyanate ion alone, the disappance rate of cyanate ions may be expressed by the folloequation:
(29)−V
S
dCCNO
dt= k′′
CNOθCNOθOx = k′′CNO
KCNOCCNO
1+ KCNOCCNO,
where theθOx value of 1 has been substituted. Eq.(29) can beeasily integrated, with the limiting condition that at the starirradiation, t = 0, the cyanate ion concentration is the initone,CCNO = CCNO,0. Thus the following integral relationshibetweenCCNO andt is obtained:
(30)
t = V
S
1
k′′CNOKCNO
ln
(CCNO,0
CCNO
)+ V
S
1
k′′CNO
(CCNO,0 − CCNO).
The values ofk′′CNO and KCNO were obtained by applying
least squares best-fitting procedure to the experimental vaof CCNO versust ; these are reported inTable 1. In Fig. 5, thelines drawn through the data represent(30) in which the pre-vious values ofk′′
CNO andKCNO have been substituted; a vegood fit of the kinetic model to the data can be seen.
To determine the values ofk′′AN andKAN, the ratio between
(28)and(26)was calculated, giving rise to the following eqution:
(31)−dCCNO
dCAN= 1− k′′
CNOKCNO
k′′ANKAN
CCNO
CAN= 1− A
CCNO
CAN,
which contains only one unknown parameter, theA constant(equal tok′′
CNOKCNO/k′′ANKAN). Integrating(31)with the limit
condition thatCCNO = 0 for CAN = CAN,0 gives
(32)CCNO = C1−AAN,0C
AAN − CAN
1− A.
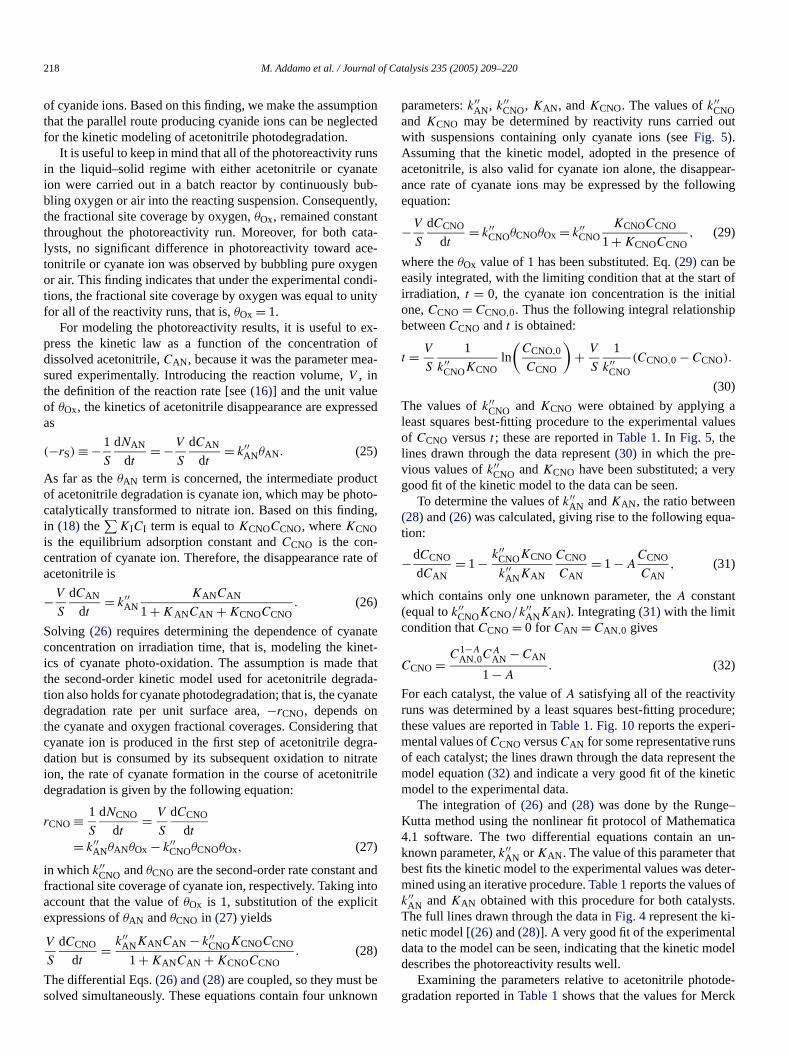
For each catalyst, the value ofA satisfying all of the reactivityruns was determined by a least squares best-fitting procethese values are reported inTable 1. Fig. 10reports the experimental values ofCCNO versusCAN for some representative runof each catalyst; the lines drawn through the data represenmodel equation(32) and indicate a very good fit of the kinetmodel to the experimental data.
The integration of(26) and (28) was done by the RungeKutta method using the nonlinear fit protocol of Mathemat4.1 software. The two differential equations contain anknown parameter,k′′
AN or KAN. The value of this parameter thbest fits the kinetic model to the experimental values was dmined using an iterative procedure.Table 1reports the values ok′′
AN andKAN obtained with this procedure for both catalysThe full lines drawn through the data inFig. 4represent the kinetic model [(26)and(28)]. A very good fit of the experimentadata to the model can be seen, indicating that the kinetic mdescribes the photoreactivity results well.
Examining the parameters relative to acetonitrile photogradation reported inTable 1shows that the values for Merc
M. Addamo et al. / Journal of Catalysis 235 (2005) 209–220 219
caline
as
one;erremsig
oreershifo
iumil
han
thege
eouvith
deid–5, nuid
e ofolidedun-
hechar-rileeousandrel-of
bepar-ndi-oto-othles.ole
teder
oj-
ork,
95
-
57.ar-
pez,ra-
73.75)
od-4–
77).
r 15
89)
c.,
Fig. 10. Cyanate concentration versus acetonitrile concentration for runsried out in liquid–solid system. The lines drawn through the data (dottedDegussa P25, continuous line Merck) represent the kinetic model [Eq.(32)].
TiO2 were always higher than those for Degussa P25 TiO2. Thephotoprocess performance in both the liquid–solid and gsolid regimes was higher with Merck TiO2 than with P25 TiO2.The presence of liquid water negatively affected the kinetic cstant values with respect to those obtained in the gas phasthe P25 catalyst, thek′′
AN value decreased by about one ordof magnitude, whereas the decrease for Merck was only thfold. The liquid water also negatively affects the equilibriuadsorption constant of acetonitrile; both catalysts showednificantly lowerKAN values; this effect was more important fMerck TiO2 than for P25 TiO2. In the gas–solid regime, thequilibrium adsorption constant of acetonitrile was two ordof magnitude higher than that of oxygen for both catalysts. Tfinding obviously indicates that photoadsorption is easiera vapour than for a gas. The kinetic constant and equilibradsorption constant of cyanate photodegradation were simto those of acetonitrile photodegradation. Thek′′
CNO value forMerck TiO2 was more than one order of magnitude higher tthat for Degussa P25 TiO2, whereas theKCNO value was a littlehigher in the former than in the latter.
Although making a straightforward correlation betweenkinetic parameters and adsorption properties of a species iserally very difficult (because the surface sites in heterogenphotocatalysis are produced under irradiation), it can be enaged that the liquid medium hinders both the adsorption andphotoreactivity of dissolved molecules.
5. Conclusions
The photoreactivity results indicate that photocatalyticgradation of acetonitrile occurred in the gas–solid and liqusolid regimes using commercial TiO2 catalysts (Degussa P2and Merck). The intermediate products cyanide, cyanatetrate, carbonate, and methanoate ions were found in the liqsolid regime, whereas hydrogen cyanide and CO2 were found
r-
–
-for
e-
-
sr
ar
n-s
s-e
-
i-–
in the gas–solid regime. These findings suggest breakagthe acetonitrile C–C bond in both regimes. In the gas–sregime, nitrile moiety formed a cyanide radical that evolvto volatile hydrogen cyanide, whereas the methyl moietyderwent a fast and quantitative oxidation to CO2 and H2O. Inthe liquid–solid regime, the acetonitrile molecule follows tsame route of degradation as seen in the gas–solid regime,acterised by C–C breaking. The nitrile part of the acetonitmolecule formed cyanate, which was released to the aqusolution for subsequent photocatalytic oxidation to nitratecarbonate, whereas oxidation of the methyl moiety wasatively slow, allowing the detection of a certain quantitymethanoate.
Photocatalytic degradation kinetics in both regimes candescribed using the Langmuir–Hinshelwood model. A comison between the constants obtained by kinetic modeling icates that liquid water played a fundamental role in the phprocess performance. In fact, the liquid medium hindered bthe adsorption and the photoreactivity of dissolved molecuAs for the adsorption in the dark, IR data confirmed the rof water as the predominant competitor for TiO2 surface siteswith respect to acetonitrile molecules, which in turn interacpreferentially with the TiO2 surface when the acetonitrile–watgaseous feed is poor in water.
Acknowledgments
The authors thank MIUR for financial support (PRIN prects 2003035534_00X and 2003035534_004).
References
[1] M. Schiavello (Ed.), Heterogeneous Photocatalysis, Wiley, New Y1995.
[2] M.R. Hoffmann, T.S. Martin, W. Choi, D.W. Bahnemann, Chem. Rev.(1995) 69.
[3] A. Fujishima, K. Hashimoto, T. Watanabe, TiO2 Photocatalysis: Fundamentals and Applications, Bkc, Tokyo, 1999.
[4] N.N. Lichtin, M. Avudaithai, Environ. Sci. Technol. 6 (1996) 2014.[5] J. Zhuang, C.N. Rusu, J.T. Yates Jr., J. Phys. Chem. B 103 (1999) 69[6] V. Augugliaro, S. Coluccia, E. García-López, V. Loddo, G. Marcì, G. M
tra, L. Palmisano, M. Schiavello, Top. Catal. 2005, in press.[7] V. Augugliaro, A. Bianco Prevot, J. Cáceres Vázquez, E. García-Ló
A. Irico, V. Loddo, S. Malato Rodríguez, G. Marcì, L. Palmisano, E. Pmauro, Adv. Environ. Res. 8 (2004) 329.
[8] S.L. Murov (Ed.), Handbook of Photochemistry, Dekker, New York, 19[9] H. Knözinger, H. Krietenbrink, J. Chem. Soc., Faraday Trans. 91 (19
2421.[10] P. Davit, G. Martra, S. Coluccia, V. Augugliaro, E. García-López, V. L
do, G. Marcì, L. Palmisano, M. Schiavello, J. Mol. Catal. A: Chem. 20205 (2003) 693.
[11] G. Martra, Appl. Catal. A: Gen. 200 (2000) 275.[12] G. Munuera, F.S. Stone, Discuss. Faraday Soc. 52 (1971) 205.[13] D.M. Griffiths, C.H. Rochester, J. Chem. Soc., Faraday Trans. 1 73 (19[14] C. Morterra, J. Chem. Soc., Faraday Trans. 1 84 (1986) 1617.[15] E. Escalona Platero, M. Peñarroya Mentruit, C. Morterra, Langmui
(1999) 5079, and reference therein.[16] C. Binet, A. Jadi, J.C. Lavalley, J. Chem. Phys. 89 (1992) 31.[17] J. Cunningham, M. Jauch, D. McNamara, Proc. R. Ir. Acad. 89 (19
299.[18] K. Hadjiivanov, D. Klissurski, G. Busca, V. Lorenzelli, J. Chem. So
Faraday Trans. 87 (1991) 175.

220 M. Addamo et al. / Journal of Catalysis 235 (2005) 209–220
Wi-
992
o,
pez,o,
92)
. 99
[19] R.I. Bickley, in: M. Schiavello (Ed.), Heterogeneous Photocatalysis,ley, New York, 1995.
[20] J. Cunningham, P. Sedlak, Catal. Today 29 (1996) 309.[21] J. Peral, X. Domenech, J. Photochem. Photobiol. A: Chem. 53 (1
93.[22] V. Augugliaro, V. Loddo, M.J. López-Muñoz, G. Marcì, L. Palmisan
J. Catal. 166 (1997) 272.
)
[23] V. Augugliaro, J. Blanco Gálvez, J. Cáceres Vázquez, E. García LóV. Loddo, M.J. López-Muñoz, S. Malato, G. Marcì, L. PalmisanM. Schiavello, J. Soria, Catal. Today 54 (1999) 45.
[24] A.G. Pelmenshikov, G. Morosi, A. Gamba, J. Phys. Chem. 96 (197422.
[25] A.G. Pelmenshikov, G. Morosi, A. Gamba, S. Coluccia, J. Phys. Chem(1995) 15018.
Copyright © 2022 FDOKUMEN


![Tris(acetonitrile-κ N ){2,6-bis[(diphenylphosphanyl)amino]-4-ethoxy-1,3,5-triazine-κ 3 P , N 1 , P ′}iron(II) bis(tetrafluoridoborate) acetonitrile disolvate](https://static.fdokumen.com/doc/165x107/6323aaae03238a9ff60a8974/trisacetonitrile-k-n-26-bisdiphenylphosphanylamino-4-ethoxy-135-triazine-k.jpg)