Photoacoustic Spectroscopy in the Assessment of the Quantitative Composition of the Biomass - Barley...
26
Chapter 15 Photoacoustic Spectroscopy in the Assessment of the Quantitative Composition of the Biomass — Barley Straw Kingsley L. Iroba and TabilLope G. Additional information is available at the end of the chapter http://dx.doi.org/10.5772/59225 1. Introduction Agricultural biomass residue is a naturally occurring polymeric compound comprised of cellulose, hemicellulose, lignin, and extractives [1]. Biomass has the potential to be used as raw material for the biofuel industry. Cellulose occurs as crystalline fibers with random amorphous portions. The crystallinity of cellulose fibers is a key obstacle for effective biomass enzymatic hydrolysis [2]. Hemicellulose functions as a matrix for the cellulose and acts as a linkage between the crystalline cellulose and amorphous lignin [1-2]. Lignin is a polyphenolic compound that acts as a cementing material for biomass [1]. Lignin binds the hemicellulose and cellulose within the matrix. It provides rigidity and mechanical strength, holding it together [3]. The complex structure of lignocellulosic biomass presents resistance and ‘recal‐ citrance’ to biological and chemical degradation during enzymatic hydrolysis/saccharification and the subsequent fermentation process. This leads to a very low conversion rate, which makes the process less economically feasible [4-7]. Pretreatment strategies are employed to overcome the aforementioned challenges by deconstructing/disrupting the lignocellulosic matrix [8], while making cellulose and hemicellulose accessible for the production of bioetha‐ nol. Radio frequency (RF)-alkaline and steam explosion pretreatment of biomass barley straw have shown that pretreatment enhanced the modification of the natural binding characteristics of lignocellulosic biomass [8-9]. Subsequently, this improved the physical properties of the produced pellets from the pretreated biomass [10]. RF heating has been considered as an energy efficient heating method that is an alternative to conventional methods (such as hot air). In RF heating, there is a volumetric heat generation inside the product, which is a result © 2015 The Author(s). Licensee InTech. This chapter is distributed under the terms of the Creative Commons Attribution License (http://creativecommons.org/licenses/by/3.0), which permits unrestricted use, distribution, and reproduction in any medium, provided the original work is properly cited.
Transcript of Photoacoustic Spectroscopy in the Assessment of the Quantitative Composition of the Biomass - Barley...

Chapter 15
Photoacoustic Spectroscopy in the Assessment of theQuantitative Composition of the Biomass — BarleyStraw
Kingsley L. Iroba and TabilLope G.
Additional information is available at the end of the chapter
http://dx.doi.org/10.5772/59225
1. Introduction
Agricultural biomass residue is a naturally occurring polymeric compound comprised ofcellulose, hemicellulose, lignin, and extractives [1]. Biomass has the potential to be used as rawmaterial for the biofuel industry. Cellulose occurs as crystalline fibers with random amorphousportions. The crystallinity of cellulose fibers is a key obstacle for effective biomass enzymatichydrolysis [2]. Hemicellulose functions as a matrix for the cellulose and acts as a linkagebetween the crystalline cellulose and amorphous lignin [1-2]. Lignin is a polyphenoliccompound that acts as a cementing material for biomass [1]. Lignin binds the hemicelluloseand cellulose within the matrix. It provides rigidity and mechanical strength, holding ittogether [3]. The complex structure of lignocellulosic biomass presents resistance and ‘recal‐citrance’ to biological and chemical degradation during enzymatic hydrolysis/saccharificationand the subsequent fermentation process. This leads to a very low conversion rate, whichmakes the process less economically feasible [4-7]. Pretreatment strategies are employed toovercome the aforementioned challenges by deconstructing/disrupting the lignocellulosicmatrix [8], while making cellulose and hemicellulose accessible for the production of bioetha‐nol.
Radio frequency (RF)-alkaline and steam explosion pretreatment of biomass barley straw haveshown that pretreatment enhanced the modification of the natural binding characteristics oflignocellulosic biomass [8-9]. Subsequently, this improved the physical properties of theproduced pellets from the pretreated biomass [10]. RF heating has been considered as anenergy efficient heating method that is an alternative to conventional methods (such as hotair). In RF heating, there is a volumetric heat generation inside the product, which is a result
© 2015 The Author(s). Licensee InTech. This chapter is distributed under the terms of the Creative CommonsAttribution License (http://creativecommons.org/licenses/by/3.0), which permits unrestricted use, distribution,and reproduction in any medium, provided the original work is properly cited.
of the interaction between the RF waves and the ions/molecules of the product [11]. Therefore,heat flows from inside the product to the outside, unlike conventional heating methods inwhich heat is transferred from the heating medium to the product via conduction or convection[8]. RF heating has the following advantages: 1) uniform electric field strength inside theapplication chambers, therefore preventing uncontrolled heating, overheating, local hot spots,and product degradation; 2) large penetration depth (10-30 m); and 3) higher energy efficiency[11-13]. RF has been successfully applied to leather drying [13], quantification of hydroxycin‐namic acids and lignin in perennial forage and energy grasses [14], thermal therapy [15], andin other research fields such as food processing (blanching, tempering, pasteurisation,sterilisation) and medicine [11]. Recently, Izadifar et al. (2009) [12] demonstrated that RF canbe used for the extraction of podophyllotoxin from rhizomes of Podophyllum peltatum.
Steam explosion is operated by introducing the feedstock into the reactor and heating understeam pressure (2000-5000 kPa; 200-260°C) for a few minutes [16]. Steam explosion induceschemical effects because "water itself acts as an acid at high temperatures" [17]. The suddenthermal expansion involved in the termination of the reaction causes the particulate structureof the biomass to open up [17]. Lam et al. 2011 [18] investigated the steam explosion of DouglasFir (Pseudotsuga menziesii) at a reaction temperature of 200-220oC and a retention time of 5-10min. Excoffier et al. (1991) [19] and Ferro et al. [20] (2004) have applied steam explosion onlignocellulosic biomass. These authors reported that steam explosion is effective in thepretreatment of biomass.
The traditional methods of determining the chemical compositions of biomass involvegravimetric and analytical procedures. These procedures are time-consuming, laborious andexpensive to perform, with low sample throughput and often results in a correspondingdegradation of natural polymers [1, 21-22]. In contrast, procedures involving infrared (IR)spectroscopy are useful tools in rapidly extracting information about the structure of biomassconstituents and the associated chemical changes resulting from various biomass treatments[1]. Infrared spectroscopy offers researchers an alternative method that is easier, robust andrapid. Fourier transform infrared (FTIR) spectroscopy has been successfully applied in avariety of species in wood surface characterization, for estimating the carbohydrate and lignincomponents [1, 22]. The majority of the carbon based molecules in plants and animals alikeare highly active in the IR. FTIR is associated with superior spectral resolution and providesinformation on the fundamental molecular vibrations [22]. This permits better discriminationof structural and compositional differences, and often better structural interpretation [22].Furthermore, FTIR analysis requires only small amounts of biomass plant material, whichhelps when screening samples available in limited quantities [22]. Applications of FTIR havealso been found in biomedical weld and medicine research such as cancer and bone [23-24].
Mid-infrared spectroscopy and near infrared reflectance spectroscopy (NIRS) are the two typesof IR spectroscopy that have found application for the measurement of chemical compositionin lignocellulosic biomass. NIRS has been used in the prediction of the chemical compositionin bulk plant samples. While mid-IR spectroscopy in contrast to NIRS predicts the fundamentalmolecular
Biofuels - Status and Perspective304
vibrations, as such it gives a better information and insight into the molecular bonds presentin the sample [25]. FTIR has been successfully applied for the comparison of Fourier transforminfrared (FTIR) spectra of individual cells acquired using synchrotron and conventionalsources [23]. The authors reported that the main beneficiaries of this rapid development (FTIR)on the instrumental front are the applications-based sciences, such as biomedical and cell-biological fields, for which results have been produced that are unavailable by standardmethodologies. Stewart et al. (1995) [26] used FTIR spectroscopy to investigate the changes incomposition and structure of oak wood and barley straw that has been subjected to chemicaland biochemical treatments. The samples were also analyzed gravimetrically for residualneutral sugar composition, lignin and uronic acid contents. The spectroscopic techniquesprovided complementary information to the traditional approach. The FTIR fingerprint ofwheat endosperm arabinoxylan (AX) has been investigated using a set of polysaccharidesexhibiting variation of their degree of substitution and xylo-oligosaccharides comprisingxylose units mono-or disubstituted by arabinose residues [27]. Yu (2005) [28] applied syn‐chrotron FTIR microspectroscopy for the investigation of the molecular chemistry of variousfeed tissues. These images revealed spatial intensity and distribution of chemical functionalgroups in various feeds tissues within cellular dimensions. The researcher reported that suchinformation can be used for plant breeding program for selecting superior variety of plant fortargeted feed purposes and for prediction of feed quality and nutritive value. This proved thatsynchrotron FTIR microspectroscopy can be used for biological structure study.
Changes in plant cell wall composition following pretreatment largely influence the end useperformance. The ability to easily monitor these compositional changes is, therefore, impor‐tant. Hence, the objective of this investigation is to study and rapidly estimate the relativechemical composition of lignin, cellulosic and hemicellulosic polymers in pretreated and non-treated lignocellulosic barley straw using FTIR-PAS. This work focuses on the effects of radiofrequency-alkaline and steam explosion pretreatments on the cell compositions of barleystraw.
2. Material and methods
2.1. Material procurement and preparation
Barley straw of the “Xena” variety was grown in Maymont, SK (56.667°N, 107.794°W) andobtained from RAW Ag Ventures Limited (Maymont, SK) in October 2009. To increase thesurface area of the biomass, the straw was ground using a hammer mill (Model No. GM13688,Glen Mills Inc., Maywood, NJ) with screen size of 1.6 mm. A dust collector (House of Tools,Model no. DC-202B, Saskatoon, SK) was connected to the outlet of the hammer mill to controldust during operation and to provide flow of the biomass in and out of the hammer mill. Theinitial moisture content of the straw was 8.09% (wet basis). The moisture content was measuredbased on ASABE standard method, ASAE S358.2 (2008). As a comparison between pretreat‐ment methods, the 1.6 mm biomass grind was subjected to two different pretreatmentmethods: radio frequency (RF)-alkaline pretreatment using a RF machine (1.5 kW & 27.12 MHz
Photoacoustic Spectroscopy in the Assessment of the Quantitative Composition of the Biomass — Barley Strawhttp://dx.doi.org/10.5772/59225
305

laboratory dryer, Strayfield, Theale, Reading) in a blown glass reactor (volume 4.25 liters)stationed in University of Saskatchewan, Saskatoon, SK, and steam explosion (SE) pretreat‐ment located at the Clean Energy Research Center, University of British of Columbia, Depart‐ment of Chemical and Biological Engineering, Vancouver, BC. The material and operatingvariables considered in both methods of pretreatment are shown in Table 1 (a-b). Eachpretreatment was performed in two replicates. For more details on the RF-alkaline and SEpretreatment, see [8-9].
Variables Levels
Hammer screen size 1.6 mm
NaOH solution concentration 1% w/v
Biomass: NaOH solution ratio 1:4 - 110 g biomass and 440 g NaOH solution1:5 - 110 g biomass and 550 g NaOH solution1:6 - 100 g biomass and 600 g NaOH solution1:7 - 100 g biomass and 700 g NaOH solution1:8 - 90 g biomass and 720 g NaOH solution
Soaking time 1 h
Temperature 70, 80, and 90oC
Residence time 20 minutes
(a)
Variables Levels
Temperature (oC) 140, 160, and 180
Moisture Content (% mass fraction of water) 8, 30, and 50
Retention Time (min.) 5 and 10
(b)
Table 1. a) RF-alkaline material and operating variables using blown glass reactor; (b) SE material and operatingvariables with corresponding levels
2.2. Chemical composition analysis of lignocellulosic biomass
The chemical composition analysis of the RF-alkaline and SE pretreated biomass grind wasperformed using the National Renewable Energy Laboratory standard (NREL) [30] at alaboratory facility at the Agriculture and Agri-Food Canada, Saskatoon, SK. Each sample wasreplicated twice. The NREL standard uses a two-step acid hydrolysis to fractionate the biomassinto forms that are more easily quantified. The first step uses 72% H2SO4, while the second stepuses 4% H2SO4. The lignin fractionates into acid insoluble and acid soluble material. The acidinsoluble lignin is the residue (remaining solids) from the hydrolysis suspension. Acid-solublelignin moieties were quantified using the Waters Acquity Ultra Performance Liquid Chroma‐tography–MS system (Acquity 2004-2010, Waters Corp., Milford, MA), which has the capa‐bility of separating and quantifying the various lignin components. The complex
Biofuels - Status and Perspective306

carbohydrates are hydrolyzed into monomeric forms (xylose, arabinose, mannose, glucose,and galactose) and subsequently quantified using UPLC-MS. The percentage hemicellulosewas obtained by adding up the percentage xylose, arabinose, mannose, and galactose, whilethe percentage glucose was assigned to percentage cellulose. Further details on the materialpreparation, physical characteristics of the biomass grind, radio frequency alkaline technique,steam explosion process, and the chemical composition analysis using the NREL standard canbe obtained in the research studies of [8-9]. The pretreated and non-treated samples werefurther ground to screen size of 0.354 mm using a precision grinder (Falling Number, ModelNo. 111739, Huddinge, Sweden).
2.3. Preparation of reference materials of known concentration
In order to develop a predictive model that will be rapidly used for the quantitative predictionof the chemical composition contained in the RF-alkaline and SE pretreated biomass, purecellulose (microcrystalline powder), hemicellulose (xylan from birch wood), and lignin(hydrolytic) powders (Sigma-Aldrich Canada Ltd., St. Louis, MO) were mixed in differentproportions (Table 2). These were used as reference spectra to determine the relationshipbetween the respective quantity in the mixture and the representative sample FTIR spectra.The FTIR wavenumber-dependent instrumental effects were corrected by using carbon blackreference spectrum.
Reference Mixtures Cellulose (%) Hemicellulose (%) Lignin (%)
C1H0L0 100 0 0
C0H1L0 0 100 0
C0H0L1 0 0 100
C7H2L0 75 25 0
C2H7L0 25 75 0
C0H2L7 0 25 75
C0H7L2 0 75 25
C7H0L2 75 0 25
C2H0L7 25 0 75
C5H2L2 50 25 25
C2H5L2 25 50 25
C2H2L5 25 25 50
C3H3L3 33 33 33
Total 13 13 13
C, H, and L represent Cellulose, Hemicellulose, and Lignin, respectively
Table 2. Reference materials: Pure cellulose, hemicellulose, and lignin mixtures used to obtained the reference spectra(adapted from [21])
Photoacoustic Spectroscopy in the Assessment of the Quantitative Composition of the Biomass — Barley Strawhttp://dx.doi.org/10.5772/59225
307

2.4. Fourier Transformed Infrared Photoacoustic Spectroscopy (FTIR-PAS)
Intensity of spectra generally increases as the particle size decreases [30]. To avoid moistureinterference, the biomass samples were further dried using the forced-air convection dryer [31](Shaw et al. 2007) set at 40oC for 48 h. Photoacoustic intensities are lower for samples with highmoisture content. This might be due to lower efficiency of heat transfer between the moistcellulose surface and the carrier gas [32]. The Infrared data/spectra of the reference materialsand biomass samples were collected using Mid-IR beamline (01B1-1) with energy range of4000-400 cm-1, at the Canadian Light Source Inc. (CLS, University of Saskatchewan, Saskatoon,SK). The beamline has a MTEC Model 300 photoacoustic cell (MTEC Photoacoustic Inc., Ames,IA) for FTIR-PAS of bulk samples. The sample cup was filled with reference biomass sample(52-75 mg, depending on the pretreatment type and combination) and purged with helium gasto remove water vapor and CO2. Helium gas is also needed in the medium because of it soundpropagating properties. The collected FTIR spectra of the reference materials and biomasssamples were recorded using Globar source (silicon carbide rod). When the radiation isincident on the sample, the energy of the Infrared beam is being absorbed by the sample layer.The photoacoustic signal is generated by thermal expansion of the gas caused by heat associ‐ated with the thermal wave emanating from the sample. The photoacoustic signal is carriedby a carrier gas (Helium) to a microphone which is transferred to the FTIR electronics (detector)for processing; this ultimately produces the needed spectrum [33-34]. The spectrum for eachreference material and biomass samples were recorded separately averaging 64 interferograms(number of scans) collected from wavenumbers of 2000-400 cm-1 at a resolution of 4 cm-1. Thehigher the number of scans the better the signal (lesser noise). Stuart (1997) [36] reported thatthe signal-to-noise ratio (SNR) is proportional to the square root of the number of scans, n (SNRα n0.5). Therefore, the higher the number of scans, the higher is the SNR. Resolution of 4 cm-1
was used to be able to discriminate between too close overlapping peaks, help increase theSNR and subsequently obtain higher resolution. The OPUS 6.5 (Brucker Optics Inc. Billerica,MA) software was used for the collection of the FTIR-PAS spectra. Three replicates wereperformed for each reference and biomass samples.
2.5. Determination of concentration
Beer-Lambert discovered that the amount of light transmitted by a solid sample was dependenton the thickness of that sample [35]. The Beer-Lambert law which can be applied to allelectromagnetic radiation, states that the absorbance of a material is directly proportional tothe thickness and concentration of the sample as shown: A=εCL. A=absorbance of the material,C=concentration, L=pathlength of the sample, and ε=constant of proportionality, which isreferred to as the molar absorptivity [35]. Infrared spectra, particularly in the spectra of solidsamples are often associated with the presence of asymmetric bands. As such, peak heightcannot be used for the quantitative analysis of the spectra, because the baseline will vary fromsample to sample. Instead, peak-area measurements should be used [35].
Biofuels - Status and Perspective308

2.6. Quantitative and qualitative analysis of the FTIR-PAS spectra
The two quantities of greatest interest in virtually any type of spectroscopy are, of course, bandpositions (wavenumbers) and intensities, the former generally conveying qualitative infor‐mation, the latter quantitative [30]. Therefore, these two variables were used for the FTIR dataanalysis.
2.6.1. Spectrum manipulation
There are techniques that assist in both qualitative and quantitative interpretation of spectra.OriginPro software (Data analysis and graphing Version 8.6, OriginLab Corporation North‐ampton, MA) was used for the spectrum manipulation, quantitative, and qualitative analysisof the FTIR-PAS Spectra:
2.6.2. Baseline correction, subtraction, and rescaling
The Baseline Mode is a tool for choosing a baseline mode and creates the baseline. A user-defined baseline treatment was applied in this analysis. A common flat baseline of 0.012,joining the points of lowest absorbance (via fitting Pro) on the peak was selected and appliesacross all the reference materials and biomass sample spectra. Thereafter, baseline subtractionwas performed from the input data, such that the absorbance difference between the selectedbaseline and the top of the band is then used. This helps to improve the accuracy of the peakfinding. Rescaling of the baseline to zero was subsequently performed, so that all the spectrawill have a common origin of zero.
2.6.3. Smoothing
Smoothing is a signal processing technique typically used to remove or diminish noise fromsignals/spectrum. After a spectrum is smoothed, it becomes similar to the result of an experi‐ment obtained at a lower resolution [35, OriginLab Corporation manual]. The features areblended into each other and the noise level decreased. A smoothing function is basically aconvolution between the spectrum and a vector whose points are determined by the degreeof smoothing one wish to apply [35]. There are multiple smoothing methods that workdifferently depending on the nature of the signal and the noise contained in the signal. Eachmethod offers a different performance. In this present analysis, Savitzky-Golay was used. TheSavitzky-Golay filter method performs a local polynomial (order of 2) regression around eachpoint, and creates a new, smoothed value for each data point. This method is superior to othermethods (such as adjacent averaging) because it tends to preserve features of the data, such aspeak height and width, which can be "washed out" by adjacent averaging (OriginLab Corpo‐ration, Northampton, MA, 2012). To increase the smoothness of the result, one can increasethe "window size," used in each local regression (OriginLab Corporation, Northampton, MA,2012). As such, the window size in this analysis was increased from one to two. But for verylarge window size, adjacent averaging may depart from the input signal too much, whereas
Photoacoustic Spectroscopy in the Assessment of the Quantitative Composition of the Biomass — Barley Strawhttp://dx.doi.org/10.5772/59225
309

Savitzky-Golay can still preserve the overall profile (OriginLab Corporation, Northampton,MA, 2012).
2.6.4. Peak finding settings
Manual peak editing was performed so as to effectively select the required respective peaks.The second (2nd) derivative was used to search for all the hidden peaks and heavily overlappedbands included in the spectrum data. Differentiation is used to resolve and locate peaks in anenvelope. Sharp bands are enhanced at the expense of broad ones, and this may allow easierselection of a peak, even when there is a broad band beneath it [35].
2.6.5. Characteristic peak assignment
The characteristic wavenumbers for pure cellulose, hemicellulose, and lignin listed in Table3, were used for the peak assignment. Five characteristic peaks were identified for the purecellulose, six characteristic peaks for pure hemicellulose, and six characteristic peaks for purelignin (Figure 1a-c). The number of the peaks identified for the respective reference materialsdepends on the mixture of the reference materials. All seventeen peaks were identified for thetreated and non-treated biomass samples.
2.6.6. Peak integration
To obtain quantitative values from the area under the manipulated spectrum/peaks, the areaunder the respective peaks were integrated and output into excel file.
2.6.7. Normalization of photoacoustic infrared spectra
Prior to the spectrum manipulation, the FTIR-PAS biomass sample spectra were corrected forwavenumber-dependent instrumental effects by dividing the reference carbon black (“back‐ground”) spectrum intensity. This strategy implicitly assumes that the stability of the instru‐mentation used is adequate to ensure reliable results, even though the sample and referencespectra were collected at different times [30]. Carbon black is featureless, in the sense that itdoes not show any major characteristics peak [30] Photoacoustic (PA) cell intensities variedwith sample packing in the PA cell [36]. Stuart (1997) [35], also reported that absorbance varieslinearly with the sample thickness. Therefore, the effect of bulk density of the referencematerials and biomass samples was corrected by dividing the integrated areas with respectivemass of the reference materials and biomass samples contained in the PA sample cup.
The model was further standardized by normalizing the corrected integrated area data from0 to 1. This was performed by dividing individual reference materials and biomass samplescorrected integrated area data by corresponding maximum corrected integrated area datavalue. The aforementioned steps were performed for the three major components of lignocel‐lulosic biomass (cellulose, hemicellulose, and lignin). Therefore, this normalization approachensures that the predictive model is adaptable for quantitative analysis of FTIR-PAS spectraobtained for any lignocellulosic biomass.
Biofuels - Status and Perspective310

3. Regression analysis
This portion of the analysis is divided into two parts: the training and verification analysis:
3.1. Training analysis
The normalized data of cellulose, hemicellulose, and lignin components in the referencematerials and the combined biomass samples (i.e. combination of data from RF and SEanalysis) were correlated to their percentage compositions. The RF and SE normalized datawere combined so as to develop a general model that can be applied on a barley straw sample,irrespective of the pretreatment method applied on the biomass. The percentage compositionsof the reference materials (Table 2) and the percentage compositions (Tables 4 & 6-8) of thecombined biomass samples obtained from the NREL Standard were used as the dependentvariable, while two out of the three replicates from the combined normalized data (obtainedfrom the PA spectra) were randomly selected and used as the independent variables. Fiveindependent variables were used for the cellulose (because it has five characteristic wave‐numbers), while six independent variables were used for both hemicellulose and lignin (theyboth have six characteristic wavenumbers each). Multiple linear regression analysis wasconducted at 5% significance level using IBM SPSS Statistics (Superior Performing StatisticalSoftware, version 20 for Windows, 2012; IBM, Armonk, New York, NY). Regression models(equations 1-3) for cellulose, hemicellulose, and lignin were developed based on the generatedregression coefficients. The developed models have the capability to predict quantitatively,the percentage compositions of cellulose, hemicellulose, and lignin in any lignocellulosicbiomass.
3.2. Verification analysis (Validation)
Subsequently, the normalized data (based on the respective characteristic peaks) from the thirdreplicate of biomass sample was substituted into the developed predictive models to estimate/predict the percentage compositions of lignocellulosic components present in the non-treated,RF-alkaline and SE pretreated biomass samples (Tables 4 & 6-8).
4. Results and discussion
4.1. Reference material spectra
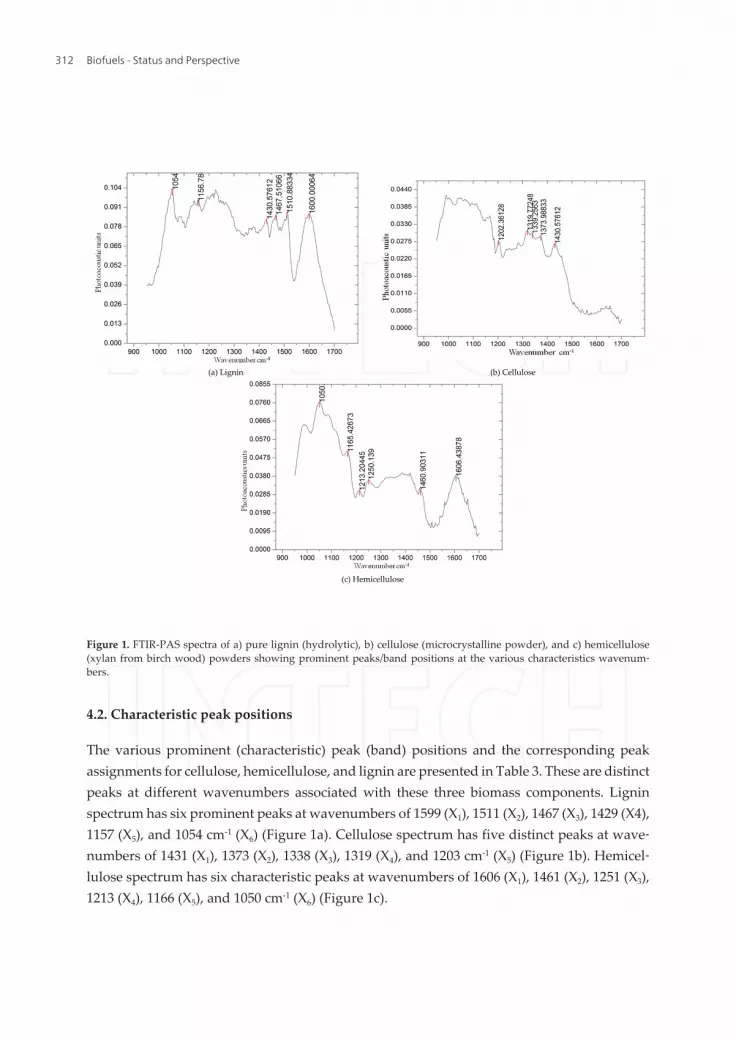
Figure 1 (a-c) shows the normalized spectral results obtained from a typical reference cellulose(100%), hemicellulose (100%), and lignin (100%), respectively, after smoothening and baselinecorrections. Generally, FTIR-PAS techniques permit to obtain spectra which present specificcharacteristic key bands of individual components. In principle, such band position allows thediscrimination of different species and provides important information about the chemicalcompositions of the material.
Photoacoustic Spectroscopy in the Assessment of the Quantitative Composition of the Biomass — Barley Strawhttp://dx.doi.org/10.5772/59225
311
(a) Lignin (b) Cellulose
(c) Hemicellulose
Figure 1. FTIR-PAS spectra of a) pure lignin (hydrolytic), b) cellulose (microcrystalline powder), and c) hemicellulose(xylan from birch wood) powders showing prominent peaks/band positions at the various characteristics wavenum‐bers.
4.2. Characteristic peak positions
The various prominent (characteristic) peak (band) positions and the corresponding peakassignments for cellulose, hemicellulose, and lignin are presented in Table 3. These are distinctpeaks at different wavenumbers associated with these three biomass components. Ligninspectrum has six prominent peaks at wavenumbers of 1599 (X1), 1511 (X2), 1467 (X3), 1429 (X4),1157 (X5), and 1054 cm-1 (X6) (Figure 1a). Cellulose spectrum has five distinct peaks at wave‐numbers of 1431 (X1), 1373 (X2), 1338 (X3), 1319 (X4), and 1203 cm-1 (X5) (Figure 1b). Hemicel‐lulose spectrum has six characteristic peaks at wavenumbers of 1606 (X1), 1461 (X2), 1251 (X3),1213 (X4), 1166 (X5), and 1050 cm-1 (X6) (Figure 1c).
Biofuels - Status and Perspective312

Wavenumbers(cm-1)
Cellulose100%
Hemicellulose100%
Lignin100%
Peak Assignment
1650-1600 - 1606 -1604-acetylated hemicellulosicpolysaccharides [37].
1600-1550 - - 1599
1595-aromatic ring stretch, strongly associated with aromaticC-O stretching mode [26]; 1595- phenylpropanoid polymer[37]; 1600-quadrant ring stretching (aromatic compound oflignin) [38-39]; 1600-aromatic skeletal vibration [1].
1550-1500 - - 1511
1515-semicircle ring stretching (aromatic compound oflignin) [40-41]; 1510-lignin aromatic compound [28]; 1510-very strong aromatic ring stretch, aromatic C-O stretch [26,40]; 1513-aromatic C=C stretch [41]; 1510-semi-circle stretchof para-substitute benzene rings [42]; 1550-protein [42]; 1502-aromatic skeletal vibration-softwood lignin [1]; 1505-aromatic skeletal vibration of benzene ring in lignin [1]
1500-1450 - 1461 1467 1462-C-H lignin deformation (methyl and methylene) [1].
1450-1400 1431 - 1429
1425- C-H in-plane lignin deformation with aromatic ringstretching [1]; 1430-CH2 in-plane bending vibrations [43];1430- C-H cellulose deformation (asymmetric) [1]; 1433-aromatic C=C stretch [41].
1400-1350 1373 - -
1370-weak C-O stretching [39, 44]; 1372-C-H cellulosedeformation (asymmetric) [1]; 1380-C-H symmetric andasymmetric deformation [41]; 1382-C-O stretch [45]; 1378-cellulose(microcrystalline) [37].
1350-13001319,1338
- -1335-weak C-O stretching [39, 44]; 1336-C-H ring in-planebending vibrations [43]; 1336- O-H in-plane cellulosedeformation [1]; 1318-CH2 cellulose wagging [1].
1300-1250 - 1251 -1258- acetylated glucomannan [37]; 1258-arabinoxylans(hemicellulose) [45].
1250-1200 1203 1213 -1246 cellulosic material [39]; 1246-weak C-O stretching [44];1258- acetylated glucomannan [37]; 1250-acetylatedhemicelluloses [43]; 1201- O-H cellulose deformation [1]
1200-1150 - 1166 11571160 glycosidic linkage [27]; 1162-C-O-C ring vibrationalstretching [43]; 1165-arabinoxylans (hemicellulose) [45];
1100-1050 - - 1054 1086- C-O of secondary alcohols [1].
1050-1000 - 1050 -1044-arabinoxylans (hemicellulose) [45]; 1035-C-O, C = C andC-C-O vibrational stretching [43]; 1045-C-OH bending [44,27]; 1025-non-structural CHO [39].
Table 3. Characteristics peaks/bands position and assignment of pure cellulose, hemicellulose, and lignin (adaptedfrom [21])
Photoacoustic Spectroscopy in the Assessment of the Quantitative Composition of the Biomass — Barley Strawhttp://dx.doi.org/10.5772/59225
313
4.3. Radio frequency-alkaline treatment on lignin
It was observed that NaOH concentration is a major factor in the pretreatment process. Theswelling initiated by NaOH creates pores in the biomass matrix [46-48], which helps enhancethe reactivity of the biomass matrix to any externally added material such as enzyme [8]. Asimilar finding was reported by [49]. The lignin values obtained from the traditional wetchemistry chemical composition analysis and through FTIR-PAS as shown in Table 4 depictsthat in most cases, there is a decrease in the lignin in the pretreated samples as compared tothe non-treated samples. This may be due to the unloosened lignified matrix in the non-treatedsample which is tightly bound to the other constituents, unlike the RF alkaline pretreatedsamples with broken bonds which has been structurally separated, and disrupted. Thisdisaggregation may be attributed to the interaction between the biomass and NaOH solutionin the presence of the RF heating which is believed to be responsible for this solid loss [8]. Italso seems that the disruption and deconstruction of the lignified matrix is associated with thedipole interaction, flip flop rotation, and friction generated between the electromagneticcharges from the RF radiation and the ions and molecules from the NaOH solution and thebiomass [8]. Lignin removal is an important part of the pretreatment process, because lignincan effectively inhibit/prevent the cellulase enzymes from hydrolysing the cellulose. Thislignin reduction resulting from the alkaline pretreatment had also been reported by [50-51].
Lignin estimated by FTIR-PAS was higher than those obtained with NREL procedures. Thelaborious and time consuming traditional method that uses 72% H2SO4 seems to create a morestringent condition that may lead to altering and further degrading the native cell wallcompositions (such as lignin and complex carbohydrates), structure, and possibly generatingartifacts. FTIR-PAS is a rapid, direct, non-invasive, and non-destructive chemical analyticaltechnique. This rapid method can detect molecular chemical characteristics of biologicalmaterials at high spatial resolutions without altering the inherent biomass structure such asthe tissue [40, 44].
The difference in the lignin values from the traditional approach and FTIR-PAS may also beattributed to the spectrum manipulations and the assumption that the reference lignin sampleis 100% pure. The FTIR-PAS qualitative and quantitative analytical chemical information canbe connected to the structural information within cellular dimension [42].
Equation 1 shows the predictive model for lignin generated from the training and verificationanalysis of the combined values from RF and SE using the methods described in section 6.3.8.
Lignin predictive model:
1 2 3 4 5 6%L 33.92 52.61 32.16 208.14 98.46 56.59 17.33 X X X X X X e= - + + + + - + + (1)
%L=%lignin (dry matter basis), Xi=regressors/explanatory variables (normalized data basedon the respective characteristic peaks, as shown in Figure 1a), with the regressors representingthe respective wavelengths as 1599 (X1), 1511 (X2), 1467 (X3), 1429 (X4), 1157 (X5), and 1054
Biofuels - Status and Perspective314

cm-1 (X6). 17.33=intercept, and ε=error term/stochastic variable which describes the noise (errorsthat could emanate from the equipment, environment, or the experimenter).
Table 5 shows the R2 and mean square error values of the various biomass components fromthe regression analysis. However, the R2 values are too low; this might be due to the associatedstochastic variables and the spectrum manipulations.
Temperature (oC) Biomass: NaOH solution ratio Lignin (%)
Wet chemistry FTIR-PAS Standard error
Non-treated - 20.12 22.62 1.25
70 1:4 19.56 15.80 1.88
80 1:4 19.22 15.78 1.72
90 1:4 20.66 20.40 0.13
70 1:5 17.81 16.77 0.52
80 1:5 18.22 20.63 1.21
80W 1:5 15.62 18.15 1.27
90 1:5 17.64 19.38 0.87
90W 1:5 15.37 15.90 0.27
24 1:6 21.57 23.65 1.04
70 1:6 17.91 15.98 0.97
90 1:6 18.38 21.63 1.62
24 1:7 17.99 22.34 2.17
70 1:7 17.82 17.55 0.13
80 1:7 18.10 25.22 3.56
80W 1:7 12.39 20.57 4.09
80DW 1:7 19.90 27.74 3.92
80TW 1:7 20.38 26.49 3.06
90 1:7 18.05 20.19 1.07
90W 1:7 10.98 18.78 3.90
70 1:8 18.53 22.20 1.83
80 1:8 18.86 21.60 1.37
90 1:8 19.27 17.45 0.91
Standard error=standard deviation between the wet chemistry and FTIR-PAS values divided by the square root of 2;W=washed after pretreatment; DW=pretreated with distilled water; TW=pretreated with tap water.
Table 4. Lignin composition of RF-alkaline pretreated and non-treated biomass grind obtained using the traditionalwet chemistry and FTIR-PAS methods
Photoacoustic Spectroscopy in the Assessment of the Quantitative Composition of the Biomass — Barley Strawhttp://dx.doi.org/10.5772/59225
315

Biomass composite R2 value Mean square error
% Lignin 0.68 9.10
% Cellulose 0.34 13.86
% Hemicellulose 0.31 15.86
Table 5. R2 and mean square error values from the regression analysis
Washing the pretreated samples reduces the lignin. This may be due to loss of solid ligninduring the washing process [8]. This investigation shows that the concentration of NaOHsolution and the ratio of biomass to the NaOH solution are the dominant contributing factors,while temperature plays a lesser role. The heat provided by the RF is needed to assist thealkaline solution in the deconstruction and disaggregation of lignocellulosic biomass matrix.It was also observed from this investigation that biomass can be alkaline pretreated even atroom temperature if the required ratio of biomass and NaOH solution is applied.
4.4. Radio frequency-alkaline treatment on cellulose and hemicellulose
The difference in the cellulose and hemicellulose values from the traditional approach andFTIR-PAS may be attributed to the spectrum manipulations and the assumption that thereference cellulose and hemicellulose samples are 100% pure. Equations 2-3 show the celluloseand hemicellulose predictive models generated from the training and verification analysis ofthe combined values from RF and SE using the methods described in section 3.
Temperature(oC)
Biomass: NaOH solutionratio
Cellulose (%) Hemicellulose (%)
Wet chemistry FTIR-PAS Standarderror
Wetchemistry
FTIR-PAS Standarderror
Non-treated - 42.51 50.37 3.93 29.98 23.82 3.08
70 1:4 22.25 28.65 3.20 23 18.10 2.45
80 1:4 22.37 27.69 2.66 22.14 28.47 3.16
90 1:4 26.93 26.09 0.42 26.24 20.73 2.75
70 1:5 24.21 4.98 9.61 21.63 30.37 4.37
80 1:5 21.07 29.42 4.18 21.38 24.56 1.59
80W 1:5 27.69 26.55 0.57 21.6 15.81 2.90
90 1:5 24.65 37.03 6.19 21.05 8.44 6.31
90W 1:5 33.44 34.50 0.53 26.08 22.58 1.75
24 1:6 30.93 14.95 7.99 29.12 21.00 4.06
70 1:6 28.25 29.02 0.39 23.18 22.88 0.15
90 1:6 30.37 20.85 4.76 22.36 39.31 8.47
Biofuels - Status and Perspective316

Temperature(oC)
Biomass: NaOH solutionratio
Cellulose (%) Hemicellulose (%)
24 1:7 25.78 27.08 0.65 23.4 26.21 1.40
70 1:7 27.39 11.74 7.82 24.27 28.81 2.27
80 1:7 26.08 17.83 4.12 26.75 10.70 8.02
80W 1:7 38.20 19.86 9.17 27.72 8.48 9.62
80DW 1:7 21.88 2.06 9.91 19.12 5.76 6.68
80TW 1:7 24.98 6.09 9.44 21.04 9.97 5.54
90 1:7 21.33 23.74 1.20 22.27 9.55 6.36
90W 1:7 33.31 12.98 10.17 20.69 9.71 5.49
70 1:8 26.73 27.91 0.59 26.76 22.69 2.03
80 1:8 18.44 42.08 11.82 18.32 31.06 6.37
90 1:8 22.68 21.66 0.51 19 25.64 3.32
Standard error=standard deviation between the wet chemistry and FTIR-PAS values divided by the square root of 2;W=washed after pretreatment; DW=pretreated with distilled water; TW=pretreated with tap water.
Table 6. Cellulose and hemicellulose compositions of RF-alkaline pretreated and non-treated biomass grind obtainedusing the traditional wet chemistry and FTIR-PAS methods
Cellulose predictive model:
1 2 3 4 5%C 28.63 48.60 35.83 51.71 29.24 37.16 X X X X X e= + + - - + + (2)
Where %C=%cellulose value, Xi=regressors/explanatory variables (normalized data based onthe respective characteristic peaks, as shown in Figure 1b), with the regressors representingthe respective wavelengths as 1431 (X1), 1373 (X2), 1338 (X3), 1319 (X4), and 1203 cm-1 (X5),37.16=intercept, and ε=error term/stochastic variable.
Hemicellulose predictive model:
1 2 3 4 5 6%H 14.25 90.42 34.14 39.18 71.17 122.90 30.42 X X X X X X e= - - + - + + + + (3)
%H=%hemicellulose wet chemistry value, Xi=regressors/explanatory variables (normalizeddata based on the respective characteristic peaks, as shown in Figure 1c), with the regressorsrepresenting the respective wavelengths as 1606 (X1), 1461 (X2), 1251 (X3), 1213 (X4), 1166 (X5),and 1050 cm-1 (X6), 30.42=intercept, and ε=error term/stochastic variable.
Ramesh and Singh (1993) [2] reported that barley straw theoretically contains about 40%cellulose, 20% hemicellulose, and 15% lignin. Marsden and Gray (1985) [52] also reported thatbarley straw theoretically contains about 44% cellulose, 27% hemicellulose, and 7% lignin.
Photoacoustic Spectroscopy in the Assessment of the Quantitative Composition of the Biomass — Barley Strawhttp://dx.doi.org/10.5772/59225
317

These values are comparable with the values obtained from the non-treated sample in thisinvestigation. It should be noted that the variance in the chemical composition between thereported theoretical values and the values obtained from this investigation may be attributedto differences in locations where the crop was grown, weather conditions, the barley varietygrown, and different methods of analysis.
4.5. Steam explosion treatment on lignin
The efficacy of FTIR-PAS techniques for studying changes in plant cell wall compositionfollowing steam explosion pretreatment has been evaluated. Table 7 shows that the SEpretreated samples have higher lignin content as compared to the non-treated. This may bedue to the carbonization of the sample resulting from the direct contact of biomass with thewalls of the reactor during the steam explosion pretreatment.
Temperature(oC)
Moisturecontent(%)*
Retention time(min)
Lignin (%)
Wet chemistry FTIR-PAS Standard error
Non-Treated - - 20.12 22.62 1.25
140 8 5 23.79 26.25 1.23
160 8 5 22.72 31.46 4.37
180 8 5 40.58 21.41 9.58
140 30 5 22.05 28.23 3.09
160 30 5 21.69 24.53 1.42
180 30 5 33.01 25.99 3.51
140 50 5 21.18 25.41 2.11
160 50 5 23.31 33.21 4.95
180 50 5 25.04 32.60 3.78
140 8 10 21.56 31.63 5.04
160 8 10 21.66 25.13 1.73
180 8 10 32.75 33.45 0.35
140 30 10 21.25 29.37 4.06
160 30 10 20.9 27.47 3.28
180 30 10 37.31 29.21 4.05
140 50 10 21 23.54 1.27
180 50 10 31.82 31.16 0.33
Standard error=standard deviation between the wet chemistry and FTIR-PAS values divided by the square root of 2; *=% mass fraction of water.
Table 7. Lignin composition of SE pretreated and non-treated biomass grind obtained using the traditional wetchemistry and FTIR-PAS methods
Biofuels - Status and Perspective318

Hemicellulose degrades easily and some volatile organic compounds vaporize as volatilecomponents, while cellulose behaves as a fixed carbon (solid combustible residue). This mayaccount for the increase in the lignin content. Lam et al. (2011) [18] investigated the steamexplosion of Douglas fir (Pseudotsuga menziesii) at a reaction temperature of 200-220oC and aretention time of 5-10 min. These researchers reported that there was increase in lignin contentfrom 30 to 43% attributed to the thermal degradation of hemicellulose during the steamexplosion treatment. Chen and Kuo (2011) [53] reported that cellulose and lignin are bothlocked in biomass from the mild carbonization process. This indicates that the degradedcellulose may appear as residue resulting to the increase in the lignin content.
The interaction between moisture content and temperature and also between retention timeand moisture content had a statistically significant effect (P<0.01) on the lignin. The interactionamong the three variables (moisture content, temperature, and retention time) also had asignificant effect on the lignin. The difference in the lignin values obtained using the FTIR-PASand the traditional approach may be attributed to the spectrum manipulations and theassumption that the reference lignin sample is 100% pure.
4.6. Steam explosion treatment on cellulose and hemicellulose
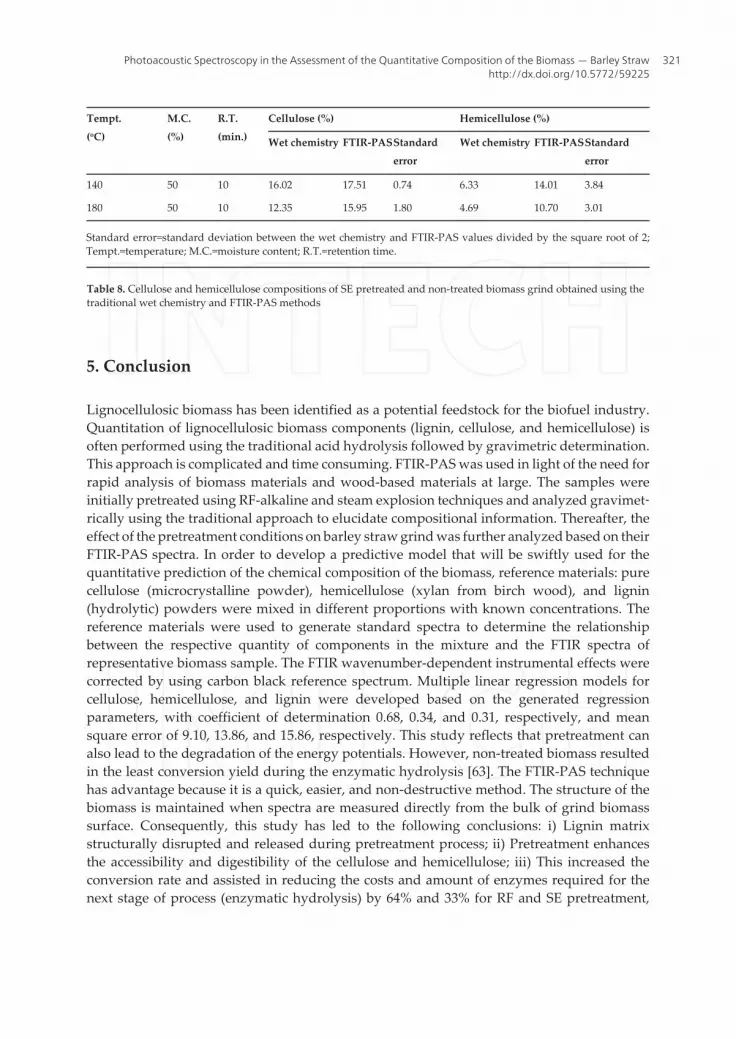
From Table 8, in comparison with the non-treated biomass, it is evident that retention time,moisture content, and temperature had a significant effect on the cellulose and hemicellulosecontent. The decrease in the sugars content increased at higher retention time and temperature.Wang et al. (2009) [54] also reported that the retention time and temperature are the processparameters required for the optimization of steam explosion process. In this present study,less degradation of the simple sugars was observed at higher moisture content. High feedstockmoisture content acts as acid catalyst to hydrolyze biomass during steam explosion. However,the direct contact of biomass with the walls of the reactor will limit and affect the extent of thehydrolysis. Therefore, a combination of carbonization and acid catalyzed hydrolysis occurredwhich ultimately led to the degradation of the simple sugars and increase in the lignin. Theobtained results from the wet chemistry demonstrated that the hemicellulose contained in thebiomass was highly degraded (79% to 89%) compared to cellulose (58% to 77%) as reported inchapter 4. The high degradation of hemicellulose was due to its amorphous nature, whichdegrades easily and evaporates as volatile components during the carbonization process.Presumably, the crystallinity of cellulose was responsible for the less degradation of thiscomponent. These degradations can be explained by considering the monomers of hemicel‐lulose and cellulose which consist primarily of sugars. Degradation of cellulose and hemicel‐lulose during steam explosion/thermal pretreatment of biomass has been reported by [16,19-20, 55-57]. It was reported that hemicellulose is very reactive and was nearly completelyremoved at 200oC, while both cellulose and lignin can be dissolved partially at higher tem‐peratures. Shaw (2008) [57] performed steam explosion on poplar and wheat straw at200-205oC, steam pressure of 1.66-1.73 MPa for 4-4.5 min. This author reported a decrease incellulose and hemicellulose content with an increase in the lignin content after the steamexplosion treatment of both biomass samples. Chen and Kuo (2011) [53, Yang et al. (2007) [59],and Khezami et al. (2007) [60] studied the effects of thermal process on biomass. These
Photoacoustic Spectroscopy in the Assessment of the Quantitative Composition of the Biomass — Barley Strawhttp://dx.doi.org/10.5772/59225
319
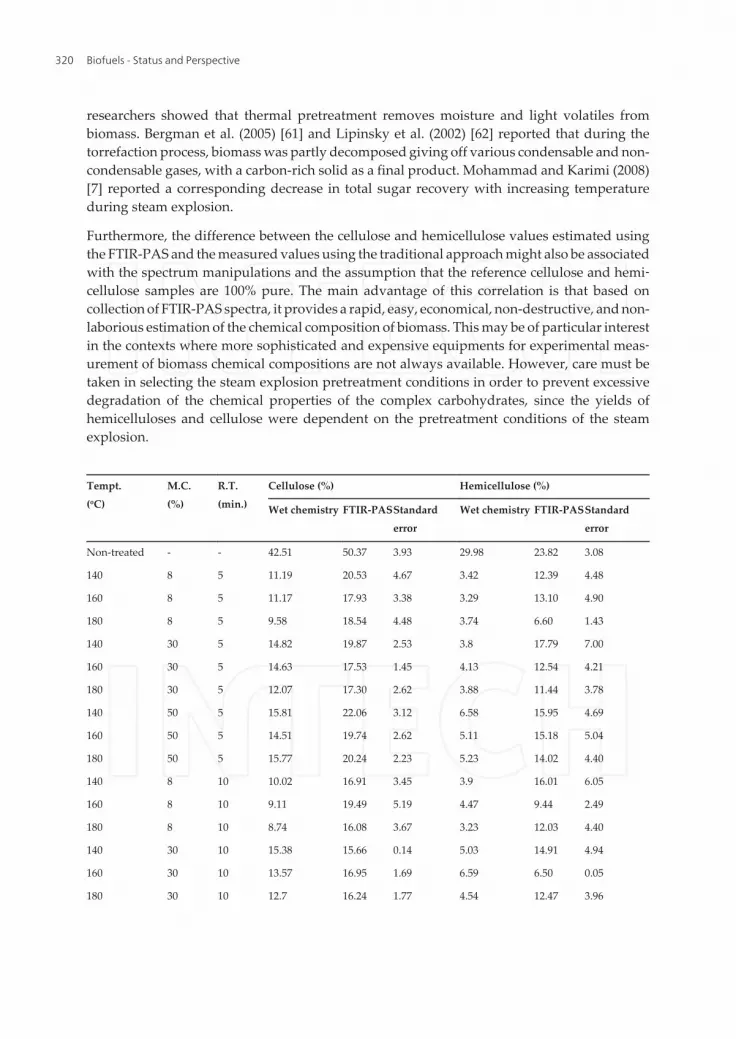
researchers showed that thermal pretreatment removes moisture and light volatiles frombiomass. Bergman et al. (2005) [61] and Lipinsky et al. (2002) [62] reported that during thetorrefaction process, biomass was partly decomposed giving off various condensable and non-condensable gases, with a carbon-rich solid as a final product. Mohammad and Karimi (2008)[7] reported a corresponding decrease in total sugar recovery with increasing temperatureduring steam explosion.
Furthermore, the difference between the cellulose and hemicellulose values estimated usingthe FTIR-PAS and the measured values using the traditional approach might also be associatedwith the spectrum manipulations and the assumption that the reference cellulose and hemi‐cellulose samples are 100% pure. The main advantage of this correlation is that based oncollection of FTIR-PAS spectra, it provides a rapid, easy, economical, non-destructive, and non-laborious estimation of the chemical composition of biomass. This may be of particular interestin the contexts where more sophisticated and expensive equipments for experimental meas‐urement of biomass chemical compositions are not always available. However, care must betaken in selecting the steam explosion pretreatment conditions in order to prevent excessivedegradation of the chemical properties of the complex carbohydrates, since the yields ofhemicelluloses and cellulose were dependent on the pretreatment conditions of the steamexplosion.
Tempt.(oC)
M.C.(%)
R.T.(min.)
Cellulose (%) Hemicellulose (%)
Wet chemistry FTIR-PASStandarderror
Wet chemistry FTIR-PASStandarderror
Non-treated - - 42.51 50.37 3.93 29.98 23.82 3.08
140 8 5 11.19 20.53 4.67 3.42 12.39 4.48
160 8 5 11.17 17.93 3.38 3.29 13.10 4.90
180 8 5 9.58 18.54 4.48 3.74 6.60 1.43
140 30 5 14.82 19.87 2.53 3.8 17.79 7.00
160 30 5 14.63 17.53 1.45 4.13 12.54 4.21
180 30 5 12.07 17.30 2.62 3.88 11.44 3.78
140 50 5 15.81 22.06 3.12 6.58 15.95 4.69
160 50 5 14.51 19.74 2.62 5.11 15.18 5.04
180 50 5 15.77 20.24 2.23 5.23 14.02 4.40
140 8 10 10.02 16.91 3.45 3.9 16.01 6.05
160 8 10 9.11 19.49 5.19 4.47 9.44 2.49
180 8 10 8.74 16.08 3.67 3.23 12.03 4.40
140 30 10 15.38 15.66 0.14 5.03 14.91 4.94
160 30 10 13.57 16.95 1.69 6.59 6.50 0.05
180 30 10 12.7 16.24 1.77 4.54 12.47 3.96
Biofuels - Status and Perspective320
Tempt.(oC)
M.C.(%)
R.T.(min.)
Cellulose (%) Hemicellulose (%)
Wet chemistry FTIR-PASStandarderror
Wet chemistry FTIR-PASStandarderror
140 50 10 16.02 17.51 0.74 6.33 14.01 3.84
180 50 10 12.35 15.95 1.80 4.69 10.70 3.01
Standard error=standard deviation between the wet chemistry and FTIR-PAS values divided by the square root of 2;Tempt.=temperature; M.C.=moisture content; R.T.=retention time.
Table 8. Cellulose and hemicellulose compositions of SE pretreated and non-treated biomass grind obtained using thetraditional wet chemistry and FTIR-PAS methods
5. Conclusion
Lignocellulosic biomass has been identified as a potential feedstock for the biofuel industry.Quantitation of lignocellulosic biomass components (lignin, cellulose, and hemicellulose) isoften performed using the traditional acid hydrolysis followed by gravimetric determination.This approach is complicated and time consuming. FTIR-PAS was used in light of the need forrapid analysis of biomass materials and wood-based materials at large. The samples wereinitially pretreated using RF-alkaline and steam explosion techniques and analyzed gravimet‐rically using the traditional approach to elucidate compositional information. Thereafter, theeffect of the pretreatment conditions on barley straw grind was further analyzed based on theirFTIR-PAS spectra. In order to develop a predictive model that will be swiftly used for thequantitative prediction of the chemical composition of the biomass, reference materials: purecellulose (microcrystalline powder), hemicellulose (xylan from birch wood), and lignin(hydrolytic) powders were mixed in different proportions with known concentrations. Thereference materials were used to generate standard spectra to determine the relationshipbetween the respective quantity of components in the mixture and the FTIR spectra ofrepresentative biomass sample. The FTIR wavenumber-dependent instrumental effects werecorrected by using carbon black reference spectrum. Multiple linear regression models forcellulose, hemicellulose, and lignin were developed based on the generated regressionparameters, with coefficient of determination 0.68, 0.34, and 0.31, respectively, and meansquare error of 9.10, 13.86, and 15.86, respectively. This study reflects that pretreatment canalso lead to the degradation of the energy potentials. However, non-treated biomass resultedin the least conversion yield during the enzymatic hydrolysis [63]. The FTIR-PAS techniquehas advantage because it is a quick, easier, and non-destructive method. The structure of thebiomass is maintained when spectra are measured directly from the bulk of grind biomasssurface. Consequently, this study has led to the following conclusions: i) Lignin matrixstructurally disrupted and released during pretreatment process; ii) Pretreatment enhancesthe accessibility and digestibility of the cellulose and hemicellulose; iii) This increased theconversion rate and assisted in reducing the costs and amount of enzymes required for thenext stage of process (enzymatic hydrolysis) by 64% and 33% for RF and SE pretreatment,
Photoacoustic Spectroscopy in the Assessment of the Quantitative Composition of the Biomass — Barley Strawhttp://dx.doi.org/10.5772/59225
321

respectively. This implies that the PA infrared spectra can be used for biofuel feedstockidentification and analysis of the chemical composition of biomass before it is processed. Thisinnovative approach could be easily adopted by the biofuel industry and extended to any formof lignocellulosic biomass feedstock.
Author details
Kingsley L. Iroba* and Tabil
*Address all correspondence to: [email protected]
Department of Chemical and Biological Engineering, University of Saskatchewan, Saska‐toon, Canada
References
[1] Pandey KK. A study of chemical structure of soft and hardwood and wood polymersby FTIR spectroscopy. Journal of Applied Polymer Science 1999;71: 1969-1975.
[2] Ramesh C.K, Singh A. Lignocellulose Biotechnology: Current and Future Prospects,Critical Review in Biotechnology 1993;13(2): 151-172.
[3] Iroba KL, Tabil LG. Lignocellulosic Biomass: Feedstock Characteristics, PretreatmentMethods and Pre-Processing for Biofuel and Bioproduct Applications, U.S. andCanadian Perspective. In: Zhang, B., Wang, Y. (Eds), Biomass Processing, Conversionand Biorefinery, New York: Nova Science Publishers, Inc.; 2013a pp. 61-98.
[4] Söderström J, Pilcher L, Galbe M, Zacchi G. Two-step steam pretreatment of soft‐wood by dilute H2SO4 impregnation for ethanol production. Biomass and Bioenergy2003;24(6): 475-486.
[5] Fan LT, Lee YH, Gharpuray MM. The nature of lignocellulosics and their pretreat‐ments for enzymatic hydrolysis. Advances in Biochemical Engineering/Biotechnolo‐gy 2006;23: 157-187.
[6] Chandra RP, Bura R, Mabee WE, Berlin A, Pan X, Saddler JN. Substrate pretreat‐ment: The key to effective enzymatic hydrolysis of lignocellulosics? Advances Bio‐chemical Engineering/Biotechnology 2007;108: 67-93.
[7] Mohammad JT, Karimi K. Pretreatment of Lignocellulosic Wastes to Improve Etha‐nol and Biogas Production: A Review in International Journal of Molecular Sciences2008;9: 1621-1651.
Biofuels - Status and Perspective322

[8] Iroba KL, Tabil LG, Dumonceaux T, Baik OD. Effect of alkaline pretreatment onchemical composition of lignocellulosic biomass using radio frequency heating. Bio‐systems Engineering 2013b;116: 385-398.
[9] Iroba KL, Tabil LG, Sokhansanj S, Dumonceaux T. Pretreatment and fractionation ofbarley straw using steam explosion at low severity factor. Biomass and Bioenergy2014a; 66: 286-300.
[10] Iroba KL, Tabil LG, Sokhansanj S, Meda V. Pelleting characteristics of radio frequen‐cy and steam explosion pretreated barley straw. Int. J. Agric. Biol. Eng. 7(3): 68-82lignocellulosic materials. Critical Reviews in Biotechnology 2014b;3(3): 235-276.
[11] Piyasena P, Dussault C, Koutchma T, Ramaswamy HS, Awuah GB. Radio frequencyheating of foods: principles applications and related properties. Critical Reviews inFood Science and Nutrition 2003;43(6): 587-606.
[12] Izadifar M, Baik OD Mittal GS. Radio frequency-assisted extraction of podophyllotox‐in: Prototyping of packed extraction reactors and experimental observations. Chemi‐cal Engineering and Processing 2009;48: 1437-1444.
[13] Balakrishnan PA, Vedaraman N, Sunder VJ, Muralidharan C, Saminathan G. Radiofrequency heating-prospective leather drying system for future. Drying Technology2004;22: 1969-1982.
[14] Allison GG, Thain SC, Morris P, Morris C, Hawkins S, Hauck B, Barraclough T, YatesN, Shield I, Bridgwater AV, Donnison IS. Quantification of hydroxycinnamic acidsand lignin in perennial forage and energy grasses by Fourier-transform infraredspectroscopy and partial least squares regression. Bioresource Technology 2009; 100:1252-1261
[15] Brausi M, Castagnetti G, Gavioli M, Peracchia G, de Luca G, Olmi R. Radio frequencyablation of renal tumours does not produce complete tumour destruction: results of aphase II study. European Urology Supplements 2004;3: 14-17.
[16] Toussaint B, Excoffier G, Vignon MR. Effect of steam explosion treatment on thephysico-chemical characteristics and enzymic hydrolysis of poplar cell wall compo‐nents. Animal Feed Science and Technology 1991;32: 235-242.
[17] Mosier N, Wyman C, Dale B, Elander R, Lee YY, Holtzapple M, Ladisch M. Featuresof promising technologies for pretreatment of lignocellulosic biomass. BioresourceTechnology 2005;96: 673-686.
[18] Lam PS, Sokhansanj S, Bi X, Lim CJ, Melin S. Energy Input and Quality of PelletsMade from Steam-Exploded Douglas Fir (Pseudotsuga menziesii). Energy and Fuels2011;25: 1521-1528.
[19] Excoffier G, Peguy A, Rinaudo M, Vignon MR. Evolution of lignocellulosic compo‐nents during steam explosion. Potential applications. In Focher B, Marzetti A, andCrescenzi V (Eds), Proceedings of the international workshop on steam explosion
Photoacoustic Spectroscopy in the Assessment of the Quantitative Composition of the Biomass — Barley Strawhttp://dx.doi.org/10.5772/59225
323

techniques: Oct 20-21, Milan Italy. Philadelphia (PA): Gordon and Breach;1991. Fun‐damentals and Industrial Application 1988;83-95.
[20] Ferro T, Torres A, Soler PB, Zanzi RD. Biomass Torrefaction. 2nd World Conferenceon Biomass for Energy, Industry and Climate Protection, 10-14 May 2004. Palazzo deiCongressi, Rome, Italy, Ed. by: Van Swaaij, Fjällström, Helm, Grassi, ISBN88-89407-04-2, ISBN 3-936338-16-7, ETA-Florence and WIP-Munich, 2004; p 859-862.
[21] Adapa PK, Tabil LG, Schoenau GJ, Canam T, Dumoneaux T. Quantitative Analysis ofLignocellulosic Components of Non-Treated and Steam Exploded Barley, Canola,Oat and Wheat Straw Using Fourier Transform Infrared Spectroscopy. Journal Agri‐cultural Science and Technology 2011;1: 177-188.
[22] Gordon GA. Application of fourier transform mid-infrared spectroscopy (FTIR) forresearch into biomass feed-stocks. In: Chapter 4, Fourier transforms-new analyticalapproaches and FTIR strategies. ed. Nikolic, G. ISBN 978-953-307-232-6. Intech 2011;p 71-88. http://www.intechopen.com/books/fourier-transforms-new-analytical-ap‐proaches-and-ftir-strategies (accessed 12 March 2014).
[23] Diem M, Romeo M, Matthaus C, Miljkovic M, Miller L, Lasch P. Comparison of Four‐ier transform infrared (FTIR) spectra of individual cells acquired using synchrotronand conventional sources. Infrared Physics and Technology 2004;45: 331-338.
[24] Huang RY, Miller LM, Carlson CS, Chance MR. In situ chemistry of osteoporosis re‐vealed by synchrotron infrared microspectroscopy. Bone 2003;33: 514-521.
[25] Allison GG. Application of Fourier Transform Mid-Infrared Spectroscopy (FTIR) forResearch into Biomass Feed-Stocks. Fourier Transforms-New Analytical Approachesand FTIR Strategies, chapter 4. Goran Nikolic, ISBN 978-953-307-232-6, Intech 2011;71-88.
[26] Stewart D, Wilson HM, Hendra PJ, Morrison IM. Fourier-transform infrared andraman spectroscopic study of biochemical and chemical treatments of oak wood(Quercus rubra) and barley (Hordeum vulgare) straw. Journal of Agricultural and FoodChemistry 1995;43: 2219-2225.
[27] Robert p, Marquis M, Barron C, Guillon F, Saulnier L. FT-IR investigation of cell wallpolysaccharides from cereal grains, arabinoxylan infrared assignment, Journal of Ag‐ricultural Food and Chemistry 2005;53: 7014-7018.
[28] Yu P. Molecular chemistry imaging to reveal structural features of various plant feedtissues. Journal of Structural Biological 2005;150: 81-89.
[29] Sluiter A, Hames B, Ruiz R, Scarlata C, Sluiter J, Templeton D, Crocker D. NationalRenewable Energy Laboratory, Laboratory Analytical Procedure (LAP). Determina‐tion of Structural Carbohydrates and Lignin in Biomass, Technical Report NREL/TP-510-42618 2007.
Biofuels - Status and Perspective324
[30] Michaelian KH. Photoacoustic Infrared Spectroscopy: instrumentation, applicationsand data analysis. John Wiley & Sons publication, 2003; Vol 159.
[31] Shaw M, Meda V, Tabil LG, Opoku A. Drying and color characteristics of corianderfoliage using convective thin layer and microwave drying. Journal of MicrowavePower and Electromagnetic Energy 2007;41: 41-65.
[32] Gurnagul N, St-Germain FGT, Gray DGC. PA FTIR measurements on paper. Journalof pulp and Paper Science 1986;12: J156 – J159.
[33] McClelland JF, Jones RW, Bajic SJ. FTIR Photoacoustics spectroscopy in: J.M. Chalm‐ers, P.R. Griffiths (Eds.), Handbook of Vibrational Spectroscopy, John Wiley & Sons,Ltd. 2002.;Vol. 2.
[34] McClelland JF, Jones RW, Luo S, Seaverson LM. A practical Guide to FTIR Photoa‐coustic Spectroscopy. MTEC Photoacoustics, Inc., CRC Press, Ames, IA, USA. 1992.
[35] Stuart B. Biological applications of Infrared Spectroscopy. John Wiley & Sons, Chi‐chester, 1997;32-33.
[36] St Germain FGT, Gray DG. Photoacoustic Fourier Transform Infrared SpectroscopicStudy of Mechanical Pulp Brightening. Journal of Wood Chemistry and Technology1987;7: 33-50.
[37] Himmelsbach DS, Akin DE. Near-infrared–fourier-transform-raman spectroscopy offlax (Linum usitatissimum L.) stems. Journal of Agricultural and Food Chemistry1998;46: 991-998.
[38] Colthup NB, Daly LH, Wiberley SE. Introduction to Infrared and Raman Spectrosco‐py, 3rd ed., Boston, Academic Press, MA. 1990.
[39] Yu P, Block H, Niu Z, Doiron K. Rapid characterization of molecular chemistry, nu‐trient make-up and microlocation of internal seed tissue. Journal of Synchrotron Ra‐diation 2007;14: 382-390.
[40] Revol JF. On the cross-sectional shape of cellulose crystallites in valonia ventricosa.Carbohydrate Polymers 1982;2:123-134.
[41] Sun XF, Xu F, Sun RC, Fowler P, Baird MS. Characteristics of degraded cellulose ob‐tained from steam-exploded wheat straw. Carbohydrate Research 2005;340: 97-106.
[42] Budevska BO. in: J.M. Chalmers, P.R. Griffiths (Eds.), Handbook of Vibrational Spec‐troscopy, Vol. 5, John Wiley and Sons, New York. 2002; pp. 3720-3732.
[43] Schulz H, Baranska M. Identification and quantification of valuable plant substancesby ir and raman spectroscopy. Vibrational Spectroscopy 2007;43: 13-25.
[44] Wetzel DL, Eilert AJ, Pietrzak LN, Miller SS, Sweat JA. Ultraspatially-resolved syn‐chrotron infrared microspectroscopy of plant tissue in situ. Cellular and MolecularBiology 1998;44: 145-167.
Photoacoustic Spectroscopy in the Assessment of the Quantitative Composition of the Biomass — Barley Strawhttp://dx.doi.org/10.5772/59225
325
[45] Xu F, Sun JX, Geng ZC, Liu CF, Ren JL, Sun RC, Fowler P. Baird MS. Comparativestudy of water-soluble and alkali-soluble hemicelluloses from perennial ryegrassleaves (Lolium peree). Carbohydrate Polymers 2007;67: 56-65.
[46] Nlewem KC, Thrash ME. Jr. Comparison of different pretreatment methods based onresidual lignin effect on the enzymatic hydrolysis of switchgrass. Bioresource Tech‐nology 2010;101: 5426-5430.
[47] Fan LT, Gharpuray MM, Lee YH. Cellulose Hydrolysis Biotechnology Monographs.Springer, Berlin, 1987; p. 57.
[48] Sun Y, Cheng JJ. Hydrolysis of lignocellulosic materials for ethanol production: A re‐view. Bioresource Technology 2002;83(1): 1-11.
[49] Kumar P, Barrett DM, Delwiche MJ, Stroeve P. Methods for pretreatment of lignocel‐lulosic biomass for efficient hydrolysis and biofuel production. Industrial and Engi‐neering Chemistry Research 2009.48, 3713-3729.
[50] Xu J, Cheng JJ, Sharma-Shivappa RR, Burns JC. Sodium Hydroxide Pretreatment ofSwitchgrass for Enzymatic Saccharification Improvement. 2009 ASABE Annual Inter‐national Meeting, Paper Number: 096062, June 21 – June 24, Nevada. 2009.
[51] Silverstein RA, Chen Y, Sharma-Shivappa RR, Boyette MD, Osborne J. A comparisonof chemical pretreatment methods for improving saccharification of cotton stalks. Bi‐oresource Technology 2007;98: 3000-3011.
[52] Marsden WL, Gray PP, Mandels M. Enzymatic hydrolysis of cellulose in lignocellu‐losic materials. CRC Critical Reviews in Biotechnology 1985;3(3): 235-276.
[53] Chen WH, Kuo PC. Torrefaction and co-torrefaction characterization of hemicellu‐lose, cellulose and lignin as well as torrefaction of some basic constituents in bio‐mass. Energy 2011;36: 803-811.
[54] Wang K, Jiang JX, Xu F, Sun RC. Influence of steaming explosion time on the physi‐co-chemical properties of cellulose from Lespedeza stalks (Lespedeza crytobotrya). Biore‐soure Technology 2009;100: 5288-5294.
[55] Yan W, Acharjee TC, Coronella CJ, Va´squez VR. Thermal Pretreatment of Lignocel‐lulosic Biomass. Environmental Progress Sustainability Energy 2009;(28)3: 435-440.
[56] Chen WH, Kuo PC. A study on torrefaction of various biomass materials and its im‐pact on lignocellulosic structure simulated by a thermogravimetry. Energy 2010; 35:2580-2586.
[57] Heitz M, Capek-Menard E, Koeberle PG, Gagne J, Chornet E, Overend RP, et al. Frac‐tionation of Populus tremuloides at the Pilot Plant Scale: Optimization of Steam Pre‐treatment Conditions using the STAKE II Technology. Bioresource Technology1991;35: 23-32.
Biofuels - Status and Perspective326

[58] Shaw MD. Feedstock and process variables influencing biomass densification. M.Sc.Unpublished dissertation submitted to Department of Agricultural and BioresourceEngineering Department, University of Saskatchewan, Canada; 2008.
[59] Yang H, Yan R, Chen H, Lee DH, Zheng C. Characteristics of hemicellulose, celluloseand lignin pyrolysis. Fuel 2007;86:1781-8.
[60] Khezami L, Chetouani A, Taouk B, Capart R. Production and characterization of acti‐vated carbon from wood components in powder: cellulose, lignin, xylan. PowderTechnology 2005;157: 48-56.
[61] Bergman PCA, Boersma AR, Zwart RWH, Kiel JHA. Torrefaction for biomass co-fir‐ing in existing coal-fired power stations “biocoal”; Energy Research Centre of theNetherlands; 2005, Jul. 71 p. Report No.: ECN-C-05-013. 2005.
[62] Lipinsky ES, Arcate JR, Reed TB. Enhanced wood fuels via torrefaction. Fuel ChemistDivision Preparation 2002;47(1): 408-410.
[63] Iroba KL, Tabil LG, Dumonceaux T, Sokhansanj S. Enzymatic saccharification of ra‐dio frequency alkaline pretreated and non-treated lignocellulosic biomass barleystraw. Paper No. CSBE13-016. 2013 Conference for Interdisciplinary Engineering andCSBE/SCGAB AGM, University of Saskatchewan, Saskatoon; 2013.
Photoacoustic Spectroscopy in the Assessment of the Quantitative Composition of the Biomass — Barley Strawhttp://dx.doi.org/10.5772/59225
327