Real-time monitoring of high-intensity focused ultrasound ablations with photoacoustic technique
Upload
khangminh22Category
view
1download
0
Western University Western University
Scholarship@Western Scholarship@Western
Electronic Thesis and Dissertation Repository
12-6-2017 2:00 PM
Intraoperative Photoacoustic Imaging of Breast Cancer Intraoperative Photoacoustic Imaging of Breast Cancer
Ivan Kosik, The University of Western Ontario
Supervisor: Jeffrey Carson, The University of Western Ontario
A thesis submitted in partial fulfillment of the requirements for the Doctor of Philosophy degree
in Medical Biophysics
© Ivan Kosik 2017
Follow this and additional works at: https://ir.lib.uwo.ca/etd
Part of the Translational Medical Research Commons
Recommended Citation Recommended Citation Kosik, Ivan, "Intraoperative Photoacoustic Imaging of Breast Cancer" (2017). Electronic Thesis and Dissertation Repository. 5147. https://ir.lib.uwo.ca/etd/5147
This Dissertation/Thesis is brought to you for free and open access by Scholarship@Western. It has been accepted for inclusion in Electronic Thesis and Dissertation Repository by an authorized administrator of Scholarship@Western. For more information, please contact [email protected].
Abstract
Breast cancer is one of the most common cancers to affect women, presenting a lifetime risk of 1 in 8.
Treatment of stage 1 and 2 cancers usually involves breast conserving surgery (BCS). The goal of BCS is
to remove the entire tumour with a surrounding envelope of healthy tissue, referred to as a negative
margin. Unfortunately, up to 50% of surgeries fail to remove the whole tumour. To minimize the risk of
cancer recurrence, a second surgery, must therefore be performed. Currently, there is no widely accepted
intraoperative tool to significantly mitigate this problem. Employed systems are usually based on
imaging, such as x-ray or ultrasonography. Unfortunately, sensitivity and specificity deficits, especially
related to breast density, reduce the effectiveness of these methods. Photoacoustic tomography (PAT) is a
relatively new imaging modality which uses safe near-infrared laser illumination to generate 3-D images
of soft tissues to a depth of up to several cm. We used a custom designed and built intraoperative PAT
system, called iPAT, to perform a 100 patient study on freshly excised breast lumpectomy specimens
within the surgical setting. The system enabled the evaluation of tumour extent, shape, morphology and
position within lumpectomy specimens measuring up to 11 cm in diameter. Scan results were used to
compare iPAT-derived tumour size to the gold-standard pathologic examination, and when available, to
x-ray, ultrasonography and DCE-MRI. Imaging results were also used to classify specimen margins as
close or wide, and positive predictive values (PPV), negative predictive values (NPV), sensitivity and
specificity were then calculated to estimate the effectiveness of the iPAT system at predicting
lumpectomy margin status. With a close margin prevalence of 35%, the PPV, NPV, sensitivity and
specificity of iPAT were found to be 71%, 83%, 69%, and 84%, respectively. Information provided by
the iPAT system identified 9 out of the 12 positive specimens, potentially reducing the positive margin
rate by 75%. Contrary to expected photoacoustic contrast mechanisms, iPAT images of hemoglobin
distribution correlated poorly with US and X-ray tumour imaging, while hypo-intense regions in lipid-
weighted iPAT images were in excellent agreement.
Keywords: Breast cancer, Photoacoustic imaging, Breast conserving surgery, Intraoperative imaging,
Surgical guidance, Tumour volume, Tumour diameter, Lumpectomy margins
ii
Co-Authorship
The contribution by other authors to the work in Chapters 2, 3, and 4 is described here. Also the
contribution to the work in Appendices 1 and 2 is included.
Chapter 2: Ivan Kosik, Muriel Brackstone, Anat Kornecki, Astrid Chamson-Reig, Philip Wong,
Morteza Haydari Araghi, and Jeffrey J.L. Carson. “Intraoperative photoacoustic tomography (iPAT)
of breast cancer: a novel imaging instrument and preliminary results”,
In preparation for submission to Journal of Biomedical Optics.
Dr. Brackstone provided access to freshly excised lumpectomy specimens and contributed to
discussion from surgical perspective. Dr. Kornecki provided interpretation of conventional
imaging results from a radiologist perspective. Dr. Chamson-Reig facilitated project
management and helped out with technical intraoperative tasks. Mr. Wong developed software
for image co-registration and reconstruction in Matlab. Mr. Araghi provided software
development in Labview. Dr. Carson provided general project supervision, aided with software
and hardware expertise and manuscript editing. I designed and constructed the portable iPAT
system, performed the experiments, performed intraoperative imaging, analyzed the data and
wrote the manuscript.
Chapter 3: Ivan Kosik, Muriel Brackstone, Anat Kornecki, Astrid Chamson-Reig, Philip Wong,
Morteza Haydari Araghi, and Jeffrey J.L. Carson. “Comparison of breast tumor size by
intraoperative photoacoustic tomography, magnetic resonance imaging and pathology”,
In preparation for submission to Annals of Surgery.
Dr. Brackstone provided access to freshly excised lumpectomy specimens and contributed to
discussion from surgical perspective. Dr. Kornecki provided interpretation of conventional
imaging results from a radiologist perspective. Dr. Chamson-Reig facilitated project
management and helped out with technical intraoperative tasks. Mr. Wong developed software
for image co-registration and reconstruction in Matlab. Mr. Araghi provided software
development in Labview. Dr. Carson provided general project supervision, aided with software
and hardware expertise and manuscript editing. I designed and constructed the portable iPAT
system, performed the experiments, performed intraoperative imaging, analyzed the data and
wrote the manuscript.
Chapter 4: Ivan Kosik, Muriel Brackstone, Anat Kornecki, Astrid Chamson-Reig, Philip Wong,
Morteza Haydari Araghi, and Jeffrey J.L. Carson. “Intraoperative photoacoustic imaging of breast
cancer: a new perspective on malignancy visualization and surgical guidance”,
In preparation for submission to Nature Medicine.

iii
Dr. Brackstone provided access to freshly excised lumpectomy specimens and contributed to
discussion from surgical perspective. Dr. Kornecki provided interpretation of conventional
imaging results from a radiologist perspective. Dr. Chamson-Reig facilitated project
management and helped out with technical intraoperative tasks. Mr. Wong developed software
for image co-registration and reconstruction in Matlab. Mr. Araghi provided software
development in Labview. Dr. Carson provided general project supervision, aided with software
and hardware expertise and manuscript editing. I designed and constructed the portable iPAT
system, performed the experiments, performed intraoperative imaging, analyzed the data and
wrote the manuscript.
Appendix 1. Ivan Kosik, Jeffrey JL Carson, “Reat-time Multispectral Imaging of Blood Phantoms” SPIE
Annual Meeting Symposium on Biomedical Optics, 2013.
Dr. Carson provided general project supervision, aided with software and hardware expertise and
manuscript editing. I designed and constructed the multispectral photoacoustic system,
performed the experiments, analyzed the data and wrote the manuscript.
Appendix 2. Ivan Kosik, Jeffrey JL Carson. “Combined 3D photoacoustic and 2D fluorescence
imaging of indocyanine green contrast agent flow.” SPIE Annual Meeting Symposium on
Biomedical Optics, 2013.
Dr. Carson provided general project supervision, aided with software and hardware expertise and
manuscript editing. I designed and constructed the multispectral photoacoustic system,
performed the experiments, analyzed the data and wrote the manuscript.
iv
Acknowledgements
The work completed over the course of my PhD studies would not have been possible without the
support, encouragement and dedication of numerous people.
First of all, many thanks are owed to my supervisor, Jeff. While you were an amazing supervisor and a
friend, you were really much more than that. The atmosphere that you established in the lab, and
generally during all activities, nurtured the creativity and free thinking that great research so strongly
depends on. Our regular brain-storming sessions, especially in the first years of my PhD, opened my
mind up to a new way of looking at old problems and significantly contributed to many of the vitally
needed breakthroughs.
Astrid, as the project coordinator/manager, you somehow always managed to guide me to the dim light at
the end of that long dark chaotic tunnel. As a friend, for all the long days, early mornings and late nights,
especially surgery days, thank you.
Part of the challenge of this project was the need for a broad range of highly specialized skill sets,
including technical as well as clinical. To Muriel, for your surgical expertise and patience while we
worked out the bugs in the system, thank you. To Anat, for your time and guidance in image
interpretation from a radiologist’s perspective, many thanks. To Phil, your perseverance in working out a
suitable image reconstruction approach is much appreciated.
The financial needs of this project were great and I would like to thank the many faces behind support
provided by the Western Graduate Scholarship (WGRS), the Translational Breast Cancer Research Unit
(TBCRU), the Canadian Institutes of Health Research (CIHR) and the Ontario Graduate Scholarship
(OGS).
I would also like to thank my family and friends. To Starka, Mamka, Tony, sisters and brother, for a
seemingly inexhaustible display of pride for every one of my successes, no matter how small. You made
me believe in myself.
And finally, to my beautiful wife Melissa. I know you didn’t sign up for raising two amazing boys while I
tackled a PhD. Thank you for supporting me on this uncertain journey while gracefully putting up with
my stress-induced fits. I dedicate this work to your dad, Sam, for instilling in you his calm, cool
demeanor and enduring strength of character.
v
Table of Contents
Abstract .......................................................................................................................................................... i
Co-Authorship............................................................................................................................................... ii
Acknowledgements ...................................................................................................................................... iv
List of Figures ............................................................................................................................................... x
List of Tables ............................................................................................................................................ xvii
List of Appendices ................................................................................................................................... xviii
List of Abbreviations ................................................................................................................................. xix
Chapter 1: Introduction ................................................................................................................................. 1
1.1 Background ......................................................................................................................................... 1
1.1.1 Cancer overview .......................................................................................................................... 1
1.1.2 The breast and breast cancer ........................................................................................................ 1
1.1.3 Breast cancer screening, diagnosis and staging ........................................................................... 4
1.1.4 Breast conserving surgery and lesion localization techniques ..................................................... 5
1.2 Clinical breast cancer imaging and surgical guidance ........................................................................ 7
1.2.1 Diagnostic and preoperative in vivo imaging .............................................................................. 7
1.2.2 Intraoperative ex-vivo specimen imaging .................................................................................... 9
1.2.3 Intraoperative lumpectomy specimen examination ................................................................... 11
1.2.4 Postoperative lumpectomy specimen histopathological examination ........................................ 11
1.3 Emerging breast cancer imaging techniques and surgical guidance ................................................. 12
1.3.1 Optical in vivo breast cancer imaging ........................................................................................ 14
1.3.2 Optical ex-vivo breast cancer imaging ....................................................................................... 15
1.3.3 New approaches to intraoperative lumpectomy specimen examination .................................... 17
1.4 Photoacoustic imaging ...................................................................................................................... 18
1.4.1 Principles of photoacoustic imaging .......................................................................................... 20
1.4.2 Optimizing photoacoustic imaging system design ..................................................................... 26
1.4.3 In vivo photoacoustic breast imaging ........................................................................................ 27
1.4.4 Ex vivo photoacoustic imaging of breast cancer ........................................................................ 30
1.5 Motivation and Objectives ................................................................................................................ 31
1.6 References ........................................................................................................................................ 34
Chapter 2: Intraoperative photoacoustic tomography (iPAT) of breast cancer: a novel imaging instrument
and preliminary results ................................................................................................................................ 40
2.1 Introduction ....................................................................................................................................... 40
2.1.1 Overview .................................................................................................................................... 40
vi
2.1.2 Objectives .................................................................................................................................. 42
2.2 Materials and methods ...................................................................................................................... 42
2.2.1 The iPAT imaging system .......................................................................................................... 42
2.2.2 The PA array, calibration, illumination, and scan synergy ........................................................ 44
2.2.3 Image reconstruction, image stitching, co-registration and resolution ...................................... 45
2.2.4 iPAT imaging of ex-vivo tissue ................................................................................................. 47
2.2.5 Lumpectomy specimen collection and preparation .................................................................... 47
2.3 Results ............................................................................................................................................... 48
2.3.1 Image reconstruction, stitching, and system resolution ............................................................. 48
2.3.2 iPAT imaging of ex-vivo tissue ................................................................................................. 50
2.3.3 iPAT imaging of freshly excised lumpectomies ........................................................................ 51
2.4 Discussion ......................................................................................................................................... 59
2.4.1 Lipid vs hemoglobin in ex vivo applications ............................................................................. 59
2.4.2 Enabling intraoperative surgical intervention ............................................................................ 60
2.4.3 System resolution and scan speed .............................................................................................. 61
2.5. Conclusion ....................................................................................................................................... 62
2.6. References ........................................................................................................................................ 62
Chapter 3: Comparison of breast tumor size by intraoperative photoacoustic tomography, magnetic
resonance imaging and pathology ............................................................................................................... 66
3.1 Introduction ....................................................................................................................................... 66
3.1.1 Overview .................................................................................................................................... 66
3.1.2 Objectives .................................................................................................................................. 69
3.2. Materials and Methods ..................................................................................................................... 69
3.2.1 iPAT Scans and patient selection ............................................................................................... 69
3.2.2 iPAT Image Volume Reconstruction and Processing ................................................................ 71
3.2.3 Volumetric segmentation and maximum diameter measurements of iPAT results ................... 72
3.2.4 Statistical Analysis ..................................................................................................................... 73
3.2.5 Tumor-contrast spectral dependence.......................................................................................... 74
3.2.6 Breast density dependence ......................................................................................................... 74
3.2.7 MR imaging and pathology ........................................................................................................ 75
3.3 Results ............................................................................................................................................... 75
3.3.1 iPAT Scans and patient selection ............................................................................................... 75
3.3.2 iPAT Image Volume Reconstruction and Processing ................................................................ 76
3.3.3 Volumetric segmentation and maximum diameter measurements ............................................ 80
3.3.4 Statistical Analysis ..................................................................................................................... 82
3.3.5 Tumor-contrast spectral dependence.......................................................................................... 85
vii
3.3.6 Dependence of tumour contrast on breast density ..................................................................... 88
3.4 Discussion and future directions ....................................................................................................... 93
3.4.1 Comparison of breast tumor measurements by iPAT, DCE-MRI and pathology ...................... 93
3.4.2 Effect of lumpectomy holder on measurements ......................................................................... 94
3.4.3 Participant and lesion characteristics ......................................................................................... 95
3.4.4 Image reconstruction and processing ......................................................................................... 96
3.4.5 Shadowing artefacts ................................................................................................................... 97
3.4.6 Breast density dependence ......................................................................................................... 98
3.4.7 Tumor-contrast spectral dependence.......................................................................................... 98
3.5 Conclusion ........................................................................................................................................ 99
3.6 References ....................................................................................................................................... 100
Chapter 4: Intraoperative photoacoustic imaging of breast cancer: a new perspective on malignancy
visualization and surgical guidance .......................................................................................................... 103
4.1 Introduction ..................................................................................................................................... 103
4.1.1 Overview .................................................................................................................................. 103
4.1.2 Objectives ................................................................................................................................ 108
4.2 Materials and Methods .................................................................................................................... 108
4.2.1 Imaging system, image reconstruction, and intraoperative protocol ....................................... 108
4.2.2 Patient selection ....................................................................................................................... 111
4.2.3 Lesion maximum diameters comparison to pathology and Statistical Analysis ...................... 112
4.2.4 Lesion localization and iPAT predictive values ....................................................................... 112
4.2.5 Areolar invasion, DCIS, breast density dependence and positive margin investigation .......... 115
4.3 Results ............................................................................................................................................. 115
4.3.1 Imaging system and intraoperative protocol ............................................................................ 115
4.3.2 Patients and clinical information .............................................................................................. 116
4.3.3 Lesion localization and iPAT predictive values ....................................................................... 116
4.3.4 Lesion maximum diameter comparison to pathology and statistical analysis ......................... 119
4.3.5 Areolar invasion, DCIS and positive margin investigation ...................................................... 122
4.4 Discussion and future directions ..................................................................................................... 130
4.4.1 Predictive values and potential clinical impact of iPAT .......................................................... 130
4.4.2 Lesion maximum diameter comparison to pathology and Statistical Analysis........................ 131
4.4.3 Influence of scanning geometry: “fast” vs transmission-mode ................................................ 132
4.4.4 Case studies .............................................................................................................................. 133
4.4.5 iPAT system and intraoperative protocol ................................................................................. 135
4.5 Conclusion ...................................................................................................................................... 135
viii
4.6 References ....................................................................................................................................... 136
Chapter 5: Discussion and future outlook ................................................................................................. 141
5.1 Theoretical considerations and future directions ............................................................................ 141
5.1.1 Lipids vs Hemoglobin in ex-vivo breast tumour imaging........................................................ 141
5.1.2 Optimizing wavelength selection for tissue discrimination ..................................................... 143
5.2 Clinical considerations and future outlook ..................................................................................... 145
5.2.1 iPAT as an intraoperative specimen analyzer .......................................................................... 145
5.2.2 iPAT breast tumour size assessment ........................................................................................ 146
5.2.3 iPAT margin evaluation ........................................................................................................... 147
5.2.4 Potential for in-vivo applications ............................................................................................. 148
5.3 iPAT system technical improvements ............................................................................................. 148
5.3.1 Tissue illumination and imaging artefacts ............................................................................... 149
5.3.2 PA signal detection and scan speed ......................................................................................... 150
5.3.3 Sample immobilization ............................................................................................................ 151
5.4 Conclusions ..................................................................................................................................... 151
5.5 References ....................................................................................................................................... 153
Appendix 1: Real-Time Multispectral 3-D Photoacoustic Imaging of Blood Phantoms ........................... 155
A1.1 Introduction .................................................................................................................................. 155
A1.1.1 Background ........................................................................................................................... 155
A1.1.2 Motivation and Approach ..................................................................................................... 156
A1.2. Methods ....................................................................................................................................... 157
A1.2.1 Multispectral photoacoustic imaging system ........................................................................ 157
A1.2.2 System set-up and operation ................................................................................................. 159
A1.2.3 Image Reconstruction ............................................................................................................ 161
A1.2.4 Multispectral photoacoustic imaging .................................................................................... 162
A1.3 Results and Discussion ................................................................................................................. 163
A1.4 Conclusion ................................................................................................................................... 166
A1.5 Acknowledgements ...................................................................................................................... 166
A1.6 References .................................................................................................................................... 166
Appendix 2: Combined 3D photoacoustic and 2D fluorescence imaging of indocyanine green contrast
agent flow .................................................................................................................................................. 167
A2.1 Introduction .................................................................................................................................. 167
A2.1.1 Background .......................................................................................................................... 167
A2.1.2 Motivation ............................................................................................................................ 168
A2.1.3 Objective and approach ......................................................................................................... 169
A2.2 Methods ........................................................................................................................................ 169
ix
A2.2.1 Imaging System ..................................................................................................................... 169
A2.2.2 Image Reconstruction .......................................................................................................... 170
A2.2.3 Imaging Tasks ...................................................................................................................... 173
A2.3. Results ......................................................................................................................................... 174
A2.4. Discussion .................................................................................................................................. 176
A2.5. Conclusion .................................................................................................................................. 170
A2.6. Acknowledgements ..................................................................................................................... 171
A2.7. References ................................................................................................................................... 171
Curriculum Vitae ...................................................................................................................................... 169
x
List of Figures
Figure 1.1. Female breast anatomy. (1) Subcutaneous fat, (2) pectoralis muscle, (3) lobules organized
into larger lobes, (4) nipple, (5) areola, (6) branching ducts, (7) suspensory ligaments. (Adapted from 3) .. 2
Figure 1.2. Possible outcomes of breast conserving surgery. (a) The tumour tissue is enclosed in a
continuous envelope of normal tissue, indicating a lumpectomy specimen with negative margin. (b)
Specimen with positive margin. The margin is clearly invaded by tumour tissue. ...................................... 6
Figure 1.3. Example of an intraoperative lumpectomy specimen transmission X-ray image, or radiograph.
The image clearly shows the localization wires as well as the tissue marker (arrow) inside the specimen.
The use of two wires implies a bracketing technique which is often used to excise poorly circumscribed,
or non-mass lesions, characteristic of DCIS. .............................................................................................. 10
Figure 1.4. Optical absorption NIR spectra of relevant compounds found in human breasts, including
oxygenated hemoglobin (HbO2), de-oxygenated hemoglobin (Hb), water, and fat. The figure was adapted
from sources available at [http://omlc.ogi.edu/spectra] and cross checked to data in 38
]. .......................... 13
Figure 1.5. Representative examples illustrating the expected time-dependent PA waveforms for varying
sizes and optical densities of absorbers. Figure (a) shows a dark-shade sphere of radius R along with the
expected signal measured at T after homogeneous illumination by L. Figure (b) shows a light-shade
sphere of radius 2R. The expected results demonstrate that object size is inversely proportional to PA
signal frequency, while object optical density is directly proportional to PA signal amplitude. ................ 25
Figure 2.1. Major components of the iPAT system for intraoperative lumpectomy margin evaluation
during BCS are depicted schematically in (a). Figure (b) is a labeled photograph of the intraoperative
system within surgical suite, consisting of US system on the left and iPAT system on the right. The front
panel of the iPAT system is removed to facilitate convenient viewing of internal components. Figure (c)
shows a close-up photograph of the arc-shaped 24-channel PA transducer array (arrow) mounted on the
effector of the Epson SCARA robot. Figure (d) depicts the PA array from below, along with scale bar
indicating dimensions and the location of the conventional 6.6 MHz linear ultrasound transducer array
(yellow arrow). Figure (d) also indicates the positioning of the individual transducer elements on the array
chassis (black arrows). Figure (e) shows the custom-built lumpectomy specimen holder which contains a
freshly excised compressively restrained lumpectomy specimen. .............................................................. 43
Figure 2.2. (a) Selected 690 nm iPAT z-slices showing a graphite/agar gel phantom reconstructed using
spatial domain stitching, resulting in unwanted scan grid artefacts in the final composite image.
Alternatively, Figure (b) shows the same scan data but with stitching implemented in the gradient domain,
resulting in complete or near complete elimination of the grid artefacts. The larger images in Figures (c)
and (d) allow for an easier appreciation of the result, while the photograph in (e) provides an effective
gold standard reference. .............................................................................................................................. 49
Figure 2.3. iPAT system resolution evaluation via line profile analysis of surgical suture image. The
black sutures, seen in the Figure (a) photograph (arrows), were clearly visualized on the 930 nm iPAT
scan result of Figure (b). The suture, indicated by an orthogonal 20 mm dashed line in the photo and iPAT
image, was used to estimate the in-plane resolution of the imaging system. FWHM analysis indicated a
resolution of approximately 2.5 mm. .......................................................................................................... 50
xi
Figure 2.4. Representative iPAT slices of poultry tissue taken from 3D stacks corresponding to an
imaging depth of 5 mm below the illuminated surface. The photograph (d) shows the tissue bed
consisting of poultry breast tissue (yellow dashed perimeter) as well as thigh fat (black arrow) and thigh
muscle (white arrow) inclusions. The fat and muscle inclusions appear light yellow and dark red in the
photo due to having less and more hemoglobin concentration, respectively, compared to the breast tissue
bed. As expected, the 690 nm scan result in (a) depicts the hemoglobin rich thigh muscle as hyper-intense
while the 930 nm scan in (b) does so for the lipid-rich thigh-fat. On the other hand the 1064 nm scan in
(c) reveals little differentiation of the three tissue types. ............................................................................ 51
Figure 2.5. Image stacks of lumpectomy specimen containing an 18 mm diameter, grade 2 IDC, aquired
using the iPAT system at the indicated Z-depths below illuminated surface. Figures (a) and (b) show
iPAT results for 690 nm and 800 nm scanns, respectively, illustrating the small difference between
targeting deoxy-hemoglobin (690 nm) vs total hemoglobin (800 nm). The increased intensity of the 690
nm scan results, compared to 800 nm (yellow arrows), likely indicate the presence of mostly
deoxygenated blood in the excised specimen. Nonetheless, both wavelengths failed to unambiguaously
differentiate the malignacy region, best indicated in the near 7 mm deep slice of the 6.6 MHz US scan
shown (d) and (g), as well as in the X-ray image found in (e). On the other hand, the iPAT slices in (c)
and (f), aquired using lipid weighted 930 nm scanns, clearly show a 20 mm-diameter centrally located
hypo-intense area corresponding to the X-ray and US findings. ................................................................ 53
Figure 2.6. (a). 930 nm iPAT slices corresponding to the indicated depth bellow illumination surface,
showing a grade 2 IDC along with a grade 2 DCIS- containing specimen, found by postoperative
pathology to have a positive margin. (b) Co-registerd slices aquired using a 6.6 MHz conventional US
scanner. Figures (c) and (d) show a larger view of the slice near Z=11 mm for iPAT and US, respectively.
The iPAT slice in (c) clearly shows intrusion of the specimen edge by the hypo-intense extension (white
arrow). For reference a photograph is included in (e), which, along with the 14 mm iPAT and US slices
show the superior orientation suture (black and green arrows). The sutures facilitated the orietation of the
specimen with superior (S) at the top and anterior (A) to the right (yellow arrows). ................................. 55
Figure 2.7. Representative montage with slides of commonly encountered BCS lesions, acquired using
the iPAT lumpectomy evaluation system. The first column shows intraoperative transmission X-ray
images. The second column depicts the corresponding 930 nm iPAT slices, which are co-registered to the
US slices shown in the third column. Finally, the last column shows specimen photographs, which, along
with the X-ray images, are not co-registered. The specimen in (a) contained a pathologically confirmed
17 mm IDC with concordant findings on iPAT and X-ray (dashed circle), and to a lesser degree, US.
Figure (b) shows a specimen which contained a lesion composed of an 8 mm IDC with an extension of
DCIS. Figure (c) represents a lumpectomy specimen found by pathology to contain two adjacent foci of
IDC, measuring 16 mm and 15 mm each, along with high-grade DCIS. Lastly, the lumpectomy found in
(d) was confirmed to be a pure DCIS lesion measuring at least 18 mm in diameter and was removed using
wire guided excision. The hooked localization wires can be appreciated in the photograph and on the X-
ray image (arrows). The iPAT results appear to be in agreement as they show hypo-intense areas
corresponding to the lesion location in the X-ray. ...................................................................................... 58
Figure 3.1. (a) Photograph of iPAT system (center) within surgical suite as well as conventional
ultrasonography system (left). Major components of iPAT scanner are labeled, including water tank
which contains a fused fiber-optic bundle assembly that is used to direct near infrared laser pulses toward
lumpectomy specimens restrained in the specialized lumpectomy holder seen in (b). The water in the
tank facilitates acoustic coupling between the lumpectomy specimen and the 24-channel arc-shaped
photoacoustic detector array. The array and fiber-optic assembly is mounted to the effector of a 4-axis
xii
SCARA robot which is controlled by the robot PC. The laser induced signals detected by the transducer
array are transferred to the 50 MHz data acquisition system (DAQ) where they are digitized and sent to
the workstation PC for processing and visualization on the video monitor. Figure 3.1(b) is a photograph
of the iPAT compatible lumpectomy holder showing a compressively restrained surgical specimen. ...... 71
Figure 3.2. Slices representative of reflection and transmission mode iPAT, showing compounding impact
of (a) Back-projection, (b) K-wave iterative image improvement, (c) 2-voxel wide median filter and (d)
pseudo-flat-field correction combined with contrast adjustment. (e) Corresponding US image. ............... 77
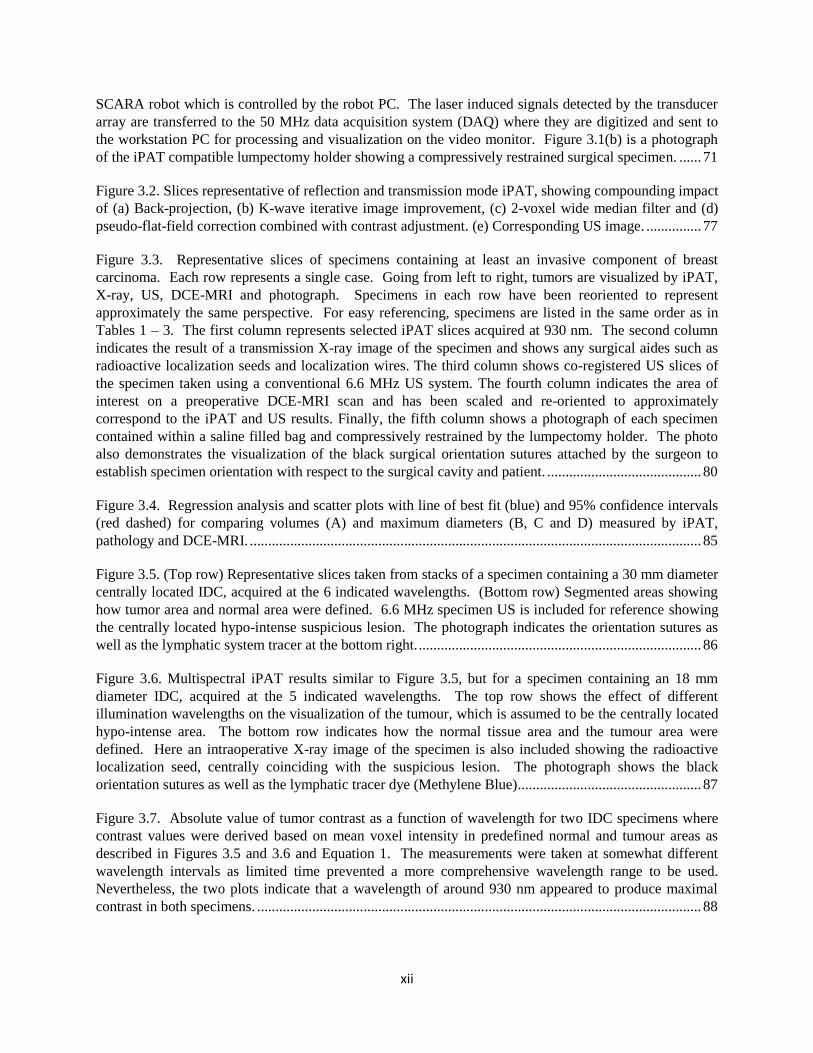
Figure 3.3. Representative slices of specimens containing at least an invasive component of breast
carcinoma. Each row represents a single case. Going from left to right, tumors are visualized by iPAT,
X-ray, US, DCE-MRI and photograph. Specimens in each row have been reoriented to represent
approximately the same perspective. For easy referencing, specimens are listed in the same order as in
Tables 1 – 3. The first column represents selected iPAT slices acquired at 930 nm. The second column
indicates the result of a transmission X-ray image of the specimen and shows any surgical aides such as
radioactive localization seeds and localization wires. The third column shows co-registered US slices of
the specimen taken using a conventional 6.6 MHz US system. The fourth column indicates the area of
interest on a preoperative DCE-MRI scan and has been scaled and re-oriented to approximately
correspond to the iPAT and US results. Finally, the fifth column shows a photograph of each specimen
contained within a saline filled bag and compressively restrained by the lumpectomy holder. The photo
also demonstrates the visualization of the black surgical orientation sutures attached by the surgeon to
establish specimen orientation with respect to the surgical cavity and patient. .......................................... 80
Figure 3.4. Regression analysis and scatter plots with line of best fit (blue) and 95% confidence intervals
(red dashed) for comparing volumes (A) and maximum diameters (B, C and D) measured by iPAT,
pathology and DCE-MRI. ........................................................................................................................... 85
Figure 3.5. (Top row) Representative slices taken from stacks of a specimen containing a 30 mm diameter
centrally located IDC, acquired at the 6 indicated wavelengths. (Bottom row) Segmented areas showing
how tumor area and normal area were defined. 6.6 MHz specimen US is included for reference showing
the centrally located hypo-intense suspicious lesion. The photograph indicates the orientation sutures as
well as the lymphatic system tracer at the bottom right. ............................................................................. 86
Figure 3.6. Multispectral iPAT results similar to Figure 3.5, but for a specimen containing an 18 mm
diameter IDC, acquired at the 5 indicated wavelengths. The top row shows the effect of different
illumination wavelengths on the visualization of the tumour, which is assumed to be the centrally located
hypo-intense area. The bottom row indicates how the normal tissue area and the tumour area were
defined. Here an intraoperative X-ray image of the specimen is also included showing the radioactive
localization seed, centrally coinciding with the suspicious lesion. The photograph shows the black
orientation sutures as well as the lymphatic tracer dye (Methylene Blue) .................................................. 87
Figure 3.7. Absolute value of tumor contrast as a function of wavelength for two IDC specimens where
contrast values were derived based on mean voxel intensity in predefined normal and tumour areas as
described in Figures 3.5 and 3.6 and Equation 1. The measurements were taken at somewhat different
wavelength intervals as limited time prevented a more comprehensive wavelength range to be used.
Nevertheless, the two plots indicate that a wavelength of around 930 nm appeared to produce maximal
contrast in both specimens. ......................................................................................................................... 88
xiii
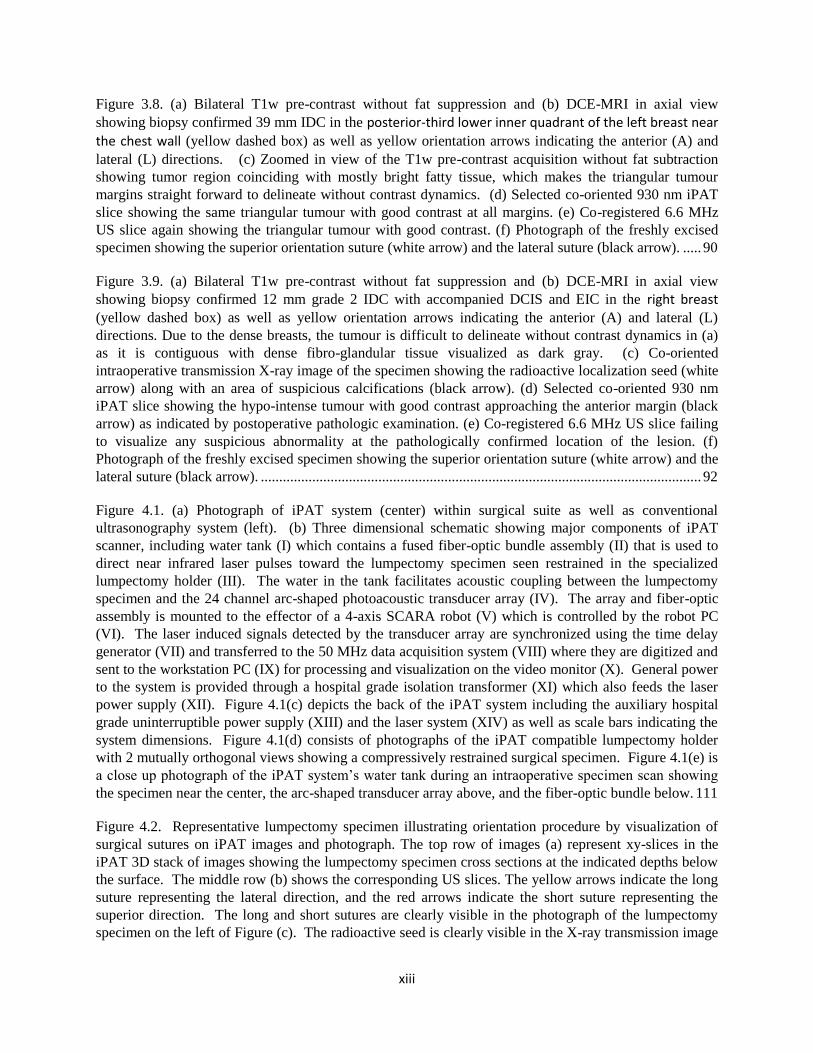
Figure 3.8. (a) Bilateral T1w pre-contrast without fat suppression and (b) DCE-MRI in axial view
showing biopsy confirmed 39 mm IDC in the posterior-third lower inner quadrant of the left breast near
the chest wall (yellow dashed box) as well as yellow orientation arrows indicating the anterior (A) and
lateral (L) directions. (c) Zoomed in view of the T1w pre-contrast acquisition without fat subtraction
showing tumor region coinciding with mostly bright fatty tissue, which makes the triangular tumour
margins straight forward to delineate without contrast dynamics. (d) Selected co-oriented 930 nm iPAT
slice showing the same triangular tumour with good contrast at all margins. (e) Co-registered 6.6 MHz
US slice again showing the triangular tumour with good contrast. (f) Photograph of the freshly excised
specimen showing the superior orientation suture (white arrow) and the lateral suture (black arrow). ..... 90
Figure 3.9. (a) Bilateral T1w pre-contrast without fat suppression and (b) DCE-MRI in axial view
showing biopsy confirmed 12 mm grade 2 IDC with accompanied DCIS and EIC in the right breast (yellow dashed box) as well as yellow orientation arrows indicating the anterior (A) and lateral (L)
directions. Due to the dense breasts, the tumour is difficult to delineate without contrast dynamics in (a)
as it is contiguous with dense fibro-glandular tissue visualized as dark gray. (c) Co-oriented
intraoperative transmission X-ray image of the specimen showing the radioactive localization seed (white
arrow) along with an area of suspicious calcifications (black arrow). (d) Selected co-oriented 930 nm
iPAT slice showing the hypo-intense tumour with good contrast approaching the anterior margin (black
arrow) as indicated by postoperative pathologic examination. (e) Co-registered 6.6 MHz US slice failing
to visualize any suspicious abnormality at the pathologically confirmed location of the lesion. (f)
Photograph of the freshly excised specimen showing the superior orientation suture (white arrow) and the
lateral suture (black arrow). ........................................................................................................................ 92
Figure 4.1. (a) Photograph of iPAT system (center) within surgical suite as well as conventional
ultrasonography system (left). (b) Three dimensional schematic showing major components of iPAT
scanner, including water tank (I) which contains a fused fiber-optic bundle assembly (II) that is used to
direct near infrared laser pulses toward the lumpectomy specimen seen restrained in the specialized
lumpectomy holder (III). The water in the tank facilitates acoustic coupling between the lumpectomy
specimen and the 24 channel arc-shaped photoacoustic transducer array (IV). The array and fiber-optic
assembly is mounted to the effector of a 4-axis SCARA robot (V) which is controlled by the robot PC
(VI). The laser induced signals detected by the transducer array are synchronized using the time delay
generator (VII) and transferred to the 50 MHz data acquisition system (VIII) where they are digitized and
sent to the workstation PC (IX) for processing and visualization on the video monitor (X). General power
to the system is provided through a hospital grade isolation transformer (XI) which also feeds the laser
power supply (XII). Figure 4.1(c) depicts the back of the iPAT system including the auxiliary hospital
grade uninterruptible power supply (XIII) and the laser system (XIV) as well as scale bars indicating the
system dimensions. Figure 4.1(d) consists of photographs of the iPAT compatible lumpectomy holder
with 2 mutually orthogonal views showing a compressively restrained surgical specimen. Figure 4.1(e) is
a close up photograph of the iPAT system’s water tank during an intraoperative specimen scan showing
the specimen near the center, the arc-shaped transducer array above, and the fiber-optic bundle below. 111
Figure 4.2. Representative lumpectomy specimen illustrating orientation procedure by visualization of
surgical sutures on iPAT images and photograph. The top row of images (a) represent xy-slices in the
iPAT 3D stack of images showing the lumpectomy specimen cross sections at the indicated depths below
the surface. The middle row (b) shows the corresponding US slices. The yellow arrows indicate the long
suture representing the lateral direction, and the red arrows indicate the short suture representing the
superior direction. The long and short sutures are clearly visible in the photograph of the lumpectomy
specimen on the left of Figure (c). The radioactive seed is clearly visible in the X-ray transmission image
xiv
near the center of the specimen on the right of Figure (c). The scale bars in each panel represent a
dimension of 2 cm. .................................................................................................................................... 117
Figure 4.3. Regression analysis and scatter plots showing the line of best fit (solid blue) and 95%
confidence intervals (dashed red) for comparing (a) iPAT measured tumour diameters to pathology
measured diameters, (b) tumour diameters on pathology to whole specimen diameters on pathology, (c)
tumour diameters on pathology to iPAT measured diameters when only transmission-mode scan
configuration was employed and finally (d) tumour diameters on pathology to iPAT measured diameters
for fast-mode only scan configuration. ..................................................................................................... 121
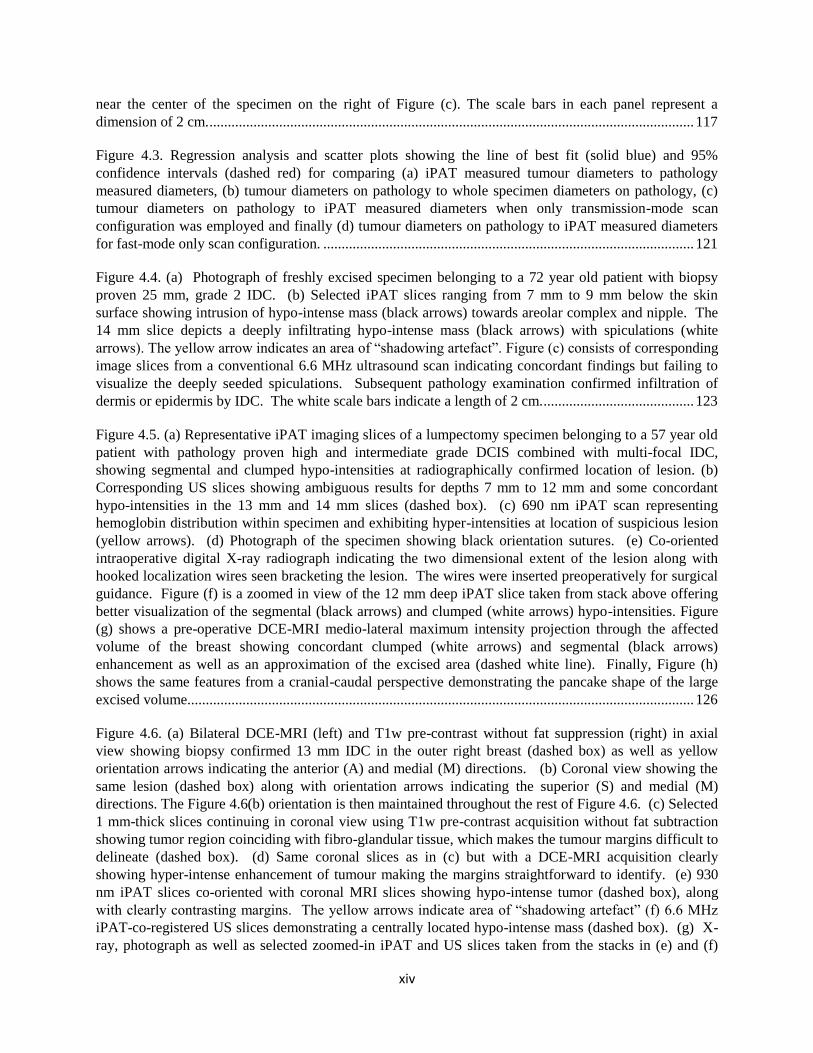
Figure 4.4. (a) Photograph of freshly excised specimen belonging to a 72 year old patient with biopsy
proven 25 mm, grade 2 IDC. (b) Selected iPAT slices ranging from 7 mm to 9 mm below the skin
surface showing intrusion of hypo-intense mass (black arrows) towards areolar complex and nipple. The
14 mm slice depicts a deeply infiltrating hypo-intense mass (black arrows) with spiculations (white
arrows). The yellow arrow indicates an area of “shadowing artefact”. Figure (c) consists of corresponding
image slices from a conventional 6.6 MHz ultrasound scan indicating concordant findings but failing to
visualize the deeply seeded spiculations. Subsequent pathology examination confirmed infiltration of
dermis or epidermis by IDC. The white scale bars indicate a length of 2 cm. ......................................... 123
Figure 4.5. (a) Representative iPAT imaging slices of a lumpectomy specimen belonging to a 57 year old
patient with pathology proven high and intermediate grade DCIS combined with multi-focal IDC,
showing segmental and clumped hypo-intensities at radiographically confirmed location of lesion. (b)
Corresponding US slices showing ambiguous results for depths 7 mm to 12 mm and some concordant
hypo-intensities in the 13 mm and 14 mm slices (dashed box). (c) 690 nm iPAT scan representing
hemoglobin distribution within specimen and exhibiting hyper-intensities at location of suspicious lesion
(yellow arrows). (d) Photograph of the specimen showing black orientation sutures. (e) Co-oriented
intraoperative digital X-ray radiograph indicating the two dimensional extent of the lesion along with
hooked localization wires seen bracketing the lesion. The wires were inserted preoperatively for surgical
guidance. Figure (f) is a zoomed in view of the 12 mm deep iPAT slice taken from stack above offering
better visualization of the segmental (black arrows) and clumped (white arrows) hypo-intensities. Figure
(g) shows a pre-operative DCE-MRI medio-lateral maximum intensity projection through the affected
volume of the breast showing concordant clumped (white arrows) and segmental (black arrows)
enhancement as well as an approximation of the excised area (dashed white line). Finally, Figure (h)
shows the same features from a cranial-caudal perspective demonstrating the pancake shape of the large
excised volume.......................................................................................................................................... 126
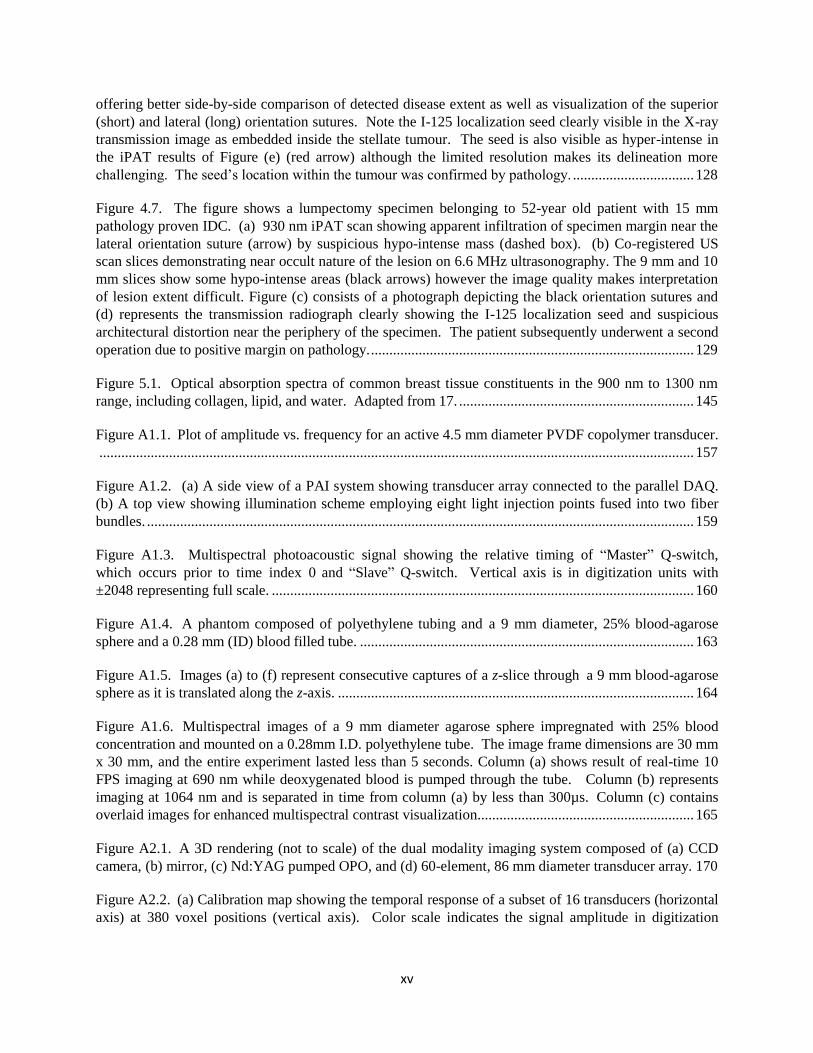
Figure 4.6. (a) Bilateral DCE-MRI (left) and T1w pre-contrast without fat suppression (right) in axial
view showing biopsy confirmed 13 mm IDC in the outer right breast (dashed box) as well as yellow
orientation arrows indicating the anterior (A) and medial (M) directions. (b) Coronal view showing the
same lesion (dashed box) along with orientation arrows indicating the superior (S) and medial (M)
directions. The Figure 4.6(b) orientation is then maintained throughout the rest of Figure 4.6. (c) Selected
1 mm-thick slices continuing in coronal view using T1w pre-contrast acquisition without fat subtraction
showing tumor region coinciding with fibro-glandular tissue, which makes the tumour margins difficult to
delineate (dashed box). (d) Same coronal slices as in (c) but with a DCE-MRI acquisition clearly
showing hyper-intense enhancement of tumour making the margins straightforward to identify. (e) 930
nm iPAT slices co-oriented with coronal MRI slices showing hypo-intense tumor (dashed box), along
with clearly contrasting margins. The yellow arrows indicate area of “shadowing artefact” (f) 6.6 MHz
iPAT-co-registered US slices demonstrating a centrally located hypo-intense mass (dashed box). (g) X-
ray, photograph as well as selected zoomed-in iPAT and US slices taken from the stacks in (e) and (f)
xv
offering better side-by-side comparison of detected disease extent as well as visualization of the superior
(short) and lateral (long) orientation sutures. Note the I-125 localization seed clearly visible in the X-ray
transmission image as embedded inside the stellate tumour. The seed is also visible as hyper-intense in
the iPAT results of Figure (e) (red arrow) although the limited resolution makes its delineation more
challenging. The seed’s location within the tumour was confirmed by pathology. ................................. 128
Figure 4.7. The figure shows a lumpectomy specimen belonging to 52-year old patient with 15 mm
pathology proven IDC. (a) 930 nm iPAT scan showing apparent infiltration of specimen margin near the
lateral orientation suture (arrow) by suspicious hypo-intense mass (dashed box). (b) Co-registered US
scan slices demonstrating near occult nature of the lesion on 6.6 MHz ultrasonography. The 9 mm and 10
mm slices show some hypo-intense areas (black arrows) however the image quality makes interpretation
of lesion extent difficult. Figure (c) consists of a photograph depicting the black orientation sutures and
(d) represents the transmission radiograph clearly showing the I-125 localization seed and suspicious
architectural distortion near the periphery of the specimen. The patient subsequently underwent a second
operation due to positive margin on pathology. ........................................................................................ 129
Figure 5.1. Optical absorption spectra of common breast tissue constituents in the 900 nm to 1300 nm
range, including collagen, lipid, and water. Adapted from 17. ................................................................ 145
Figure A1.1. Plot of amplitude vs. frequency for an active 4.5 mm diameter PVDF copolymer transducer.
.................................................................................................................................................................. 157
Figure A1.2. (a) A side view of a PAI system showing transducer array connected to the parallel DAQ.
(b) A top view showing illumination scheme employing eight light injection points fused into two fiber
bundles. ..................................................................................................................................................... 159
Figure A1.3. Multispectral photoacoustic signal showing the relative timing of “Master” Q-switch,
which occurs prior to time index 0 and “Slave” Q-switch. Vertical axis is in digitization units with
±2048 representing full scale. ................................................................................................................... 160
Figure A1.4. A phantom composed of polyethylene tubing and a 9 mm diameter, 25% blood-agarose
sphere and a 0.28 mm (ID) blood filled tube. ........................................................................................... 163
Figure A1.5. Images (a) to (f) represent consecutive captures of a z-slice through a 9 mm blood-agarose
sphere as it is translated along the z-axis. ................................................................................................. 164
Figure A1.6. Multispectral images of a 9 mm diameter agarose sphere impregnated with 25% blood
concentration and mounted on a 0.28mm I.D. polyethylene tube. The image frame dimensions are 30 mm
x 30 mm, and the entire experiment lasted less than 5 seconds. Column (a) shows result of real-time 10
FPS imaging at 690 nm while deoxygenated blood is pumped through the tube. Column (b) represents
imaging at 1064 nm and is separated in time from column (a) by less than 300µs. Column (c) contains
overlaid images for enhanced multispectral contrast visualization........................................................... 165
Figure A2.1. A 3D rendering (not to scale) of the dual modality imaging system composed of (a) CCD
camera, (b) mirror, (c) Nd:YAG pumped OPO, and (d) 60-element, 86 mm diameter transducer array. 170
Figure A2.2. (a) Calibration map showing the temporal response of a subset of 16 transducers (horizontal
axis) at 380 voxel positions (vertical axis). Color scale indicates the signal amplitude in digitization
xvi
counts. (b) Enlarged view of the temporal response of 4 transducers at 80 voxels indicated by the
highlighted rectangle in (a). ...................................................................................................................... 172
Figure A2.3. Photograph of the hemispherical bowl holding the transducer array and showing the S-
shaped tube suspended by a wire jig. Here, the tube is filled with blood instead of ICG to aide in
visualization of the tube in the photograph. .............................................................................................. 174
Figure A2.4. (a) Photoacoustic images of ICG flowing through a 0.27 mm ID tube. (b) Co-registered
fluorescence images of the same tube shown in panel (a). ....................................................................... 175
Figure A2.5. Reconstructed PAI images of five z-plane slices intersecting a 9-mm diameter agarose-ICG
sphere. The bottom-most plane is shown in panel (a) and is located at z = -1.0 mm relative to the center
of the bowl. The top-most plane is shown in panel (e) and is located z = +1.0 mm relative to the center of
the bowl. Note the thin steel mounting wire indicated by the arrow in (b). The wire entered the sphere on
the bottom left side of the sphere as shown in (a) and was observed to cross the five planes and exit at the
top right side of the sphere as shown in panel (e). .................................................................................... 176

xvii
List of Tables
Table 1.1. ACR classification of breast tissue and associated diagnostic accuracy. [adapted from 5] .......... 3
Table 1.2 Relative strengths and weaknesses of competing intraoperative lumpectomy margin evaluation
methods…………………………………………………………………………………………………19
Table 3.1. Patient and tumor information ................................................................................................... 76
Table 3.2. Maximum tumor diameters and volumetric measurements ...................................................... 81
Table 3.3. Specimen diameters and corresponding ellipsoid volumes determined by pathology and iPAT
.................................................................................................................................................................... 81
Table 3.4. Correlation coefficients and statistical assessment between the imaging modalities for tumor
size and whole specimen size...................................................................................................................... 84
Table 3.5. Breast composition according to pathology and MRI. Also, level of background parenchymal
enhancement in DCE-MRI is indicated. ..................................................................................................... 93
Table 4.1. Patient and tumor information ................................................................................................. 116
Table 4.2. Predictive values, specificity, and sensitivity for two paradigms aiming to achieve negative
margins at pathology. ................................................................................................................................ 119
Table 4.3. Correlation coefficients and statistical difference assessment between iPAT and pathology, as
well as between tumour size and specimen size by absolute as well as percent difference. ..................... 122
xviii
List of Appendices
A1. Real-Time Multispectral 3-D Photoacoustic Imaging of blood phantoms…………………..145
A2. Combined 3D photoacoustic and 2D fluorescence imaging of indocyanine green contrast agent
flow…………………………………………………………………………….……………………158

xix
List of Abbreviations
2D two dimensional
3D three dimensional
BCS Breast conserving surgery
BIRADS Breast imaging and reporting data system
cm Centimeter
CT Computed tomography
DAQ Data acquisition
DCE Dynamic Contrast Enhanced
DCIS Ductal carcinoma in situ
DRS Diffuse reflectance spectroscopy
FOV Field of view
FWHM Full width at half-maximum
Hz Hertz
IDC Invasive ductal carcinoma
IL Intralipid™
ILC Invasive lobular carcinoma
kHz Kilohertz
LCIS Lobular carcinoma in situ
LOIS Light optoacoustic imaging system
MHz Megahertz
mJ Millijoule
mm Millimeter
MRI Magnetic resonance imaging
ms Millisecond
Nd:YAG Neodymium-doped yttrium aluminum garnet
NIRS Near infrared spectroscopy
ns Nanosecond
OCT Optical coherence tomography
OPO Optical parametric oscillator
PA Photoacoustic
PAI Photoacoustic imaging
PAM Photoacoustic microscopy
xx
PAT Photoacoustic tomography
PC Personal computer
PET Positron emission tomography
RECIST Response Evaluation Criteria in Solid Tumors
RF Radio frequency
RTB Residual tumour burden
s Second
SNR Signal-to-noise ratio
SVD Singular value decomposition
US Ultrasound
μm Micrometer
μs Microsecond
1
Chapter 1: Introduction
1.1 Background
1.1.1 Cancer overview
Cancer is an umbrella term used to describe a class of diseases that arise due to abnormal cell division and
growth. While this may appear to be a relatively simple concept, the specific ways by which a normal
cell alters its behavior to become a cancer, or malignant cell, seem insurmountably complex.
Nevertheless, in their highly influential work, “The Hallmarks of Cancer”, cancer researchers Hanahan
and Weinberg identify six crucial characteristics that differentiate cancer cells from their normal
counterparts1. Briefly, they summarize the “hallmarks” of cancer cells as (1) possessing a self-sufficiency
in growth signals, (2) insensitivity to anti-growth signals, (3) evasion of apoptosis, or cell death, (4)
limitless replicative potential, (5) sustained angiogenesis, or vascular recruitment, and (6) tissue invasion
and metastasis. It is the sixth identifying characteristic, namely the cancer cell’s potential to spread, or
metastasize to other parts of the body that is of most concern to doctors and patients alike. The most
common locations where cancer spreads are the liver, lung, bone and brain. Indeed, the majority of
cancer fatalities are not caused by the primary tumour. Instead it is the uninterrupted progression of the
disease to the metastatic stage that results in a terminal diagnosis, and this is of paramount concern for
most cancers, including breast cancer.
1.1.2 The breast and breast cancer
About 1 in 8 women in the developed world are expected to develop breast cancer during their lifetime2.
For women, this means that breast cancer is the most common cancer and the second leading cause of
cancer mortality.
2
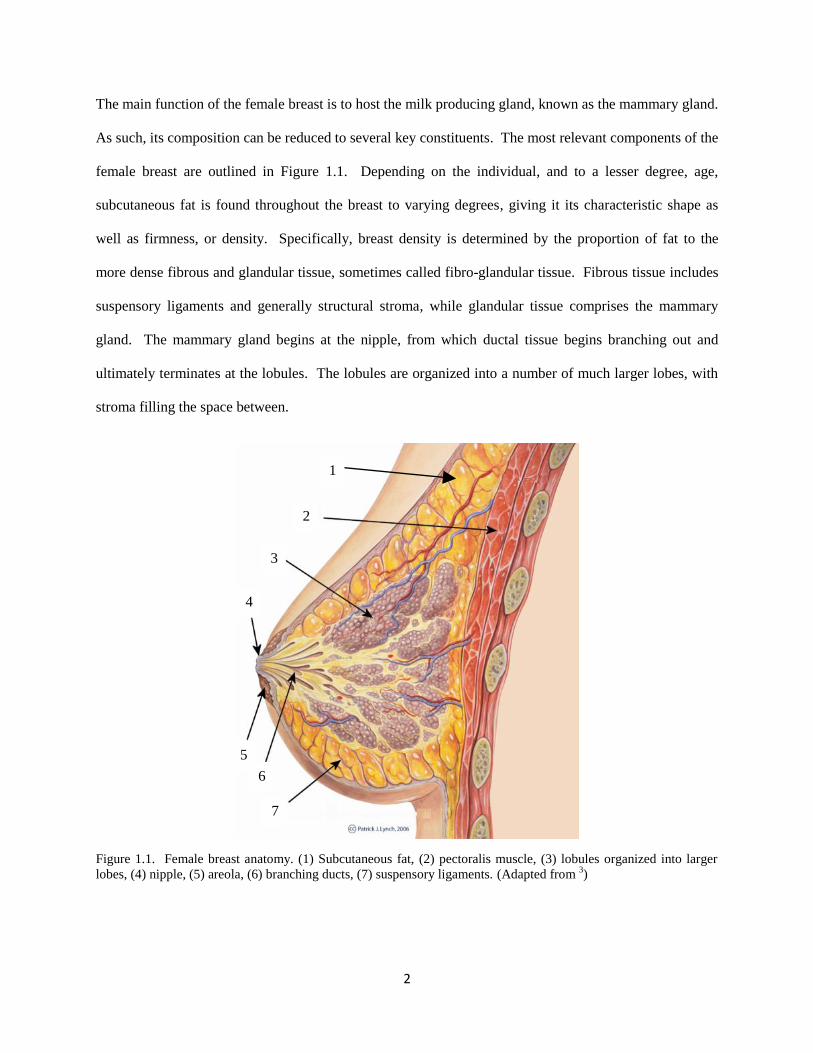
The main function of the female breast is to host the milk producing gland, known as the mammary gland.
As such, its composition can be reduced to several key constituents. The most relevant components of the
female breast are outlined in Figure 1.1. Depending on the individual, and to a lesser degree, age,
subcutaneous fat is found throughout the breast to varying degrees, giving it its characteristic shape as
well as firmness, or density. Specifically, breast density is determined by the proportion of fat to the
more dense fibrous and glandular tissue, sometimes called fibro-glandular tissue. Fibrous tissue includes
suspensory ligaments and generally structural stroma, while glandular tissue comprises the mammary
gland. The mammary gland begins at the nipple, from which ductal tissue begins branching out and
ultimately terminates at the lobules. The lobules are organized into a number of much larger lobes, with
stroma filling the space between.
Figure 1.1. Female breast anatomy. (1) Subcutaneous fat, (2) pectoralis muscle, (3) lobules organized into larger
lobes, (4) nipple, (5) areola, (6) branching ducts, (7) suspensory ligaments. (Adapted from 3)
1
2
3
4
5
6
7

3
Today, it is well known that dense breasts, which contain a higher proportion of fibrous and glandular
tissue, increase the risk-factor for developing breast cancer and reduce the effectiveness of currently
employed diagnostic methods4. To combat this problem, the American College of Radiology (ACR), a
leading authority on standardization of cancer assessment and reporting methods, established a lexicon for
the categorization of breast density based on the proportion of fatty and fibro-glandular tissue found
throughout the breast5. Table 1.1 lists the standardized categories as well as the expected accuracy of
current diagnostic methods.
Table 1.1. ACR classification of breast tissue and associated diagnostic accuracy. [adapted from 5]
ACR Description Diagnostic accuracy
1 Mostly fatty Very high
2 Fibro-glandular High
3 Heterogeneously dense Limited
4 Dense Limited
Breast cancer sub-types are numerous, but most can be grouped based on their site of origin and level of
infiltration. Breast cancer that begins in the ducts and invades the surrounding fatty or fibro-glandular
tissue, is referred to as invasive ductal carcinoma (IDC). IDC is by far the most commonly diagnosed
breast cancer, representing about 80% of invasive cancer diagnoses. If the cancer does not invade the
surrounding tissue but instead remains confined within the ducts, it is called ductal carcinoma in-situ
(DCIS). As a common precursor to invasive ductal cancer, DCIS is often found along with it. Similarly,
when the cancer starts within the lobules, invasive lobular carcinoma (ILC), and lobular carcinoma in-situ
(LCIS) refer to invasive and non-invasive types of the disease, respectively. Lobular cancers represent
about 10% of invasive cancer diagnoses. Other sub-types of breast cancer can occur, but are rare.
4
1.1.3 Breast cancer screening, diagnosis and staging
Carcinoma of the breast presents with many variations in both the microscopic and macroscopic regime.
Our desire to understand, detect, and treat the condition, has led to the development of an equally
complex arsenal of diagnostic and surgical procedures, imaging methods, and therapies. In spite of the
steadily rising incidence rate of breast cancer, these developments have led to a dramatic improvement in
survival and quality of life for patients dealing with the disease today, as compared to a few decades ago.
This improvement is largely due to the early detection of cancers via regional screening programs6,7
.
Thanks to the availability of medical imaging technology, routine breast cancer screening programs are
now a relatively standard practice in the developed world7. Most women over the age of 50, or younger
at-risk individuals, are encouraged to undertake annual mammograms. The Breast Imaging and
Reporting Data System (BIRADS), introduced by the ACR, is commonly used to standardize results of
imaging studies8,9
. These results are categorized in range from negative or benign (BIRADS 1 and 2), to
proven malignancy (BIRADS 6). Ultimately, microscopic tissue samples are extracted from the suspect
area of the affected breast, usually by needle core biopsy, and histological tissue analysis determines the
basis for a BIRADS 6 diagnosis.
In cases that lead to a BIRADS 6 classification, cancer staging is typically performed to determine the
extent, or progression, of the disease10
. Staging refers to the size of the primary malignant lesion as well
as the extent to which the cancer has spread beyond its original location. The most common staging
convention assesses the disease on a scale of 0 to 4 where stages 1 to 4 are indicated using roman
numerals I to IV 11
. The disease assessment depends on various factors such as lesion diameter, sentinel
lymph node involvement, and distant metastasis. Often cancer staging is used to group the disease
progression into either early stage, locally advanced, or metastatic breast cancer.
Early stage breast cancer refers to lesions that are less than 5 cm in diameter with no more than 3 lymph
nodes involved. This includes stage I and most stage II diagnoses. On the other hand, locally advanced
5
breast cancer includes lesions that are more than 5 cm in diameter. Furthermore, locally advanced disease
implies that cancer has spread to more than 3 lymph nodes, or was found in other nearby tissues, such as
muscle and skin. Locally advanced breast cancer includes some stage II and all stage III diagnoses, as
well as inflammatory breast cancer. Finally, metastatic, or advanced breast cancer, consists of disease
that has spread to other organs in the body. It is referred to as stage IV breast cancer11
. Fortunately, in the
developed and developing world today, most diagnoses of breast cancer occur at relatively early stages,
usually stage I or II 2.
1.1.4 Breast conserving surgery and lesion localization techniques
Typically treatment of stage I and II diagnoses of breast cancer includes Breast Conserving Surgery
(BCS), sometimes referred to as lumpectomy. The goal of the procedure is to excise all malignant tissue
from the breast surrounded by a continuous envelope of normal tissue. A successful procedure results in
a negative margin and is depicted in Figure 1.2(a).12
Currently, the necessary width of a lumpectomy
margin to minimize cancer recurrence is a topic of debate. Opinions range from less than 2 mm to more
than 10 mm depending on age, cancer type and therapies employed. 12–14
Nevertheless, in clinical practice
the procedure often fails, resulting in a positive margin being reported by pathology at a later time. This
occurs in up to 60% of cases and is shown in Figure 1.2(b). 15,16
To minimize the risk of cancer
recurrence such a finding usually leads to need for a second surgery. This situation has a negative impact
on hospital resources and patients, by delaying adjuvant therapy, elevating stress levels and degrading
cosmetic outcome. Reducing BCS re-excision rates would translate to a substantial improvement in
breast cancer care from both a monetary and personal perspective.
6
(a) Negative Margin (b) Positive Margin
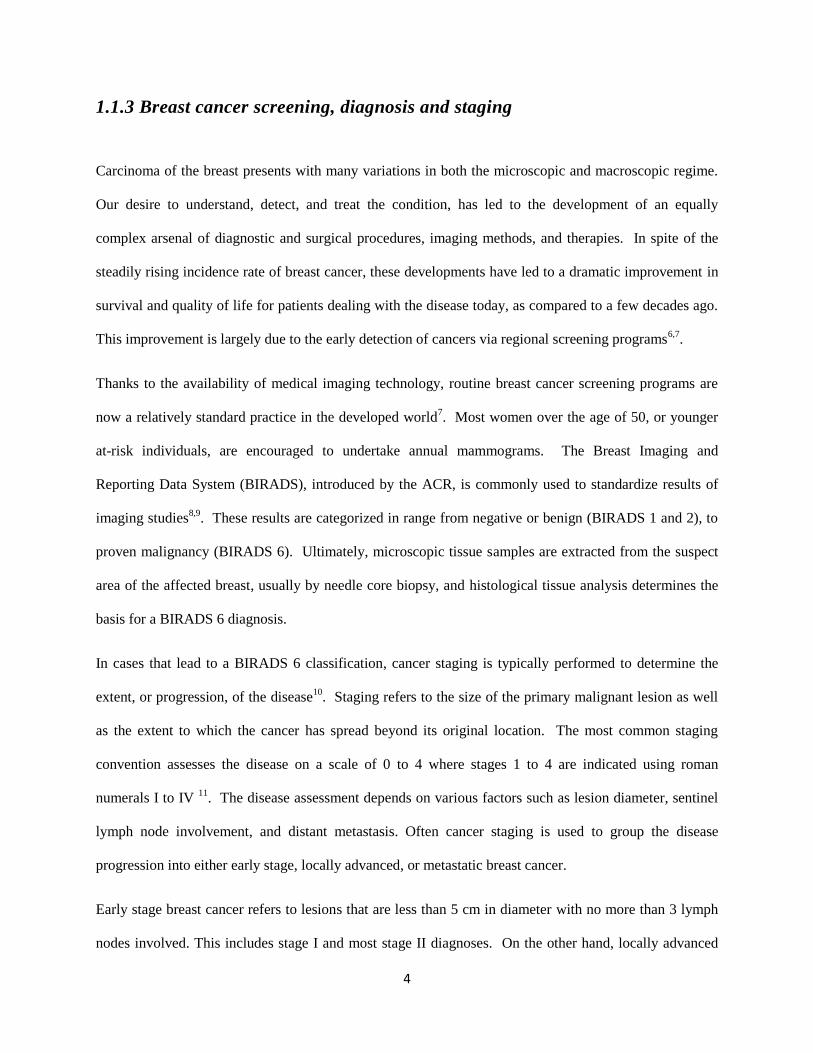
Figure 1.2. Possible outcomes of breast conserving surgery. (a) The tumour tissue is enclosed in a continuous
envelope of normal tissue, indicating a lumpectomy specimen with negative margin. (b) Specimen with positive
margin. The margin is clearly invaded by tumour tissue.
Traditionally, preoperative lesion localization is performed to guide the surgeon and aid in successful
surgical outcomes. Various approaches have been implemented with differing rates of success. One of
the earliest and widely used techniques, known as wire-guided localization (WGL), involves the insertion
of one, or more, fine hooked wires into the lesion of interest. To ensure that the hooked-end of the wire is
placed inside the lesion, the insertion is performed under medical imaging guidance. During BCS the
surgeon uses the localization wire as a guide towards malignant tissue, thereby improving the chances of
success17
.
A more frequently successful localization technique, called radio-guided localization, uses a radiotracer
that is injected into the lesion under imaging guidance18
. However, the use of injectable radiotracers
complicates the protocol, and consequently, the use of radio-guided localization has not seen widespread
implementation. On the other hand, a similar procedure, called radioactive seed localization, is enjoying
more widespread use as it delivers the precision and convenience of radio-guidance without the need for
tracer injection. Instead, in radioactive seed localization, a small radioactive Iodine-125 seed is inserted
into the lesion under imaging guidance12
. Nevertheless, with either tracer or seed localization, the
Tumour
tissue
Normal
tissue
Specimen
margin Tumour
tissue at
margin
7
operating surgeon enjoys the convenience of a gamma proximity probe to locate the source of
radioactivity, and with it, the lesion.
1.2 Clinical breast cancer imaging and surgical guidance
There are many possible candidate techniques for the assessment of disease extent or tumor size.
Currently, the accepted gold standard is postsurgical histopathological examination. Unfortunately, for
obvious reasons, the examination results are not available to guide pre-surgical decisions.
Physical breast examination via palpation remains useful due to its relative simplicity, enabling patients to
perform routine self-exams and offering the possibility of catching a tumor early, especially if located
peripherally. Unfortunately, palpation has been shown to be unreliable, particularly in dense breasts, as
well as dependent on examiner experience and nature of tumor. In clinical trials, physical examination
has been shown to be one of the least accurate techniques in correlation with histopathological
examination19
.
1.2.1 Diagnostic and preoperative in vivo imaging
Current clinical practice in the treatment of breast cancer usually involves a number of medical imaging
technologies that are used to carry out, or aid in, a variety procedures. As mentioned earlier, preoperative
lesion localization techniques, such as wire-guided or radio-guided localization, depend on image
guidance to ensure accurate placement. However, application of medical imaging technology toward
treatment of breast cancer is much broader. From breast cancer screening, diagnosis and staging, to
treatment monitoring and biopsy guidance, medical imaging plays a vital role throughout the treatment
process. Here, the most frequently used imaging methods are described.
As a generally accepted breast cancer screening tool and due to its relatively good balance between cost,
complexity, sensitivity and specificity, X-ray mammography is perhaps the most widely used breast
8
imaging technique7,19
. On the other hand, studies have demonstrated a significant sensitivity and
specificity reduction in younger patients, and independently in denser breasts, particularly when
monitoring response to neoadjuvant therapy20
. Furthermore, in cases with spiculated lesions, the 2-D
nature of mammographic images can make the true 3-D size of tumors difficult to estimate.
Ultrasonography (US) has demonstrated better sensitivity than mammography but suffers from lesion size
underestimation and, due to its operator dependence, is not a reproducible procedure with good
repeatability statistics10,19,21
. Notably, some studies have demonstrated a significant improvement in
sensitivity when a combination of US and mammography was used, and generally, overall improvement
in disease extent assessment when multiple modalities were employed. From a practical perspective, the
expense and complexity of using multiple imaging modalities to assess single cases points toward an
unmet need in this area.
Dynamic contrast enhanced magnetic resonance imaging (DCE-MRI) has established itself as the best
single imaging modality in the detection and evaluation of breast cancer. It’s effectiveness for estimating
in vivo tumor burden has been validated in numerous studies and shown to be superior to both
mammography and ultrasound10,21,22
. The success of DCE-MRI, particularly in differentiating various
soft tissues, is largely attributed to its inherent molecular source of contrast. Compared to mammography
and sonography, both of which derive contrast based on tissue physical density, DCE-MRI offers
sensitivity and specificity towards specific molecules, such as H2O, and lipids. Consequently, the
technique is capable of differentiating fatty tissues from muscle, glandular and connective tissues.
Furthermore, by use of time-resolved intravenous contrast perfusion tracking DCE-MRI can estimate
tissue specific parameters, such as tissue permeability, which is instrumental in differentiating malignant
lesions from other tissue types. On the downside, specificity deficits lead to a sub-optimal false positive
rate particularly in breasts exhibiting high background parenchymal enhancement. Large studies have
shown that frequent use of DCE-MRI leads to unnecessary repeat surgical procedures and mastectomies
due to overestimates of tumour size and detection of numerous non-specific lesions.23
Consequently, this
9
feature has prevented DCE-MRI from being recommended for general population screening and second-
look ultrasound is often used to cross check suspicious MRI findings. Finally, these shortcomings
combined with the high cost and complexity of DCE-MRI mean that its use will likely be limited to
mammographically/sonographically occult lesions and cases where mammography and US produce
ambiguous findings24
.
18FDG-PET imaging, an excellent whole body distant metastasis detector, has been proposed and
occasionally used to also assess tumor stage and monitor therapy efficacy. However, the procedural
complexity as well as use of radiotracers combined with limited sensitivity for small (<2-3 cm) tumors
and a rather high false positive rate, reduces the utility of PET as an efficient tumor extent assessment
tool25
.
1.2.2 Intraoperative ex-vivo specimen imaging
Beyond patient imaging, medical imaging continues to aid in breast cancer treatment in the surgical arena.
Below, we describe two of the most common intraoperative lumpectomy specimen imaging methods,
aimed at ensuring negative margins during BCS.
Specimen transmission X-ray imaging, sometimes called radiography, involves scanning of surgical
specimens using a specialized X-ray tissue scanner. To perform the scan a freshly excised lumpectomy
specimen is placed in the scanner under a known orientation with respect to the surgical cavity.
Therefore, if the scan results show indications of a close or positive margin, the surgeon can perform a re-
excision in the correct area, potentially sparing the patient a repeat surgery. Specimen radiography is a
convenient specimen examination method with the capability to visualize surgical aids like tissue clips, I-
125 seeds, and localization wires with high contrast and resolution (Figure 1.3). Unfortunately it offers
poor contrast in soft tissues, especially in denser breasts, resulting in poor correlation with histological
measurements. 26
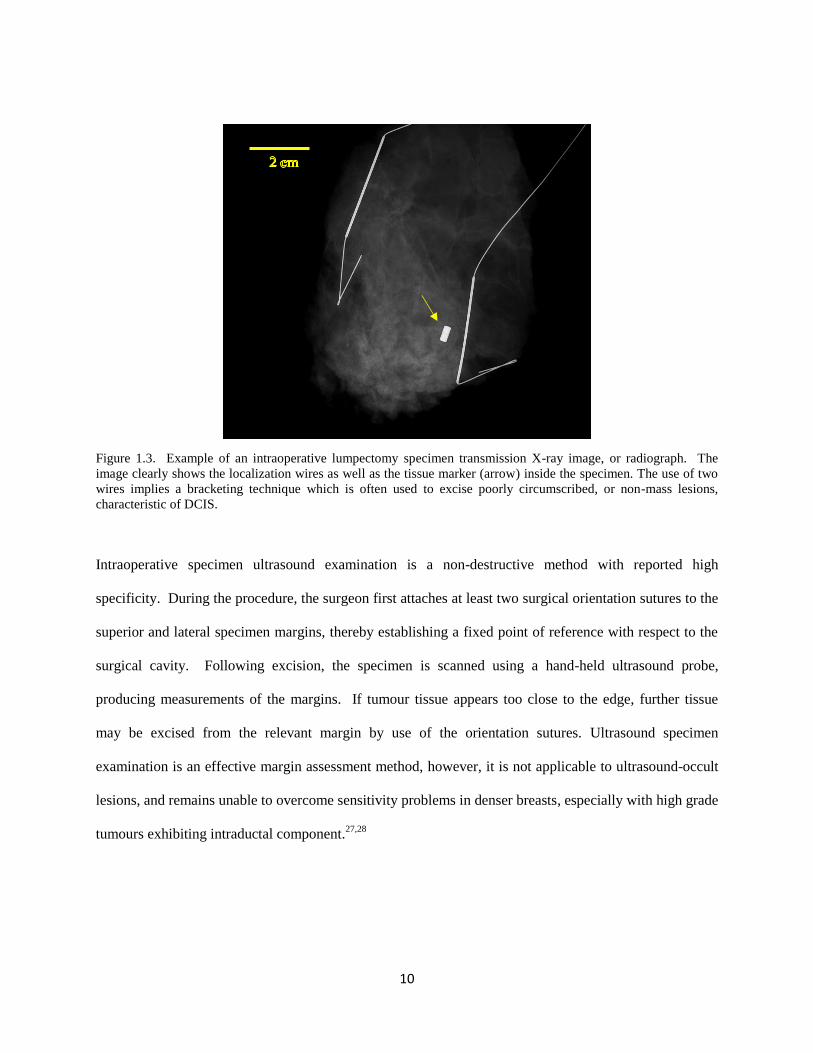
10
Figure 1.3. Example of an intraoperative lumpectomy specimen transmission X-ray image, or radiograph. The
image clearly shows the localization wires as well as the tissue marker (arrow) inside the specimen. The use of two
wires implies a bracketing technique which is often used to excise poorly circumscribed, or non-mass lesions,
characteristic of DCIS.
Intraoperative specimen ultrasound examination is a non-destructive method with reported high
specificity. During the procedure, the surgeon first attaches at least two surgical orientation sutures to the
superior and lateral specimen margins, thereby establishing a fixed point of reference with respect to the
surgical cavity. Following excision, the specimen is scanned using a hand-held ultrasound probe,
producing measurements of the margins. If tumour tissue appears too close to the edge, further tissue
may be excised from the relevant margin by use of the orientation sutures. Ultrasound specimen
examination is an effective margin assessment method, however, it is not applicable to ultrasound-occult
lesions, and remains unable to overcome sensitivity problems in denser breasts, especially with high grade
tumours exhibiting intraductal component.27,28
11
1.2.3 Intraoperative lumpectomy specimen examination
Intraoperative specimen imaging has demonstrated the potential for improved success rates in BCS,
however, current methods suffer from limited applicability or sensitivity. Clearly, an alternative
intraoperative specimen margin assessment method could be of great benefit if it is able to quickly detect
and visually guide the operating surgeon towards a broad range of lesion types with high sensitivity and
specificity. There are several techniques that have been implemented. Here we describe some of the most
prominent.
Frozen sectioning allows for visual inspection of the margin but requires special expertise, is time
consuming, and can be difficult to interpret due to artefacts caused by the freezing process.29
Intraoperative contact cytology reduces the processing time but is limited to surface examination and
suffers from variable sensitivity related to pathologist skill level.30
Of note is a recently FDA approved device called the MARGINProbe, which uses radio frequency
spectroscopy to interrogate a 7 mm diameter area of interest to a depth of up to 1 mm. The device features
a hand-held probe that makes measurements by contacting tissue for about 1.5 seconds. On the downside,
limited sensitivity (65%), specificity (50%), field of view and penetration, imply that complete margin
assessment is neither practical nor possible leading to a possibility of missed malignant tissue within the
margin.31
1.2.4 Postoperative lumpectomy specimen histopathological examination
Histological examination of excised tissue specimens represents the gold standard in tissue analysis, and
ultimately, disease diagnosis29
. Typically, freshly excised and suture oriented lumpectomy specimens are
fixed in a formalin solution for at least 24 hours, or more for large specimens. After fixation, the
specimen margins are identified using the sutures and each of the six margins surfaces are inked using a
12
different colour. Following inking, the specimens are serially sectioned and a gross examination of the
slices is performed. At this stage, grossly visible tumour is measured on each slice and the maximum
dimension is recorded. Measurement of the shortest distance between the inked surface and tumour
grossly establishes the width of each of the six resection margins. This information is then used to decide
on sections that may need a more detailed microscopic examination.
Following gross sectioning and examination, selected slices are prepared for microscopic examination by
embedment in paraffin and staining with hematoxylin-eosin, or H&E stain. This procedure allows
different cellular components, such as nuclei, to be readily identifiable based on specific stain colours.
Examination under an optical microscope then reveals a host of information including the microscopic
status of the resection margins, as well as the appearance of the tumour cells. In brief, using the
Nottingham histologic grading score, tumours are assigned a grade from 1 to 3, depending on how
different, or differentiated, the cells appear compared to normal cells32
. Grade 1 tumours tend to contain
cells that appear only somewhat different, and are characterized by slow growth, or low aggressiveness.
On the other hand, grade 3 tumour cells are typically well differentiated from normal cells and associated
with rapid growth, or high aggressiveness. This information is then used to further guide the course of
treatment.
1.3 Emerging breast cancer imaging techniques and surgical
guidance
The methods and technologies that are applied in current clinical treatment of breast cancer have made a
dramatic impact on prognosis. Nevertheless, the advancement and availability of specialized devices such
as lasers and light emitting diodes (LEDs), as well as acoustic, electromagnetic and optical sensors, have
catalyzed the development of highly promising alternatives. For example, recent studies using optical
techniques, such as Raman spectroscopy, auto-fluorescence spectroscopy, optical coherence tomography
and diffuse reflectance spectroscopy, have demonstrated superior soft tissue contrast resulting in margin
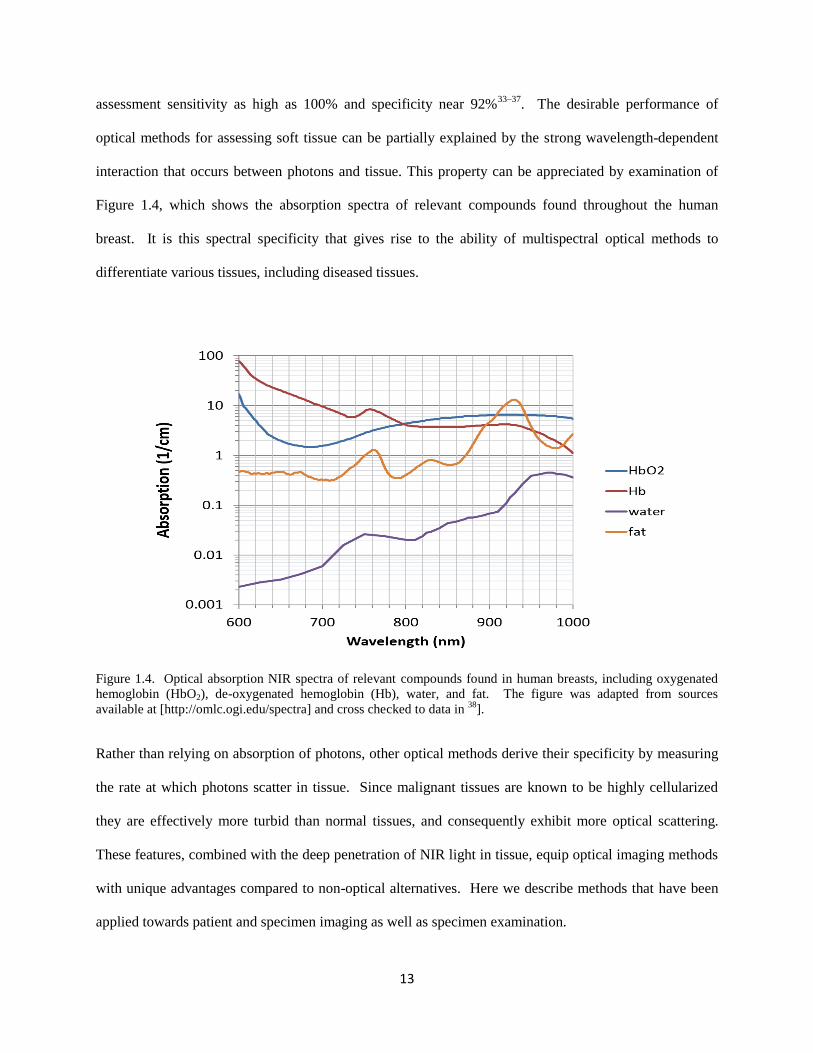
13
assessment sensitivity as high as 100% and specificity near 92%33–37
. The desirable performance of
optical methods for assessing soft tissue can be partially explained by the strong wavelength-dependent
interaction that occurs between photons and tissue. This property can be appreciated by examination of
Figure 1.4, which shows the absorption spectra of relevant compounds found throughout the human
breast. It is this spectral specificity that gives rise to the ability of multispectral optical methods to
differentiate various tissues, including diseased tissues.
Figure 1.4. Optical absorption NIR spectra of relevant compounds found in human breasts, including oxygenated
hemoglobin (HbO2), de-oxygenated hemoglobin (Hb), water, and fat. The figure was adapted from sources
available at [http://omlc.ogi.edu/spectra] and cross checked to data in 38
].
Rather than relying on absorption of photons, other optical methods derive their specificity by measuring
the rate at which photons scatter in tissue. Since malignant tissues are known to be highly cellularized
they are effectively more turbid than normal tissues, and consequently exhibit more optical scattering.
These features, combined with the deep penetration of NIR light in tissue, equip optical imaging methods
with unique advantages compared to non-optical alternatives. Here we describe methods that have been
applied towards patient and specimen imaging as well as specimen examination.
14
1.3.1 Optical in vivo breast cancer imaging
Diffuse optical methods that have been investigated for whole breast imaging can be divided into two
categories. Optical reflectance mammography refers to techniques where the transmitter of optical
signals is placed on the same side of the breast as the receiver39,40
. On the other hand, in optical
transmission mammography, the receiver and transmitter are on opposite sides of the breast41
.
Consequently, the optical signals, or photons, are required to either reflect from or transmit through, the
tissue. The transmitter typically consists of a light source such as an arc lamp, laser or an LED, while the
receiver is usually a CCD camera or a type of photodiode. By measuring the amount of transmitted or
reflected photons, these methods can estimate the type and degree of interaction between various
wavelengths of light and the tissue under scrutiny. In particular, the optical absorption coefficient and the
reduced scattering coefficient can be derived. The derived coefficient values can then be compared to
known values for various molecules and hence tissue types, such as fat, fibro-glandular tissue, or tumour
tissue.
Optical mammography studies on patients with confirmed malignancies have demonstrated significantly
altered tissue properties in and around the lesion area with total hemoglobin concentration sometimes as
much as double that of normal surrounding tissue. In particular, one study of 26 patients with breast
cancer found that cancerous lesions were found to contain reduced lipid content (-8%) as well as
increased water (+7%) and hemoglobin content (+2.4 µM)41
. Furthermore, reduced scattering coefficient
measurements have shown increased scattering in tumour areas thought to result from the expected
increases in cellularity associated with malignancy. The main limitation preventing clinical adoption of
optical mammography techniques is low resolution and its inverse relationship with imaging depth. The
resolution, on the order of cm, implies that optical mammography methods are most useful when used in
conjunction with high resolution methods such as X-ray mammography and sonography. In that context,
15
optical mammography can be thought of as a supplementary procedure aimed to increase the specificity
of current clinical techniques.
1.3.2 Optical ex-vivo breast cancer imaging
Diffuse optical imaging demonstrated the potential for improved specificity in whole breast imaging,
however the poor resolution of the technique eliminated it as a stand-alone replacement of current clinical
modalities. Fortunately, the evaluation of surgical resection margins in excised specimens relies much
more heavily on specimen surface properties, and this represents a unique opportunity for high resolution
optical imaging methods.
Diffuse reflectance spectroscopy (DRS), as the analogue of diffuse optical mammography, operates under
similar principles (see above), but is aimed at surface and shallow sub-surface tissue examination35,42
.
While the use of NIR light in diffuse optical mammography allows the recovery of photons from deep
tissue at low resolution, DRS typically employs shorter-wavelength visible light. The shorter wavelength
light enables higher resolution at the cost of penetration depth, which is typically less than 2 mm. One
DRS investigation of 55 resection margins in 48 patients undergoing BCS yielded an accuracy in
identifying positive and negative margins of 75% 34
.
Due to similarities in instrumentation employed by DRS and auto-fluorescence spectroscopy, the two
techniques are frequently implemented in one device35,36
. Auto-fluorescence imaging begins with
illumination, or excitation, of tissue, usually using an ultraviolet wavelength of light. However, auto-
fluorescence imaging does not rely on the immediately reflected photons. Instead, some photons are
absorbed by molecules in the tissue, causing the molecules to reach a higher energy, or, excited state.
Following excitation, molecules drop through a cascade of lower and lower excited states, eventually
reaching back to the ground state. The energy difference between the ground state and the next excited
state is typically released as a photon of specific energy, or characteristic wavelength. It is these photons

16
that are collected and used to form an image. The intensity of fluorescence can be related to the
concentration of specific compounds or fluorophores, some of which have been linked to cancerous
tissue. In differentiating cancerous from benign tissue types, one study of 56 malignant and benign breast
lesions, employing a combination of DRS and auto-fluorescence, produced a sensitivity of 70.0% and
specificity of 91.7% 36
.
Thanks in part to its near-histologic level resolution, optical coherence tomography (OCT) represents one
of the most promising newcomers in the arena of lumpectomy margin evaluation. During OCT imaging a
suitably short-coherence light beam is split into two beams. One beam is then allowed to interact with
tissue before being recombined inside an interferometer with the non-interacting beam. The level of
interference that occurs between the two recombined beams can be used to estimate the amount of
scattering that photons underwent in the tissue under examination. Since scattering is known to be
elevated in malignant lesions, and reduced in fatty tissue, OCT is able to indirectly differentiate various
tissue types. In practice, OCT is capable of non-destructively examining breast tissue specimens to a
depth of 1 mm – 2 mm with micrometer-level resolution. Unfortunately, long image acquisition times
imply that OCT may not be ideal for time-sensitive intraoperative examination. Furthermore, by
mimicking the scattering properties of tumour areas, cautery artefacts as well as bloody surfaces can
confound OCT. Nevertheless, one investigation of breast lumpectomy specimens yielded a sensitivity of
100% and specificity of 82% 37
.
Raman spectroscopy and imaging offers molecular specificity along with very high resolution, making it
a potential contender for soft tissue specimen examination. Raman spectroscopy takes advantage of
inelastic scattering of photons as they interact with molecules in tissue. When photons travel through
turbid media most experience elastic scattering, however, a small fraction interacts in-elastically thereby
undergoing an energy transfer. Since only specific energy states are permitted, the change in energy of
the photons can be used to infer the nature of the molecular environment where the interaction occurred.
Finally, by filtering out unwanted elastically scattered photons, a Raman spectra of the tissue volume
17
under investigation can be obtained. On the downside, the need for each microscopic volume to be
sampled separately results in excessive scan times, on the order of many hours. This feature has
prevented Raman spectroscopy to be applicable in the intraoperative setting. However, by use of auto-
fluorescence imaging, recent advances in the field have devised methods to optimize the sampling
strategy, producing dramatically improved scan times. A recent study employing this technique for
differentiation of ductal carcinoma from normal tissue in fresh samples was able to achieve a sensitivity
of 95.6% and a specificity of 96.2% 33
. The reported image acquisition rate was near 15 minutes for a 5
mm x 5 mm area. While this rate is still too slow for clinical application on typically-sized lumpectomy
specimens, future advances in data acquisition technology may bring Raman spectroscopy into an
acceptable range.
1.3.3 New approaches to intraoperative lumpectomy specimen examination
Beyond imaging, alternative intraoperative methods have been devised and tested for the examination of
specimens. ClearSightTM
is a novel intraoperative MRI system that was recently implemented for the
study of tissue samples. Based on the same principles as conventional MRI, the device is essentially a
sophisticated MR spectrometer capable of estimating the apparent diffusion coefficient in tissue. Each
measurement takes between 1 and 2 seconds to complete, and interrogates a 4 mm diameter area to a
depth of about 1 mm. In MRI, the apparent diffusion coefficient is a measure of the diffusion, or
mobility, of water. Since malignant tissue is known to be highly cellularized, water molecules are
presented with a higher density of cell membranes, compared to normal tissue. As a result, the apparent
diffusion of water is slower in tumours, and this is reflected in the measurements of the apparent diffusion
coefficient. The prototype ClearSightTM
system was used to assess 77 surgeon-selected specimens, each
measuring 6 mm in diameter and 2 mm to 5 mm in depth. The resulting sensitivity was 91% and
specificity was near 93% 43
. While these numbers are impressive, it remains to be seen if the large
18
sampling volume (analogous to low resolution), limited penetration, and unknown practicability, have an
adverse effect on true clinical results.
Intelligent knife, or iKnife, is an intraoperative tissue analysis method based on rapid evaporative
ionization mass spectrometry (REIMS). The technique consists of an aerosol, or smoke, collection
system coupled to standard electrosurgical tools. During surgery, the fumes that are emitted via cautery
are captured and analyzed using REIMS. Real-time lipidomic profiling is performed, yielding results
classifying tissue as cancerous or normal. The system was used during 81 resections, including 2 for
breast cancer, and was able to correctly match histological diagnosis in all 81 cases44
. Furthermore, the
generated lipidomic profiles were distinguishable between various histological tumour sub-types,
implying high specificity in diagnosis. iKnife seems to be a highly promising approach, however, since
the method does not concretely confirm the presence of the target tumour within the excised specimen, or
estimate the width of the resection margin, there are questions as to the widespread translatability of the
technology.
1.4 Photoacoustic imaging
The imaging methods and intraoperative specimen examination techniques described above highlight
some very promising indications. For example, tissue contrast derived from optical imaging appears to
possess the potential to differentiate cancerous lesions with superior sensitivity and specificity, compared
to conventional methods. Furthermore, altered tissue chromophore concentrations, particularly lipids,
appear to be a strong indicator of disease, as highlighted by the effectiveness of lipidomic profiling in
identifying malignancy44
. Unfortunately, the desirable diagnostic properties of these methods are offset
by either their limited penetration depth or insufficient resolution. The limited sensing depth eliminates
these methods in practical applications concerned with detection of tumours or measurements of
specimen margin width. On the other hand, low resolution implies that these methods alone may not
provide sufficient spatial information to facilitate the conservative nature of BCS. A margin evaluation
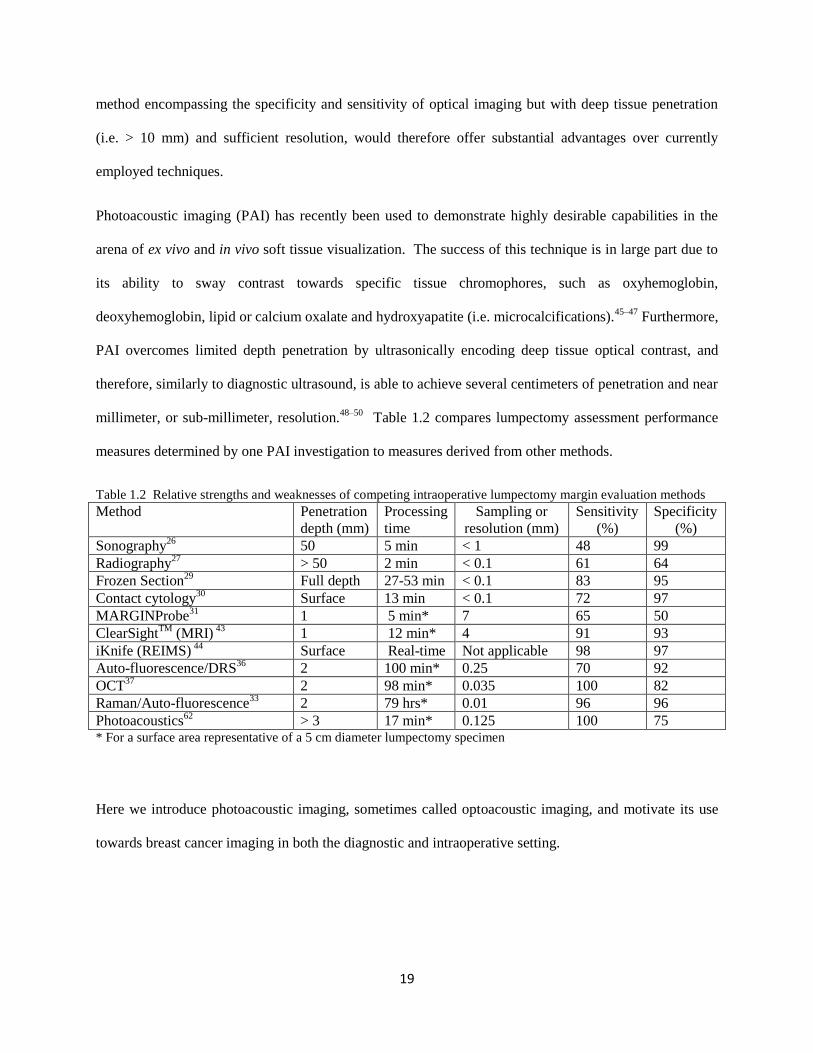
19
method encompassing the specificity and sensitivity of optical imaging but with deep tissue penetration
(i.e. > 10 mm) and sufficient resolution, would therefore offer substantial advantages over currently
employed techniques.
Photoacoustic imaging (PAI) has recently been used to demonstrate highly desirable capabilities in the
arena of ex vivo and in vivo soft tissue visualization. The success of this technique is in large part due to
its ability to sway contrast towards specific tissue chromophores, such as oxyhemoglobin,
deoxyhemoglobin, lipid or calcium oxalate and hydroxyapatite (i.e. microcalcifications).45–47
Furthermore,
PAI overcomes limited depth penetration by ultrasonically encoding deep tissue optical contrast, and
therefore, similarly to diagnostic ultrasound, is able to achieve several centimeters of penetration and near
millimeter, or sub-millimeter, resolution.48–50
Table 1.2 compares lumpectomy assessment performance
measures determined by one PAI investigation to measures derived from other methods.
Table 1.2 Relative strengths and weaknesses of competing intraoperative lumpectomy margin evaluation methods
Method Penetration
depth (mm)
Processing
time
Sampling or
resolution (mm)
Sensitivity
(%)
Specificity
(%)
Sonography26
50 5 min < 1 48 99
Radiography27
> 50 2 min < 0.1 61 64
Frozen Section29
Full depth 27-53 min < 0.1 83 95
Contact cytology30
Surface 13 min < 0.1 72 97
MARGINProbe31
1 5 min* 7 65 50
ClearSightTM
(MRI) 43
1 12 min* 4 91 93
iKnife (REIMS) 44
Surface Real-time Not applicable 98 97
Auto-fluorescence/DRS36
2 100 min* 0.25 70 92
OCT37
2 98 min* 0.035 100 82
Raman/Auto-fluorescence33
2 79 hrs* 0.01 96 96
Photoacoustics62
> 3 17 min* 0.125 100 75 * For a surface area representative of a 5 cm diameter lumpectomy specimen
Here we introduce photoacoustic imaging, sometimes called optoacoustic imaging, and motivate its use
towards breast cancer imaging in both the diagnostic and intraoperative setting.
20
1.4.1 Principles of photoacoustic imaging
Photoacoustic imaging is a hybrid imaging technique based on the photoacoustic (PA) effect. The
photoacoustic effect was discovered over a 130 years ago by Alexander Graham Bell during experiments
with sunlight51
. Bell noticed a distinct sound produced by sudden exposure of materials to sunlight.
While the underlying principles are the same, today, photoacoustic imaging typically employs lasers or
high power LEDs for illumination and ultrasonic detectors, or transducers, for signal detection.
In general, PAI involves illumination of a turbid imaging target by either a pulsed or modulated light
source. Upon illumination, photons are diffusely scattered and absorbed in the target. Volumes inside the
target with relatively high absorption coefficients preferentially absorb the light energy and undergo slight
but rapid heating, followed by near instantaneous thermo-elastic expansion. The expansion generates a
spatially varying three dimensional pressure distribution which is proportional to the locally absorbed
energy. Shortly after the illumination is reduced, the pressure is dissipated as an acoustic transient wave
in the ultrasound frequency range. To generate images, acoustic transducers of appropriate frequency
range, or bandwidth, surround the imaging target and detect the dissipating transient waves. By utilizing
an image reconstruction method such as back-projection, the detected signals can be used to solve for the
original pressure, and hence absorber, distribution52
.
Photoacoustic wave theory:
(Note: Information provided in the remainder of this section is based on “Biomedical Optics: Principles and
Imaging”, L.V. Wang and H.I. Wu, 2007)
To gain further understanding of how properties of the PA signal-carrying wave depend on the
illumination and resultant pressure distribution, it is instructive to consider a fully symmetrical and
homogeneous absorber, such as the dark gray sphere of radius R in Figure 1.5a. It is straight forward to
show that in order to generate acoustic waves with a waveform and amplitude that is a good
representation of the locally absorbed light energy, two conditions must be met. First, the heat generated
21
during the illumination phase must not have sufficient time, referred to as thermal relaxation time τth, to
diffuse out of the region of interest before the illumination is reduced. This is referred to as thermal
confinement and the thermal relaxation time is given by
τth = 𝑑𝑐
2
4𝐷𝑇 1.1
where dc is the size (mm), or characteristic dimension, of the region of interest, and DT is the thermal
diffusivity of the material of interest. Therefore, for the sphere of radius R, and a thermal diffusivity
similar to soft tissue of DT ~ 0.1 mm2/s, the thermal relaxation time is τth = R
2/0.4 s.
56 This means that for
an accurate thermal response profile of a 1 mm sphere, the illumination time must not exceed 1/0.4 = 2.5
s. This can be easily achieved using conventional illumination sources; however, the other condition,
namely stress confinement, is more stringent. Stress confinement implies that the thermo-elastically
induced pressure wave does not have sufficient time, called stress relaxation time τs, to travel out of the
region of interest before the illumination is reduced. The stress relaxation time is given by
τs = 𝑑𝑐
𝑣𝑠 1.2
where vs is the speed of sound in the material of interest, typically around 1.5 mm/µs for soft tissue.
Again, considering the soft tissue sphere with radius R = 1 mm implies that to satisfy stress confinement
the illumination time must not exceed τs = 1/1.5 µs, or about 0.7 µs. This can typically be achieved using
pulsed lasers and LEDs, as well as some arc lamp sources.
According to fluid mechanics, the fractional volume change dV/V of a region of interest expressed as a
function of local change in pressure at constant temperature Δp and local change in temperature at
constant pressure ΔT, can be approximated by
𝑑𝑉
𝑉= 𝛽∆𝑇 − 𝜅𝛥𝑝 1.3
22
where β is the thermal coefficient of volume expansion and κ is the isothermal compressibility. However,
if a very short illumination time τi is implemented then the thermal and stress confinement requirements,
described by Equations 1.1 and 1.2, will be significantly exceeded (i.e. τi << τth and τi << τs ). This
suggests that the fractional volume change during illumination is negligible, or dV/V ~ 0. Therefore,
Equation 1.3 can be written as
∆𝑝 = 𝛽∆𝑇
𝜅 1.4
Equation 1.4 quantifies the local pressure reached as a function of the temperature rise during the
illumination pulse. If we further assume that all absorbed light energy was converted into heat, then the
temperature rise ΔT can be expressed as a function of the locally absorbed light through
𝛥𝑇 = 𝜇𝑎𝐹
𝜌𝐶𝑣 1.5
where µa is the local optical absorption coefficient, F is the local optical fluence, ρ is the local physical
density and Cv is the specific heat capacity at constant volume. Using Equation 1.5 the initial local
pressure reached can be expressed as a function of the local fluence and absorption coefficient,
∆𝑝 = 𝛽𝜇𝑎𝐹
𝜅𝜌𝐶𝑣 = ΓµaF 1.6
where Γ = β / κρCv is the dimensionless Grueneisen parameter which parametrizes the material’s inherent
photoacoustic energy-conversion efficiency, and is estimated to be around Γ ~ 0.24 for soft tissues.56
The
studies undertaken in this work involved soft breast tissues, known to have an optical absorption
coefficient near µa ~ 0.06 cm-1
. As a result, given the utilized fluence of F ~ 4 mJ/cm2, the expected
pressure generated near the surface was ~ 58 Pa.41
Equation 1.6 implies that knowledge of the local fluence F coupled with pressure measurements Δp, can
be used to estimate the local absorption coefficient µa. As discussed above, the value of µa is of
23
significant importance in the characterization of various tissue types. Indeed Figure 1.4 clearly
demonstrates the potential differentiation of tissue constituents based solely on absorption coefficient
values.
Nevertheless, Equation 1.6 tells us nothing about how the initial local pressure within some sample can be
related to the time-resolved acoustic pressure measurements, which arrive and are collected later in time.
In order to relate the non-local pressure wave measurements to the local initial pressure distribution, the
general wave equation describing propagation of pressure waves under thermal confinement is used
( ∇2 –
1
𝑣𝑠 2
𝜕2
𝜕𝑡2 ) p(r, t) = −
𝛽
𝐶𝑝 𝜕𝐻
𝜕𝑡 1.7
where H is the heating function which depends on the temperature, and via Equation 1.5, the optical
fluence, and is given by
H( r,t) = ρCv 𝜕𝑇(𝐫,𝑡)
𝜕𝑡 1.8
The right side of Equation 1.7 describes the initial pressure as a function of position and time, and it is
clear that in order to generate a wave (i.e. ∂H/∂t ≠ 0) the heating function must not be constant. Once
again, this necessary condition is satisfied as long as the optical energy is converted into heat under
thermal confinement.
Equation 1.7 is an inhomogeneous differential equation and the solution, typically provided by invoking
Green’s function for a δ impulse source, is given by
p(r,t) = 1
4𝜋𝑣𝑠 2
𝜕
𝜕𝑡 [
1
𝑡𝑣𝑠 ∫ drʹ p0(rʹ) δ(t -
|𝐫−𝐫ʹ|
𝑣𝑠)] 1.9
Equation 1.9 gives the pressure p at location r and time t, given an initial pressure p0 at location rʹ and
time tʹ= t - |𝐫−𝐫ʹ|
𝑣𝑠 . Thus, by using numerous pressure measurements after illumination of an imaging
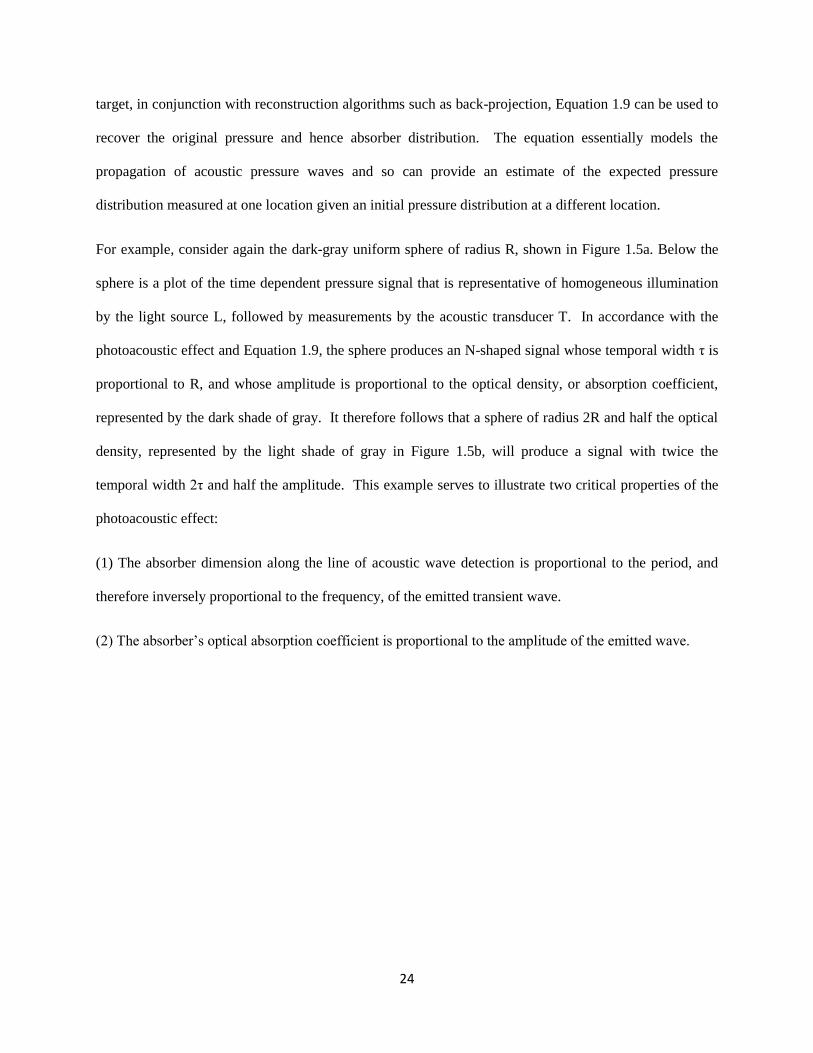
24
target, in conjunction with reconstruction algorithms such as back-projection, Equation 1.9 can be used to
recover the original pressure and hence absorber distribution. The equation essentially models the
propagation of acoustic pressure waves and so can provide an estimate of the expected pressure
distribution measured at one location given an initial pressure distribution at a different location.
For example, consider again the dark-gray uniform sphere of radius R, shown in Figure 1.5a. Below the
sphere is a plot of the time dependent pressure signal that is representative of homogeneous illumination
by the light source L, followed by measurements by the acoustic transducer T. In accordance with the
photoacoustic effect and Equation 1.9, the sphere produces an N-shaped signal whose temporal width τ is
proportional to R, and whose amplitude is proportional to the optical density, or absorption coefficient,
represented by the dark shade of gray. It therefore follows that a sphere of radius 2R and half the optical
density, represented by the light shade of gray in Figure 1.5b, will produce a signal with twice the
temporal width 2τ and half the amplitude. This example serves to illustrate two critical properties of the
photoacoustic effect:
(1) The absorber dimension along the line of acoustic wave detection is proportional to the period, and
therefore inversely proportional to the frequency, of the emitted transient wave.
(2) The absorber’s optical absorption coefficient is proportional to the amplitude of the emitted wave.
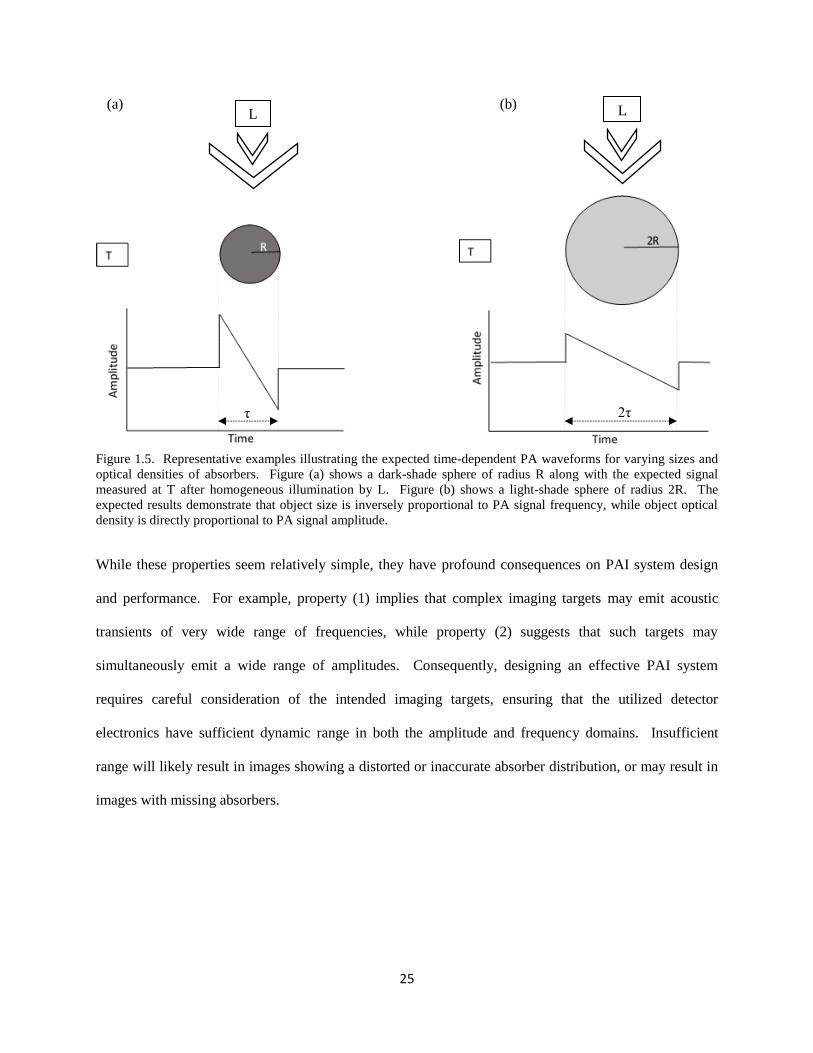
25
(a) (b)
Figure 1.5. Representative examples illustrating the expected time-dependent PA waveforms for varying sizes and
optical densities of absorbers. Figure (a) shows a dark-shade sphere of radius R along with the expected signal
measured at T after homogeneous illumination by L. Figure (b) shows a light-shade sphere of radius 2R. The
expected results demonstrate that object size is inversely proportional to PA signal frequency, while object optical
density is directly proportional to PA signal amplitude.
While these properties seem relatively simple, they have profound consequences on PAI system design
and performance. For example, property (1) implies that complex imaging targets may emit acoustic
transients of very wide range of frequencies, while property (2) suggests that such targets may
simultaneously emit a wide range of amplitudes. Consequently, designing an effective PAI system
requires careful consideration of the intended imaging targets, ensuring that the utilized detector
electronics have sufficient dynamic range in both the amplitude and frequency domains. Insufficient
range will likely result in images showing a distorted or inaccurate absorber distribution, or may result in
images with missing absorbers.
2τ τ
L L
26
1.4.2 Optimizing photoacoustic imaging system design
The previous section outlined basic principles of PAI, illustrating potential considerations necessary in
designing an effective imaging system. For example, since real acoustic transducers have an intrinsically
finite frequency bandwidth, selecting a specific model will allow the detection of signals originating from
an equally specific range of absorber sizes. Absorbers in the mm and sub-millimeter range will typically
generate acoustic signals in the MHz frequency range. On the other hand, detecting signals from
absorbers in the cm range, typical of stage 1 and 2 breast tumours, requires transducers sensitive in the
100 kHz range53
. Hence very careful attention must be given when deciding on transducer bandwidth.
Another major consideration in designing a PAI system is the illumination scheme. Traditionally, pulsed
lasers are employed due to their high-power output enabling high signal-to-noise-ratios (SNR) and
consequently extending the attainable imaging depth in soft tissues to several cm50
. On the downside,
lasers tend to be expensive and technically challenging to maintain within optimal operating condition.
However, recent advances in LED technology are beginning to open new opportunities featuring virtually
maintenance free operation. Nevertheless, a critical aspect of the illumination strategy is ability to select
the appropriate wavelength for specific imaging tasks. Similarly to transducer selection, use of an
inappropriate illumination wavelength can produce results with low SNR, or at worst, completely fail to
generate signals from the intended imaging target. This can be appreciated in Figure 4, which shows the
NIR optical absorption spectrum of relevant tissue chromophores. Inspection of the spectrum reveals the
effectiveness of specific wavelengths in generating signals from specific tissues. For example, if
targeting of lipids is desired, a wavelength of around 930 nm is optimal. Alternatively, the high
absorption of hemoglobin at a wavelength of 600 nm would be effective at detecting vasculature, but
would likely fail at visualizing lipids.
Many variations of PAI technology have been realized, usually tailored towards a specific imaging task.
For example, by using high frequency focused-transducer scanning systems, along with focused
27
illumination, PA microscopy, or PAM, produces images exhibiting microvascular trees with the ability to
resolve single red blood cells54
. While PAM is a great research tool, the often hours-long image
acquisition time and sub-millimeter imaging depth, result in limited clinical potential, particularly towards
breast cancer intraoperative and diagnostic imaging. Therefore, the focus of the remainder of this
discussion will not be on PAM, and instead placed on another major PAI variation, namely photoacoustic
tomography, or PAT.
In PAT imaging, staring or scanning unfocused transducer arrays, coupled with diffuse optical
illumination, can generate PA images in seconds to minutes at clinically relevant depths of several cm and
near-millimeter resolution. Consequently, PAT comprises the ideal contender for diagnostic breast
imaging and intraoperative examination of tissue specimens during BCS. In the following sections the
most prominent investigations to date into the application of PAT towards breast cancer imaging will be
discussed.
1.4.3 In vivo photoacoustic breast imaging
Currently there are four groups that have performed PAT of the breast, two of which focused specifically
on detection and visualization of breast cancer. Oraevski et al. was first to design and test a PAT
instrument dedicated to breast cancer detection55
. However, the novel PAT system employed a fixed
wavelength of 1064 nm and only 12 transducers in a linear configuration, resulting in limited scanning
efficiency and low resolution. Furthermore, the investigation was carried out using ex-vivo mastectomy
specimens, raising questions about in-vivo applicability. Nevertheless, the high-contrast detected
between normal and tumour breast tissues (near 300%) was encouraging, leading the group to develop a
new generation scanner, dubbed laser optoacoustic imaging system (LOIS)56
. Among improvements over
the earlier version was the redesigned transducer array, featuring arc-shaped geometry and 64 ultra-
wideband Polyvinylidene fluoride (PVDF) transducers. Combined with a high-power Alexandrite laser
producing 750 mJ pulses at the more hemoglobin-relevant fixed wavelength of 757 nm, LOIS exhibited
28
exquisite sensitivity capable of detecting tumour mimicking phantoms at sub-millimeter resolution
throughout a semicircular slice 70 mm in radius. Even more excitingly, during clinical testing of the
LOIS imager on 20 patients with US-detected IDC, the system successfully visualized 18 (90%) of the
lesions. In spite of this success, the 2D nature of the LOIS imager as well as fixed-wavelength, prevented
multispectral specificity and volumetric visualization capability, from being realized.
Another group, based at the University of Twente in the Netherlands, developed a PAT based breast
imaging system referred to as the Twente photoacoustic mammoscope, or PAM57
. The system featured a
densely packed array of 590 transducer elements as well as a laser delivering 30 mJ/cm2 fixed-wavelength
1064 nm pulses at a repetition frequency of 10 Hz. The wide-band polymer based (PVDF) transducer
elements were distributed on a planar phase-array in a circular fashion. The array and measurement area
consisted of 40 mm x 40 mm and required a scan time of 25 minutes to sample all transducers using 100
averages per measurement.
While the LOIS system employed an orthogonal illumination scheme, the Twente-PAM featured
transmission-mode illumination. Similar to conventional mammography, this strategy permitted slight
breast compression to be applied between the planar array and a transparent compression paddle, enabling
deeper light penetration and improving the SNR. Additionally, the transmission illumination strategy
ensured that weak, deeply-sourced PA signals, were detected prior to the strong signals from the
illuminated surface, avoiding interference from back-reflected US clutter, further improving the effective
SNR. In comparison, the simultaneous detection of deeply-sourced and surface-sourced PA signals by
the LOIS system caused extensive illumination artefacts requiring sophisticated signal and image
processing, which ultimately reduced the attainable resolution.
The Twente-PAM system was used to scan 13 patients with 12 breast cancers and one cyst.
Unfortunately, various technical difficulties were blamed for 7 scan failures, and only 2 cases were
presented in published work. Nevertheless, the results were sufficient for continuation of the project and
the group recently reported on a study of 30 patients with 33 malignancies using an upgraded version of
29
the scanner58
. The upgrades included a significantly increased measurement area (85 mm x 90 mm) as
well as reduced scan time (10 min), yielding visualization of 32 of the 33 (97%) malignancies. Notably,
to establish the effect of breast density on contrast in PAT images of breast lesions, the study included a
two stage version of the ACR breast density lexicon and concluded that PAT performance appeared
independent of breast density. On the downside, the authors noted the presence of other high intensity
areas throughout the reconstructed imaging volumes, which reduced the specificity of the results. While
the Twente-PAM produced high-contrast 3D images of chromophore distribution, it utilized a sub-
optimal illumination wavelength of 1064 nm, failing to take advantage of multispectral specificity
associated with other optical methods.
By employing transducer arrays with wide 130% fractional bandwidth and relatively low 1 MHz center
frequency, the Oraevsky and Twente groups recognized the value in implementing an imaging system
capable of sensing the optical properties of bulk breast tissue. Since breast tumours are known to contain
altered chromophore concentrations compared to normal tissue, and are typically on the order of cm in
size at the time of diagnosis, this design decision likely played a major role in the successful visualization
of breast lesions. In contrast, by employing narrow-bandwidth and relatively high-frequency transducers,
Kruger et al. developed a dedicated PAT imaging system for angiography of the breast59
. The system
employed a hemispherical transducer array with 128 individual elements arranged in a unique helical
pattern, enabling a relatively wide 64 mm x 64 mm field of view (FOV). The elements had a 5 MHz
center frequency with a fractional bandwidth of 70%. Intriguingly, imaging of healthy breasts of two
volunteers revealed visualization of vasculature at sub-millimeter resolution to a depth of 40 mm using
800 nm, relatively low energy, 1 mJ/cm2 laser pulses. Furthermore, the image acquisition time was only
24 seconds, highlighting the clinical potential of the technique. These results motivated the group to later
redesign their detector array using 512 transducers at a lower 2 MHz center frequency60
. These
developments, along with an adjustable scan pattern, enabled a clinically relevant FOV of up to 24 cm,
encompassing some 90% of breast sizes encountered in practice. Testing of the upgraded system on four
30
healthy volunteers demonstrated visualization of breast vasculature down to an impressive depth of up to
53 mm including the chest wall.
More recently, a group in Munich, Germany, led by D. Razansky, applied their previously-developed
real-time multispectral hand-held PAT scanner to breast imaging61
. However, after testing on two healthy
volunteers, the high center frequency of 4 MHz and relatively narrow acoustic aperture resulted in only 2
centimeters of penetration depth and was limited to visualization of vasculature. Nevertheless, the
multispectral nature of the device permitted differentiation of arterial and venous blood vessels, with the
potential of functional imaging of blood oxygenation in the breast. Finally, by demonstrating similar
contrast in dense and fatty breast tissue, the investigation also demonstrated the independence of imaging
performance on breast density.
1.4.4 Ex vivo photoacoustic imaging of breast cancer
At this point it is clear that the marriage of optical specificity and sensitivity, together with the favourable
diagnostic properties of acoustic imaging, endow PAT with unique advantages in the detection and
assessment of breast lesions. In spite of these favorable properties, PAT has rarely been evaluated for
surgical intervention and only recently for assessing breast lumpectomy margins. In a study performed at
Indiana University, 12 lumpectomy tissue specimens were assessed by employing a commercially
available ultrasonography system (Vevo 2100, FUJIFILM VisualSonics Inc.). By using a fiber optic
bundle, a conventional 21 MHz center-frequency linear transducer was coupled to an optical parametric
oscillator (OPO) pumped laser (NT 300, EKSPLA) delivering up to 100 mJ/pulse. The multispectral
system was able to tune wavelengths in a range from 670 nm to 2300 nm, offering excellent spectral
specificity. By implementing a sophisticated spectral un-mixing approach, together with illumination at
16 wavelengths, the study concluded with a reported 100% sensitivity and 75% specificity in identifying
positive margins62
.
31
However, the investigation included a small number of samples and only (IDC) lesions, raising concerns
over statistical significance as well as ability to evaluate other types of tumours, such as ductal carcinoma
in situ (DCIS) and invasive lobular carcinoma (ILC), which currently represent a substantial clinical
problem.63–65
Furthermore, depending on the standard of practice employed in a particular region or
country, the reported 3 mm imaging penetration may or may not be enough to examine the margin to
sufficient depth.13,14,63
From a technical perspective, the limited view reflection mode imaging geometry,
employed in that study, combined with a high frequency transducer, invited well documented
photoacoustic imaging problems such as limited view and reflection artefacts, as well as shallow tissue
penetration.66,67
And finally, the study utilized BCS specimens that were fixed in 10% formalin as well as
embedded in 2.5 % gelatin; these are both time consuming procedures, and hence, unrealistic with respect
to clinical intraoperative applications. Extension of the results should therefore be made with caution
since the effect of sample preparation on sensitivity and specificity is unknown. Nevertheless, the highly
encouraging results highlighted the potential of a dedicated intraoperative lumpectomy margin evaluation
system based on photoacoustic tomography (PAT).
1.5 Motivation and Objectives
The preceding discussion outlined unmet needs in areas of clinical breast cancer imaging and concluded
with promising alternatives. Specifically, it was made clear that current diagnostic imaging methods
suffer from insufficient specificity and sensitivity to a variety of breast abnormalities, especially as it
pertains to in-situ lesions and dense breasts. This is likely the result of over-dependence of current
methods on tissue physical density. Unfortunately, tissue-density based contrast, as a sole discriminator
of tissue types, has been shown to be too vague in many cases and not applicable in dense breasts. On the
other hand, in differentiating malignancy in the breast, recent developments in optical imaging techniques
have demonstrated molecular-based contrast leading to outstanding sensitivity and specificity, and
perhaps most importantly, independence from breast density.
32
Logically, numerous groups have investigated a variety of breast-tissue optical-imaging approaches, with
a wide range of success. On the downside, most of these attempts resulted in demonstrating either limited
imaging depth, or low resolution, ultimately preventing widespread clinical applicability. However, one
particular optical technique distinguished itself by embodying the clinically desirable attributes of deep
tissue penetration and high resolution along with pure optical contrast. Indeed, PA imaging, and
especially 3D tomography, currently appears to be the best candidate as a superior stand-alone
replacement of currently employed diagnostic imaging modalities.
A review of literature on the subject of PA imaging of breast tissue, in-vivo as well as ex-vivo, reveals a
number of possible approaches with inherent strengths and weaknesses. Intriguingly, in spite of the
volume of work completed to-date, it seems that a PA system capitalizing on the whole sum of
knowledge in the field has yet to be realized. For example, some groups implemented state-of-the-art
acoustic transducer technology, demonstrating high-sensitivity to bulk tissue properties, but failed to
complement the detection scheme with an equally optimized multispectral illumination strategy56,58
.
Other groups employed excellent illumination technology, along with sophisticated spectral un-mixing
methods with sensitivity to multiple tissue chromophores, including lipid and hemoglobin, but neglected
to implement a complimentary PA-signal detection strategy, with an appropriate sensitivity, bandwidth,
or scan geometry60–62
. Consequently, this approach prevented efficient generation or detection of relevant
PA-signals, resulting in poor image quality or lack of tumour-related sensitivity.
Another potential shortcoming of currently ongoing PA investigations into breast imaging has been the
adoption of inflexible design methods, as well as in-vivo system testing. As a result, experimentation and
system optimization via modification of system parameters, was likely difficult, and this is reflected in the
many years seen between publications of results from newer generation systems. In light of these lessons,
an optimized approach to investigation of PAT of breast abnormalities should ideally be flexible to
various system and study design parameters. This strategy will allow rapid progress towards optimization
33
of a breast-cancer-dedicated imaging system based on PAT. Below is a summary of desirable features of
an investigation into PAT of breast cancer.
Rather than beginning with in-vivo PAT imaging, the study of freshly excised breast tissue specimens is
preferable. This stems from the fact that an excised specimen allows access for imaging scans from a full
360-degree range of angles. Consequently, this approach will enable direct testing of various scan and
illumination geometries. Furthermore, the investigation should permit a relevant range of illumination
wavelengths, particularly those related to lipid and hemoglobin absorption. This will reveal empirical
evidence behind the selected illumination strategy. Finally, wide-band, relatively low frequency
transducers should be implemented, permitting the interrogation of bulk-size tissue, typical of breast
tumours at diagnosis.
In the following chapters, these attributes are exploited to determine the capability of PAT to visualize
breast abnormalities in a true clinical setting through imaging of freshly excised lumpectomy specimens
from 100 patients. Chapter 2 outlines the intraoperative nature of the study and describes the technical
parameters of the employed PAT instrument. Moreover, through multispectral PAT imaging of fresh
human as well as animal tissues, Chapter 2 dives into exploration of various cancer-related optical
contrast mechanisms.
After optimization of the PAT imaging protocol from a technical and clinical perspective, a rich source of
clinically-relevant data into visualization of malignancy by PAT was gathered. This data is used in
Chapter 3 to compare the performance of volumetric visualization of IDC lesions by PAT, DCE-MRI,
and pathology. This chapter also investigates the dependence of breast tumour contrast on wavelength
and breast density. Finally, Chapter 3 includes a theoretical discussion about the underlying causes of
artefacts in PAT.
In Chapter 4 the final results of the 100-patient study are summarized. The analysis includes comparison
of breast lesion size as well as extent within freshly excised specimens. The included lesions belong to a
34
variety of histologic sub-types, such as IDC, DCIS, ILC as well as lesions with extensive intraductal
component. The lesion size comparisons between PAT, DCE-MRI, and pathology are done through
linear regression analysis. On the other hand, to compare lesion extent estimates by PAT to gold standard
histopathology, positive and negative predictive values for lumpectomy margin status are calculated.
This enables the effectiveness of PAT to detect positive margins to be evaluated, leading to estimates of
the sensitivity and specificity of this technique. Chapter 4 includes a breakdown of these performance
measures based on the utilized scan geometry, facilitating further performance optimization. The chapter
closes with a variety of case studies, illustrating some of the most clinically confounding scenarios
typically found in practice.
1.6 References
1. Hanahan D, Weinberg RA, Francisco S. The Hallmarks of Cancer Review University of California at San Francisco. 2000;100:57-70.
2. Siegel RL, Miller KD, Jemal A. Cancer Statistics , 2015. CA Cancer J Clin. 2015;65(1):5-29. doi:10.3322/caac.21254.
3. Lynch PJ. Breast anatomy. https://en.wikipedia.org/wiki/Breast#/media/File:Breast_anatomy_normal_scheme.png.
4. Green VL. Mammographic Breast Density and Breast Cancer Risk : Implications of the Breast Density Legislation for Health Care Practitioners. 2016;59(2):419-438.
5. Hermann KP. Applications and literature review of the BI-RADS classification. 2005:1027-1036. doi:10.1007/s00330-004-2593-9.
6. Chiarelli AM, Halapy E, Nadalin V, Shumak R, Malley FO, Mai V. Performance measures from 10 years of breast screening in the Ontario Breast Screening Program , 1990 / 91 to 2000. 2000:34-42.
7. Yaffe MJ, Bloomquist AK, Hunter DM, Mawdsley GE, Chiarlli AM, Muradali D, Mainprize JG. Comparative performance of modern digital mammography systems in a large breast screening program Comparative performance of modern digital mammography systems in a large breast screening program. Med Phys. 2013;40(112):121915. doi:10.1118/1.4829516.
8. Balleyguier C, Ayadi S, Van Nguyen K, Vanel D, Dromain C, Sigal R. BIRADS??? classification in mammography. Eur J Radiol. 2007;61(2):192-194. doi:10.1016/j.ejrad.2006.08.033.
9. Tardivon AA, Athanasiou A, Thibault F, El Khoury C. Breast imaging and reporting data system (BIRADS): Magnetic resonance imaging. Eur J Radiol. 2007;61(2):212-215. doi:10.1016/j.ejrad.2006.08.036.
35
10. Yang WT, Lam WWM, Cheung H, Suen M, King WWK, Metreweli C. Sonographic, magnetic resonance imaging, and mammographic assessments of preoperative size of breast cancer. J Ultrasound Med. 1997;16(12):791-797. http://www.scopus.com/inward/record.url?eid=2-s2.0-0000202613&partnerID=tZOtx3y1.
11. American joint committee on Breast Cancer Staging.
12. Ananthakrishnan P, Balci FL, Crowe JP. Optimizing Surgical Margins in Breast Conservation. Int J Surg Oncol. 2012;2012. doi:10.1155/2012/585670.
13. Lagios MD, Silverstein MJ. Ductal Carcinoma In Situ: Recent History and Areas of Controversy. Breast J. 2015;21(1):21-26. doi:10.1111/tbj.12359.
14. Silverstein MJ, Lagios MD. Treatment Selection for Patients with Ductal Carcinoma In Situ (DCIS) of the Breast Using the University of Southern California/Van Nuys (USC/VNPI) Prognostic Index. Breast J. 2015;21(2):127-132. doi:10.1111/tbj.12368.
15. Waljee JF, Hu ES, Newman LA, Alderman AK. Predictors of Re-excision among Women Undergoing Breast-Conserving Surgery for Cancer. Ann Surg Oncol. 2008;15(5):1297-1303. doi:10.1245/s10434-007-9777-x.
16. Schiller DE, Le LW, Cho BCJ, Youngson BJ, Mccready DR. Factors Associated with Negative Margins of Lumpectomy Specimen: Potential Use in Selecting Patients for Intraoperative Radiotherapy. Ann Ourgical Oncol. 2007;15(3):833-842. doi:10.1245/s10434-007-9711-2.
17. Hall FM, Kopans DB, Sadowsky NL, Homer MJ. Development of Wire Localization for Occult Breast. Radiology. 2013;268(3).
18. Gennari R, Galimberti V, Cicco C De, Zurrida S, Veronesi U, Hon F. Use of Technetium-99m – Labeled Colloid Albumin for Preoperative and Intraoperative Localization of Nonpalpable. 7515(0):692-698.
19. Bosch AM, Kessels AGH, Beets GL, Rupa JD, Koster D, van Engelshoven JMA, von Meyenfeldt MF. Preoperative estimation of the pathological breast tumour size by physical examination, mammography and ultrasound: A prospective study on 105 invasive tumours. Eur J Radiol. 2003;48(3):285-292. doi:10.1016/S0720-048X(03)00081-0.
20. Schaefgen B, Mati M, Sinn HP, et al. Can Routine Imaging After Neoadjuvant Chemotherapy in Breast Cancer Predict Pathologic Complete Response? Ann Surg Oncol. 2015;23(3):789-795. doi:10.1245/s10434-015-4918-0.
21. Gruber I V, Rueckert M, Kagan KO, Staebler A, Siegmann KC, Hartkopf A, Wallwiener D, Hahn M. Measurement of tumour size with mammography, sonography and magnetic resonance imaging as compared to histological tumour size in primary breast cancer. BMC Cancer. 2013;13(June 2005):328. doi:10.1186/1471-2407-13-328.
22. Gu Y-L, Pan S-M, Ren J, Yang Z-X, Jiang G-Q. Role of Magnetic Resonance Imaging in Detection of Pathologic Complete Remission in Breast Cancer Patients Treated With Neoadjuvant Chemotherapy: A Meta-analysis. Clin Breast Cancer. 2017. doi:10.1016/j.clbc.2016.12.010.
23. Menezes GL, Knuttel FM, Stehouwer BL, Pijnappel RM, van den Bosch MA. Magnetic resonance imaging in breast cancer: A literature review and future perspectives. World J Clin Oncol. 2014;5(2):61-70. doi:10.5306/wjco.v5.i2.61.
36
24. Siegmann-Luz KC, Bahrs SD, Preibsch H, Hattermann V, Claussen CD. Management of Breast Lesions Detectable Only on MRI. Rofo. 2014;186(1):30-36. doi:10.1055/s-0033-1335972.
25. Weir L, Worsley D, Bernstein V. The value of FDG positron emission tomography in the management of patients with breast cancer. Breast J. 2005;11(3):204-209. doi:TBJ21625 [pii]\r10.1111/j.1075-122X.2005.21625.x.
26. Britton PD, Sonoda LI, Yamamoto AK, Koo B, Soh E, Goud A. Breast surgical specimen radiographs : How reliable are they ? Eur J Radiol. 2011;79(2):245-249. doi:10.1016/j.ejrad.2010.02.012.
27. Eggemann H, Ignatov T, Dan S. Accuracy of ultrasound-guided breast-conserving surgery in the determination of adequate surgical margins. Breast Cancer Res Treat. 2014;145(1):129-136. doi:10.1007/s10549-014-2932-8.
28. Krekel NMA, Haloua MH, Cardozo AMFL, de Wit RH, Bosch AM, de Widt-Levert LM, Muller S, van der Veen H, Bergers E, de Lange de Klerk ESM, Meijer S, Petrousjka van den Tol M. Intraoperative ultrasound guidance for palpable breast cancer excision ( COBALT trial ): a multicentre , randomised controlled trial. Lancet Oncol. 2013;14(1):48-54. doi:10.1016/S1470-2045(12)70527-2.
29. Emmadi R, Wiley EL. Evaluation of Resection Margins in Breast Conservation Therapy : The Pathology Perspective — Past , Present , and Future. Int J Surg Oncol. 2012;2012:180259. doi:10.1155/2012/180259.
30. Esbona K, Li Z, Wilke LG. Intraoperative Imprint Cytology and Frozen Section Pathology for Margin Assessment in Breast Conservation Surgery : A Systematic Review. Ann Surg Oncol. 2012;19(10):3236-3245. doi:10.1245/s10434-012-2492-2.
31. Thill M, Dittmer C, Baumann K, Friedrichs K, Blohmer J. MarginProbe- Final results of the German post-market study in breast conserving surgery of ductal carcinoma in situ. The Breast. 2014;23(1):94-96. doi:10.1016/j.breast.2013.11.002.
32. Elston CW, Ellis O. Pathological prognostic factors in breast cancer . I . The value of histological grade in breast cancer : experience from a large study with long-term follow-up. 1991:403-410.
33. Koloydenko A, Notingher I. Towards intra-operative diagnosis of tumours during breast conserving surgery by selective-sampling Raman micro-spectroscopy. Phys Med Biol. 2014;59(20):6141-6152. doi:10.1088/0031-9155/59/20/6141.
34. Brown JQ, Bydlon TM, Richards LM, Yu B, Kennedy SA, Geradts J, Wilke LG, Junker MK, Gallagher J, Barry WT, Ramanujam N. Optical Assesssment of Tumor Resection Margins in the Breast. IEEE J Sel Top Quantum Electron. 2010;16(3):530-544.
35. Lue N, Kang JW, Yu C, Barman I, Dingari NC, Field MS, Dasari RR, Fitzmaurice M. Portable Optical Fiber Probe-Based Spectroscopic Scanner for Rapid Cancer Diagnosis : A New Tool for Intraoperative Margin Assessment. PLoS One. 2012;7(1). doi:10.1371/journal.pone.0030887.
36. Breslin TM, Xu F, Palmer GM, Zhu C, Gilchrist KW, Ramanujam N. Autofluorescence and Diffuse Reflectance Properties of Malignant and Benign Breast Tissues. Ann Surg Oncol. 2004;11(1):65-70. doi:10.1245/ASO.2004.03.031.
37. Nguyen FT, Zysk AM, Chaney EJ, Kotynek JG, Oliphant UJ, Bellafiore FJ, Rowland KM, Johnson PA,
37
Boppart SA. Intraoperative Evaluation of Breast Tumor Margins with Optical Coherence Tomography. Cancer Res. 2009;69(22):8790-8797. doi:10.1158/0008-5472.CAN-08-4340.
38. Jacques SL. Corrigendum : Optical properties of biological tissues : 2013;58:5007-5008. doi:10.1088/0031-9155/58/14/5007.
39. Cerussi AE, Berger AJ, Bevilacqua F, Shah N, Jakubowski D, Butler J, Holcombe RF, Tromberg BJ. Sources of Absorption and Scattering Contrast for Near-Infrared Optical Mammography 1. 2001:211-218.
40. Jakubowski D.B., Cerussi A. E., Bevilacqua F. SN. Monitoring neoadjuvant chemotherapy in breast cancer using quantitative diffuse optical spectroscopy: a case study. J Biomed Opt. 2003;9(1):230-238.
41. Anderson PG, Kainerstorfer JM, Sassaroli A, Krishnamurthy N, Homer MJ, Graham RA, Fantini S. Broadband optical mammography: Chromophore concentration and hemoglobin saturation contrast in breast cancer. PLoS One. 2015;10(3):1-23. doi:10.1371/journal.pone.0117322.
42. Bydlon TM, Barry WT, Kennedy S a, Brown JQ, Galagher JE, Wilke LG, Geradts J, Ramanujam N. Advancing optical imaging for breast margin assessment: an analysis of excisional time, cautery, and patent blue dye on underlying sources of contrast. PLoS One. 2012;7(12):e51418. doi:10.1371/journal.pone.0051418.
43. Papa M, Allweis T, Karni T, Sandbanks J, Konichezky M, Diment J, Guterman A, Shapiro M, Peles Z, Maishar R, Gur A, Kolka E, Brem R. An intraoperative MRI system for margin assessment in breast conserving surgery: Initial results from a novel technique. J Surg Oncol. 2016;114(1):22-26. doi:10.1002/jso.24246.
44. Balog J, Sasi-szabó L, Kinross J, Lewis MR, Muirhead LJ, Vesekov K, Mirnezami R, Dezso B, Damjanovich L, Darzi A, Nicholson JK, Takats Z. Intraoperative Tissue Identification Using Rapid Evaporative Ionization Mass Spectrometry. 2013;5(194).
45. Kim GR, Kang J, Kwak JY, Chang JH, Kim S Il, Youk JH. Photoacoustic Imaging of Breast Microcalcifications : A Preliminary Study with 8-Gauge Core-Biopsied Breast Specimens. PLoS One. 2014;9(8):8-10. doi:10.1371/journal.pone.0105878.
46. Wang B, Karpiouk A, Yeager D. In vivo intravascular ultrasound-guided photoacoustic imaging of lipid in plaques using an animal model of atherosclerosis. Ultrasound Med Biol. 2013;38(12):2098-2103. doi:10.1016/j.ultrasmedbio.2012.08.006.In.
47. Dogra VS, Chinni BK, Valluru KS, Joseph J V. Multispectral Photoacoustic Imaging of Prostate Cancer : Preliminary Ex ‑ vivo Results. J Clin Imaging Sci. 2015;3(3):1-7. doi:10.4103/2156-7514.119139.
48. Kim C, Erpelding TN, Jankovic L, Pashley MD, Wang L V. Deeply penetrating in vivo photoacoustic imaging using a clinical ultrasound array system. Biomed Opt Express. 2010;1(1):335-340.
49. Song KH, Wang L V. Deep reflection-mode photoacoustic imaging of biological tissue. J Biomed Opt. 2007;12(December):1-3. doi:10.1117/1.2818045.
50. Wang L V, Hu S. Photoacoustic Tomography : In Vivo Imaging from Organelles to Organs. Science (80- ). 2012;335(March):1458-1462.
38
51. Bell AG. On the production and reproduction of sound by light. Am J Sci. 1880;20(118):305-324.
52. Xu M, Wang L V. Universal back-projection algorithm for photoacoustic computed tomography. Phys Rev E. 2005;71(1):16706. doi:10.1103/PhysRevE.71.016706.
53. Xia W, Piras D, Van Hespen JCG, van Velhdhoven S, Prins C, van Leeuwen TG, Steenbergen W, Manohar S. An optimized ultrasound detector for photoacoustic breast tomography. Med Phys. 2012;40(3):1-37. doi:10.1118/1.4792462.
54. Strohm EM, Moore MJ, Kolios MC. Single Cell Photoacoustic Microscopy : A Review. 2016;22(3).
55. Oraevski AA, Andreev VG, Karabutov AA, RD Fleming, Z Gatalica, H Singh, RO Esenaliev. Laser opto-acoustic imaging of the breast: detection of cancer angiogenesis. Proc SPIE. 1999;3597:352-363.
56. Ermilov S a., Khamapirad T, Conjusteau A, Leonard MH, Lacewell R, Mehta K, Miller T, Oraevski AA. Laser optoacoustic imaging system for detection of breast cancer. J Biomed Opt. 2009;14(2):24007. doi:10.1117/1.3086616.
57. Manohar S, Vaartjes SE, van Hespen JCG, Klasse JM, van den Engh FM, Steenbergen W, van Leeuwen TG. Initial results of in vivo non-invasive cancer imaging in the human breast using near-infrared photoacoustics. Opt Express. 2007;15(19):12277-12285. doi:10.1364/OE.15.012277.
58. Heijblom M, Piras D, van den Engh FM, van der Schaaf M, Klasse JM, Steenbergen W, Manohar S. The state of the art in breast imaging using the Twente Photoacoustic Mammoscope: results from 31 measurements on malignancies. Eur Radiol. 2016;26(11):3874-3887. doi:10.1007/s00330-016-4240-7.
59. Kruger RA, Lam RB, Reinecke DR, SP Del Rio, Doyle RP. Photoacoustic angiography of the breast. doi:10.1118/1.3497677.
60. Kruger RA, Kuzmiak CM, Lam RB, Reinecke DR, SP Del Rio, Steed D. Dedicated 3D photoacoustic breast imaging. Med Phys. 2013;40(11):113301. doi:10.1118/1.4824317.
61. Deán-ben XL, Fehm TF, Gostic M, Razansky D. Volumetric hand-held optoacoustic angiography as a tool for real-time screening of dense breast. 2016;259(3):253-259. doi:10.1002/jbio.201500008.
62. Li R, Wang P, Lan L, Lloyd jr. FP, Goergen CJ, Chen S, Cheng J. Assessing breast tumor margin by multispectral photoacoustic tomography. Biomed Opt Express. 2015;6(4):1273. doi:10.1364/BOE.6.001273.
63. Hainsworth A, Fosh B, Raymond W, Eaton M, Mcleay W. Ductal carcinoma in situ : breast-conserving surgery without radiotherapy. ANZ J Surg. 2015;85(4):245-248. doi:10.1111/ans.12655.
64. Subhedar P, Olcese C, Patil S, Morrow M, Zee KJ Van. Decreasing Recurrence Rates for Ductal Carcinoma In Situ : Analysis of 2996 Women Treated with Breast-Conserving Surgery Over 30 Years. Ann Surg Oncol. 2015;(April):3273-3281. doi:10.1245/s10434-015-4740-8.
65. Newcomb P a., Trentham-Dietz A, Hampton JM, Egan KM, Titus-Ernstoff L, Andersen SW, Greenberg ER, Willett WC. Late age at first full term birth is strongly associated with lobular breast cancer. Cancer. 2011;117:1946-1956. doi:10.1002/cncr.25728.
39
66. Ellwood R, Cox B, Zhang E, Beard P. Photoacoustic imaging using acoustic reflectors to enhance planar arrays. J Biomed Opt. 2014;19(12):126012. doi:10.1117/1.JBO.
67. Jaeger M, Harris-Birtill D, Gertsch A, O’Flynn E, Bamber J. Deformation-compensated averaging for clutter reduction in epiphotoacoustic imaging in vivo. J Biomed Opt. 2012;17(6):66007. doi:10.1117/1.JBO.17.6.066007.
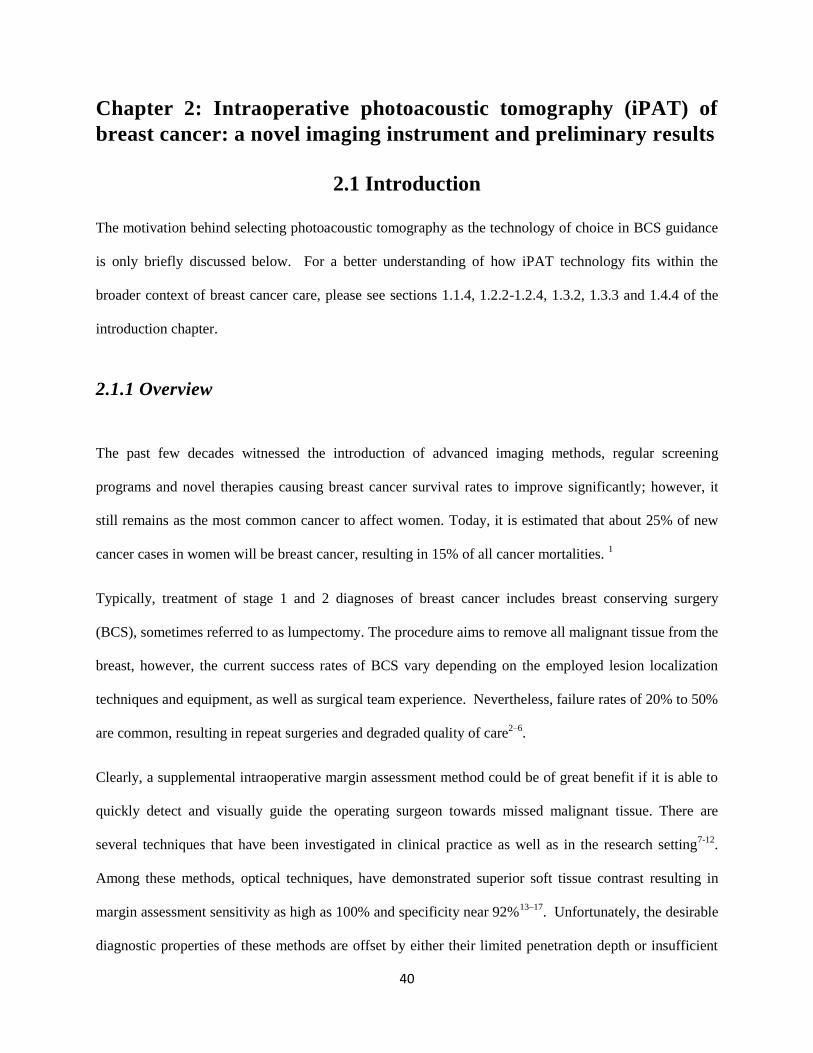
40
Chapter 2: Intraoperative photoacoustic tomography (iPAT) of
breast cancer: a novel imaging instrument and preliminary results
2.1 Introduction
The motivation behind selecting photoacoustic tomography as the technology of choice in BCS guidance
is only briefly discussed below. For a better understanding of how iPAT technology fits within the
broader context of breast cancer care, please see sections 1.1.4, 1.2.2-1.2.4, 1.3.2, 1.3.3 and 1.4.4 of the
introduction chapter.
2.1.1 Overview
The past few decades witnessed the introduction of advanced imaging methods, regular screening
programs and novel therapies causing breast cancer survival rates to improve significantly; however, it
still remains as the most common cancer to affect women. Today, it is estimated that about 25% of new
cancer cases in women will be breast cancer, resulting in 15% of all cancer mortalities. 1
Typically, treatment of stage 1 and 2 diagnoses of breast cancer includes breast conserving surgery
(BCS), sometimes referred to as lumpectomy. The procedure aims to remove all malignant tissue from the
breast, however, the current success rates of BCS vary depending on the employed lesion localization
techniques and equipment, as well as surgical team experience. Nevertheless, failure rates of 20% to 50%
are common, resulting in repeat surgeries and degraded quality of care2–6
.
Clearly, a supplemental intraoperative margin assessment method could be of great benefit if it is able to
quickly detect and visually guide the operating surgeon towards missed malignant tissue. There are
several techniques that have been investigated in clinical practice as well as in the research setting7-12
.
Among these methods, optical techniques, have demonstrated superior soft tissue contrast resulting in
margin assessment sensitivity as high as 100% and specificity near 92%13–17
. Unfortunately, the desirable
diagnostic properties of these methods are offset by either their limited penetration depth or insufficient

41
resolution. A margin evaluation method encompassing the specificity and sensitivity of optical imaging
but with deep tissue penetration (i.e. > 10 mm) and sufficient resolution, would therefore offer substantial
advantages over currently employed techniques.
3D photoacoustic tomography (PAT) has recently been used to demonstrate highly desirable capabilities
in the arena of ex vivo and in vivo soft tissue visualization. The success of this technique is in large part
due to its ability to sway contrast towards specific tissue chromophores, such as oxyhemoglobin,
deoxyhemoglobin, lipid or calcium oxalate and hydroxyapatite (i.e. microcalcifications).18–20
Furthermore,
PAT overcomes limited depth penetration by ultrasonically encoding deep tissue optical contrast, and
therefore, similarly to diagnostic ultrasound, is able to achieve several centimeters of penetration and near
millimeter, or sub-millimeter, resolution21–23
.
In spite of these favorable properties, PAT has rarely been evaluated for surgical intervention and only
recently for assessing breast lumpectomy margins. In a study performed at Indiana University, 12
lumpectomy tissue specimens were assessed by employing a commercially available hybrid US and
photoacoustic imaging system with reported 100% sensitivity and 75% specificity24
. However, the
investigation included a small number of samples and only invasive ductal carcinoma (IDC) lesions,
raising concerns over statistical significance as well as ability to evaluate other types of tumours, such as
ductal carcinoma in situ (DCIS) and invasive lobular carcinoma (ILC), which currently represent a
substantial clinical problem25–27
. Other potential shortcomings of that investigation included insufficient
imaging depth, sub-optimal scan geometry as well as extensive and time-consuming specimen
processing3,4,25,28,29
. Extension of the results should, therefore, be made with caution since the effect of
sample preparation on sensitivity and specificity is unknown. Nevertheless, the results were highly
encouraging highlighting the potential of a dedicated intraoperative lumpectomy margin evaluation
system based on photoacoustic tomography (PAT).
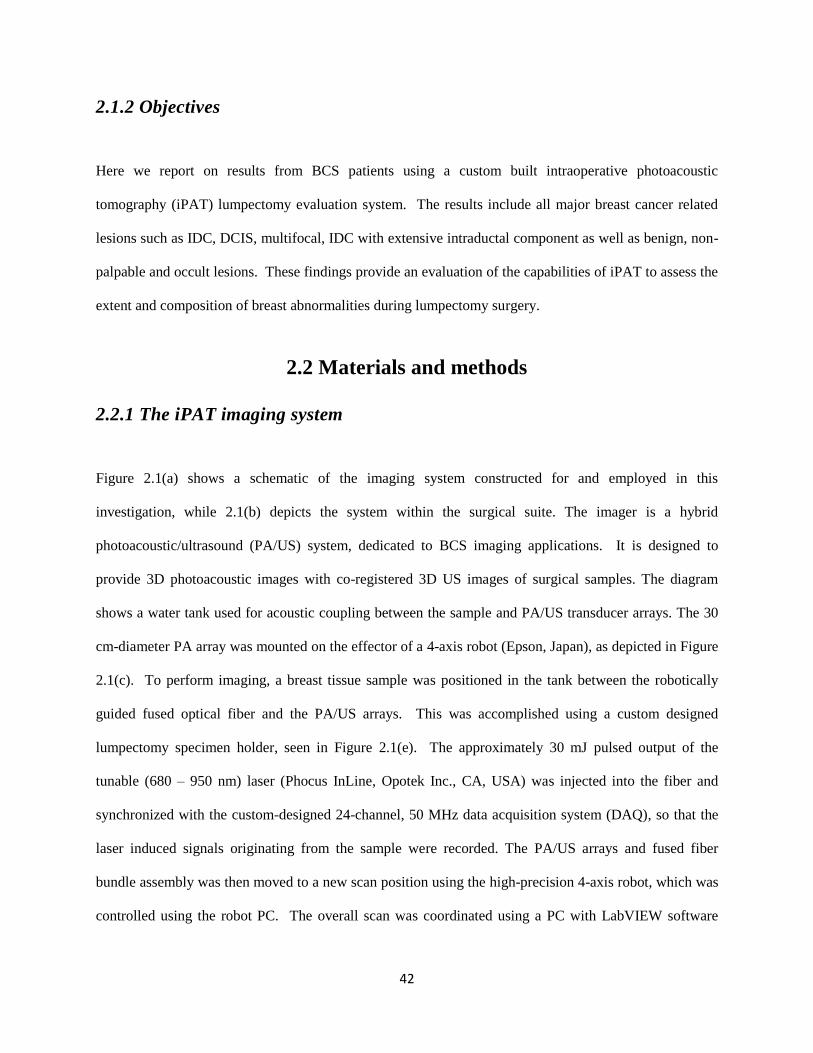
42
2.1.2 Objectives
Here we report on results from BCS patients using a custom built intraoperative photoacoustic
tomography (iPAT) lumpectomy evaluation system. The results include all major breast cancer related
lesions such as IDC, DCIS, multifocal, IDC with extensive intraductal component as well as benign, non-
palpable and occult lesions. These findings provide an evaluation of the capabilities of iPAT to assess the
extent and composition of breast abnormalities during lumpectomy surgery.
2.2 Materials and methods
2.2.1 The iPAT imaging system
Figure 2.1(a) shows a schematic of the imaging system constructed for and employed in this
investigation, while 2.1(b) depicts the system within the surgical suite. The imager is a hybrid
photoacoustic/ultrasound (PA/US) system, dedicated to BCS imaging applications. It is designed to
provide 3D photoacoustic images with co-registered 3D US images of surgical samples. The diagram
shows a water tank used for acoustic coupling between the sample and PA/US transducer arrays. The 30
cm-diameter PA array was mounted on the effector of a 4-axis robot (Epson, Japan), as depicted in Figure
2.1(c). To perform imaging, a breast tissue sample was positioned in the tank between the robotically
guided fused optical fiber and the PA/US arrays. This was accomplished using a custom designed
lumpectomy specimen holder, seen in Figure 2.1(e). The approximately 30 mJ pulsed output of the
tunable (680 – 950 nm) laser (Phocus InLine, Opotek Inc., CA, USA) was injected into the fiber and
synchronized with the custom-designed 24-channel, 50 MHz data acquisition system (DAQ), so that the
laser induced signals originating from the sample were recorded. The PA/US arrays and fused fiber
bundle assembly was then moved to a new scan position using the high-precision 4-axis robot, which was
controlled using the robot PC. The overall scan was coordinated using a PC with LabVIEW software
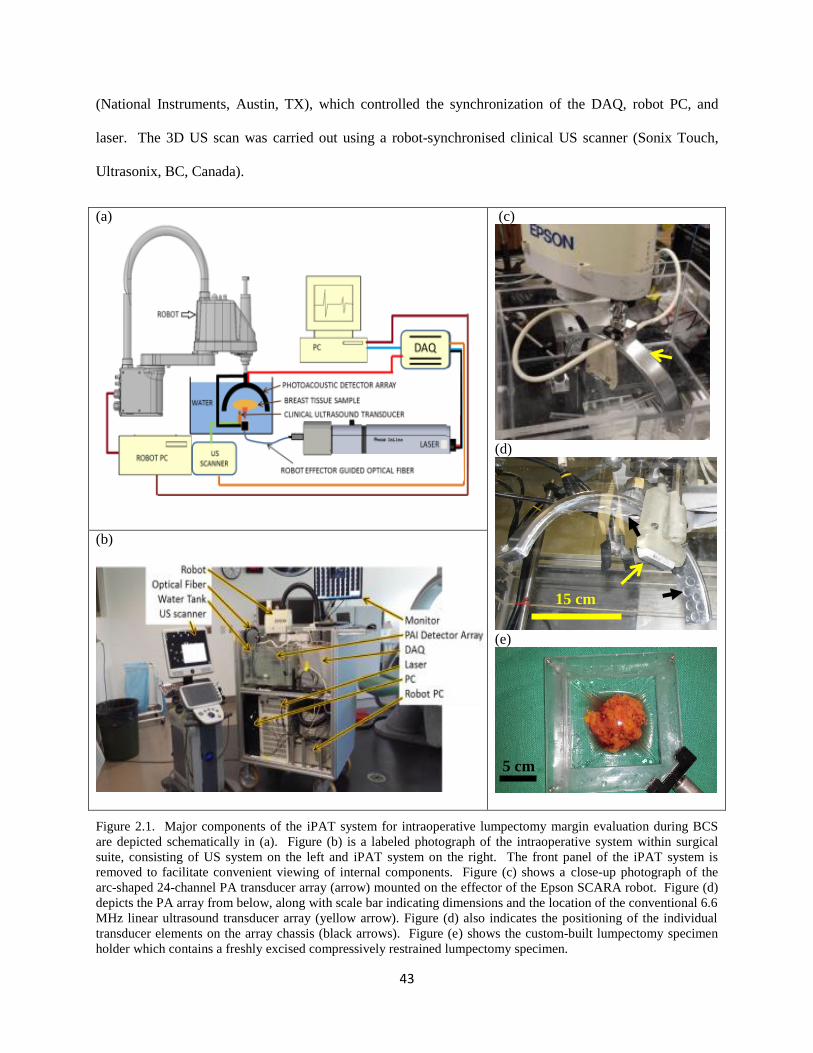
43
(National Instruments, Austin, TX), which controlled the synchronization of the DAQ, robot PC, and
laser. The 3D US scan was carried out using a robot-synchronised clinical US scanner (Sonix Touch,
Ultrasonix, BC, Canada).
(a)
(c)
(d)
(e)
(b)
Figure 2.1. Major components of the iPAT system for intraoperative lumpectomy margin evaluation during BCS
are depicted schematically in (a). Figure (b) is a labeled photograph of the intraoperative system within surgical
suite, consisting of US system on the left and iPAT system on the right. The front panel of the iPAT system is
removed to facilitate convenient viewing of internal components. Figure (c) shows a close-up photograph of the
arc-shaped 24-channel PA transducer array (arrow) mounted on the effector of the Epson SCARA robot. Figure (d)
depicts the PA array from below, along with scale bar indicating dimensions and the location of the conventional 6.6
MHz linear ultrasound transducer array (yellow arrow). Figure (d) also indicates the positioning of the individual
transducer elements on the array chassis (black arrows). Figure (e) shows the custom-built lumpectomy specimen
holder which contains a freshly excised compressively restrained lumpectomy specimen.
5 cm
15 cm
44
2.2.2 The PA array, calibration, illumination, and scan synergy
The custom designed and built, 30 cm diameter PA transducer array consisted of 24 disk-shaped PVDF
elements measuring 15 mm in diameter each. The elements were positioned and secured in an arc shaped
aluminum housing (Fig. 2.1d) such that the focus of the array was concentric with respect to the center of
curvature. This arrangement, along with the approximately 15 degree angular acceptance of each
transducer element, measured at -6dB, allowed for an effective isotropic imaging sub-volume of 3 cm x 3
cm x 3 cm. Near complete angular coverage of the imaging sub-volume was achieved by rotation of the
arc array through 10 steps of 18 degrees each. This resulted in 240 projections per sub-volume and
mimicked the performance of a staring and sparse 240-channel hemispherical array. The spatial locations
of the transducers, with respect to the 3 cm3
imaging sub-volume, were determined experimentally via
robotic calibration scan, developed previously and detailed elsewhere30–33
. Importantly, this approach
eliminated the dependence of image reconstruction accuracy on array fabrication precision.
To complement the transducer-derived 3 cm x 3 cm x 3 cm imaging sub-volume, a high-power fused-
input optical fiber bundle (Lumen Dynamics Group Inc., Mississauga, ON, Canada) was positioned 6 cm
below the imaging volume (Fig 2.1a), such that the minimum beam diameter intersecting the volume was
also 3 cm. The resulting maximum tissue surface fluence was approximately 4 mJ/cm2, which is well
below the damage threshold and well below the maximum permissible exposure for in vivo applications.34
Crucially, this trans-illumination imaging mode combined with a delay generator (TCU-1, Continuum,
Santa Clara, California) allowed the time-gated detection of laser induced PA signals so that strongest
signals originating at tissue surface would not be permitted to interact with the detector array until the
deeply sourced, weak signals, were recorded. This approach preserved the full dynamic range of the
detection electronics and prevented back-scattered US “clutter” signals from interfering with direct time-
45
of-flight PA signal measurements. In this way, reflection artefacts commonly associated with deep tissue
reflection mode PA imaging, were addressed 29
.
In order to facilitate scans of specimens up to 11 cm in diameter, the total imaging volume was expanded
by horizontal translation of the PA array and fiber bundle assembly along with the 3 cm3
imaging sub-
volume. This was implemented along a square x-y coordinate grid of 100 horizontal scan positions
centered 9 mm apart. Consequently, the imaging scan amounted to 24,000 projections per total imaging
volume (i.e. 240/sub-volume x 100 sub-volumes). The 9 mm horizontal step size was experimentally
found to be close to an optimal compromise between scan speed and sufficient sampling. The 24-channel
iPAT system combined with a 20 Hz laser was capable of scanning this total volume of 11 cm x 11 cm x
3 cm (L x W x H) in under 6 minutes. The iPAT scan was followed by a robotically guided 6.6 MHz US
scan, which took approximately 90 seconds and examined the equivalent volume. This volume capacity
encompasses the vast majority of lumpectomy specimens, as was indicated by the collaborating surgeon.
However, due to a reduction in the iPAT system’s signal-to-noise-ratio (SNR), experienced beyond 2 – 3
cm of imaging depth, the imaging protocol was to invert, or flip the specimen and repeat the scan for the
opposite side. Nevertheless, this dual side scan imaging protocol was only implemented when
intraoperative time constrains permitted.
Due to the 20 minute time constraint imposed by the intraoperative nature of the imaging protocol, only 2
wavelengths were able to be utilized in most cases. The expected dominant chromophore distribution
inside lumpectomies, namely adipose tissue and deoxyhemoglobin, motivated use of 930 nm and 690 nm
wavelengths, respectively.
2.2.3 Image reconstruction, image stitching, co-registration and resolution
To generate sub-volume images using the acoustic time-of-flight measurements performed by the iPAT
system, the recorded pressure signals were first passed through a Butterworth bandpass filter (100 kHz –
46
3 MHz). The universal filtered backprojection (FBP) algorithm was then implemented35
. The FBP
method preserved the rich frequency content of broadband PA signals, necessary for generating
boundary-enhanced images. It essentially related the acoustic amplitude measured at the transducer
positions, to the initial pressure at each voxel position in the imaging volume at the moment of
illumination. The approach assumed a spherical detection surface geometry with 240 measurement
locations. It also included a simple apodization function that limited the contribution of each amplitude
projection to a solid angle corresponding to 10 degrees. While image reconstruction using time reversal
is probably more physically accurate, we found the computational needs of that method to be too great in
the context of practical and time sensitive applications.
The full imaging volume was composed of 100 individual sub-volumes measuring 3 cm3 each, and
centered 9 mm apart. Consequently, stitching these sub-volumes together resulted in significant overlap,
or heterogeneous spatial oversampling. This effect, combined with the laser output variability from shot
to shot, manifested in the final composite image as a noticeable grid pattern. To compensate for the
resulting uneven bulk-voxel intensity between neighboring sub-volumes, image stitching was carried out
in the gradient domain using the Haar wavelet 2D integration method36
. A disk-shaped 1% agar
concentration phantom with radially directed graphite spokes was prepared to evaluate the performance
of gradient domain stitching versus spatial domain stitching. The graphite concentration in the spokes
was 1 g/L. After the phantom was fully cured it was secured in the iPAT water tank and scanned at a
wavelength of 690 nm.
Co-registration of the iPAT and US images was performed using Horn’s absolute orientation method.37
The method called for a minimum of 3 known coordinates in each of the two (PA and US) Cartesian
coordinate systems. An agar gel phantom, with 4 spherical graphite-containing inclusions, was prepared
in order to calibrate the two systems. The inclusions were clearly visualized and the center coordinates of
the spheres were selected for co-registration.
47
An imaging target consisting of a black surgical suture was selected to determine the iPAT system
resolution. Full-width-half-max (FWHM) analysis of the line profile of the suture target was carried out
to estimate the effective resolution value. The FBP, image stitching, and co-registration were all
performed in MATLAB.
2.2.4 iPAT imaging of ex-vivo tissue
In order to evaluate iPAT’s ability to differentiate various ex-vivo soft tissues, three tissue types were
selected for imaging system testing. Based on their differing lipid and hemoglobin concentrations, poultry
cuts of thigh fat and muscle tissue, as well as breast muscle, were used to produce a soft tissue specimen
measuring approximately 6 cm in diameter. Specifically, breast muscle was used as the background, or
tissue bed, while small cuts of thigh muscle and fat were used as inclusions. Two sections of the breast
muscle tissue bed were excised and the thigh and fat tissue inclusions were inserted into the resulting
surgical cavity. The specimen was then scanned using a wavelength of 690 nm to detect
deoxyhemoglobin contrast, 930 nm for lipids, and 1064 nm due to its frequent use in near infrared
photoacoustic imaging research.
2.2.5 Lumpectomy specimen collection and preparation
Patients diagnosed by biopsy with breast cancer or a related breast abnormality, and scheduled to undergo
BCS, were asked to participate in the study according to the institutional review board of the University
of Western Ontario (UWO Research Ethics Board # 105467; LHSC Tissue Archive # 888; Lawson
Approval #R-14-311). The intraoperative imaging protocol permitted the surgical standard of care to be
unaffected by the iPAT and US imaging scans. The freshly excised lumpectomy specimens were placed
inside a customized saline filled Ziploc® bag and handed to the iPAT specialist for scanning. In the
48
meantime, the patient was sutured and prepared for surgical suite discharge. Prior to discharge the
specimen was handed back to the surgeon, who then passed it on to pathology.
2.3 Results
2.3.1 Image reconstruction, stitching, and system resolution
The result of image reconstruction and stitching in the gradient domain, as compared to the spatial
domain, can be appreciated in Figure 2.2. The figure shows outcome of scanning the spoked
agar/graphite gel phantom followed by FBP reconstruction and sub-volume stitching in the spatial domain
(a), as well as in the gradient domain (b). The relative brightness intensity in the images is proportional to
the optical absorption coefficient of the phantom, and has been normalized with respect to the average
pixel intensity within a particular slice. The selected z-slices are separated by 1 mm and depict the
graphite spoke inclusions as hyper-intense on the iPAT scan. On the other hand, the photograph in (e)
shows the same graphite inclusions as dark gray. The effect of uneven illumination and heterogeneous
spatial sampling, between the stitched sub-volumes, manifested in the final composite image as a grid
pattern, easier to see in the zoomed-in slice in (c). Intriguingly, the scan-grid artefacts appear to be
effectively eliminated by implementing stitching in the gradient domain, as shown in (d). Equally
important however, is the apparent lack of any significant side-effects on the final image results.
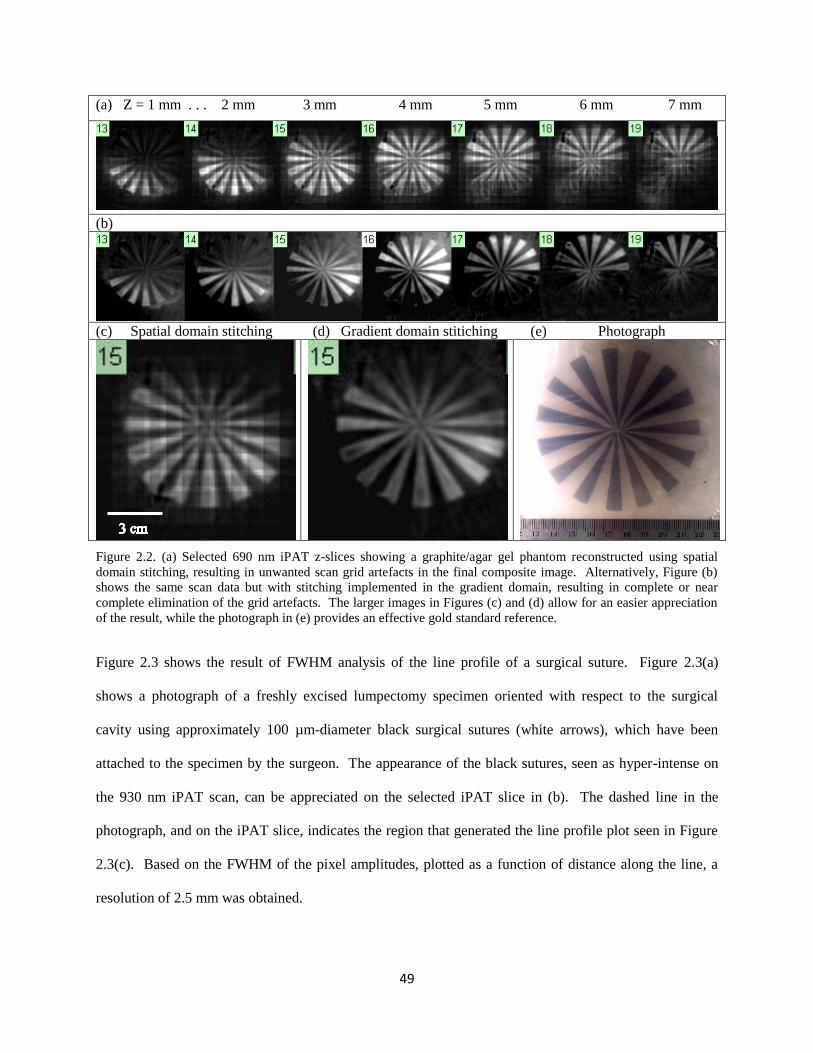
49
(a) Z = 1 mm . . . 2 mm 3 mm 4 mm 5 mm 6 mm 7 mm
(b)
(c) Spatial domain stitching (d) Gradient domain stitiching (e) Photograph
Figure 2.2. (a) Selected 690 nm iPAT z-slices showing a graphite/agar gel phantom reconstructed using spatial
domain stitching, resulting in unwanted scan grid artefacts in the final composite image. Alternatively, Figure (b)
shows the same scan data but with stitching implemented in the gradient domain, resulting in complete or near
complete elimination of the grid artefacts. The larger images in Figures (c) and (d) allow for an easier appreciation
of the result, while the photograph in (e) provides an effective gold standard reference.
Figure 2.3 shows the result of FWHM analysis of the line profile of a surgical suture. Figure 2.3(a)
shows a photograph of a freshly excised lumpectomy specimen oriented with respect to the surgical
cavity using approximately 100 µm-diameter black surgical sutures (white arrows), which have been
attached to the specimen by the surgeon. The appearance of the black sutures, seen as hyper-intense on
the 930 nm iPAT scan, can be appreciated on the selected iPAT slice in (b). The dashed line in the
photograph, and on the iPAT slice, indicates the region that generated the line profile plot seen in Figure
2.3(c). Based on the FWHM of the pixel amplitudes, plotted as a function of distance along the line, a
resolution of 2.5 mm was obtained.
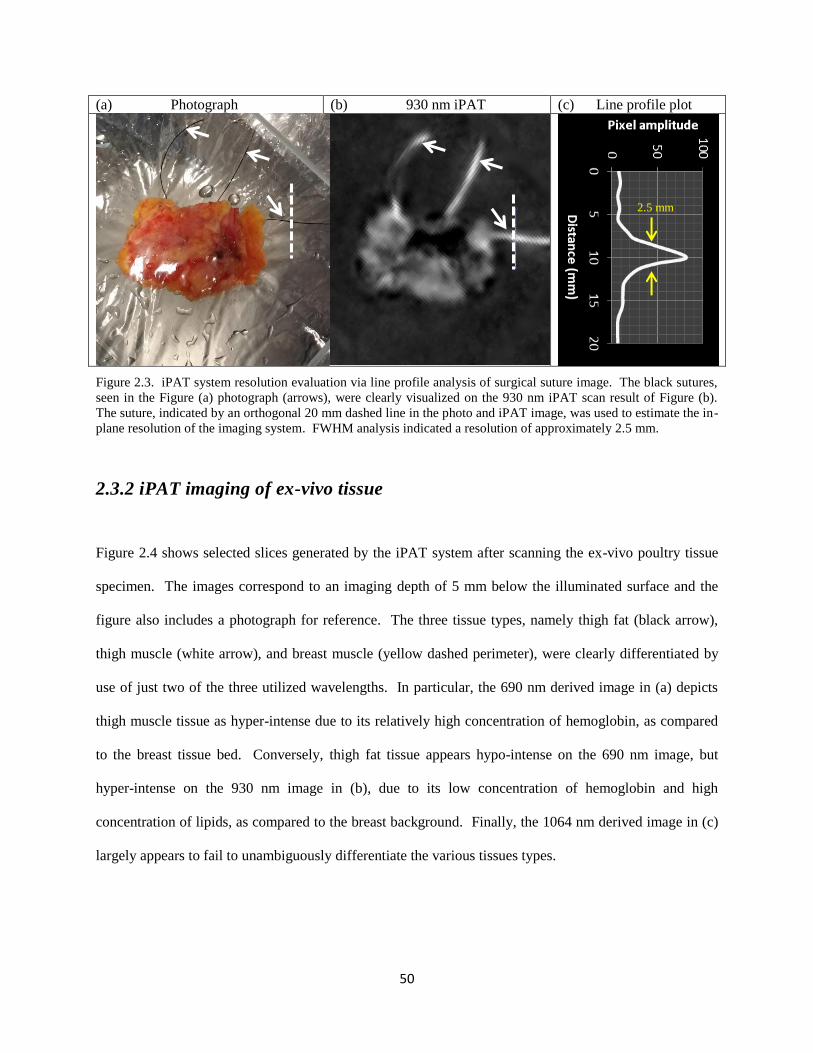
50
(a) Photograph (b) 930 nm iPAT (c) Line profile plot
Figure 2.3. iPAT system resolution evaluation via line profile analysis of surgical suture image. The black sutures,
seen in the Figure (a) photograph (arrows), were clearly visualized on the 930 nm iPAT scan result of Figure (b).
The suture, indicated by an orthogonal 20 mm dashed line in the photo and iPAT image, was used to estimate the in-
plane resolution of the imaging system. FWHM analysis indicated a resolution of approximately 2.5 mm.
2.3.2 iPAT imaging of ex-vivo tissue
Figure 2.4 shows selected slices generated by the iPAT system after scanning the ex-vivo poultry tissue
specimen. The images correspond to an imaging depth of 5 mm below the illuminated surface and the
figure also includes a photograph for reference. The three tissue types, namely thigh fat (black arrow),
thigh muscle (white arrow), and breast muscle (yellow dashed perimeter), were clearly differentiated by
use of just two of the three utilized wavelengths. In particular, the 690 nm derived image in (a) depicts
thigh muscle tissue as hyper-intense due to its relatively high concentration of hemoglobin, as compared
to the breast tissue bed. Conversely, thigh fat tissue appears hypo-intense on the 690 nm image, but
hyper-intense on the 930 nm image in (b), due to its low concentration of hemoglobin and high
concentration of lipids, as compared to the breast background. Finally, the 1064 nm derived image in (c)
largely appears to fail to unambiguously differentiate the various tissues types.
2.5 mm

51
(a) 690 nm (b) 930 nm (c) 1064 nm (d) Photograph
Figure 2.4. Representative iPAT slices of poultry tissue taken from 3D stacks corresponding to an imaging depth of
5 mm below the illuminated surface. The photograph (d) shows the tissue bed consisting of poultry breast tissue
(yellow dashed perimeter) as well as thigh fat (black arrow) and thigh muscle (white arrow) inclusions. The fat and
muscle inclusions appear light yellow and dark red in the photo due to having less and more hemoglobin
concentration, respectively, compared to the breast tissue bed. As expected, the 690 nm scan result in (a) depicts the
hemoglobin rich thigh muscle as hyper-intense while the 930 nm scan in (b) does so for the lipid-rich thigh-fat. On
the other hand the 1064 nm scan in (c) reveals little differentiation of the three tissue types.
2.3.3 iPAT imaging of freshly excised lumpectomies
Case study 1. IDC excision with radioactive seed localization
A 69 year old patient presented with an architectural distortion on screening mammography and
subsequently underwent an US exam of the whole right breast. The exam revealed an approximately 16
mm-diameter hypoechoic mass which demonstrated irregular margins and posterior acoustic shadowing.
An US-guided biopsy was carried out and resulted in an IDC diagnosis (BIRADS-6). The patient
underwent BCS with radioactive seed localization. Postoperative pathology discovered an 18 mm-
diameter, grade 2, IDC lesion with the radioactive localization seed embedded within. The lesion and
localization seed (arrow) can be appreciated in Figure 2.5(e), which depicts an intraoperative transmission
X-ray image of the specimen. Figures 2.5(a-d) show representative z-slice image stacks of the freshly
excised breast lumpectomy specimen at the indicated depths. Images in 2.5(a) and 2.5(b) were acquired
using the iPAT scanner at 690 nm and 800 nm, respectively. Surprisingly, little or no correlation of
internal structure was found when comparing the 690 nm and 800 nm hemoglobin-enhanced iPAT
images, to the US results of Figure 2.5(d). In contrast, the 930 nm lipid-enhanced iPAT images in (c)
clearly show a dark central mass corresponding to the hypoechoic region found in the US images of

52
Figure (d). This is easier to confirm in the zoomed-in images of Figures 2.5(f) and (g), where the US and
the 930 nm iPAT slices show a hypo-intense region measuring approximately 20 mm in diameter.
Furthermore, these findings were found concordant with the intraoperative X-ray image in (e) and
pathology, as both confirmed the central location of the IDC tumour within the lumpectomy specimen.
For reference, Figure 2.5(h) shows a colour photograph of the specimen (not co-registered), taken
immediately prior to the iPAT scans.
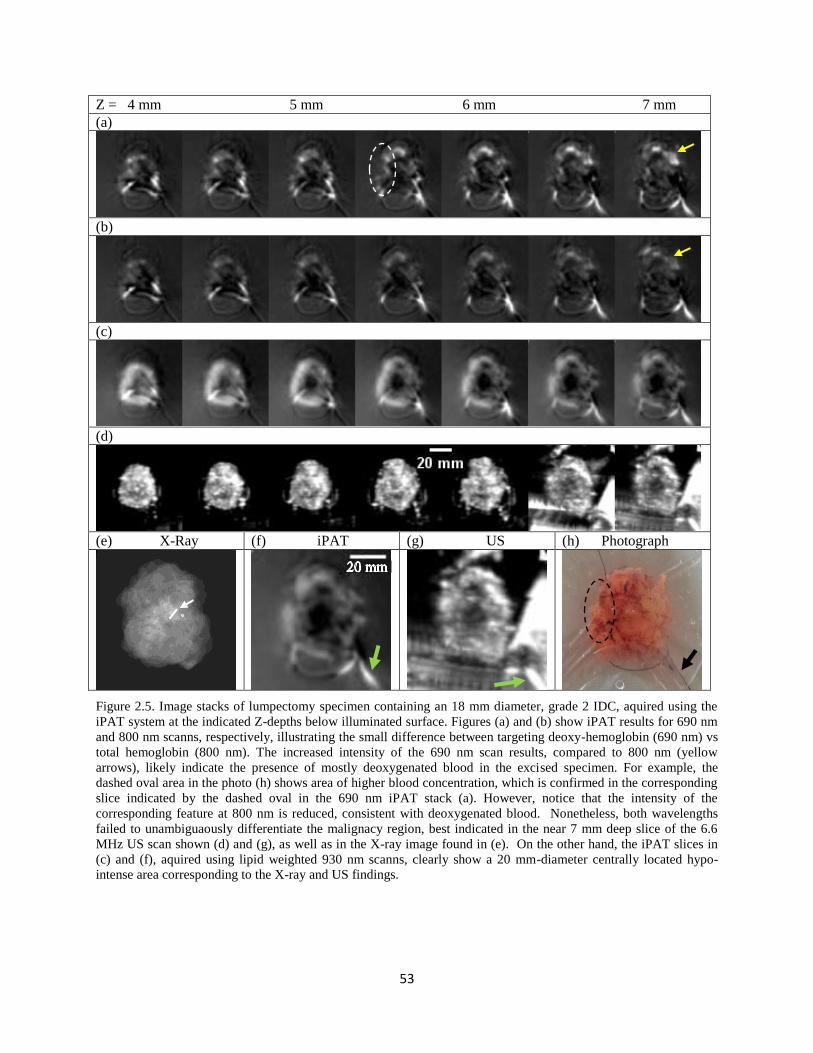
53
Z = 4 mm 5 mm 6 mm 7 mm
(a)
(b)
(c)
(d)
(e) X-Ray (f) iPAT (g) US (h) Photograph
Figure 2.5. Image stacks of lumpectomy specimen containing an 18 mm diameter, grade 2 IDC, aquired using the
iPAT system at the indicated Z-depths below illuminated surface. Figures (a) and (b) show iPAT results for 690 nm
and 800 nm scanns, respectively, illustrating the small difference between targeting deoxy-hemoglobin (690 nm) vs
total hemoglobin (800 nm). The increased intensity of the 690 nm scan results, compared to 800 nm (yellow
arrows), likely indicate the presence of mostly deoxygenated blood in the excised specimen. For example, the
dashed oval area in the photo (h) shows area of higher blood concentration, which is confirmed in the corresponding
slice indicated by the dashed oval in the 690 nm iPAT stack (a). However, notice that the intensity of the
corresponding feature at 800 nm is reduced, consistent with deoxygenated blood. Nonetheless, both wavelengths
failed to unambiguaously differentiate the malignacy region, best indicated in the near 7 mm deep slice of the 6.6
MHz US scan shown (d) and (g), as well as in the X-ray image found in (e). On the other hand, the iPAT slices in
(c) and (f), aquired using lipid weighted 930 nm scanns, clearly show a 20 mm-diameter centrally located hypo-
intense area corresponding to the X-ray and US findings.
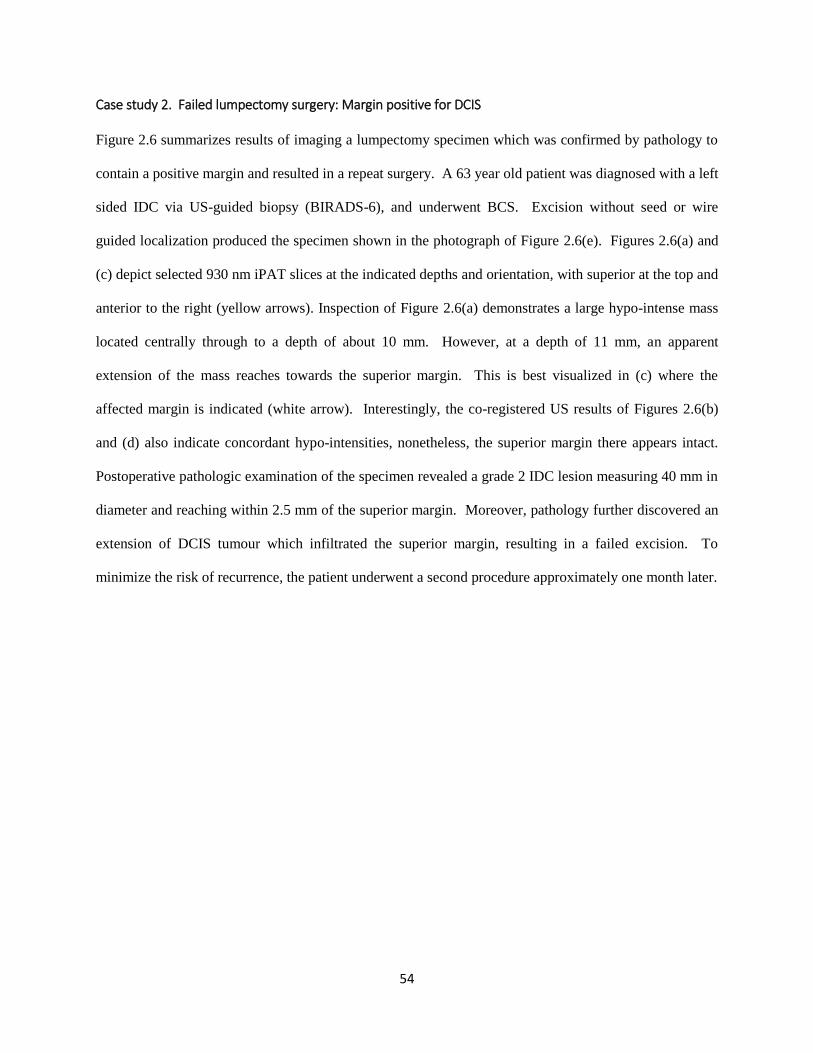
54
Case study 2. Failed lumpectomy surgery: Margin positive for DCIS
Figure 2.6 summarizes results of imaging a lumpectomy specimen which was confirmed by pathology to
contain a positive margin and resulted in a repeat surgery. A 63 year old patient was diagnosed with a left
sided IDC via US-guided biopsy (BIRADS-6), and underwent BCS. Excision without seed or wire
guided localization produced the specimen shown in the photograph of Figure 2.6(e). Figures 2.6(a) and
(c) depict selected 930 nm iPAT slices at the indicated depths and orientation, with superior at the top and
anterior to the right (yellow arrows). Inspection of Figure 2.6(a) demonstrates a large hypo-intense mass
located centrally through to a depth of about 10 mm. However, at a depth of 11 mm, an apparent
extension of the mass reaches towards the superior margin. This is best visualized in (c) where the
affected margin is indicated (white arrow). Interestingly, the co-registered US results of Figures 2.6(b)
and (d) also indicate concordant hypo-intensities, nonetheless, the superior margin there appears intact.
Postoperative pathologic examination of the specimen revealed a grade 2 IDC lesion measuring 40 mm in
diameter and reaching within 2.5 mm of the superior margin. Moreover, pathology further discovered an
extension of DCIS tumour which infiltrated the superior margin, resulting in a failed excision. To
minimize the risk of recurrence, the patient underwent a second procedure approximately one month later.

55
(a) Z = 4 mm . . . 6 mm . . . 8 mm 9 mm 10 mm 11 mm . . . 14 mm
(b)
(c) Z = 11 mm iPAT (d) Z = 11 mm US (e) Photograph
Figure 2.6. (a). 930 nm iPAT slices corresponding to the indicated depth bellow illumination surface, showing a
grade 2 IDC along with a grade 2 DCIS- containing specimen, found by postoperative pathology to have a positive
margin. (b) Co-registerd slices aquired using a 6.6 MHz conventional US scanner. Figures (c) and (d) show a larger
view of the slice near Z=11 mm for iPAT and US, respectively. The iPAT slice in (c) clearly shows intrusion of the
specimen edge by the hypo-intense extension (white arrow). For reference a photograph is included in (e), which,
along with the 14 mm iPAT and US slices show the superior orientation suture (black and green arrows). The
sutures facilitated the orietation of the specimen with superior (S) at the top and anterior (A) to the right (yellow
arrows).
In addition to visualization of malignant tissue within the lumpectomy specimen, two imaging features
exemplified by results shown in Figures 2.5 and 2.6, should be pointed out. First, notice the bright streaks
especially apparent near the bottom and on the right of the US slices, near the 7 mm depth in Figures
2.5(d) and (g). These streaks were caused by US visualization of the ̴ 40 µm-thick polyethylene Ziploc®
bag, which was used to restrain the lumpectomy specimen. The streaks typically became apparent near
the mid-plane of the specimen where the thin bag material obliquely intersected the imaging plane.
S
A
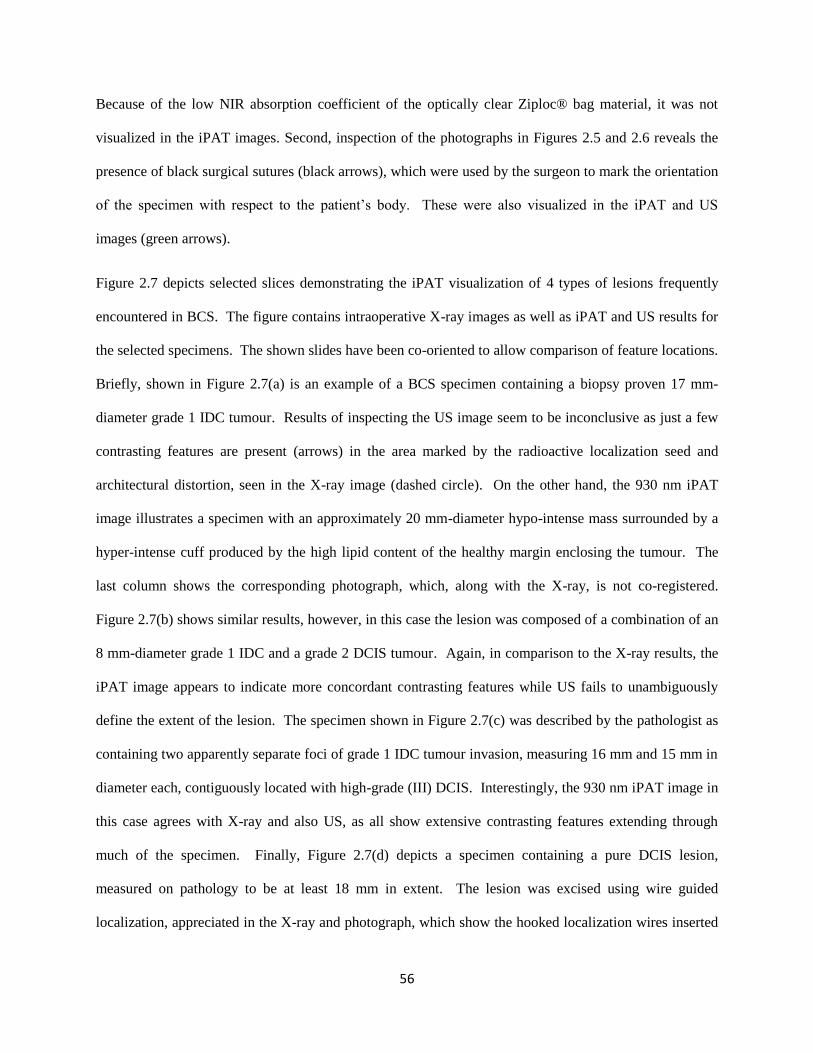
56
Because of the low NIR absorption coefficient of the optically clear Ziploc® bag material, it was not
visualized in the iPAT images. Second, inspection of the photographs in Figures 2.5 and 2.6 reveals the
presence of black surgical sutures (black arrows), which were used by the surgeon to mark the orientation
of the specimen with respect to the patient’s body. These were also visualized in the iPAT and US
images (green arrows).
Figure 2.7 depicts selected slices demonstrating the iPAT visualization of 4 types of lesions frequently
encountered in BCS. The figure contains intraoperative X-ray images as well as iPAT and US results for
the selected specimens. The shown slides have been co-oriented to allow comparison of feature locations.
Briefly, shown in Figure 2.7(a) is an example of a BCS specimen containing a biopsy proven 17 mm-
diameter grade 1 IDC tumour. Results of inspecting the US image seem to be inconclusive as just a few
contrasting features are present (arrows) in the area marked by the radioactive localization seed and
architectural distortion, seen in the X-ray image (dashed circle). On the other hand, the 930 nm iPAT
image illustrates a specimen with an approximately 20 mm-diameter hypo-intense mass surrounded by a
hyper-intense cuff produced by the high lipid content of the healthy margin enclosing the tumour. The
last column shows the corresponding photograph, which, along with the X-ray, is not co-registered.
Figure 2.7(b) shows similar results, however, in this case the lesion was composed of a combination of an
8 mm-diameter grade 1 IDC and a grade 2 DCIS tumour. Again, in comparison to the X-ray results, the
iPAT image appears to indicate more concordant contrasting features while US fails to unambiguously
define the extent of the lesion. The specimen shown in Figure 2.7(c) was described by the pathologist as
containing two apparently separate foci of grade 1 IDC tumour invasion, measuring 16 mm and 15 mm in
diameter each, contiguously located with high-grade (III) DCIS. Interestingly, the 930 nm iPAT image in
this case agrees with X-ray and also US, as all show extensive contrasting features extending through
much of the specimen. Finally, Figure 2.7(d) depicts a specimen containing a pure DCIS lesion,
measured on pathology to be at least 18 mm in extent. The lesion was excised using wire guided
localization, appreciated in the X-ray and photograph, which show the hooked localization wires inserted
57
in the lesion (arrows). As consistent with previous performance, the iPAT image shows hypo-intense
features whose location coincides with the apparent lesion location in the X-ray image, marked by the
hooked wire ends. Again, the US results are inconclusive as there are few definite contrasting areas in the
image.
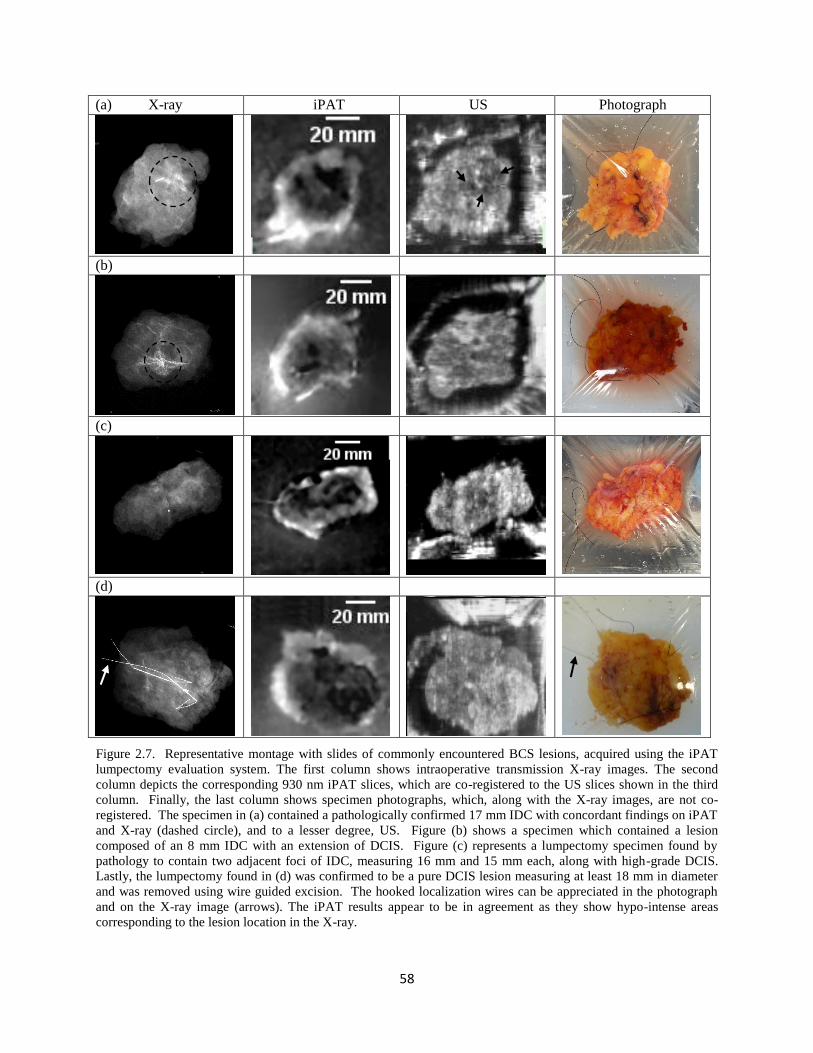
58
(a) X-ray iPAT US Photograph
(b)
(c)
(d)
Figure 2.7. Representative montage with slides of commonly encountered BCS lesions, acquired using the iPAT
lumpectomy evaluation system. The first column shows intraoperative transmission X-ray images. The second
column depicts the corresponding 930 nm iPAT slices, which are co-registered to the US slices shown in the third
column. Finally, the last column shows specimen photographs, which, along with the X-ray images, are not co-
registered. The specimen in (a) contained a pathologically confirmed 17 mm IDC with concordant findings on iPAT
and X-ray (dashed circle), and to a lesser degree, US. Figure (b) shows a specimen which contained a lesion
composed of an 8 mm IDC with an extension of DCIS. Figure (c) represents a lumpectomy specimen found by
pathology to contain two adjacent foci of IDC, measuring 16 mm and 15 mm each, along with high-grade DCIS.
Lastly, the lumpectomy found in (d) was confirmed to be a pure DCIS lesion measuring at least 18 mm in diameter
and was removed using wire guided excision. The hooked localization wires can be appreciated in the photograph
and on the X-ray image (arrows). The iPAT results appear to be in agreement as they show hypo-intense areas
corresponding to the lesion location in the X-ray.
59
2.4 Discussion
2.4.1 Lipid vs hemoglobin in ex vivo applications
A survey of photoacoustic imaging literature suggests that the primary contrast of tumours is provided by
elevated hemoglobin concentration associated with cancer induced angiogenesis20,23,38–40
. Consequently, it
was expected that 690 nm imaging would show increased signal intensity originating from periphery of
tumour regions. However, contrary to this hypothesis, this investigation found evidence that 690 nm
deoxyhemoglobin weighted images generally showed little or no correlation with hypoechoic US regions
inside ex vivo specimens. This was the case for most of the specimens encountered in this study and is
exemplified in Figure 2.5. Therefore, the extendibility of documented in vivo results to ex vivo
applications must be questioned. The extendibility hypothesis rests upon two assumptions. First, it was
assumed that a freshly excised tissue specimen will quickly reach low blood oxygenation levels due to a
lack of blood supply. This motivated the 690 nm wavelength selection, where deoxyhemoglobin
dominates tissue absorption. The validity of this assumption was corroborated by the increased signal
intensity, seen in the 690 nm slices compared to the 800 nm slices of Figure 2.5 (yellow arrows).
Specifically, one can infer that the blood content in the excised tissue is dominated by deoxyhemoglobin
since the 800 nm wavelength is absorbed equally by both deoxy- and oxy-hemoglobin while the 690 nm
wavelength is primarily absorbed by only deoxy-hemoglobin. Indeed, upon closer inspection of the 690
nm iPAT imaging results of Figure 2.5, it can be seen that areas with higher blood concentration produce
high intensity features. For example, the area of high blood content marked in the photograph of Figure
2.5(h) by a dashed oval, corresponds well to the iPAT 690 nm image in 2.5(a), near the periphery of the
specimen (dashed oval). The second assumption is that blood distribution inside the specimen will
remain relatively unchanged after excision. However, the blood distribution depends on ability of the
vascular network to maintain blood vessel volume, which in turn depends on blood pressure, provided by
cardiac output. Because an excised specimen is no longer connected to the cardiovascular system, it is

60
possible that many of its blood vessels collapsed during surgery, leading to a heterogeneous reduction in
blood volume. Therefore, hemoglobin distribution inside excised tissue specimens may not a good
biomarker of malignancy.
Alternatively, low lipid concentration has been well documented by optical methods as being a significant
indicator of breast abnormalities41
. Furthermore, the lipid concentration within breast tissue, including
the parenchyma and adipose tissue, is unaffected by surgical excision. Consequently, it is possible that
low lipid concentration is a good indicator of tumour location, and extent, in excised tissue. Moreover,
lipid may be a more effective biomarker for in vivo tumour mapping as well, and going forward,
researchers with access to high-fidelity photoacoustic imaging systems should make an effort to examine
this approach. The preliminary results of the study presented here, provide motivation for this direction.
Finally, the results outlined in the case study sections provided confidence that photoacoustic imaging
may have a significant role to play in soft tissue visualization and assessment, especially as pertains to
malignancy visualization. The high concordance of iPAT results with established X-ray and US
technology, in terms of tumour location and extent, were encouraging. Furthermore, the agreement
between iPAT derived indications and the gold standard postoperative pathologic examination, indicate
that molecular specificity of optical imaging may give iPAT an edge over existing lumpectomy margin
assessment methods. In particular, the positive margin case illustrated a possible opportunity to intervene
intraoperatively, potentially sparing the patient a repeat surgery, however, substantially more data must be
gathered before conclusions are made.
2.4.2 Enabling intraoperative surgical intervention
Mapping 3D spatial coordinates of detected positive margins to the surgical cavity where missed
malignant tissue needs to be excised, is not trivial. Fortunately, the current standard of practice for BCS
surgery includes specimen orientation sutures, which are used by the surgeon to mark the lateral (long
61
suture) and superior (short suture) orientation of the specimen with respect to the patient. These can be
seen in the specimen photographs. Even more importantly, the high contrast appearance of black colour
sutures in the iPAT images promises convenient referencing of the specimen orientation with respect to
the surgical cavity, enabling intraoperative intervention in cases of positive margin detection.
As outlined in the introduction, most novel systems currently being considered for intraoperative margin
assessment applications do not provide the surgeon with a full view of the tumour, and at worst, only
examine the surface. In some cases, this approach may not meet the needs of the standard of care, but
perhaps even more importantly, it may hinder the translation of the technology to the clinic. Complete
visualization of the specimen, which is the current intraoperative standard provided by x-ray imaging,
allows evaluation of the tumour extent, shape, morphology and position within the specimen. The
information is provided simultaneously, giving the surgeon confidence about the assessment results, and
this likely plays a role in enabling effective intervention. The iPAT system was able to deliver this
familiar functionality, but with the enhanced sensitivity and specificity of optical spectroscopy.
2.4.3 System resolution and scan speed
The estimated 2.5 mm resolution of the iPAT system is sufficient for most intraoperative applications.
The present surgical standard of a minimum 2 mm clear margin is potentially practicable with the current
version of the iPAT system. However, the ongoing debate about the minimum margin width necessary
for recurrence prevention may establish a new standard of less than 2 mm, in the near future. Fortunately,
this trend would not render iPAT ineffective because the system resolution can be readily increased by
use of higher frequency PA transducer arrays.
The scan time of 6 minutes per side means that scanning both sides will require about 12 minutes, not
including sample preparation and inversion. This is substantially longer than just a few seconds needed
by current x-ray technology. However, we used a 24-channel PA array and, consequently, the system

62
spent most of its time rotating and translating the array over the imaging volume. An array with 240-
elements can be constructed using a straight forward extension of existing technology. This would result
in a scan time of less than 40 seconds, on par with current x-ray technology.
2.5. Conclusion
We have presented preliminary results of intraoperative photoacoustic imaging of breast lumpectomy
specimens using a novel iPAT scanner, clearly showing whole tumours in a true clinical setting. This was
accomplished via construction of a medical grade carted photoacoustic imager. A key aspect of PAT
system design is the use of transducer array technology specialized for a specific imaging task. Detecting
signals from large tissue specimens requires highly sensitive detectors with frequency bandwidth
extending over an ultra-broad range, typically unavailable commercially. Furthermore, accurate
reconstruction of PA images requires full view PA detection geometry. By addressing these common
pitfalls of PAT system design we have successfully constructed an intraoperative photoacoustic
tomography lumpectomy evaluation system allowing us to pursue practical imaging studies within
clinical conditions. We found that targeting surgical margins during BCS imaging is advantageous over
targeting the tumour due to the consistent presence of lipids in healthy breast tissue. This approach shines
a light towards novel soft tissue abnormality assessment, potentially leading to improved intraoperative
instrumentation and higher surgical success rates.
Future work consists of system resolution and imaging speed improvements, regular imaging of fresh
lumpectomy specimens and extension to a clinical trial. Also, development of a segmentation technique
to differentiate healthy from malignant tissue is needed. Such extensions to the current work will result in
a statistical database linking the iPAT results to pathology and re-excision surgery rates.
2.6. References
1. Siegel RL, Miller KD, Jemal A. Cancer Statistics , 2015. CA Cancer J Clin. 2015;65(1):5-29.
63
doi:10.3322/caac.21254.
2. Ananthakrishnan P, Balci FL, Crowe JP. Optimizing Surgical Margins in Breast Conservation. Int J Surg Oncol. 2012;2012. doi:10.1155/2012/585670.
3. Lagios MD, Silverstein MJ. Ductal Carcinoma In Situ: Recent History and Areas of Controversy. Breast J. 2015;21(1):21-26. doi:10.1111/tbj.12359.
4. Silverstein MJ, Lagios MD. Treatment Selection for Patients with Ductal Carcinoma In Situ (DCIS) of the Breast Using the University of Southern California/Van Nuys (USC/VNPI) Prognostic Index. Breast J. 2015;21(2):127-132. doi:10.1111/tbj.12368.
5. Waljee JF, Hu ES, Newman LA, Alderman AK. Predictors of Re-excision among Women Undergoing Breast-Conserving Surgery for Cancer. Ann Surg Oncol. 2008;15(5):1297-1303. doi:10.1245/s10434-007-9777-x.
6. Schiller DE, Le LW, Cho BCJ, Youngson BJ, Mccready DR. Factors Associated with Negative Margins of Lumpectomy Specimen : Potential Use in Selecting Patients for Intraoperative Radiotherapy. Ann Ourgical Oncol. 2007;15(3):833-842. doi:10.1245/s10434-007-9711-2.
7. Emmadi R, Wiley EL. Evaluation of Resection Margins in Breast Conservation Therapy : The Pathology Perspective — Past , Present , and Future. Int J Surg Oncol. 2012;2012:180259. doi:10.1155/2012/180259.
8. Esbona K, Li Z, Wilke LG. Intraoperative Imprint Cytology and Frozen Section Pathology for Margin Assessment in Breast Conservation Surgery : A Systematic Review. Ann Surg Oncol. 2012;19(10):3236-3245. doi:10.1245/s10434-012-2492-2.
9. Britton PD, Sonoda LI, Yamamoto AK, Koo B, Soh E, Goud A. Breast surgical specimen radiographs : How reliable are they ? Eur J Radiol. 2011;79(2):245-249. doi:10.1016/j.ejrad.2010.02.012.
10. Thill M, Dittmer C, Baumann K, Friedrichs K, Blohmer J. MarginProbe- Final results of the German post-market study in breast conserving surgery of ductal carcinoma in situ. The Breast. 2014;23(1):94-96. doi:10.1016/j.breast.2013.11.002.
11. Eggemann H, Ignatov T, Dan S. Accuracy of ultrasound-guided breast-conserving surgery in the determination of adequate surgical margins. Breast Cancer Res Treat. 2014;145(1):129-136. doi:10.1007/s10549-014-2932-8.
12. Krekel NMA, Haloua MH, Cardozo AMFL, de Wit RH, Bosch AM, de Widt-Levert LM, Muller S, van der Veen H, Bergers E, de Lange de Klerk ESM, Meijer S, Petrousjka van den Tol M. Intraoperative ultrasound guidance for palpable breast cancer excision ( COBALT trial ): a multicentre , randomised controlled trial. Lancet Oncol. 2013;14(1):48-54. doi:10.1016/S1470-2045(12)70527-2.
13. Koloydenko A, Notingher I. Towards intra-operative diagnosis of tumours during breast conserving surgery by selective-sampling Raman micro-spectroscopy. Phys Med Biol. 2014;59(20):6141-6152. doi:10.1088/0031-9155/59/20/6141.
14. Brown JQ, Bydlon TM, Richards LM, et al. Optical Assesssment of Tumor Resection Margins in the Breast. IEEE J Sel Top Quantum Electron. 2010;16(3):530-544.

64
15. Lue N, Kang JW, Yu C, et al. Portable Optical Fiber Probe-Based Spectroscopic Scanner for Rapid Cancer Diagnosis : A New Tool for Intraoperative Margin Assessment. PLoS One. 2012;7(1). doi:10.1371/journal.pone.0030887.
16. Breslin TM, Xu F, Palmer GM, Zhu C, Gilchrist KW, Ramanujam N. Autofluorescence and Diffuse Reflectance Properties of Malignant and Benign Breast Tissues. Ann Surg Oncol. 2004;11(1):65-70. doi:10.1245/ASO.2004.03.031.
17. Nguyen FT, Zysk AM, Chaney EJ, Kotynek JG, Oliphant UJ, Bellafiore FJ, Rowland KM, Johnson PA, Boppart SA. Intraoperative Evaluation of Breast Tumor Margins with Optical Coherence Tomography. Cancer Res. 2009;69(22):8790-8797. doi:10.1158/0008-5472.CAN-08-4340.
18. Kim GR, Kang J, Kwak JY, Chang JH, Kim S Il, Youk JH. Photoacoustic Imaging of Breast Microcalcifications : A Preliminary Study with 8-Gauge Core-Biopsied Breast Specimens. PLoS One. 2014;9(8):8-10. doi:10.1371/journal.pone.0105878.
19. Wang B, Karpiouk A, Yeager D. In vivo intravascular ultrasound-guided photoacoustic imaging of lipid in plaques using an animal model of atherosclerosis. Ultrasound Med Biol. 2013;38(12):2098-2103. doi:10.1016/j.ultrasmedbio.2012.08.006.In.
20. Dogra VS, Chinni BK, Valluru KS, Joseph J V. Multispectral Photoacoustic Imaging of Prostate Cancer : Preliminary Ex ‑ vivo Results. J Clin Imaging Sci. 2015;3(3):1-7. doi:10.4103/2156-7514.119139.
21. Kim C, Erpelding TN, Jankovic L, Pashley MD, Wang L V. Deeply penetrating in vivo photoacoustic imaging using a clinical ultrasound array system. Biomed Opt Express. 2010;1(1):335-340.
22. Song KH, Wang L V. Deep reflection-mode photoacoustic imaging of biological tissue. J Biomed Opt. 2007;12(December):1-3. doi:10.1117/1.2818045.
23. Wang L V, Hu S. Photoacoustic Tomography : In Vivo Imaging from Organelles to Organs. Science (80- ). 2012;335(March):1458-1462.
24. Li R, Wang P, Lan L, et al. Assessing breast tumor margin by multispectral photoacoustic tomography. Biomed Opt Express. 2015;6(4):1273. doi:10.1364/BOE.6.001273.
25. Hainsworth A, Fosh B, Raymond W, Eaton M, Mcleay W. Ductal carcinoma in situ : breast-conserving surgery without radiotherapy. ANZ J Surg. 2015;85(4):245-248. doi:10.1111/ans.12655.
26. Subhedar P, Olcese C, Patil S, Morrow M, Zee KJ Van. Decreasing Recurrence Rates for Ductal Carcinoma In Situ : Analysis of 2996 Women Treated with Breast-Conserving Surgery Over 30 Years. Ann Surg Oncol. 2015;(April):3273-3281. doi:10.1245/s10434-015-4740-8.
27. Newcomb P a., Trentham-Dietz A, Hampton JM, et al. Late age at first full term birth is strongly associated with lobular breast cancer. Cancer. 2011;117:1946-1956. doi:10.1002/cncr.25728.
28. Ellwood R, Cox B, Zhang E, Beard P. Photoacoustic imaging using acoustic reflectors to enhance planar arrays. J Biomed Opt. 2014;19(12):126012. doi:10.1117/1.JBO.
29. Jaeger M, Harris-Birtill D, Gertsch A, O’Flynn E, Bamber J. Deformation-compensated averaging for clutter reduction in epiphotoacoustic imaging in vivo. J Biomed Opt. 2012;17(6):66007. doi:10.1117/1.JBO.17.6.066007.
65
30. Roumeliotis M, Ephrat P, Patrick J, Carson JJL. Development and characterization of an omnidirectional photoacoustic point source for calibration of a staring 3D photoacoustic imaging system. Opt Express. 2009;17(17):15228-15238. doi:10.1364/OE.17.015228.
31. Roumeliotis MB, Kosik I, Carson JJL. 3D photoacoustic imaging using starting, sparse array with 60 transducers. 2012;8223:82233F-82233F-6. doi:10.1117/12.908841.
32. Kosik I, Carson JJL, Program I, Health L, Joseph S. Combined 3D photoacoustic and 2D fluorescence imaging of indocyanine green contrast agent flow. Proc SPIE. 2013;8581:1-8. doi:10.1117/12.2005269.
33. Wong P, Kosik I, Raess A, Carson JJL. Objective Assessment and Design Improvement of a Staring, Sparse Transducer Array by the Spatial Crosstalk Matrix for 3D Photoacoustic Tomography. PLoS One. 2015;10(4):e0124759. doi:10.1371/journal.pone.0124759.
34. American National Standard for Safe Use of Lasers, ANSI Z136.1, Washington, DC (2007).
35. Xu M, Wang L V. Universal back-projection algorithm for photoacoustic computed tomography. Phys Rev E. 2005;71(1):16706. doi:10.1103/PhysRevE.71.016706.
36. Sevcenco IS, Hampton PJ, Agathoklis P. Seamless stitching of images based on a Haar Wavelet 2D integration method. In 17th International conference on digital signal processing. 2011, (DSP) pp. 1-6. doi:10.1109/ICDSP.2011.6004934
37. Horn BKP. Closed-form solution of absolute orientation using unit quaternions. J Opt Soc Am A. 1987;4(4):629. doi:10.1364/JOSAA.4.000629.
38. Ermilov S a., Khamapirad T, Conjusteau A, Leonard MH, Lacewell R, Mehta K, Miller T, Oraevski AA. Laser optoacoustic imaging system for detection of breast cancer. J Biomed Opt. 2009;14(2):24007. doi:10.1117/1.3086616.
39. Manohar S, Vaartjes SE, van Hespen JCG, Klasse JM, van den Engh FM, Steenbergen W, van Leeuwen TG. Initial results of in vivo non-invasive cancer imaging in the human breast using near-infrared photoacoustics. Opt Express. 2007;15(19):12277-12285. doi:10.1364/OE.15.012277.
40. Xie Z, Hooi FM, Fowlkes JB, Pinsky RW, Wang X, Carson PL. Combined photoacoustic and acoustic imaging of human breast specimens in the mammographic geometry. Ultrasound Med Biol. 2013;39(11):2176-2184. doi:10.1016/j.ultrasmedbio.2013.05.018.
41. Anderson PG, Kainerstorfer JM, Sassaroli A, Krishnamurthy N, Homer MJ, Graham RA, Fantini S. Broadband optical mammography: Chromophore concentration and hemoglobin saturation contrast in breast cancer. PLoS One. 2015;10(3):1-23. doi:10.1371/journal.pone.0117322.
66
Chapter 3: Comparison of breast tumor size by intraoperative
photoacoustic tomography, magnetic resonance imaging and
pathology
3.1 Introduction
A relatively brief discussion of the many roles that medical imaging plays in the breast cancer treatment
process is outlined below. For a more detailed examination please see sections 1.1.3, 1.2.1 and 1.2.2.
This chapter also includes investigation of multispectral optical-contrast mechanisms that lead to a new
method of PA tumour visualization. Review of the topics covered in sections 1.3.1 and 1.4.3 may aid in a
more thorough appreciation of this subject.
3.1.1 Overview
Breast cancer is one of the most common cancers to affect women, exhibiting an average lifetime risk of
1 in 8 1. It is a complex disease that is of particular concern for aging women and those with family
history of cancer. In spite of rising incidence of breast cancer, the prognosis of patients diagnosed with
the disease is much better today compared to the past. These improvements are largely due to the early
detection of breast tumours, often at stage I and II, facilitated by the rapid development of medical
imaging technology and widespread screening programs2-7
.
By monitoring neoadjuvant therapy, medical imaging continues to play a vital role in the treatment of
stage 3 and higher breast cancers, as well as tumors which are inoperable due to location or extent 8. This
therapy is administered in the time between initial diagnosis and surgical intervention, which may be
radical mastectomy or BCS. The aim of neoadjuvant therapy is to reduce the cancer extent, known as the
residual tumor burden (RTB), and potentially down-stage the cancer. In responding patients this
treatment course may open up new surgical options such as BCS versus mastectomy, or even facilitate a
67
surgical option when there was none before. Furthermore, depending on the estrogen receptor (ER),
progesterone receptor (PR), or human epidermal growth factor receptor (HER-2) status of the primary
tumor, this therapy is usually tailored as neoadjuvant hormone therapy, targeted therapy, chemotherapy or
radiation therapy. In some cases, it may be appropriate to select a combination of these therapies.
Regardless of which therapy avenue is chosen, one of the most critical aspects of treatment is accurate
and repeatable RTB assessment. Indeed, the size of the tumor in breast cancer is the single most
important factor determining the cancer stage 9. As a result, the accuracy of tumor measurement can have
a significant effect on selecting an appropriate course of action. Measurement errors of just a few mm,
can, in some cases, alter the course of treatment. The need for high precision RTB assessment is further
highlighted by the widely adopted revised Response Evaluation Criteria in Solid Tumors (RECIST v1.1,
released 2009) originally prepared by the International Working Group.10
Amongst other changes, the
updated definition of “tumor progression” now includes an absolute increase of the largest tumor diameter
by a minimum of 5 mm. Compared to the previous criteria of a minimum 20% increase in size, this new
standard places a premium on medical imaging precision and accuracy, especially in cases with multiple
lesions where the sum of diameters must be calculated.
Beyond the responsibility of determining the stage of the cancer, tumor extent assessment, therefore, also
continues to play a vital role in treatment efficacy monitoring during neoadjuvant therapy. The
importance of this cannot be overstated since ineffective therapies can subject patients to prolonged as
well as potentially toxic treatments, with no added survival benefit. Even more significant to patient well-
being, however, is the possibility that with periodic RTB assessment, a patient with a non-responding
tumor could be switched to a different neoadjuvant therapy, which may in some cases be more effective,
thereby maximizing patient survival and recovery. From the perspective of the cancer therapy researcher
who is armed with an efficient and accurate RTB monitoring tool, the time between diagnosis and surgery
represents an opportunity to examine a number of different neoadjuvant therapies, potentially tailoring the
optimum therapy for each patient. Finally, employing an approach featuring accurate and efficient RTB
68
monitoring, could yield a wealth of knowledge about the relationship between various disease and therapy
models. This information has been shown to be useful in predicting patient response to post-surgical
therapy, further maximizing survival, especially for stage 3 and higher cancers11
.
Aside from facilitating breast cancer screening, staging, and therapy monitoring, clinical imaging
modalities such as DCE-MRI, sonography, as well as X-ray mammography and radiography, also
facilitate pre-operative and intraoperative lesion localization, making them invaluable tools in the overall
treatment process2,5,8,12-16
.
The debate about how best to perform tumor extent assessment, in general as well as in the neoadjuvant
setting, is ongoing. However, there is broad agreement on several fronts. For example, the current
standard of unidimensional tumour measurement is likely to change in the near future due to the clinically
demonstrated superiority of 3-dimensional assessment. In fact, the International Working Group, while
preparing the revised version of RECIST (v1.1, 2009), noted that, in regards to volumetric tumor
assessment, they “did not believe that there is at present sufficient standardization and widespread
availability to recommend adoption.” 10
This conclusion suggests that RECIST guidelines will reflect a
technologically viable solution once it is available and sufficiently standardized. Beyond 3D
visualization, other desirable features of such a potentially viable breast imaging solution include
simplicity, low cost, operator independence and breast density independence.
Photoacoustic tomography (PAT) is a relatively new imaging modality with limited clinical experience17–
20. Nevertheless, it has demonstrated highly desirable features, especially with respect to breast cancer
imaging. It appears to meet many of the desired properties required for widespread practical
implementation in the breast abnormality assessment arena 18
. For example, PAT employs tissue-safe
near infrared laser illumination thereby avoiding problems associated with ionizing radiation such as in
mammography. PAT is also a relatively inexpensive imaging technique, especially compared to MRI
where the cost and complexity of maintaining superconducting magnets makes the installation of MRI
systems rather involved and unaffordable to all but larger hospitals. Moreover, PAT makes use of

69
endogenous optical contrast of blood, lipids and other soft tissues, eliminating the need for exogenous
contrast agents, and hence, speeding up and simplifying the imaging protocol.21,22
Because the basis of
PAT is an intrinsically 3D phenomenon, called the photoacoustic effect, it is easily implemented as a 3D
imaging modality, eliminating the concern for operator dependence.18,23
And finally, PAT sensitivity has
been shown to be breast density independent.17,19
Breast density independence is again owing to the
optical nature of its contrast mechanism, as opposed to mammography and US which derive contrast
based on tissue density.
3.1.2 Objectives
The purpose of this study was to determine the viability of intraoperative PAT (iPAT), as a breast tumor
assessment method by comparison of tumour volumes determined by iPAT to DCE-MRI and pathology.
Also, informal comparison of iPAT imaging to ultrasonography and intraoperative X-ray imaging is
presented. Finally, an investigation was carried out to examine how tumor contrast in iPAT images
depended on illumination wavelength, fibro-glandular density of tumor bed as well as tumor grade,
receptor status, and presence of in-situ components.
3.2. Materials and Methods
3.2.1 iPAT Scans and patient selection
Seventeen patients undergoing diagnostic imaging studies in preparation for BCS were recruited for this
iPAT imaging study. In brief, a novel and portable iPAT scanner was used to generate 3D image volumes
of freshly excised breast lumpectomy specimens. Figure 3.1(a) shows a photograph of the system inside a
surgical suite. The front cover panel of the system was removed to expose the major components, which
are labeled. The device was a hybrid photoacoustic/ultrasound (PA/US) system, dedicated to BCS
imaging applications. It was designed to provide 3D photoacoustic images with co-registered 3D US
70
images of surgical samples. The photo shows a water tank used for acoustic coupling between the sample
and photoacoustic detector array. To perform imaging, a breast tissue sample was positioned in the tank
using a custom designed lumpectomy specimen holder, seen in Figure 3.1(b). Following specimen
positioning, a SCARA robot (Epson, Japan) was used to scan the custom designed 24-channel arc-shaped
PA transducer array using a combination of rotational and translational motion. Illumination was
provided by a pulsed laser system delivering approximately 30 mJ of output in the 680 nm to 950 nm
wavelength range (Phocus In-line, Opotek, Carlsbad, CA, USA). The laser induced signals were detected
and digitized using a custom fabricated 50-MHz data acquisition system (DAQ). The overall scan was
coordinated using a PC with LabVIEW software, which oversaw the synchronization of the DAQ, robot
PC and laser. Following the iPAT scan a co-registered 3D US scan was carried out using a robot-
synchronized 6.6 MHz clinical US scanner (Sonix Touch, Ultrasonix, BC, Canada). In some cases, due
to concern over specimen thickness and artefacts, a scan of the opposite face was performed after flipping
the specimen 180° with respect to the diagonal axis of the holder (see dotted line in Figure 3.1(b)).
Patient eligibility consisted of biopsy confirmed breast cancer cases with at least an invasive component.
Patient recruitment and study procedures were performed at a university affiliated hospital and regional
breast cancer center. Results were retrospectively examined to obtain imaging data for patients who also
received a preoperative bilateral DCE-MRI scan. The study was carried out with approval of the
Institutional Review board of The University of Western Ontario (HSREB# 105467).
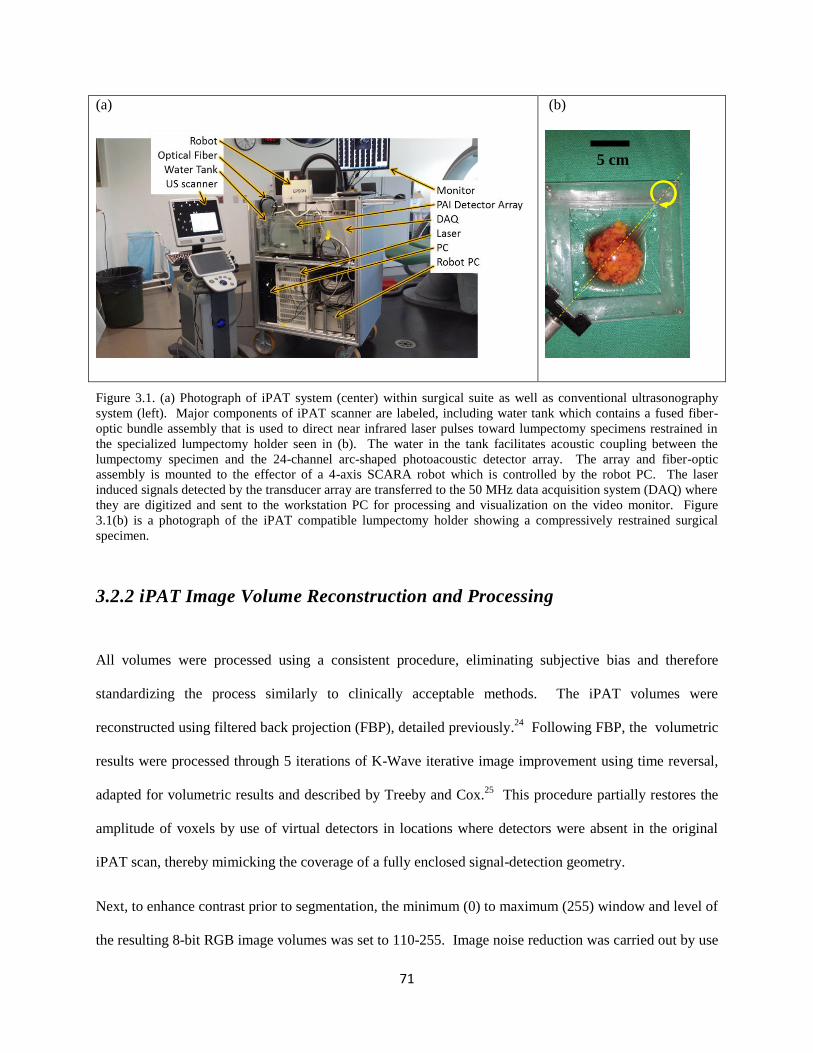
71
(a)
(b)
Figure 3.1. (a) Photograph of iPAT system (center) within surgical suite as well as conventional ultrasonography
system (left). Major components of iPAT scanner are labeled, including water tank which contains a fused fiber-
optic bundle assembly that is used to direct near infrared laser pulses toward lumpectomy specimens restrained in
the specialized lumpectomy holder seen in (b). The water in the tank facilitates acoustic coupling between the
lumpectomy specimen and the 24-channel arc-shaped photoacoustic detector array. The array and fiber-optic
assembly is mounted to the effector of a 4-axis SCARA robot which is controlled by the robot PC. The laser
induced signals detected by the transducer array are transferred to the 50 MHz data acquisition system (DAQ) where
they are digitized and sent to the workstation PC for processing and visualization on the video monitor. Figure
3.1(b) is a photograph of the iPAT compatible lumpectomy holder showing a compressively restrained surgical
specimen.
3.2.2 iPAT Image Volume Reconstruction and Processing
All volumes were processed using a consistent procedure, eliminating subjective bias and therefore
standardizing the process similarly to clinically acceptable methods. The iPAT volumes were
reconstructed using filtered back projection (FBP), detailed previously.24
Following FBP, the volumetric
results were processed through 5 iterations of K-Wave iterative image improvement using time reversal,
adapted for volumetric results and described by Treeby and Cox.25
This procedure partially restores the
amplitude of voxels by use of virtual detectors in locations where detectors were absent in the original
iPAT scan, thereby mimicking the coverage of a fully enclosed signal-detection geometry.
Next, to enhance contrast prior to segmentation, the minimum (0) to maximum (255) window and level of
the resulting 8-bit RGB image volumes was set to 110-255. Image noise reduction was carried out by use
5 cm
72
of a 2-voxel wide median filter to de-speckle and preserve sharp boundaries. Uneven illumination,
caused by illumination gradients, was addressed by implementation of a pseudo-flat-field background
correction available in ImageJ (1.49v, National Institutes of Health, USA). The final window and level
were set by excluding very bright objects, such as black sutures, and saturating 1% of voxels so that the
contrast stretching was not influenced by outliers. Image reconstruction and K-Wave correction was
implemented in Matlab (MATLAB and K-wave Toolbox Release 2013a, The MathWorks, Inc., Natick,
Massachusetts, United States) and image processing was carried out using ImageJ (1.49v, National
Institutes of Health, USA).
3.2.3 Volumetric segmentation and maximum diameter measurements of iPAT
results
Prior to segmentation of the tumor volumes in iPAT, co-registered 3D-US imaging was used to identify
specimen edges, which were in some cases difficult to delineate using iPAT alone due to shadowing edge
artefacts. Furthermore, specimen x-ray images obtained using a dedicated 2-D intraoperative scanner
(Faxitron, Faxitron Bioptics, Tucson, Arizona, USA), were examined, and the tumor location was
correlated to the tumor location in the iPAT volumes. Importantly, while specimen edges and tumour
locations were correlated with US and X-ray images, tumour measurements themselves were performed
using only iPAT visualization. To aid in visual referencing, image volumes from all 3-D modalities
(iPAT, DCE-MRI, US) were reoriented to coincide with each other, as well as with images from the 2-D
modalities (intraoperative X-ray, photography). This was done with help of surgical specimen orientation
sutures, used by the surgeon to orient specimens with respect to the surgical cavity. The sutures indicated
the superior aspect (short suture) and the lateral aspect (long suture).
The identified tumor masses were segmented manually by an experienced operator, who trained on
images of phantoms. In the case of multi-focal cancer, the largest tumor was measured for
73
unidimensional measurement and all lesions were summed for volumetric measurements. Tumors
presenting as stellate or spiculated lesions were measured as the longest contiguous dimension and total
apparent contiguous volume. The resulting segmented areas were used to calculate the total volume,
based on slice thickness, as well as the maximum in-slice diameter. The segmentation was carried out in
ImageJ.
To account for specimen shape distortion between formalin-fixed samples and samples compressed inside
the specialized lumpectomy holder, whole lumpectomy specimen size measurements from pathology
were compared to measurements from the iPAT and US scans. The findings were then correlated with
tumor size and shape to determine possible effect of specimen preparation on tumor measurements.
3.2.4 Statistical Analysis
A linear regression analysis was carried out to determine the relationship between measured quantities.
Comparison of tumor maximum diameter and volume was done by calculation of Pearson’s correlation
coefficients, and the non-parametric Wilcoxon signed-rank test. P=0.05 was considered as the
significance threshold. iPAT derived volumes were compared to DCE-MRI volumes. Maximum
diameters determined by iPAT were compared to DCE-MRI diameters, and separately, to pathology
derived diameters. Finally, DCE-MRI diameters were also compared to diameters reported by pathology.
Imaging-derived maximum diameters were measured on a single slice, and pathologic diameters were
measured on a single slide. The statistical analysis was carried out using the Statistics Toolbox in Matlab
(MATLAB and Statistics Toolbox Release 2013a, The MathWorks, Inc., Natick, Massachusetts, United
States).

74
3.2.5 Tumor-contrast spectral dependence
On two occasions, cosmetic breast-reconstruction procedures delayed patient discharge from the surgical
suite, allowing extra scanning time with the fresh lumpectomy specimen. The extended access allowed 6
wavelengths in one case and 5 wavelengths in the other, to be utilized. The wavelengths ranged from 690
nm to 950 nm. This opportunity facilitated a small multispectral iPAT study to be carried out by
comparing the average contrast C, between the tumor and background breast tissue, defined by equation
1.
C = (It - Ib )/ Ib (1)
Where It is the average voxel intensity in the tumor area, and Ib is the average intensity in the normal
breast tissue. The tumor area was defined as a 1 cm diameter disk, which simultaneously overlapped
apparent tumor tissue found in iPAT, US and X-ray images. The background breast tissue was defined by
segmenting out the entire specimen. The C values were then plotted against the corresponding
wavelength. The average intensities were extracted using ImageJ after images were scaled from 0 (black)
to 255 (white). While an investigation with only 2 specimens and 5/6 wavelengths cannot present
statistically significant findings, we nevertheless include it here as a possible motivator for future PAT
research.
3.2.6 Breast density dependence
To investigate the relationship between breast density and iPAT performance, tissue-density surrounding
the tumors was classified according to the ACR BI-RADS ATLAS for breast MRI.26
For comparison,
information from the pathology report regarding the tumor bed was also classified using the same
categories. These findings were then correlated to visualization contrast and quality of the tumor masses
on iPAT.
75
3.2.7 MR imaging and pathology
Gradient-echo 3D T1-weighted images were obtained in an axial and sagittal plane with and without
Gadovist injection. Tumors, identified by a radiologist with extensive experience (>10 years), were
manually segmented in the axial plane based on their contrast enhancement. The segmented areas were
used to calculate the total volume, as well as the maximum diameter.
Pathological examination was completed, and a breast invasive carcinoma synoptic report was generated,
according to AJCC/UICC TNM 7th edition, CAP Version 3.1.0.0 (June 2012). The work was completed
by, or under supervision of, a senior pathologist with more than 10 years of experience. The synoptic
report was used to determine the following tumor specific information: maximum diameter, histologic
type and grade, receptor status, presence of extensive intra-ductal component and presence of in situ
disease. These properties were then compared with the photoacoustic appearance of the lesion to discover
potential relationships.
3.3 Results
3.3.1 iPAT Scans and patient selection
Seventeen out of the 100 patients who participated in the intraoperative photoacoustic imaging study of
breast lumpectomy assessment were found to have received a DCE-MRI scan. One patient had a DCE-
MRI occult tumor due to contrast enhancement which was not significantly different from background.
One patient received a second BCS, having had the main tumor mass removed previously. One patient
had received neoadjuvant therapy and was found on pathology to be a pathologically complete responder,
with no malignancy remaining. One patient presented with pure in-situ disease and no invasive tumor.
And finally, one patient was found to have a pure radial scar. The remaining 12 patients were included in
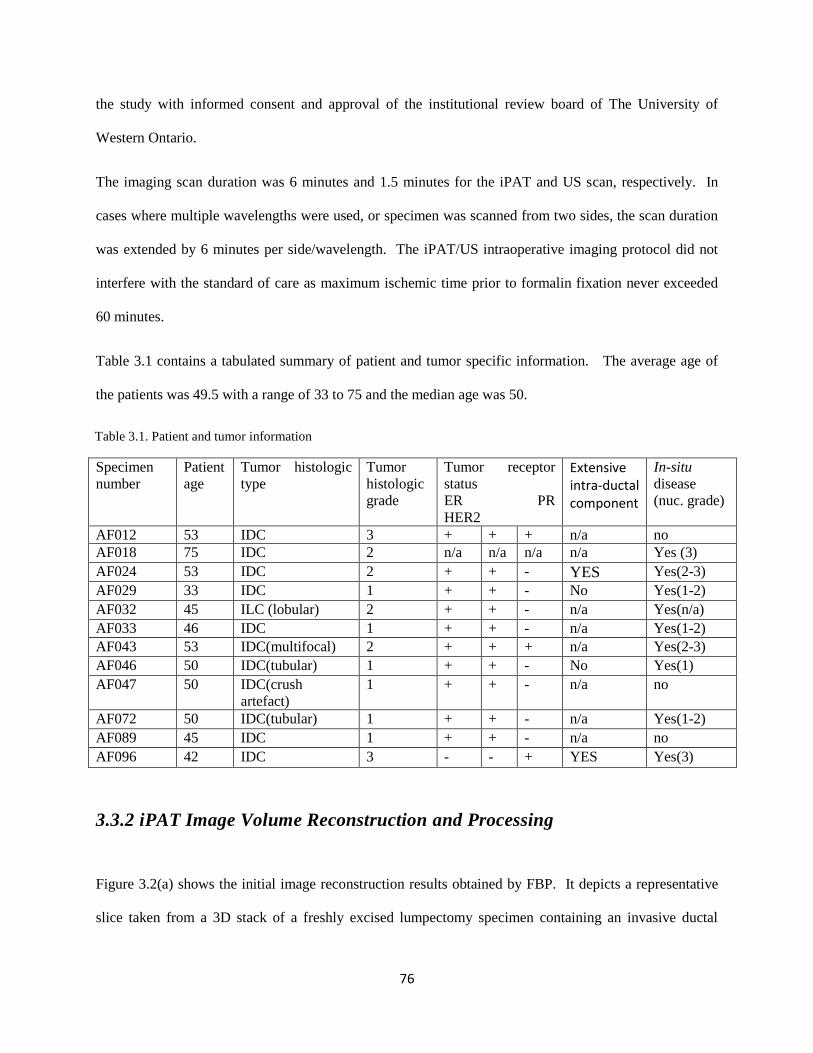
76
the study with informed consent and approval of the institutional review board of The University of
Western Ontario.
The imaging scan duration was 6 minutes and 1.5 minutes for the iPAT and US scan, respectively. In
cases where multiple wavelengths were used, or specimen was scanned from two sides, the scan duration
was extended by 6 minutes per side/wavelength. The iPAT/US intraoperative imaging protocol did not
interfere with the standard of care as maximum ischemic time prior to formalin fixation never exceeded
60 minutes.
Table 3.1 contains a tabulated summary of patient and tumor specific information. The average age of
the patients was 49.5 with a range of 33 to 75 and the median age was 50.
Specimen
number
Patient
age
Tumor histologic
type
Tumor
histologic
grade
Tumor receptor
status
ER PR
HER2
Extensive intra-ductal component
In-situ
disease
(nuc. grade)
AF012 53 IDC 3 + + + n/a no
AF018 75 IDC 2 n/a n/a n/a n/a Yes (3)
AF024 53 IDC 2 + + - YES Yes(2-3)
AF029 33 IDC 1 + + - No Yes(1-2)
AF032 45 ILC (lobular) 2 + + - n/a Yes(n/a)
AF033 46 IDC 1 + + - n/a Yes(1-2)
AF043 53 IDC(multifocal) 2 + + + n/a Yes(2-3)
AF046 50 IDC(tubular) 1 + + - No Yes(1)
AF047 50 IDC(crush
artefact)
1 + + - n/a no
AF072 50 IDC(tubular) 1 + + - n/a Yes(1-2)
AF089 45 IDC 1 + + - n/a no
AF096 42 IDC 3 - - + YES Yes(3)
3.3.2 iPAT Image Volume Reconstruction and Processing
Figure 3.2(a) shows the initial image reconstruction results obtained by FBP. It depicts a representative
slice taken from a 3D stack of a freshly excised lumpectomy specimen containing an invasive ductal
Table 3.1. Patient and tumor information
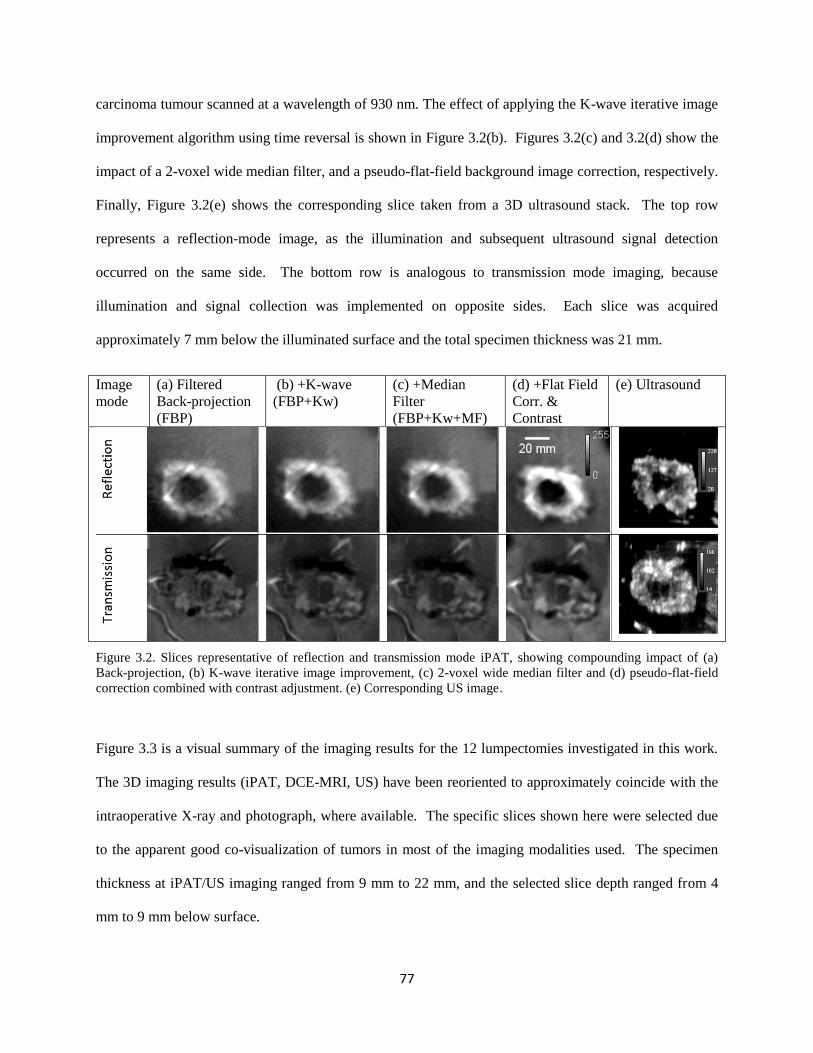
77
carcinoma tumour scanned at a wavelength of 930 nm. The effect of applying the K-wave iterative image
improvement algorithm using time reversal is shown in Figure 3.2(b). Figures 3.2(c) and 3.2(d) show the
impact of a 2-voxel wide median filter, and a pseudo-flat-field background image correction, respectively.
Finally, Figure 3.2(e) shows the corresponding slice taken from a 3D ultrasound stack. The top row
represents a reflection-mode image, as the illumination and subsequent ultrasound signal detection
occurred on the same side. The bottom row is analogous to transmission mode imaging, because
illumination and signal collection was implemented on opposite sides. Each slice was acquired
approximately 7 mm below the illuminated surface and the total specimen thickness was 21 mm.
Image
mode
(a) Filtered
Back-projection
(FBP)
(b) +K-wave
(FBP+Kw)
(c) +Median
Filter
(FBP+Kw+MF)
(d) +Flat Field
Corr. &
Contrast
(e) Ultrasound
Figure 3.2. Slices representative of reflection and transmission mode iPAT, showing compounding impact of (a)
Back-projection, (b) K-wave iterative image improvement, (c) 2-voxel wide median filter and (d) pseudo-flat-field
correction combined with contrast adjustment. (e) Corresponding US image.
Figure 3.3 is a visual summary of the imaging results for the 12 lumpectomies investigated in this work.
The 3D imaging results (iPAT, DCE-MRI, US) have been reoriented to approximately coincide with the
intraoperative X-ray and photograph, where available. The specific slices shown here were selected due
to the apparent good co-visualization of tumors in most of the imaging modalities used. The specimen
thickness at iPAT/US imaging ranged from 9 mm to 22 mm, and the selected slice depth ranged from 4
mm to 9 mm below surface.
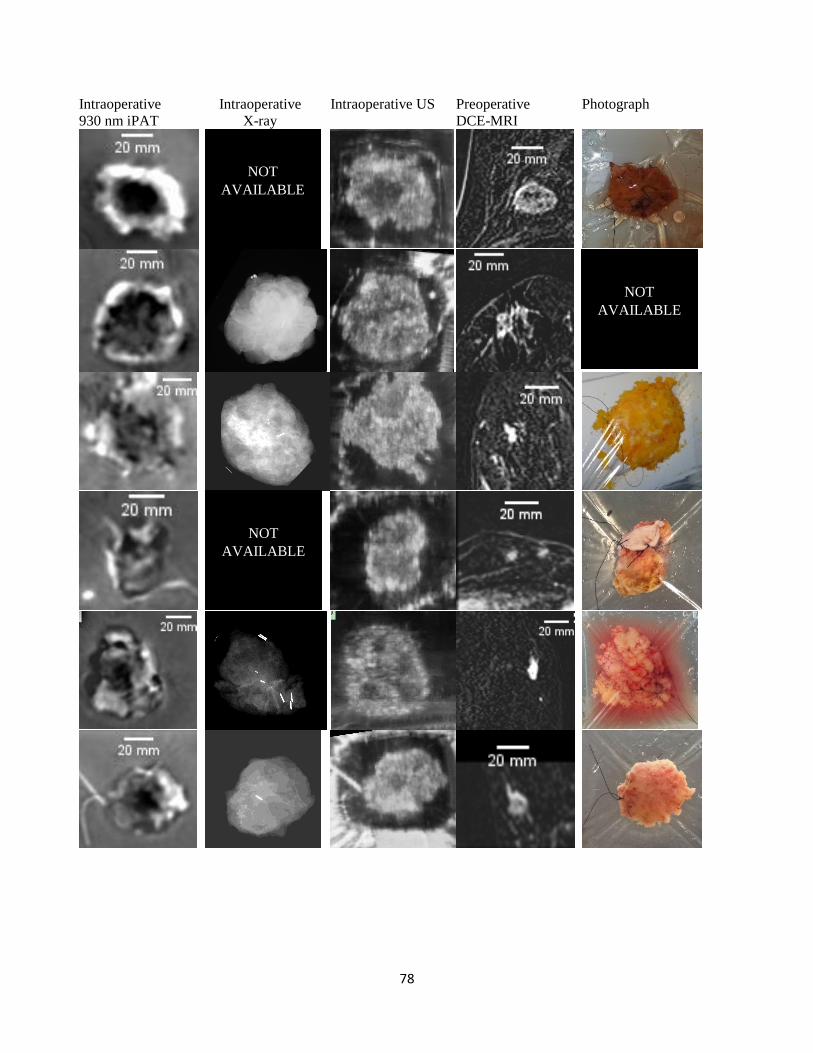
78
Intraoperative
930 nm iPAT
Intraoperative
X-ray
Intraoperative US Preoperative
DCE-MRI
Photograph
NOT
AVAILABLE
NOT
AVAILABLE
NOT
AVAILABLE
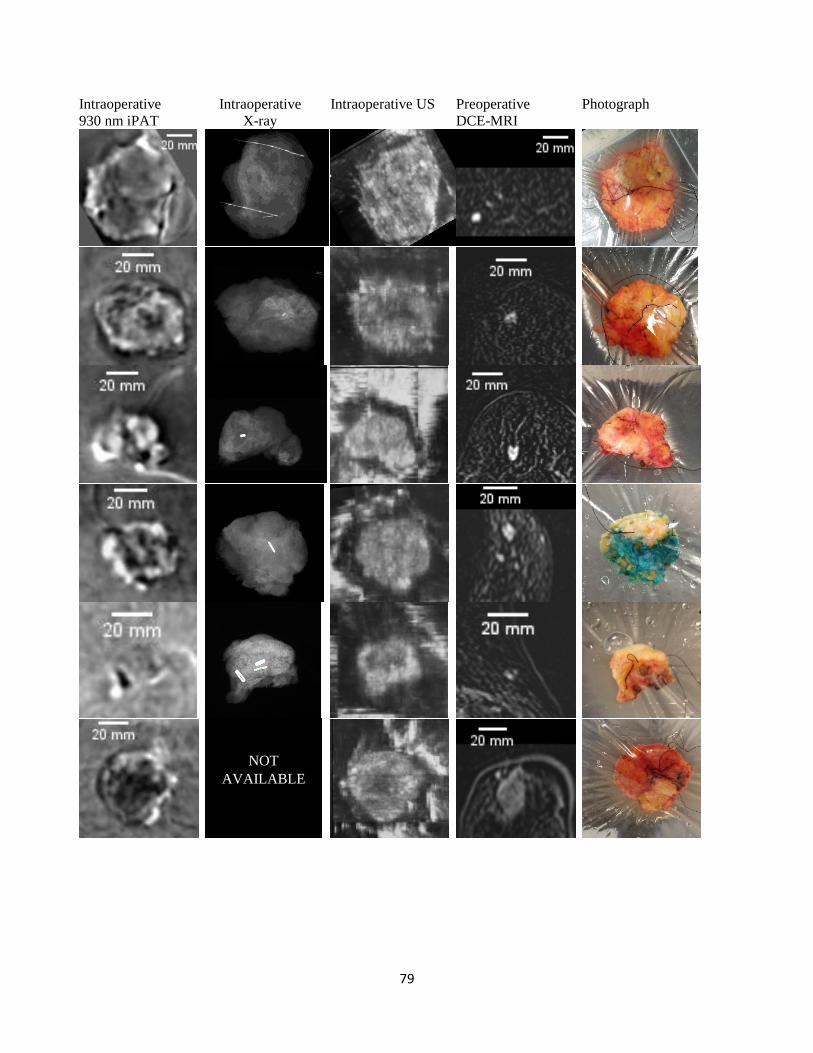
79
Intraoperative
930 nm iPAT
Intraoperative
X-ray
Intraoperative US Preoperative
DCE-MRI
Photograph
NOT
AVAILABLE
80
Figure 3.3. Representative slices of specimens containing at least an invasive component of breast carcinoma. Each
row represents a single case. Going from left to right, tumors are visualized by iPAT, X-ray, US, DCE-MRI and
photograph. Specimens in each row have been reoriented to represent approximately the same perspective. For
easy referencing, specimens are listed in the same order as in Tables 1 – 3. The first column represents selected
iPAT slices acquired at 930 nm. The second column indicates the result of a transmission X-ray image of the
specimen and shows any surgical aides such as radioactive localization seeds and localization wires. The third
column shows co-registered US slices of the specimen taken using a conventional 6.6 MHz US system. The fourth
column indicates the area of interest on a preoperative DCE-MRI scan and has been scaled and re-oriented to
approximately correspond to the iPAT and US results. Finally, the fifth column shows a photograph of each
specimen contained within a saline filled bag and compressively restrained by the lumpectomy holder. The photo
also demonstrates the visualization of the black surgical orientation sutures attached by the surgeon to establish
specimen orientation with respect to the surgical cavity and patient.
3.3.3 Volumetric segmentation and maximum diameter measurements
The maximum diameter measurements for pathology, DCE-MRI, and iPAT are listed in Table 3.2. The
table also shows results for volumetric measurements derived from DCE-MRI and iPAT. The mean
tumor volume based on DCE-MRI was 1426 mm3
(range of 94 – 5509 mm3) with a median of 610 mm
3.
In comparison, the mean volume from iPAT measurements was 1169 mm3 (range of 41 – 4705 mm
3) and
median was 757 mm3. In terms of mean maximum tumor diameter, the measurement for pathology was
14.8 mm (range 4 – 39 mm) with median 13.5 mm, DCE-MRI produced 18 mm (range 7 -43 mm) with
median 16 mm, and finally iPAT mean maximum diameter was 23.1 mm (range 9 – 46 mm) with median
of 23 mm.
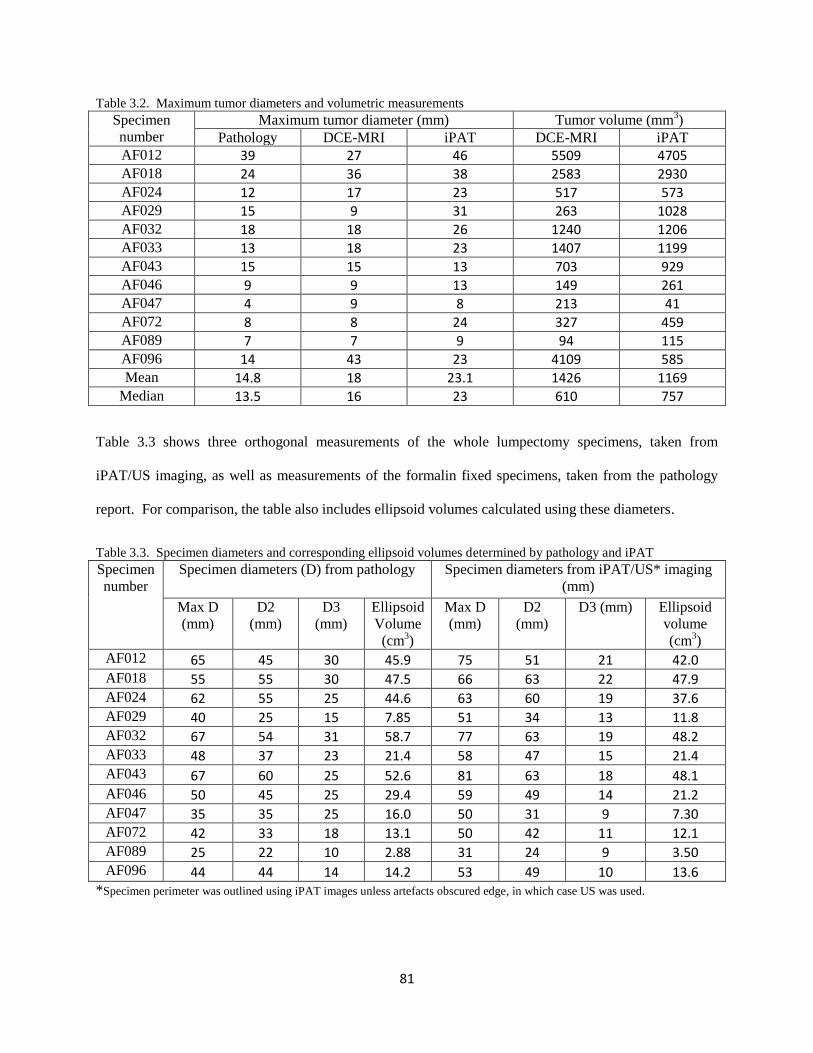
81
Table 3.2. Maximum tumor diameters and volumetric measurements
Specimen
number
Maximum tumor diameter (mm) Tumor volume (mm3)
Pathology DCE-MRI iPAT DCE-MRI iPAT
AF012 39 27 46 5509 4705 AF018 24 36 38 2583 2930 AF024 12 17 23 517 573 AF029 15 9 31 263 1028 AF032 18 18 26 1240 1206 AF033 13 18 23 1407 1199 AF043 15 15 13 703 929 AF046 9 9 13 149 261 AF047 4 9 8 213 41 AF072 8 8 24 327 459 AF089 7 7 9 94 115 AF096 14 43 23 4109 585 Mean 14.8 18 23.1 1426 1169
Median 13.5 16 23 610 757
Table 3.3 shows three orthogonal measurements of the whole lumpectomy specimens, taken from
iPAT/US imaging, as well as measurements of the formalin fixed specimens, taken from the pathology
report. For comparison, the table also includes ellipsoid volumes calculated using these diameters.
Table 3.3. Specimen diameters and corresponding ellipsoid volumes determined by pathology and iPAT
Specimen
number
Specimen diameters (D) from pathology Specimen diameters from iPAT/US* imaging
(mm)
Max D
(mm)
D2
(mm)
D3
(mm)
Ellipsoid
Volume
(cm3)
Max D
(mm)
D2
(mm)
D3 (mm) Ellipsoid
volume
(cm3)
AF012 65 45 30 45.9 75 51 21 42.0 AF018 55 55 30 47.5 66 63 22 47.9 AF024 62 55 25 44.6 63 60 19 37.6 AF029 40 25 15 7.85 51 34 13 11.8 AF032 67 54 31 58.7 77 63 19 48.2 AF033 48 37 23 21.4 58 47 15 21.4 AF043 67 60 25 52.6 81 63 18 48.1 AF046 50 45 25 29.4 59 49 14 21.2 AF047 35 35 25 16.0 50 31 9 7.30 AF072 42 33 18 13.1 50 42 11 12.1 AF089 25 22 10 2.88 31 24 9 3.50 AF096 44 44 14 14.2 53 49 10 13.6
*Specimen perimeter was outlined using iPAT images unless artefacts obscured edge, in which case US was used.
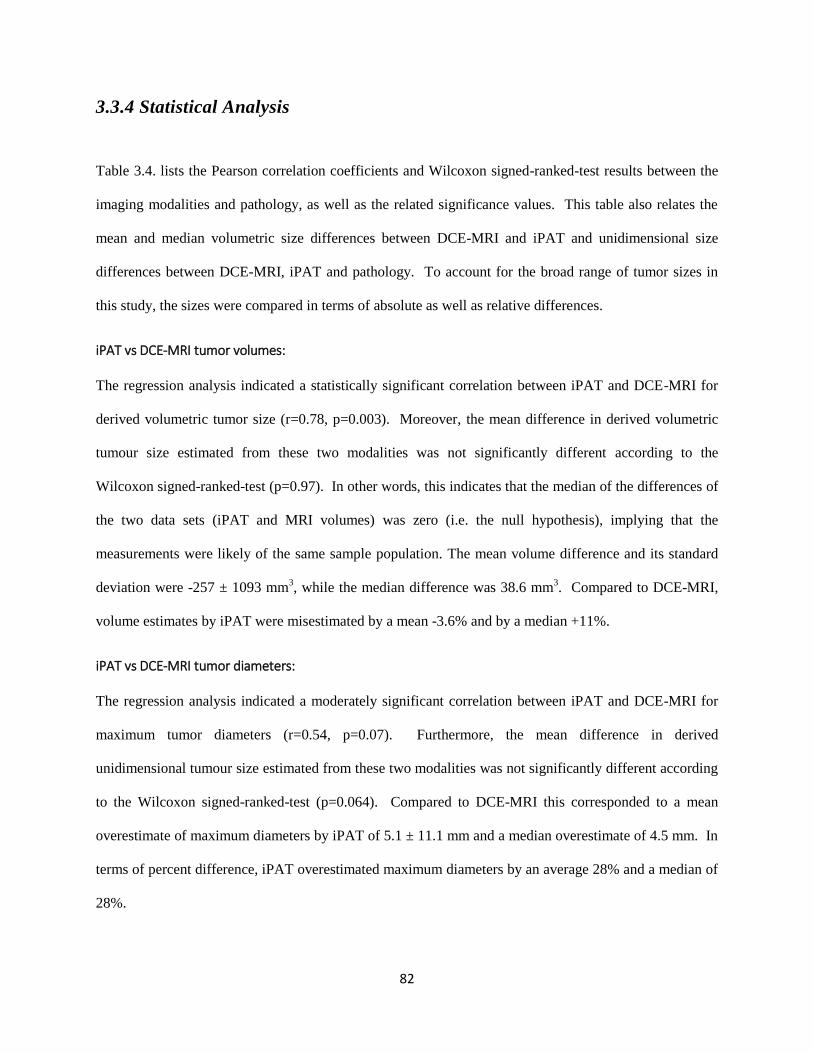
82
3.3.4 Statistical Analysis
Table 3.4. lists the Pearson correlation coefficients and Wilcoxon signed-ranked-test results between the
imaging modalities and pathology, as well as the related significance values. This table also relates the
mean and median volumetric size differences between DCE-MRI and iPAT and unidimensional size
differences between DCE-MRI, iPAT and pathology. To account for the broad range of tumor sizes in
this study, the sizes were compared in terms of absolute as well as relative differences.
iPAT vs DCE-MRI tumor volumes:
The regression analysis indicated a statistically significant correlation between iPAT and DCE-MRI for
derived volumetric tumor size (r=0.78, p=0.003). Moreover, the mean difference in derived volumetric
tumour size estimated from these two modalities was not significantly different according to the
Wilcoxon signed-ranked-test (p=0.97). In other words, this indicates that the median of the differences of
the two data sets (iPAT and MRI volumes) was zero (i.e. the null hypothesis), implying that the
measurements were likely of the same sample population. The mean volume difference and its standard
deviation were -257 ± 1093 mm3, while the median difference was 38.6 mm
3. Compared to DCE-MRI,
volume estimates by iPAT were misestimated by a mean -3.6% and by a median +11%.
iPAT vs DCE-MRI tumor diameters:
The regression analysis indicated a moderately significant correlation between iPAT and DCE-MRI for
maximum tumor diameters (r=0.54, p=0.07). Furthermore, the mean difference in derived
unidimensional tumour size estimated from these two modalities was not significantly different according
to the Wilcoxon signed-ranked-test (p=0.064). Compared to DCE-MRI this corresponded to a mean
overestimate of maximum diameters by iPAT of 5.1 ± 11.1 mm and a median overestimate of 4.5 mm. In
terms of percent difference, iPAT overestimated maximum diameters by an average 28% and a median of
28%.
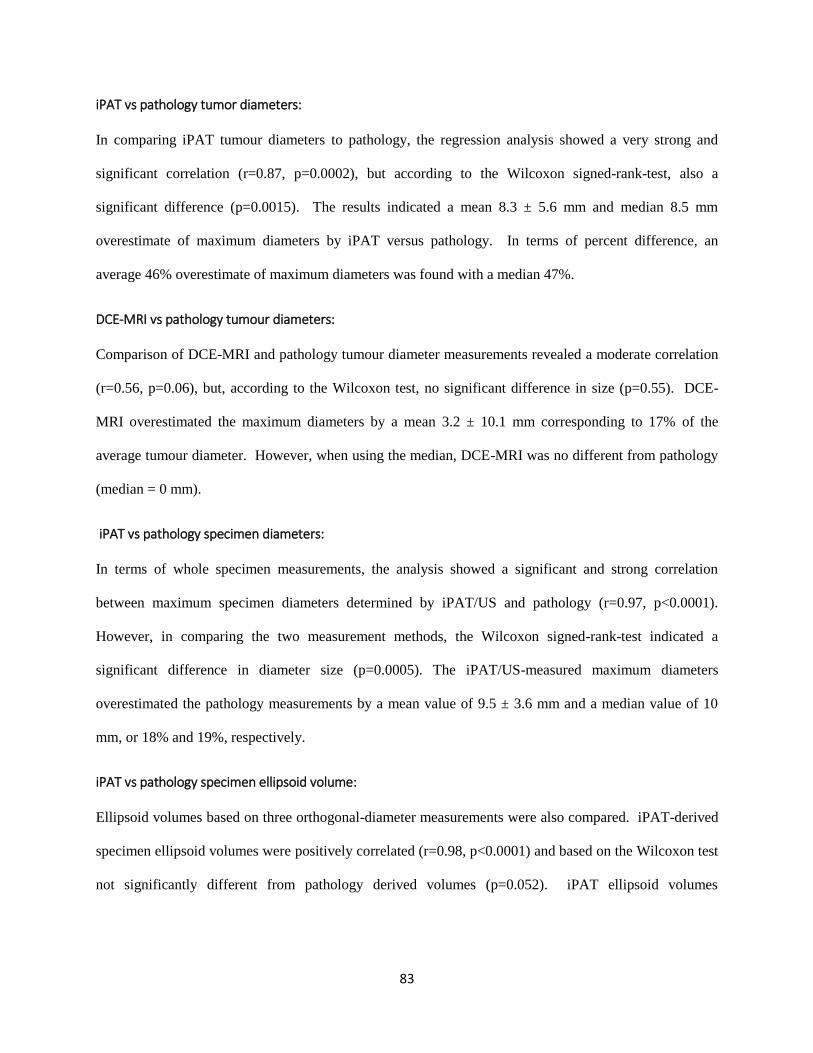
83
iPAT vs pathology tumor diameters:
In comparing iPAT tumour diameters to pathology, the regression analysis showed a very strong and
significant correlation (r=0.87, p=0.0002), but according to the Wilcoxon signed-rank-test, also a
significant difference (p=0.0015). The results indicated a mean 8.3 ± 5.6 mm and median 8.5 mm
overestimate of maximum diameters by iPAT versus pathology. In terms of percent difference, an
average 46% overestimate of maximum diameters was found with a median 47%.
DCE-MRI vs pathology tumour diameters:
Comparison of DCE-MRI and pathology tumour diameter measurements revealed a moderate correlation
(r=0.56, p=0.06), but, according to the Wilcoxon test, no significant difference in size (p=0.55). DCE-
MRI overestimated the maximum diameters by a mean 3.2 ± 10.1 mm corresponding to 17% of the
average tumour diameter. However, when using the median, DCE-MRI was no different from pathology
(median = 0 mm).
iPAT vs pathology specimen diameters:
In terms of whole specimen measurements, the analysis showed a significant and strong correlation
between maximum specimen diameters determined by iPAT/US and pathology (r=0.97, p<0.0001).
However, in comparing the two measurement methods, the Wilcoxon signed-rank-test indicated a
significant difference in diameter size (p=0.0005). The iPAT/US-measured maximum diameters
overestimated the pathology measurements by a mean value of 9.5 ± 3.6 mm and a median value of 10
mm, or 18% and 19%, respectively.
iPAT vs pathology specimen ellipsoid volume:
Ellipsoid volumes based on three orthogonal-diameter measurements were also compared. iPAT-derived
specimen ellipsoid volumes were positively correlated (r=0.98, p<0.0001) and based on the Wilcoxon test
not significantly different from pathology derived volumes (p=0.052). iPAT ellipsoid volumes
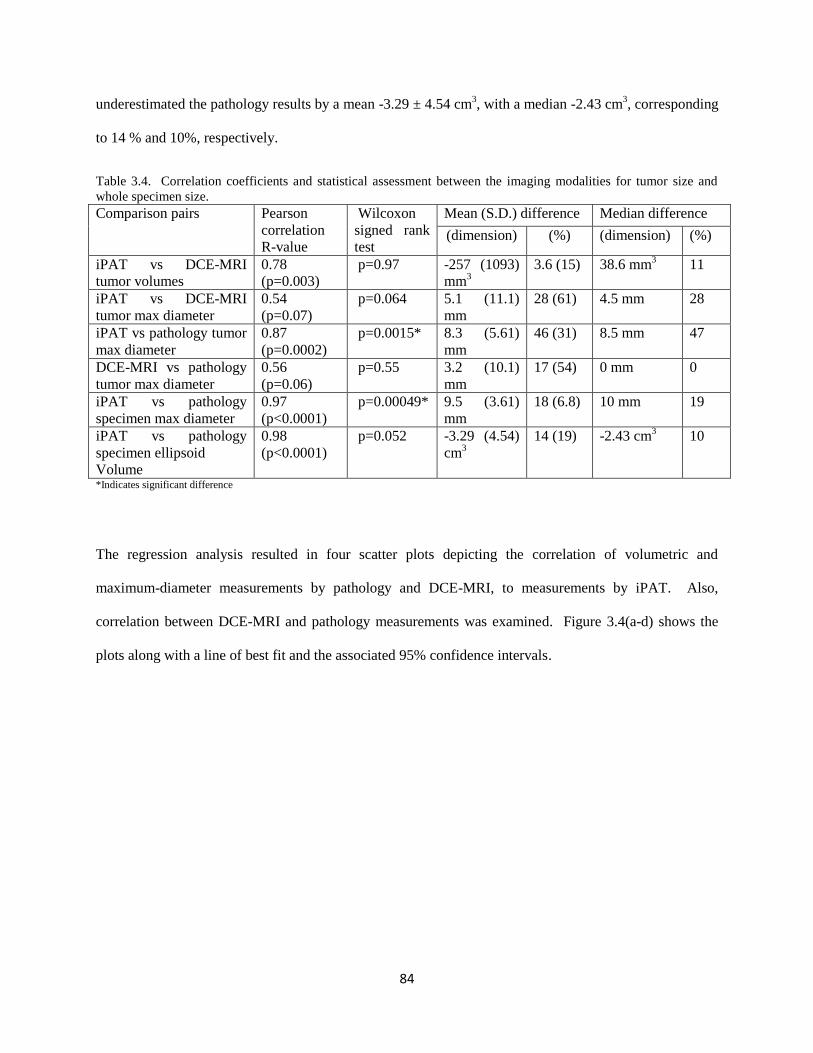
84
underestimated the pathology results by a mean -3.29 ± 4.54 cm3, with a median -2.43 cm
3, corresponding
to 14 % and 10%, respectively.
Table 3.4. Correlation coefficients and statistical assessment between the imaging modalities for tumor size and
whole specimen size.
Comparison pairs Pearson
correlation
R-value
Wilcoxon
signed rank
test
Mean (S.D.) difference Median difference
(dimension) (%) (dimension) (%)
iPAT vs DCE-MRI
tumor volumes
0.78
(p=0.003)
p=0.97 -257 (1093)
mm3
3.6 (15) 38.6 mm3
11
iPAT vs DCE-MRI
tumor max diameter
0.54
(p=0.07)
p=0.064 5.1 (11.1)
mm
28 (61) 4.5 mm 28
iPAT vs pathology tumor
max diameter
0.87
(p=0.0002)
p=0.0015* 8.3 (5.61)
mm
46 (31) 8.5 mm 47
DCE-MRI vs pathology
tumor max diameter
0.56
(p=0.06)
p=0.55 3.2 (10.1)
mm
17 (54) 0 mm 0
iPAT vs pathology
specimen max diameter
0.97
(p<0.0001)
p=0.00049* 9.5 (3.61)
mm
18 (6.8) 10 mm 19
iPAT vs pathology
specimen ellipsoid
Volume
0.98
(p<0.0001)
p=0.052 -3.29 (4.54)
cm3
14 (19) -2.43 cm3 10
*Indicates significant difference
The regression analysis resulted in four scatter plots depicting the correlation of volumetric and
maximum-diameter measurements by pathology and DCE-MRI, to measurements by iPAT. Also,
correlation between DCE-MRI and pathology measurements was examined. Figure 3.4(a-d) shows the
plots along with a line of best fit and the associated 95% confidence intervals.
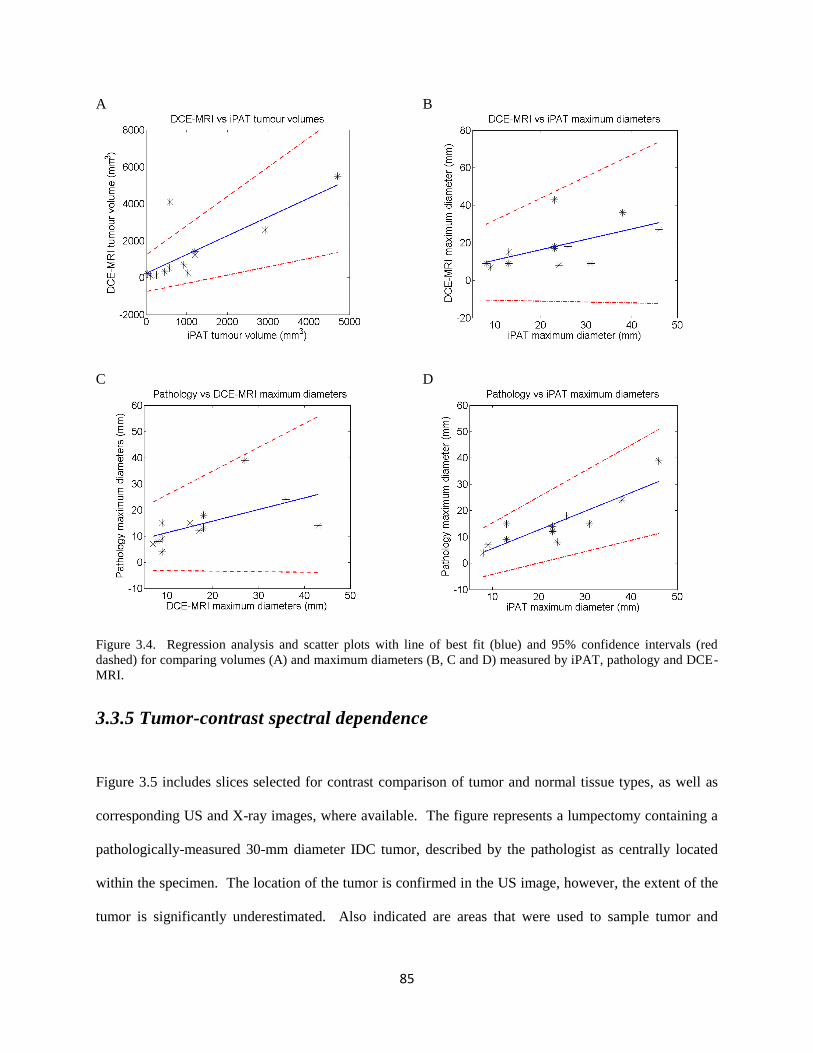
85
A B
C D
Figure 3.4. Regression analysis and scatter plots with line of best fit (blue) and 95% confidence intervals (red
dashed) for comparing volumes (A) and maximum diameters (B, C and D) measured by iPAT, pathology and DCE-
MRI.
3.3.5 Tumor-contrast spectral dependence
Figure 3.5 includes slices selected for contrast comparison of tumor and normal tissue types, as well as
corresponding US and X-ray images, where available. The figure represents a lumpectomy containing a
pathologically-measured 30-mm diameter IDC tumor, described by the pathologist as centrally located
within the specimen. The location of the tumor is confirmed in the US image, however, the extent of the
tumor is significantly underestimated. Also indicated are areas that were used to sample tumor and
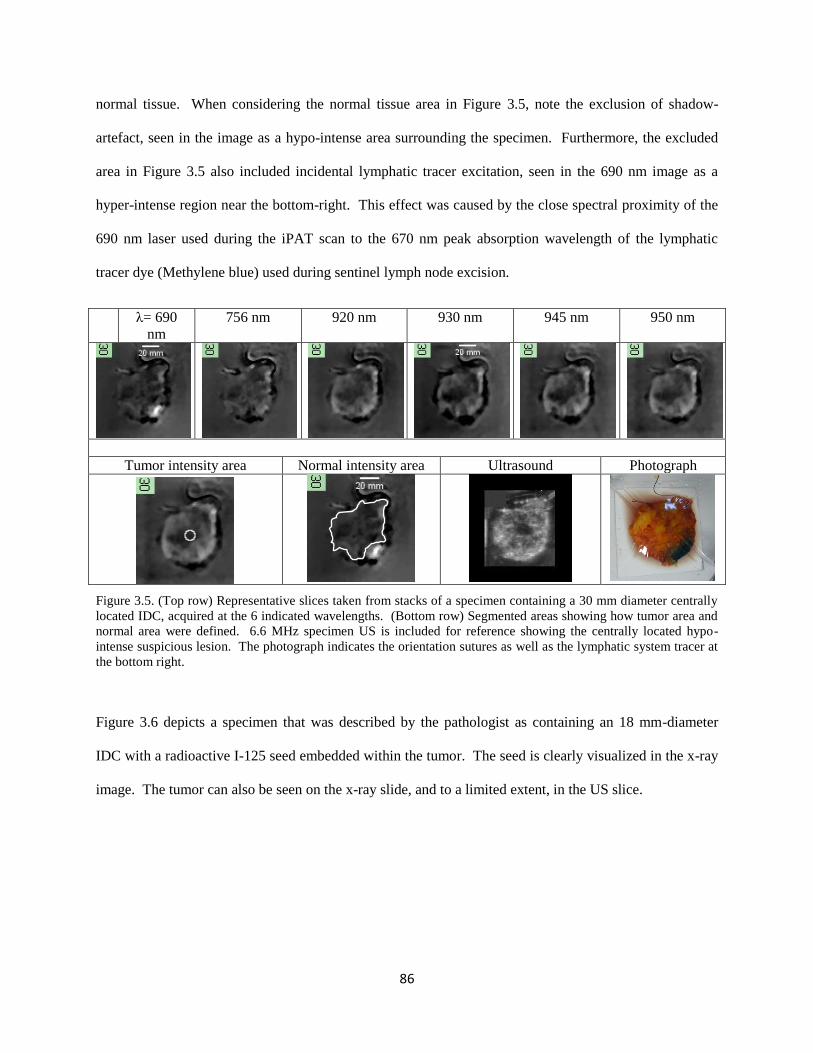
86
normal tissue. When considering the normal tissue area in Figure 3.5, note the exclusion of shadow-
artefact, seen in the image as a hypo-intense area surrounding the specimen. Furthermore, the excluded
area in Figure 3.5 also included incidental lymphatic tracer excitation, seen in the 690 nm image as a
hyper-intense region near the bottom-right. This effect was caused by the close spectral proximity of the
690 nm laser used during the iPAT scan to the 670 nm peak absorption wavelength of the lymphatic
tracer dye (Methylene blue) used during sentinel lymph node excision.
λ= 690
nm
756 nm 920 nm 930 nm 945 nm 950 nm
Tumor intensity area Normal intensity area Ultrasound Photograph
Figure 3.5. (Top row) Representative slices taken from stacks of a specimen containing a 30 mm diameter centrally
located IDC, acquired at the 6 indicated wavelengths. (Bottom row) Segmented areas showing how tumor area and
normal area were defined. 6.6 MHz specimen US is included for reference showing the centrally located hypo-
intense suspicious lesion. The photograph indicates the orientation sutures as well as the lymphatic system tracer at
the bottom right.
Figure 3.6 depicts a specimen that was described by the pathologist as containing an 18 mm-diameter
IDC with a radioactive I-125 seed embedded within the tumor. The seed is clearly visualized in the x-ray
image. The tumor can also be seen on the x-ray slide, and to a limited extent, in the US slice.
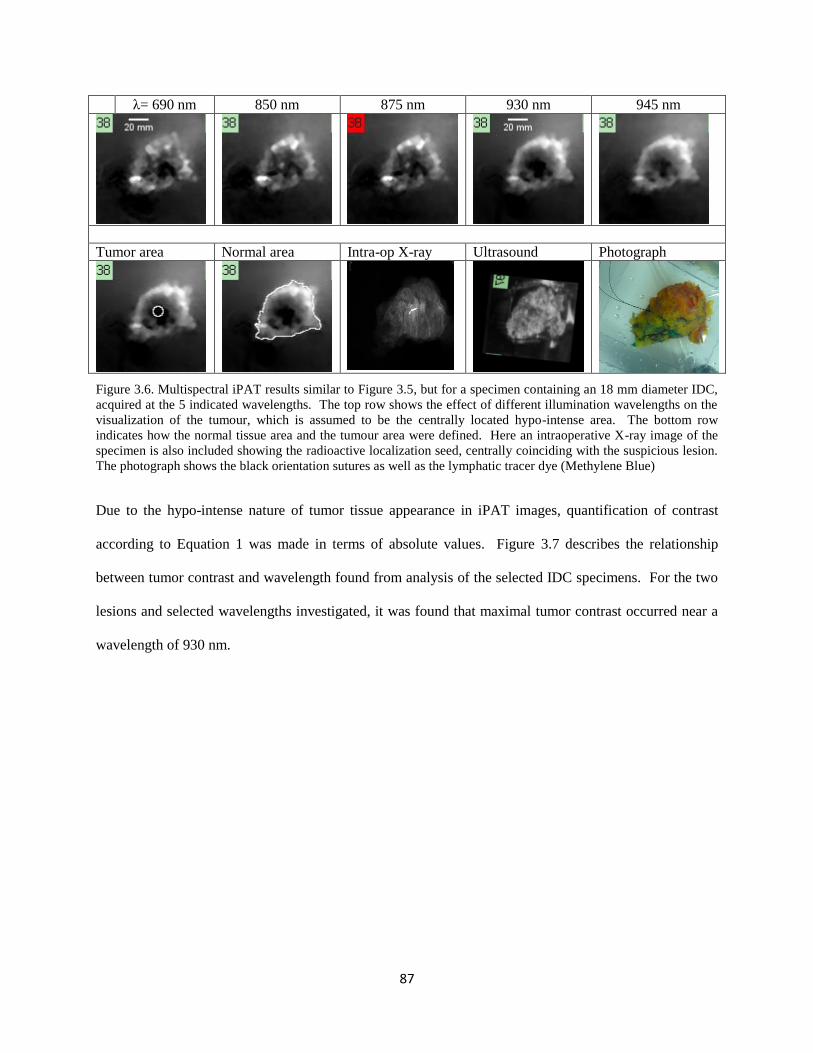
87
λ= 690 nm 850 nm 875 nm 930 nm 945 nm
Tumor area Normal area Intra-op X-ray Ultrasound Photograph
Figure 3.6. Multispectral iPAT results similar to Figure 3.5, but for a specimen containing an 18 mm diameter IDC,
acquired at the 5 indicated wavelengths. The top row shows the effect of different illumination wavelengths on the
visualization of the tumour, which is assumed to be the centrally located hypo-intense area. The bottom row
indicates how the normal tissue area and the tumour area were defined. Here an intraoperative X-ray image of the
specimen is also included showing the radioactive localization seed, centrally coinciding with the suspicious lesion.
The photograph shows the black orientation sutures as well as the lymphatic tracer dye (Methylene Blue)
Due to the hypo-intense nature of tumor tissue appearance in iPAT images, quantification of contrast
according to Equation 1 was made in terms of absolute values. Figure 3.7 describes the relationship
between tumor contrast and wavelength found from analysis of the selected IDC specimens. For the two
lesions and selected wavelengths investigated, it was found that maximal tumor contrast occurred near a
wavelength of 930 nm.
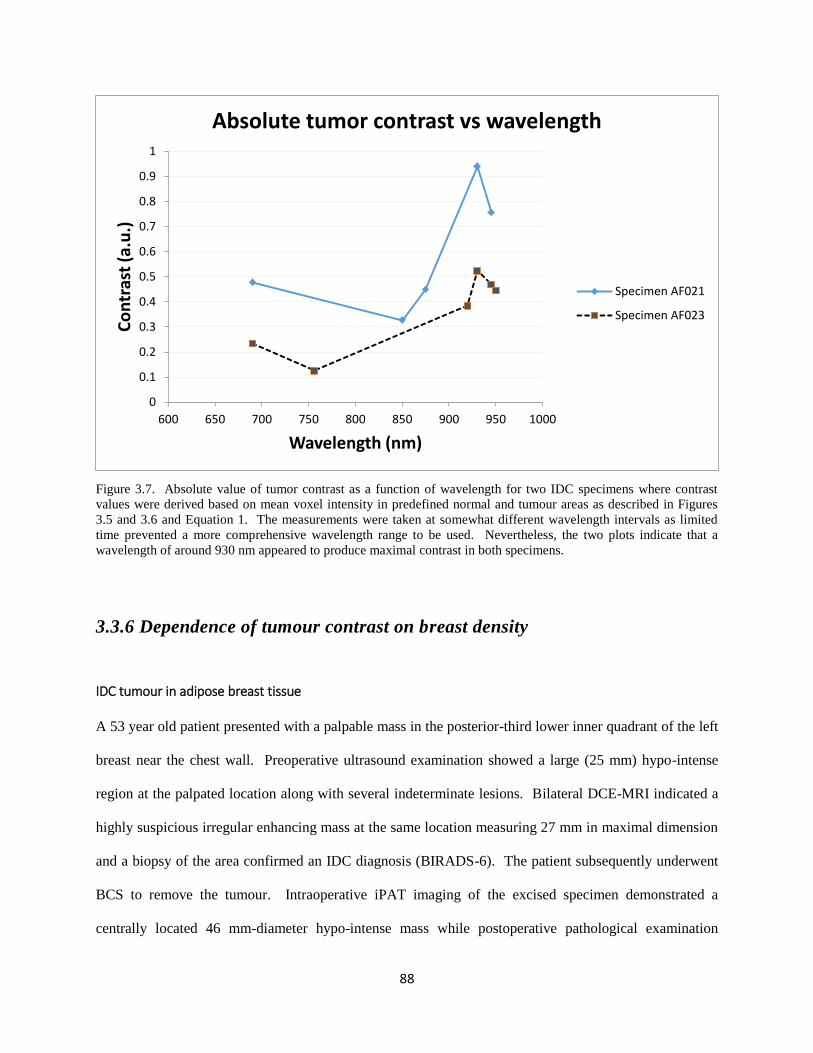
88
Figure 3.7. Absolute value of tumor contrast as a function of wavelength for two IDC specimens where contrast
values were derived based on mean voxel intensity in predefined normal and tumour areas as described in Figures
3.5 and 3.6 and Equation 1. The measurements were taken at somewhat different wavelength intervals as limited
time prevented a more comprehensive wavelength range to be used. Nevertheless, the two plots indicate that a
wavelength of around 930 nm appeared to produce maximal contrast in both specimens.
3.3.6 Dependence of tumour contrast on breast density
IDC tumour in adipose breast tissue
A 53 year old patient presented with a palpable mass in the posterior-third lower inner quadrant of the left
breast near the chest wall. Preoperative ultrasound examination showed a large (25 mm) hypo-intense
region at the palpated location along with several indeterminate lesions. Bilateral DCE-MRI indicated a
highly suspicious irregular enhancing mass at the same location measuring 27 mm in maximal dimension
and a biopsy of the area confirmed an IDC diagnosis (BIRADS-6). The patient subsequently underwent
BCS to remove the tumour. Intraoperative iPAT imaging of the excised specimen demonstrated a
centrally located 46 mm-diameter hypo-intense mass while postoperative pathological examination
0
0.1
0.2
0.3
0.4
0.5
0.6
0.7
0.8
0.9
1
600 650 700 750 800 850 900 950 1000
Co
ntr
ast
(a.u
.)
Wavelength (nm)
Absolute tumor contrast vs wavelength
Specimen AF021
Specimen AF023
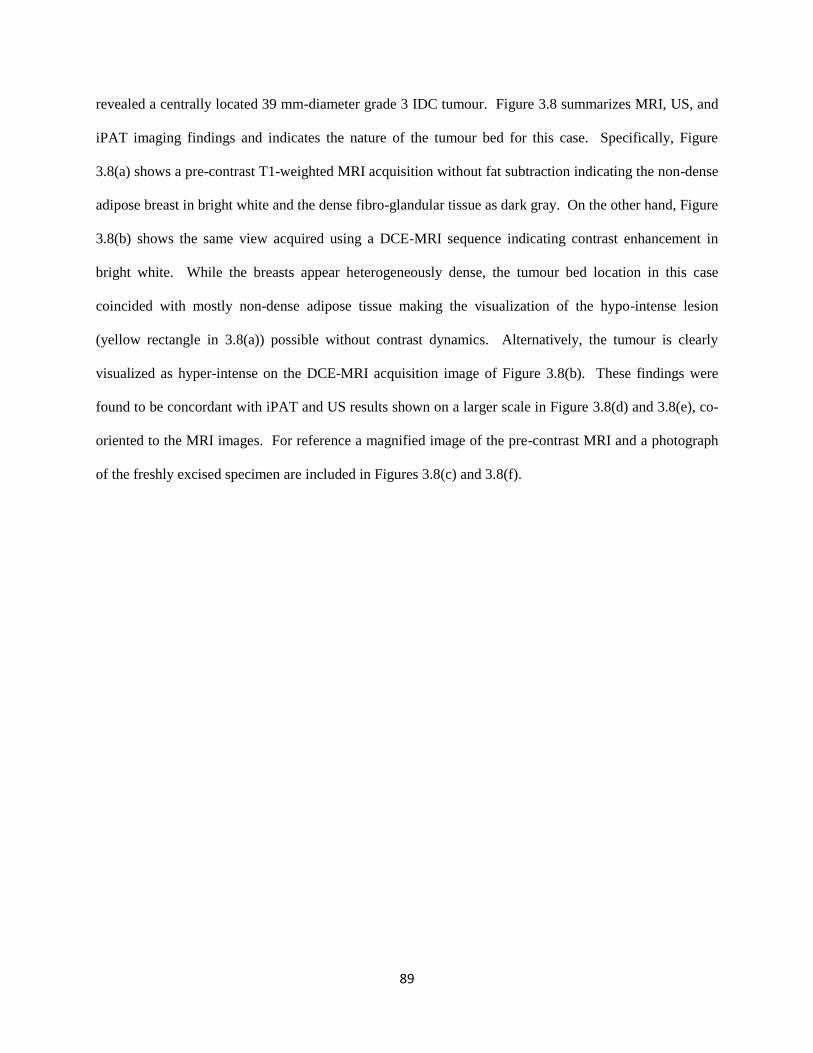
89
revealed a centrally located 39 mm-diameter grade 3 IDC tumour. Figure 3.8 summarizes MRI, US, and
iPAT imaging findings and indicates the nature of the tumour bed for this case. Specifically, Figure
3.8(a) shows a pre-contrast T1-weighted MRI acquisition without fat subtraction indicating the non-dense
adipose breast in bright white and the dense fibro-glandular tissue as dark gray. On the other hand, Figure
3.8(b) shows the same view acquired using a DCE-MRI sequence indicating contrast enhancement in
bright white. While the breasts appear heterogeneously dense, the tumour bed location in this case
coincided with mostly non-dense adipose tissue making the visualization of the hypo-intense lesion
(yellow rectangle in 3.8(a)) possible without contrast dynamics. Alternatively, the tumour is clearly
visualized as hyper-intense on the DCE-MRI acquisition image of Figure 3.8(b). These findings were
found to be concordant with iPAT and US results shown on a larger scale in Figure 3.8(d) and 3.8(e), co-
oriented to the MRI images. For reference a magnified image of the pre-contrast MRI and a photograph
of the freshly excised specimen are included in Figures 3.8(c) and 3.8(f).
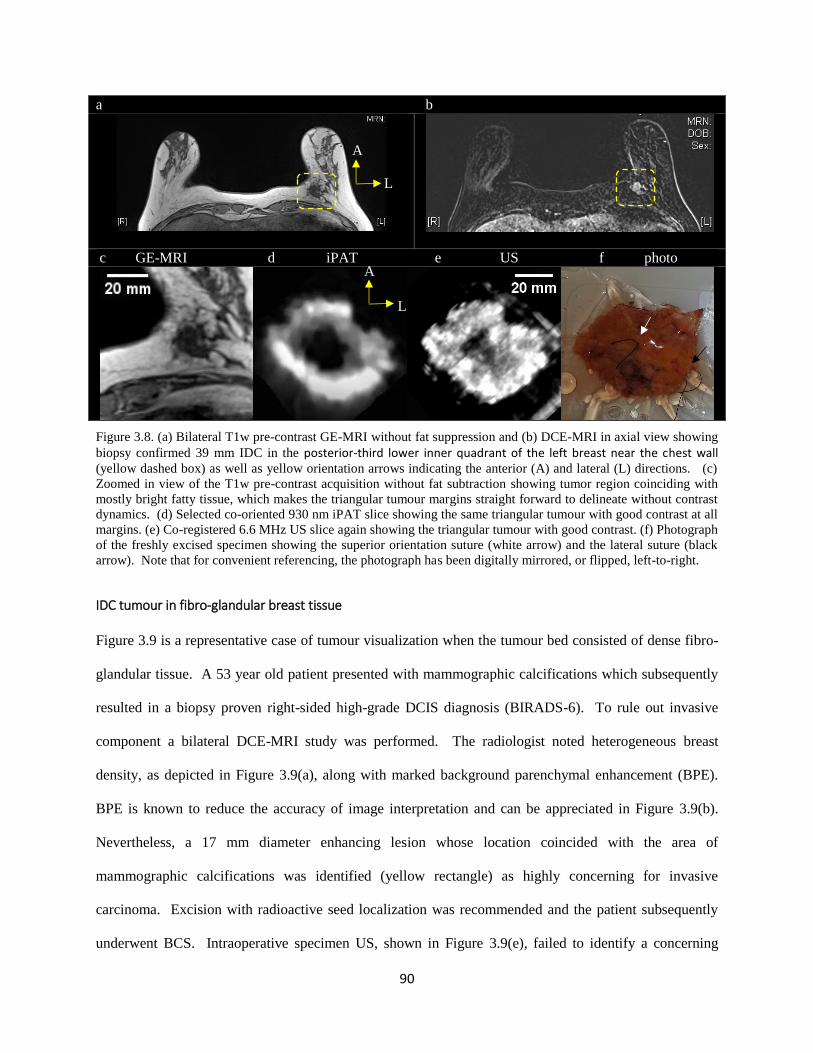
90
a b
c GE-MRI d iPAT e US f photo
Figure 3.8. (a) Bilateral T1w pre-contrast GE-MRI without fat suppression and (b) DCE-MRI in axial view showing
biopsy confirmed 39 mm IDC in the posterior-third lower inner quadrant of the left breast near the chest wall (yellow dashed box) as well as yellow orientation arrows indicating the anterior (A) and lateral (L) directions. (c)
Zoomed in view of the T1w pre-contrast acquisition without fat subtraction showing tumor region coinciding with
mostly bright fatty tissue, which makes the triangular tumour margins straight forward to delineate without contrast
dynamics. (d) Selected co-oriented 930 nm iPAT slice showing the same triangular tumour with good contrast at all
margins. (e) Co-registered 6.6 MHz US slice again showing the triangular tumour with good contrast. (f) Photograph
of the freshly excised specimen showing the superior orientation suture (white arrow) and the lateral suture (black
arrow). Note that for convenient referencing, the photograph has been digitally mirrored, or flipped, left-to-right.
IDC tumour in fibro-glandular breast tissue
Figure 3.9 is a representative case of tumour visualization when the tumour bed consisted of dense fibro-
glandular tissue. A 53 year old patient presented with mammographic calcifications which subsequently
resulted in a biopsy proven right-sided high-grade DCIS diagnosis (BIRADS-6). To rule out invasive
component a bilateral DCE-MRI study was performed. The radiologist noted heterogeneous breast
density, as depicted in Figure 3.9(a), along with marked background parenchymal enhancement (BPE).
BPE is known to reduce the accuracy of image interpretation and can be appreciated in Figure 3.9(b).
Nevertheless, a 17 mm diameter enhancing lesion whose location coincided with the area of
mammographic calcifications was identified (yellow rectangle) as highly concerning for invasive
carcinoma. Excision with radioactive seed localization was recommended and the patient subsequently
underwent BCS. Intraoperative specimen US, shown in Figure 3.9(e), failed to identify a concerning
A
L
A
L
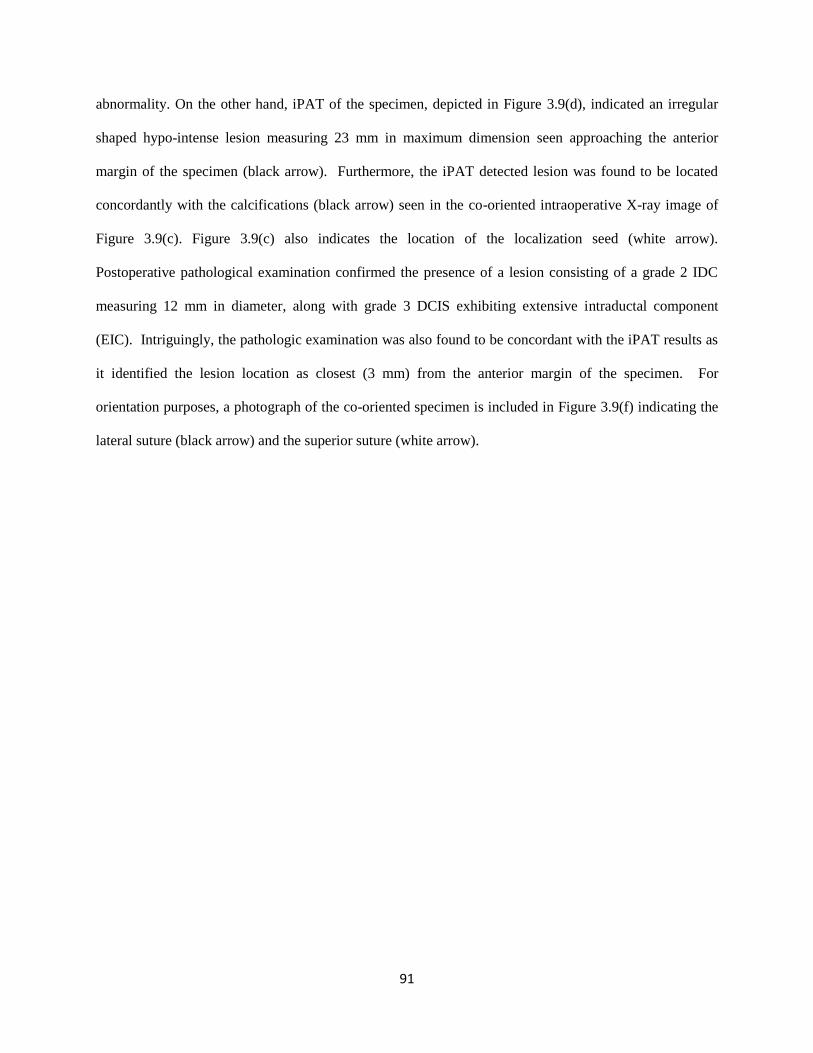
91
abnormality. On the other hand, iPAT of the specimen, depicted in Figure 3.9(d), indicated an irregular
shaped hypo-intense lesion measuring 23 mm in maximum dimension seen approaching the anterior
margin of the specimen (black arrow). Furthermore, the iPAT detected lesion was found to be located
concordantly with the calcifications (black arrow) seen in the co-oriented intraoperative X-ray image of
Figure 3.9(c). Figure 3.9(c) also indicates the location of the localization seed (white arrow).
Postoperative pathological examination confirmed the presence of a lesion consisting of a grade 2 IDC
measuring 12 mm in diameter, along with grade 3 DCIS exhibiting extensive intraductal component
(EIC). Intriguingly, the pathologic examination was also found to be concordant with the iPAT results as
it identified the lesion location as closest (3 mm) from the anterior margin of the specimen. For
orientation purposes, a photograph of the co-oriented specimen is included in Figure 3.9(f) indicating the
lateral suture (black arrow) and the superior suture (white arrow).
92
a b
c X-ray d iPAT e US f photo
Figure 3.9. (a) Bilateral T1w pre-contrast without fat suppression and (b) DCE-MRI in axial view showing biopsy
confirmed 12 mm grade 2 IDC with accompanied DCIS and EIC in the right breast (yellow dashed box) as well as
yellow orientation arrows indicating the anterior (A) and lateral (L) directions. Due to the dense breasts, the tumour
is difficult to delineate without contrast dynamics in (a) as it is contiguous with dense fibro-glandular tissue
visualized as dark gray. (c) Co-oriented intraoperative transmission X-ray image of the specimen showing the
radioactive localization seed (white arrow) along with an area of suspicious calcifications (black arrow). (d) Selected
co-oriented 930 nm iPAT slice showing the hypo-intense tumour with good contrast approaching the anterior margin
(black arrow) as indicated by postoperative pathologic examination. (e) Co-registered 6.6 MHz US slice failing to
visualize any suspicious abnormality at the pathologically confirmed location of the lesion. (f) Photograph of the
freshly excised specimen showing the superior orientation suture (white arrow) and the lateral suture (black arrow).
Note that for convenient referencing, the photograph has been digitally mirrored, or flipped, left-to-right.
Table 3.5 lists the ACR BI-RADS ATLAS classification of breast tissue density, encountered in this
study, and the same categories have been adopted for the corresponding pathological description. Table 5
also shows a breakdown of the DCE-MRI background parenchymal enhancement levels. While the
pathological description corresponded to the limited breast tissue volume of the excised specimen, a good
agreement was found with MRI, which described the entire breast. MRI breast density was extreme in 4
cases, while pathologic description indicated extreme density in 3 cases. Heterogeneous density was
found to be present in 6 and 5 cases for MRI and pathology, respectively. Pathology indicated the
remaining 4 specimens to be either mostly fatty or scattered fibro-glandular, while MRI found this for the
A
L
A
L
A
L
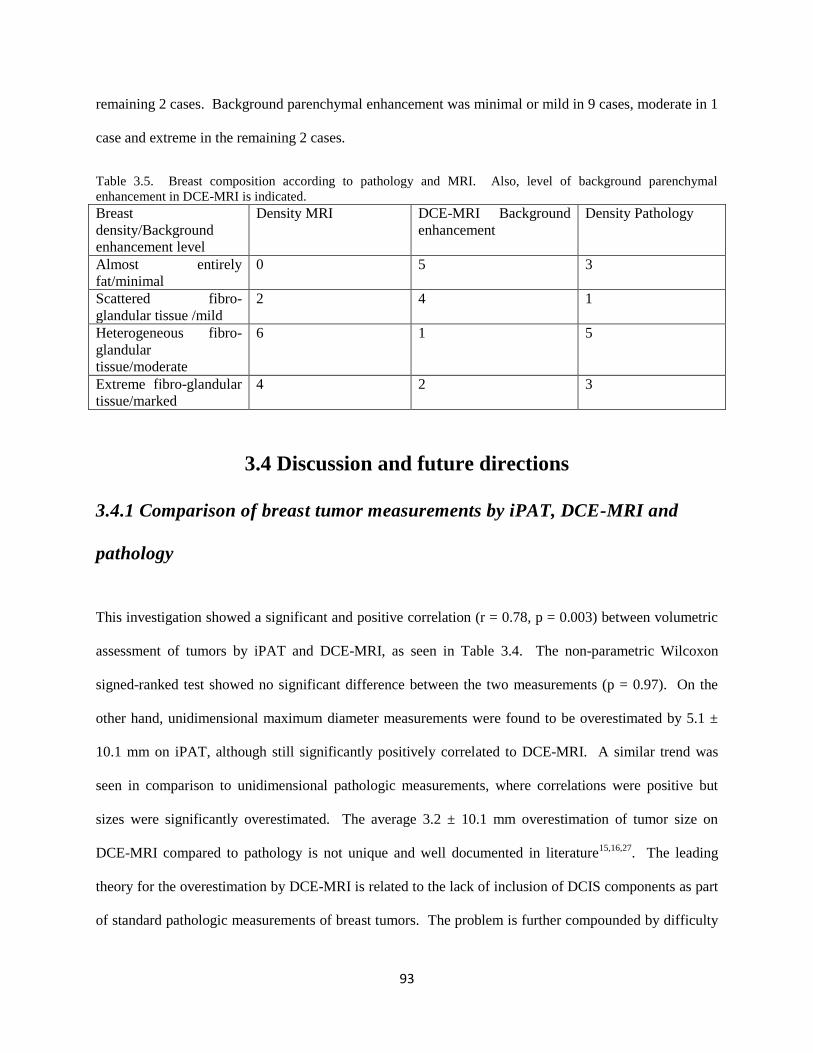
93
remaining 2 cases. Background parenchymal enhancement was minimal or mild in 9 cases, moderate in 1
case and extreme in the remaining 2 cases.
Table 3.5. Breast composition according to pathology and MRI. Also, level of background parenchymal
enhancement in DCE-MRI is indicated.
Breast
density/Background
enhancement level
Density MRI DCE-MRI Background
enhancement
Density Pathology
Almost entirely
fat/minimal
0 5 3
Scattered fibro-
glandular tissue /mild
2 4 1
Heterogeneous fibro-
glandular
tissue/moderate
6 1 5
Extreme fibro-glandular
tissue/marked
4 2 3
3.4 Discussion and future directions
3.4.1 Comparison of breast tumor measurements by iPAT, DCE-MRI and
pathology
This investigation showed a significant and positive correlation (r = 0.78, p = 0.003) between volumetric
assessment of tumors by iPAT and DCE-MRI, as seen in Table 3.4. The non-parametric Wilcoxon
signed-ranked test showed no significant difference between the two measurements (p = 0.97). On the
other hand, unidimensional maximum diameter measurements were found to be overestimated by 5.1 ±
10.1 mm on iPAT, although still significantly positively correlated to DCE-MRI. A similar trend was
seen in comparison to unidimensional pathologic measurements, where correlations were positive but
sizes were significantly overestimated. The average 3.2 ± 10.1 mm overestimation of tumor size on
DCE-MRI compared to pathology is not unique and well documented in literature15,16,27
. The leading
theory for the overestimation by DCE-MRI is related to the lack of inclusion of DCIS components as part
of standard pathologic measurements of breast tumors. The problem is further compounded by difficulty
94
in differentiating DCIS from IDC with current medical imaging technology. This study, being
retrospective in nature, did not include special instructions to collect more detailed information on DCIS
tumors. This is unfortunate because the maximum tumor diameter overestimate, found on both DCE-
MRI and iPAT, is likely at least partially due to DCIS. Having DCIS size information would have
allowed iPAT effectiveness for DCIS assessment to be estimated, and therefore, future studies focused on
DCIS should ensure that detailed pathologic measurements are taken.
Tumor grade and receptor status was not found to significantly affect iPAT imaging findings or
appearance. However, the two specimens found to contain extensive intra-ductal component, did appear
to have many heterogeneously scattered focal hypo-intensities. This made tumor measurements
somewhat difficult, compared to almost all other cases, and resulted in an above average overestimation
of size by iPAT and DCE-MRI, compared to pathologic size.
3.4.2 Effect of lumpectomy holder on measurements
While the overestimate of maximum tumor diameters by iPAT versus pathology is partially explained by
the lack of inclusion of DCIS, it does not explain the average 5.1 mm overestimate of diameters on iPAT
compared to DCE-MRI. However, a compelling case can be made by considering the method by which
the specimen was immobilized inside the iPAT scanner. The specialized lumpectomy specimen holder,
that was used to restrain the samples, applied significant compressive pressure on the specimens. This
had the effect of flattening out the samples, making them noticeably thinner, vertically, as well as wider,
horizontally. Motivated similarly to x-ray mammographic breast compression, this method of sample
immobilization is well suited to iPAT because it allows greater laser fluence to reach inside the thinner
compressed specimen compared to an uncompressed specimen. Unfortunately, compression may skew
non-volumetric unidimensional measurement results, due to specimen deformation, making maximum
diameter correlations biased.
95
To establish a measure of specimen and tumor deformation, three orthogonal diameter measurements and
associated ellipsoid volumes were calculated using pathologic and iPAT/US data. Similarly, to tumor
maximum diameters, the resulting specimen maximum diameters were also positively correlated but
significantly different. In fact, specimen maximum diameters were overestimated by an average 9.5 ± 3.6
mm, while ellipsoid volumes were not significantly different, a trend also seen with the tumor
measurements tabulated in Table 3.4. Therefore, a reasonable explanation is that at least part of the
specimen deformation, caused by the compressive nature of the lumpectomy holder, was imparted to the
lesions contained within. This finding is not entirely new as mammographic and photoacoustic
compression paddles, as well as MRI breast coils, have been blamed for tumor measurement
discrepancies in previous studies5,19,28
. Furthermore, the shape of specimens in the present investigation
was likely even more affected by the compression of the holder because less tissue was present
surrounding the tumor compared to in-vivo cases. In fact, the goal of BCS is to remove a minimum
amount of surrounding normal tissue in order to achieve good cosmetic outcomes. With less tissue to
cushion the compression of the holder, even more deformation should be expected, making the present
investigation particularly vulnerable to systematic bias.
3.4.3 Participant and lesion characteristics
The selected participants in this first-of-a-kind investigation were not representative of an average breast
cancer patient population. The most common reason for MRI examination in these cases was either
occult nature of tumor on US and mammography, or generally ambiguous findings due to dense breasts.
This is reflected in the low mean (49.5 years) and median (50 years) age of the participants. Compared to
the full 100 participant cohort in our intraoperative study, the average age for the group reported here was
approximately 10 years lower. For these reasons it is not surprising that the average breast density
associated with the participants in this investigation was significantly higher, compared to a normal
population. In fact, 10 out of 12, or 83%, of the participants had heterogeneous or extreme fibro-
96
glandular tissue. This is much higher than an average of 50% encountered in the normal population29
.
Furthermore, 75%, or 9 out of 12 invasive cancer cases studied contained in-situ components, which were
not included in pathologic measurements, as per current standard of care. These statistics indicate that the
cases are likely more challenging than what would be expected of the general population. Therefore,
interpretation of the results should be made with these differences in mind.
3.4.4 Image reconstruction and processing
The specificity of iPAT is owed in large part to the relative quantification of dominant tissue
chromophores, extracted from deep tissue via the photoacoustic effect. Filtered back-projection was
found to be an efficient image reconstruction method to estimate the chromophore distribution inside the
specimens. However, the limited aperture effect, which often plagues PAT results, likely distorted the true
chromophore distribution due to the absence of sensors at key points30,31
. We found that the K-wave
image improvement method, described above, could at least partially restore voxel amplitudes in areas
where intensity varied in a non-physical manner. The result was a smoother and more cohesive
appearance of tumours. This can be appreciated in Figure 3.2 where the tumour-edge is significantly
clearer in the K-wave improved image. The effect is especially noticeable in the transmission-mode
image, which is consistent with the fact that the transmission mode side of the imaging volume is further
out of the effective signal detection region. The improved images were found to better agree with
correlated x-ray and US findings, and were easier to segment. The segmentation was further aided by use
of a median filter, which is often invoked in US image processing because of its ability to smooth out
speckle noise while preserving boundary features.32
The benefit of K-wave iterative image improvement on the imaging results of this study indicated that
detector coverage was sub-optimal. While the method was able to partially mitigate transducer detection
gaps by estimating forward model pressure measurements over a fully enclosing detection surface using
time reversal, it was unable to provide any additional information. To minimize missing information
97
caused by aperture deficits, future investigations using PAT should pay close attention to scanning
geometry and transducer detection coverage.
3.4.5 Shadowing artefacts
The vertical bidirectional illumination geometry, combined with an effectively hemispherical detection
scheme, resulted in what can be considered a combination transmission/reflection/orthogonal mode image
volume. It was important that image analysis and segmentation took this information into account,
particularly near the edges of the specimen. Analogous to acoustic shadowing and edge shadowing
artefacts in ultrasonography, sharp illumination gradients associated with iPAT imaging may also cause
shadowing artefacts.33
For example, in the case of the IDC shown in Figure 3.2, the transmission-mode
panels show a hypo-intense band running along the top of the specimen. These shadow-like effects can
interfere with the visualization of tumors, which also present as hypo-intense volumes. In cases where the
tumor was abutting the margins, or was otherwise located peripherally, this interference caused the edges
of the specimen to be difficult to delineate from the tumors. In this study, we partially overcame this
difficulty by collecting co-registered US images to define the edges of the specimens prior to tumor
segmentation. This approach was particularly useful in one case where a positive margin was detected on
pathology. Nevertheless, if the shadowing artefacts were mistaken for tumour tissue, the delineation
problem could still arise even with specimen edges predefined by US. However, notice the lack of
shadowing artefacts in the reflection-mode image of the same IDC in Figure 3.2. More generally, we
found that transmission mode iPAT imaging was prone to shadowing, while reflection mode appeared
artefact-free. This points to a seemingly simple solution, but more investigation is needed to establish the
superiority of reflection-mode iPAT, especially as it pertains to imaging depth and sensitivity of tumour
imaging.

98
3.4.6 Breast density dependence
Our results indicated that tumour tissue may be distinguished from normal breast tissue using iPAT. The
mechanism underlying this contrast difference was hypothesized to be due to the relatively low optical
absorption coefficient of malignant tissue and subsequent hypo-intense imaging appearance on scans near
a wavelength of 930 nm. However, a wavelength of 930 nm has been shown to be strongly absorbed by
bulk-lipid, or, fat-containing tissue.34
A possible concern with this inference, therefore, was that the
hypo-intense regions in iPAT images were volumes of the breast with relatively low-fat content, and as
such may simply have represented dense non-fatty fibro-glandular tissue. Indeed, dense fibro-glandular
tissue is also often blamed for sensitivity and specificity deficits in conventional imaging methods, such
as ultrasound and mammography, and are often overcome only by use of dynamic contrast enhancement
in MRI.12,15
It was therefore hypothesized that tumours which are visible on iPAT simply due to
surrounding fat tissue should also be seen as surrounded by fat, visualized as hyper-intense on T1
weighted pre-contrast MRI. This situation is exemplified by the case in Figure 3.8. Surprisingly
however, inspection of Figure 3.9 reveals that this may not always be the case, since a significant portion
of that IDC was embedded in dense fibro-glandular tissue and was only delineated by use of dynamic
contrast enhancement. Since most of the cases in this study involved relatively dense breasts, as seen in
Table 3.5, the ability of iPAT to successfully visualize highly localized hypo-intense volumes with good
contrast, hints at the independence of iPAT and breast density. Finally, the photoacoustic mammography,
or PAM, study by Manohar et al. also reached the same conclusion, i.e. the optical contrast in PAT is
largely independent of tissue density.19
3.4.7 Tumor-contrast spectral dependence
Figure 3.7 indicates that maximum apparent tumor contrast on iPAT scans occurs near a wavelength of
930 nm. As discussed above, this wavelength corresponded to the strong absorption band by fat, and
99
apparently, healthy fibro-glandular breast tissue. Therefore, the contrast mechanism came about by
enhancement of non-malignant volumes, leaving tumours hypo-intense. However, beyond using 690 nm
and 930 nm to map hemoglobin and lipids in lumpectomies, other wavelengths may offer further cancer
relevant contrast. For example, the firm and fibrous tissue that is often associated with palpable tumour
lumps, is known to contain elevated concentrations of water and collagen, both of which exhibit unique
spectral features in the infrared wavelength range from about 900 nm to 1300 nm. Therefore, careful
selection of key wavelengths in this range may offer further differentiation capability.
Interestingly, both lesions under the multispectral study had present within them volumes that were hypo-
intense at multiple wavelengths. Even the deoxy-hemoglobin-sensitive wavelengths of 690 nm and 756
nm contained hypo-intense areas, some of which were contiguous with the tumor. These findings
indicated that some malignant tissue may present as hypo-intense only on lipid-weighted 930 nm
imaging, while other malignant tissue presents as hypo-intense on both 930 nm and hemoglobin-weighted
690 nm imaging. The heterogeneity of tumor areas, imaged at different wavelengths, indicates
underlying compositional complexity, and this highlights the importance of multispectral assessment in
furthering our understanding of the tumour environment.
3.5 Conclusion
This investigation presented a comparison of breast tumor size by intra-operative iPAT, pre-operative
DCE-MRI and post-operative pathology. The strong positive correlations of up to r = 0.78 that were
found between iPAT and other modalities as well as pathology provided confidence that iPAT has utility
for imaging during breast surgery. We found that volumetric tumor measurements were more reliable
than unidimensional measurements, echoing previous studies with established medical imaging
technologies. These findings open a new window and a fresh perspective on malignancy visualization
and assessment. Compelling future research directions were highlighted by brief examination of the
nature of breast tumor contrast in iPAT, and its dependence on illumination wavelength. Finally, perhaps
100
the most impactful aspect of this investigation may be the apparent independence of iPAT tumour
contrast and breast density. This finding implies that a breast imaging system based on iPAT technology
may offer fast and safe high-contrast tumour visualization at low cost and without the need for contrast
agents or ionizing radiation exposure. In addition to intraoperative applications, highlighted here, the
potential impact of such technology on breast screening programs as well as preoperative imaging is
significant.
3.6 References
1. Siegel RL, Miller KD, Jemal A. Cancer Statistics , 2015. CA Cancer J Clin. 2015;65(1):5-29. doi:10.3322/caac.21254.
2. Yaffe MJ, Bloomquist AK, Hunter DM, et al. Comparative performance of modern digital
mammography systems in a large breast screening program Comparative performance of modern
digital mammography systems in a large breast screening program. Med Phys.
2013;40(112):121915. doi:10.1118/1.4829516.
3. Balleyguier C, Ayadi S, Van Nguyen K, Vanel D, Dromain C, Sigal R. BIRADS??? classification
in mammography. Eur J Radiol. 2007;61(2):192-194. doi:10.1016/j.ejrad.2006.08.033.
4. Tardivon AA, Athanasiou A, Thibault F, El Khoury C. Breast imaging and reporting data system
(BIRADS): Magnetic resonance imaging. Eur J Radiol. 2007;61(2):212-215.
doi:10.1016/j.ejrad.2006.08.036.
5. Yang WT, Lam WWM, Cheung H, Suen M, King WWK, Metreweli C. Sonographic, magnetic
resonance imaging, and mammographic assessments of preoperative size of breast cancer. J
Ultrasound Med. 1997;16(12):791-797. http://www.scopus.com/inward/record.url?eid=2-s2.0-
0000202613&partnerID=tZOtx3y1.
6. Ananthakrishnan P, Balci FL, Crowe JP. Optimizing Surgical Margins in Breast Conservation. Int
J Surg Oncol. 2012;2012. doi:10.1155/2012/585670.
7. Hargreaves AC, Mohamed M. Intra-Operative Guidance : Methods for Achieving Negative
Margins in Breast Conserving Surgery. J Surg Oncol. 2014;110(1):21-25. doi:10.1002/jso.23645.
8. Gu Y-L, Pan S-M, Ren J, Yang Z-X, Jiang G-Q. Role of Magnetic Resonance Imaging in
Detection of Pathologic Complete Remission in Breast Cancer Patients Treated With Neoadjuvant
Chemotherapy: A Meta-analysis. Clin Breast Cancer. 2017. doi:10.1016/j.clbc.2016.12.010.
9. Groheux D, Cochet A, Humbert O, Alberini J-L, Hindié E, Mankoff D. 18F-FDG PET/CT for
Staging and Restaging of Breast Cancer. J Nucl Med. 2016;57 Suppl 1:17S-26S.
doi:10.2967/jnumed.115.157859.
10. Eisenhauer EA, Therasse P, Bogaerts J, et al. New response evaluation criteria in solid tumours:
Revised RECIST guideline (version 1.1). Eur J Cancer. 2009;45(2):228-247.
doi:10.1016/j.ejca.2008.10.026.
101
11. Waljee JF, Hu ES, Newman LA, Alderman AK. Predictors of Re-excision among Women
Undergoing Breast-Conserving Surgery for Cancer. Ann Surg Oncol. 2008;15(5):1297-1303.
doi:10.1245/s10434-007-9777-x.
12. Bosch AM, Kessels AGH, Beets GL, et al. Preoperative estimation of the pathological breast
tumour size by physical examination, mammography and ultrasound: A prospective study on 105
invasive tumours. Eur J Radiol. 2003;48(3):285-292. doi:10.1016/S0720-048X(03)00081-0.
13. Weir L, Worsley D, Bernstein V. The value of FDG positron emission tomography in the
management of patients with breast cancer. Breast J. 2005;11(3):204-209. doi:TBJ21625
[pii]\r10.1111/j.1075-122X.2005.21625.x.
14. Schaefgen B, Mati M, Sinn HP, et al. Can Routine Imaging After Neoadjuvant Chemotherapy in
Breast Cancer Predict Pathologic Complete Response? Ann Surg Oncol. 2015;23(3):789-795.
doi:10.1245/s10434-015-4918-0.
15. Gruber I V, Rueckert M, Kagan KO, et al. Measurement of tumour size with mammography,
sonography and magnetic resonance imaging as compared to histological tumour size in primary
breast cancer. BMC Cancer. 2013;13(June 2005):328. doi:10.1186/1471-2407-13-328.
16. Menezes GL, Knuttel FM, Stehouwer BL, Pijnappel RM, van den Bosch MA. Magnetic resonance
imaging in breast cancer: A literature review and future perspectives. World J Clin Oncol.
2014;5(2):61-70. doi:10.5306/wjco.v5.i2.61.
17. Manohar S, Vaartjes SE, van Hespen JCG, et al. Initial results of in vivo non-invasive cancer
imaging in the human breast using near-infrared photoacoustics. Opt Express. 2007;15(19):12277-
12285. doi:10.1364/OE.15.012277.
18. Kruger RA, Kuzmiak CM, Lam RB, et al. Dedicated 3D photoacoustic breast imaging Dedicated
3D photoacoustic breast imaging. Med Phys. 2013;40(11):113301. doi:10.1118/1.4824317.
19. Heijblom M, Piras D, van den Engh FM, et al. The state of the art in breast imaging using the
Twente Photoacoustic Mammoscope: results from 31 measurements on malignancies. Eur Radiol.
2016;26(11):3874-3887. doi:10.1007/s00330-016-4240-7.
20. Ermilov S a., Khamapirad T, Conjusteau A, et al. Laser optoacoustic imaging system for detection
of breast cancer. J Biomed Opt. 2009;14(2):24007. doi:10.1117/1.3086616.
21. Wang L V, Hu S. Photoacoustic Tomography : In Vivo Imaging from Organelles to Organs.
Science (80- ). 2012;335(March):1458-1462.
22. Dogra VS, Chinni BK, Valluru KS, Joseph J V. Multispectral Photoacoustic Imaging of Prostate
Cancer : Preliminary Ex ‑ vivo Results. J Clin Imaging Sci. 2015;3(3):1-7. doi:10.4103/2156-
7514.119139.
23. Kosik I, Carson JJL, Program I, Health L, Joseph S. Combined 3D photoacoustic and 2D
fluorescence imaging of indocyanine green contrast agent flow. Proc SPIE. 2013;8581:1-8.
doi:10.1117/12.2005269.
24. Xu M, Wang L V. Universal back-projection algorithm for photoacoustic computed tomography.
Phys Rev E. 2005;71(1):16706. doi:10.1103/PhysRevE.71.016706.25. Treeby B, Cox B.
Iterative Image Improvement Using Time Reversal. http://www.k-
wave.org/documentation/example_pr_2D_tr_iterative.php. Published 2016.
26. CJ D, EA S, EB M, EA M. ACR BI-RADS® Atlas, Breast Imaging Reporting and Data System.
Am Coll Radiol. 2013.
102
27. Lai H-W, Chen D-R, Wu Y-C, et al. Comparison of the Diagnostic Accuracy of Magnetic
Resonance Imaging with Sonography in the Prediction of Breast Cancer Tumor Size: A
Concordance Analysis with Histopathologically Determined Tumor Size. Ann Surg Oncol.
2015;(August 2014):3816-3823. doi:10.1245/s10434-015-4424-4.
28. El Khouli RH, Macura KJ, Kamel IR, Bluemke D a, Jacobs M a. The effects of applying breast
compression in dynamic contrast material-enhanced MR imaging. Radiology. 2014;272(1):79-90.
doi:10.1148/radiol.14131384.
29. Radiology AC of. Breast Density Breast cancer screening.
https://www.acr.org/~/media/ACR/Documents/PDF/QualitySafety/Resources/Breast-
Imaging/Breast-Density-bro_ACR_SBI_lores.pdf.
30. Yao L, Jiang H. Photoacoustic image reconstruction from few-detector and limited-angle data.
Biomed Opt Express. 2011;2(9):2649. doi:10.1364/BOE.2.002649.
31. Paltauf G, Nuster R, Burgholzer P. Weight factors for limited angle photoacoustic tomography.
2011;54(11):3303-3314. doi:10.1088/0031-9155/54/11/002.Weight.
32. Shibin Wu, Qingsong Zhu, Yaoqin Xie. Evaluation of various speckle reduction filters on medical
ultrasound images. 2013 35th Annu Int Conf IEEE Eng Med Biol Soc. 2013:1148-1151.
doi:10.1109/EMBC.2013.6609709.
33. Feldman MK, Katyal S, Blackwood MS. US artifacts. Radiographics. 2009;29(4):1179-1189.
doi:10.1148/rg.294085199.
34. Anderson PG, Kainerstorfer JM, Sassaroli A, et al. Broadband optical mammography:
Chromophore concentration and hemoglobin saturation contrast in breast cancer. PLoS One.
2015;10(3):1-23. doi:10.1371/journal.pone.0117322.
103
Chapter 4: Intraoperative photoacoustic imaging of breast cancer:
a new perspective on malignancy visualization and surgical
guidance
4.1 Introduction
This chapter presents results from a variety of diagnostic and intraoperative imaging modalities. A
detailed discussion on this subject can be found in section 1.2.1.
The discussion below also includes assumed knowledge relating to current histopathological tissue
examination standards as well as emerging intraoperative alternatives. Sections 1.2.4, 1.3.2, 1.3.3 and
1.4.4 provide a brief primer into these areas.
4.1.1 Overview
Breast cancer is a serious problem, especially for aging women and those with a family history of the
disease. It represents nearly one quarter of new cancer cases in women. Estimates indicate that one in
eight women will be affected by the disease during her lifetime and this is projected to be a major health
care challenge in the future1. Nearly everyone will be either directly impacted, or will have family
members who are. Incidence of breast cancer has been steadily rising over the past several decades, and
this trend is expected to continue. In spite of this trend, receiving a diagnosis of breast cancer today often
comes with a much better prognosis than in the past thanks to innovative treatment strategies and
advances in medical science, particularly imaging2.
Treating breast cancer is a complicated process, however almost all cases involve surgery3. A successful
surgery depends on many factors. Ideally, the surgical team is equipped with state-of-the-art tools,
allowing them to operate with precision and confidence. Amongst the most important of these are
medical imaging systems such as mammography, ultrasonography (US) and dynamic contrast enhanced
magnetic resonance imaging (DCE-MRI)2,4–6
. These modalities provide the radiologist and surgeon with
104
critical information about the location and extent of disease. Consequently, medical imaging is
instrumental in selecting the most appropriate therapy and surgical avenue, be it breast conserving surgery
(BCS) or mastectomy.
Precision breast cancer imaging is becoming even more important in recent years due to the increasing
popularity of BCS compared to more invasive procedures such as radical mastectomies. Large
multicenter trials have been completed, catalyzing confidence in BCS by demonstrating comparable long-
term disease recurrence rates to mastectomies, particularly in conjunction with advanced adjuvant and
neo-adjuvant therapies7,8
. However, BCS is fundamentally more challenging. The surgeon is charged
with minimizing the volume of excised tissue while ensuring complete tumor excision. Finding the right
balance is necessary to produce desirable cosmetic results in conjunction with minimal disease recurrence
rates.
Placing a premium on breast conservation has also increased the demands on imaging versatility. For
example, in cases of close areolar complex involvement, surgeons and radiologists are now more
encouraged to consider nipple sparing procedures. By facilitating oncoplastic surgery, these procedures
offer real benefits for the patient with the possibility of improving quality of life, particularly for younger
women9. Since the areolar and retro-areolar region accounts for about 8 percent of breast cancers, this
represents a considerable clinical problem10
. Furthermore, due to the typically increasing ductal density
near the nipple, this area of the breast challenges even the most advanced imaging methods. This is
particularly problematic for conventional imaging modalities, such as mammography and US, which rely
on density-based contrast. Often in these cases, DCE-MRI is used in the assessment; however, the areolar
complex may still be problematic due to benign ductal enhancement caused by increased vascularity in
this region. One DCE-MRI study of 427 lesions found that ductal enhancement was associated with
benign findings in 55 percent of cases, and resulted in a positive predictive value (PPV) of only 26
percent11
. Finally, the large prevalence of ductal carcinoma in-situ tumors (DCIS) mixed with invasive
105
ductal carcinoma (IDC) tumors means that imaging of ductal tissue represents a challenging clinical
problem.
In light of these technological shortcomings it is perhaps not surprising that a statistical examination of
success rates of BCS indicate that nearly one in four procedures fail to remove all malignant tissue12,13
.
Further complicating the situation is the fact that these failures are usually discovered post-operatively, at
the pathology level. Typically, pathologic examination of a formalin fixed lumpectomy specimen is
performed days after surgery. At that point in time, the discovery of tumor tissue at the edge of the
specimen, referred to as a positive margin, means that the surgery must be repeated in order to achieve
complete excision. Currently, repeat surgeries constitute a serious setback for patients due to extensive
leave from employment, as well as emotional and physical hardship. In terms of health care
administration, repeat surgeries negatively impact hospital resources, however, the associated delays in
therapies and increased surgical wait times also negatively impact treatment efficacy.
The high monetary and personal burden of repeat surgeries is perhaps best highlighted by the recent
increase in adoption of the more relaxed “no-ink-on-tumor” definition of a clear margin14
. The new
definition means that it is now considered sufficient for there to be a single layer of normal cells between
the tumor and margin. While this new standard has reduced re-excision rates due to close margins by
almost 14 percent, it throws into question whether there will be any associated effect on long term
recurrence rates14
. On the one hand, recent meta-analysis studies assessing the new guideline show
acceptable disease control as long as radiation therapy is administered15
. However, adopting such narrow
margins on the surgical side in conjunction with errors arising from under-sampling on the pathology side
may result in an increase in undetected disease remaining near the post-surgical cavity. This outcome
could prove problematic due to the theoretically increased radiation-therapy resistance of aggressive
tumour cells within the typically hypoxic environment of the lumpectomy scar bed16
. Finally, breast
radiation therapy is associated with negative side-effects, morbidity, and in cases of small low-grade
tumours as well as DCIS lesions, no significant improvement in survival compared to radiation-free
106
BCS17,18
. Alternatively, studies show that advanced oncoplastic techniques aided by pre-operative and
intra-operative imaging can produce similar ipsilateral recurrence rates without the use of radiation
therapy18,19
. Therefore, eliminating at least some post-operative radiation treatments via high-precision
malignancy visualization could translate to a better BCS experience for the patient without sacrificing
long term results.
The reasons outlined above indicate that technological improvement is needed on two fronts. First,
radiologists and surgeons are in need of better pre-operative malignancy visualization systems, allowing
them to quickly assess the position and extent of breast lesions with high sensitivity and specificity. A
strong contender would ideally offer visualization in 3-dimensions and be independent of tissue density as
well as lesion type and location. Its implementation in the pre-surgical work-up would likely
significantly reduce rates of positive margins. The second improvement can be thought of as a last line of
defense against failed surgeries. It would implement a lumpectomy margin assessment system within the
intra-operative setting. The actionable information, provided by the system in real-time, would allow the
surgeon to intervene prior to patient discharge, thereby sparing them a second procedure.
The needs of clinical pre-operative malignancy visualization are currently addressed in practice by the
medical imaging systems discussed above. However, some cases of advanced disease or ambiguous
findings indicate that unique information provided by other modalities may be useful. These include
Positron Emission Tomography (PET) and Computed Tomography (CT), as well as hybrid varieties such
as PET-CT and PET-MRI. The strengths and weaknesses of these systems have been extensively
discussed, but briefly put, sensitivity and specificity deficits remain, especially related to breast density
and small (< 2 cm) tumour size 5,20-22
. In terms of intra-operative margin assessment, there are numerous
possible approaches. Many of these are based on the same familiar imaging modalities, such as X-ray
(Faxitron), US and MRI, meaning that they suffer similar shortcomings23–26
. Others, such as frozen
sectioning, contact cytology and radiofrequency spectroscopy have been shown to be somewhat effective
but are considered too labour intensive and time consuming by most busy surgical centers27,28
.
107
However, because part of the goal of intraoperative lumpectomy assessment is to examine the surface of
the excised specimen, optical imaging systems offer unique opportunities. Optical imaging methods
include Raman spectroscopy, autofluorescence spectroscopy, optical coherence tomography (OCT) and
diffuse reflectance spectroscopy29–33
. Once again, these methods have been previously discussed, and it
was demonstrated that in differentiating normal tissue from malignancy, optical contrast produced
superior sensitivity and specificity values. In spite of these successes, limitations in either resolution or
imaging depth have prevented optical-based systems from enjoying wide-spread adoption.
A highly promising approach, called Photoacoustic Tomography (PAT), capable of overcoming these
limitations by ultrasonically encoding optical contrast from deep tissue, has been described in a number of
studies34–37,38–41
. PAT is a hybrid optical-acoustic imaging method used to interrogate soft tissues to a
depth of several centimeters. The imaging procedure typically begins with pulsed laser illumination of a
tissue sample, resulting in absorption of light within the tissue. The absorption leads to the emission of an
acoustic wave via the photoacoustic effect. Finally, the time-resolved intensity of the acoustic wave can
be detected by US transducers surrounding the sample. Such measurements can be used with a number of
image reconstruction methods to generate a 2D or 3D image. Of particular significance, PAT images
appear to be insensitive to breast tissue density42
. To our knowledge, one study of lumpectomy
assessment via PAT has been carried out to date43
. However, the study involved extensive sample
preparation, including formalin fixation, and therefore was not realistic with respect to real-time
intraoperative surgical guidance. Also, that investigation used a detection scheme permitting only a few
mm of imaging depth, and hence failed to visualize complete lesions. Here we show for the first time that
high contrast visualization of whole tumors within freshly excised specimens is feasible in a clinical
setting via PAT imaging. Studies showing low 10 year recurrence rates of 2.8 % when intraoperative
ultrasonography was combined with wide excision, motivated this investigation to be carried out in the
setting of intraoperative breast abnormality assessment and lumpectomy margin evaluation44
. We present
intraoperative PAT imaging from 100 patients who underwent BCS.
108
4.1.2 Objectives
This report summarizes results of a 100-patient pilot study aimed to investigate the capabilities of a PAT-
based imaging system, which we dubbed intraoperative Photoacoustic Tomography (iPAT). By
comparing iPAT derived results to pathology, this study aims to estimate the accuracy of iPAT with
respect to breast tumour sizing and localization within freshly excised specimens. Furthermore, we
present a case study example of areolar-complex invasion, and compare the performance of iPAT to
conventional US. Similarly, another case study is used to compare visualization of Ductal Carcinoma in
Situ (DCIS) using iPAT, US, DCE-MRI and X-ray imaging. A third study demonstrates the independence
of iPAT tumour contrast and breast density. Finally, we close with a case study of a failed lumpectomy
surgery, exemplifying the visualization of a positive margin on iPAT and US.
4.2 Materials and Methods
4.2.1 Imaging system, image reconstruction, and intraoperative protocol
A custom designed and built photoacoustic imaging system was deployed in an intra-operative setting of
a university-affiliated hospital breast surgical suite. Figure 4.1(a) shows the iPAT system within the
surgical suite and Figure 4.1(b) and (c) shows the system schematic diagram with major components
exposed for convenient viewing. The protocol for imaging a specimen was as follows: First, a surgeon
presented a freshly excised lumpectomy. The specimen was immediately immersed in a saline solution
contained within a specialized zipploc® bag. The bag was carefully sealed, making sure no air bubbles
were present. Next, the bag was mounted on a custom-designed iPAT compatible lumpectomy holder,
seen in Figure 4.1(d), and inserted inside the scanner water tank at the location marked by the red
ellipsoid in Figure 4.1(b). This location coincides with the active sensor area of the arc-shaped 24-
channel photoacoustic transducer array, seen inside the tank. The water in the tank provided acoustic
109
coupling between the array and the sample, enabling signal detection and playing a similar role to
conventional US gel.
Once the sample was secured in position, two iPAT scans were carried out at wavelengths of 930 nm and
690 nm. When intraoperative time constraints permitted, concerns about imaging depth penetration and
artefacts were addressed by implementing a “transmission-mode” imaging protocol. This protocol
consisted of scanning the two compressed sides of the specimen separately by inverting the sample and
scanning the other side. Otherwise, a “fast” protocol was implemented which consisted of scanning the
entire specimen in one pass. The trade-off of the “fast” protocol was the multimode nature of the
resulting image volume which was more difficult to interpret. The protocol concluded with a 6.6 MHz
ultrasound scan of the sample, performed using the conventional US system seen on the left in Figure
4.1(a), which examined the equivalent volume.
Each scan resulted in 24,000 acoustic time-of-flight measurements, or projections. These measurements
were used in conjunction with a filtered-back-projection (FBP) image reconstruction algorithm to
generate 3D images representing the relevant chromophore distribution within the sample. For the 930
nm wavelength, the targeted tissue was healthy breast parenchyma and fat, while the 690 nm scan
corresponded to hemoglobin distribution. After initial FBP reconstruction, image post-processing was
carried out to aide image interpretation. Post-processing consisted of K-Wave iterative image
improvement using time reversal, which was adapted for volumetric results. This procedure partially
corrected the amplitude of voxels by use of virtual photoacoustic signal detectors in locations where
detectors were absent in the original iPAT scan. Therefore, implementation of this procedure simulated
the coverage of fully enclosing signal-detection geometry45
. Image noise reduction was carried out by use
of a 2-voxel wide median filter which de-speckled the images while preserving sharp boundaries. In a
few cases of low SNR due to deep imaging demands or low laser output, contrast enhancement was done
by narrowing of the minimum (0) to maximum (255) window of the 8-bit RGB image volume. Image
reconstruction was carried out in Matlab (MATLAB and K-wave Toolbox Release 2013a, The
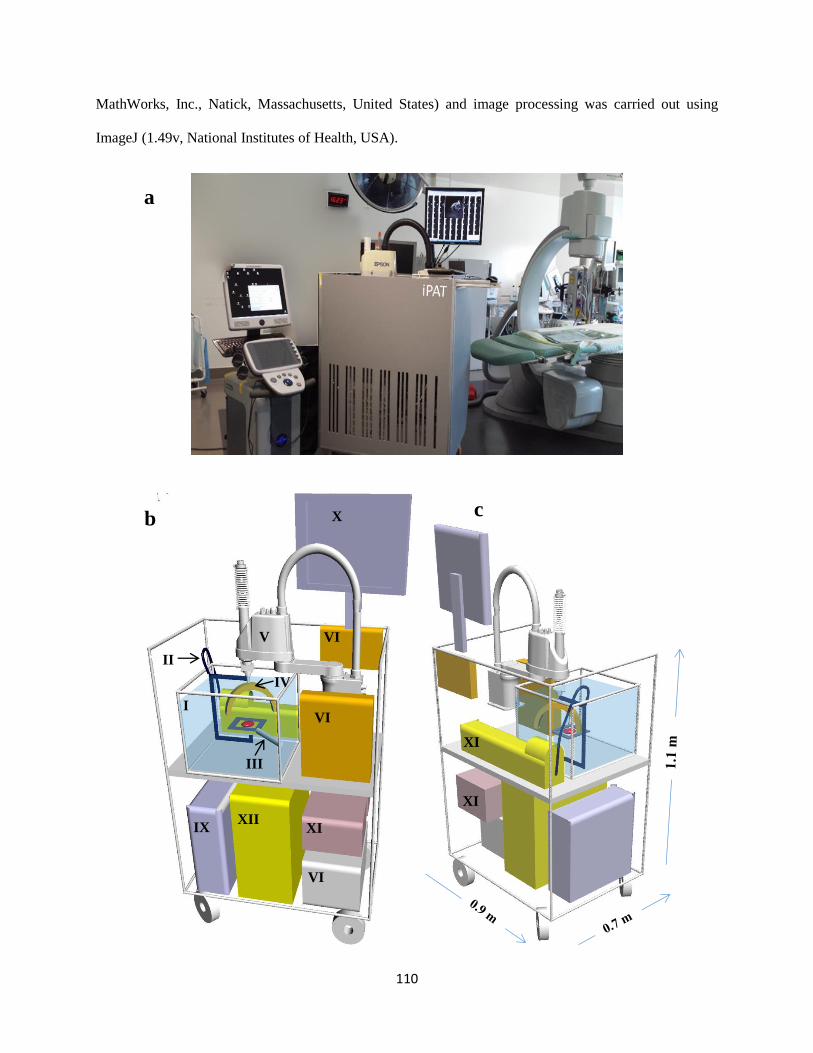
110
MathWorks, Inc., Natick, Massachusetts, United States) and image processing was carried out using
ImageJ (1.49v, National Institutes of Health, USA).
XII
b c
I
VI
I
III
IV
II
V
VI
IX
X
VI
II
XI
II
XI
V
XI
a
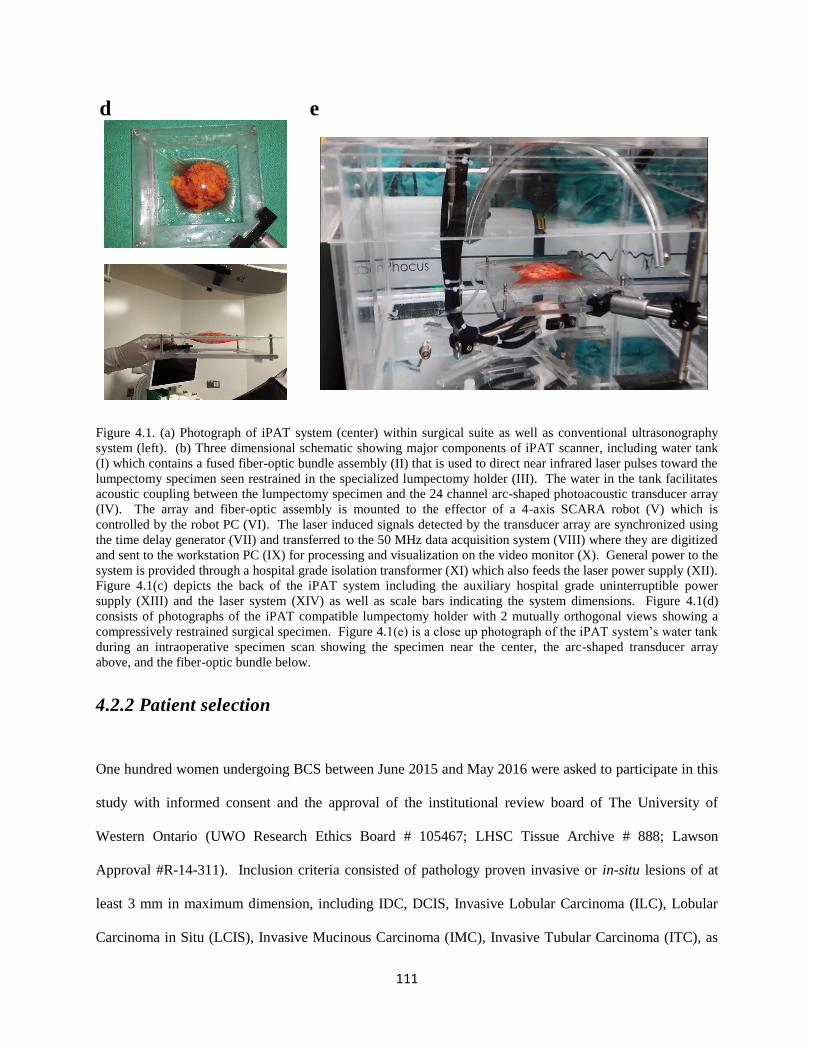
111
d
e
Figure 4.1. (a) Photograph of iPAT system (center) within surgical suite as well as conventional ultrasonography
system (left). (b) Three dimensional schematic showing major components of iPAT scanner, including water tank
(I) which contains a fused fiber-optic bundle assembly (II) that is used to direct near infrared laser pulses toward the
lumpectomy specimen seen restrained in the specialized lumpectomy holder (III). The water in the tank facilitates
acoustic coupling between the lumpectomy specimen and the 24 channel arc-shaped photoacoustic transducer array
(IV). The array and fiber-optic assembly is mounted to the effector of a 4-axis SCARA robot (V) which is
controlled by the robot PC (VI). The laser induced signals detected by the transducer array are synchronized using
the time delay generator (VII) and transferred to the 50 MHz data acquisition system (VIII) where they are digitized
and sent to the workstation PC (IX) for processing and visualization on the video monitor (X). General power to the
system is provided through a hospital grade isolation transformer (XI) which also feeds the laser power supply (XII).
Figure 4.1(c) depicts the back of the iPAT system including the auxiliary hospital grade uninterruptible power
supply (XIII) and the laser system (XIV) as well as scale bars indicating the system dimensions. Figure 4.1(d)
consists of photographs of the iPAT compatible lumpectomy holder with 2 mutually orthogonal views showing a
compressively restrained surgical specimen. Figure 4.1(e) is a close up photograph of the iPAT system’s water tank
during an intraoperative specimen scan showing the specimen near the center, the arc-shaped transducer array
above, and the fiber-optic bundle below.
4.2.2 Patient selection
One hundred women undergoing BCS between June 2015 and May 2016 were asked to participate in this
study with informed consent and the approval of the institutional review board of The University of
Western Ontario (UWO Research Ethics Board # 105467; LHSC Tissue Archive # 888; Lawson
Approval #R-14-311). Inclusion criteria consisted of pathology proven invasive or in-situ lesions of at
least 3 mm in maximum dimension, including IDC, DCIS, Invasive Lobular Carcinoma (ILC), Lobular
Carcinoma in Situ (LCIS), Invasive Mucinous Carcinoma (IMC), Invasive Tubular Carcinoma (ITC), as

112
well as lesions exhibiting extensive intra-ductal component (EIC). Finally, lesions consisting of
combinations of these were also included.
4.2.3 Lesion maximum diameters comparison to pathology and Statistical
Analysis
Tumour masses were identified on 930 nm iPAT scans as hypo-intense volumes. The maximum diameter
of the volumes was measured on a single imaging slice that presented the largest contiguous lesion
profile. Correspondingly, maximum diameters were pathologically measured within a single histology
slide presenting the largest profile. The relationship between diameters was then examined. Furthermore,
to establish the relationship between total amount of excised tissue and tumour size, maximum
pathologically measured tumour diameters were also compared to whole specimen diameters. Statistical
examination consisted of linear regression analysis and the non-parametric Wilcoxon signed-rank test.
These resulted in a Pearson’s correlation coefficient (R-value) and the Wilcoxon probability value (p-
value) for estimating equivalency of the two data sets. The analysis was carried out using the Statistics
Toolbox in Matlab (MATLAB and Statistics Toolbox Release 2013a, The MathWorks, Inc., Natick,
Massachusetts, United States). Tumour maximum diameter measurements were performed using ImageJ
(1.49v, National Institutes of Health, USA). A value of p=0.05 was considered statistically significant.
4.2.4 Lesion localization and iPAT predictive values
Pathological examination was carried out resulting in a breast invasive carcinoma synoptic report. This
was done according to AJCC/UICC TNM 7th edition, CAP Version 3.1.0.0 (June 2012). A pathologist
with extensive experience (>10 years) performed or supervised the examination. To estimate how tumour
localization of iPAT compared to pathology, image volumes resulting from 930 nm iPAT scans were first
oriented using intraoperative photographs in conjunction with surgical orientation sutures. The sutures
113
are placed by the surgeon to orient the specimen with respect to the surgical cavity. The sutures indicate
the superior aspect (short suture) and the lateral aspect (long suture), and are visualized on iPAT. The six
margins (superior, inferior, medial, lateral, anterior and posterior) of the specimen were identified through
interpretation of the sutures in the iPAT and US images. Hypo-intense regions within the iPAT image
volumes were considered representative of malignant lesions. The extent of the hypo-intense lesions in
the oriented images was used to find all iPAT-positive margins. If no margins appeared positive, the
closest uninvolved margin was measured. These findings were then compared to the positive or closest
uninvolved margins noted by the pathologist. As described in literature, gross pathologic measurements
were used unless microscopic measurements were available46
.
Positive Predictive Values (PPV) and Negative Predictive Values (NPV) were established for two
paradigms. First, given a particular lumpectomy specimen, we assessed the ability of iPAT to predict
which margins the pathologist would measure as closest, whether involved or not. And second, given an
iPAT-specific definition of a pathologically-measured positive margin, how accurately did the system
predict margin status. Finally, the potential effect of iPAT on preventing positive margins at pathology
was determined. The “no-ink-on-tumour” definition was adopted.
To achieve the first task, each of the six margins was placed into one of two categories. This was done
based on iPAT imaging results, and separately, based on pathology measurements. Specifically, if iPAT
indicated that a margin was positive or closest, it was placed into the close margin category (CMC). The
remaining margins of that lumpectomy specimen were then placed in the wide margin category (WMC).
Separation of the six margins into these binary categories established a proportion of close-to-wide
margins for each lumpectomy specimen, and this proportion was maintained during the pathologic
categorization. For example, if after assessing a particular lumpectomy specimen, iPAT placed x-number
of margins into the CMC, this would subsequently guide the pathologic examination to also place the
closest x-number of pathologically measured margins into the CMC. The remaining margins in both
assessments were placed into the WMC.
114
Following this categorization, PPV were calculated by defining true positives (TP) as cases where a
margin, placed in the CMC by iPAT, was also placed there by pathology. Correspondingly, false
positives (FP) were defined as cases where a margin, placed in the CMC by iPAT, was placed in the
WMC by pathology. Similarly, NPV were calculated by defining true negatives (TN) as cases where a
margin placed in the WMC by iPAT, was also placed in the WMC by pathology. Finally, false negatives
(FN) were cases where a margin was placed in the WMC by iPAT, but was placed into the CMC by
pathology or was the same pathologic size as the margin(s) in the CMC.
For margin status prediction, we emulated previous intraoperative US studies where PPV and NPV were
determined47
. These recognized frequent underestimation of lesion size, and hence overestimation of
margin size, and compensated for this by calibrating their US margin measurements (e.g. US = Path + 8
mm). Therefore, to achieve an expected 2 mm histologically-measured negative margin, they adopted a
minimum 10 mm US-measured negative margin. In contrast, results relating iPAT to pathologic tumour
sizes, as described in section 2.3 above, demonstrated a possible overestimation of lesion size, and
therefore underestimation of margin-width. This motivated defining positive iPAT-determined margins
as ones that are pathologically-measured to be 5 mm or less (e.g. iPAT = Path – 5 mm). PPV, NPV,
sensitivity and specificity for margin status were then calculated. This was done by defining TP as cases
where positive iPAT-determined margins were found to be 5 mm or less on pathology. FP were therefore
considered cases where iPAT-determined positive margins were found to be larger than 5 mm on
pathology. Similarly, TN were counted for cases where iPAT indicated a negative margin which was
found to be larger than 5 mm on pathology, and FN were cases where iPAT indicated a negative margin
which was found to be 5 mm or less on pathology.
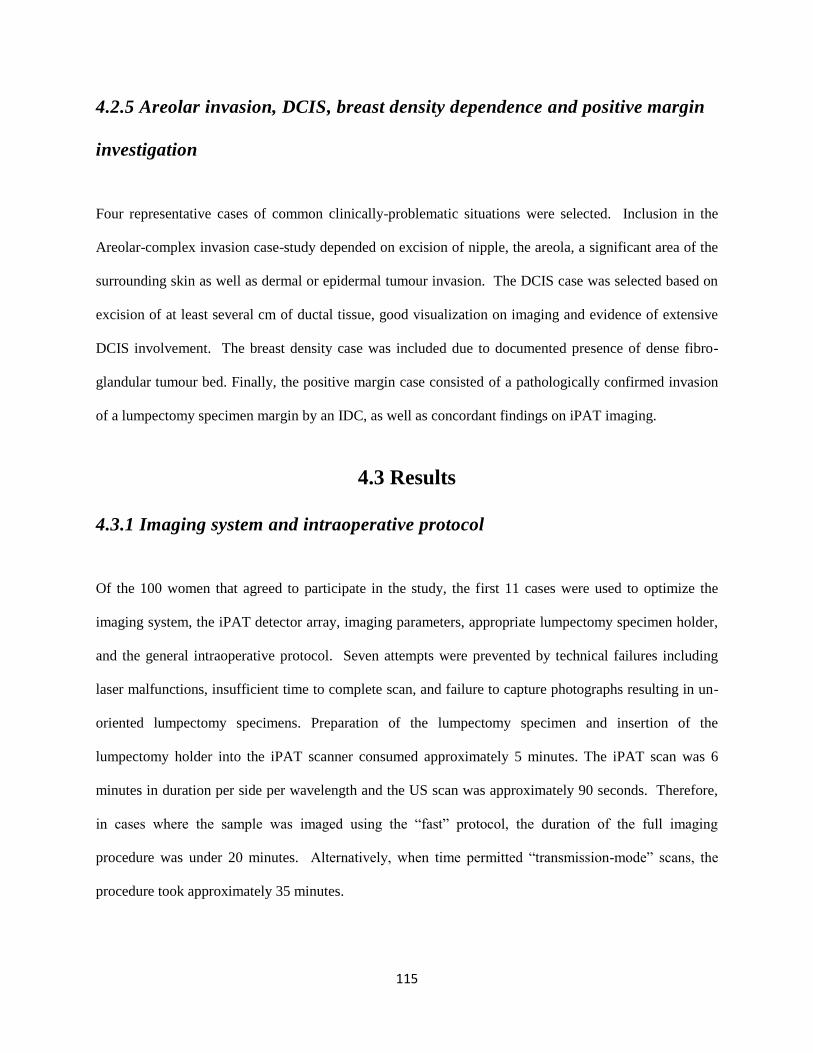
115
4.2.5 Areolar invasion, DCIS, breast density dependence and positive margin
investigation
Four representative cases of common clinically-problematic situations were selected. Inclusion in the
Areolar-complex invasion case-study depended on excision of nipple, the areola, a significant area of the
surrounding skin as well as dermal or epidermal tumour invasion. The DCIS case was selected based on
excision of at least several cm of ductal tissue, good visualization on imaging and evidence of extensive
DCIS involvement. The breast density case was included due to documented presence of dense fibro-
glandular tumour bed. Finally, the positive margin case consisted of a pathologically confirmed invasion
of a lumpectomy specimen margin by an IDC, as well as concordant findings on iPAT imaging.
4.3 Results
4.3.1 Imaging system and intraoperative protocol
Of the 100 women that agreed to participate in the study, the first 11 cases were used to optimize the
imaging system, the iPAT detector array, imaging parameters, appropriate lumpectomy specimen holder,
and the general intraoperative protocol. Seven attempts were prevented by technical failures including
laser malfunctions, insufficient time to complete scan, and failure to capture photographs resulting in un-
oriented lumpectomy specimens. Preparation of the lumpectomy specimen and insertion of the
lumpectomy holder into the iPAT scanner consumed approximately 5 minutes. The iPAT scan was 6
minutes in duration per side per wavelength and the US scan was approximately 90 seconds. Therefore,
in cases where the sample was imaged using the “fast” protocol, the duration of the full imaging
procedure was under 20 minutes. Alternatively, when time permitted “transmission-mode” scans, the
procedure took approximately 35 minutes.
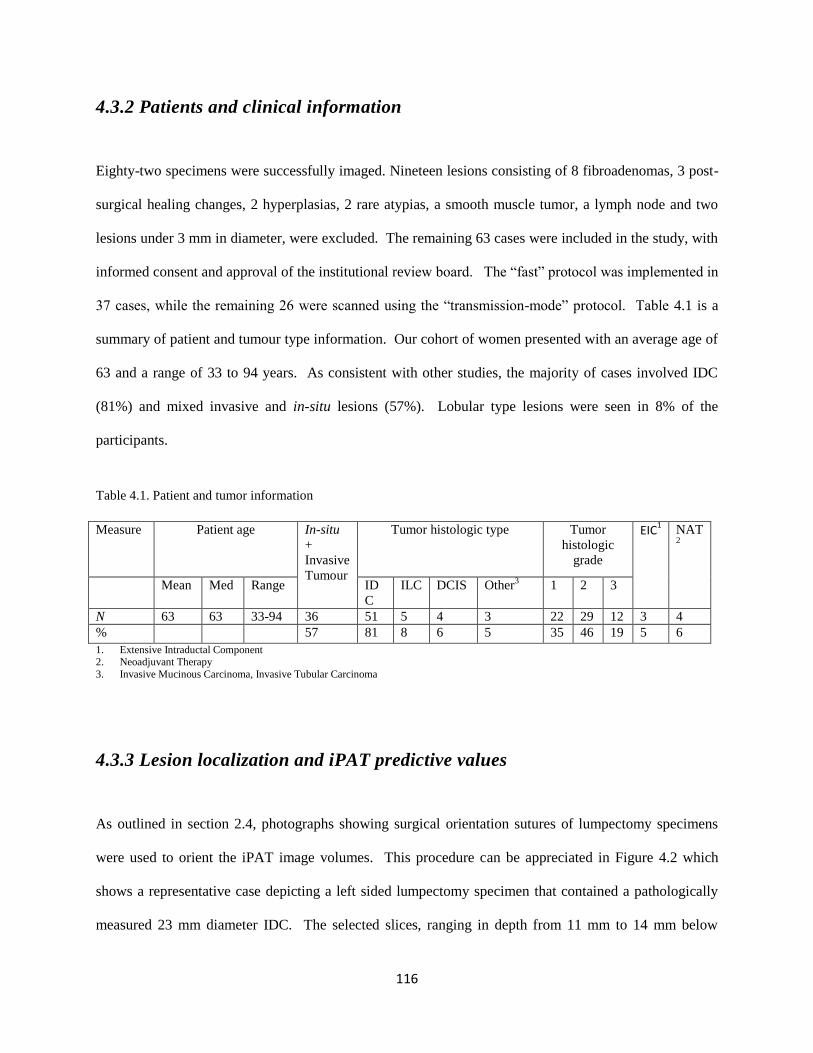
116
4.3.2 Patients and clinical information
Eighty-two specimens were successfully imaged. Nineteen lesions consisting of 8 fibroadenomas, 3 post-
surgical healing changes, 2 hyperplasias, 2 rare atypias, a smooth muscle tumor, a lymph node and two
lesions under 3 mm in diameter, were excluded. The remaining 63 cases were included in the study, with
informed consent and approval of the institutional review board. The “fast” protocol was implemented in
37 cases, while the remaining 26 were scanned using the “transmission-mode” protocol. Table 4.1 is a
summary of patient and tumour type information. Our cohort of women presented with an average age of
63 and a range of 33 to 94 years. As consistent with other studies, the majority of cases involved IDC
(81%) and mixed invasive and in-situ lesions (57%). Lobular type lesions were seen in 8% of the
participants.
Measure Patient age
In-situ
+
Invasive
Tumour
Tumor histologic type
Tumor
histologic
grade
EIC1 NAT
2
Mean Med Range ID
C
ILC DCIS Other3
1 2 3
N 63 63 33-94 36 51 5 4 3 22 29 12 3 4
% 57 81 8 6 5 35 46 19 5 6
1. Extensive Intraductal Component 2. Neoadjuvant Therapy
3. Invasive Mucinous Carcinoma, Invasive Tubular Carcinoma
4.3.3 Lesion localization and iPAT predictive values
As outlined in section 2.4, photographs showing surgical orientation sutures of lumpectomy specimens
were used to orient the iPAT image volumes. This procedure can be appreciated in Figure 4.2 which
shows a representative case depicting a left sided lumpectomy specimen that contained a pathologically
measured 23 mm diameter IDC. The selected slices, ranging in depth from 11 mm to 14 mm below
Table 4.1. Patient and tumor information
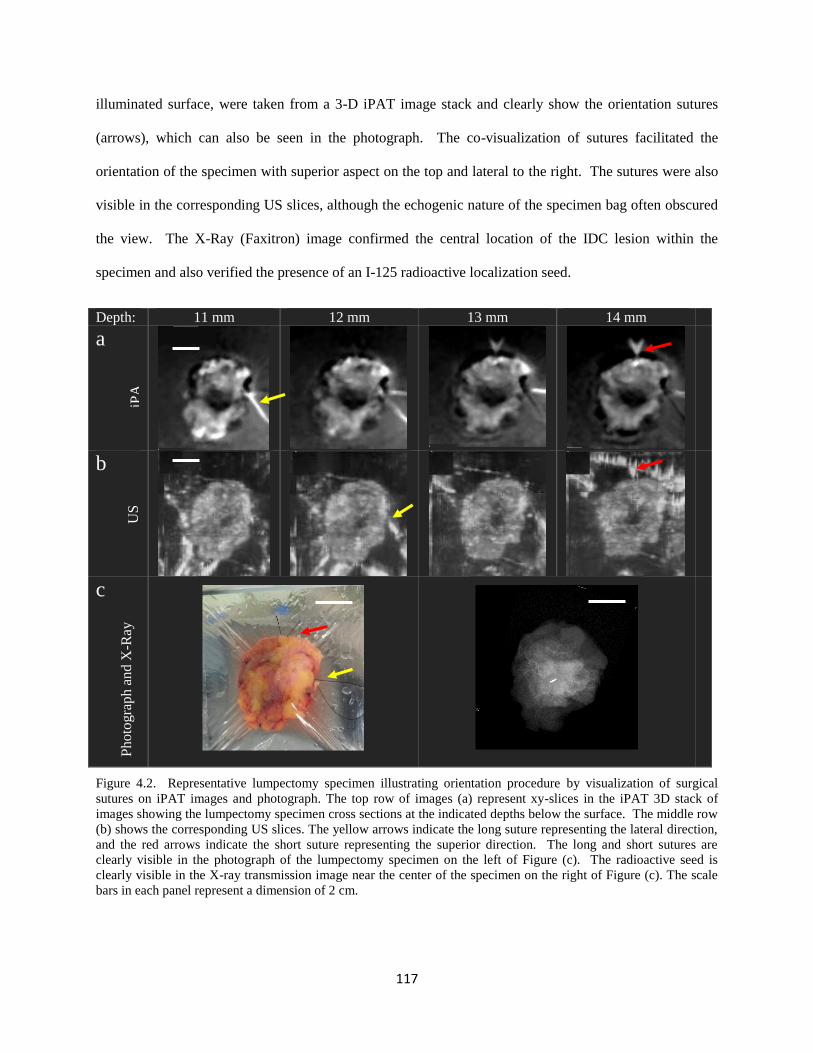
117
illuminated surface, were taken from a 3-D iPAT image stack and clearly show the orientation sutures
(arrows), which can also be seen in the photograph. The co-visualization of sutures facilitated the
orientation of the specimen with superior aspect on the top and lateral to the right. The sutures were also
visible in the corresponding US slices, although the echogenic nature of the specimen bag often obscured
the view. The X-Ray (Faxitron) image confirmed the central location of the IDC lesion within the
specimen and also verified the presence of an I-125 radioactive localization seed.
Depth: 11 mm 12 mm 13 mm 14 mm
a
b
c
Figure 4.2. Representative lumpectomy specimen illustrating orientation procedure by visualization of surgical
sutures on iPAT images and photograph. The top row of images (a) represent xy-slices in the iPAT 3D stack of
images showing the lumpectomy specimen cross sections at the indicated depths below the surface. The middle row
(b) shows the corresponding US slices. The yellow arrows indicate the long suture representing the lateral direction,
and the red arrows indicate the short suture representing the superior direction. The long and short sutures are
clearly visible in the photograph of the lumpectomy specimen on the left of Figure (c). The radioactive seed is
clearly visible in the X-ray transmission image near the center of the specimen on the right of Figure (c). The scale
bars in each panel represent a dimension of 2 cm.
iPA
US
P
hoto
gra
ph
an
d X
-Ray
118
Fifty-three of the 63 cases under investigation included pathology measurements for all six margins,
enabling the classification scheme outlined in section 2.4. Table 4.2 summarizes the predictive value
results for both scan modes combined, as well as for “fast”-mode and transmission-mode scans
independently. A total of 318 margins were investigated by both iPAT and pathology. Examining the
number of iPAT-determined positive or closest margins for the whole cohort resulted in 112 margins
being classified into the close margin category (CMC), with a mean pathology-measured margin size of
5.6 ± 6.1 mm (median 4 mm, range 0 mm – 44 mm) . On the other hand, the remaining 206 margins that
were iPAT-allocated to the wide margin category (WMC) presented with a mean pathology margin of
13.2 ± 8.4 mm (median 12 mm, range 0 mm – 40 mm). Comparing the classification results to pathology
yielded 79 true positives (TP), 33 false positives (FP), 170 true negatives (TN) and 36 false negatives
(FN). This indicates that for a positive or close margin prevalence of 35.2%, the PPV, NPV, sensitivity
and specificity for iPAT was 70.5%, 82.5%, 68.7%, and 83.7%, respectively.
Inclusion of only the transmission-mode scans revealed a total 114 margins on 19 specimens, with a
positive or close margin prevalence of 37.7%. The PPV, NPV, sensitivity and specificity for transmission
mode was 81.4%, 87.3%, 79.6%, and 88.6%, respectively. The “fast” scan alone produced data for 204
margins with a positive or close margin prevalence of 33.8%. The PPV, NPV, sensitivity and specificity
for “fast” mode scan was 63.8%, 80.0%, 62.0%, and 81.2%, respectively.
As outlined above, for margin-status prediction we adopted a 5 mm threshold for positive margin
definition. Therefore, margins measured to be 5 mm or less on pathology were considered positive, while
margins measured to be 0 mm on iPAT were considered to be positive. The comparison between iPAT
and pathology resulted in 75 true positives, 38 false positives, 170 true negatives and 36 false negatives.
This paradigm established a positive margin prevalence of 34.8%, with PPV, NPV, sensitivity, and
specificity of 66.4%, 82.5%, 67.6% and 81.7%, respectively. Considering only transmission-mode scans
produced positive margin prevalence of 34.2%, with PPV, NPV, sensitivity, and specificity of 68.2%,
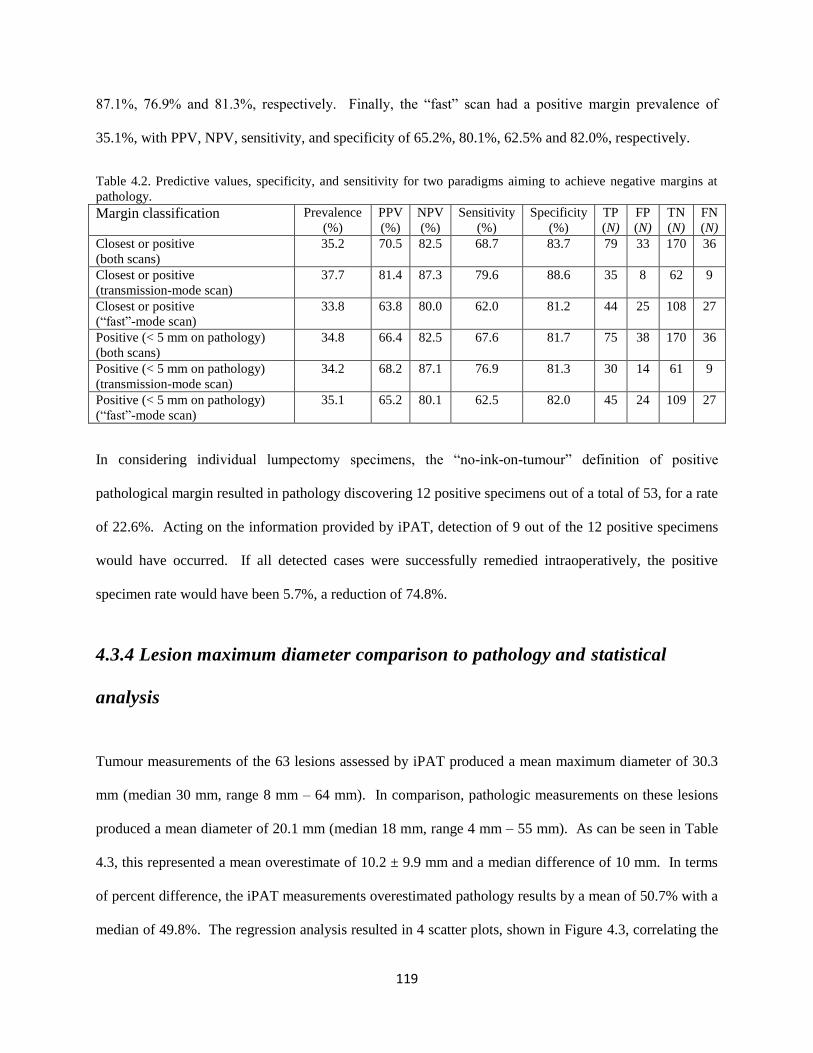
119
87.1%, 76.9% and 81.3%, respectively. Finally, the “fast” scan had a positive margin prevalence of
35.1%, with PPV, NPV, sensitivity, and specificity of 65.2%, 80.1%, 62.5% and 82.0%, respectively.
Table 4.2. Predictive values, specificity, and sensitivity for two paradigms aiming to achieve negative margins at
pathology.
Margin classification Prevalence
(%)
PPV
(%)
NPV
(%)
Sensitivity
(%)
Specificity
(%)
TP
(N)
FP
(N)
TN
(N)
FN
(N)
Closest or positive
(both scans)
35.2 70.5 82.5 68.7 83.7 79 33 170 36
Closest or positive
(transmission-mode scan)
37.7 81.4 87.3 79.6 88.6 35 8 62 9
Closest or positive
(“fast”-mode scan)
33.8 63.8 80.0 62.0 81.2 44 25 108 27
Positive (< 5 mm on pathology)
(both scans)
34.8 66.4 82.5 67.6 81.7 75 38 170 36
Positive (< 5 mm on pathology)
(transmission-mode scan)
34.2 68.2 87.1 76.9 81.3 30 14 61 9
Positive (< 5 mm on pathology)
(“fast”-mode scan)
35.1 65.2 80.1 62.5 82.0 45 24 109 27
In considering individual lumpectomy specimens, the “no-ink-on-tumour” definition of positive
pathological margin resulted in pathology discovering 12 positive specimens out of a total of 53, for a rate
of 22.6%. Acting on the information provided by iPAT, detection of 9 out of the 12 positive specimens
would have occurred. If all detected cases were successfully remedied intraoperatively, the positive
specimen rate would have been 5.7%, a reduction of 74.8%.
4.3.4 Lesion maximum diameter comparison to pathology and statistical
analysis
Tumour measurements of the 63 lesions assessed by iPAT produced a mean maximum diameter of 30.3
mm (median 30 mm, range 8 mm – 64 mm). In comparison, pathologic measurements on these lesions
produced a mean diameter of 20.1 mm (median 18 mm, range 4 mm – 55 mm). As can be seen in Table
4.3, this represented a mean overestimate of 10.2 ± 9.9 mm and a median difference of 10 mm. In terms
of percent difference, the iPAT measurements overestimated pathology results by a mean of 50.7% with a
median of 49.8%. The regression analysis resulted in 4 scatter plots, shown in Figure 4.3, correlating the
120
maximum diameters measured by iPAT and pathology, as well as between specimen size and pathologic
tumour size.
For “fast”-mode and transmission-mode iPAT scans combined, as well as separately, the non-parametric
Wilcoxon signed-rank-test indicated a significant difference in measured diameters compared to
pathology (p<0.0001). However, the Pearson correlation coefficient for the whole cohort showed a fairly
strong positive correlation (r = 0.61, p<0.0001). Furthermore, the transmission-mode scan alone
produced a significant and strong positive correlation (r = 0.77, p<0.0001) and the “fast”-mode scan alone
resulted in a moderate positive correlation (r = 0.52, p<0.001). Compared to pathology, the transmission-
mode scan delivered the smallest mean and median tumour diameter difference of 6.7 ± 6.9 mm and 4.5
mm, respectively. Finally, comparing pathologically measured specimen size and tumour size resulted in
a somewhat weak positive correlation (r = 0.43, p=0.0004).
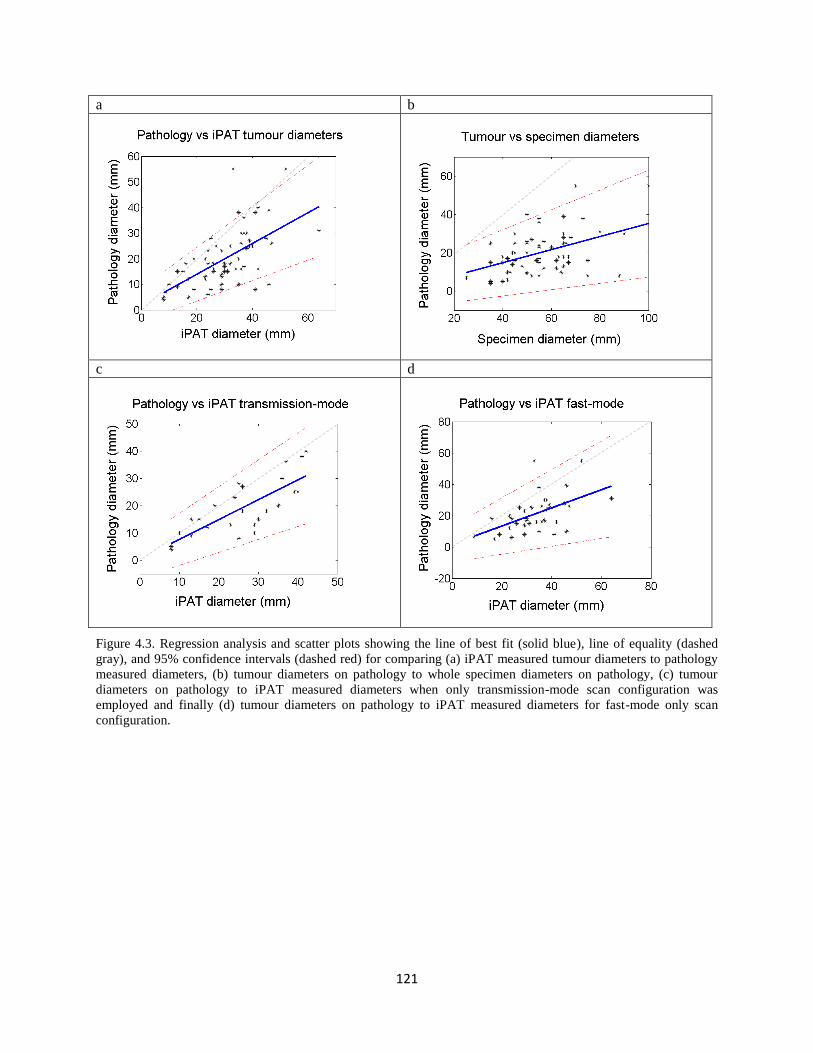
121
a b
c d
Figure 4.3. Regression analysis and scatter plots showing the line of best fit (solid blue), line of equality (dashed
gray), and 95% confidence intervals (dashed red) for comparing (a) iPAT measured tumour diameters to pathology
measured diameters, (b) tumour diameters on pathology to whole specimen diameters on pathology, (c) tumour
diameters on pathology to iPAT measured diameters when only transmission-mode scan configuration was
employed and finally (d) tumour diameters on pathology to iPAT measured diameters for fast-mode only scan
configuration.
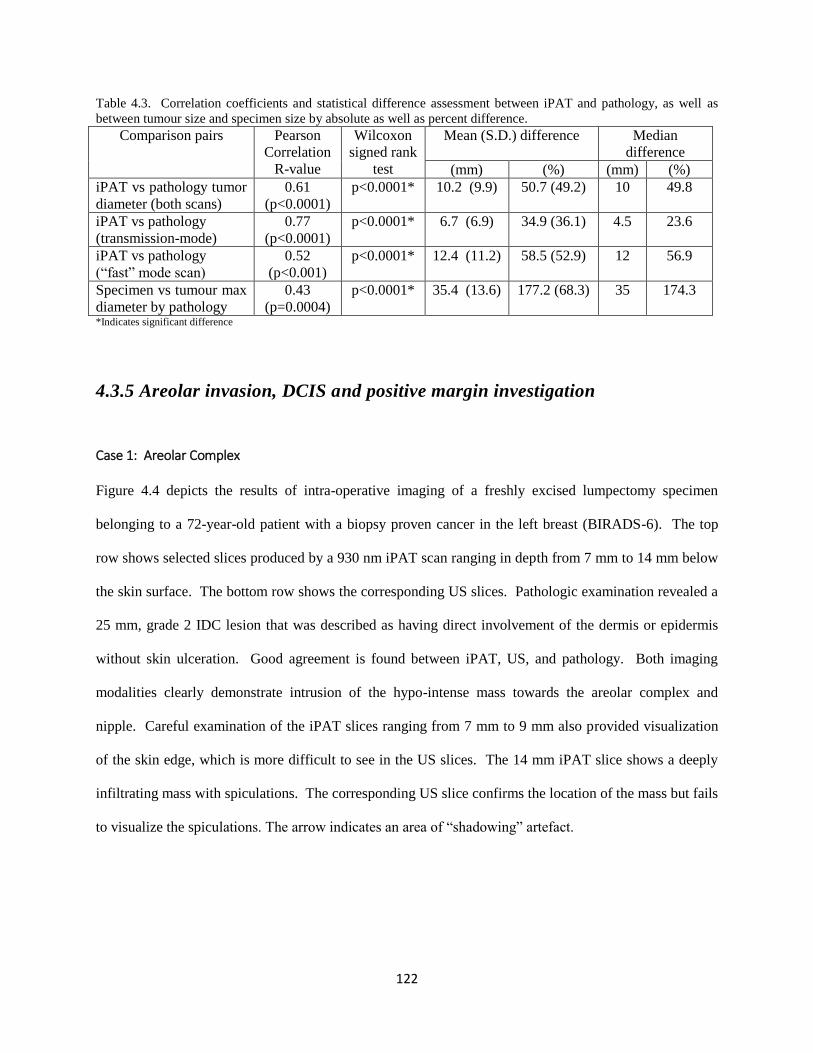
122
Table 4.3. Correlation coefficients and statistical difference assessment between iPAT and pathology, as well as
between tumour size and specimen size by absolute as well as percent difference.
Comparison pairs Pearson
Correlation
R-value
Wilcoxon
signed rank
test
Mean (S.D.) difference Median
difference
(mm) (%) (mm) (%)
iPAT vs pathology tumor
diameter (both scans)
0.61
(p<0.0001)
p<0.0001* 10.2 (9.9)
50.7 (49.2) 10 49.8
iPAT vs pathology
(transmission-mode)
0.77
(p<0.0001)
p<0.0001* 6.7 (6.9)
34.9 (36.1) 4.5 23.6
iPAT vs pathology
(“fast” mode scan)
0.52
(p<0.001)
p<0.0001* 12.4 (11.2)
58.5 (52.9) 12 56.9
Specimen vs tumour max
diameter by pathology
0.43
(p=0.0004)
p<0.0001* 35.4 (13.6) 177.2 (68.3) 35 174.3
*Indicates significant difference
4.3.5 Areolar invasion, DCIS and positive margin investigation
Case 1: Areolar Complex
Figure 4.4 depicts the results of intra-operative imaging of a freshly excised lumpectomy specimen
belonging to a 72-year-old patient with a biopsy proven cancer in the left breast (BIRADS-6). The top
row shows selected slices produced by a 930 nm iPAT scan ranging in depth from 7 mm to 14 mm below
the skin surface. The bottom row shows the corresponding US slices. Pathologic examination revealed a
25 mm, grade 2 IDC lesion that was described as having direct involvement of the dermis or epidermis
without skin ulceration. Good agreement is found between iPAT, US, and pathology. Both imaging
modalities clearly demonstrate intrusion of the hypo-intense mass towards the areolar complex and
nipple. Careful examination of the iPAT slices ranging from 7 mm to 9 mm also provided visualization
of the skin edge, which is more difficult to see in the US slices. The 14 mm iPAT slice shows a deeply
infiltrating mass with spiculations. The corresponding US slice confirms the location of the mass but fails
to visualize the spiculations. The arrow indicates an area of “shadowing” artefact.
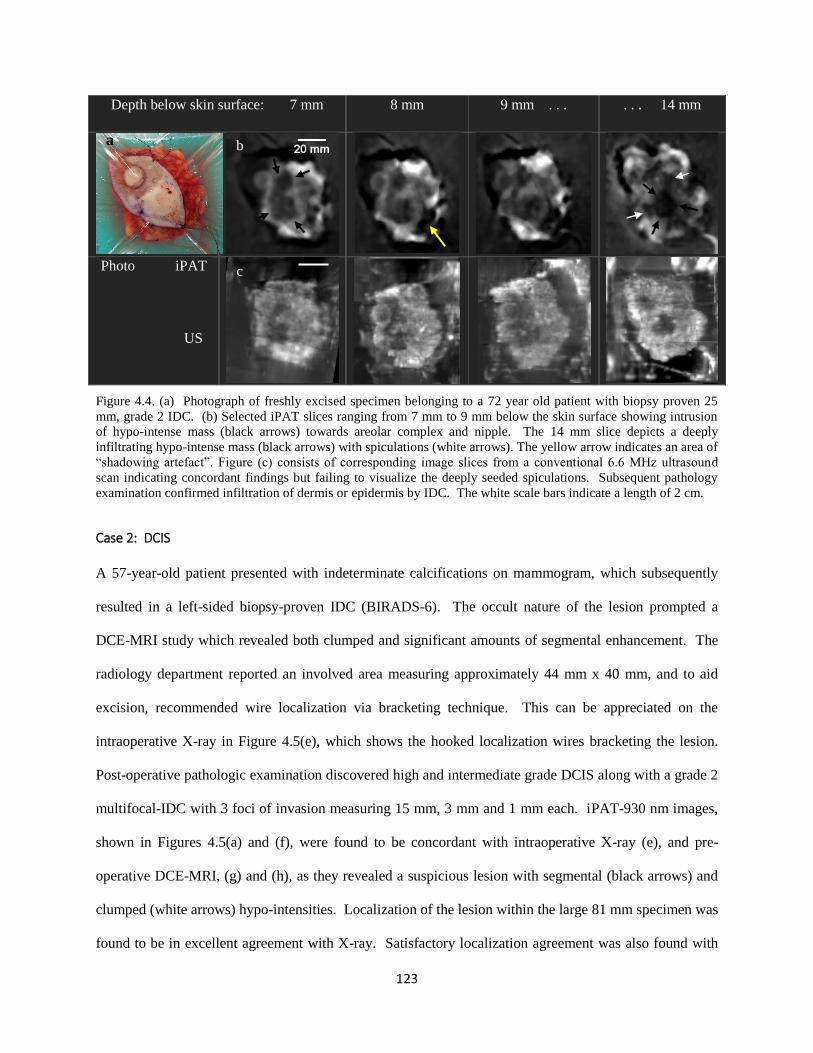
123
Depth below skin surface: 7 mm
8 mm 9 mm . . . . . . 14 mm
Photo iPAT
Figure 4.4. (a) Photograph of freshly excised specimen belonging to a 72 year old patient with biopsy proven 25
mm, grade 2 IDC. (b) Selected iPAT slices ranging from 7 mm to 9 mm below the skin surface showing intrusion
of hypo-intense mass (black arrows) towards areolar complex and nipple. The 14 mm slice depicts a deeply
infiltrating hypo-intense mass (black arrows) with spiculations (white arrows). The yellow arrow indicates an area of
“shadowing artefact”. Figure (c) consists of corresponding image slices from a conventional 6.6 MHz ultrasound
scan indicating concordant findings but failing to visualize the deeply seeded spiculations. Subsequent pathology
examination confirmed infiltration of dermis or epidermis by IDC. The white scale bars indicate a length of 2 cm.
Case 2: DCIS
A 57-year-old patient presented with indeterminate calcifications on mammogram, which subsequently
resulted in a left-sided biopsy-proven IDC (BIRADS-6). The occult nature of the lesion prompted a
DCE-MRI study which revealed both clumped and significant amounts of segmental enhancement. The
radiology department reported an involved area measuring approximately 44 mm x 40 mm, and to aid
excision, recommended wire localization via bracketing technique. This can be appreciated on the
intraoperative X-ray in Figure 4.5(e), which shows the hooked localization wires bracketing the lesion.
Post-operative pathologic examination discovered high and intermediate grade DCIS along with a grade 2
multifocal-IDC with 3 foci of invasion measuring 15 mm, 3 mm and 1 mm each. iPAT-930 nm images,
shown in Figures 4.5(a) and (f), were found to be concordant with intraoperative X-ray (e), and pre-
operative DCE-MRI, (g) and (h), as they revealed a suspicious lesion with segmental (black arrows) and
clumped (white arrows) hypo-intensities. Localization of the lesion within the large 81 mm specimen was
found to be in excellent agreement with X-ray. Satisfactory localization agreement was also found with
US
a
c
b
124
US; however, the appearance of the lesion was limited in extent compared to iPAT. Furthermore,
compared to US the image quality of iPAT appeared superior, permitting the visualization of what
appeared to be individual ductal structures. These can be appreciated in the selected iPAT slices at depths
of 12 mm – 14 mm, which show segmental and branching hypo-intensities near the top of the image. At
a depth of 14 mm, US also shows some concordant segmental structure (dashed box), but again, low
image quality makes evaluation more difficult. Interestingly, the specimen under consideration also
exhibited areas with elevated hemoglobin concentrations, which were also well co-located with the
malignant lesion. These are visualized as hyper-intensities (yellow arrows and dashed box) on the 690
nm iPAT scan results, shown in Figure 4.5(c).
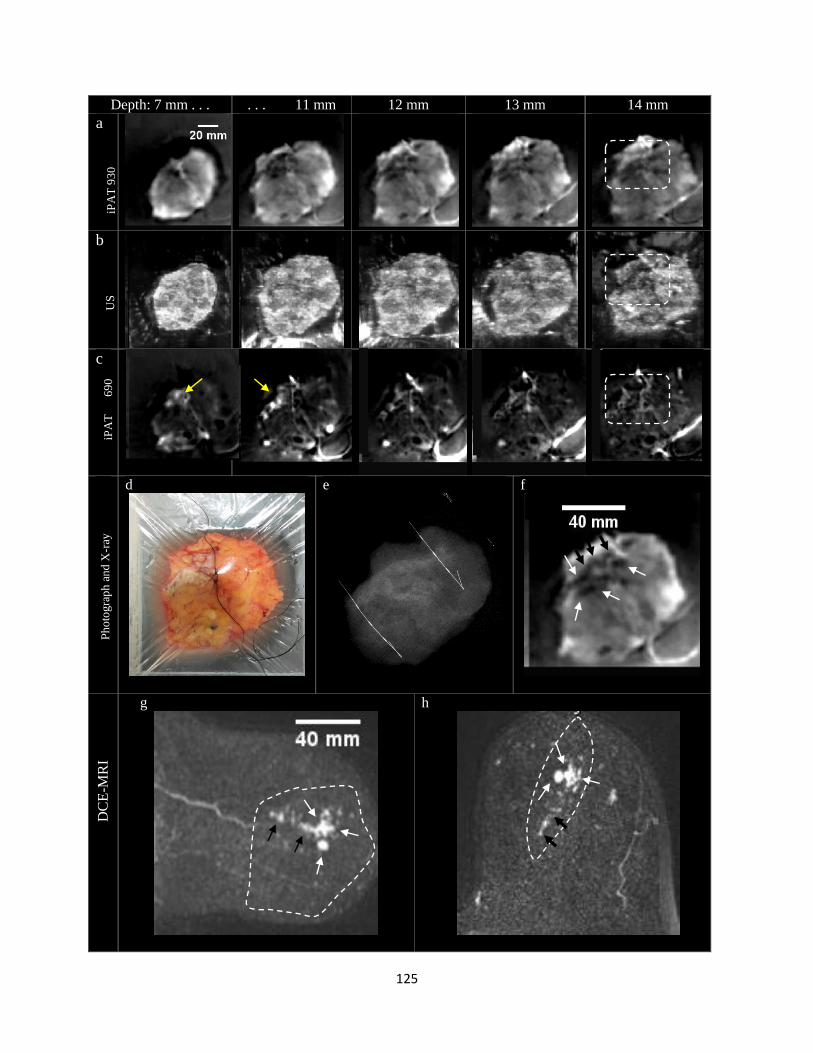
125
Depth: 7 mm . . . . . . 11 mm 12 mm 13 mm 14 mm
a
b
c
d
e
f
g
h
iPA
T 9
30
nm
iPA
T
69
0
nm
Ph
oto
gra
ph
an
d X
-ray
D
CE
-MR
I U
S

126
Figure 4.5. (a) Representative iPAT imaging slices of a lumpectomy specimen belonging to a 57 year old patient
with pathology proven high and intermediate grade DCIS combined with multi-focal IDC, showing segmental and
clumped hypo-intensities at radiographically confirmed location of lesion. (b) Corresponding US slices showing
ambiguous results for depths 7 mm to 12 mm and some concordant hypo-intensities in the 13 mm and 14 mm slices
(dashed box). (c) 690 nm iPAT scan representing hemoglobin distribution within specimen and exhibiting hyper-
intensities at location of suspicious lesion (yellow arrows). (d) Photograph of the specimen showing black
orientation sutures. (e) Co-oriented intraoperative digital X-ray radiograph indicating the two dimensional extent of
the lesion along with hooked localization wires seen bracketing the lesion. The wires were inserted preoperatively
for surgical guidance. Figure (f) is a zoomed in view of the 12 mm deep iPAT slice taken from stack above offering
better visualization of the segmental (black arrows) and clumped (white arrows) hypo-intensities. Figure (g) shows a
pre-operative DCE-MRI medio-lateral maximum intensity projection through the affected volume of the breast
showing concordant clumped (white arrows) and segmental (black arrows) enhancement as well as an
approximation of the excised area (dashed white line). Finally, Figure (h) shows the same features from a cranial-
caudal perspective demonstrating the pancake shape of the large excised volume.
Case 3: Breast density dependence
Figure 4.6 is a representative case of invasive tumor visualization when tumor bed consisted of dense
fibro-glandular tissue. A 46-year old patient was admitted due to a palpable mass in the upper outer right
breast. A biopsy of the site indicated an IDC diagnosis (BIRADS-6). The patient underwent BCS with
preoperative bilateral DCE-MRI and mammogram scans. Post-operative pathology found a 13 mm
diameter IDC as well as low and intermediate grade DCIS. The tumour presented as an 18 mm diameter
lesion on pre-operative DCE-MRI and as a 23 mm lesion on intra-operative 930 nm iPAT. Figures 4.6(a)
and (b) clearly show that the tumor’s inferior and posterior aspect is contiguous with dense fibro-
glandular tissue, which makes delineation of those tumor margins difficult to evaluate without contrast
dynamics (right). This is confirmed to be the case through all of the coronal slices shown in (c) and (d).
On the other hand, the co-oriented slices in Figure (e) clearly show the same tumor on iPAT imaging
without loss of contrast at the dense fibro-glandular margins (dashed box). The co-registered US slices in
Figure (f) confirm the central location of the tumor. Figure (g) shows the results of intraoperative X-ray,
further demonstrating the central location of the lesion, but also confirming the presence of the
localization seed within the lesion as well as the spiculated nature of the tumour. For easier visualization,
Figure (g) also includes selected zoomed in slices, taken from the iPAT and US stacks, indicating the
extent of disease detected by those modalities.
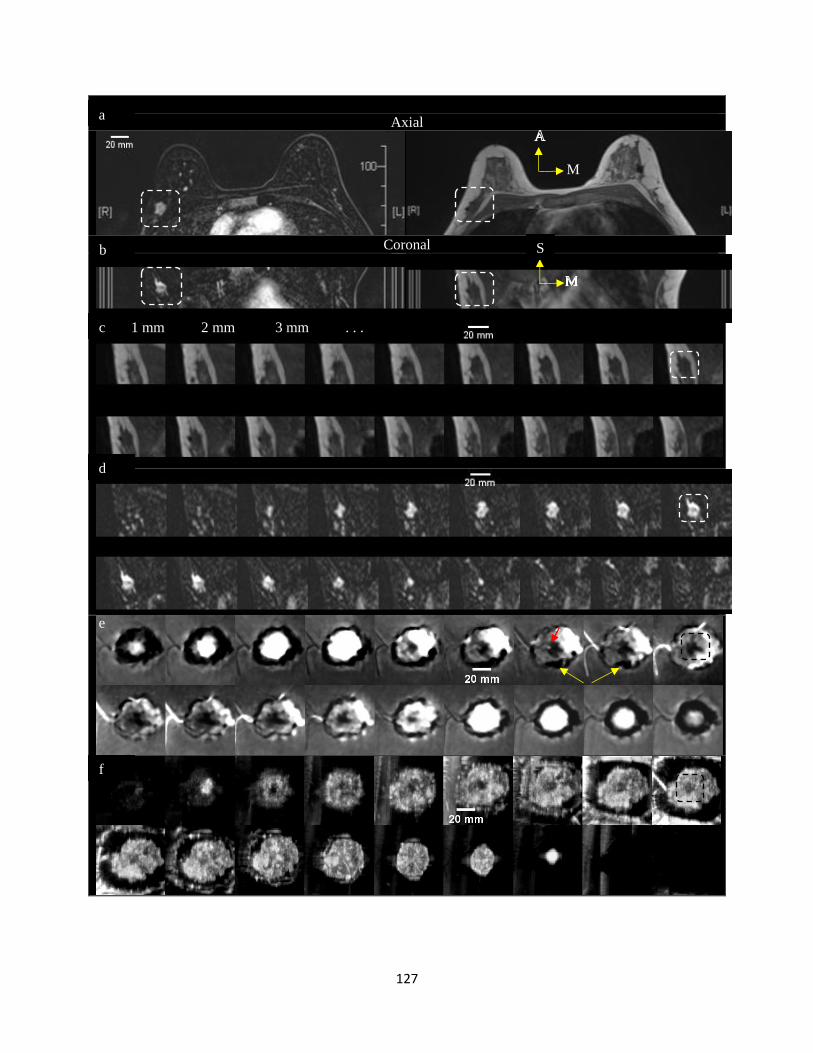
127
Axial
Coronal
M
b
a
f
c 1 mm 2 mm 3 mm . . .
e
d
S
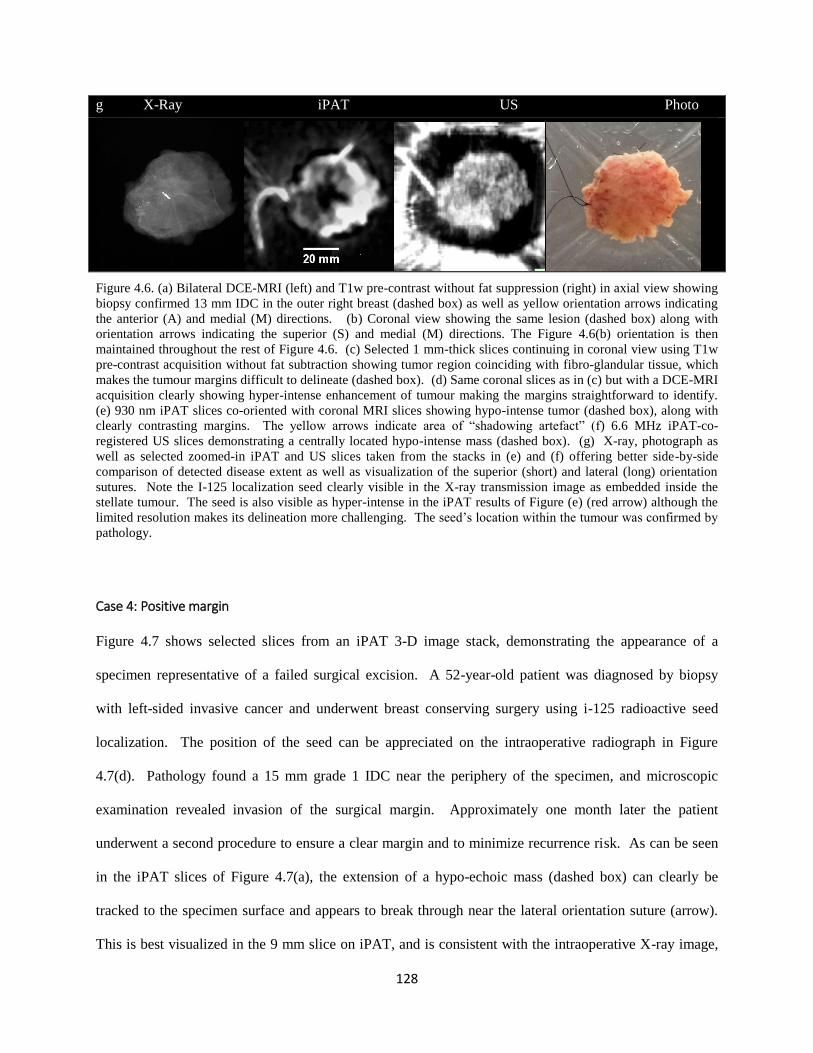
128
g X-Ray iPAT US Photo
Figure 4.6. (a) Bilateral DCE-MRI (left) and T1w pre-contrast without fat suppression (right) in axial view showing
biopsy confirmed 13 mm IDC in the outer right breast (dashed box) as well as yellow orientation arrows indicating
the anterior (A) and medial (M) directions. (b) Coronal view showing the same lesion (dashed box) along with
orientation arrows indicating the superior (S) and medial (M) directions. The Figure 4.6(b) orientation is then
maintained throughout the rest of Figure 4.6. (c) Selected 1 mm-thick slices continuing in coronal view using T1w
pre-contrast acquisition without fat subtraction showing tumor region coinciding with fibro-glandular tissue, which
makes the tumour margins difficult to delineate (dashed box). (d) Same coronal slices as in (c) but with a DCE-MRI
acquisition clearly showing hyper-intense enhancement of tumour making the margins straightforward to identify.
(e) 930 nm iPAT slices co-oriented with coronal MRI slices showing hypo-intense tumor (dashed box), along with
clearly contrasting margins. The yellow arrows indicate area of “shadowing artefact” (f) 6.6 MHz iPAT-co-
registered US slices demonstrating a centrally located hypo-intense mass (dashed box). (g) X-ray, photograph as
well as selected zoomed-in iPAT and US slices taken from the stacks in (e) and (f) offering better side-by-side
comparison of detected disease extent as well as visualization of the superior (short) and lateral (long) orientation
sutures. Note the I-125 localization seed clearly visible in the X-ray transmission image as embedded inside the
stellate tumour. The seed is also visible as hyper-intense in the iPAT results of Figure (e) (red arrow) although the
limited resolution makes its delineation more challenging. The seed’s location within the tumour was confirmed by
pathology.
Case 4: Positive margin
Figure 4.7 shows selected slices from an iPAT 3-D image stack, demonstrating the appearance of a
specimen representative of a failed surgical excision. A 52-year-old patient was diagnosed by biopsy
with left-sided invasive cancer and underwent breast conserving surgery using i-125 radioactive seed
localization. The position of the seed can be appreciated on the intraoperative radiograph in Figure
4.7(d). Pathology found a 15 mm grade 1 IDC near the periphery of the specimen, and microscopic
examination revealed invasion of the surgical margin. Approximately one month later the patient
underwent a second procedure to ensure a clear margin and to minimize recurrence risk. As can be seen
in the iPAT slices of Figure 4.7(a), the extension of a hypo-echoic mass (dashed box) can clearly be
tracked to the specimen surface and appears to break through near the lateral orientation suture (arrow).
This is best visualized in the 9 mm slice on iPAT, and is consistent with the intraoperative X-ray image,
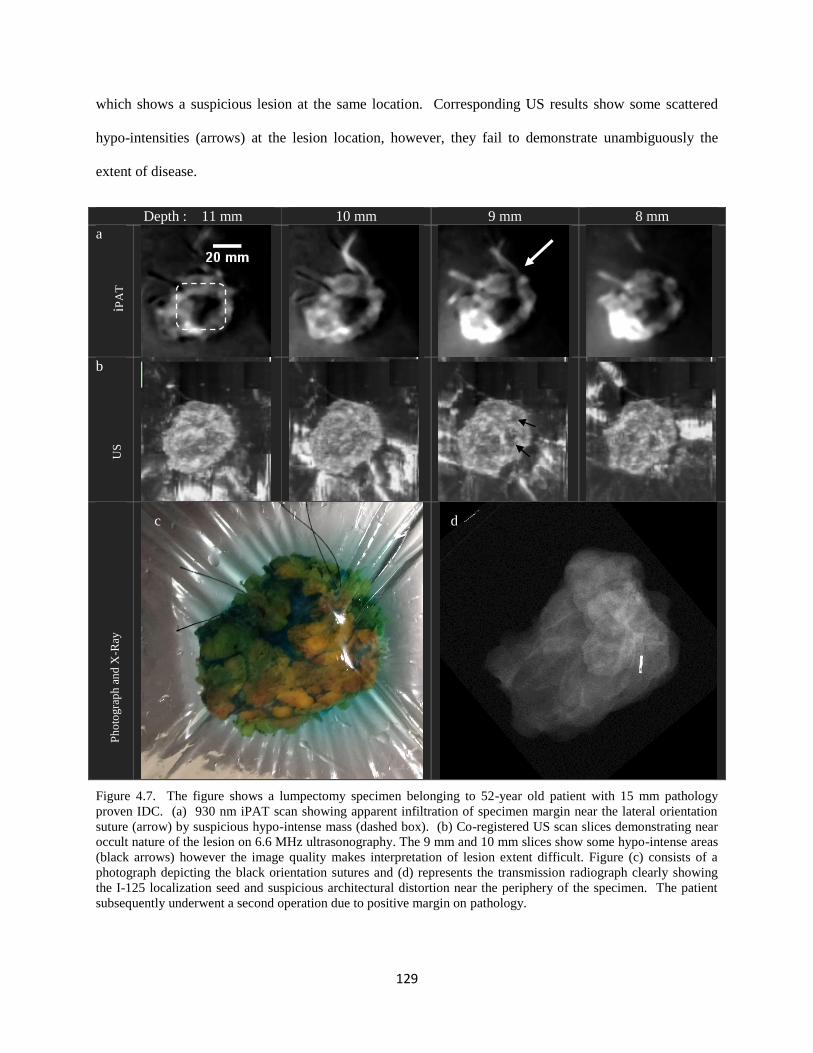
129
which shows a suspicious lesion at the same location. Corresponding US results show some scattered
hypo-intensities (arrows) at the lesion location, however, they fail to demonstrate unambiguously the
extent of disease.
Depth : 11 mm 10 mm 9 mm 8 mm
a
b
Figure 4.7. The figure shows a lumpectomy specimen belonging to 52-year old patient with 15 mm pathology
proven IDC. (a) 930 nm iPAT scan showing apparent infiltration of specimen margin near the lateral orientation
suture (arrow) by suspicious hypo-intense mass (dashed box). (b) Co-registered US scan slices demonstrating near
occult nature of the lesion on 6.6 MHz ultrasonography. The 9 mm and 10 mm slices show some hypo-intense areas
(black arrows) however the image quality makes interpretation of lesion extent difficult. Figure (c) consists of a
photograph depicting the black orientation sutures and (d) represents the transmission radiograph clearly showing
the I-125 localization seed and suspicious architectural distortion near the periphery of the specimen. The patient
subsequently underwent a second operation due to positive margin on pathology.
iPA
T
US
P
ho
togra
ph
an
d X
-Ray
c d
130
4.4 Discussion and future directions
4.4.1 Predictive values and potential clinical impact of iPAT
An effective breast conserving therapy will ideally achieve low long-term recurrence rates as well as high
patient satisfaction. Therefore the problem is an optimization one. For the patient, this means good
cosmetic outcomes combined with minimal repeat surgeries. For the surgeon, this means high quality
actionable information at the time of initial excision.
From a practical perspective, having precise pathological information about the width of a specimen
margin is less important than the ability to locate malignant tissue left behind in the surgical cavity.
Indeed, extra cavity wall shavings are readily undertaken during surgery since the monetary and personal
cost is low while the patient is still on the operating table. In contrast, the costs of finding a positive
margin on post-operative pathology are higher, since a repeat surgery is indicated. Furthermore,
addressing positive margins with separate procedures undertaken weeks or months later comes with
additional risk due to the high discordance rates between margin localization by surgery and pathology19
.
Disturbingly, studies show that as much as 37% of surgeries repeated due to positive margins fail to
harvest further malignant tissue, implying that the patient did not benefit from the repeated procedure and
may in fact still be at high risk of recurrence48
.
Therefore, a surgeon in a busy breast surgical center may be more interested in which margins are closest
and simply take a few more shavings. A few mm of extra tissue is unlikely to have significant impact on
cosmetic results but can mean a great deal in terms of recurrence risk, especially for high grade aggressive
tumours. Our study found that implementing this approach using iPAT would have intervened in 112 of
the 318 (35%) margins under investigation, with positive and negative predictive values of approximately
71% and 83%, respectively. In terms of the new “no-ink-on-tumour” definition, this paradigm would
have resulted in a surgical failure rate of less than 6%. Compared to the nearly 23% that was experienced
in our series, this represents a reduction of about 75%. Conservatively, if taking extra shavings was only
131
around 50% effective in removing all malignant tissue from an iPAT-detected involved margin, a
considerably improved positive rate of 13% would have been achieved.
4.4.2 Lesion maximum diameter comparison to pathology and Statistical
Analysis
Since maximum lesion size is limited by lumpectomy specimen size, comparison of tumour sizes in
excised specimens is inherently biased toward some level of correlation. For example, it should be
expected that relatively large tumours will be contained within relatively large specimens. Not
surprisingly, in comparing our gold standard pathology measurements, we found a significant although
somewhat weak positive correlation (r = 0.43, p = 0.0004). In contrast, the stronger positive correlation
between diameters determined by iPAT and pathology (r = 0.61, p < 0.0001) indicated that the influence
of whole lumpectomy specimen size on iPAT measured tumour size was limited. This is particularly
evident from the large mean overestimate of tumour size based on whole specimen diameters (35.4 ± 13.6
mm) compared to iPAT (10.2 ± 9.9 mm).
On the other hand, in comparing the equivalency of iPAT measurements to pathology, we found a
significant difference in maximum diameters determined by iPAT compared to pathology, as indicated by
the non-parametric Wilcoxon signed-rank-test (p < 0.0001). We believe this to be largely due to
specimen compression by the lumpectomy holder, which can be appreciated in the two orthogonal
photographs in Figure 4.1(d). The photos show typical stretching and compression of proportions
imposed by the holder on the fresh and highly compliant lumpectomy specimen. Nevertheless, artefacts
and pathologically undocumented DCIS cannot be ruled out. Future studies should address this
confounding factor by implementing an enhanced pathologic examination of the specimens. In particular,
detailed pathologic measurements of in-situ disease should be included. This would allow a more fair

132
comparison to iPAT, which, other than on the basis of lesion morphology, may not necessarily
differentiate invasive from in-situ components
4.4.3 Influence of scanning geometry: “fast” vs transmission-mode
Intriguingly, Tables 4.2 and 4.3 indicate that specimens scanned using transmission-mode iPAT produce
significantly stronger correlations, predictive values, sensitivity and specificity, compared to the whole
cohort. Conversely, considering specimens scanned using the “fast”-mode iPAT resulted in weaker
values. The differences were largest between the two subgroups with correlation coefficients for
transmission-mode versus “fast”-mode being r = 0.77 (p < 0.0001) and r = 0.52 (p < 0.001), respectively.
Furthermore, the positive and negative predictive values for closest or positive margins based on
transmission-mode were 81% and 87%, versus only 63% and 80% for the “fast”-mode, respectively. This
indicates that the theoretical basis for superiority of the transmission-mode scanning geometry is sound.
The technical details of the differences between these scan geometries have been discussed in literature,
however, the tendency for “shadowing” artefacts to be more pronounced in our transmission-mode
images cast doubt on the conclusions. These “shadows” can be appreciated in Figures 4.2 and 4.4 as
apparent hypo-intense features typically found near the periphery of lesions. In particular, the 8 mm and
9 mm slices of Figure 4.4 demonstrate the potential confusion that can arise in margin and lesion extent
assessment. For example, the hypo-intense area on the bottom right of the 8 mm slice in Figure 4.4
(arrow) could easily be confused with malignant tissue.
Naturally, a potential solution may consist of reflection-mode scans, which suffer from significantly less
shadowing, as can be deduced from literature as well as in our earlier work38
. However, the well
documented theoretical inferiority of this approach has prevented its application in our studies49,50
.
Nevertheless, future studies involving iPAT tumour imaging should examine the performance of pure
reflection-mode scan geometry. This will enable comparison to transmission-mode in terms of positive
133
and negative predictive values, sensitivity and specificity. With that information researchers could move
towards mitigating the artefacts in iPAT and optimizing the illumination and detection scheme.
4.4.4 Case studies
The four case studies presented in this work visually demonstrate the potential and versatility of iPAT in a
clinical setting. In particular, the areolar invasion case exemplified the performance of iPAT when
imaging through intact skin. This demonstrated for the first time that in-vivo detection of breast tumours
may be possible via PAT whose target is healthy breast tissue. Analogous to ultrasonography, the
targeting of healthy breast tissue resulted in a contrasting appearance of diseased lesions. The extension
to in vivo applications follows since the optical properties of freshly excised specimens at the relevant
wavelength are minimally affected by excision. It is expected that the main effect will likely consists of
higher blood volume and oxygenation levels for in-vivo applications compared to ex-vivo. However,
since hemoglobin does not dominate absorption at the relevant wavelength of 930 nm, the effects may be
negligible. Therefore, this case also served to illustrate the potential role of iPAT in the pre-operative
work-up.
The DCIS case validated the ability of iPAT to differentiate in-situ disease in a large volume of tissue,
suggesting high specificity. Furthermore, it is well known from conventional imaging modalities, such as
DCE-MRI, that the presence of segmental morphology correlates with in-situ disease. Therefore, iPAT-
derived results of the high-grade DCIS specimen further indicate good imaging versatility. In this case,
iPAT appeared to outperform conventional ultrasonography, which significantly underestimated the
documented extent of disease. Interestingly, while hemoglobin concentration has been named in
literature as a biomarker for malignancy, our study found this case to be one of very few featuring
agreement with conventional imaging.
134
As explained above, our findings indicated that tumor tissue may be distinguished from healthy breast
tissue using iPAT. This was hypothesized to be due to the relatively low optical absorption coefficient of
malignant tissue and subsequent hypo-intense imaging appearance of tumours on scans near a wavelength
of 930 nm. However, this wavelength is well-known to be strongly absorbed by bulk-lipid, or, fat-
containing tissue.51
A possible concern with this inference, therefore, is that the hypo-intense regions in
iPAT images are volumes of the breast parenchyma with relatively low fat content, and as such they may
simply represent dense non-fatty fibro-glandular tissue. Indeed, dense fibro-glandular tissue is also often
blamed for sensitivity and specificity deficits in conventional imaging methods, such as ultrasound and
mammography, and are often overcome only by use of dynamic contrast enhancement in MRI.5,52
It was
therefore further hypothesized that tumors which are visible on iPAT simply due to surrounding fat tissue
should also be seen as surrounded by fat, visualized as hyper-intense on T1 weighted pre-contrast MRI.
Surprisingly, the breast density dependence case revealed that this may not be the case. Indeed, a
significant portion of the 13 mm IDC discussed in that case was embedded in dense fibro-glandular
tissue. Furthermore, close inspection of Figure 4.6 (c, d, and e) indicates that iPAT imaging was able to
visualize all tumor edges with good contrast, even when pre-contrast T1w MRI was not. Finally, the
photoacoustic mammography, or PAM, study by Manohar et al. also reached the same conclusion, i.e. the
optical contrast in PAT is largely independent of tissue density42
.
Lastly, the positive margin case illustrated perhaps the most impactful potential of iPAT. Notably,
intraoperative X-ray also demonstrated the presence of a spiculated mass inside the lumpectomy
specimen, but the two-dimensional nature of that imaging modality failed to inform the operating surgeon
of its true three-dimensional extent. On the other hand, the US examination revealed very little useful
indication of lesion position or size. In contrast, iPAT clearly visualized the lesion and its extent. If the
iPAT scan results for this case were permitted to be shared with the surgeon, the patient would potentially
have been spared a repeat surgery.
135
4.4.5 iPAT system and intraoperative protocol
While iPAT was able to deliver novel imaging results, the current prototype remains to be optimized to
enable smooth operation in a demanding surgical environment. However, straight forward technical
improvements should greatly reduce the operator burden. Our experience identified several key
shortcomings. For example, the 24-channel photoacoustic transducer array, which was used to detect
signals originating from the specimen, spent most of its time scanning the imaging volume to capture the
24,000 projections necessary for high fidelity image reconstruction. Implementing a 240-channel array
would in theory reduce scan time from 6 minutes to only 36 seconds. Therefore, the “fast” mode protocol
would have taken about 10 minutes instead of 20 minutes. Additionally, a more user-friendly
lumpectomy specimen holder and preparation protocol could potentially reduce the entire procedure to
just a few minutes.
Another concern involved the laser. We found that energy output stability was sub-optimal, especially for
the first few hours of operation. This occasionally resulted in a reduced signal-to-noise ratio and lowered
image quality. A better laser system or stabilization method would represent a substantial improvement.
Finally, an increase in the number of wavelengths employed for discrimination of tissue types would
represent a well of potential cancer-related information. While tissue lipid and hemoglobin concentration
are important biomarkers, collagen, elastin and H2O may yield further insight into tissue microstructure.
Therefore, illumination in the 900 nm to 1300 nm wavelength range, where theses tissue chromophores
exhibit unique spectral features, should prove useful in further characterizing breast abnormalities.
4.5 Conclusion
This work established a potential role of photoacoustic tomography in the pre-operative and intra-
operative setting during breast conserving surgery. By delivering real-time actionable information within
an operational surgical suite, the novel imaging system presented here promises significant clinical impact
136
through higher surgical success rates. Positive and negative predictive values as high as 81% and 87%,
respectively, were found leading to a potential reduction in failed surgeries from 22.6% to as low as 5.7%.
In spite of the significant overestimation of lesion size, we found the correlation coefficient, as high as r =
0.77 (p < 0.0001) between iPAT and pathology, to be encouraging. However, the dependence of PPV,
NPV, sensitivity, specificity and correlation on the iPAT scan configuration suggests that optimization of
this imaging method is far from complete.
4.6 References
1. Siegel RL, Miller KD, Jemal A. Cancer Statistics , 2015. CA Cancer J Clin. 2015;65(1):5-29. doi:10.3322/caac.21254.
2. Yaffe MJ, Bloomquist AK, Hunter DM, Mawdsley GE, Chiarlli AM, Muradali D, Mainprize JG. Comparative performance of modern digital mammography systems in a large breast screening program Comparative performance of modern digital mammography systems in a large breast screening program. Med Phys. 2013;40(112):121915. doi:10.1118/1.4829516.
3. Mamounas EP. Continuing evolution in breast cancer surgical management. J Clin Oncol. 2005;23(8):1603-1606. doi:10.1200/JCO.2005.01.015.
4. Kornecki A. Current status of breast ultrasound. Can Assoc Radiol J. 2011;62(1):31-40. doi:10.1016/j.carj.2010.07.006.
5. Gruber I V, Rueckert M, Kagan KO, Staebler A, Siegmann KC, Hartkopf A, Wallwiener D, Hahn M. Measurement of tumour size with mammography, sonography and magnetic resonance imaging as compared to histological tumour size in primary breast cancer. BMC Cancer. 2013;13(June 2005):328. doi:10.1186/1471-2407-13-328.
6. Yang WT, Lam WWM, Cheung H, Suen M, King WWK, Metreweli C. Sonographic, magnetic resonance imaging, and mammographic assessments of preoperative size of breast cancer. J Ultrasound Med. 1997;16(12):791-797. http://www.scopus.com/inward/record.url?eid=2-s2.0-0000202613&partnerID=tZOtx3y1.
7. Fisher B. Twenty-Year Follow-Up of a Randomized Trial Comparing Total for the Treatment of Invasive Breast Cancer. N Engl J Med. 2002;347(16):1233-1241. doi:10.1056/NEJMoa020128.
8. Brackstone M, Townson JL, Chambers AF. Tumour dormancy in breast cancer: an update. Breast Cancer Res. 2007;9(3):208. doi:10.1186/bcr1677.
9. Rusby JE, Smith BL, Gui GPH. Nipple-sparing mastectomy. Br J Surg. 2010;97(3):305-316. doi:10.1002/bjs.6970.
10. Ferré R, Paré M, Smith L, Theriault M, Aldis A, Kao E, Mesurolle B. Retroareolar Carcinomas in Breast Ultrasound: Pearls and Pitfalls. Cancers (Basel). 2016;9(1):1. doi:10.3390/cancers9010001.
137
11. Liberman L, Morris EA, Dershaw DD, Abramson AF, Tan LK. Ductal enhancement on MR imaging of the breast. Am J Roentgenol. 2003;181(2):519-525. doi:10.2214/ajr.181.2.1810519.
12. Schiller DE, Le LW, Cho BCJ, Youngson BJ, Mccready DR. Factors Associated with Negative Margins of Lumpectomy Specimen : Potential Use in Selecting Patients for Intraoperative Radiotherapy. Ann Ourgical Oncol. 2007;15(3):833-842. doi:10.1245/s10434-007-9711-2.
13. Waljee JF, Hu ES, Newman LA, Alderman AK. Predictors of Re-excision among Women Undergoing Breast-Conserving Surgery for Cancer. Ann Surg Oncol. 2008;15(5):1297-1303. doi:10.1245/s10434-007-9777-x.
14. Schulman AM, Mirrielees JA, Leverson G, Landercasper J, Greenberg C, Wilke LG. Reexcision Surgery for Breast Cancer: An Analysis of the American Society of Breast Surgeons (ASBrS) MasterySM Database Following the SSO-ASTRO “No Ink on Tumor” Guidelines. Ann Surg Oncol. 2016;(February):52-58. doi:10.1245/s10434-016-5516-5.
15. Houssami N, Macaskill P, Luke Marinovich M, Morrow M. The Association of Surgical Margins and Local Recurrence in Women with Early-Stage Invasive Breast Cancer Treated with Breast-Conserving Therapy: A Meta-Analysis. Ann Surg Oncol. 2014;21(3):717-730. doi:10.1245/s10434-014-3480-5.
16. Newman LA, Kuerer HM. Advances in breast conservation therapy. J Clin Oncol. 2005;23(8):1685-1697. doi:10.1200/JCO.2005.09.046.
17. Holli K, Saaristo R, Isola J, Joensuu H, Hakama M. Lumpectomy with or without postoperative radiotherapy for breast cancer with favourable prognostic features: results of a randomized study. Br J Cancer. 2001;84(2):164-169. doi:10.1054/bjoc.2000.1571.
18. Hainsworth A, Fosh B, Raymond W, Eaton M, Mcleay W. Ductal carcinoma in situ : breast-conserving surgery without radiotherapy. ANZ J Surg. 2015;85(4):245-248. doi:10.1111/ans.12655.
19. Ananthakrishnan P, Balci FL, Crowe JP. Optimizing Surgical Margins in Breast Conservation. Int J Surg Oncol. 2012;2012. doi:10.1155/2012/585670.
20. Weir L, Worsley D, Bernstein V. The value of FDG positron emission tomography in the management of patients with breast cancer. Breast J. 2005;11(3):204-209. doi:TBJ21625 [pii]\r10.1111/j.1075-122X.2005.21625.x.
21. Menezes GL, Knuttel FM, Stehouwer BL, Pijnappel RM, van den Bosch MA. Magnetic resonance imaging in breast cancer: A literature review and future perspectives. World J Clin Oncol. 2014;5(2):61-70. doi:10.5306/wjco.v5.i2.61.
22. Groheux D, Cochet A, Humbert O, Alberini J-L, Hindié E, Mankoff D. 18F-FDG PET/CT for Staging and Restaging of Breast Cancer. J Nucl Med. 2016;57 Suppl 1:17S-26S. doi:10.2967/jnumed.115.157859.
23. Papa M, Allweis T, Karni T, Sandbanks J, Konichezky M, Diment J, Guterman A, Shapiro M, Peles Z, Maishar R, Gur A, Kolka E, Brem R. An intraoperative MRI system for margin assessment in breast conserving surgery: Initial results from a novel technique. J Surg Oncol. 2016;114(1):22-26. doi:10.1002/jso.24246.
24. Britton PD, Sonoda LI, Yamamoto AK, Koo B, Soh E, Goud A. Breast surgical specimen
138
radiographs : How reliable are they ? Eur J Radiol. 2011;79(2):245-249. doi:10.1016/j.ejrad.2010.02.012.
25. Eggemann H, Ignatov T, Dan S. Accuracy of ultrasound-guided breast-conserving surgery in the determination of adequate surgical margins. Breast Cancer Res Treat. 2014;145(1):129-136. doi:10.1007/s10549-014-2932-8.
26. Krekel NMA, Haloua MH, Cardozo AMFL, de Wit RH, Bosch AM, de Widt-Levert LM, Muller S, van der Veen H, Bergers E, de Lange de Klerk ESM, Meijer S, Petrousjka van den Tol M. Intraoperative ultrasound guidance for palpable breast cancer excision ( COBALT trial ): a multicentre , randomised controlled trial. Lancet Oncol. 2013;14(1):48-54. doi:10.1016/S1470-2045(12)70527-2.
27. Esbona K, Li Z, Wilke LG. Intraoperative Imprint Cytology and Frozen Section Pathology for Margin Assessment in Breast Conservation Surgery : A Systematic Review. Ann Surg Oncol. 2012;19(10):3236-3245. doi:10.1245/s10434-012-2492-2.
28. Thill M, Dittmer C, Baumann K, Friedrichs K, Blohmer J. MarginProbe- Final results of the German post-market study in breast conserving surgery of ductal carcinoma in situ. The Breast. 2014;23(1):94-96. doi:10.1016/j.breast.2013.11.002.
29. Koloydenko A, Notingher I. Towards intra-operative diagnosis of tumours during breast conserving surgery by selective-sampling Raman micro-spectroscopy. Phys Med Biol. 2014;59(20):6141-6152. doi:10.1088/0031-9155/59/20/6141.
30. Brown JQ, Bydlon TM, Richards LM, Yu B, Kennedy SA, Geradts J, Wilke LG, Junker MK, Gallagher J, Barry WT, Ramanujam N. Optical Assesssment of Tumor Resection Margins in the Breast. IEEE J Sel Top Quantum Electron. 2010;16(3):530-544.
31. Lue N, Kang JW, Yu C, Barman I, Dingari NC, Field MS, Dasari RR, Fitzmaurice M. Portable Optical Fiber Probe-Based Spectroscopic Scanner for Rapid Cancer Diagnosis : A New Tool for Intraoperative Margin Assessment. PLoS One. 2012;7(1). doi:10.1371/journal.pone.0030887.
32. Breslin TM, Xu F, Palmer GM, Zhu C, Gilchrist KW, Ramanujam N. Autofluorescence and Diffuse Reflectance Properties of Malignant and Benign Breast Tissues. Ann Surg Oncol. 2004;11(1):65-70. doi:10.1245/ASO.2004.03.031.
33. Nguyen FT, Zysk AM, Chaney EJ, Kotynek JG, Oliphant UJ, Bellafiore FJ, Rowland KM, Johnson PA, Boppart SA. Intraoperative Evaluation of Breast Tumor Margins with Optical Coherence Tomography. Cancer Res. 2009;69(22):8790-8797. doi:10.1158/0008-5472.CAN-08-4340.
34. Wang L V, Hu S. Photoacoustic Tomography : In Vivo Imaging from Organelles to Organs. Science (80- ). 2012;335(March):1458-1462.
35. Dogra VS, Chinni BK, Valluru KS, Joseph J V. Multispectral Photoacoustic Imaging of Prostate Cancer : Preliminary Ex ‑ vivo Results. J Clin Imaging Sci. 2015;3(3):1-7. doi:10.4103/2156-7514.119139.
36. Kim GR, Kang J, Kwak JY, Chang JH, Kim S Il, Youk JH. Photoacoustic Imaging of Breast Microcalcifications : A Preliminary Study with 8-Gauge Core-Biopsied Breast Specimens. PLoS One. 2014;9(8):8-10. doi:10.1371/journal.pone.0105878.
37. Kim C, Erpelding TN, Jankovic L, Pashley MD, Wang L V. Deeply penetrating in vivo photoacoustic
139
imaging using a clinical ultrasound array system. Biomed Opt Express. 2010;1(1):335-340.
38. Kosik I, Carson JJL, Program I, Health L, Joseph S. Combined 3D photoacoustic and 2D fluorescence imaging of indocyanine green contrast agent flow. Proc SPIE. 2013;8581:1-8. doi:10.1117/12.2005269.
39. Wong P, Kosik I, Raess A, Carson JJL. Objective Assessment and Design Improvement of a Staring, Sparse Transducer Array by the Spatial Crosstalk Matrix for 3D Photoacoustic Tomography. PLoS One. 2015;10(4):e0124759. doi:10.1371/journal.pone.0124759.
40. Roumeliotis MB, Kosik I, Carson JJL. 3D photoacoustic imaging using starting, sparse array with 60 transducers. 2012;8223:82233F-82233F-6. doi:10.1117/12.908841.
41. Roumeliotis M, Ephrat P, Patrick J, Carson JJL. Development and characterization of an omnidirectional photoacoustic point source for calibration of a staring 3D photoacoustic imaging system. Opt Express. 2009;17(17):15228-15238. doi:10.1364/OE.17.015228.
42. Heijblom M, Piras D, van den Engh FM, van der Schaaf M, Klasse JM, Steenbergen W, Manohar S. The state of the art in breast imaging using the Twente Photoacoustic Mammoscope: results from 31 measurements on malignancies. Eur Radiol. 2016;26(11):3874-3887. doi:10.1007/s00330-016-4240-7.
43. Li R, Wang P, Lan L, Lloyd jr. FP, Goergen CJ, Chen S, Cheng J. Assessing breast tumor margin by multispectral photoacoustic tomography. Biomed Opt Express. 2015;6(4):1273. doi:10.1364/BOE.6.001273.
44. Tan KY, Tan SM, Chiang SH, Tan A, Chong CK, Tay KH. Breast specimen ultrasound and mammography in the prediction of tumour-free margins. ANZ J Surg. 2006;76(12):1064-1067. doi:10.1111/j.1445-2197.2006.03941.x.
45. Treeby B, Cox B. Iterative Image Improvement Using Time Reversal. http://www.k-wave.org/documentation/example_pr_2D_tr_iterative.php. Published 2016.
46. Chagpar AB. Influence of breast cancer histology on the relationship between ultrasound and pathology tumor size measurements. Breast Dis. 2005;16(1):48-49. doi:10.1016/S1043-321X(05)80031-1.
47. Moschetta M, Telegrafo M, Introna T, Coi L, Rella L, Ranieri V. original article Role of specimen US for predicting resection margin status. 2015;36(October):201-204.
48. Scopa CD, Aroukatos P, Tsamandas AC, Aletra C. Evaluation of margin status in lumpectomy specimens and residual breast carcinoma. Breast J. 2006;12(2):150-153. doi:10.1111/j.1075-122X.2006.00223.x.
49. Jaeger M, Harris-Birtill D, Gertsch A, O’Flynn E, Bamber J. Deformation-compensated averaging for clutter reduction in epiphotoacoustic imaging in vivo. J Biomed Opt. 2012;17(6):66007. doi:10.1117/1.JBO.17.6.066007.
50. Song KH, Wang L V. Deep reflection-mode photoacoustic imaging of biological tissue. J Biomed Opt. 2007;12(December):1-3. doi:10.1117/1.2818045.
51. Anderson PG, Kainerstorfer JM, Sassaroli A, Krishnamurthy N, Homer MJ, Graham RA, Fantini S. Broadband optical mammography: Chromophore concentration and hemoglobin saturation
140
contrast in breast cancer. PLoS One. 2015;10(3):1-23. doi:10.1371/journal.pone.0117322.
52. Bosch AM, Kessels AGH, Beets GL, Rupa JD, Koster D, van Engelshoven JMA, von Meyenfeldt MF. Preoperative estimation of the pathological breast tumour size by physical examination, mammography and ultrasound: A prospective study on 105 invasive tumours. Eur J Radiol. 2003;48(3):285-292. doi:10.1016/S0720-048X(03)00081-0.
141
Chapter 5: Discussion and future outlook
The work presented in the preceding chapters covers a considerable breadth of knowledge in various
disciplines and topics. It is likely that future developments and applications of this technology and
methodology will occur in an equally diverse and multidisciplinary setting, including the physical,
biological and medical sciences. With this in mind, an effort has been made to keep the material
accessible from a clinical as well as technical perspective. In that spirit, the concluding chapter of this
dissertation is organized according to theoretical, clinical and technical considerations and improvements.
5.1 Theoretical considerations and future directions
As a hybrid optical/acoustic imager, the iPAT system that was developed for, and employed in, this work,
derived much of its inherently unique capabilities from exploitation of the molecular specificity
associated with multispectral optical imaging. In contrast, examination of section 1.4.2 reveals that many
groups working on PAT of the breast settled on fixed-wavelength illumination1–3
. For example, the
fundamental Nd-YAG laser emission at 1064 nm was often used, probably due to factors associated with
convenience, reliability and expense of employed laser systems. Our group recognized early-on that these
wavelengths are rarely optimal for differentiation of various tissue types, as can be appreciated in Figure
2.4 of chapter 2, as well as our earlier work4,5
. Consequently, multispectral illumination capability was
one of the defining features of this investigation. In this section, merits and pitfalls of the employed
wavelength-selection are discussed and the theoretical basis behind the proposed wavelength optimization
approach are outlined.
5.1.1 Lipids vs Hemoglobin in ex-vivo breast tumour imaging
A survey of photoacoustic imaging literature suggests that the primary contrast of tumours is provided by
elevated hemoglobin concentration associated with cancer induced angiogenesis2,6–9
. Consequently, it was
142
expected that iPAT scans targeting hemoglobin would exhibit increased signal intensity originating from
periphery of tumour regions. However, contrary to this hypothesis, this investigation found that
hemoglobin weighted images generally showed little or no correlation with hypoechoic US regions inside
ex vivo specimens. This was the case for most of the specimens encountered in this study and is
exemplified in Figure 2.5 of chapter 2. Therefore, the extendibility of documented in vivo results to ex
vivo applications must be questioned. The extendibility hypothesis rests upon two assumptions.
First, it was assumed that a freshly excised tissue specimen would quickly reach low blood oxygenation
levels due to a lack of blood supply. This motivated the 690 nm wavelength selection, where
deoxyhemoglobin dominates tissue absorption as shown in Figure 1.4 of the Introduction. The validity of
this assumption was corroborated by the increased 690 nm signal intensity associated with bloody
regions. For example, note the hyper-intense appearance of the region indicated by the dashed oval in the
690 nm image shown in Figure 2.5(a) of chapter 2. This region corresponds well to the area of high blood
content marked by a dashed oval in the photograph of Figure 2.5(h). In comparison, the corresponding
800 nm images in Figure 2.5(b) show reduced intensity. This result suggests a dominance of
deoxygenated blood since the 800 nm wavelength is absorbed equally by deoxy- and oxy-hemoglobin
while the 690 nm wavelength is dominantly absorbed by only deoxyhemoglobin.
The second assumption is that blood distribution inside the specimen will remain relatively unchanged
after excision. However, the blood distribution depends on ability of the vascular network to maintain
blood vessel volume, which in turn depends on blood pressure, provided by cardiac output. Because an
excised specimen is no longer connected to the cardiovascular system, it is possible that many of its blood
vessels collapsed during surgery, leading to a heterogeneous reduction in blood volume. Therefore,
hemoglobin distribution inside excised tissue specimens may not be a good biomarker of malignancy.
Alternatively, low lipid concentration has been well documented by optical methods as being a significant
indicator of breast abnormalities10
. Furthermore, unlike the mobile nature of blood, the lipid
concentration within breast tissue is unaffected by surgical excision. Consequently, it is possible that low
143
lipid concentration is a good indicator of tumour location and extent, in excised tissue. Moreover, lipid
may be a more effective biomarker for in vivo tumour mapping as well, and going forward, researchers
with access to high-fidelity photoacoustic imaging systems should make an effort to examine this
approach. The preliminary results of the study presented here provide motivation for this direction.
Finally, recently developed sophisticated lipidomic profiling methods have demonstrated outstanding
diagnostic accuracy near 100%11
. These findings independently indicate that, in differentiating malignant
lesions, lipid content may be a promising new alternative to hemoglobin.
5.1.2 Optimizing wavelength selection for tissue discrimination
Beyond the two employed wavelengths, which targeted hemoglobin and lipids, other tissue chromophores
should ideally be exploited to maximize the sensitivity and specificity of iPAT. For example, breast
density, or the amount of fibro-glandular tissue in the breast, has been correlated to water concentration,
and independently, to elevated breast cancer risk12,13
. Specifically, increases in water concentration were
associated with volumes containing increased fibrous and glandular tissue, while still higher
concentrations were associated with malignant lesions. Furthermore, NIR optical methods have
demonstrated excellent sensitivity to water content, indicating altered concentrations in most malignant
breast tumours10
. Therefore, use of an appropriate water-sensitive illumination wavelength during iPAT
imaging of lumpectomy specimens may uncover new, potentially cancer-relevant, indicators of
underlying tissue composition.
To that end, there are numerous wavelength selection possibilities in the deeper NIR optical spectrum
where hemoglobin plays a reduced role in tissue absorption. For example, the spectral water peaks near
970 nm and 1180 nm seem logical staring points, as can be appreciated in Figure 5.1. On the other hand,
the close spectral proximity of those peaks, to the 930 nm and 1210 nm lipid peaks, may cause reduced
tissue-differentiation capacity. Consequently, a wavelength near 1140 nm may produce more effective
results.
144
Similarly, the protein collagen and to a lesser degree, elastin, are found throughout the breast, and indeed
the entire body. Furthermore, it is well known that malignant neoplasms frequently induce a desmoplastic
reaction via elevated secretion of collagen, ultimately leading to an area of increased stiffness, or a
palpable lump14
. Importantly, more recent studies have linked the degree of collagen concentration
within a malignant lesion to an increased propensity of tumour metastasis15,16
. Therefore, in addition to
hemoglobin, lipids, and water, collagen may also be a significant indicator of malignancy, and perhaps
may even provide insight into the aggressiveness of tumours.
Inspecting Figure 5.1 reveals potential wavelengths that could be used to sway iPAT contrast towards
collagen. For example, the absorption peak near 1170 nm may be a good option. However, the high
absorption of water and lipids near that spectral region may overshadow collagen contrast. Instead, a
wavelength of 1040 nm, where both lipids and water play reduced roles, might yield more effective
collagen-biased imaging results. Ultimately, in practice, wavelength optimization will likely require
consideration of both theoretical and empirical evidence.
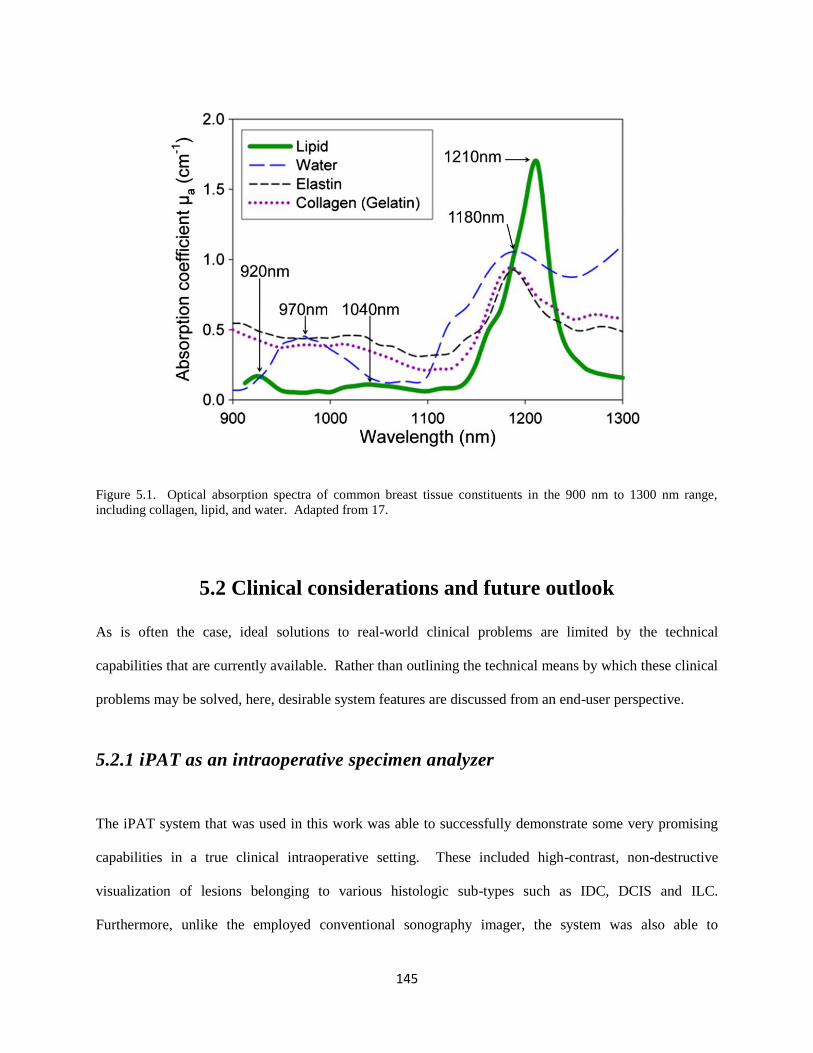
145
Figure 5.1. Optical absorption spectra of common breast tissue constituents in the 900 nm to 1300 nm range,
including collagen, lipid, and water. Adapted from 17.
5.2 Clinical considerations and future outlook
As is often the case, ideal solutions to real-world clinical problems are limited by the technical
capabilities that are currently available. Rather than outlining the technical means by which these clinical
problems may be solved, here, desirable system features are discussed from an end-user perspective.
5.2.1 iPAT as an intraoperative specimen analyzer
The iPAT system that was used in this work was able to successfully demonstrate some very promising
capabilities in a true clinical intraoperative setting. These included high-contrast, non-destructive
visualization of lesions belonging to various histologic sub-types such as IDC, DCIS and ILC.
Furthermore, unlike the employed conventional sonography imager, the system was also able to
146
consistently visualize surgical orientation sutures. This feature, in combination with photographs,
facilitated specimen orientation with respect to the patient, enabling practical studies comparing iPAT
results to diagnostic imaging and pathology. Straight forward implementation of oriented specimen
imaging also illustrated what is likely the most impactful use of the iPAT imaging platform, namely
intraoperative specimen examination. Therefore, similarly to current intraoperative tissue analyzers and
protocols, such as Faxitron, we believe that the system belongs in the operating room where the surgeon
can obtain real-time actionable information, with or without radiologist or pathologist input.
On the downside, the system frequently failed to visualize localization wires, tissue clips, as well as I-125
radioactive localization seeds. This is unfortunate because the widespread translation of this technology
will likely depend on preservation of the current standard of practice, namely X-ray radiography. As can
be appreciated in Figure 1.3 of Chapter 1, X-ray imaging excels at visualization of metallic surgical aides,
providing surgeons and radiologists with confidence about surgery outcomes, particularly as it relates to
harvesting of radioactive seeds. Therefore to be an effective stand-alone replacement of current
intraoperative specimen examination methods, iPAT should be modified to enable visualization of these
aides. Fortunately, this is likely possible through iPAT system resolution improvements via modification
of the technical specifications, discussed further below, and exemplified in literature18
. However, it may
be possible to overcome this problem by simply employing a metal-optimized illumination wavelength.
Alternatively, perhaps selection of iPAT compatible surgical aides, or modification of current aides by
coating or otherwise impregnating materials with contrast agents, may enable more efficient PA signal
generation, and result in successful surgical aid visualization.
5.2.2 iPAT breast tumour size assessment
The work presented in Chapters 3 and 4 revealed that iPAT produces relatively high correlation values
when comparing tumour sizing and extent to pathology and DCE-MRI. Particularly, volumetric
assessment by iPAT and DCE-MRI produced highly concordant indications with correlation coefficient
147
values of up to r=0.78. However, the high dependence of correlation values on the employed iPAT scan
geometry indicates that further optimization is needed. Specifically, transmission-mode scans
consistently outperformed multi-mode or fast scans. Unfortunately, transmission-mode scans involved
scanning two opposing sides of the lumpectomy specimen separately. Consequently, this required double
the amount of time to complete, causing delays that threatened to interfere with the clinically established
surgical workflow. To remedy this problem, the iPAT system should be modified to enable a faster scan
speed, as well as a user-friendly and seamless specimen inversion mechanism or protocol.
It should also be mentioned, that, as described in the methods sections of Chapter 3 and 4, a single
observer was responsible for measurements of volumes and diameters, likely introducing some level of
bias. This bias stems from that observer’s a priori knowledge of results from other imaging studies such
as US, X-ray and MRI. However, this situation is similar to realistic clinical conditions where individual
lesions will often receive multiple modality imaging scans, producing a pool of information that is used in
surgical decisions. Nevertheless, given that inter-observer variability in typical clinical assessment of
lesion size can be tens of percent, a more accurately representative comparison of modality measurement
performance should ideally average measurements from multiple observers.
5.2.3 iPAT margin evaluation
By employing a preemptive and conservative surgical approach, along with iPAT margin assessment, this
investigation promised significant clinical impact by potentially reducing re-excision rates due to positive
margins by nearly 75%. However, an ideal margin assessment method should offer similar information
as the pathology report, including sub-millimeter measurements of the resection margins. This would
enable objective comparison between the gold standard pathology and iPAT. Unfortunately, the
relatively low 2.5 mm resolution of the system, combined with shadowing artefacts, typically found near
the margins, prevented histologically-comparable measurements. Therefore, future developments of this
148
technology should include increased imaging resolution, as well as an artefact elimination or mitigation
strategy.
5.2.4 Potential for in-vivo applications
Rather than beginning with the considerably more complicated task of performing in-vivo breast cancer
imaging, the approach of this work was to focus on tumour detection and assessment technology, ex-vivo.
The relative simplicity of this approach facilitated more freedom to experiment and optimize the
technology and methodology, resulting in novel results. Nevertheless, these results are directly
translatable to in-vivo applications. Accordingly, an in-vivo breast imaging system, based on the
technology behind iPAT, should be the next logical step in technology development. For example, the
breast angiography system introduced by Kruger et al. demonstrated excellent tissue penetration,
clinically-relevant scan times and FOV, as well as volumetric visualization19
. Therefore, it is likely
possible that an imaging system similar in design to the Krueger system, but with illumination and signal
detection based on iPAT technology, could perform diagnostic-style patient imaging featuring tumour
visualization performance similar to iPAT. Furthermore, literature as well as studies in Appendix 2 have
shown that PAT is highly sensitive to conventional optical contrast agents, such as Indocyanine green
(ICG) and Methylene blue (MB+). Therefore a fast in-vivo PAT system would permit the development
and implementation of dynamic contrast enhanced (DCE) imaging protocols aimed at specific tasks, such
as evaluation of tumour perfusion dynamics. Similarly to DCE-MRI, these developments will likely
further improve the imaging performance and versatility of this imaging platform.
5.3 iPAT system technical improvements
The current iPAT system prototype embodies many desirable features of an ideal intraoperative specimen
analyzer, including 3D volumetric visualization, multispectral capability, large FOV, and sensitivity to
multiple lesion sub-types. However, the preceding theoretical and clinical discussion outlined further
149
unmet needs, including surgical aid visualization, sub-millimeter margin measurements, wavelength
selection range encompassing water and collagen spectral peaks, as well as decreased scan time and more
user friendly specimen preparation and handling protocol. Here the technical improvements necessary to
realize these capabilities are discussed.
5.3.1 Tissue illumination and imaging artefacts
In summary, the current iPAT system illumination employs an Nd-YAG laser coupled to an optical
parametric oscillator (OPO) capable of generating output wavelengths in the 670 nm to 950 nm range,
with energies up to 40 mJ/pulse and a repetition rate of 20 Hz. To expand the wavelength tuning range
and enable efficient excitation of collagen and water, a laser with an OPO that tunes farther into the NIR
should be employed, along with fiber optics featuring the appropriate spectral transmission range. For
example, one group utilized a laser able to generate output from 670 nm to 2300 nm20
.
In terms of illumination geometry, currently, the laser system directs a 3 cm diameter light beam along a
single vertical line of sight, perpendicularly to the largest plane intersecting the compressively flattened
specimen. Due to this unidimensional illumination, shadows are cast below highly absorbing features, as
well as areas presenting a steep incline to the laser beam, such as near the outer edges of the specimen.
While light diffusion in deep tissue typically smoothens out any steep illumination gradients, the surface
and sub-surface regions remain vulnerable. To mitigate the shadowing artefact problem, the illumination
scheme should be modified to ideally come from multiple directions, similarly to the employed
hemispherical signal detection geometry. This would reduce the dependence of the incident laser fluence
on one particular angle, hence maintaining a more homogeneous fluence overall.
150
5.3.2 PA signal detection and scan speed
As previously described, at the heart of the iPAT system is a unique 24-channel acoustic transducer array,
featuring highly sensitive wide-band polymer (PVDF) transducer elements with a low sub-MHz peak
frequency. This detection scheme is favourable due to its exquisite sensitivity to bulk tissue, enabling
visualization of large centimeter-level features, including tumours. However, the use of transducers of a
single low-frequency limits the attainable resolution, and in fact, reduces the sensitivity, and ultimately
detectability, of signals originating from millimeter and sub-millimeter features, such as surgical aides
and vasculature.
Accordingly, redesigning the iPAT transducer array should include use of multiple transducer types to
enable the detection of small imaging targets and to increase the attainable imaging resolution. Due to
their reasonable compromise between ease of fabrication, sensitivity, and acoustic impedance match to
tissue, some groups have begun employing transducer elements with composite piezoelectric materials7.
Other groups have resorted to using conventional piezoelectric ceramics, such as PZT, due to their
excellent sensitivity and widespread availability19
. These options should be investigated for iPAT array
fabrication, however, the resonant properties of these materials may be ill-suited to the detection of
transient PA waves in water and tissue. Alternatively, our group has previously reported on use of
various PVDF co-polymer materials and PA transducer construction methods, demonstrating excellent
acoustic impedance match to tissue, high sensitivity, and sub-millimeter resolution4,5,21
. Logically, these
expertise should be applied to the design and construction of a multi-frequency iPAT transducer array.
To capture a full hemisphere of projection measurements, necessary for high quality PA image
reconstruction, the current iPAT scanner spends a majority of time rotating the 24-element arc-shaped
transducer array. Therefore, designing a new array with more elements would be a straight-forward way
to increase the scan speed. For example, a hemispherical staring transducer array, utilizing 240-elements,
would eliminate the need for rotational scan motion, and would potentially reduce scan time from 6
151
minutes to just 40 seconds. Our group has previously published results demonstrating the capabilities of a
staring 128-channel hemispherical PA array, consequently, an array with 240-channels implies a
relatively simple extension of existing technology4.
5.3.3 Sample immobilization
To prepare a fresh lumpectomy for scanning in the iPAT system requires placement of the specimen
inside a customized saline-filled Ziploc bag, drainage of excess saline, installation of the sealed and
drained bag onto the lumpectomy holder, and insertion of the holder into the iPAT system’s water tank.
Furthermore, if air bubbles infiltrate the bag or are unintentionally overlooked, the process must be
repeated to minimize risk of imaging artefacts. In our experience, this sub-optimal procedure represents
one of the best opportunities for improvement, particularly in specimen processing time. There are a
number of possible approaches to enable a faster and smoother specimen handling experience. Ideally, a
mechanized instrument should be designed that would accept a suture oriented specimen of arbitrary
shape. The instrument should be capable of automatically processing, positioning, inverting and finally
ejecting the specimen. This could be realized by use of a simple water-proof translation stage, coupled to
a modified version of a commercially available vacuum sealer. Alternatively, a simpler design could be
implemented by separating the specimen processing task from the specimen-holder insertion task.
5.4 Conclusions
The work presented in this dissertation began with the aim to address high BCS re-excision rates due to
positive margins. A dedicated PAT-based lumpectomy specimen scanner, called iPAT, was designed,
constructed, and tested in an intraoperative setting on 100 patients undergoing BCS. During the course of
the investigation, the novel instrument demonstrated a capability to visualize a variety of breast
abnormalities with high concordance compared to established medical imaging modalities, as well as
histopathology. These capabilities resulted in a potential reduction in re-excision rates by nearly 75%.

152
Chapter 2 described the technical details of the iPAT instrument, and presented phantom studies, ex-vivo
chicken-tissue studies as well as preliminary results of lumpectomy imaging. At the heart of the iPAT
scanner was a novel transducer-array allowing detection of PA signals from bulk-tissue. The array
coupled with a tunable laser permitted the differentiation and visualization of various soft tissues
including poultry breast, thigh and fat tissues, as well as fresh lumpectomy specimens containing IDC and
DCIS lesions. The chapter included a demonstration of the appearance of a positive margin on iPAT
images. It also included a report on the discovery of lipids as a potentially alternative source of PA
contrast for the visualization of whole breast tumours.
In Chapter 3 the capabilities of iPAT were tested by comparison of breast lesion size to DCE-MRI and
pathology. The results were promising with correlation coefficient values for volumetric tumour
measurements of up to r=0.78. Furthermore, the dependence iPAT breast tumour contrast on the utilized
illumination wavelength was investigated, indicating an optimal range near 930 nm. Finally, the chapter
discussed the leading theory behind shadowing artefacts, which were found to appear near the periphery
of specimen images and were likely caused by sharp illumination gradients.
Chapter 4 summarized the results of the 100 patient pilot-study by demonstrating potentially significant
clinical impact through intraoperative detection of 9 out of 12 positive margins during BCS. Furthermore,
margin-status predictive values were calculated yielding scan-type dependent PPV, NPV, sensitivity and
specificity of up to 81%, 87%, 80% and 89%, respectively. This chapter also expanded the statistical
comparison of lesion diameters to 63 specimens, demonstrating strong, but also scan-type dependent
correlations of up to r=0.77. The chapter established that transmission-scan geometry is optimal in
visualizing breast tumour extent in lumpectomies. Finally, four case studies concluded the chapter by
illustrating the visualization of IDC infiltration of the areolar complex, DCIS, IDC in fibro-glandular
tissue, and a positive margin.
The application of the technology developed during this work will likely see a broadening range in the
future. The ever-increasing life expectancy of the general population, particularly in the developing
153
world, means that cancer diagnosis and treatment are going to play an equally increasing role. Excitingly,
iPAT-based technology, along with an extension to diagnostic imaging, promises higher BCS success
rates, fewer re-excisions, and ultimately a more efficient cancer care administration.
5.5 References
1. Oraevski AA, Andreev VG, Karabutov AA, RD Fleming, Z Gatalica, H Singh, RO Esenaliev. Laser opto-acoustic imaging of the breast: detection of cancer angiogenesis. Proc SPIE. 1999;3597:352-363.
2. Manohar S, Vaartjes SE, van Hespen JCG, Klasse JM, van den Engh FM, Steenbergen W, van Leeuwen TG. Initial results of in vivo non-invasive cancer imaging in the human breast using near-infrared photoacoustics. Opt Express. 2007;15(19):12277-12285. doi:10.1364/OE.15.012277.
3. Heijblom M, Piras D, van den Engh FM, van der Schaaf M, Klasse JM, Steenbergen W, Manohar S. The state of the art in breast imaging using the Twente Photoacoustic Mammoscope: results from 31 measurements on malignancies. Eur Radiol. 2016;26(11):3874-3887. doi:10.1007/s00330-016-4240-7.
4. Kosik I, Carson JJL. Real-time multispectral 3-D photoacoustic imaging of blood phantoms. Proc SPIE. 2013;8581:85811V. doi:10.1117/12.2005199.
5. Kosik I, Carson JJL, Program I, Health L, Joseph S. Combined 3D photoacoustic and 2D fluorescence imaging of indocyanine green contrast agent flow. Proc SPIE. 2013;8581:1-8. doi:10.1117/12.2005269.
6. Wang L V, Hu S. Photoacoustic Tomography : In Vivo Imaging from Organelles to Organs. Science (80- ). 2012;335(March):1458-1462.
7. Ermilov S a., Khamapirad T, Conjusteau A, Leonard MH, Lacewell R, Mehta K, Miller T, Oraevski AA. Laser optoacoustic imaging system for detection of breast cancer. J Biomed Opt. 2009;14(2):24007. doi:10.1117/1.3086616.
8. Dogra VS, Chinni BK, Valluru KS, Joseph J V. Multispectral Photoacoustic Imaging of Prostate Cancer : Preliminary Ex ‑ vivo Results. J Clin Imaging Sci. 2015;3(3):1-7. doi:10.4103/2156-7514.119139.
9. Xie Z, Hooi FM, Fowlkes JB, Pinsky RW, Wang X, Carson PL. Combined photoacoustic and acoustic imaging of human breast specimens in the mammographic geometry. Ultrasound Med Biol. 2013;39(11):2176-2184. doi:10.1016/j.ultrasmedbio.2013.05.018.
10. Anderson PG, Kainerstorfer JM, Sassaroli A, Krishnamurthy N, Homer MJ, Graham RA, Fantini S. Broadband optical mammography: Chromophore concentration and hemoglobin saturation contrast in breast cancer. PLoS One. 2015;10(3):1-23. doi:10.1371/journal.pone.0117322.
11. Balog J, Sasi-szabó L, Kinross J, Lewis MR, Muirhead LJ, Vesekov K, Mirnezami R, Dezso B, Damjanovich L, Darzi A, Nicholson JK, Takats Z. Intraoperative Tissue Identification Using Rapid Evaporative Ionization Mass Spectrometry. 2013;5(194).
154
12. Green VL. Mammographic Breast Density and Breast Cancer Risk : Implications of the Breast Density Legislation for Health Care Practitioners. 2016;59(2):419-438.
13. Graham, S. J, Bronskill, M. J, Byng, J. W, Yaffe MJ, Boyd, N. F. Quantitative correlation of breast tissue parameters using magnetic resonance and X-ray mammography. Br J Cancer. 1996;168:162-168.
14. Walker RA. The complexities of breast cancer desmoplasia. Braest Cancer Res. 2001.
15. Zhang K, Corsa CA, Ponik SM, Prior JL, Piwnica-Worms D, Eliceiri KW, Keely PJ Longmore GD. The Collagen Receptor Discoidin Domain Receptor 2 Stabilizes Snail1 Protein to Facilitate Breast Cancer Metastasis. Nat Cell Biol. 2013;15(6):677-687. doi:10.1038/ncb2743.The.
16. Fenner J, Stacer AC, Winterroth F, Johnson TD, Luker KE, Luker GD. Macroscopic Stiffness of Breast Tumors Predicts Metastasis. Sci Rep. 2014:1-8. doi:10.1038/srep05512.
17. C. Tsai, J. Chen and WW. Near-infrared absorption property of biological soft tissue constituents. J Med Biol Eng. 2001;21(1):7-13.
18. Su J. Photoacoustic imaging of clinical metal needles in tissue. J Biomed Opt. 2010;15(April):1-6. doi:10.1117/1.3368686.
19. Kruger RA, Kuzmiak CM, Lam RB, Reinecke DR, SP Del Rio, Steed D. Dedicated 3D photoacoustic breast imaging. Med Phys. 2013;40(11):113301. doi:10.1118/1.4824317.
20. Li R, Wang P, Lan L, Lloyd jr. FP, Goergen CJ, Chen S, Cheng J. Assessing breast tumor margin by multispectral photoacoustic tomography. Biomed Opt Express. 2015;6(4):1273. doi:10.1364/BOE.6.001273.
21. Roumeliotis MB, Kosik I, Carson JJL. 3D photoacoustic imaging using starting, sparse array with 60 transducers. 2012;8223:82233F-82233F-6. doi:10.1117/12.908841.
155
Appendix 1: Real-Time Multispectral 3-D Photoacoustic Imaging
of Blood Phantoms
Citation:
Kosik I, Carson JJL. Real-time multispectral 3-D photoacoustic imaging of blood phantoms. Proc SPIE.
2013;8581:85811V. doi:10.1117/12.2005199.
This work focused on development of acoustic transducer technology with high sensitivity. While the
frequency was found to be too high for bulk tissue sensing, the integrated pre-amplifiers demonstrated
excellent sensitivity by detecting signals from blood phantoms at various oxygenation levels. The work
was focused on real time imaging, as a result, the individual image quality is low, however the temporal
resolution was high. This was accomplished by use of two separate lasers tuned to different wavelengths.
Ultimately, the findings of this investigation indicated that highly specialized transducers with ultra-
wideband frequency response and sensitivity were needed if tumour-sized objects were to be visualized
using PAT. This led to the development of the sensors that made the work of this dissertation possible.
A1.1 Introduction
A1.1.1 Background
Our group has previously reported 3D PAI with a 60 element staring, sparse hemispherical transducer
array with single wavelength laser excitation, where we were able to demonstrate 3D reconstruction of a
variety of targets [1]. Here, we present early results of an improved 128 element multispectral 3D PAI
system featuring a staring, sparse hemispherical transducer array with better angular coverage, more
sensitive detectors and dual wavelength excitation. The system was tested using blood phantoms with
different oxygenation states.
156
A1.1.2 Motivation and Approach
One routinely studied contrast mechanism in PAI is the strong absorption of near infrared (NIR) light by
blood. Hence, a 3D PAI system holds the potential to provide visualization of tissue vasculature without
the need for ionizing radiation or contrast agents. Furthermore, the optical contrast sensitivity and laser
tunability of PAI provides the means to perform multispectral imaging of blood based on the wavelength-
dependent absorption of hemoglobin, which is the dominant chromophore in blood. Specifically,
multispectral PAI provides images with inherent blood oxygenation contrast and as such might aid in the
detection of tissues affected by diseases, such as cancer [2].
The PAI scheme typically employs a transducer array whose shape determines many characteristics of the
system. Linear ultrasound arrays hold the advantage of being commercially available and hence are often
used. However the downside is a high level of difficulty in obtaining sufficient angular coverage for
meaningful 3D image reconstruction without the use of mechanical translation or rotation stages.
Furthermore, current commercial arrays intended for ultrasound imaging feature transducers that tend to
be highly resonant with a narrow bandwidth response, thereby greatly affecting resolution and frequency
coverage. Hence, custom built, low resonance and wide bandwidth transducers are highly desirable when
designing an ultrasound detection array for PAI.
Multispectral illumination schemes often employ one laser to scan through wavelengths and collect
images widely spaced in time. The downside is inability to temporally synchronize the multispectral
contrast, consequently functional information related to fast oxygenation dynamics is compromised.
To overcome this issue, near simultaneous illumination at multiple wavelengths must be used to capture
independent images each with specific wavelength contrast. This can be accomplished by using a rapid
series of synchronized pulses from multiple lasers, while measuring ultrasound output. To test this
concept, we adapted our 3D PAI approach to dual wavelength imaging.
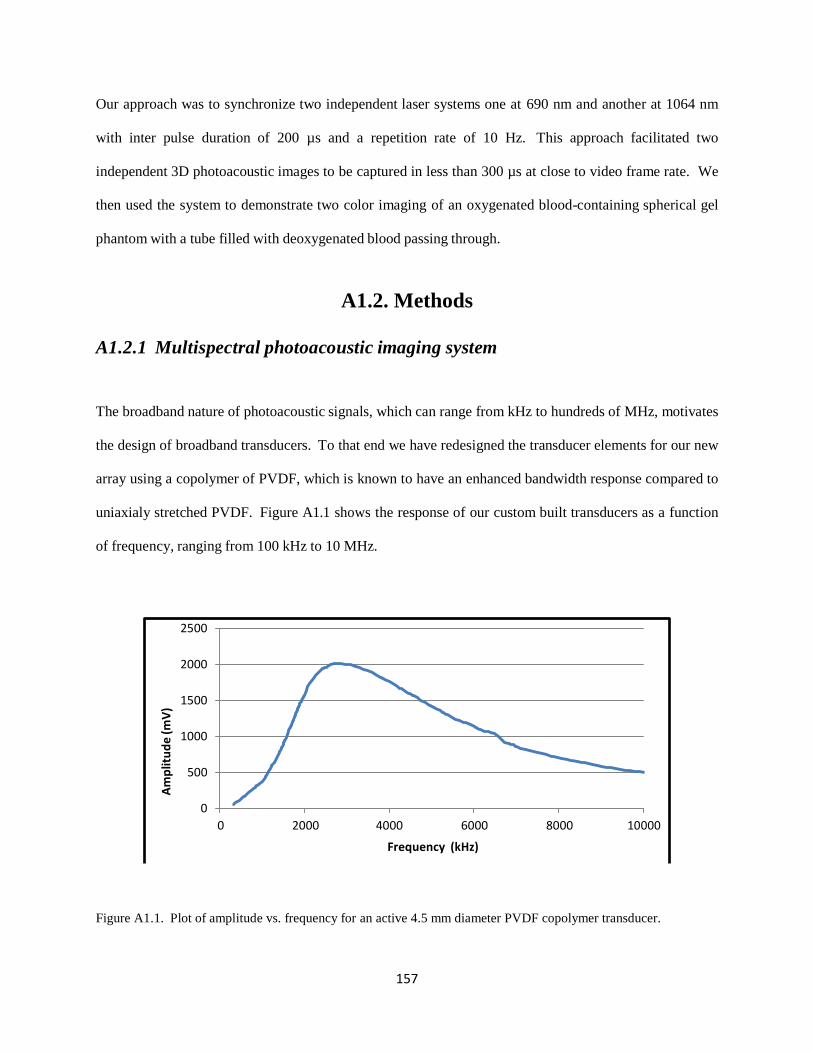
157
Am
plit
ud
e (m
V)
Our approach was to synchronize two independent laser systems one at 690 nm and another at 1064 nm
with inter pulse duration of 200 µs and a repetition rate of 10 Hz. This approach facilitated two
independent 3D photoacoustic images to be captured in less than 300 µs at close to video frame rate. We
then used the system to demonstrate two color imaging of an oxygenated blood-containing spherical gel
phantom with a tube filled with deoxygenated blood passing through.
A1.2. Methods
A1.2.1 Multispectral photoacoustic imaging system
The broadband nature of photoacoustic signals, which can range from kHz to hundreds of MHz, motivates
the design of broadband transducers. To that end we have redesigned the transducer elements for our new
array using a copolymer of PVDF, which is known to have an enhanced bandwidth response compared to
uniaxialy stretched PVDF. Figure A1.1 shows the response of our custom built transducers as a function
of frequency, ranging from 100 kHz to 10 MHz.
2500
2000
1500
1000
500
0
0 2000 4000 6000 8000 10000
Frequency (kHz)
Figure A1.1. Plot of amplitude vs. frequency for an active 4.5 mm diameter PVDF copolymer transducer.
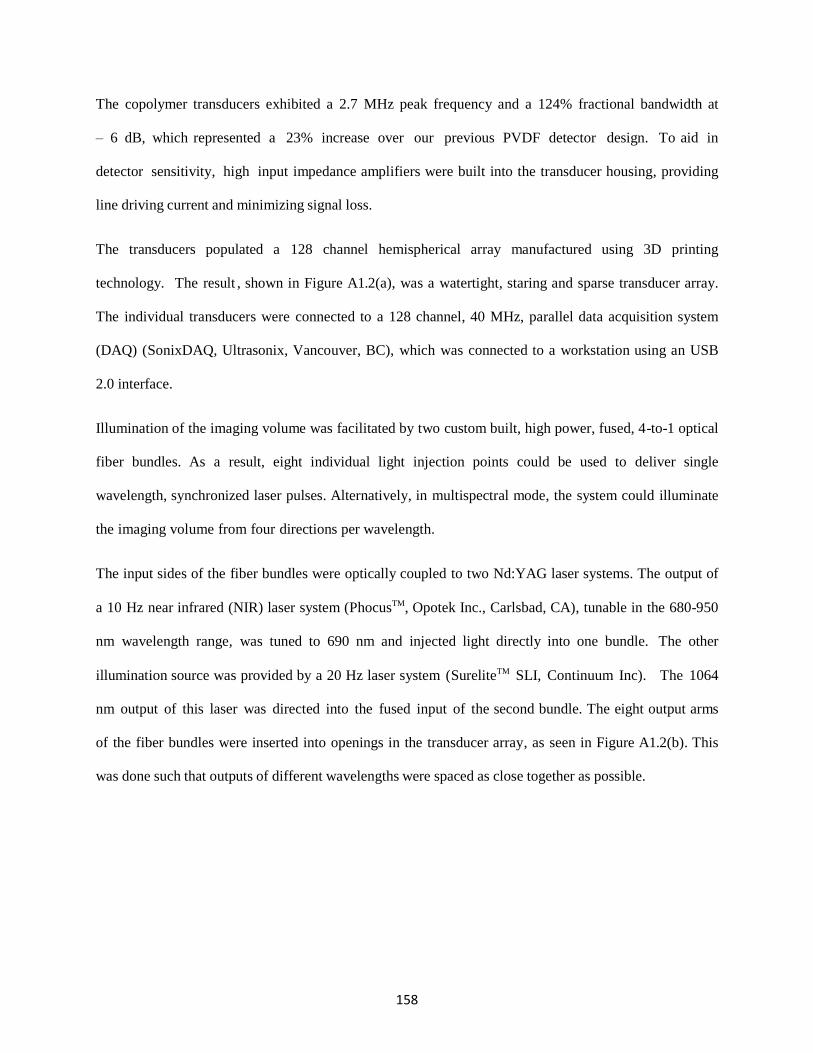
158
The copolymer transducers exhibited a 2.7 MHz peak frequency and a 124% fractional bandwidth at
– 6 dB, which represented a 23% increase over our previous PVDF detector design. To aid in
detector sensitivity, high input impedance amplifiers were built into the transducer housing, providing
line driving current and minimizing signal loss.
The transducers populated a 128 channel hemispherical array manufactured using 3D printing
technology. The result , shown in Figure A1.2(a), was a watertight, staring and sparse transducer array.
The individual transducers were connected to a 128 channel, 40 MHz, parallel data acquisition system
(DAQ) (SonixDAQ, Ultrasonix, Vancouver, BC), which was connected to a workstation using an USB
2.0 interface.
Illumination of the imaging volume was facilitated by two custom built, high power, fused, 4-to-1 optical
fiber bundles. As a result, eight individual light injection points could be used to deliver single
wavelength, synchronized laser pulses. Alternatively, in multispectral mode, the system could illuminate
the imaging volume from four directions per wavelength.
The input sides of the fiber bundles were optically coupled to two Nd:YAG laser systems. The output of
a 10 Hz near infrared (NIR) laser system (PhocusTM, Opotek Inc., Carlsbad, CA), tunable in the 680-950
nm wavelength range, was tuned to 690 nm and injected light directly into one bundle. The other
illumination source was provided by a 20 Hz laser system (SureliteTM SLI, Continuum Inc). The 1064
nm output of this laser was directed into the fused input of the second bundle. The eight output arms
of the fiber bundles were inserted into openings in the transducer array, as seen in Figure A1.2(b). This
was done such that outputs of different wavelengths were spaced as close together as possible.
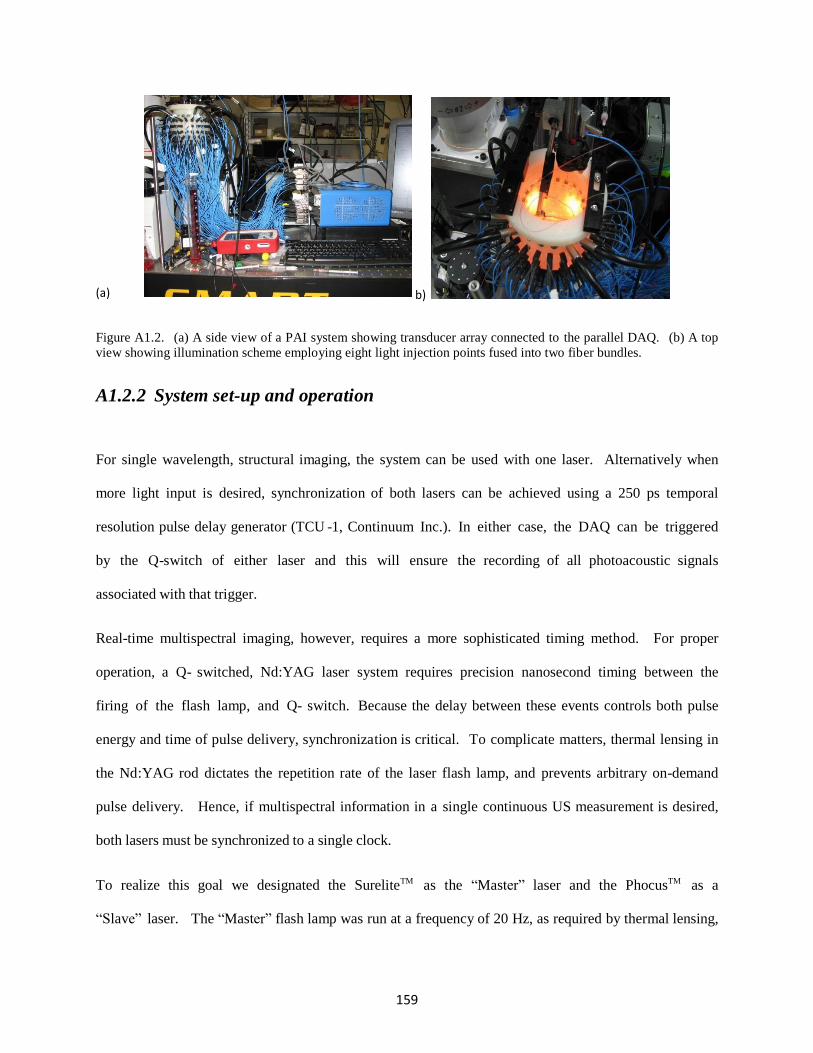
159
(a) b)
Figure A1.2. (a) A side view of a PAI system showing transducer array connected to the parallel DAQ. (b) A top
view showing illumination scheme employing eight light injection points fused into two fiber bundles.
A1.2.2 System set-up and operation
For single wavelength, structural imaging, the system can be used with one laser. Alternatively when
more light input is desired, synchronization of both lasers can be achieved using a 250 ps temporal
resolution pulse delay generator (TCU -1, Continuum Inc.). In either case, the DAQ can be triggered
by the Q-switch of either laser and this will ensure the recording of all photoacoustic signals
associated with that trigger.
Real-time multispectral imaging, however, requires a more sophisticated timing method. For proper
operation, a Q- switched, Nd:YAG laser system requires precision nanosecond timing between the
firing of the flash lamp, and Q- switch. Because the delay between these events controls both pulse
energy and time of pulse delivery, synchronization is critical. To complicate matters, thermal lensing in
the Nd:YAG rod dictates the repetition rate of the laser flash lamp, and prevents arbitrary on-demand
pulse delivery. Hence, if multispectral information in a single continuous US measurement is desired,
both lasers must be synchronized to a single clock.
To realize this goal we designated the SureliteTM as the “Master” laser and the PhocusTM as a
“Slave” laser. The “Master” flash lamp was run at a frequency of 20 Hz, as required by thermal lensing,
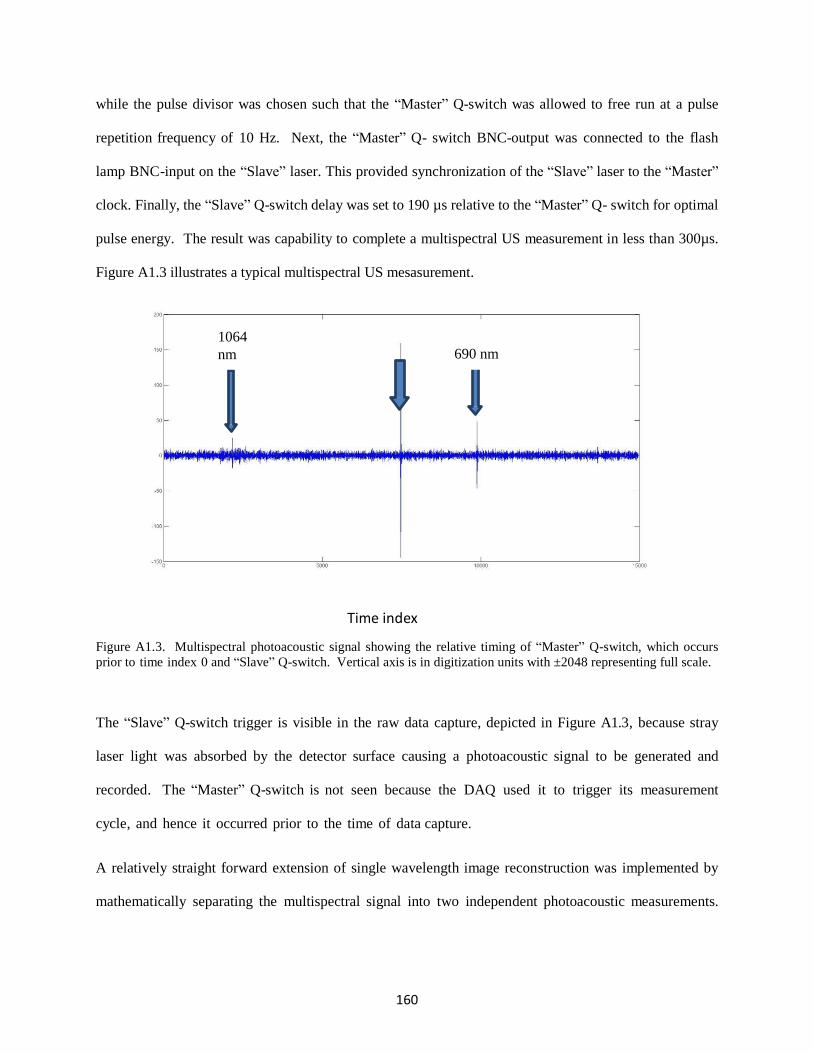
160
Slave
Q-switch
while the pulse divisor was chosen such that the “Master” Q-switch was allowed to free run at a pulse
repetition frequency of 10 Hz. Next, the “Master” Q- switch BNC-output was connected to the flash
lamp BNC-input on the “Slave” laser. This provided synchronization of the “Slave” laser to the “Master”
clock. Finally, the “Slave” Q-switch delay was set to 190 µs relative to the “Master” Q- switch for optimal
pulse energy. The result was capability to complete a multispectral US measurement in less than 300µs.
Figure A1.3 illustrates a typical multispectral US mesasurement.
Time index
Figure A1.3. Multispectral photoacoustic signal showing the relative timing of “Master” Q-switch, which occurs
prior to time index 0 and “Slave” Q-switch. Vertical axis is in digitization units with ±2048 representing full scale.
The “Slave” Q-switch trigger is visible in the raw data capture, depicted in Figure A1.3, because stray
laser light was absorbed by the detector surface causing a photoacoustic signal to be generated and
recorded. The “Master” Q-switch is not seen because the DAQ used it to trigger its measurement
cycle, and hence it occurred prior to the time of data capture.
A relatively straight forward extension of single wavelength image reconstruction was implemented by
mathematically separating the multispectral signal into two independent photoacoustic measurements.
1064
nm 690 nm
161
The separated data was then used to reconstruct images using the single wavelength image reconstruction
method as outlined in the next section.
A1.2.3 Image Reconstruction
Our model based 3D photoacoustic image reconstruction method has been described in previous
publications and hence only a general overview will be given here [3]. It should be noted that model based
techniques usually employ a combination of experimental and analytical elements, while our system
model is experimentally determined.
The reconstruction method operates on the principle of modeling imaging targets as ensembles of
individual omnidirectional photoacoustic point sources. The “quality” of our imaging operator, which
contains the complete system response to a point source in every voxel, is therefore highly dependent on
the uniformity of our point source signal. In the past we have used cleaved optical fiber, either coated or
submerged in optically absorbent material, to generate photoacoustic signals. While this produced signals
that were point-like, the zenith angle uniformity suffered. To improve the signal consistency as a function
of zenith angle, previous flat cleaved fiber, which produced signals of higher amplitude in the forward
direction, was replaced by a fiber whose tip has been machined to a hemisphere shape.
To produce an imaging operator for our system we experimentally captured the response of each
transducer channel to a robotically positioned photoacoustic point source. A LabVIEW (National
InstrumentsTM) controlled, SCARA robot (Model E2C351S-UL, Epson, Nagano, Japan) with fiber optic
point source attached to the effector, raster scanned the object space. At each voxel location the laser fired
a ~10 ns pulse into the fiber, and consequently, the point source generated an approximately
omnidirectional ultrasonic signal via the photoacoustic effect. The signal was measured by the transducer
array, captured and digitized by the DAQ and finally transferred to a workstation for analysis. Matlab®
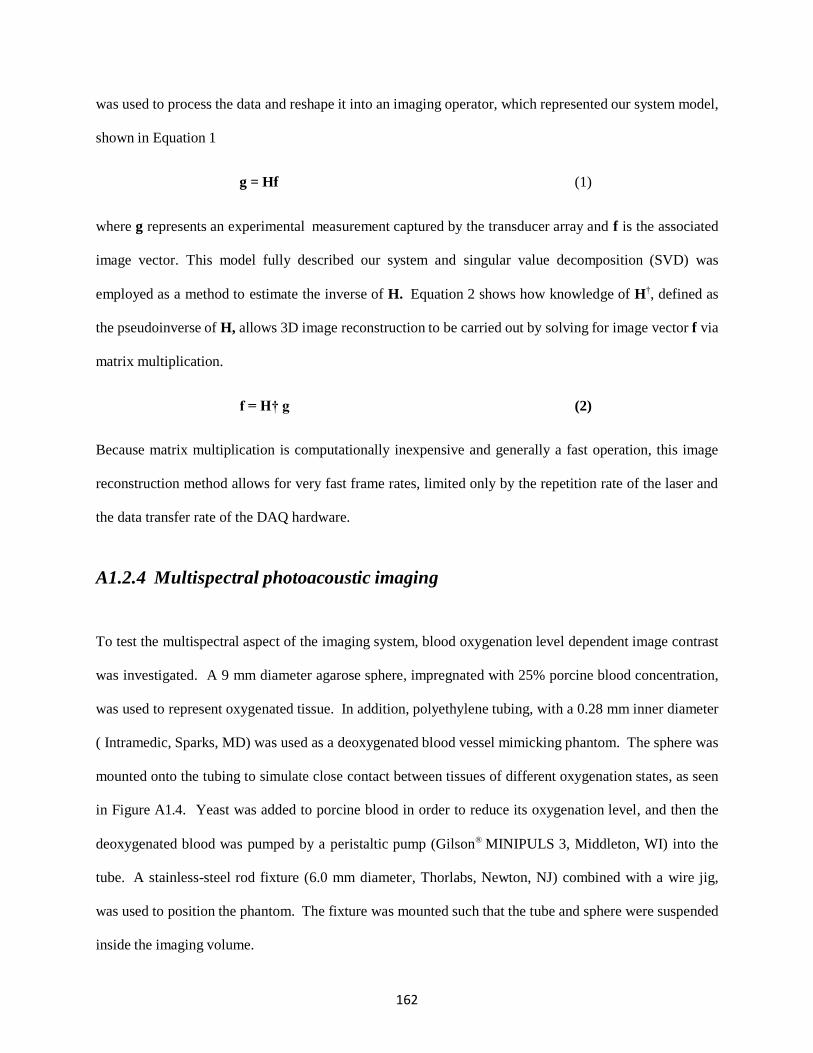
162
was used to process the data and reshape it into an imaging operator, which represented our system model,
shown in Equation 1
g = Hf (1)
where g represents an experimental measurement captured by the transducer array and f is the associated
image vector. This model fully described our system and singular value decomposition (SVD) was
employed as a method to estimate the inverse of H. Equation 2 shows how knowledge of H†, defined as
the pseudoinverse of H, allows 3D image reconstruction to be carried out by solving for image vector f via
matrix multiplication.
f = H† g (2)
Because matrix multiplication is computationally inexpensive and generally a fast operation, this image
reconstruction method allows for very fast frame rates, limited only by the repetition rate of the laser and
the data transfer rate of the DAQ hardware.
A1.2.4 Multispectral photoacoustic imaging
To test the multispectral aspect of the imaging system, blood oxygenation level dependent image contrast
was investigated. A 9 mm diameter agarose sphere, impregnated with 25% porcine blood concentration,
was used to represent oxygenated tissue. In addition, polyethylene tubing, with a 0.28 mm inner diameter
( Intramedic, Sparks, MD) was used as a deoxygenated blood vessel mimicking phantom. The sphere was
mounted onto the tubing to simulate close contact between tissues of different oxygenation states, as seen
in Figure A1.4. Yeast was added to porcine blood in order to reduce its oxygenation level, and then the
deoxygenated blood was pumped by a peristaltic pump (Gilson® MINIPULS 3, Middleton, WI) into the
tube. A stainless-steel rod fixture (6.0 mm diameter, Thorlabs, Newton, NJ) combined with a wire jig,
was used to position the phantom. The fixture was mounted such that the tube and sphere were suspended
inside the imaging volume.
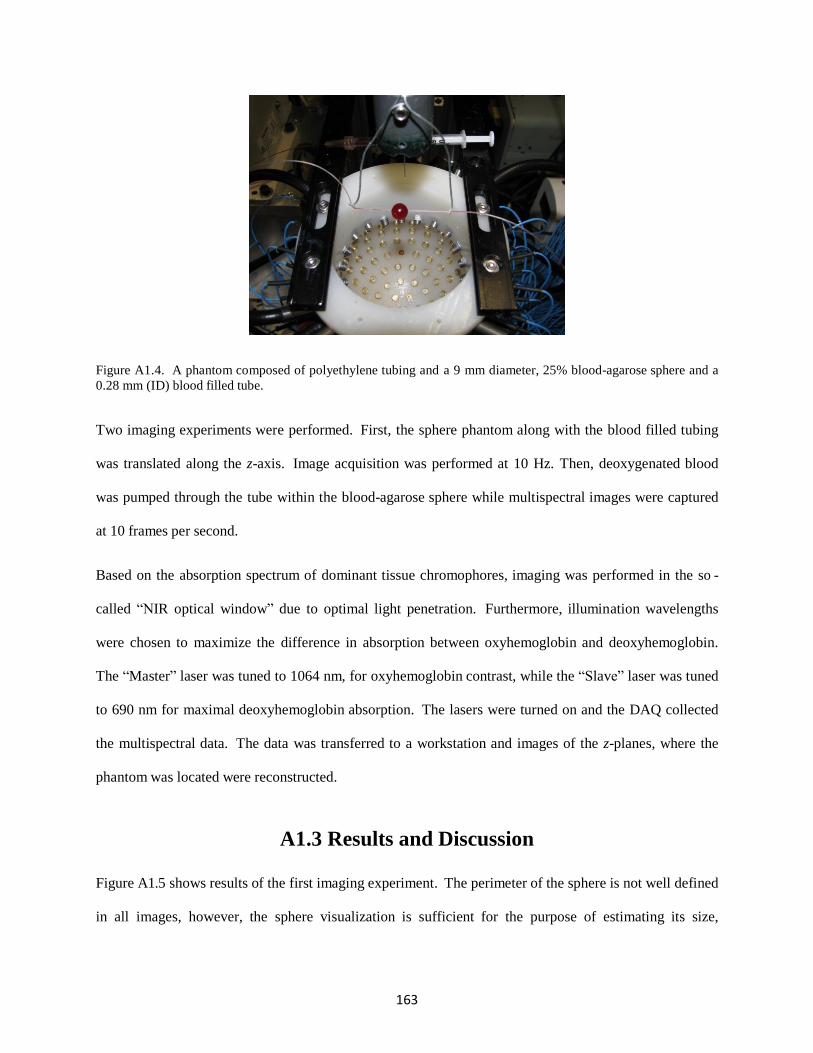
163
Figure A1.4. A phantom composed of polyethylene tubing and a 9 mm diameter, 25% blood-agarose sphere and a
0.28 mm (ID) blood filled tube.
Two imaging experiments were performed. First, the sphere phantom along with the blood filled tubing
was translated along the z-axis. Image acquisition was performed at 10 Hz. Then, deoxygenated blood
was pumped through the tube within the blood-agarose sphere while multispectral images were captured
at 10 frames per second.
Based on the absorption spectrum of dominant tissue chromophores, imaging was performed in the so -
called “NIR optical window” due to optimal light penetration. Furthermore, illumination wavelengths
were chosen to maximize the difference in absorption between oxyhemoglobin and deoxyhemoglobin.
The “Master” laser was tuned to 1064 nm, for oxyhemoglobin contrast, while the “Slave” laser was tuned
to 690 nm for maximal deoxyhemoglobin absorption. The lasers were turned on and the DAQ collected
the multispectral data. The data was transferred to a workstation and images of the z-planes, where the
phantom was located were reconstructed.
A1.3 Results and Discussion
Figure A1.5 shows results of the first imaging experiment. The perimeter of the sphere is not well defined
in all images, however, the sphere visualization is sufficient for the purpose of estimating its size,
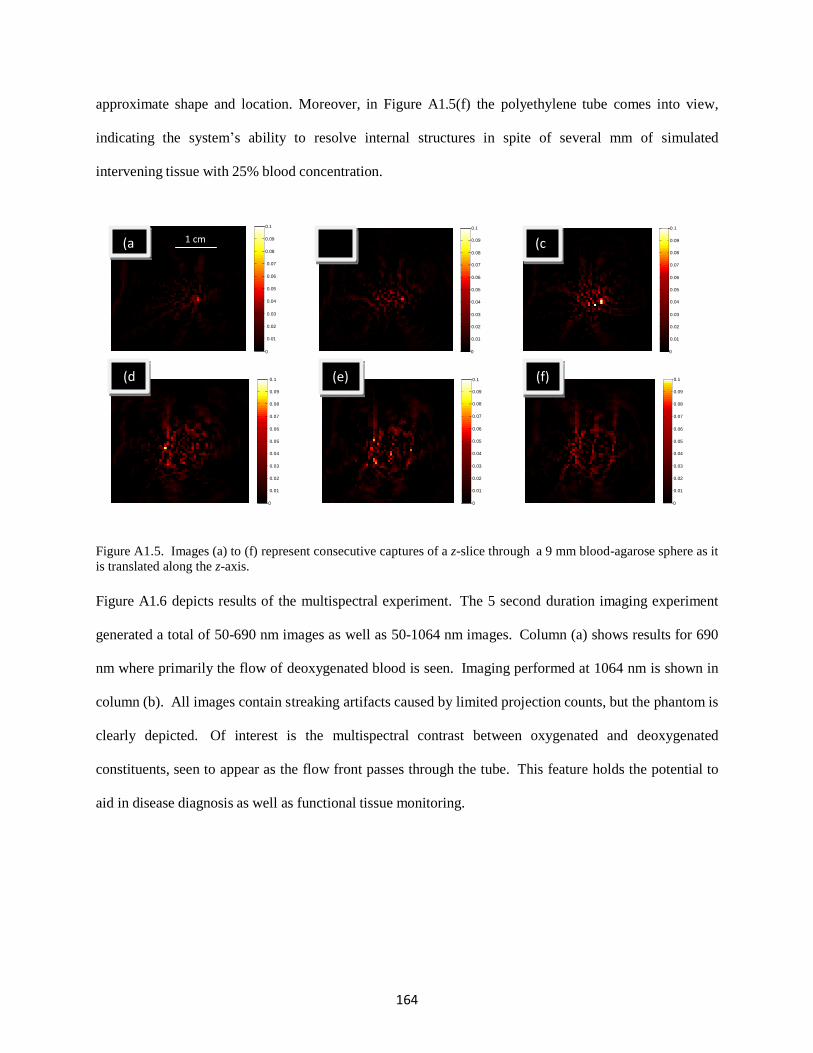
164
approximate shape and location. Moreover, in Figure A1.5(f) the polyethylene tube comes into view,
indicating the system’s ability to resolve internal structures in spite of several mm of simulated
intervening tissue with 25% blood concentration.
(a 1 cm
0.1
0.09
0.08
0.1
0.09 (c 0.08
0.1
0.09
0.08
0.07 0.07
0.07
0.06 0.06
0.06
0.05 0.05
0.05
0.04 0.04
0.04
0.03 0.03
0.03
0.02 0.02
0.02
0.01 0.01
0.01
0 0 0
(d 0.1
0.09
(e) 0.1
0.09
(f) 0.1
0.09
0.08
0.08
0.08
0.07
0.07
0.07
0.06
0.06
0.06
0.05
0.05
0.05
0.04
0.04
0.04
0.03
0.03
0.03
0.02
0.02
0.02
0.01
0.01
0.01
0 0 0
Figure A1.5. Images (a) to (f) represent consecutive captures of a z-slice through a 9 mm blood-agarose sphere as it
is translated along the z-axis.
Figure A1.6 depicts results of the multispectral experiment. The 5 second duration imaging experiment
generated a total of 50-690 nm images as well as 50-1064 nm images. Column (a) shows results for 690
nm where primarily the flow of deoxygenated blood is seen. Imaging performed at 1064 nm is shown in
column (b). All images contain streaking artifacts caused by limited projection counts, but the phantom is
clearly depicted. Of interest is the multispectral contrast between oxygenated and deoxygenated
constituents, seen to appear as the flow front passes through the tube. This feature holds the potential to
aid in disease diagnosis as well as functional tissue monitoring.
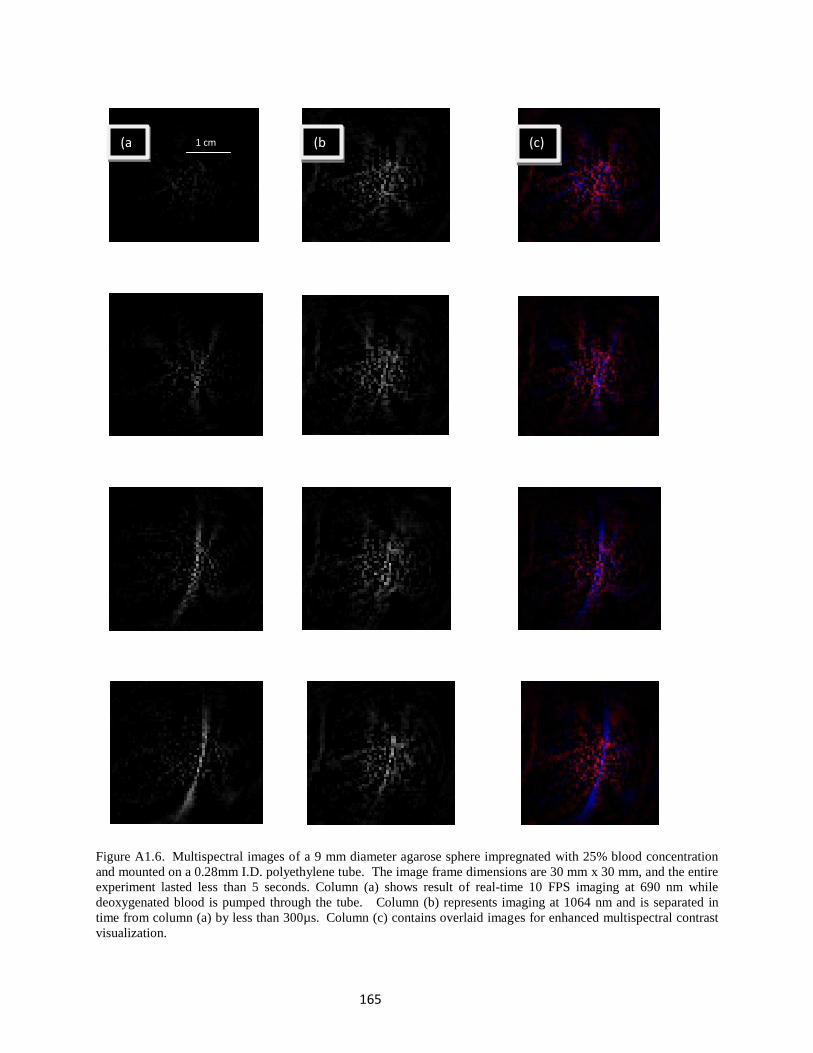
165
(a 1 cm (b (c)
Figure A1.6. Multispectral images of a 9 mm diameter agarose sphere impregnated with 25% blood concentration
and mounted on a 0.28mm I.D. polyethylene tube. The image frame dimensions are 30 mm x 30 mm, and the entire
experiment lasted less than 5 seconds. Column (a) shows result of real-time 10 FPS imaging at 690 nm while
deoxygenated blood is pumped through the tube. Column (b) represents imaging at 1064 nm and is separated in
time from column (a) by less than 300µs. Column (c) contains overlaid images for enhanced multispectral contrast
visualization.
166
A1.4 Conclusion
A 3D multispectral photoacoustic imaging system was built and tested. Real-time dual wavelength
imaging was performed on blood phantoms with different oxygenation states. Polyethylene tubing,
containing deoxygenated blood, was clearly visualized passing through a 9 mm gel sphere with 25%
blood concentration. Our images exhibit clear blood oxygen contrast. At 690 nm only the deoxygenated
blood was seen, while at 1064 nm primarily oxygenated blood was observed. The results demonstrate that
our system is capable of providing maps of blood at different oxygenation states non-invasively at high
speed and with mm-level resolution.
A1.5 Acknowledgements
Ivan Kosik was supported by the Translational Breast Cancer Research Unit (TBCRU) as well as The
University of Western Ontario (WGRS). Research funding was provided by the Canadian Foundation for
Innovation (CFI), the Natural Sciences and Engineering Research Council (NSERC), the Canadian
Institute for Health Research (CIHR), and the Lawson Health Research Institute (LHRI). MultiMagnetics
Inc. provided support with respect to the development of the data acquisition hardware.
A1.6 References
[1] Roumeliotis, M., Kosik I., and Carson, J. J. L.,"3D photoacoustic imaging using a staring-sparse array with 60 transducers", Proc. SPIE 8223, 82233F (2012).
[2] Xu, M. and Wang, L.V. “Photoacoustic imaging in biomedicine,” Rev. Sci. Instrum. 77, 041101 (2006). [3] Roumeliotis, M.B., Stodilka, R.Z., Anastasio, M.A., Ng, E. and Carson, J.J.L., "Singular value decomposition analysis of a photoacoustic imaging system and 3D imaging at 0.7 FPS," Opt. Express 19(14), 13405-13417 (2011).
167
Appendix 2: Combined 3D photoacoustic and 2D fluorescence
imaging of indocyanine green contrast agent flow
Citation:
Kosik I, Carson JJL, Program I, Health L, Joseph S. Combined 3D photoacoustic and 2D fluorescence
imaging of indocyanine green contrast agent flow. Proc SPIE. 2013;8581:1-8. doi:10.1117/12.2005269.
In Appendix 2, we used a custom built photoacoustic imaging system consisting of a 60-channel
transducer array, a 50 MHz data acquisition system, and an Nd:YAG pumped OPO laser, to perform
simultaneous photoacoustic and fluorescence imaging. A single 780 nm laser pulse generated both
ultrasound and fluorescence, enabling reconstruction of images for both modalities with near perfect
temporal co-registration. The result highlighted the ability of photoacoustic imaging to supplement
fluorescence data when optical scatter reduces fluorescence resolution beyond its useful range. This work
motivated the inclusion of fluorescence imaging during the lumpectomy evaluation procedure, which was
the main target of this doctoral study. Since it was found that a single laser pulse could deliver excitation
for both modalities, it seemed that fluorescence could be a convenient supplemental source of
information, particularly sensitive to the surface of the specimen. Unfortunately, the complexity of
implementing the iPAT system alone was found to be too great to add any further complication.
A2.1 Introduction
A2.1.1 Background
When short, pulsed laser light is absorbed by optically dense media, ultrasonic transients in the MHz
frequency range are created via the photoacoustic effect [1]. Provided that the stress and thermal
confinement conditions are met, sub- millimetre resolution is possible in images reconstructed from the
acoustic transients detected with transducers of sufficient bandwidth [2,3]. Photoacoustic images can be
created using a number of different reconstruction approaches such as back-projection algorithms, which
require explicit knowledge of the transducer location and orientation; and model-based algorithms that can
168
recover images utilizing the system response to a photoacoustic point source, in some cases without prior
knowledge of transducer location or orientation [4-8].
We have previously reported on a photoacoustic imaging (PAI) system that used a custom built
hemispherical ultrasound transducer array with 60 detectors and a staring and sparse geometry, combined
with an Nd:YAG pumped Optical Parametric Oscillator (OPO) laser system [9]. We were able to show an
improvement in real time 3D reconstruction capability compared to previous attempts [4]. We now report
on combining our 3D PAI system with a 2D fluorescence imaging system into a single co-registered
optical imaging modality. Single shot, dual modality functional imaging was performed on ICG
impregnated phantoms demonstrating the ability of the system to accurately reconstruct co-registered
fluorescence and photoacoustic images.
A2.1.2 Motivation
Resulting from the relatively low scatter and absorption of acoustic waves in tissue, PAI is effective at
much greater depths than any other optical imaging method. As a result, PAI complements other optical
imaging techniques, such as fluorescence imaging (FI), which may provide superior resolution and
contrast, but suffer from low depth penetration in turbid media. A number of attempts to marry the two
techniques have been demonstrated; however a common problem has been long image acquisition times
for PAI [10-12]. The difference between excitation and emission during FI allows a simple optical filter
system to separate the two signals, resulting in fluorescence images which exhibit extremely high contrast
against background. This can be very useful when visualization of contrast-enhanced vasculature, such as
near a tumour, is desired. However, when imaging behind other fluorescence sources, behind highly
absorbing or scattering tissue, or beyond a few millimetres deep, the resolution of FI rapidly degrades. On
the other hand PAI is much less affected by the optical properties of intervening tissue, and can accurately
reconstruct structural images of absorbers down to several centimetres. Real-time 3D PAI combined with
169
FI therefore holds the potential to provide superior visualization of tissue vasculature, as well as of
functional processes such as bolus tracking and perfusion.
A2.1.3 Objective and approach
We aimed to take advantage of the superior penetration depth of PAI and the high contrast capability of
FI, by combining the two modalities into a co-registered imaging system. To accomplish this aim we used
a 3D staring and sparse photoacoustic system capable of real-time 3D image reconstruction. For FI we
mounted a CCD camera above the photoacoustic system in such a way that real-time image co-registration
was possible by using a single laser pulse to generate images for both modalities.
A2.2 Methods
A2.2.1 Imaging System
The PAI system consisted of a custom built 60-channel transducer array connected to a 14 bit, 50 MHz
custom data acquisition system (DAQ128, MultiMagnetics Inc). The array featured a staring and sparse
hemispherical geometry, with cylindrical transducers arranged along 4 rungs. The hemispherical bowl
had an inside diameter of 86 mm. The front face of the each transducer was flush with the internal surface
of the bowl. The 4.5 mm diameter transducer elements had a center frequency of 2.6 MHz and a
bandwidth of 101% at -6 dB. The individual transducers were connected to the DAQ128, with custom
built anti-aliasing filters and amplifiers using coaxial cables and SMA connectors.
The principle component of the fluorescence imaging system was a Photometrics Cascade 12 bit CCD
camera. The camera featured a thermoelectrically cooled 0.5 Megapixel detector array. To prevent the
780 nm excitation light from damaging the CCD detector, as well as to enable image contrast, light
entering the camera was first filtered using an 830 nm narrow band optical filter (customized by Comar
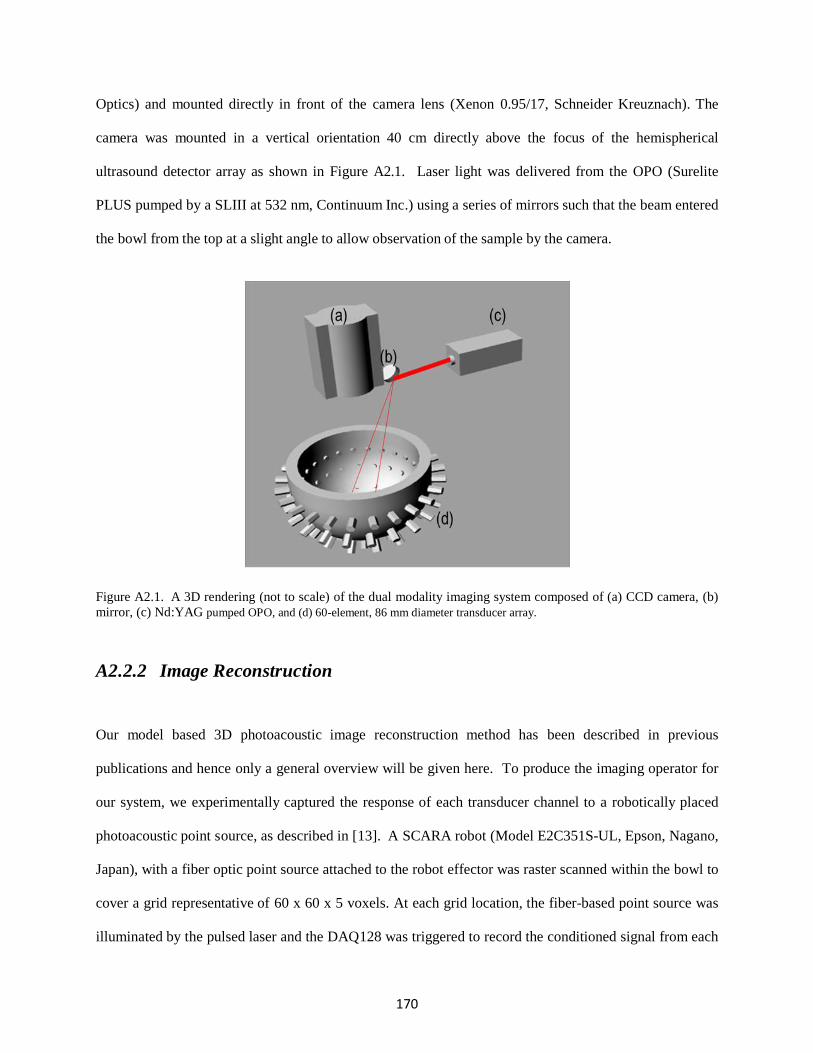
170
Optics) and mounted directly in front of the camera lens (Xenon 0.95/17, Schneider Kreuznach). The
camera was mounted in a vertical orientation 40 cm directly above the focus of the hemispherical
ultrasound detector array as shown in Figure A2.1. Laser light was delivered from the OPO (Surelite
PLUS pumped by a SLIII at 532 nm, Continuum Inc.) using a series of mirrors such that the beam entered
the bowl from the top at a slight angle to allow observation of the sample by the camera.
Figure A2.1. A 3D rendering (not to scale) of the dual modality imaging system composed of (a) CCD camera, (b)
mirror, (c) Nd:YAG pumped OPO, and (d) 60-element, 86 mm diameter transducer array.
A2.2.2 Image Reconstruction
Our model based 3D photoacoustic image reconstruction method has been described in previous
publications and hence only a general overview will be given here. To produce the imaging operator for
our system, we experimentally captured the response of each transducer channel to a robotically placed
photoacoustic point source, as described in [13]. A SCARA robot (Model E2C351S-UL, Epson, Nagano,
Japan), with a fiber optic point source attached to the robot effector was raster scanned within the bowl to
cover a grid representative of 60 x 60 x 5 voxels. At each grid location, the fiber-based point source was
illuminated by the pulsed laser and the DAQ128 was triggered to record the conditioned signal from each

171
transducer simultaneously. The data was then transferred from the DAQ128 to the workstation and stored
for processing in Matlab®. Figure A2.2 shows a subset of the imaging operator with panels showing
additional detail to visualize typical transducer responses.
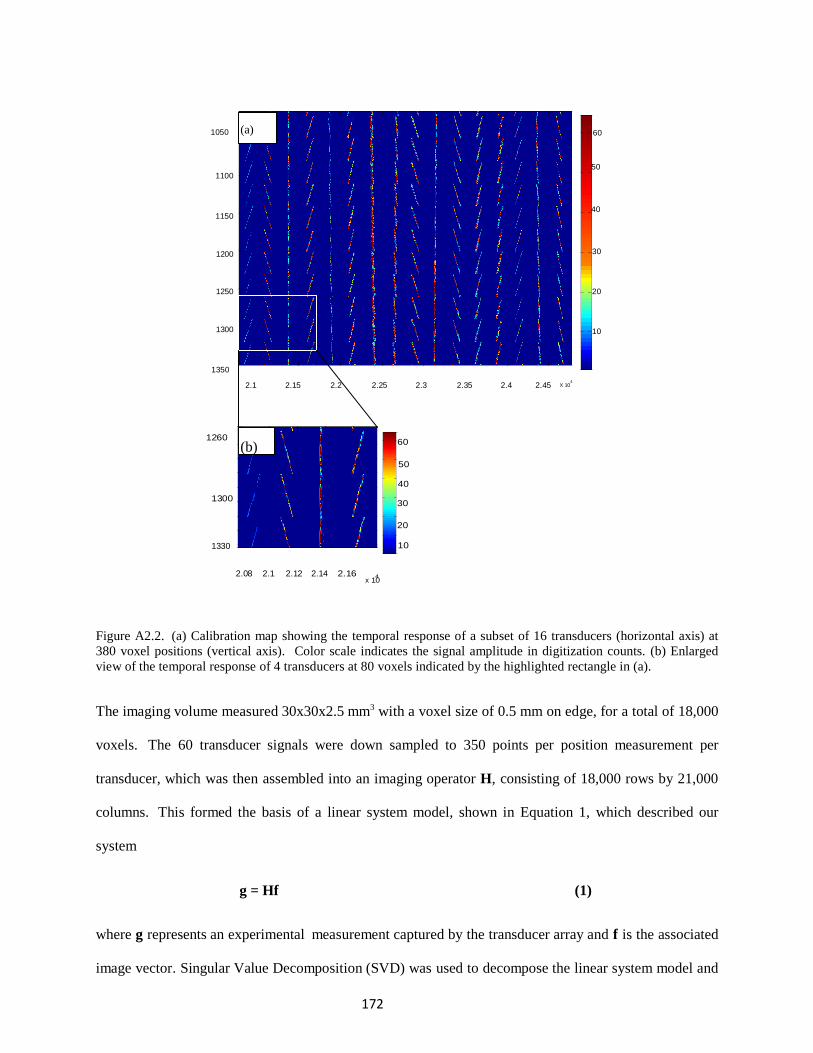
172
1050 (a) 60
50
1100
40 1150
1200 30
1250 20
1300 10
1350 2.1 2.15 2.2 2.25 2.3 2.35 2.4 2.45
4
X 10
1260
(b)
60
50
40
1300
30
20
1330 10
2.08 2.1 2.12 2.14 2.16
4 x 10
Figure A2.2. (a) Calibration map showing the temporal response of a subset of 16 transducers (horizontal axis) at
380 voxel positions (vertical axis). Color scale indicates the signal amplitude in digitization counts. (b) Enlarged
view of the temporal response of 4 transducers at 80 voxels indicated by the highlighted rectangle in (a).
The imaging volume measured 30x30x2.5 mm3 with a voxel size of 0.5 mm on edge, for a total of 18,000
voxels. The 60 transducer signals were down sampled to 350 points per position measurement per
transducer, which was then assembled into an imaging operator H, consisting of 18,000 rows by 21,000
columns. This formed the basis of a linear system model, shown in Equation 1, which described our
system
g = Hf (1)
where g represents an experimental measurement captured by the transducer array and f is the associated
image vector. Singular Value Decomposition (SVD) was used to decompose the linear system model and
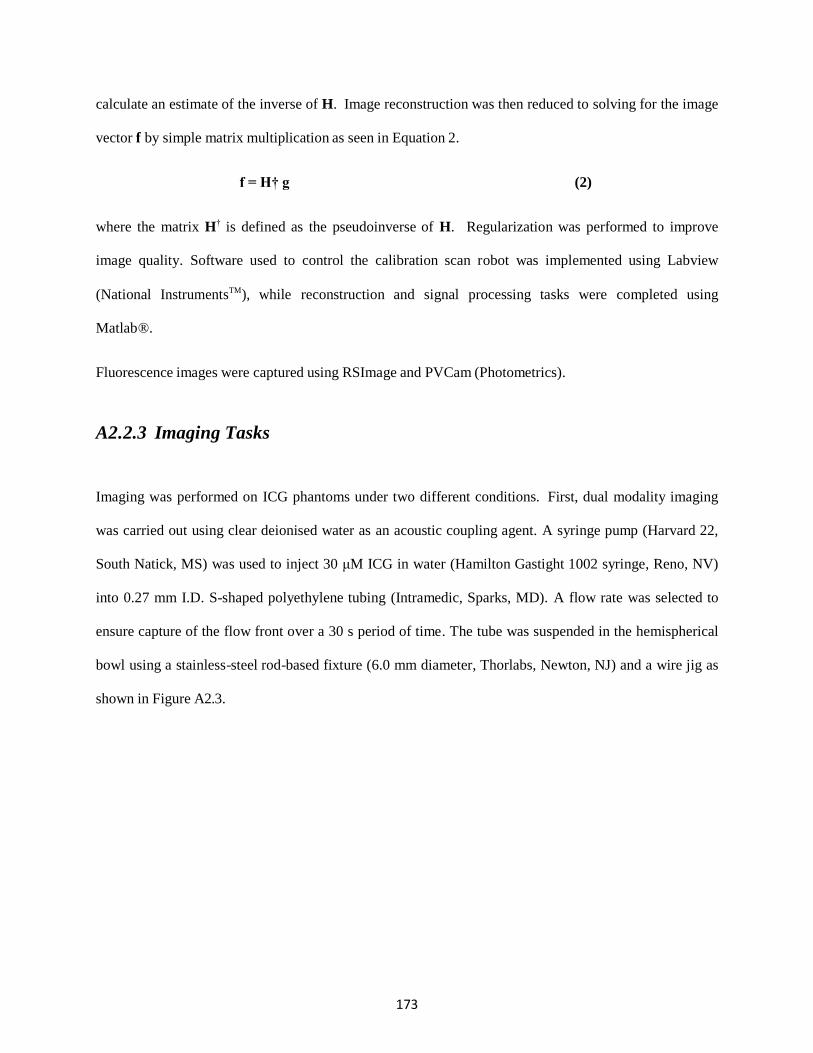
173
calculate an estimate of the inverse of H. Image reconstruction was then reduced to solving for the image
vector f by simple matrix multiplication as seen in Equation 2.
f = H† g (2)
where the matrix H† is defined as the pseudoinverse of H. Regularization was performed to improve
image quality. Software used to control the calibration scan robot was implemented using Labview
(National InstrumentsTM), while reconstruction and signal processing tasks were completed using
Matlab®.
Fluorescence images were captured using RSImage and PVCam (Photometrics).
A2.2.3 Imaging Tasks
Imaging was performed on ICG phantoms under two different conditions. First, dual modality imaging
was carried out using clear deionised water as an acoustic coupling agent. A syringe pump (Harvard 22,
South Natick, MS) was used to inject 30 μM ICG in water (Hamilton Gastight 1002 syringe, Reno, NV)
into 0.27 mm I.D. S-shaped polyethylene tubing (Intramedic, Sparks, MD). A flow rate was selected to
ensure capture of the flow front over a 30 s period of time. The tube was suspended in the hemispherical
bowl using a stainless-steel rod-based fixture (6.0 mm diameter, Thorlabs, Newton, NJ) and a wire jig as
shown in Figure A2.3.
174
Figure A2.3. Photograph of the hemispherical bowl holding the transducer array and showing the S-shaped tube
suspended by a wire jig. Here, the tube is filled with blood instead of ICG to aide in visualization of the tube in the
photograph.
The OPO, pumped by a Nd:YAG pulsed laser system, was used to illuminate the phantom at a
wavelength of 780 nm. Each laser pulse generated both fluorescence and photoacoustic signals, which
were captured simultaneously by the CCD camera and transducer array, respectively. Photoacoustic
images were reconstructed of the z-plane representative of the phantom location. For the second phantom,
light scattering conditions similar to biological tissue were used. The bowl was filled with a 1%
IntralipidTM in water solution. An agarose sphere, impregnated with 30 μM ICG and measuring 9 mm in
diameter, was mounted on a thin steel wire, approximately 0.2 mm in diameter, and suspended near the
center of the hemispherical bowl. The transducer array was filled such that the top of the ICG sphere was
10 mm below the surface of the IntralipidTM solution. Photoacoustic imaging was performed as described
above and images were reconstructed for five z-planes, each separated by 0.5 mm.
A2.3. Results
Figure A2.4(a) is a summary of PAI results for four representative time points during the ICG flow
through the S-shaped tube. Figure A2.4(b) shows the FI results corresponding to the images in Figure
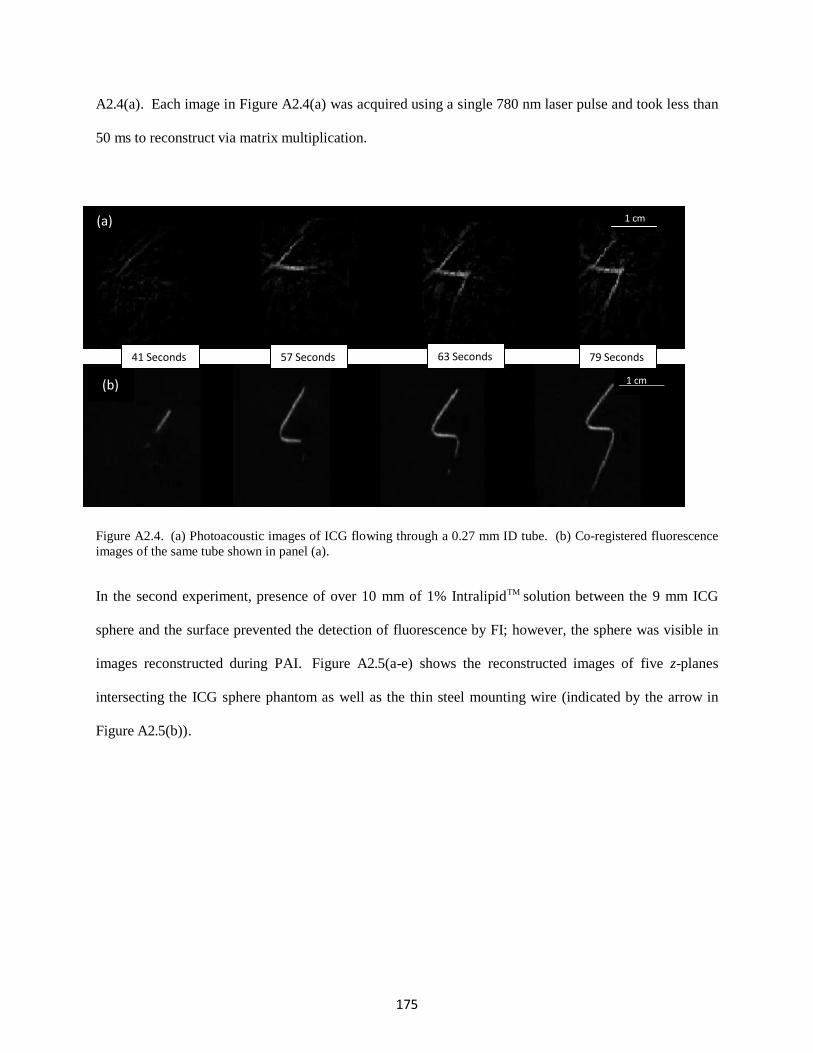
175
A2.4(a). Each image in Figure A2.4(a) was acquired using a single 780 nm laser pulse and took less than
50 ms to reconstruct via matrix multiplication.
(a) 1 cm
(b)
41 Seconds 57 Seconds 63 Seconds 79 Seconds
1 cm
Figure A2.4. (a) Photoacoustic images of ICG flowing through a 0.27 mm ID tube. (b) Co-registered fluorescence
images of the same tube shown in panel (a).
In the second experiment, presence of over 10 mm of 1% IntralipidTM solution between the 9 mm ICG
sphere and the surface prevented the detection of fluorescence by FI; however, the sphere was visible in
images reconstructed during PAI. Figure A2.5(a-e) shows the reconstructed images of five z-planes
intersecting the ICG sphere phantom as well as the thin steel mounting wire (indicated by the arrow in
Figure A2.5(b)).
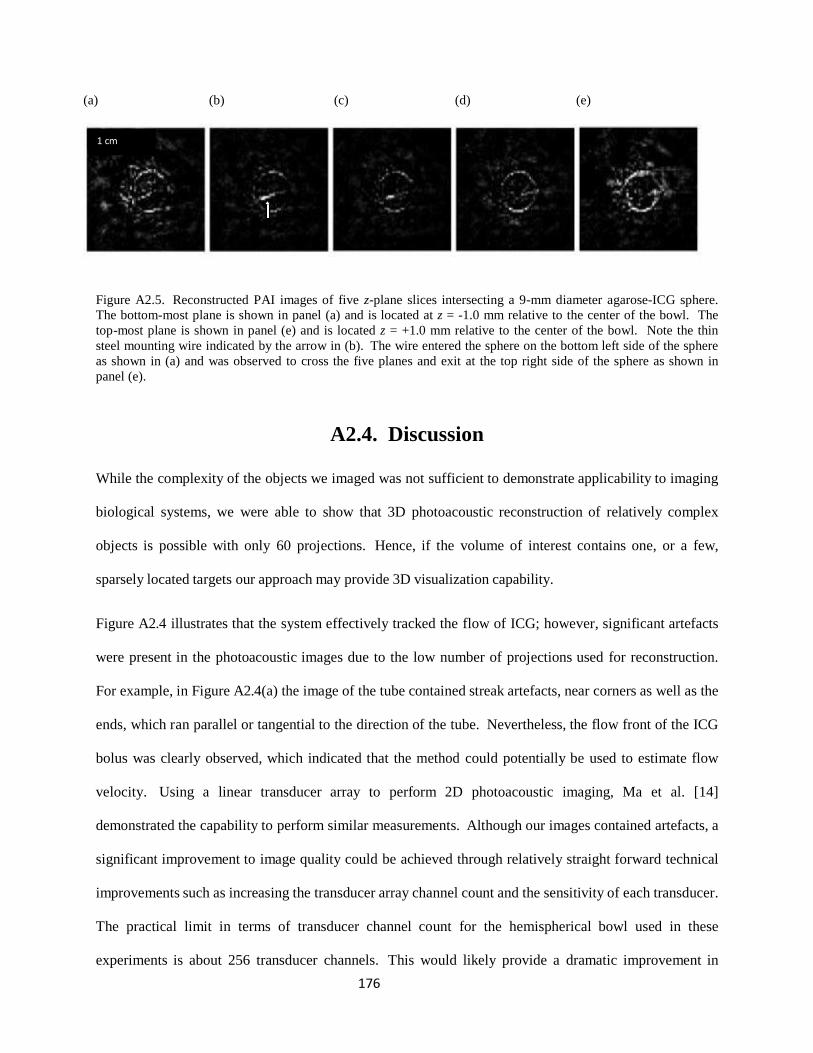
176
(a) (b) (c) (d) (e)
1 cm
Figure A2.5. Reconstructed PAI images of five z-plane slices intersecting a 9-mm diameter agarose-ICG sphere.
The bottom-most plane is shown in panel (a) and is located at z = -1.0 mm relative to the center of the bowl. The
top-most plane is shown in panel (e) and is located z = +1.0 mm relative to the center of the bowl. Note the thin
steel mounting wire indicated by the arrow in (b). The wire entered the sphere on the bottom left side of the sphere
as shown in (a) and was observed to cross the five planes and exit at the top right side of the sphere as shown in
panel (e).
A2.4. Discussion
While the complexity of the objects we imaged was not sufficient to demonstrate applicability to imaging
biological systems, we were able to show that 3D photoacoustic reconstruction of relatively complex
objects is possible with only 60 projections. Hence, if the volume of interest contains one, or a few,
sparsely located targets our approach may provide 3D visualization capability.
Figure A2.4 illustrates that the system effectively tracked the flow of ICG; however, significant artefacts
were present in the photoacoustic images due to the low number of projections used for reconstruction.
For example, in Figure A2.4(a) the image of the tube contained streak artefacts, near corners as well as the
ends, which ran parallel or tangential to the direction of the tube. Nevertheless, the flow front of the ICG
bolus was clearly observed, which indicated that the method could potentially be used to estimate flow
velocity. Using a linear transducer array to perform 2D photoacoustic imaging, Ma et al. [14]
demonstrated the capability to perform similar measurements. Although our images contained artefacts, a
significant improvement to image quality could be achieved through relatively straight forward technical
improvements such as increasing the transducer array channel count and the sensitivity of each transducer.
The practical limit in terms of transducer channel count for the hemispherical bowl used in these
experiments is about 256 transducer channels. This would likely provide a dramatic improvement in
170
image quality compared to the 60 channel transducer array. Gamelin et al. have shown excellent results
with a 2D PAI system incorporating 512 channels [15].
The 3D nature of our PAI imaging system is clearly observed in Figure A2.5. The figure shows the outer
perimeter of an ICG agarose sphere mounted on a thin steel wire. As one inspects the consecutive z-slice
images, the wire is seen to enter the sphere on the bottom and can be tracked as it makes its way up
through the vertical planes on an oblique angle. Finally, the wire is seen to exit the sphere on the top. Due
to the limited bandwidth of our transducers, photoacoustic signals due to thermoelastic expansion of the
entire sphere was not detected. Instead, higher frequency signals from the light absorption near the
surface of the sphere were detected and visualized in the reconstructed images. The perimeter of the
sphere was accurately reconstructed at a depth of 1 cm inside the turbid medium, where fluorescence was
not detected.
A2.5. Conclusion
A combined 3D photoacoustic and 2D fluorescence imaging system was constructed and calibrated.
Single shot co- registered PAI and FI was performed on ICG phantoms. Functional imaging was
demonstrated on a polyethylene tube phantom where the ICG bolus injection, including the flow front,
was clearly visualized. Three dimensional PAI of a 9 mm agarose-ICG sphere phantom mounted on a thin
steel wire and immersed in 1% IntralipidTM was successful at a depth where fluorescence was not detected.
Photoacoustic images were successfully captured with excellent temporal co-registration to fluorescence
images, demonstrating the benefits of supplementing fluorescence data with photoacoustic information,
when deep imaging is desired. Although artefacts were present in PAI images due to few available
projections and electronic noise, these limitations can be overcome with relatively straight forward
technological improvements.
171
A2.6. Acknowledgements
Ivan Kosik was supported by the Translational Breast Cancer Research Unit (TBCRU) as well as The
University of Western Ontario (WGRS). Research funding was provided by the Canadian Foundation for
Innovation (CFI), the Natural Sciences and Engineering Research Council (NSERC), the Canadian
Institute for Health Research (CIHR), and the Lawson Health Research Institute (LHRI). MultiMagnetics
Inc. provided support with respect to the development of the data acquisition hardware.
A2.7. References
[1] Sigrist, M.W. “Laser generation of acoustic waves in liquids and gases,” J. Appl. Phys. 60, R83 (1986).
[2] Xu, M. and Wang, L.V. “Photoacoustic imaging in biomedicine,” Rev. Sci. Instrum. 77, 041101 (2006).
[3] Ku, G., Wang, X. Stoica, G. and Wang, L.V. “Multiple-bandwidth photoacoustic tomography,” Phys. Med. Biol. 49(7), 1329-1338 (2004).
[4] Roumeliotis, M.B., Stodilka, R.Z., Anastasio, M.A., Ng, E. and Carson, J.J.L., "Singular value decomposition analysis of a photoacoustic imaging system and 3D imaging at 0.7 FPS," Opt. Express 19(14), 13405-13417 (2011).
[5] Carson, J.J.L., Roumeliotis, M., Chaudhary, G., Stodilka, R.Z., and Anastasio, M.A., “3D photoacoustic imaging,” Proc. SPIE 7750, 775009-1 (2010).
[6] Ephrat, P., Keenliside, L., Seabrook, A., Prato, F.S., & Carson, J.J.L., Three-dimensional photoacoustic imaging by sparse-array detection and iterative image reconstruction. J. Biomed. Opt. 13(5): 054052(2008).
[7] Ephrat, P., Roumeliotis, M., Prato F.S., and Carson, J.J.L., “Four-dimensional photoacoustic imaging of moving targets,” Opt. Express 16(26), 21570–21581 (2008).
[8] Roumeliotis, M., Stodilka, R.Z., Anastasio, M.A., Chaudhary, G., Al-Aabed, H., Ng, E., Immucci, A., and Carson, J.J.L., "Analysis of a photoacoustic imaging system by the crosstalk matrix and singular value decomposition," Opt. Express 18(11), 11406-11417 (2010).
[9] Roumeliotis, M., Kosik I., and Carson, J. J. L.,"3D photoacoustic imaging using a staring-sparse array with 60 transducers", Proc. SPIE 8223, 82233F (2012).
[10] Wang, B., Zhao, Q., Barkey, N.M., Morse, D.L., and Jiang, H.,“Photoacoustic tomography and fluorescence molecular tomography: A comparative study based on indocyanine green,” Med. Phys. 39(5), 2512-2517 (2012).
[11] Wang, L., Xie X., Oh, J.T., Li, M.L., Ku, G., Similache, S., Li C., and Stoica, G., "Combined Photoacoustic and Molecular Fluorescence Imaging In Vivo," Conf. Proc. IEEE Eng. Med. Biol. Soc. 1, 190-192 (2005).
[12] Wang, Y., Maslov, K.; Kim, C., Hu, S., Wang, L.V.; , "Integrated Photoacoustic and Fluorescence Confocal Microscopy," IEEE Trans. Biomed. Eng. 57(10), 2576-2578 (2010).
[13] Roumeliotis, M., Ephrat, P., Patrick, J. and Carson, J. J. L. , "Development and characterization of an omnidirectional photoacoustic point source for calibration of a staring 3D photoacoustic imaging system,"
172
Opt. Express 17(17), 15228-15238 (2009).
[14] Ma, S., Yang, S.,and Xing, D., “Photoacoustic imaging velocimetry for flow-field measurement,” Opt. Express 18(10), 9991-10000 (2010).
[15] Gamelin, J., Maurudis, A., Aguirre, A., Huang, F., Guo, P., Lihong V. Wang, and Zhu, Q., "A real-time photoacoustic tomography system for small animals," Opt. Express 17(13), 10489-10498 (2009)
169
Curriculum Vitae
IVAN KOSIK
EDUCATION
2011- 2017 Ph.D. Medical Biophysics, University of Western Ontario
2011 B.Sc. Honours Specialization in Medical Physics, University of Western Ontario
2006 B.Sc. Physics, University of Western Ontario
HONOURS & AWARDS
2016-2017 London Health Research Day (platform presentation winner)
2015-2016 Ontario Graduate Scholarship
Translational Breast Cancer Research Unit Traineeship
Western Graduate Research Scholarship
2014-2015 Translational Breast Cancer Research Unit Traineeship
CIHR STP CaRTT Scholarship
Western Graduate Research Scholarship
236 Ecclestone Dr
Brampton, Ontario, L6X 3P9
Cell: (647) 223-4826
Home: (905) 455-4505
Fax: (905) 455-4505
Ph.D. Candidate, Department of Medical Biophysics,
Western University. Contact: Lawson Health Research Institute 268
Grosvenor Street, Lab: F5-127, London, Ontario,
Canada, N6A 4V2, Lab: 519-646-6100 x64190
6937 Barrisdale Dr Mississauga, Ontario, L5N 2H5 Cell: (647) 223-4826 Home: (905) 816-9018 Fax: (905) 816-9018
170
2013-2014 Translational Breast Cancer Research Unit Traineeship
Western Graduate Research Scholarship
2012-2013 Translational Breast Cancer Research Unit Traineeship
Western Graduate Research Scholarship
2011-2012 Translational Breast Cancer Research Unit Traineeship
Western Graduate Research Scholarship
2010-2011 Faculty of Science Dean’s Honour List
2004-2005 Faculty of Science Dean’s Honour List
PUBLICATIONS
1. Wong, P., Kosik, I., Raess, A., & J.J.L. Carson. Objective Assessment and Design
Improvement of a Staring, Sparse Transducer Array by the Spatial Crosstalk Matrix for
3D Photoacoustic Tomography. PLOS ONE 10(4): e0124759 (2015) [Published]
2. Kosik, I., & J.J.L. Carson. Real-time multispectral 3-D photoacoustic imaging of
blood phantoms. Proc. SPIE 8581: 85811V-1-85811V-8 (2013) - [Published]
3. Kosik, I., & J.J.L. Carson. Combined 3D photoacoustic and 2D fluorescence imaging
of indocyanine green contrast agent flow. Proc. SPIE 8581: 858143-1-858143-8 (2013) -
[Published]
4. Wong, P., Kosik, I., & J.J.L. Carson. Dynamic contrast enhanced 3D photoacoustic
imaging. Proc. SPIE 8581: 858152-1-858152-6 (2013) - [Published]
5. Tavakolian, P., Kosik, I., Chamson-Reig, A., St. Lawrence, K., & J.J.L. Carson.
Potential for photoacoustic imaging of the neonatal brain. Proc. SPIE 8581: 858147-1-
858147-6 (2013) - [Published]
6. Tavakolian, P., Todd, R., Kosik, I., Chamson-Reig, A., Vasefi, F., St. Lawrence, K.,
& J.J.L. Carson. Development of a neonatal skull phantom for photoacoustic
imaging. Proc. SPIE 8581: 858146-1-858146-6 (2013) - [Published]
7. Roumeliotis, M., Kosik, I., & J.J.L. Carson. 3D photoacoustic imaging using a staring-
sparse array with 60 transducers. Proc. SPIE 8223: 82233F-1-82233F-6 (2012) -
[Published]
PRESENTATIONS
1. Comparison of breast tumour assessment by photoacoustic tomography, magnetic resonance
imaging and pathology. CSHRF, Winnipeg, June 2017.
171
2. Comparison of breast tumour size by photoacoustic tomography, magnetic resonance imaging
and pathology. London Health Research Day, London, March, 2017 (Platform presentation)
3. Intraoperative photoacoustic imaging of breast cancer. Oncology Research and Education
Day, London, June, 2016. (Platform presentation)
4. Intraoperative breast lumpectomy imaging with dedicated photoacoustic tomography system.
London Health Research Day, London, March, 2016
5. Photoacoustic imaging system for breast lumpectomy characterization. Imaging Network of
Ontario, London, March, 2015.
6. Photoacoustic imaging system for breast lumpectomy characterization. London Health
Research Day, London, March, 2015 (Platform presentation)
7. Hand-held real-time multispectral photoacoustic imaging of blood oxygen saturation
Oncology Research and Education Day, London, June, 2014.
8. Hand-held real-time multispectral photoacoustic imaging of blood oxygen saturation. London
Health Research Day, London, March, 2014.
9. Real-time 3D photoacoustic imaging. Artimino Ultrasound Conference, Muskoka, June, 2013.
(Platform presentation)
10. Combined 3D photoacoustic and 2D fluorescence imaging of indocyanine green contrast
agent flow. London Health Research Day, London, March, 2012.
11. 3D photoacoustic imaging using a staring-sparse array with 60 transducers. London Health
Research Day, London, March, 2013.
12. Real-time multispectral 3-D photoacoustic imaging of blood phantoms. SPIE Photonics
West, San Francisco, February 2013. (Platform presentation)

172
WORK EXPERIENCE
2002 –present Director
Superior Assembly Inc.
Founder of company with recent expansion into small production run, biomedical
device manufacturing with contract to major University
long standing (10 years) contracts to major retailers for their bicycle assembly
and warranty service
Managed all aspects of business including recruitment, training, customer
service, accounting, research and development
Developed and expanded the business, through recruitment and training,
resulting in an autonomous operation
May 2011 – Summer Student
September 2011 Lawson Health Research Institute
Performing biomedical research in imaging department
Troubleshooting complicated computer interface devices
Working independently and as part of a team
February - Supervisor
September 2001 Statistics Canada: Federal Government of Canada
Supervisor at a call centre working for the 2001 Canada Census project
Responsible for standardized testing, interviewing, and hiring of call centre
phone operators
Gained valuable experience by training a group of 35 operators in classroom
setting
Responsible for day-to-day scheduling and supervision of operators, handling of
difficult callers and situations Collected and organized statistical data and maintained efficient communication
of new developments in a dynamic environment
Explained the importance of statistical research to concerned citizens
Copyright © 2022 FDOKUMEN