Pheromone-mediated upwind flight of male gypsy moths, Lymantria dispar, in a forest
Upload
independentCategory
view
1download
0
Physiological Entomology (1991) 16, 507-521
Pheromone-mediated upwind fight of male gypsy moths, Lymantriu dispar, in a forest
MARK A . WILLIS, JOHN MURLIS" and R I N G T. C A R D E Department of Entomology, University of Massachusetts, Amherst, Massachusetts, U.S.A.
Abstract. Lymantria dispar L. males flying upwind in a pheromone plume in a forest were video-recorded at 2.5, 10 and 20 m from the source of pheromone. Males flew slower and steered more across the wind as they approached the source. In concert, their ground speed decreased and track angles increased. In contrast to these changes, their drift angles were fairly constant and the transverse component of image flow, above and/or below the moths eyes, showed almost no change. The inter-turn duration (time between sequential turns), a temporal aspect of the male flight manoeuvres, showed a consistent but relatively small increase as the distance from the source increased. The flight tracks narrowed as the males approached close (2.5 m) to the source. Because of unpredicted correlations between physical variables (i.e. temperature, wind velocity) and the distance from the source, we used principal components analysis to generate a set of completely independent variables. Greater than 90% of the variability in the data could be explained by four principal factors which corresponded well with known relationships in the flight manoeuvres. All four of these factors showed a significant regression against distance to the source. Although uncon- trolled factors such as temperature and wind velocity may have con- tributed to changes in flight behaviour, recent data indicate that, in addition to concentration, certain temporal and spatial characteristics (i.e. burst period, burst return period) of plumes in wind vary system- atically with distance from the source. We propose that L.dispar males might adjust their flight manoeuvres in response to these changes.
Key words. Lymantria dispar, gypsy moth, flight orientation, pheromone, counterturning, anemotaxis.
* Present address: Department of the Environment, London, S.W.l.
Correspondence: Dr Mark A. Willis, Arizona Research Laboratories, Division of Neurobiology, 61 1 Gould- Simpson Building, University of Arizona, Tucson, Arizona 85721, U.S.A.
507

508 M. A . Willis, J . Murlis and R. T. Card6
Introduction
A majority of the studies of odour-mediated flight orientation behaviour in insects have used the upwind flight of male moths to a source of female pheromone as a model (Kennedy, 1986; Baker, 1988). Almost all of these observations have been made in laboratory wind tunnels. Such laboratory studies have formed the basis of our current understanding of the mechanisms involved in this complex behaviour. The most widely accepted model of this behaviour involves the integration of two main mechanisms. First, on contact with pheromone in Right, a positive optomotor anemotaxis is initiated (Kennedy & Marsh, 1974), whereby a pheromone-stimulated male turns into the wind and steers his course at an angle to the wind using visual flow field cues. The resultant track angles appear to be set internally at some ‘preferred’ value which the males maintain by altering the courses steered in response to changing optomotor feedback (Marsh et al., 1978; Willis & CardC, 1990). Second, an hypothesized central nervous system (CNS) oscillator triggers alternating turns back- and-forth across the wind line with a metronome- like temporal regularity (Baker et al., 1984; Willis & Baker, 1988). In at least one species this counterturning appears to be temporally modulated by pheromone concentration (Grapholita rnolesta: Kuenen & Baker, 1982b). Additionally, males require the intermittent pheromone stimulation shown to be present in a plume (Murlis et al., 1990) to maintain upwind progress (Baker et al., 1985). An homogeneous cloud of pheromone does not provide the ap- propriate stimuli for sustained upwind flight (Kennedy et al . , 1980, 1981; Willis & Baker, 1984).
Although much information has come from wind tunnel studies, very few quantitative studies of flight orientation have been pursued in the field. Murlis et al. (1982) found that Spodoptera littoralis males in the field fly much like other species do in a wind tunnel, systematically altering their air speed to compensate for changes in wind velocity and thereby maintaining their ground speed within a fairly narrow range. Males in that study were recorded from 5 m downwind until they failed to make further upwind progress, usually within 0.5 m of the source.
David et al. (1983) found that gypsy moth
males flying towards a pheromone source over an open field usually are able to maintain contact with an odour plume, despite shifts in wind direction. Males that lost pheromone contact when the wind shifted commonly were able to relocate it by utilizing cross wind casting. Casting behaviour had previously been described from wind tunnel experiments (Marsh et al . , 1978), but its significance was not fully appre- ciated prior to these field observations. David et al. (1983) recorded males from c. 15 m away from the source until source contact, but a detailed analysis of flight manoeuvres was not undertaken.
We have recorded gypsy moth, Lymantria dispar L., males flying upwind in a pheromone plume at 2.5, 10 and 20 m from the source within their natural forest habitat. A detailed analysis was performed of how the males altered their flight manoeuvres as they flew at different distances from the source. A companion study (Murlis et al . , 1990) quantifying the structure of plumes in the forest and an open field allows us to propose that, as well as adapting their flight to uncontrolled variables (wind velocity and temperature), L. dispar males may alter their flight manoeuvres in response to systematic changes in plume structure.
Materials and Methods
Insects. Our L.dispar colony was based on a monthly delivery of egg masses from the USDA APHIS Methods Development Center, Otis Air National Guard Base Massachusetts. The larvae were reared on a wheat germ diet (Bell et ul . , 1981) and maintained at 24°C and 60-70% r.h. on a LD 16:8 h photo cycle. Pupae were separ- ated according to sex, Males were allowed to emerge, and were maintained at 24°C and ap- proximately 80% r.h. on an LD cycle. The light cycle of the environmental chamber was adjusted to match natural photoperiod (c. LD 1 6 3 h). Males were 1-4 days old and used c. 6-10 h into the photophase.
Pheromone. The synthetic pheromone source used to elicit upwind flight in Ldispar males was (7R,8S)-cis-epoxy-2-methyloctadecane [( +)-disparlure] (Bier1 et al., 1970; CardC et al., 1977). A 1 pg/pl solution of (+)-disparlure in hexane was formulated gravimetrically. The pheromone source used to attract males in the

Pheromone-mediated upwind Bight in a forest 509
forest consisted of 2 pg of (+)&parlure applied to a 0.7 cm diameter filter paper (Whatman No. 1) disk, which was then aerated in a fume hood for 1 h prior to use in the field. In order to ensure that the males were not pre-exposed to pheromone, the source was carried to the field site in an air-tight glass container.
Study site and data recording. Video recordings of Ldispar flight tracks were made during July and August 1987, in a pine (Pinus resinosa) plantation with a nearly closed canopy and devoid of understorey vegetation. The study site was on the Prescott Peninsula of the Quabbin Reservoir Forest, Massachusetts (Elkinton et a[., 1987).
The flight tracks of the males were recorded in plan view from above using a Sony AVC- 3450 video camera connected to a Sony SLO 340 video recorder. The camera was positioned c. 5 m above the forest floor pointing down at a c. 10 X 10m clearing (free of trees but within the canopy) in the forest. This positioning re- sulted in a field of view of 5.5 X 4.0 m. A 6 X 10 m area of the floor of the clearing was covered by a white cloth painted with a randomly ar- ranged pattern of 18 cm diameter red dots (David, 1982). A red filter was placed over the lens of the video camera, rendering the dots nearly white in black-and-white video recordings and thus facilitated later tracing of flight tracks. In all cases the males were flying through the same clearing in the forest. Therefore, they had approximately the same visual surround whether they were 2.5, 10 or 20 m away from the pheromone source.
Wind velocity and direction were determined using a bubble machine as described in David et al. (1983). A wheel consisting of wire loops (5 cm diameter) rotated into a trough of liquid detergent (Palmolive) and then in front of a small electric fan. The resulting bubbles were c . 5 cm in diameter, nearly neutrally buoyant, sensitive to wind, and lasted up to 3 min before bursting. An operating bubble machine was always present in the field of view of the camera.
Experimental procedures. Males were trans- ported from the laboratory to the forest in screen boxes open to sunlight and air circulation. Males were selected randomly from these boxes and loaded individually into 6 X 6 X 6 cm screen cages and allowed to acclimate to the forest conditions for 30-60 min prior to testing.
Flight 2.5 m from the source was recorded by
placing the pheromone source in the centre of the field of view of the camera. The filter paper disk containing pheromone was pierced with an insect pin mounted in a cork on the tip of a 1.5 m tall metal post. An ion generator (Murlis et al., 1990) was mounted with ring stand clamps 0.5 m below the pheromone source. A continu- ously operating bubble machine was mounted on a 1 m tall metal post, 1.5 rn away from the post holding the pheromone source. The release cages were held in the pheromone plume by using the continuously generated bubbles as an indicator of wind direction. Males took flight and flew from the hand-held release cages c. 1 m before entering the field of view of the camera. No male was recorded more than once. Once a male had successfully flown to the source, he was captured with an insect net and destroyed.
Recording flights 10 and 20 m from the source required a different method from that used to record the 2.5 m flights. We established two concentric paths with radii of 10 and 20 m measured from the centre of the field of view. A pheromone source was mounted on the tip of a 1.5 m tall metal pole with a bubble machine mounted 0.5 m below it on the same pole. This pole was hand-carried and positioned around one or the other of these two concentric paths. Using the bubbles from this hand-carried bubble machine and those emitted from the fixed bubble machine, the pheromone plume was ‘aimed’ towards the field of view of the camera. Males were released only when bubbles from both bubble machines, and hence pheromone, were moving through the field of view simultaneously.
Due to the highly variable wind velocities and directions which characterize the forest (Elkinton et al., 1987, it was not possible to record flights from every distance each day that observations were made. Prevailing wind direction and vel- ocity determined where the pheromone source was placed, and the distance from which the males approached the source.
Data analysis. Flight tracks of individual males were re-recorded onto a Sony SVM-1010 motion analyser for improved resolution, and played back frame-by-frame on a 41 cm Panasonic WV-5470 black-and-white video monitor. The consecutive locations of each male were marked every 1/15 s on transparent acetate sheets placed on the screen of the monitor. Each coordinate was digitized using an X/Y digitizer pad (Apple Graphics Tablet) and these coordinates for each

510 M. A. Willis, J . Murlis and R. T. Card&
track were then stored on disk (Apple IIe) for later analysis.
The wind velocity and direction during each flight track were determined by tracking the bubbles in the field of view at the same time as the moth. These values were essential for the correct determination of the air speed of the male and the relationship between the flight track of the moths and the instantaneous wind direction. Due of placement of the pheromone source and bubble machines, bubbles were at approximately the same altitude as the males and usually less than 50 cm away from them laterally. We never observed a moth colliding with a bubble.
The stored flight tracks were analysed with a computer program (BASIC) developed to measure and calculate pertinent track parameters (Charlton et al., 1991). Parameters measured from each movement vector (the vector between each pair of consecutive locations) were: ground speed (velocity along the track), track angle (angle of the movement vector with respect to due upwind, O"), and net velocity (velocity of net movement toward the source). The triangle of velocities method (Marsh et al., 1978) was used to determine how the males altered their flight manoeuvres as they flew in different wind speeds. Using values measured from the track (ground speed and track angle) and the wind speeds measured from drifting bubbles, the males' course angles, drift angles and air speeds were calculated. The transverse and longitudinal components of visual image flow were computed from the triangle of velocities data for each vector using a method outlined by Ludlow (1984) and David (1986). Parameters measured manu- ally from each flight track were: inter-reversal distance (track width) (Card6 & Hagaman, 1979; Kuenen & Baker, 1982b), and the inter-reversal duration (time between the apices of consecu- tive turns).
Due to the potential confounding factors posed by the uncontrollable conditions which charac- terize field experiments, track data were first analysed using a principal-component analy- sis (PCA) of the correlation matrix among all of the variables (Harris, 1975), followed by a varimax rotation of the extracted factors. Using a correlation matrix of the original track and physical variables (i.e. air speed, track angle, etc.), PCA generates completely orthogonal (i.e. independent) principal component factors
that are linear combinations of the original thir- teen (Table 1). The 'loading' of the original track variables on these new independent vari- ables represents the percentage of variation of the original variable explained by the particular principal factor. A maximal factor loading of 1.0 (or -1.0) would indicate that 100% of the variation of a given variable (track angle, air speed, etc.) can be explained by that principal factor. (A + or - factor loading indicates a positive or negative correlation between the particular variable and the other variables that load on that factor.)
In our data over 90% of the total variation observed (in all original variables) can be ex- plained by a few (four; PC Factors I-IV) vari- ables. Independent interpretations of these four variables were obtained by using an arbitrary factor loading cut-off value of 0.7 (Table 1). Although PCA has not been used previously to examine flight track data, it offered a valid and effective way to deal with the uncontrollable variables that make results from field exper- iments difficult to analyse. With PCA we gen- erated a new set of variables (the factors) which are independent from each other. Independent variables are difficult to obtain otherwise, but necessary for most standard statistical analyses. These new factors have no inherent biological meaning of their own, and thus it is the responsi- bility of the authors to interpret the PCA in a biologically relevant way.
To determine if there were any significant effects due to distance, a stepwise multiple regression of the factor scores of each individual male on the orthogonal factors extracted via PCA, using the distance from the source as the dependent variable, was performed. All statisti- cal analyses were performed using SAS-PCTM ( 1988).
Results
The tracks of males flying in the plume close to the source (Fig. 1) were typical of the zigzagging flight observed in the wind tunnel studies of other species of moths. Although the tracks change in some minor aspects, males flying at 10 and 20 m (Fig. 1) continue to manoeuvre in ways that generate a zigzagging upwind flight track.
We discovered during the analyses that, for
Pheromone-mediated upwind flight in a forest 51 1
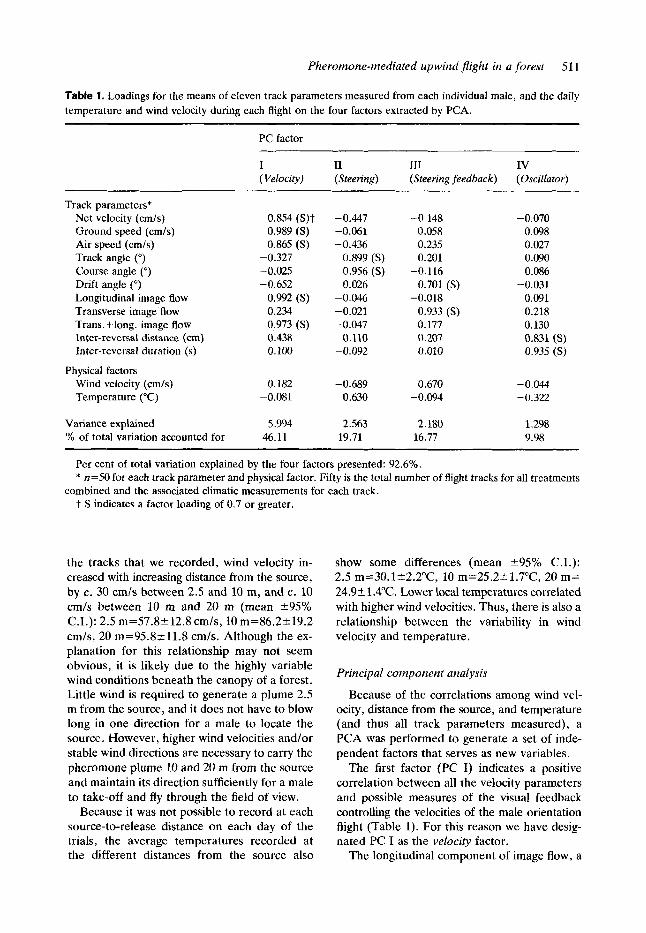
Table 1. Loadings for the means of eleven track parameters measured from each individual male, and the daily temperature and wind velocity during each flight on the four factors extracted by PCA.
PC factor ~ _ _ _ _ ~
I I1 I11 IV (Velocity) (Steering) (Steering feedback) (Oscillator)
Track parameters* Net velocity (cm/s) Ground speed (cm/s) Air speed (cm/s) Track angle (") Course angle (") Drift angle (") Longitudinal image flow Transverse image Row Trans. +long. image Row Inter-reversal distance (cm) Inter-reversal duration (s)
Wind velocity (cm/s) Temperature ("C)
Variance explained % of total variation accounted for
Physical factors
0.854 (S)t 0.989 (S) 0.865 (S)
-0.327 -0.025 -0.652
0.992 (S) 0.234 0.973 (S) 0.438 0. loo
0.182 -0.081
5.994 46.11
-0.447 -0.061 -0.436
0.899 (S) 0.956 (S) 0.026
-0.046 -0.021 -0.047
0.110 -0.092
-0.689 0.630
2.563 19.71
-0.148 0.058 0.235 0.201
4 . 1 16 0.701 ( S )
-0.018 0.933 (S) 0.177 0.207 0.010
0.670 -0.094
2.180 16.77
-0.070 0.098 0.027 0.090 0.086
-0.031 0.091 0.218 0.130 0.831 (S) 0.935 (S)
-0.044 -0.322
1.298 9.98
~ ~ ~~ ~~
Per cent of total variation explained by the four factors presented: 92.6%. * n=50 for each track parameter and physical factor. Fifty is the total number of flight tracks for all treatments
t S indicates a factor loading of 0.7 or greater. combined and the associated climatic measurements for each track.
the tracks that we recorded, wind velocity in- creased with increasing distance from the source, by c . 30 cmls between 2.5 and 10 m, and c . 10 cm/s between 10 m and 20 m (mean i95% C.I.): 2.5 m=57.8+12.8 cmls, 10 m=86.2219.2 cm/s, 20 m=95.8+11.8 cm/s. Although the ex- planation for this relationship may not seem obvious, it is likely due to the highly variable wind conditions beneath the canopy of a forest. Little wind is required to generate a plume 2.5 m from the source, and it does not have to blow long in one direction for a male to locate the source. However, higher wind velocities and/or stable wind directions are necessary to carry the pheromone plume 10 and 20 m from the source and maintain its direction sufficiently for a male to take-off and fly through the field of view.
Because it was not possible to record at each source-to-release distance on each day of the trials, the average temperatures recorded at the different distances from the source also
show some differences (mean ?95% C.I.): 2.5 m=30.1i2.2"C, 10 m=25.2+-1.7"C, 20 m= 24.9k 1.4"C. Lower local temperatures correlated with higher wind velocities. Thus, there is also a relationship between the variability in wind velocity and temperature.
Principal component analysis
Because of the correlations among wind vel- ocity, distance from the source, and temperature (and thus all track parameters measured), a PCA was performed to generate a set of inde- pendent factors that serves as new variables.
The first factor (PC I) indicates a positive correlation between all the velocity parameters and possible measures of the visual feedback controlling the velocities of the male orientation flight (Table 1). For this reason we have desig- nated PC I as the velocity factor.
The longitudinal component of image flow, a

512 M . A. Willis. .I. Murlis and R. T. Card.4
2.5 m
Source . ...
10 m from
Source
20 m from
Fig. 1. Typical flight tracks of L.dispar males flying upwind at three different distances from a source of female sex pheromone. In this figure the wind is blowing from top to bottom. Dots along the flight tracks indicate the position of the male every 1/15 s. Note that all tracks are displayed at the same scale.
measure of the optomotor feedback controlling the velocity output of the male, loaded strongly and positively on velocity. The variable transverse + longitudinal image flow also loaded strongly on velocity, but this reflects only the influence of the longitudinal component. The transverse component of image flow showed only a slight loading on velocity (Table 1). So, the factor velocity reflects the velocity output of the males in flight and the optomotor feedback controlling this output. The variables loading on velocity are largely independent of those loading on the other components (i.e. they do not load strongly on other factors), with the exception of the negatively loading drift angle and a relatively weak positive loading of the inter-reversal dis-
tance. Note that the wind velocity variable does not load strongly on velocity.
The track parameter variables loading on PC I1 and PC I11 load independently on each, but some relationship may be indicated by the wind velocity variable loading fairly strongly on both (Table 1). Since the two most strongly loading track parameter variables are course angle steered by the males and its resultant track angle, we have designated PC I1 the steering factor. The negative loading of the wind velocity variable on steering is a reflection of the negative correlation between course angle and wind vel- ocity. The relatively weak loading of the air speed, net velocity and wind velocity on steering reflects the known effects of these parameters (Marsh et al . , 1978) on courses steered and resulting track angles. The temperature variable loaded positively on steering and showed only weak loading on the other factors.
Drift angle, transverse image flow and wind velocity are the only varisbles that load strongly on PC 111. Thus, we designated PC I11 the steering feedback factor since it appears to reflect the optomotor feedback information which has been proposed to control steering during upwind flight. Again, consistent with wind tunnel studies (Willis & CardC, 1990), the loading of wind velocity on steering feedback indicates that there is a positive correlation between wind velocity and steering.
Inter-reversal distance and inter-reversal duration are the only track parameters measured that load on PC IV, and the inter-reversal duration loaded only on PC IV. This lends support to the hypothesis that the internal counterturn oscillator, if present, operates in- dependently of other manoeuvres made by the males in flight. We designated PC 1V the oscil- lator factor. The strong positive loading of both inter-reversal distance and inter-reversal duration on oscillator indicates a positive relationship between these two parameters.
Multiple regression analysis
A stepwise multiple regression analysis per- formed using each individual's factor scores on each of these four factors (Le. velocity, steering, etc.) indicated that the combination of the four factors, as well as a stepwise progression, de- monstrated a significant regression (P<0.05) on distance from the source (Table 2). This indicates

Pheromone-mediated upwind flight in a forest 513
Table 2. Partial R2 values derived from a stepwise multiple regression; where the factor scores of individual males on each factor (velocity, steering, ctc.) were regressed against the distancc from the source.
Step Factor* Partial R2 Probability that R 0 . 0 5 ~~
Steering (PC 11) 0.484 0.0001 Velocity (PC I) 0.112 0.0007 Steering feedback (PC 111) 0.041 0.027 Oscillator (PC 1V) 0.035 0.034
Total R2 for analysis=0.673 with P<CO.D.5. * n=50 in all cases.
that a statistically significant amount of the vari- ation in the individual's loadings on all four factors could be explained by the distance they were from the source when the track parameter variables were measured. The steering factor showed the strongest regression on distance, accounting for much of the cumulative R2. The velocity factor accounted for the next largest proportion of the cumulative R2, with steering feedback and oscillator making relatively little contribution to the final cumulative R2. These results are important in that they demonstrate that those variables loading strongly on the steering and velocity factors were significantly affected by the distance from the source at which they were recorded. But, the steering feedback and oscillator factors were affected in a statistically significant but relatively minor way.
Effects of distance from the source on flight manoeuvres
All of the flight track parameters loading on the velocity factor showed a consistent increase the further males were from the source when their flights were recorded (Fig. 2). A similar trend has been reported for the ground speed, air speed and net velocity of G.molesta and L. dispar males responding to pheromone sources of increasing concentration in wind tunnels (Kuenen & Baker, 1982b; Charlton etal., 1991). The longitudinal component of image flow in- creases consistently as the distance from the source increases (Fig. 2 ) . A possible relationship between the longitudinal image flow as a feed- back to ground speed is indicated by the simi- larity between the response of these two variables (Fig. 2 ) the closer to the source the males were
recorded. The values of the transverse + longi- tudinal image flow showed the same response as the longitudinal component alone (Fig. 2). Because the transverse component was little changed (Fig. S), this response can be attributed almost entirely to the change in the longitudinal component.
Those track parameters loading on the steerzng factor increased on average as the males were recorded closer to the source. Males steered their course angles, on average, progressively more across the wind line the closer to the source they were recorded (Fig. 3). The resultant track angles were also oriented more cross wind the closer the males approached the source
04 I 0 2.5 10 20
DISTANCE FROM SOURCE (m)
Fig. 2. The mean flight track parameters (?95% (2.1.) which Ioadcd on the velocrty factor at the three dis- tances from the source at which the Right tracks were recorded. Each mean plotted is surrounded by its 95% confidence interval (k), but in all cases the intervals are so small that the symbol obscures them. A, Air speed; 0 , transverse + longitudinal image flow; 0, ground speed; A , longitudinal image flow; m, net velocity.

514 M . A. Willis, J . Murlis and R. T. Card6
'"1
0 0 2.5 10 20
DISTANCE FROM SOURCE (m)
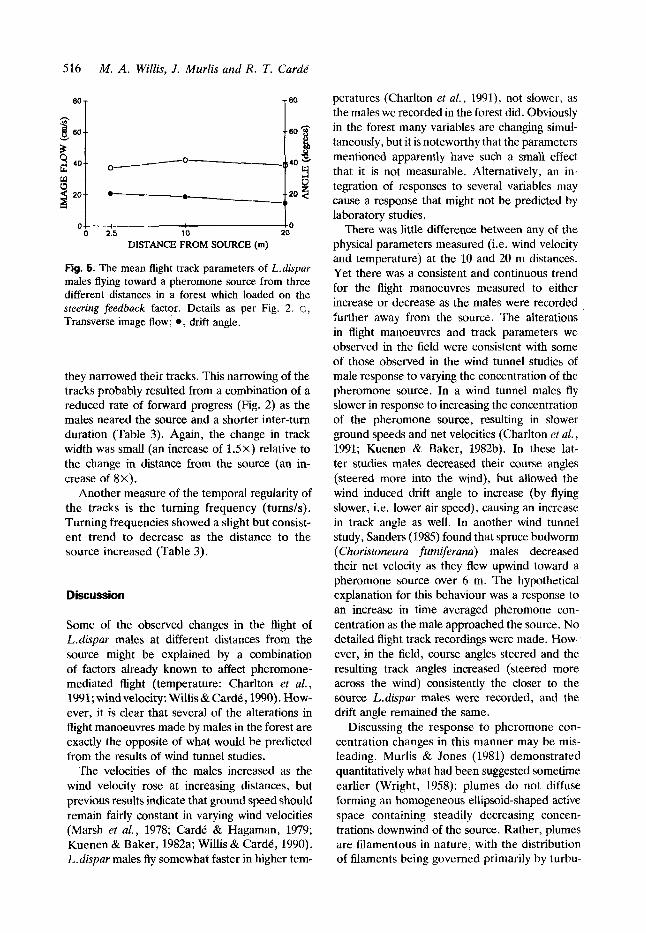
Fig. 3. The mean flight track parameters of L.dispar males flying toward a pheromone source from three different distances in a forest which loaded on the steering factor. Details as per Fig. 2. A , Track angle; e, course angle.
(Fig. 3). The frequency distribution of the track angles of males flying 2.5 m from the source was the typical bimodal distribution observed from L.dispar and other moth species in the wind tunnel (Fig. 4A). Of the individuals that were pooled to generate this distribution, 93% showed the same bimodal distribution. This bimodal dis- tribution became less pronounced as the distance from the source increased (Fig. 4A). Of the individuals pooled at 10 and 20 m from the source, 39% and 50%, respectively, had bimodal track angle distributions. Those individuals that did not have bimodal track angle distributions showed no well-defined peaks in the distributions of their angles. Due to smaller numbers of turns per'track, the number of vectors was not large enough to indicate any bias in the distribution of some individual males.
The course angles steered by the males were also distributed bimodally at 2.5 m from the source (Fig. 4B). As the distance from the source increased the males steered their course more into the wind, resulting in a monomodal distri- bution centred on zero degrees (due upwind). The frequency distributions of the course angles of individual males were as described for the track angles.
Relatively slight changes in the track par- ameters loading on the steering feedback factor were observed (Fig. 5). The result of the males altering their air speed flown and course angles steered was to maintain their drift angles at a fairly constant value, on average, at all distances measured (Fig. 5). Since the drift angle is the difference between the track and course angles it shows a bimodal frequency distribution similar to that of the track angles at 2.5 m from the source (Fig. 4C). Even though the drift angles did nar- row, there was a small but consistent dip at 0" at all distances recorded (Fiz. 4C). The transverse component of image flow showed little change at any of the distances recorded (Fig. 5). Males may be using the transverse component of image flow as the visual feedback necessary to maintain their drift angles within an acceptable range for upwind progress.
Track parameters loading on the oscillator factor did not show a consistent relationship with distance from the source. The inter-turn duratibns increased consistently as the distance from the source increased. But this increase was small (an increase of 1.8X) relative to the increase in dis- tance from the source (an increase of 8X) (Table 3). The track width (inter-reversal distances) showed little change between 20 and 10 m from the source (Table 3), but as the males got closer
Table 3. Means (295% C.I.) of track parameten of Ldispar rnalcs in pheromone-mediated upwind flight 2.5, 10 and 20 m from a pheromone source.
~~ ~ ~
Distance from source (m) n
2.5 15 10 21 20 14
~
Inter-turn Turn Inter-reversal duration frequency distance (s) (turnsls) ( 4
0.37k0.02 (198) 2.0120.06 44.525.3 0.30*0.01 (309)* 2.93 20.09 34.122.6
0.4020.05 (96) 2.0020.13 43.528.5
* Numbers in parentheses are the total number (n) of inter-turn intervals or turns measured at that par- ticular treatment.

Pheromone-mediated upwind jlight in a forest 515
T' I'
0 E E 2 0 2 3 -ud 0
r/)
516 M. A. Willis, J . Murlis and R. T. Carde
1 T"
CO 0 2.5 10 20
DISTANCE FROM SOURCE (m)
Fig. 5. The mean flight track parameters of L.dispar males flying toward a pheromone source from three different distances in a forest which loaded on the steering feedback factor. Details as per Fig. 2. 0, Transverse image flow; @, drift angle.
they narrowed their tracks. This narrowing of the tracks probably resulted from a combination of a reduced rate of forward progress (Fig. 2) as the males neared the source and a shorter inter-turn duration (Table 3). Again, the change in track width was small (an increase of 1 . 5 ~ ) relative to the change in distance from the source (an in- crease of 8 ~ ) .
Another measure of the temporal regularity of the tracks is the turning frequency (turns/s). Turning frequencies showed a slight but consist- ent trend to decrease as the distance to the source increased (Table 3).
Discussion
Some of the observed changes in the flight of L.dispar males at different distances from the source might be explained by a combination of factors already known to affect pheromone- mediated flight (temperature: Charlton et ul., 1991; windvelocity: Willis & Card6,1990). How- ever, it is clear that several of the alterations in flight manoeuvres made by males in the forest are exactly the opposite of what would be predicted from the results of wind tunnel studies.
The velocities of the males increased as the wind velocity rose at increasing distances, but previous results indicate that ground speed should remain fairly constant in varying wind velocities (Marsh et al., 1978; CardC & Hagaman, 1979; Kuenen &Baker, 1982a; Willis & CardC, 1990). L.dispar males fly somewhat faster in higher tem-
peratures (Charlton et al., 1991), not slower, as the males we recorded in the forest did. Obviously in the forest many variables are changing simul- taneously, but it is noteworthy that the parameters mentioned apparently have such a small effect that it is not measurable. Alternatively, an in- tegration of responses to several variables may cause a response that might not be predicted by laboratory studies.
There was little difference between any of the physical parameters measured (i.e. wind velocity and temperature) at the 10 and 20 m distances. Yet there was a consistent and continuous trend for the flight manoeuvres measured to either increase or decrease as the males were recorded further away from the source. The alterations in flight manoeuvres and track parameters we observed in the field were consistent with some of those observed in the wind tunnel studies of male response to varying the concentration of the pheromone source. In a wind tunnel males fly slower in response to increasing the concentration of the pheromone source, resulting in slower ground speeds and net velocities (Charlton et al., 1991; Kuenen & Baker, 1982b). In these lat- ter studies males decreased their course angles (steered more into the wind), but allowed the wind induced drift angle to increase (by flying slower, i.e. lower air speed), causing an increase in track angle as well. In another wind tunnel study, Sanders (1985) found that spruce budworm (Choristoneura furniferuna) males decreased their net velocity as they flew upwind toward a pheromone source over 6 m. The hypothetical explanation for this behaviour was a response to an increase in time averaged pheromone con- centration as the male approached the source. No detailed flight track recordings were made. How- ever, in the field, course angles steered and the resulting track angles increased (steered more across the wind) consistently the closer to the source L.dispar males were recorded, and the drift angle remained the same.
Discussing the response to pheromone con- centration changes in this manner may be mis- leading. Murlis & Jones (1981) demonstrated quantitatively what had been suggested sometime earlier (Wright, 1958): plumes do not diffuse forming an homogeneous ellipsoid-shaped active space containing steadily decreasing concen- trations downwind of the source. Rather, plumes are filamentous in nature, with the distribution of filaments being governed primarily by turbu-

Pheromone-mediated upwind flight in a forest 517
lent diffusion. The individual filaments of the plume are eventually torn apart by the small- scale turbulence in the air as the plume is carried downwind, but decrease in the concentration of odour within these filaments is little altered by molecular diffusion (Murlis, 1986; Murlis et al. , 1990). Although mean concentration decreases with increasing distance from the source, there remains a finite probability of encounter with essentially undiluted odour. Thus the range of filament strengths widens as the distance from the source increases and the ratio of average peak to mean concentration becomes greater. There are a number of temporal and spatial parameters of a plume in wind that vary sys- tematically with distance from the source (Murlis et al. , 1990), but their reliability as indicators of the distance to the source depend on the duration of sampling time.
The necessity of intermittent pheromone stimulation for prolonged upwind flight has been demonstrated clearly in two moth species (Adoxophyes orana: Kennedy et al. , 1980,1981; G.molesta: Willis & Baker, 1984; Baker et al., 1985). Differences in plume shape and structure have also been proposed as an explanation for the differences in trapping ability of certain trap designs (Lewis & Macaulay, 1976). Recent evi- dence indicates that males have the ability at the level of the receptor (Baker et a l . , 1989; Kaissling, 1986; Rumbo & Kaissling, 1989) and the CNS (Christensen & Hildebrand, 1988; Christensen et al . , 1989) to resolve temporally fine-scale (up to 10 Hz) bursts of pheromone.
As males encounter filaments within the pheromone plume at distances of 10-20 m, these filaments will be generally lower in con- centration than at the source, but will be broader spatially and therefore will be detected for a longer interval by a flying insect which is main- taining its ground speed within a narrow range (Murlis et al., 1990). This spatial broadening of the filaments as the plume moves down wind translates, temporally, into a slower rise from onset to the peak pheromone concentration in each filament as the plume travels further from the source. If this broadening of a pheromone filament were perceived by the males it might provide a more reliable gauge of distance from the source than concentration alone. Moore & Atema (1988) have proposed a model which incorporates the ability to perceive the rate of increase in odour concentration at the leading
edge of odour bursts as a way to perceive relative distance to the source.
The ratio of average peak pheromone con- centration to mean concentration in a given burst of ions or pheromone also changes sys- tematically with distance from the source (Murlis et al. , 1990). The time interval between the onset of one filament of pheromone and the onset of the next, the burst return period (sensu Murlis & Jones, 1981), also increases as the distance from the source increases. These two parameters show strong systematic relationships with distance from the source, and both would require sampling over time and some form of memory to allow comparison as the male ap- proaches the source. Christensen et al. (1989) have demonstrated the existence of elements in the antenna1 lobe of the brain that show long-term excitation to pheromone, as well as elements that show rapid peak-following responses. Perhaps a pattern of long-term exci- tation overlaid with rapid phasic responses to concentration peaks could combine to enable males to derive a temporal and spatial profile of the plume and thus derive information on dis- tance travelled relative from where they entered the plume, or perhaps an estimate of their absolute distance from the source of pheromone.
It is also possible that the temporal and spatial information present in the pheromone stimuli provided by the plume might be influencing the hypothetical CNS counterturning oscillator. A trend for a decreased time between turns, and hence an increase in the frequency of turns per second, has been reported as a response to increased pheromone concentration (Kuenen & Baker, 1982b). In contrast, Charlton et al. (1991) have demonstrated that L . dispar males maintain the temporal aspects (as measured by turning frequency) of their flight tracks at a very constant value across a range of concentrations that re- present the dynamic response range for concen- tration in males. L.dispar males have been shown to have a remarkably consistent inter- turn duration in response to a wide variety of stimuli in wind tunnel experiments (pheromone concentration and temperature; Charlton et al . , 1991; wind velocity; Willis & CardC, 1990). In all of these wind tunnel studies the inter-turn duration (as determined from turning frequency as measured by Charlton et al., 1991) was c . 0.25-0.30 s. These values coincide well with the inter-turn durations of L.dispar males flying

518 M. A . Willis. J . Murlis and R . T. Cardd
close to the source in the forest. All of the wind tunnel experiments, and the 2.5 m distance in the forest, were studies of flight relatively close to the source (c . 3 m from release point to source). A possible explanation for this remark- able consistency is that the changes in the spatial and temporal nature of the pheromone plume are similar over the distances flown, relative to the source. Our results from the field suggest that as the distance from the source increases, the temporal, spatial and concentration par- ameters of the plume change (Murlis et al., 1990), and the period of the counterturns increases.
It has been proposed that males zigzagging upwind in a pheromone plume resolve the optomotor feedback provided by the visual flow field, into longitudinal and transverse components (Ludlow, 1984; David, 1986). This optomotor feedback then enables the males to modulate their motor output (course angles steered and air speed flown), and maintain their ground speed and track angle near some ‘pre- ferred’ values (Marsh et al., 1978). It has been proposed that the easiest way for a male to do this is to keep a constant relationship between transverse and longitudinal image flow (Ludlow, 19M; David, 1986). As previously demonstrated, with L.dispar males responding to different wind velocities (Willis & CardC, 1990), the longitudinal and transverse components of image flow were not maintained at any constant re- lationship by males flying in the forest. Rather the transverse image flowisteering feedback loop and the longitudinal image flow/velocity feed- back loop a appear to act separately in control of steering and velocity, at least in Ldispar.
In the present study, males flying in the forest did not show consistent ‘preferred’ ground speeds or track angles that were maintained at all distances from the source, as observed in the wind tunnel (Willis & Carde, 1990). However, the changes in the velocity parameters were paralleled by changes in the longitudinal com- ponent of image flow, supporting the proposed feedback function.
The track angles changed in a manner pre- dictable from the alteration in the courses steered at the different distances from the source. How- ever, the transverse component of image flow, the hypothetical feedback control for steering, remained fairly constant at all distances recorded. The drift angle, a measure of the effect of wind
on the course angle steered by the male, also remained relatively constant. Thus, it seems possible that the males were, by monitoring their transverse image flow, maintaining the amount that they were drifted off course at some presumably optimum value. This is not to say that the males were not also actively steering their course angles. Apparently under the conditions recorded in the forest, the males optimized their wind-induced drift via optomotor feedback while altering their steering and the resultant track angle. It is possible that temporal and spatial information from the pheromone plume may feed into this steering system too.
Charlton et al. (1991) have demonstrated that a pheromone plume of sufficiently high con- centration will cause L.dispar males to alter their flight manoeuvres and become arrested in flight before they reach the source. It has been suggested that in-flight arrestment is caused by an olfactory fusion of the flickering pheromone signal as the male approaches the source (Baker, 1985). Recordings made both at the levels of the electroantennogram (C.molesta: Baker & Haynes, 1989) and the single sensillum (Agrotis segetum: Baker et al., 1989), indicate that at sufficiently high concentrations of pheromone the insect’s receptors are no longer able to resolve the rapidly occurring changes in the plume’s filaments. The distance from the pher- omone source at which the antennae and single sensillum tested could no longer monitor these fluctuations corresponded roughly to the distance where males in flight became arrested to the same pheromone source. The inability of re- ceptors to follow rapid concentration changes may effectively eliminate pheromone inputs to the CNS. The recent increase in our level of understanding of the capabilities of peripheral and CNS processing of the temporal/spatial nature of the pheromone plume, the potential information available within the pheromone plume, and the apparent behavioural response to this information, should prompt a more de- tailed examination of the influence of plume structure on flight behaviour.
It would not have been possible to draw the conclusions that we have without the recordings of plume structure (Murlis et al., 1990) carried out in concert with this behavioural study. In the absence of the information on the temporal and spatial structure of plumes, the differences in flight behaviour would have been explained

Pheromone-mediated upwind flight in a forest 519
by a combination of concentration effects and the uncontrolled conditions that characterize field recordings. This explanation remains as an alternative hypothesis.
The simultaneous electroantennogram and ion plume recordings reported by Murlis et al. (1090), indicate that the main features of the pheromone plume as modelled by ionized air are reflected in the structure of the pheromone plume as monitored by the antenna. This result validates the use of ionized air plumes as a model for a pheromone plume. Continued at- tempts to correlate flight behaviour and plume structure are important for a better under- standing of the males’ ability to perceive and respond to variations in the plume. It may become more important to use ionized air or another model system as a way to trace variation in plume structure. These methods, using sensors which approach a perfect response, can give a more complete picture of the plume structure than is available using natural (i.e. antenno- grams, etc.) detectors. There is a wide variety of spatial and temporal information available to the males in the structure of the plume, but we will be able to discern only a small portion of what they are actually extracting by monitoring at the antenna1 or even the single sensillum level. Studies on other moths (Manduca sexta: Christensen & Hildebrand, 1988; Heliothis virescens: Christensen et al. , 1989) have re- vealed higher order elements in the CNS that are capable of extracting some of the temporal and spatial information available in the plume. Further examination of the CNS capabilities of these insects is needed.
Finally, is it of adaptive value that male moths should know their distance from a pheromone source? Males frequently lose contact with pheromone plumes during the course of upwind flight to the source (David et al., 1983; Elkinton et al., 1987). We know how their manoeuvres change upon pheromone loss, but we know very little about what determines the length of time casting behaviour will be expressed before the males ‘give up’ and leave the area. In an earlier report (Elkinton et al., 1987), L.dispar males flying to a phcromone source in the same forest location used in the present study took median times of 3.9, 5.7, 7.0 and 9.7 min respectively to reach sources located 20, 40, 80 and 120 m away. These transit times suggest that males were not flying continuously toward
the sourcc. A possible explanation for these long flight times is that shifts in the wind direction caused the males to temporarily lose contact with the plume (David et al., 1983). Upwind progress only occurred during those relatively brief periods when the wind direction was stable, and thus the plume was mainly linear. Further- more, the proportion of males locating the source of pheromone from those distances fell from 45% at 20 m to 8% at 120 m. Clearly, the ‘giving up time’, if it is varying with the likelihood of source location, ought to increase as the male draws close to the pheromone source. The temporal and spatial stimuli received from the pheromone plume prior to odour loss might serve to regulate this process, and such infor- mation appears to be more indicative of dis- tance from the source than concentration. Without more precise field observations, and controlled laboratory manipulations of plume structure in the wind tunnel, we cannot be sure which features of the plume’s change with distance caused the behavioural changes that we observed.
Thus, we have added to our understanding of the Ldispar male’s ability to locate a pheromone source over relatively long distances, but there remain outstanding questions on the nature of the flight manoeuvres employed and the features of the pheromone signal and the visual environ- ment extracted by the male to achieve this navigational feat.
Acknowledgments
We acknowledge Dr C. Schwalbe and co-workers at the USDA Methods Development Center at Otis Air National Guard Base, Massachusetts, for supplying the L.dispar egg masses, and Ms K. Spenser for supervising their rearing. We also thank Ms A. Brown and Mr T. Brown for their excellent technical help during both data collection and analysis. Drs R. Chapman, Bas Kuenen and R. Olberg critically reviewed earlier drafts of the manuscript and made import- ant contributions to its final form. Dr B. Smith made important suggestions on statistical analysis and helpful comments on the manu- script. Dr C. David was involved in early stages of these observations and contributed many helpful ideas.
This study was supported by a USDA Com- petitive Grant-Pest Sciences.

520 M . A . Willis, J . Murlis and R . T. Card6
References
Baker, T.C. (1985) Chemical control of behavior. Comprehensive Insect Physiology, Biochemistry and Pharmacology (ed. by G. A. Kerkut and L. I. Gilbert), pp. 621 -672. Pergamon Press, Oxford.
Baker, T.C. (1988) Pheromones and flight behavior. Insect FZight (ed. by G. Goldsworthy and C . Wheeler), pp. 231-255. CRC Press, Boca Raton, Florida.
Baker, T.C., Hansson, B.S., Lofstedt, C. & Lofqvist, J. (1989) Adaptation of antenna1 neurons in moths is associated with cessation of pheromone-mediated upwind flight. Proceedings of the National Academy of Sciences of the United States of America, 85,
Baker, T.C. & Hayncs, K.F. (1989) Field and lab- oratory electroantennographic measurements of pheromone plume structure correlated with oriental fruit moth behaviour. Physiological Entomology,
Baker, T.C., Willis, M.A. & Phelan, P.L. (1984) Optomotor anemotaxis polarizes self-steered zig- zagging in flying moths. Physiological Entomology,
Baker, T.C., Willis, M.A., Haynes, K.F. & Phelan, P.L. (1985) A pulsed cloud of SCX pheromone elicits upwind flight in male moths. Physiological Entomology, 10, 257-265.
Bell, R.A., Owens, C.D., Shapiro, M. & Tardiff, J.R. (1981) Development of mass-rearing tech- nology. In: The Gypsy Moth: Research Toward Integrated Pest Management (ed. by C. C. Doane and M. L. McManus). USDA, Tcchnical Bulletin, Washington DC.
Bierl, B.A., Beroza, M. & Collier, C.W. (1970) Potent sex attractant of the gypsy moth: its isolation, identification and synthesis. Science, 170, 87-89.
Carde, R.T., Doane, C.C., Baker, T.C., Iwaki, S. & Marumo, S. (1977) Attractancy of optically active pheromone for male gypsy moths. Environmental Entomology, 6, 768-772.
CardC, R.T. & Hagaman, T.E. (1979) Behavioral responses of the gypsy moth in a wind tunnel to air- borne enantiomers of disparlure. Environmental Entomology, 8, 475484.
Charlton, R.E., Kanno, H. , Collins, R.D. & Cardt, R.T. (1991) Influence of pheromone concentration and ambient temperature on flight of the gypsy moth, Lymantria dispar, in a sustained-flight wind tunnel. Physiological Entomology (in press).
Christensen, T.A. & Hildebrand, J.G. (1988) Fre- quency coding by central olfactory neurons in the sphinx moth Manduca sexta. Chemical Senses, 13,
Christensen, T.A., Mustaparta, H. & Hildebrand, J.G. (1989) Discrimination of sex pheromone blends in the olfactory system of the moth. Chemical Senses,
9826-9830.
14, 1-12.
9, 365-376.
123-130.
14, 463-477. David, C.T. (1982) Competition between fixed and
moving stripes in the control of orientation by Bymg Drosophilu. Physiological Entomology, 7,
David, C.T. (1986) Mechanisms of directional flight in wind. Mechanisms in Insect Olfaction (ed. by T. L. Paync, M. C. Birch and C . E. J . Kcnnedy), pp. 49-57. Clarcndon Press, Oxford.
David, C.T., Kennedy, J.S. & Ludlow, A.R. (1983) Finding of a sex pheromone source by gypsy moths released in the field. Nature, 303, 804-806.
Elkinton, J.S. , Schal, C., Ono, T. & CardC, R.T. (1987) Pheromone puff trajectory and upwind flight of gypsy moths in a forest. Physiological Entomology, 12, 399 -406.
Harris, R.J. (1975) A Primer of Multivariate Statistics. Academic Press, New York.
Kaissling, K.-E. (1986) Temporal characteristics of pheromone receptor cell responses in relation to orientation behaviour of moths. Mechanisms in Insect Olfaction (ed. by T. L. Payne, M. C. Birch and C. E. J. Kennedy), pp. 193-199. Clarendon Press, Oxford.
Kennedy, J.S. (1986) Some current issues in orientation to odour sources. Mechanisms in Insect Olfaction (cd. by T. L. Payne, M. C. Birch and C. E. J. Kennedy), pp. 11-26. Clarendon Press, Oxford.
Kennedy, J.S., Ludlow, A.R. & Sanders, C.J. (1980) Guidance system used in moth sex attraction. Nature,
Kennedy, J.S., Ludlow, A.R. 8( Sanders, C.J. (1981) Guidance of flying male moths by wind-borne sex pheromone. Physiologicul Entomology, 6 , 395-412.
Kennedy, J.S. & Marsh, D. (1974) Pheromone- rcgulated ancmotaxis in flying moths. Science, 184, 999- 1001.
Kuenen, L.P.S. & Baker, T.C. (1982a) Optomotor regulation of ground velocity in moths during flight to sex pheromone at different heights. Physiological Entomology, 7, 193 -202.
Kuenen, L.P.S. &Baker, T.C. (1982b) The effects of pheromone concentration on the fight behaviour of the oriental fruit moth, Grupholitha molesta. Physiological Entomology, 7, 423-434.
Lewis, T. & Macaulay, E.D.M. (1976) Design and elevation of sex-attractant traps for pea moth, Cydia nigricana (Stcph.) and the effect of plume shape on catches. Ecological Entomology, I , 175- 187.
Ludlow, A.R. (1984) Application of computer mod- elling to behavioral coordination. Ph.D. thcsis, University of London.
Marsh, D., Kennedy, J.S. & Ludlow, A.R. (1978) An analysis of anemotactic zigzagging flight in male moths stimulated by pheromone. Physiological Entomology, 3, 221-240.
Moore, P. & Atema, J. (1988) A model of a temporal filter in chcrnoreception to extract directional infor-
151-156.
288, 474-477.

Pheromone-mediated upwind flight in a forest 521
mation from a turbulent odor plume. Biological Rulletin, 174, 355-363.
Murlis, J. (1986) The structure of odour plumes. Mechanisms in Insect Olfaction (ed. by T. L. Paync, M. C. Birch and C. E. J. Kennedy), pp. 27-38. Clarcndon Press, Oxford.
Murlis, J., Bettany, B.W., Kelley, J. & Martin, L. (1982) The analysis of flight paths of male Egyptian cotton leafworm moths, Spodoptera littoralis, to a sex pheromone source in thc field. Physiological Entomology, 7 , 435-441.
Murlis, J. & Jones, C.D. (1981) Fine-scalc structure of odour plumes in relation to insect orientation to distant pheromone and other attractant sources. Physiological Entomology, 6, 71-86.
Murlis, J., Willis, M.A. & CardC, R.T. (1990) Odour signals: patterns in time and space. In: Proceedings of the X International Symposium on Olfaction and Taste, Oslo (ed. by K. Doving), pp. 6-17.
Rumbo, E.R. & Kaissling, K.-E. (1989) Temporal re- solution of odour pulses by three types of pheromone receptor cells in Antheruea polyphemus. Journal of Comparative Physiology, 165, 281-291.
Sanders, C.J. (1985) Flight speed of male spruce budworm moths in a wind tunnel at different wind speeds and at diffcrcnt distances from a pheromonc source. Physiological Entomology, 10, 83-88.
Willis, M.A. & Baker, T.C. (1984) Effects of inter- mittent and continuous pheromone stimulation on the flight behavior of the oriental fruit moth, Grapholita molesta. Physiological Entomology, 9,
Willis, M.A. & Baker, T.C. (1988) Effects of varying sex pheromone component ratios on the zigzag- ging fiight movements of the oriental fruit moth, Grapholita molesta. Journal of Insect Behavior, I ,
Willis, M.A. & CardC, R.T. (1990) Pheromone me- diated optomotor response in male gypsy moths Lymantria dispar L.: upwind flight in different wind velocities. Journal of Comparative Physiology
Wright, R.H. (1958) The olfactory guidance of flying insects. The Canadian Entomologist, 90, 81-89.
341 -3%.
357-371.
A, 167, 699-706.
Accepted 9 October 1990
Copyright © 2022 FDOKUMEN


![Zigeunerweisen (Gypsy Air) [Op.20] - Free-scores.com](https://static.fdokumen.com/doc/165x107/6327e376e491bcb36c0b8140/zigeunerweisen-gypsy-air-op20-free-scorescom.jpg)