Parieto-occipital cortex activation during self-generated eye movements in the dark
Upload
independentCategory
view
3download
0
RESEARCH ARTICLE
Phenotypes of Th lineages generated by the commonly usedactivation with anti-CD3/CD28 antibodies differ from thosegenerated by the physiological activation with the specificantigen
Cuiyan Tan1, Lai Wei1, Barbara P Vistica1, Guangpu Shi1, Eric F Wawrousek2 and Igal Gery1
T-helper (Th) lineages have been generated in vitro by activating CD4 cells with anti-CD3/CD28 antibodies during
polarization. Physiologically, however, the generation of Th lineages is by activation with the specific antigen presented
by antigen-presenting cells (APC). Here, we used T-cell receptor (TCR)-transgenic mice to compare the phenotypes of
Th1, Th9 and Th17 lineages when generated by either one of the two activation modes. Lineage Th cells specific against
hen egg lysozyme (HEL), were adoptively transferred into recipient mice transgenically expressing HEL in their lens.
Remarkable differences were found between lineages of Th1, Th9 or Th17, generated by either one of the two modes in
their capacities to migrate to and proliferate in the recipient spleen and, importantly, to induce inflammation in the
recipient mouse eyes. Substantial differences were also observed between the lineage pairs in their transcript expression
profiles of certain chemokines and chemokine receptors. Surprisingly, however, close similarities were observed between
the transcript expression profiles of lineages of the three phenotypes, activated by the same mode. Furthermore, Th cell
lineages generated by the two activation modes differed considerably in their pattern of gene expression, as monitored by
microarray analysis, but exhibited commonality with lineages of other phenotypes generated by the same activation
mode. This study thus shows that (i) Th lineages generated by activation with anti-CD3/CD28 antibodies differ from
lineages generated by antigen/APC; and (ii) the mode of activation determines to a large extent the expression profile of
major transcripts.
Cellular & Molecular Immunology (2014) 11, 305–313; doi:10.1038/cmi.2014.8; published online 3 March 2014
Keywords: Eye; Inflammation; Microarray; T-cell differentiation
INTRODUCTION
Studies in recent years revealed the heterogeneity of the T-
helper (Th) cell population, with five subpopulations having
been defined so far, namely, Th1, Th2, Th9, Th17 and
Th22.1–7 Analyses of these subpopulations have been carried
out mainly in vitro and accumulating data have identified the
specific polarizing cytokines for each Th subpopulation. The
polarization process of naı̈ve CD4 cells requires the cells to be
concurrently activated and it is assumed that in vivo, the
activation is provided by interaction of the naive CD4 cells
with their specific antigen (Ag), presented by Ag-presenting
cells (APC). Since only minuscule proportions of CD4 cells
with specificity toward tested Ags exist in preparations of
CD4 cells from wild-type animals, the activation by Ag and
APC has been commonly replaced by exposure of the CD4
cells to antibodies (Abs) against CD3 and CD28, two mole-
cules that participate in the physiological process of
activation.CD3 is a major component of the T-cell receptor
(TCR) complex, while CD28 is a potent costimulatory mole-
cule. Interaction of the anti-CD3 and anti-CD28 Abs with
their target molecules results in vigorous activation of the
CD4 cells,8,9 a process that has served as a replacement for
activation with the Ag presented by APC. Activation by these
Abs for generation of polarized Th cell lineages has been
employed, therefore, in numerous studies that have iden-
tified and characterized the different Th subpopulations.
1Laboratory of Immunology, National Eye Institute, National Institutes of Health, Bethesda, MD, USA and 2Laboratory of Molecular and DevelopmentalBiology, National Eye Institute, National Institutes of Health, Bethesda, MD, USACorrespondence: Dr I Gery, Laboratory of Immunology, NEI, NIH, Bldg 10, Rm 10N208, Bethesda, MD 20892-1857, USA.E-mail: [email protected]: 25 July 2013; Revised: 2 January 2014; Accepted: 20 January 2014
Cellular & Molecular Immunology (2014) 11, 305–313� 2014 CSI and USTC. All rights reserved 1672-7681/14 $32.00
www.nature.com/cmi
The availability of TCR transgenic (Tg) mice made it pos-
sible, however, to generate lines of polarized Th cells by activa-
tion of naive CD4 cells with the specific Ag presented by
APC.10–13 The TCR Tg cells can also be activated by the anti-
CD3/CD28 Abs, thus making it possible to compare lines of
polarized cells generated by either one of the two modes of
activation. In a previous study, we noticed differences in the
pathogenicity between subpopulations of Th1 and Th17, gen-
erated by either one of the two modes of activation.14 The
present study expanded these preliminary observations by
comparing subpopulations of Th1, Th9 and Th17, specific to
the same Ag (hen egg lysozyme (HEL)),but generated by activa-
tion with either HEL/APC, or anti-CD3/CD28 Abs. We com-
pared the three lineage pairs for pathogenicity, the capacity to
invade and proliferate in the recipient spleen, their major sur-
face markers, their expression of certain chemokines and che-
mokine receptors transcripts, as well as their gene expression
patterns by microarray analysis. The data show remarkable
differences between the corresponding subpopulation pairs,
generated by the two different modes. In addition, however,
unexpected close similarity was found among the lineages gen-
erated by activation with either one of the modes, in their
transcript expression patterns of the chemokine and chemo-
kine receptors, as well as the gene expression as determined by
the microarray analysis.
MATERIALS AND METHODS
Mice
All mice used in this study were (FVB/N3B10.BR) F1 hybrids,
transgenically expressing either HEL in their eyes (‘HEL-Tg’),
or HEL-specific TCR by their T cells (‘3A9’); see Ref. 15 for
detail. The mice were housed in a pathogen-free facility and all
manipulations were performed in compliance with the NIH
Resolution on the Use of Animals in Research.
Reagents
IL-6, TGF-b, PE-anti-Ccr6, PE-anti-Cxcr3 and their correspond-
ing IgG isotype controls were provided by R&D Systems. IL-1awas from PeproTech, anti-IFN-c (clone R4-6A2) was from
Harlan Bioproducts for Science, anti-IL-4 (clone 11B11) was from
NCI-Frederick Repository, and IL-12 and HEL were purchased
from Sigma-Aldrich. The following reagents were from BD
Biosciences: IL-4, anti-CD3 antibody, anti-CD28 antibody, anti-
IL-12, PE-anti-CD4, Percp-Cy5.5-anti-CD4, PE-anti-CD45RB,
PE-anti-CD69, PE-anti-a4b7, PE-anti–aEb7, PE-anti-IL-17,
APC-anti-IFN-c, IgG isotype control and 7-AAD. A clonotypicm
Ab specific for the TCR of 3A9 mice, designated ‘1G12’, a gift
from E. Unanue (Washington University), was conjugated with
FITC (Pierce).
In vitro T-cell differentiation
Naive CD41 T cells were purified from spleen and lymph node
cells of 3A9 mice, using T-cell columns (R&D Systems). CD4
cells expressing the Tg TCR were sorted by FACSAria II (BD
Biosciences), using the clonotypicm Ab 1G12, and then were
activated and polarized toward Th1, Th9 and Th17 lineage as
follows: the CD4 cells were cultured in 12-well plates (Corning)
at 253104/ml cells in a volume of 2 ml of RPMI-1640, supple-
mented with 10% FCS, antibiotics and 50 mM 2-ME. Activation
was induced either by HEL (1 mg/ml for Th9 cell culture, or
2 mg/ml for Th1 and Th17 cell cultures) presented by irradiated
(30 Gy) syngeneic wild-type naive splenocytes serving as APCs
(1253104/ml) (‘HA’), or byplate bound anti-CD3 (1 mg/ml)
and anti-CD28 (10 mg/ml) Abs (‘PbAb’). Polarizing cocktails,
added concurrently with the activation process included: for
Th1 lineage, 10 ng/ml IL-12 and 10 mg/ml anti-IL-4; for Th9
lineage, 10 ng/ml IL-4 and 1 ng/ml TGF-b; and for Th17 lin-
eage, 3 ng/ml TGF-b, 10 ng/ml IL-6, 5 ng/ml IL-1a, 20 mg/ml
anti-IFN-c, 10 mg/ml anti-IL-4 and 10 mg/ml anti-IL-12.
In additional experiments, we titrated the capacity of the
anti-CD3 Ab to activate the CD4 lymphocytes during the
polarization process by testing the Ab at three different con-
centrations, 0.2, 1.0 and 5.0 mg/ml. All other conditions were
the same as detailed above and the proportions of the generated
Th1, Th9 and Th17 cells were determined by flow cytometry, as
detailed below.
Adoptive transfer of polarized Th cells
Th cells (53106) harvested after 3 or 4 days of activation were
injected via the tail vein into HEL-Tg mice. Recipient mice
were killed 4 or 7 days post cell injection and their eyes were
collected for histological analysis by conventional hematoxylin
and eosin methods.
Flow cytometric analysis
Polarized cells cultured for 3 or 4 days and lymphocytes isolated
from the recipient spleen at different time points were collected
for surface cytokine staining and intracellular staining accord-
ing to the manufacturers’ instructions (see Ref. 15 for details).
Cells were acquired on a FACSCalibur (BD Bioscience). The
data were analyzed by FlowJo software (Tree Star).
Quantitative (q)-PCR
Transcript levels of the tested chemokine and chemokine
receptor genes of the polarized Th cells were assessed by
qPCR as described elsewhere,15 using reagents and methods
according to the manufacturer’s instructions (Applied
Biosystems).
Affymetrix microarray data collection and analysis
Total RNA was isolated from different Th cells cultured for 4 days
using mirVana miRNA isolation kit (Ambion). In total, 500 ng
total RNA was amplified and biotin-labelled using MessageAmp
II-Biotin Enhanced Kit (Ambion). Approximately 10 mg of
total labeled RNA was hybridized to GeneChip MEO430 2.0
arrays (Affymetrix) according to the manufacturer’s protocols.
Expression values were determined using GeneChip Operating
Software v1.1.1. All data analysis was performed using
GeneSpring GX 11.0 (Agilent Technologies). Expression values
for each probe were normalized using Robust Multichip
Average method. All probes with expression values ,50 in all
Activation mode of Th lineages determines their phenotype
CY Tan et al
306
Cellular & Molecular Immunology
samples were deleted from subsequent analysis (The GEO acces-
sion number for the microarray data: GSE54938.)
Statistical analysis
Data were shown as the mean6s.e.m. The software GraphPad
Prism was used to perform the statistical analyses of the data
with two-tailed Student’s t-test. Differences were considered
significant at P,0.05 (*P,0.05; **P,0.01; ***P,0.001).
RESULTS
Th lineages generated by activation with either anti-CD3/
CD28 Abs or HEL/APC differ in their pathogenicity
To compare between subpopulations generated by the two
modes of activation, we generated lines of Th1, Th9 and
Th17 cells by activating naive CD4 cells during the respective
polarization process with either plate-bound anti-CD3/CD28
Abs (‘PbAb’), or the target Ag, HEL, presented by APC (‘HA’).
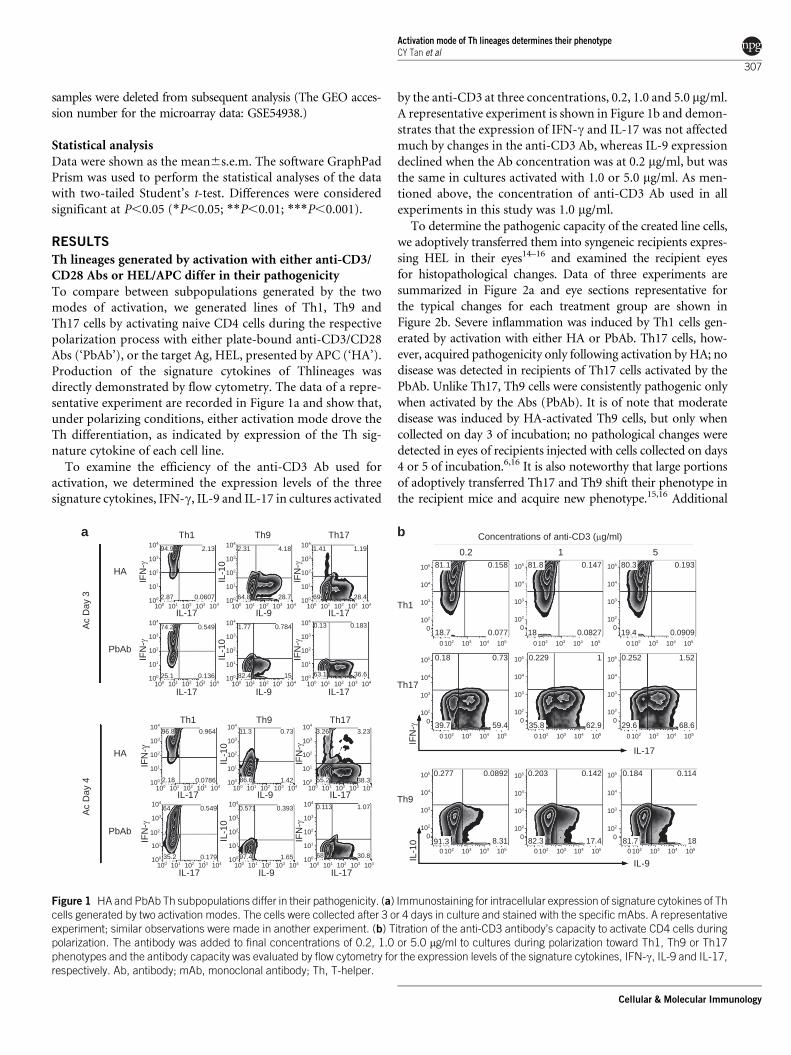
Production of the signature cytokines of Thlineages was
directly demonstrated by flow cytometry. The data of a repre-
sentative experiment are recorded in Figure 1a and show that,
under polarizing conditions, either activation mode drove the
Th differentiation, as indicated by expression of the Th sig-
nature cytokine of each cell line.
To examine the efficiency of the anti-CD3 Ab used for
activation, we determined the expression levels of the three
signature cytokines, IFN-c, IL-9 and IL-17 in cultures activated
by the anti-CD3 at three concentrations, 0.2, 1.0 and 5.0 mg/ml.
A representative experiment is shown in Figure 1b and demon-
strates that the expression of IFN-c and IL-17 was not affected
much by changes in the anti-CD3 Ab, whereas IL-9 expression
declined when the Ab concentration was at 0.2 mg/ml, but was
the same in cultures activated with 1.0 or 5.0 mg/ml. As men-
tioned above, the concentration of anti-CD3 Ab used in all
experiments in this study was 1.0 mg/ml.
To determine the pathogenic capacity of the created line cells,
we adoptively transferred them into syngeneic recipients expres-
sing HEL in their eyes14–16 and examined the recipient eyes
for histopathological changes. Data of three experiments are
summarized in Figure 2a and eye sections representative for
the typical changes for each treatment group are shown in
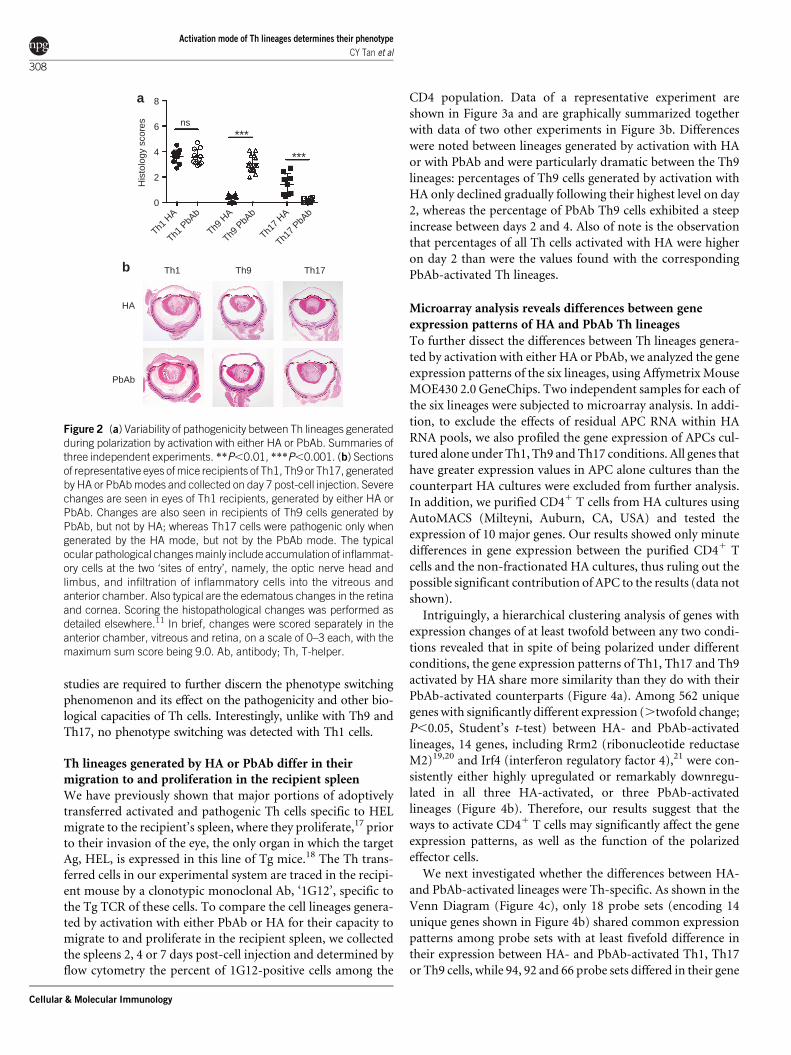
Figure 2b. Severe inflammation was induced by Th1 cells gen-
erated by activation with either HA or PbAb. Th17 cells, how-
ever, acquired pathogenicity only following activation by HA; no
disease was detected in recipients of Th17 cells activated by the
PbAb. Unlike Th17, Th9 cells were consistently pathogenic only
when activated by the Abs (PbAb). It is of note that moderate
disease was induced by HA-activated Th9 cells, but only when
collected on day 3 of incubation; no pathological changes were
detected in eyes of recipients injected with cells collected on days
4 or 5 of incubation.6,16 It is also noteworthy that large portions
of adoptively transferred Th17 and Th9 shift their phenotype in
the recipient mice and acquire new phenotype.15,16 Additional
104Th9Th1
HA
PbAb
Ac
Day
3A
c D
ay 4
HA
PbAb
94.9
2.87 0.0607
2.13 2.31
64.8 28.7
4.18 1.41
69 28.4
1.19
0.13
63.1 36.6
0.1831.77
82.4 15
0.78474.2
25.1 0.136
0.549
96.8
2.18 0.0786
0.964 11.3
86.6 1.42
0.73 3.26
55.2 38.3
3.23
0.113
68 30.8
1.070.571
97.4 1.65
0.39364
35.2 0.179
0.549
Th17 Concentrations of anti-CD3 (mg/ml)
0.2
Th1
Th17
IL-1
0
IFN
-γ
Th9
IL-9
IL-17
81.1
18.7
0.158
0.077
1 5
Th9Th1 Th17
IL-9IL-17 IL-17
IL-9IL-17 IL-17
IL-9IL-17 IL-17
IL-9IL-17 IL-17
103
102
IFN
-g
IL-1
0
IFN
-g
IFN
-g
IL-1
0
IFN
-g
IL-1
0
IFN
-g IFN
-g
101
100
100 103102101 104
104
103
102
101
100
100 103102101 104
104
105
104
103
102
102 104103 105
0
0
81.8
18
0.147
0.0827
105
104
103
102
102 104103 105
0
0
80.3
19.4
0.193
0.0909
105
104
103
102
102 104103 105
0
0
0.18
39.7
0.73
59.4
105
104
103
102
102 104103 105
0
0
0.229
35.8
1
62.9
105
104
103
102
102 104103 105
0
0
0.252
29.6
1.52
68.6
105
104
103
102
102 104103 105
0
0
0.277
91.3
0.0892
8.31
105
104
103
102
102 104103 105
0
0
0.203
82.3
0.142
17.4
105
104
103
102
102 104103 105
0
0
0.184
81.7
0.114
18
105
104
103
102
102 104103 105
0
0
103
102
101
100
100 103102101 104
104
103
102
101
100
100 103102101 104
104
103
102
101
100
100 103102101 104
104
103
102
101
100
100 103102101 104
104
103
102
IFN
-g
IL-1
0
IFN
-g
102
101
100
100 103102101 104
104
103
102
101
100
100 103102101 104
104
103
102
101
100
100 103102101 104
104
103
101
100
100 103102101 104
104
103
102
101
100
100 103102101 104
104
103
102
101
100
100 103102101 104
a b
Figure 1 HA and PbAb Th subpopulations differ in their pathogenicity. (a) Immunostaining for intracellular expression of signature cytokines of Thcells generated by two activation modes. The cells were collected after 3 or 4 days in culture and stained with the specific mAbs. A representativeexperiment; similar observations were made in another experiment. (b) Titration of the anti-CD3 antibody’s capacity to activate CD4 cells duringpolarization. The antibody was added to final concentrations of 0.2, 1.0 or 5.0 mg/ml to cultures during polarization toward Th1, Th9 or Th17phenotypes and the antibody capacity was evaluated by flow cytometry for the expression levels of the signature cytokines, IFN-c, IL-9 and IL-17,respectively. Ab, antibody; mAb, monoclonal antibody; Th, T-helper.
Activation mode of Th lineages determines their phenotype
CY Tan et al
307
Cellular & Molecular Immunology
studies are required to further discern the phenotype switching
phenomenon and its effect on the pathogenicity and other bio-
logical capacities of Th cells. Interestingly, unlike with Th9 and
Th17, no phenotype switching was detected with Th1 cells.
Th lineages generated by HA or PbAb differ in their
migration to and proliferation in the recipient spleen
We have previously shown that major portions of adoptively
transferred activated and pathogenic Th cells specific to HEL
migrate to the recipient’s spleen, where they proliferate,17 prior
to their invasion of the eye, the only organ in which the target
Ag, HEL, is expressed in this line of Tg mice.18 The Th trans-
ferred cells in our experimental system are traced in the recipi-
ent mouse by a clonotypic monoclonal Ab, ‘1G12’, specific to
the Tg TCR of these cells. To compare the cell lineages genera-
ted by activation with either PbAb or HA for their capacity to
migrate to and proliferate in the recipient spleen, we collected
the spleens 2, 4 or 7 days post-cell injection and determined by
flow cytometry the percent of 1G12-positive cells among the
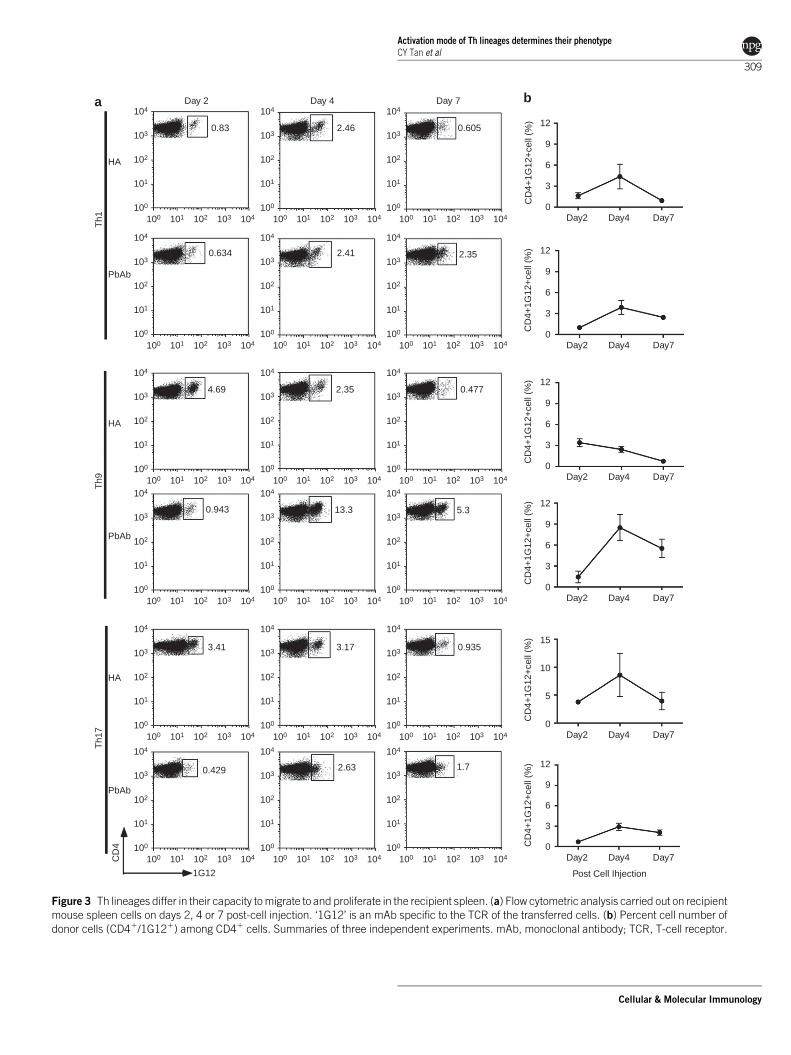
CD4 population. Data of a representative experiment are
shown in Figure 3a and are graphically summarized together
with data of two other experiments in Figure 3b. Differences
were noted between lineages generated by activation with HA
or with PbAb and were particularly dramatic between the Th9
lineages: percentages of Th9 cells generated by activation with
HA only declined gradually following their highest level on day
2, whereas the percentage of PbAb Th9 cells exhibited a steep
increase between days 2 and 4. Also of note is the observation
that percentages of all Th cells activated with HA were higher
on day 2 than were the values found with the corresponding
PbAb-activated Th lineages.
Microarray analysis reveals differences between gene
expression patterns of HA and PbAb Th lineages
To further dissect the differences between Th lineages genera-
ted by activation with either HA or PbAb, we analyzed the gene
expression patterns of the six lineages, using Affymetrix Mouse
MOE430 2.0 GeneChips. Two independent samples for each of
the six lineages were subjected to microarray analysis. In addi-
tion, to exclude the effects of residual APC RNA within HA
RNA pools, we also profiled the gene expression of APCs cul-
tured alone under Th1, Th9 and Th17 conditions. All genes that
have greater expression values in APC alone cultures than the
counterpart HA cultures were excluded from further analysis.
In addition, we purified CD41 T cells from HA cultures using
AutoMACS (Milteyni, Auburn, CA, USA) and tested the
expression of 10 major genes. Our results showed only minute
differences in gene expression between the purified CD41 T
cells and the non-fractionated HA cultures, thus ruling out the
possible significant contribution of APC to the results (data not
shown).
Intriguingly, a hierarchical clustering analysis of genes with
expression changes of at least twofold between any two condi-
tions revealed that in spite of being polarized under different
conditions, the gene expression patterns of Th1, Th17 and Th9
activated by HA share more similarity than they do with their
PbAb-activated counterparts (Figure 4a). Among 562 unique
genes with significantly different expression (.twofold change;
P,0.05, Student’s t-test) between HA- and PbAb-activated
lineages, 14 genes, including Rrm2 (ribonucleotide reductase
M2)19,20 and Irf4 (interferon regulatory factor 4),21 were con-
sistently either highly upregulated or remarkably downregu-
lated in all three HA-activated, or three PbAb-activated
lineages (Figure 4b). Therefore, our results suggest that the
ways to activate CD41 T cells may significantly affect the gene
expression patterns, as well as the function of the polarized
effector cells.
We next investigated whether the differences between HA-
and PbAb-activated lineages were Th-specific. As shown in the
Venn Diagram (Figure 4c), only 18 probe sets (encoding 14
unique genes shown in Figure 4b) shared common expression
patterns among probe sets with at least fivefold difference in
their expression between HA- and PbAb-activated Th1, Th17
or Th9 cells, while 94, 92 and 66 probe sets differed in their gene
8a
b
ns***
***
6
4H
isto
logy
sco
res
2
0
Th1
HA
PbAb
Th9 Th17
Th1 H
A
Th1 P
bAb
Th9 H
A
Th9 P
bAb
Th17 H
A
Th17 P
bAb
Figure 2 (a) Variability of pathogenicity between Th lineages generatedduring polarization by activation with either HA or PbAb. Summaries ofthree independent experiments. **P,0.01, ***P,0.001. (b) Sectionsof representative eyes of mice recipients of Th1, Th9 or Th17, generatedby HA or PbAb modes and collected on day 7 post-cell injection. Severechanges are seen in eyes of Th1 recipients, generated by either HA orPbAb. Changes are also seen in recipients of Th9 cells generated byPbAb, but not by HA; whereas Th17 cells were pathogenic only whengenerated by the HA mode, but not by the PbAb mode. The typicalocular pathological changes mainly include accumulation of inflammat-ory cells at the two ‘sites of entry’, namely, the optic nerve head andlimbus, and infiltration of inflammatory cells into the vitreous andanterior chamber. Also typical are the edematous changes in the retinaand cornea. Scoring the histopathological changes was performed asdetailed elsewhere.11 In brief, changes were scored separately in theanterior chamber, vitreous and retina, on a scale of 0–3 each, with themaximum sum score being 9.0. Ab, antibody; Th, T-helper.
Activation mode of Th lineages determines their phenotype
CY Tan et al
308
Cellular & Molecular Immunology
104
0.83 2.46 0.605
0.634
4.69
0.943
3.41
0.429 2.63 1.7
3.17 0.935
13.3 5.3
2.35 0.477
2.41 2.35
Day 2
HA
baTh
1
PbAb
HA
Th9
PbAb
HA
Th17
PbAb
1G12
CD
4Day 4 Day 7
103
102
101
100
103102101100 104
104
103
102
101
100
103102101100 104
104
12
9
CD
4+1G
12+c
ell (
%)
6
3
0Day2 Day4 Day7
12
9
CD
4+1G
12+c
ell (
%)
6
3
0Day2 Day4 Day7
12
9
CD
4+1G
12+c
ell (
%)
6
3
0Day2 Day4 Day7
12
9C
D4+
1G12
+cel
l (%
)
6
3
0Day2 Day4 Day7
12
9
CD
4+1G
12+c
ell (
%)
6
3
0Day2
Post Cell Ihjection
Day4 Day7
15
10
CD
4+1G
12+c
ell (
%)
5
0Day2 Day4 Day7
103
102
101
100
103102101100 104
104
103
102
101
100
103102101100 104
104
103
102
101
100
103102101100 104
104
103
102
101
100
103102101100 104
104
103
102
101
100
103102101100 104
104
103
102
101
100
103102101100 104
104
103
102
101
100
103102101100 104
104
103
102
101
100
103102101100 104
104
103
102
101
100
103102101100 104
104
103
102
101
100
103102101100 104
104
103
102
101
100
103102101100 104
104
103
102
101
100
103102101100 104
104
103
102
101
100
103102101100 104
104
103
102
101
100
103102101100 104
104
103
102
101
100
103102101100 104
104
103
102
101
100
103102101100 104
Figure 3 Th lineages differ in their capacity to migrate to and proliferate in the recipient spleen. (a) Flow cytometric analysis carried out on recipientmouse spleen cells on days 2, 4 or 7 post-cell injection. ‘1G12’ is an mAb specific to the TCR of the transferred cells. (b) Percent cell number ofdonor cells (CD41/1G121) among CD41 cells. Summaries of three independent experiments. mAb, monoclonal antibody; TCR, T-cell receptor.
Activation mode of Th lineages determines their phenotype
CY Tan et al
309
Cellular & Molecular Immunology

Th17 HATh1 PB
Th17 PBTh1 HA
Th9 HATh9 PB
4a b
c
0
Fold ChangeGeneSymbol Th17* Th9
8.3
5.1
–5.7
–5.9
–6.9
–7.4
–7.4
–7.6
–9.3
–9.5
–10.4
–10.8
–30.6
–64.7
15
92
1816
94
TH17 TH1
TH9
34
66
5.1
5.9
–9.4
–12.1
–5.8
–11.5
–15.8
–6.0
–18.2
–22.1
–9.0
–9.5
–6.3
–12.1
*Fold change was calculated using the expression value in HA conditions divided by the value in PB conditions.
6.3
transcription factor 19
CD83 antigen
solute carrier family 7, member 3
Na+/H+ exchanger domain containing 2
nuclear receptor subfamily 4, group A, member 2
RAB34, member of RAS oncogene family
glutamic pyruvate transaminase 2
cystathionase
nuclear protein 1
interferon regulatory factor 4
interferon regulatory factor 6
heat shock protein 1A
ribonucleotide reductase M2
heat shock protein 1B
5.8
–23.6
–7.0
–5.9
–12.8
–10.2
–7.4
–62.6
–29.6
–7.0
–5.7
–9.5
–18.8
Tcf19
Cd83
Sla7a3
Nhedc2
Nr4a2
Rab34
Gpt2
Cth
Nupr1
Irf4
Irf6
Hspa1a
Rrm2
Hspa1b
Th1Gene Title
–4
Figure 4 Microarray analysis of genome-wide expression differences among the six different Th cell lineages. (a) A hierarchical clustering analysisof 20 175 probe sets with expression changes of at least twofold between any of the two conditions (‘HA’ and ‘PbAb’). The color coding depicts thenormalized expression value for each probe, with red representing higher expression and green representing lower expression as compared to themean of the same probe across all samples. (b) A list of 14 unique genes (representing 18 probes) with at least fivefold increase or decrease in geneexpression among all Th lineages stimulated by HA as compared to their expression in their counterpart lineages stimulated by PbAb. (b) A Venndiagram indicating the overlap and difference among Th17, Th1 and Th9 categories. Probe sets with at least fivefold increase or decrease in geneexpression between HA- and PbAb-stimulated Th17, Th1 and Th9 cells are summarized in the Th17, Th1 and Th9 categories, respectively. Ab,antibody; Th, T-helper.
Activation mode of Th lineages determines their phenotype
CY Tan et al
310
Cellular & Molecular Immunology

expression between HA- and PbAb-activated Th17, Th1, or
Th9 cells in a Th lineage specific manner.
HA and PbAb Th lineages differ in their profiles of
chemokine/chemokine receptor transcripts
Mobility toward targets and related functions of Th cells are
determined to a large extent by their profile of chemokines
and chemokine receptors. To compare between the Th
lineages generated by the two modes of activation, we
extracted RNA samples from the cultured cells and deter-
mined by qPCR the levels of nine transcripts. These nine
transcripts were found by McGeachy et al.22 to differ in their
expression between the pathogenic and non-pathogenic sub-
populations of Th17 cells. Data of three independent experi-
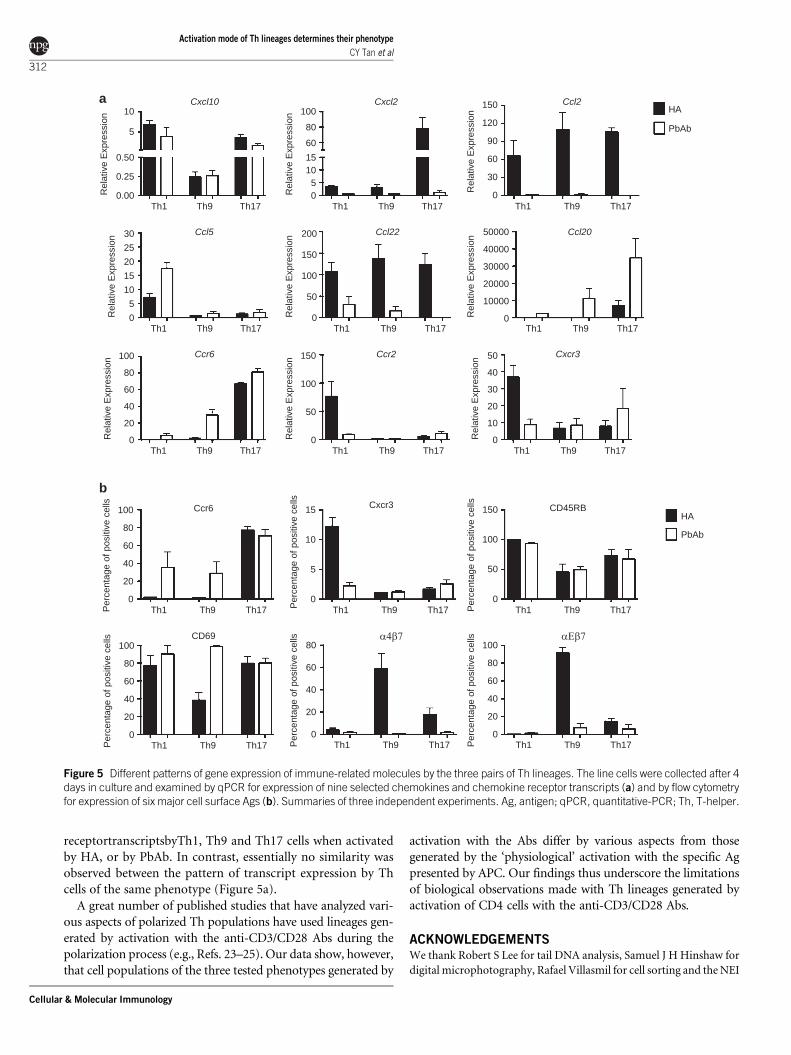
ments are combined in Figure 5a and show in general
remarkable differences between Th lineages activated by
either HA or PbAb in their expression levels of the tested
transcripts. Interestingly, similar patterns of difference
between the pairs of transcripts were seen for five of the
nine transcripts of lineages generated by activation with
either HA or PbAb. Thus, the expression levels of transcripts
for Cxcl2, Ccl2 and Ccl22 were higher in Th1, Th9 and Th17
cells activated by HA, whereas cells activated by PbAb
expressed higher transcript levels of Ccl5 and Ccl20 than
did the corresponding HA cultures. No clear consistency
was seen, however, in the transcript expression levels of
Ccr6, Ccr2, Cxcl10 and Cxcr3 between lineages activated by
HA or PbAb.
Th lineages generated by HA or PbAb differ in their profiles
of surface Ag markers
Another parameter related to mobility of Th cells and their
capacity to invade tissues is the profile of their surface Ags.
To compare between the surface Ag profiles of cells of lineages
generated by either HA or PbAb, we used flow cytometry with
Abs against six major surface Ags. Data of repeated three
experiments are summarized in Figure 5b. Remarkable diffe-
rences were observed between the lineage pairs of the three Th
phenotypes, activated by either one of the two modes, in their
staining for Ccr6, Cxcr3, a4b7 and aEb7. Only moderate or no
differences were seen, however, between the three lineage pairs
in their staining for CD45RB and CD69.
DISCUSSION
Data collected in this study demonstrate that lineages of Th1,
Th9 and Th17, generated by activation with plate-bound anti-
CD3/CD28 Abs (‘PbAb’) differ remarkably from lineages of the
same named phenotypes, activated by the physiological process
of interaction between the TCR on Th cells and the specific Ag,
HEL, presented by APC (‘HA’). The different lineages were
generated by activation by either one of the two tested modes
concurrently with the polarization by the corresponding cyto-
kines. The comparison between the two types of activation was
achieved by using T-cell populations of TCR Tg mice, which
were generated by activation with either PbAb or HA during
polarization, thus yielding the pairs of lineages of Th1, Th9 or
Th17 phenotypes we tested here.
Analysis of pathogenic capacity of the lineages, generated by
activation with either HA or PbAb, revealed similar capacities
by the two Th1 lineages, but sharp dissimilarities between the
pairs of lineages of Th17 and Th9 (Figure 2). Th17 cells gener-
ated by activation with HA induced severe inflammation in
recipient eyes, whereas no such activity could be detected in
Th17 lineages activated by the PbAb. In contrast, Th9 lineages
were consistently pathogenic only when activated by PbAb. The
difference between the two Th17 lineages observed here is in
line with our previous report.14 It is of interest that lineages of
pathogenic or non-pathogenic Th17 cells were also generated
in a study by McGeachy et al.,22 using a system different from
ours; in their system, pre-immunized cells were stimulated by
IL-23 or by IL-6/TGF-b, to generate pathogenic or non-patho-
genic Th17 cells, respectively. It is possible that the differences
in pathogenicity between lines generated by the different gen-
eration modes are related to variability in the cells’ capacity to
switch phenotypes, as shown for Th17.15
Pairs of lineages of the same phenotypes also differed in
their capacity to migrate to and proliferate in spleens of the
recipient mice, before moving on to invade the recipient’s
eyes, where the target Ag (HEL) was expressed (Figure 2).
Different patterns of migration and proliferation were
observed among lineages of the three Th phenotypes and,
in particular, between the pairs of Th9cells generated by
either one of the activation modes. The differences in the
migration capacity, as well as the pathogenicity of the
lineages, could be attributed, at least in part, to differences
we found in expression of chemokines and their receptors
(Figure 5a), as well as of surface Ags (Figure 5b). These two
families of molecules determine to a large extent the cells’
mobility and their capacity to invade the target tissue.
Surprisingly, the pattern of differences in expression of the
nine tested chemokines and chemokine receptor transcripts
was found here to be similar for five transcripts among Th of
the three different phenotypes (Th1, Th9 and Th17) when
activated by the same mode, i.e., by either HA or PbAb.
Striking differences between lineage pairs, generated by
activation with either PbAb or HA, were also found by the
microarray analysis. Of particular interest is the observation
we made by the hierarchical clustering analysis, namely, that
the patterns of changes in gene expression were more similar
among the subpopulations of Th1, Th9 and Th17, activated
with either PbAb or HA, than were the similarity levels between
the pairs of subpopulations of each of the three phenotypes
(Th1, Th9 and Th17) (Figure 4a). Furthermore, our analysis
revealed that 14 genes were highly expressed specifically by
subpopulations of Th cells of the three phenotypes, activated
with either HA or PbAb (Figure 4b), suggesting that the mode
of activation of Th lineages critically affects the gene expression
patterns during the polarization process. Moreover, this notion
is in line with our other observation, mentioned above, of
similarity in expression profiles of chemokine and chemokine
Activation mode of Th lineages determines their phenotype
CY Tan et al
311
Cellular & Molecular Immunology
receptortranscriptsbyTh1, Th9 and Th17 cells when activated
by HA, or by PbAb. In contrast, essentially no similarity was
observed between the pattern of transcript expression by Th
cells of the same phenotype (Figure 5a).
A great number of published studies that have analyzed vari-
ous aspects of polarized Th populations have used lineages gen-
erated by activation with the anti-CD3/CD28 Abs during the
polarization process (e.g., Refs. 23–25). Our data show, however,
that cell populations of the three tested phenotypes generated by
activation with the Abs differ by various aspects from those
generated by the ‘physiological’ activation with the specific Ag
presented by APC. Our findings thus underscore the limitations
of biological observations made with Th lineages generated by
activation of CD4 cells with the anti-CD3/CD28 Abs.
ACKNOWLEDGEMENTS
We thank Robert S Lee for tail DNA analysis, Samuel J H Hinshaw for
digital microphotography, Rafael Villasmil for cell sorting and the NEI
5
0.50
Rel
ativ
e E
xpre
ssio
n
0.25
10a
b
0.00Th9
Cxcl10
Th1 Th17
Rel
ativ
e E
xpre
ssio
n 302520151050
Th9
Ccl5
Th1 Th17
Rel
ativ
e E
xpre
ssio
n 100
80
60
40
20
0Th9
Ccr6
Th1 Th17
Per
cent
age
of p
ositi
ve c
ells
80
60
40
20
100
0Th9
Ccr6
Th1 Th17
Per
cent
age
of p
ositi
ve c
ells
80
60
40
20
100
0Th9
CD69
Th1 Th17 Per
cent
age
of p
ositi
ve c
ells
80
60
40
20
0Th9
a4b7
Th1 Th17 Per
cent
age
of p
ositi
ve c
ells
80
60
40
20
100
0Th9
aEb7
Th1 Th17
Per
cent
age
of p
ositi
ve c
ells
10
5
15
0Th9
Cxcr3
Th1 Th17 Per
cent
age
of p
ositi
ve c
ells
100
50
150
0Th9
CD45RB
Th1 Th17
Rel
ativ
e E
xpre
ssio
n 150
100
50
0Th9
Ccr2
Th1 Th17
Rel
ativ
e E
xpre
ssio
n
40
30
20
10
50
0Th9
Cxcr3
Th1 Th17
Rel
ativ
e E
xpre
ssio
n 200
150
100
50
0Th9
Ccl22
Th1 Th17
Rel
ativ
e E
xpre
ssio
n
40000
30000
20000
10000
50000
0Th9
Ccl20
Th1 Th17
80
15
Rel
ativ
e E
xpre
ssio
n 100
60
1050
Th9
Cxcl2
Th1 Th17
120HA
PbAb
HA
PbAb
60
Rel
ativ
e E
xpre
ssio
n
150
90
30
0Th9
Ccl2
Th1 Th17
Figure 5 Different patterns of gene expression of immune-related molecules by the three pairs of Th lineages. The line cells were collected after 4days in culture and examined by qPCR for expression of nine selected chemokines and chemokine receptor transcripts (a) and by flow cytometryfor expression of six major cell surface Ags (b). Summaries of three independent experiments. Ag, antigen; qPCR, quantitative-PCR; Th, T-helper.
Activation mode of Th lineages determines their phenotype
CY Tan et al
312
Cellular & Molecular Immunology

Histology Core Facility for tissue section preparations. This work was
supported by the Intramural Research Program of the National Eye
Institute, NIH.
1 Zhu J, Paul WE. Heterogeneity and plasticity of T helper cells. Cell Res2010; 20: 4–12.
2 Jiang S, Dong C. A complex issue on CD41 T-cell subsets. ImmunolRev 2013; 252: 5–11.
3 Kanno Y, VahediG,HiraharaK, SingletonK,O’Shea JJ. Transcriptionaland epigenetic control of T helper cell specification: molecularmechanisms underlying commitment and plasticity. Annu RevImmunol 2012; 30: 707–731.
4 Noelle RJ, Nowak EC. Cellular sources and immune functions ofinterleukin-9. Nat Rev Immunol 2010; 10: 683–687.
5 Goswami R, Kaplan MH. A brief history of IL-9. J Immunol 2011; 186:3283–3288.
6 Tan C, Gery I. The unique features of Th9 cells and their products. CritRev Immunol 2012; 32: 1–10.
7 Eyerich S, Eyerich K, Pennino D, Carbone T, Nasorri F, Pallotta S et al.Th22 cells represent a distinct human T cell subset involved inepidermal immunity and remodeling. J Clin Invest 2009; 119:3573–3585.
8 Katz JD, Benoist C, Mathis D. T helper cell subsets in insulin-dependent diabetes. Science 1995; 268: 1185–1188.
9 Lafaille JJ, Keere FV, Hsu AL, Baron JL, Hass W, Raine CS et al. Myelinbasic protein-specific T helper 2 (Th2) cells cause experimentalautoimmune encephalomyelitis in immunodeficient hosts ratherthan protect them from the disease. J Exp Med 1997; 186: 307–312.
10 Riddell SR, Greenberg PD. The use of anti-CD3 and anti-CD28monoclonal antibodies to clone and expand human antigen-specificT cells. J Immunol Methods 1990; 128: 189–201.
11 Kim SJ, Zhang M, Vistica BP, Chan CC, Shen DF, Wawrousek EF et al.Induction of ocular inflammation by T-helper lymphocytes type 2.Invest Ophthalmol Vis Sci 2002; 43: 758–765.
12 Iqbal N, Oliver JR, Wagner FH, Lazenby AS, Elson CO, Weaver CT. Thelper 1 and T helper 2 cells are pathogenic in an antigen-specificmodel of colitis. J Exp Med 2002; 195: 71–84.
13 Trickett A, Kwan YL. T cell stimulation and expansion using anti-CD3/CD28 beads. J Immunol Methods 2003; 275: 251–255.
14 Shi G, Lovaas JD, Tan C, Vistica BP, Wawrousek EF, Aziz MK et al.Cell–cell interaction with APC, not IL-23, is required for naive CD4
cells to acquire pathogenicity during Th17 lineage commitment.J Immunol 2012; 189: 1220–1227.
15 Shi G, Cox CA, Vistica BP, Tan C, Wawrousek EF, Gery I. Phenotypeswitching by inflammation-inducing polarized Th17 cells, but not byTh1 cells. J Immunol 2008; 181: 7205–7213.
16 Tan C, Aziz MK, Lovaas JD, Vistica BP, Shi G, Wawrousek EF et al.Antigen-specific Th9 cells exhibit uniqueness in their kinetics ofcytokine production and short retention at the inflammatory site. JImmunol 2010; 185: 6795–6801.
17 Lai JC, FukushimaA, Wawrousek EF, LobanoffMC, CharukamnoetkanokP, Smith-Gill SJ et al. Immunotolerance against a foreign antigentransgenically expressed in the lens. Invest Ophthalmol Vis Sci 1998;39: 2049–2057.
18 Chen J, Fujimoto C, Vistica BP, He J, Wawrousek EF, Kelsall B et al.Active participation of antigen-nonspecific lymphoid cells inimmune-mediated inflammation. J Immunol 2006; 177: 3362–3368.
19 Heidel JD, Liu JY, Yen Y, Zhou B, Heale BSE, Rossi JJ et al. PotentsiRNA inhibitors of ribonucleotide reductase subunit RRM2 reducecell proliferation in vitro and in vivo. Clin Cancer Res 2007; 13:2207–2215.
20 Rahman MA, Amin AR, Wang D, Koenig L, Nannapaneni S, Chen Zet al. RRM2 regulates Bcl-2 in head and neck and lung cancers: apotential target for cancer therapy. Clin Cancer Res 2013; 19: 3416–3428.
21 Biswas PS, Bhagat G, Pernis AB. IRF4 and its regulators: evolvinginsights into the pathogenesis of inflammatory arthritis? Immunol Rev2010; 233: 79–96.
22 McGeachy MJ, Bak-Jensen KS, Chen Y, Tato CM, Blumenschein W,McClanahan T et al. TGF-beta and IL-6 drive the production of IL-17and IL-10 by T cells and restrain TH-17 cell-mediated pathology. NatImmunol 2007; 8: 1390–1397.
23 Davidson TS, DiPaolo RJ, Andersson J, Shevach EM. Cutting edge: IL-2 is essential for TGF-beta-mediated induction of Foxp31 T regulatorycells. J Immunol 2007; 178: 4022–4026.
24 Jager A, Dardalhon V, Sobel RA, Bettelli E, Kuchroo VK. Th1, Th17, andTh9 effector cells induce experimental autoimmune encephalomyelitiswith different pathological phenotypes. J Immunol 2009; 183: 7169–7177.
25 Veldhoen M, Uyttenhove C, van Snick J, Helmby H, Westendorf A,Buer J et al. Transforming growth factor-beta ‘reprograms’ thedifferentiation of T helper 2 cells and promotes an interleukin 9-producing subset. Nat Immunol 2008; 9: 1341–1346.
Activation mode of Th lineages determines their phenotype
CY Tan et al
313
Cellular & Molecular Immunology
Copyright © 2022 FDOKUMEN