Cross Talk between CD3 and CD28 Is Spatially Modulated by Protein Lateral Mobility
Upload
independentCategory
view
4download
0
doi:10.1182/blood-2007-04-083139Prepublished online September 5, 2007;2007 110: 3936-3948
Marina Daouya, Julien Caumartin, Joel LeMaoult, Edgardo D. Carosella and Nathalie Rouas-FreissAbderrahim Naji, Solene Le Rond, Antoine Durrbach, Irene Krawice-Radanne, Caroline Creput, acceptanceperipheral blood suppressor T-cell subsets involved in transplant CD3+CD4low and CD3+CD8low are induced by HLA-G: novel human
http://bloodjournal.hematologylibrary.org/content/110/12/3936.full.htmlUpdated information and services can be found at:
(1880 articles)Transplantation � (5019 articles)Immunobiology �
Articles on similar topics can be found in the following Blood collections
http://bloodjournal.hematologylibrary.org/site/misc/rights.xhtml#repub_requestsInformation about reproducing this article in parts or in its entirety may be found online at:
http://bloodjournal.hematologylibrary.org/site/misc/rights.xhtml#reprintsInformation about ordering reprints may be found online at:
http://bloodjournal.hematologylibrary.org/site/subscriptions/index.xhtmlInformation about subscriptions and ASH membership may be found online at:
Copyright 2011 by The American Society of Hematology; all rights reserved.Washington DC 20036.by the American Society of Hematology, 2021 L St, NW, Suite 900, Blood (print ISSN 0006-4971, online ISSN 1528-0020), is published weekly
For personal use only. by guest on June 2, 2013. bloodjournal.hematologylibrary.orgFrom

IMMUNOBIOLOGY
CD3�CD4low and CD3�CD8low are induced by HLA-G: novel human peripheralblood suppressor T-cell subsets involved in transplant acceptanceAbderrahim Naji,1 Solene Le Rond,1 Antoine Durrbach,2 Irene Krawice-Radanne,1 Caroline Creput,2 Marina Daouya,1
Julien Caumartin,1 Joel LeMaoult,1 Edgardo D. Carosella,1 and Nathalie Rouas-Freiss1
1Service de Recherches en Hemato-Immunologie, Commissariat a l’energie atomique-Direction des science, du vivant-Departement de la recherche medical(CEA-DSV-DRM), Hopital Saint-Louis, Institut Universitaire d’Hematologie (IUH), Paris; and 2Departement de Nephrologie et Transplantation, Hopital duKremlin-Bicetre, Le Kremlin-Bicetre, France
HLA-G is a tolerogenic molecule whosedetection in sera and within allograftedtissues is associated with better graftacceptance. HLA-G mediates T-cell differ-entiation into suppressor cells, which arethought to promote tolerance. Here, weinvestigated such T cells phenotypicallyand functionally and assessed their clini-cal relevance in the peripheral blood ofpatients who have undergone transplanta-tion. Our results demonstrate that HLA-Gexpressed by antigen-presenting cellsor present as soluble protein down-regulates the expression of CD4 and CD8
on allostimulated T cells at both transcrip-tional and posttranslational levels. TheseCD3�CD4low and CD3�CD8low T-cell sub-sets are characterized by an increasedproportion of cells expressing CD45RAand HLA-DR, and a decreased number ofcells expressing CD62L. In addition, theseHLA-G–induced CD3�CD4low andCD3�CD8low subpopulations are Foxp3-negative suppressor T cells whose func-tion involves IL-10. Biologic relevancecame from analysis of patients who under-went transplantation, with high HLA-Gplasma concentrations associated with
better graft survival. Peripheral blood fromthese patients contains increased levelsof IL-10 concomitantly to an enhancedrepresentation of CD3�CD4low andCD3�CD8low T cells compared with HLA-G–negative patients who underwent trans-plantation and healthy individuals. Thesedata define novel immunosuppressivesubpopulations of peripheral blood T cellsinduced by HLA-G with potent implica-tions in peripheral tolerance. (Blood. 2007;110:3936-3948)
© 2007 by The American Society of Hematology
Introduction
Although central tolerance mechanisms delete the majority ofautoreactive T cells during a tightly controlled selection in thethymus, peripheral tolerance is required to avoid autoimmunity oraberrant immune responses.1 Furthermore, the induction of periph-eral tolerance is a major goal in human allotransplantation whereallograft rejection is mediated mainly by recipient alloreactive Tcells.2 T-cell activation by antigen-presenting cells (APCs) needs atleast 2 signals: the first is mediated by interaction of the T-cellreceptor (TCR)–CD3 complex associated with CD4 or CD8coreceptors with MHC class II or class I molecules on APCs,respectively. The second signal is costimulatory and originatesfrom the engagement of CD28 with its ligands CD80/CD86 onAPCs. Disrupting one of these signals may constitute a veryefficient way to inhibit CD4� and CD8� T-cell activation, withtherapeutic potential to prevent organ transplant rejection.3
HLA-G can be expressed as 7 different isoforms including 4membrane-bound (HLA-G1 to -G4) and 3 soluble (HLA-G5 to-G7) proteins due to alternative splicing of the HLA-G primarytranscript (see review in Carosella et al4). The HLA-G5 solubleisoform (37 kDa) differs from the membrane-anchored HLA-G1protein (39 kDa) by the absence of both the transmembrane regionand the cytoplasmic tail, which are substituted by a specificC-terminus sequence. The �1 and �2 heavy chain domains makethe peptide-binding groove, while the �3 domain associated withthe �2 microglobulin interacts with the CD8 T-cell coreceptor.5
HLA-G does not induce immune responses through TCR interac-
tions but rather inhibits both natural killer (NK)– and cytotoxic Tlymphocyte (CTL)–mediated cytolysis through binding to inhibi-tory receptors.6 To date, 3 HLA-G receptors have been identified:the killer immunoglobulin-like receptor KIR2DL4/CD158d7 andthe leukocyte immunoglobulin (Ig)–like receptors LILRB1/ILT-2/CD85j and LILRB2/ILT-4/CD85d.8 KIR2DL4 expression is re-stricted to NK cells, and ILT-4 is myeloid lineage specific, whileILT-2 is expressed by monocytes, dendritic cells, T cells, B cells,and NK cells. With such a large distribution of HLA-G receptors,various immune functions may be altered by HLA-G, such as T-cellproliferation9 and dendritic cell (DC) maturation.10,11
In opposition to classical HLA-class I molecules, HLA-G is oflow polymorphism and its expression is found in a limited numberof healthy tissues.4 HLA-G was first identified in cytotrophoblastwhere it is involved in the maternal-fetal tolerance.12 However,HLA-G expression can be up-regulated in various tissues under“pathological” conditions such as allotransplantation.13 Indeed, anincreasing number of clinical studies reported HLA-G expressionin recipients who did not reject their allograft following hearttransplantation,14-16 kidney transplantation,17 liver transplanta-tion,18 and liver-kidney transplantation.19,20 Concomitantly, in vitrofunctional studies showed that T cells stimulated by HLA-G1–expressing APCs9 or sensitized by HLA-G521 differentiate intosuppressor T cells. These HLA-G–induced T cells were found to bedifferent from the naturally occurring CD4�CD25� regulatory Tcells.21,22 Up to now, their precise phenotype, cytokine context,
Submitted April 2, 2007; accepted July 29, 2007. Prepublished online as BloodFirst Edition paper, September 5, 2007; DOI 10.1182/blood-2007-04-083139.
The publication costs of this article were defrayed in part by page charge
payment. Therefore, and solely to indicate this fact, this article is herebymarked ‘‘advertisement’’ in accordance with 18 USC section 1734.
© 2007 by The American Society of Hematology
3936 BLOOD, 1 DECEMBER 2007 � VOLUME 110, NUMBER 12
For personal use only. by guest on June 2, 2013. bloodjournal.hematologylibrary.orgFrom

mechanism of action, and in vivo relevance remained to becharacterized. The aim of this work was to address these points invitro in mixed lymphocyte reactions and in vivo in humanallotransplantation.
Patients, materials, and methods
APC-HLA-G1s and HLA-G5–secreting cells
The HLA class II� human B-lymphoblastoid cell line LCL 721.221 (ATCC,Manassas, VA) was transfected by electroporation with either pRc/RSVvector alone (Invitrogen, Frederick, MD) or the pRc/RSV vector containingthe HLA-G1 cDNA, to obtain LCL-RSV and LCL-HLA-G1 cells, respec-tively.23 The LCL-HLA-G1 cells strongly expressed HLA-G1 at their cellsurface (Figure 1A box). We used LCL-RSV and LCL-HLA-G1 as anAPC-like model expressing or not HLA-G1.24 These cells will be referredin the text as APCs and APC-HLA-G1s, respectively. The HLA classI–positive, HLA-G–negative, M8 melanoma cell line was transfected withthe pcDNA3.1 vector (Invitrogen) either alone to generate M8-pcDNA orcontaining the HLA-G5 cDNA to produce M8-HLA-G5 cells, as describedpreviously.6
Patients who underwent transplantation and controlindividuals
Blood samples from patients who received a kidney transplant (KT), livertransplant (LT), or combined liver-kidney transplant (LKT) were collectedduring their clinical follow-up. Thirty-four KT patients (Kremlin BicetreHospital, Le Kremlin-Bicetre, France), 21 LT patients (Paul BrousseHospital, Villejuif, France), and 44 LKT patients (Paul Brousse Hospital,Villejuif, France) were investigated in the present study. Within a popula-tion that underwent transplantation, patients were divided into 3 groupsaccording to the time interval between transplantation and blood collection.Patient characteristics are described in Table 1, Table 2, and Table 3 for KT,LT, and LKT populations, respectively. All patients had stable graft functionat the time of blood collection. Histologic lesions of acute or chronic graftrejection were classified according to the Banff classification. Controlindividuals (n � 14) were healthy volunteer blood donors (HDs) fromFrench Blood Establishment (EFS, Saint-Louis Hospital, Paris, France).The healthy donor population was age matched (49 � 9 years old) with thatof patients who underwent transplantation. Plasma and peripheral bloodmononuclear cells (PBMCs) were isolated from blood samples to investi-gate plasma levels of soluble HLA-G, IL-10, and soluble CD4/CD8 andphenotype of peripheral T cells. Informed consent was obtained from allpatients in accordance with the Declaration of Helsinki, and the study wasapproved by the local ethics committee at the Hospital Saint-Louis.
Cell preparation, culture procedure, MLR, and suppressionassays
PBMCs from heparinized whole blood of HDs, and KT, LT, or LKT patientswere obtained by density-gradient centrifugation over Ficoll-histopaque1077 (Sigma, St Louis, MO). For allostimulation assays, PBMCs were usedas responder or �-irradiated stimulator cells (25 Gy). When lymphoblastoidcell lines (LCLs) were used as stimulator cells, a 75-Gy dose irradiation wasgiven. For each allostimulation, responder-stimulator ratio was of 1:1 with afinal concentration of responder cells of 106 cells/mL. Suppression assaysused �-irradiated third-party cells (25 Gy) added to the mixed lymphocytereaction (MLR) at a responder–stimulator–third-party cell ratio of 1:1:1,except for dose-response assays. T-cell proliferation was measured at day 6of MLR, as previously described.25 When indicated, suppression assayswere performed using transwell (0.4 �m) culture system (Greiner bio-one,San Diego, CA). For large-scale allostimulation experiments, 40 � 106
responder cells were cocultured with �-irradiated allogeneic stimulatorcells at a ratio of 1:1 and at a final concentration of responder cells of 106
cells/mL. Each allostimulation or suppression assay was performed withPBMCs from at least 3 distinct healthy donors.
CD4� and CD8� T-cell isolation
After 6 days of MLR in presence or in absence of HLA-G, allostimulatedCD4� and CD8� T cells were isolated by positive selection, respectively,using either CD4 or CD8 immunomagnetic beads according to themanufacturer’s instructions (Dynal Biotech, Lake Success, NY). Positivelyselected CD4� and CD8� T-cell populations were collected after releasefrom magnetic beads by overnight incubation at 37°C. Purity of eachfraction was checked by flow cytometry showing that CD4� and CD8�
fractions were more than 95%. In case of allostimulation using irradiatedAPC-HLA-G1s, we checked that none of these cells remained after 6 daysof MLR, attesting that any contaminating HLA-G1� cell was present in theCD4� and CD8� isolated T-cell fractions that were subsequently used insuppression assays.
Antibodies and flow cytometric analysis
The following Abs were used: MEM-G/9 anti–HLA-G1/HLA-G5 (Exbio,Vestec, Czech Republic); 5A6G7 anti–HLA-G5 (Exbio). Antibodies usedfor flow cytometric analyses were conjugated with either FITC, PE, ECD,or PC5 (Beckman Coulter, Hialeah, FL), except PD1-FITC (Pharmingen,San Diego, CA) and GITR-PE (R&D Systems, Minneapolis, MN). Briefly,cells were first incubated 30 minutes at 4°C in 20% human serum. Isotypecontrol was systematically used to evaluate and compensate nonspecificsignal. Cells were analyzed on EPICS XL4 cytometer using Expo32software (Beckman Coulter).
Intracellular Foxp3 staining was performed using Alexa 488–conjugated antihuman Foxp3 Ab (clone 259D; Ozyme, Saint Quentin,France). To assess cell permeabilization, anti–�-tubulin (Sigma) was usedas control. T cells activated for 48 hours with 5 �g/mL anti-CD3 Ab(OKT-3; BD Biosciences, San Jose, CA) and 1 �g/mL soluble anti-CD28Ab (clone CD28.2; eBioscience, San Diego, CA) in the presence of100 U/mL IL-2 (Sigma) were used as Foxp3 expression positive control.26
Anti–IL-10 blocking experiments
To neutralize IL-10, anti–IL-10 mAb (clone B-S10; Diaclone, Besancon,France) was added at a concentration of 10 �g/mL on days 1 and 3 inallostimulation or suppression assay.27 An irrelevant isotype Ab was used asa control at the same concentration.
Real-time reverse-transcription–polymerase chain reactionanalysis
Total mRNA were extracted from healthy donor’s peripheral bloodleukocytes (PBLs; calibrator) and allostimulated T cells and reverse-transcribed to generate cDNA. Multiplex PCR amplifications were per-formed using commercially available primers and probe for CD4 and CD8�(Hs00181217 m1 and Hs00233520 m1, respectively; Applied Biosys-tems, Courtaboeuf, France) according to manufacturer’s instructions.GAPDH was used as an internal standard; primer and probe were purchasedfrom Applied Biosystems. Relative quantification was analyzed using theCT method: CT � CT (CD4 or CD8) CT (GAPDH) and CT � CT
(sample) CT (calibrator). Relative expressions are given as 2CT.
ELISA
Soluble HLA-G concentrations were measured in plasma from KT, LT, andLKT patients, and HDs, as well as in supernatants from M8 transfectants.Two distinct enzyme-linked immunosorbent assay (ELISA) were used thatdetect either both shed HLA-G1 and HLA-G5 (MEM-G/9 as captureantibody and anti-�2m as detection antibody) or HLA-G5 specifically(5A6G7 as capture antibody and the Pan HLA class I W6/32 as detectionantibody), as described previously.28 Plasma samples were diluted 1⁄2 or 1⁄4prior to measuring HLA-G.
IL-2, IFN-�, IL-4, and IL-10 were measured by Th1/Th2 human ELISAkits (eBioscience), according to the manufacturer’s instructions. ELISAwas performed using either MLR or suppressor assay supernatants orundiluted plasma from KT, LT, and LKT patients. Soluble CD4 and CD8
HLA-G DRIVES SUPPRESSOR CD4low AND CD8low T CELLS 3937BLOOD, 1 DECEMBER 2007 � VOLUME 110, NUMBER 12
For personal use only. by guest on June 2, 2013. bloodjournal.hematologylibrary.orgFrom
molecules were quantified in similar samples using specific ELISA kits (USBiological, Swampscott, MA; and Bender Med System, Vienna, Austria).
Statistical analysis
Statistical analysis was performed with Student t test; ANOVA test andlinear regression analyses were used to assess significance and correlationbetween variables. The Kaplan-Meier method was used to estimate thesurvival time without acute and chronic rejection. Survival differences wereanalyzed using the log-rank test. Statistical test, P value, and significancewere given with the results assuming P values less than .05 as significant(** and *** at the top of histogram indicate P values less than .001.
Results
APC-HLA-G1s and soluble HLA-G5 induce immunosuppressiveT cells
We previously showed that T cells stimulated by HLA-G1–expressing APCs9 or sensitized by soluble HLA-G521 differenti-ate into suppressor T cells that were different from CD4�CD25�
regulatory T cells.21 To identify and characterize these HLA-G–
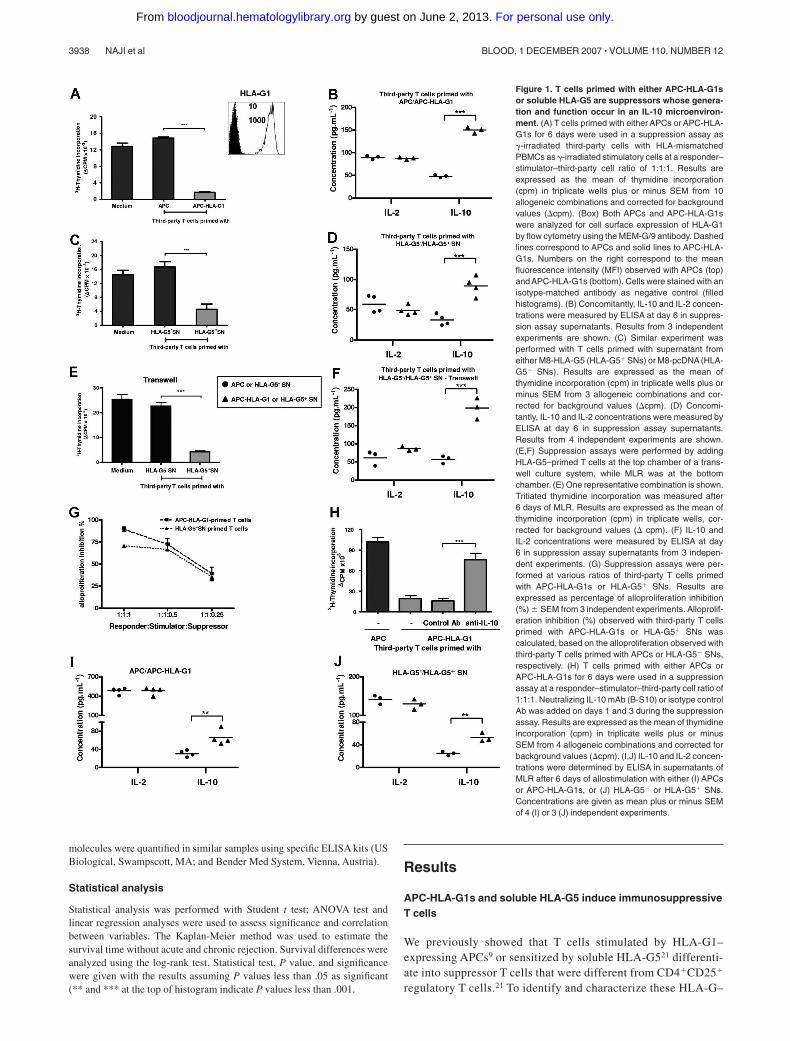
Figure 1. T cells primed with either APC-HLA-G1sor soluble HLA-G5 are suppressors whose genera-tion and function occur in an IL-10 microenviron-ment. (A) T cells primed with either APCs or APC-HLA-G1s for 6 days were used in a suppression assay as�-irradiated third-party cells with HLA-mismatchedPBMCs as �-irradiated stimulatory cells at a responder–stimulator–third-party cell ratio of 1:1:1. Results areexpressed as the mean of thymidine incorporation(cpm) in triplicate wells plus or minus SEM from 10allogeneic combinations and corrected for backgroundvalues (cpm). (Box) Both APCs and APC-HLA-G1swere analyzed for cell surface expression of HLA-G1by flow cytometry using the MEM-G/9 antibody. Dashedlines correspond to APCs and solid lines to APC-HLA-G1s. Numbers on the right correspond to the meanfluorescence intensity (MFI) observed with APCs (top)and APC-HLA-G1s (bottom). Cells were stained with anisotype-matched antibody as negative control (filledhistograms). (B) Concomitantly, IL-10 and IL-2 concen-trations were measured by ELISA at day 6 in suppres-sion assay supernatants. Results from 3 independentexperiments are shown. (C) Similar experiment wasperformed with T cells primed with supernatant fromeither M8-HLA-G5 (HLA-G5� SNs) or M8-pcDNA (HLA-G5 SNs). Results are expressed as the mean ofthymidine incorporation (cpm) in triplicate wells plus orminus SEM from 3 allogeneic combinations and cor-rected for background values (cpm). (D) Concomi-tantly, IL-10 and IL-2 concentrations were measured byELISA at day 6 in suppression assay supernatants.Results from 4 independent experiments are shown.(E,F) Suppression assays were performed by addingHLA-G5–primed T cells at the top chamber of a trans-well culture system, while MLR was at the bottomchamber. (E) One representative combination is shown.Tritiated thymidine incorporation was measured after6 days of MLR. Results are expressed as the mean ofthymidine incorporation (cpm) in triplicate wells, cor-rected for background values ( cpm). (F) IL-10 andIL-2 concentrations were measured by ELISA at day6 in suppression assay supernatants from 3 indepen-dent experiments. (G) Suppression assays were per-formed at various ratios of third-party T cells primedwith APC-HLA-G1s or HLA-G5� SNs. Results areexpressed as percentage of alloproliferation inhibition(%) � SEM from 3 independent experiments. Alloprolif-eration inhibition (%) observed with third-party T cellsprimed with APC-HLA-G1s or HLA-G5� SNs wascalculated, based on the alloproliferation observed withthird-party T cells primed with APCs or HLA-G5 SNs,respectively. (H) T cells primed with either APCs orAPC-HLA-G1s for 6 days were used in a suppressionassay at a responder–stimulator–third-party cell ratio of1:1:1. Neutralizing IL-10 mAb (B-S10) or isotype controlAb was added on days 1 and 3 during the suppressionassay. Results are expressed as the mean of thymidineincorporation (cpm) in triplicate wells plus or minusSEM from 4 allogeneic combinations and corrected forbackground values (cpm). (I,J) IL-10 and IL-2 concen-trations were determined by ELISA in supernatants ofMLR after 6 days of allostimulation with either (I) APCsor APC-HLA-G1s, or (J) HLA-G5 or HLA-G5� SNs.Concentrations are given as mean plus or minus SEMof 4 (I) or 3 (J) independent experiments.
3938 NAJI et al BLOOD, 1 DECEMBER 2007 � VOLUME 110, NUMBER 12
For personal use only. by guest on June 2, 2013. bloodjournal.hematologylibrary.orgFrom
induced T cells, we here used HLA-G as either a membrane formpresented at the cell surface of APCs or a soluble form releasedin biologic fluids. Previously, the direct role of HLA-G ininhibiting T-cell alloproliferation was demonstrated in these 2expression models.24 Both HLA-G forms are biologically rel-evant in transplantation since infiltrating mononuclear cellsexpressing HLA-G were detected in vivo within grafted tissues,and since high serum levels of soluble HLA-G were measured inpatients who underwent transplantation who had better graftacceptance.18,19
First, we analyzed induction of immunosuppressive T cells byHLA-G. T cells were primed with either APCs or APC-HLA-G1sand then tested as �-irradiated third-party cells in suppressionassays. APC-HLA-G1–primed T cells highly inhibited alloprolifera-tion (n � 10, mean percentage inhibition of 88%, P � .001,Student t test) compared with T cells primed with HLA-G–negativeAPCs (Figure 1A). This inhibition was associated with an in-creased IL-10 secretion (n � 3, P � .001, Student t test), whileIL-2 levels remained stable (Figure 1B). Similar results wereobtained with HLA-G5–primed T cells that inhibited alloprolifera-tion by 70% when used as third-party cells (n � 3, P � .001,Student t test), concomitantly to a significant increase of IL-10secretion (n � 4, P � .001, Student t test) (Figure 1C,D). Theseresults were strengthened by (1) the correlation between the ratio ofthird-party T cells primed with APC-HLA-G1s or HLA-G5� SNs(suppressors) and the inhibition level of alloresponses (Figure 1G),and (2) transwell chamber experiments showing that HLA-G–
induced T cells do not require cell contact to exert their suppressivefunction but act through soluble factor(s), including IL-10 (Figure 1E,F).
IL-10 is required for the suppressive function ofHLA-G–induced T cells
We then analyzed the direct contribution of IL-10 to the suppres-sive function of HLA-G–induced T cells. Results showed thatneutralizing IL-10 with Ab reversed the suppressive activity ofHLA-G–induced T cells (Figure 1H). We next investigated whethera particular cytokinic microenvironment could be related to theirgeneration. Results showed that increased levels of IL-10 wereobserved at day 6 in MLR supernatants when APC-HLA-G1s(Figure 1I) or HLA-G5 (Figure 1J) was used to induce suppressor Tcells. By contrast, IL-4, IFN-�, and IL-2 levels did not vary in thesame experiments (data not shown and Figure 1I,J). Taken together,these results show that IL-10 is required for the suppressivefunction of HLA-G–primed T cells whose emergence occurs fromIL-10 microenvironment.
APC-HLA-G1s and soluble HLA-G5 induce CD3� T-cellsubpopulations expressing lowered levels of CD4 and CD8
To identify the phenotype of suppressor T cells induced by HLA-G,we then analyzed the expression of T-cell markers associated withsuppressive function. Flow cytometric analysis showed that thepercentage of positive cells as well as mean fluorescence intensityfor PD-1 (programmed cell death-1 protein), CD25 (IL-2 receptor
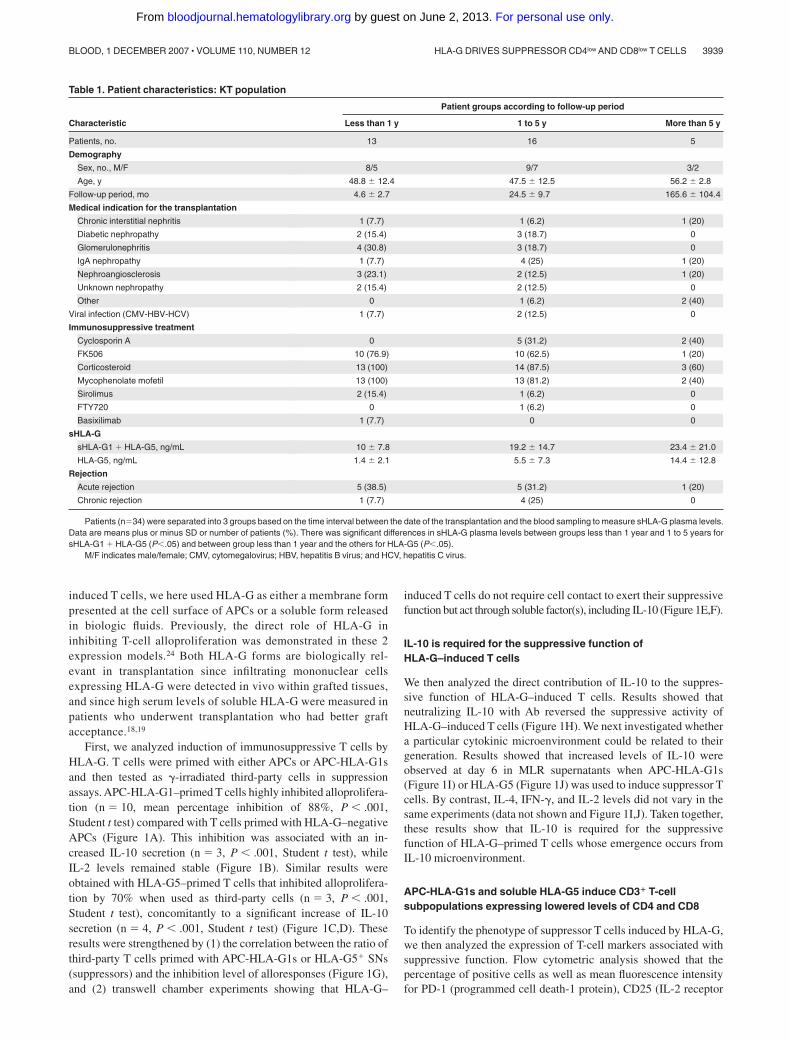
Table 1. Patient characteristics: KT population
Patient groups according to follow-up period
Characteristic Less than 1 y 1 to 5 y More than 5 y
Patients, no. 13 16 5
Demography
Sex, no., M/F 8/5 9/7 3/2
Age, y 48.8 � 12.4 47.5 � 12.5 56.2 � 2.8
Follow-up period, mo 4.6 � 2.7 24.5 � 9.7 165.6 � 104.4
Medical indication for the transplantation
Chronic interstitial nephritis 1 (7.7) 1 (6.2) 1 (20)
Diabetic nephropathy 2 (15.4) 3 (18.7) 0
Glomerulonephritis 4 (30.8) 3 (18.7) 0
IgA nephropathy 1 (7.7) 4 (25) 1 (20)
Nephroangiosclerosis 3 (23.1) 2 (12.5) 1 (20)
Unknown nephropathy 2 (15.4) 2 (12.5) 0
Other 0 1 (6.2) 2 (40)
Viral infection (CMV-HBV-HCV) 1 (7.7) 2 (12.5) 0
Immunosuppressive treatment
Cyclosporin A 0 5 (31.2) 2 (40)
FK506 10 (76.9) 10 (62.5) 1 (20)
Corticosteroid 13 (100) 14 (87.5) 3 (60)
Mycophenolate mofetil 13 (100) 13 (81.2) 2 (40)
Sirolimus 2 (15.4) 1 (6.2) 0
FTY720 0 1 (6.2) 0
Basixilimab 1 (7.7) 0 0
sHLA-G
sHLA-G1 � HLA-G5, ng/mL 10 � 7.8 19.2 � 14.7 23.4 � 21.0
HLA-G5, ng/mL 1.4 � 2.1 5.5 � 7.3 14.4 � 12.8
Rejection
Acute rejection 5 (38.5) 5 (31.2) 1 (20)
Chronic rejection 1 (7.7) 4 (25) 0
Patients (n�34) were separated into 3 groups based on the time interval between the date of the transplantation and the blood sampling to measure sHLA-G plasma levels.Data are means plus or minus SD or number of patients (%). There was significant differences in sHLA-G plasma levels between groups less than 1 year and 1 to 5 years forsHLA-G1 � HLA-G5 (P�.05) and between group less than 1 year and the others for HLA-G5 (P�.05).
M/F indicates male/female; CMV, cytomegalovirus; HBV, hepatitis B virus; and HCV, hepatitis C virus.
HLA-G DRIVES SUPPRESSOR CD4low AND CD8low T CELLS 3939BLOOD, 1 DECEMBER 2007 � VOLUME 110, NUMBER 12
For personal use only. by guest on June 2, 2013. bloodjournal.hematologylibrary.orgFrom

� chain), CD122 (IL-2 receptor � chain), CD152 (CTLA-4),CD137 (4–1BB), CD154 (CD40L), CD28, CD18 (integrin �2
chain), and GITR (glucocorticoid-induced tumor necrosis factorreceptor family related) did not vary among CD3�CD4� (Figure2A) and CD3�CD8� (Figure 2B) T cells that had been primed for 6days with APCs expressing or not HLA-G1. In addition, T cellsprimed with APCs or APC-HLA-G1s did not express intracellularFoxp3 protein, while activated T cells did as expected (Figure 2C).Similar results were obtained at day 3 (data not shown).
By contrast, there were striking differences in T-cell morphol-ogy between APC- and APC-HLA-G1–primed T cells. APC-primed T cells were enlarged, while APC-HLA-G1–primed T cellswere smaller with fewer granularities (Figure 3A). We showed thatallostimulation by APC-HLA-G1s induced T-cell subsets withlower cell surface expression of CD4 or CD8 coreceptor comparedwith APC-primed T cells (Figure 3B,C). Indeed, flow cytometricanalysis showed a 2-fold and 8-fold decrease of CD4 and CD8surface expression, respectively, on CD3� T cells primed withAPC-HLA-G1s compared with APC-primed T cells (Figure 3C).Interestingly, these CD3�CD4low and CD3�CD8low T cells showedhigher surface expression levels of CD3 (Figure 3B,C). SuchCD3�CD4low and CD3�CD8low T cells were found after 6 days ofallostimulation with APC-HLA-G1s. Similar results were observedwith T cells primed in presence of HLA-G5 (data not shown). SinceHLA-G–induced T cells emerge from IL-10 microenvironment(Figure 1I,J), we investigated whether this cytokine was directlyinvolved in their differentiation into CD3�CD4low and CD3�CD8low
T cells. In our experimental conditions, addition of neutralizingIL-10 mAb did not affect this differentiation. Indeed, CD4 MFI was58 (� 4) versus 55 (� 1) and CD8 MFI was 1182 (� 202) versus944 (� 105) with and without anti–IL-10 mAb, respectively (n � 3,
P � .05, Student t test). In these experiments, CD4 and CD8 MFIwas 84 (� 3) and 2192 (� 104), respectively, after T-cell primingin the absence of HLA-G.
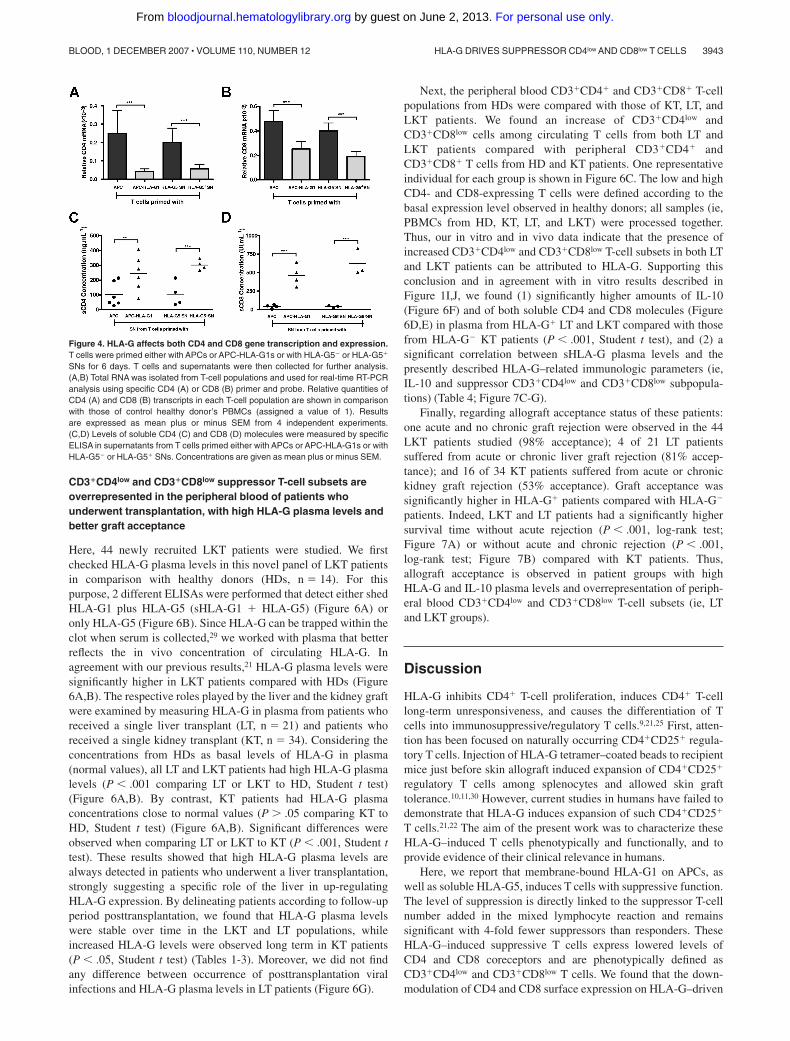
To define the level at which HLA-G downmodulates CD4 andCD8 expression, we first analyzed CD4 and CD8 gene transcrip-tion. Results showed that both CD4 (Figure 4A) and CD8 (Figure4B) transcriptional levels were significantly decreased in, respec-tively, HLA-G–induced CD3�CD4low and CD3�CD8low T cellscompared with T cells primed in absence of HLA-G (P � .001,Student t test) (Figure 4A,B). Second, we investigated whetherHLA-G–mediated CD4/CD8 downmodulation may also resultfrom a release of both molecules from T-cell surface. Resultsshowed that the amount of soluble CD4 (Figure 4C) and CD8(Figure 4D) molecules was significantly higher in supernatantsfrom HLA-G–induced T cells than in those of T cells primed inabsence of HLA-G (P � .001, Student t test).
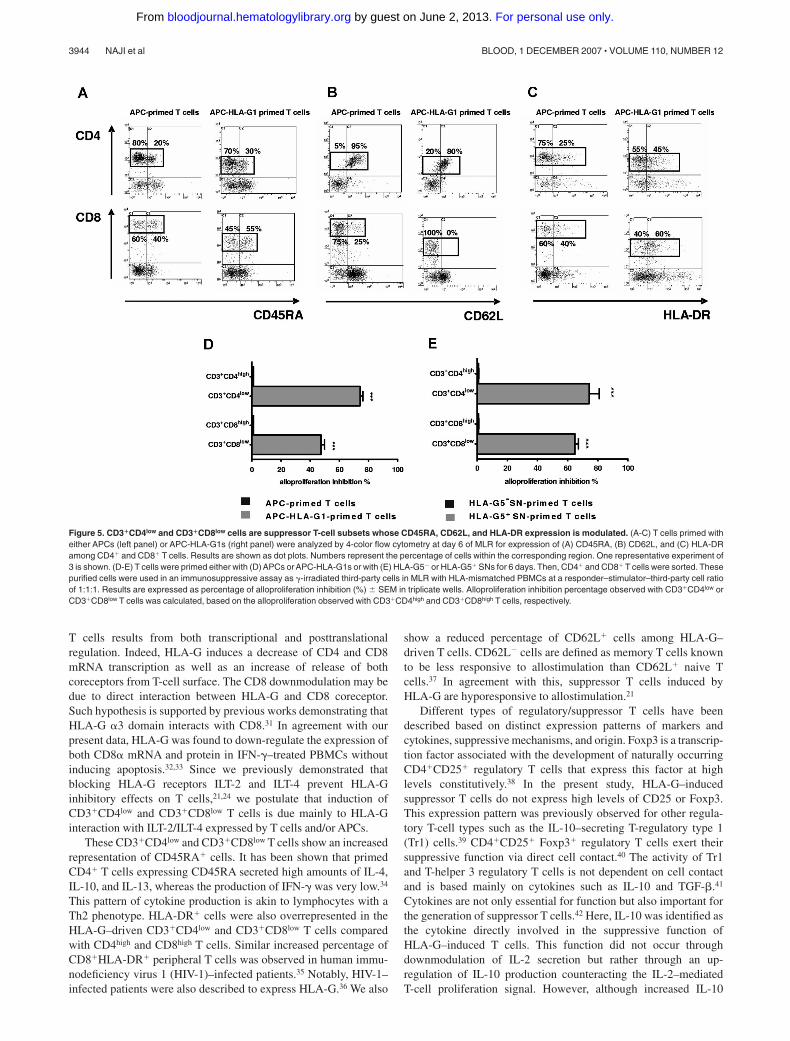
Extensive phenotypic analysis showed that the percentage of cellsexpressing CD45RA, HLA-DR, and CD62L differed amongCD3�CD4low and CD3�CD8low T cells compared with CD3�CD4high
and CD3�CD8high T cells primed without HLA-G (Figure 5). Indeed,CD4highCD45RA� T cells represented 20% of CD3�CD4high T cellsprimed with APCs, whereas CD4lowCD45RA� T cells represented 30%of CD3�CD4low T cells (Figure 5A). CD45RA� cells reached 55%among CD3�CD8low T cells, while they represented 40% of theCD3�CD8high T cells primed with APCs (Figure 5A). These differenceswere significant with a mean of CD4highCD45RA� versusCD4lowCD45RA� T cells: 20 (� 1) versus 33 (� 2), and a mean ofCD8highCD45RA� versus CD8lowCD45RA� T cells: 37 (� 1) versus53 (� 4); (n � 3, P � .05, Student t test). Interestingly, the percentageof HLA-DR� cells was increased in both CD3�CD4low and CD3�CD8low
T cells by more than 1.5-fold (Figure 5C). This enhancement was
Table 2. Patient characteristics: LT population
Patients groups according to follow-up period
Characteristic Less than 1 y 1 to 5 y More than 5 y
Patients, no. 5 8 8
Demography
Sex, no. M/F 2/3 4/4 5/3
Age, y 44.8 � 9.7 54.6 � 10.6 56.9 � 6.0
Follow-up period, mo 5.8 � 4.7 45 � 12.4 177.2 � 58.3
Medical indication for the transplantation
Viral cirrhosis 1 (20) 5 (62.5) 8 (100)
Alcoholic cirrhosis 2 (40) 0 0
Hyperoxaluria type 1/amyloidosis neuropathy 0 2 (25) 0
Autoimmune cirrhosis 0 1 (12.5) 0
Other 2 (40) 0 0
Viral hepatic recurrence
Hepatitis B virus 0 0 1 (12.5)
Hepatitis C virus 0 3 (37.5) 2 (25)
Immunosuppressive treatment
Cyclosporin A 0 2 (25) 7 (87.5)
FK506 5 (100) 6 (75) 1 (12.5)
Corticosteroid 5 (100) 7 (87.5) 5 (62.5)
Mycophenolate mofetil 5 (100) 7 (87.5) 5 (62.5)
Azathioprin 0 0 1 (12.5)
sHLA-G, ng/mL
sHLA-G1 � HLA-G5 102.6 � 6.2 116.5 � 35.9 134.1 � 50.3
HLA-G5 97 � 11.9 80.5 � 27.3 110.9 � 20.9
Rejection
Acute rejection 0 2 (25) 1 (12.5)
Chronic rejection 0 1 (12.5) 0
Patients (n�21) were separated into 3 groups based on the time interval between the date of the transplantation and the blood sampling to measure sHLA-G plasma levels.Data are means plus or minus SD or number of patients (%). There was no significant difference in sHLA-G plasma levels between follow-up period groups, except betweengroups 1 to 5 years and more than 5 years for HLA-G5 (P�.01).
3940 NAJI et al BLOOD, 1 DECEMBER 2007 � VOLUME 110, NUMBER 12
For personal use only. by guest on June 2, 2013. bloodjournal.hematologylibrary.orgFrom

significant with a mean of CD4highHLA-DR� versus CD4lowHLA-DR�
T cells: 28 (� 4) versus 48 (� 4), and a mean of CD8highHLA-DR�
versus CD8lowHLA-DR� T cells: 39 (� 4) versus 56 (� 3; n � 3,P � .05, Student t test). Concomitantly, CD62L� T-cell subsets de-creased among CD3�CD4low and CD3�CD8low T cells (Figure 5B).This diminution was significant with a mean of CD4highCD62L� versusCD4lowCD62L� T cells: 94 (� 3) versus 76 (� 3), and a mean ofCD8highCD62L� versus CD8lowCD62L� T cells: 21 (� 2) versus 5 (� 2;
n � 3, P � .05, Student t test). All these results were similarly observedwith T cells primed in presence of HLA-G5 (data not shown).
Both CD3�CD4low and CD3�CD8low T-cell subsets induced byHLA-G are suppressor cells
We next investigated whether the HLA-G–induced suppressive functionwas associated with the CD3�CD4low/CD3�CD8low phenotype. We
Figure 2. HLA-G–induced CD4� and CD8� T cells areFoxp3� and their expression of CD18, CD25, CD28,CD122, CD137, CD152, CD154, GITR, and PD1 is notmodulated. (A,B) T cells were primed with either APCsor APC-HLA-G1s and were analyzed by 4-color flowcytometry at day 6 of MLR for expression of PD1, GITR,CD25, CD122, CD152, CD137, CD154, CD28, andCD18 among the CD3�CD4� (A) and CD3�CD8� (B)T cells. Results are shown as histograms representingthe percentage of positive cells. One representativeexperiment of 5 is shown. (C) Intracellular Foxp3 proteinexpression was analyzed by flow cytometry in T cellsprimed with either APCs or APC-HLA-G1s at day 6 ofMLR. Analysis was done after cell permeabilization onCD3�-gated cells. Positive control of Foxp3 staining wasprovided by anti-CD3/anti-CD28 activated T cells. Perme-abilization was assessed by �-tubulin staining. Onerepresentative experiment of 3 is shown.
Table 3. Patient characteristics: LKT population
Patients groups according to follow-up period
Characteristic Less than 1 y 1 to 5 y More than 5 y
Patients, no. 14 18 12
Demography
Sex, M/F 11/3 10/8 8/4
Age, y 56.9 � 7.8 56 � 7.2 49.8 � 11.1
Follow-up period, mo 4.9 � 2.2 33.4 � 14.3 100.2 � 31.9
Medical indication for the transplantation
Viral cirrhosis 9 (64.3) 7 (38.9) 6 (50)
Alcoholic cirrhosis 4 (28.6) 3 (16.7) 2 (16.7)
Hyperoxaluria type 1/amyloidosis neuropathy 0 2 (11.1) 3 (25)
Liver-kidney polykystosis 1 (7.1) 3 (16.7) 0
Other 0 3 (16.7) 1 (8.3)
Viral hepatic recurrence
Hepatitis B virus 1 (7.1) 0 1 (8.3)
Hepatitis C virus 3 (21.4) 4 (22.2) 2 (16.7)
Immunosuppressive treatment
Cyclosporin A 0 3 (16.7) 4 (33.3)
FK506 13 (92.8) 14 (77.8) 4 (33.3)
Corticosteroid 8 (57.1) 7 (38.9) 10 (83.3)
Mycophenolate mofetil 6 (42.8) 7 (38.9) 4 (33.3)
Azathioprin 0 0 3 (25)
Everolimus 1 (7.1) 1 (5.6) 1 (8.3)
sHLA-G, ng/mL
sHLA-G1 � HLA-G5 251.4 � 88.8 214.3 � 108.9 238.5 � 139.2
HLA-G5 102.1 � 45.3 95.3 � 48.0 116.8 � 61.5
Rejection
Acute rejection 0 1 (5.6) 0
Chronic rejection 0 0 0
Patients (n�44) were separated into 3 groups based on the time interval between the date of the transplantation and the blood sampling to measure sHLA-G plasma levels.Data are means plus or minus SD or number of patients (%). There was no significant difference in sHLA-G plasma levels between follow-up period groups.
HLA-G DRIVES SUPPRESSOR CD4low AND CD8low T CELLS 3941BLOOD, 1 DECEMBER 2007 � VOLUME 110, NUMBER 12
For personal use only. by guest on June 2, 2013. bloodjournal.hematologylibrary.orgFrom

sorted the CD3�CD4low and CD3�CD8low T cells after primingwith APC-HLA-G1s or HLA-G5, and the CD3�CD4high andCD3�CD8high T cells after priming in the absence of HLA-G after 6days of MLR. These cells were then used as third-party cells insuppression assays. CD3�CD4low and CD3�CD8low T cells inducedeither by APC-HLA-G1s (Figure 5D) or HLA-G5 (Figure 5E)significantly inhibited alloproliferation compared with CD3�CD4high
and CD3�CD8high. Indeed, CD3�CD4low and CD3�CD8low T cellsinduced by APC-HLA-G1s inhibited alloproliferation by74% (� 2%) and 47% (� 2%; n � 3, mean � SEM), respectively,compared with CD3�CD4high and CD3�CD8high T cells (P � .001,Student t test) (Figure 5D). Similar results were found usingCD3�CD4low and CD3�CD8low T cells induced by HLA-G5
leading to alloproliferation inhibition of 74% (� 7%) and65% (� 2%; n � 3, mean � SEM, P � .001, Student t test),respectively (Figure 5E).
These data show that HLA-G1 and HLA-G5 affect T-cell activationduring in vitro allogeneic challenge inducing CD3�CD4low andCD3�CD8low suppressor T cells. To assess the clinical relevance of theseHLA-G–induced suppressor T-cell subsets, we studied patients whoreceived a combined liver-kidney transplant (LKT). Previous studiesshowed that LKT patients have high HLA-G plasma levels andperipheral blood T cells with suppressive function.21 They better accepttheir kidney graft compared with patients who received a single kidneytransplant (KT), and this improved allograft acceptance could beassociated with HLA-G expression.18,19
Figure 3. CD3�CD4low and CD3�CD8low T cells are induced after APC-HLA-G1 priming. (A) Morphology and granularity of T cells primed with either APCs orAPC-HLA-G1s are provided on a forward scatter (size) and side scatter (granularity) graph. APC-primed T cells are enlarged (mean fluorescence intensity � MFI,X-MFI � 750) and granulated (Y-MFI � 62), while APC-HLA-G1–primed T cells are smaller (X-MFI � 590) with fewer granularities (Y-MFI � 47). (B,C) T cells primed witheither APCs (left panel) or APC-HLA-G1s (right panel) were analyzed for surface expression of CD3, CD4, and CD8 at day 6 of MLR using 4-color flow cytometry. Results areexpressed as (B) dot plots gated on CD3� T cells or (C) histograms. (B) X-MFI corresponds to CD3-MFI, and Y-MFI indicates CD4-MFI or CD8-MFI. (C) Numbers on the left ofeach graph represent the percentage of positive cells (top) and the MFI calculated on the positive cells (bottom). Two representative experiments of 6 are shown.
3942 NAJI et al BLOOD, 1 DECEMBER 2007 � VOLUME 110, NUMBER 12
For personal use only. by guest on June 2, 2013. bloodjournal.hematologylibrary.orgFrom
CD3�CD4low and CD3�CD8low suppressor T-cell subsets areoverrepresented in the peripheral blood of patients whounderwent transplantation, with high HLA-G plasma levels andbetter graft acceptance
Here, 44 newly recruited LKT patients were studied. We firstchecked HLA-G plasma levels in this novel panel of LKT patientsin comparison with healthy donors (HDs, n � 14). For thispurpose, 2 different ELISAs were performed that detect either shedHLA-G1 plus HLA-G5 (sHLA-G1 � HLA-G5) (Figure 6A) oronly HLA-G5 (Figure 6B). Since HLA-G can be trapped within theclot when serum is collected,29 we worked with plasma that betterreflects the in vivo concentration of circulating HLA-G. Inagreement with our previous results,21 HLA-G plasma levels weresignificantly higher in LKT patients compared with HDs (Figure6A,B). The respective roles played by the liver and the kidney graftwere examined by measuring HLA-G in plasma from patients whoreceived a single liver transplant (LT, n � 21) and patients whoreceived a single kidney transplant (KT, n � 34). Considering theconcentrations from HDs as basal levels of HLA-G in plasma(normal values), all LT and LKT patients had high HLA-G plasmalevels (P � .001 comparing LT or LKT to HD, Student t test)(Figure 6A,B). By contrast, KT patients had HLA-G plasmaconcentrations close to normal values (P � .05 comparing KT toHD, Student t test) (Figure 6A,B). Significant differences wereobserved when comparing LT or LKT to KT (P � .001, Student ttest). These results showed that high HLA-G plasma levels arealways detected in patients who underwent a liver transplantation,strongly suggesting a specific role of the liver in up-regulatingHLA-G expression. By delineating patients according to follow-upperiod posttransplantation, we found that HLA-G plasma levelswere stable over time in the LKT and LT populations, whileincreased HLA-G levels were observed long term in KT patients(P � .05, Student t test) (Tables 1-3). Moreover, we did not findany difference between occurrence of posttransplantation viralinfections and HLA-G plasma levels in LT patients (Figure 6G).
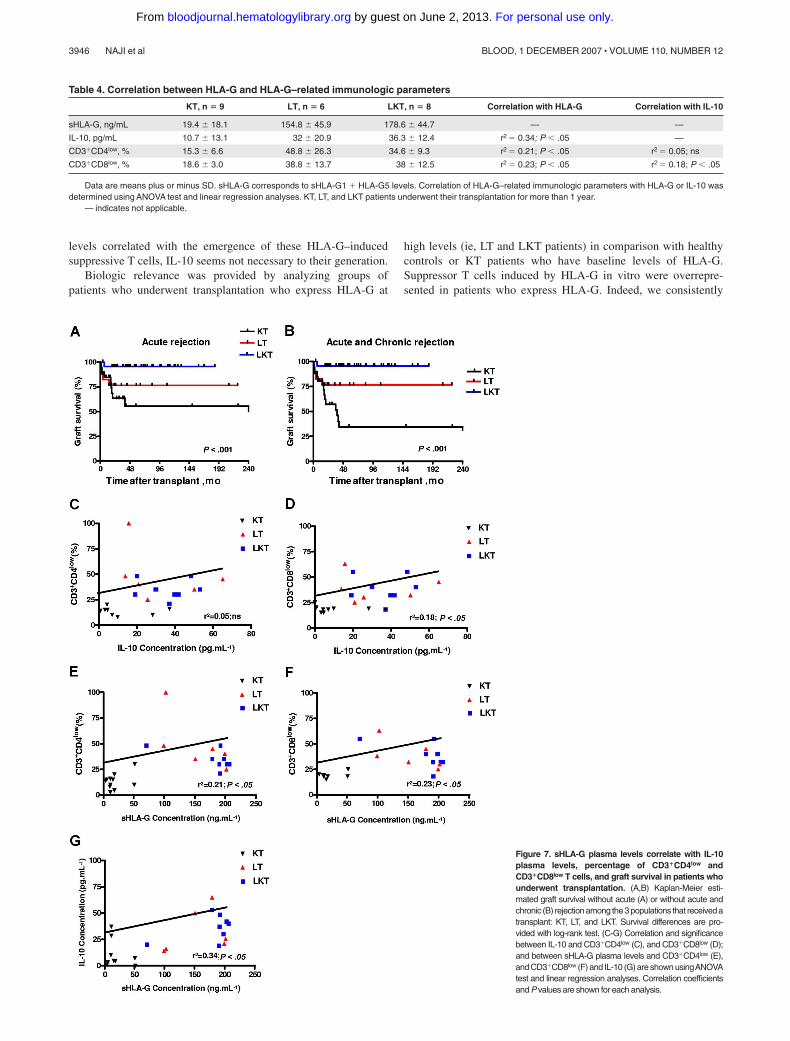
Next, the peripheral blood CD3�CD4� and CD3�CD8� T-cellpopulations from HDs were compared with those of KT, LT, andLKT patients. We found an increase of CD3�CD4low andCD3�CD8low cells among circulating T cells from both LT andLKT patients compared with peripheral CD3�CD4� andCD3�CD8� T cells from HD and KT patients. One representativeindividual for each group is shown in Figure 6C. The low and highCD4- and CD8-expressing T cells were defined according to thebasal expression level observed in healthy donors; all samples (ie,PBMCs from HD, KT, LT, and LKT) were processed together.Thus, our in vitro and in vivo data indicate that the presence ofincreased CD3�CD4low and CD3�CD8low T-cell subsets in both LTand LKT patients can be attributed to HLA-G. Supporting thisconclusion and in agreement with in vitro results described inFigure 1I,J, we found (1) significantly higher amounts of IL-10(Figure 6F) and of both soluble CD4 and CD8 molecules (Figure6D,E) in plasma from HLA-G� LT and LKT compared with thosefrom HLA-G KT patients (P � .001, Student t test), and (2) asignificant correlation between sHLA-G plasma levels and thepresently described HLA-G–related immunologic parameters (ie,IL-10 and suppressor CD3�CD4low and CD3�CD8low subpopula-tions) (Table 4; Figure 7C-G).
Finally, regarding allograft acceptance status of these patients:one acute and no chronic graft rejection were observed in the 44LKT patients studied (98% acceptance); 4 of 21 LT patientssuffered from acute or chronic liver graft rejection (81% accep-tance); and 16 of 34 KT patients suffered from acute or chronickidney graft rejection (53% acceptance). Graft acceptance wassignificantly higher in HLA-G� patients compared with HLA-G
patients. Indeed, LKT and LT patients had a significantly highersurvival time without acute rejection (P � .001, log-rank test;Figure 7A) or without acute and chronic rejection (P � .001,log-rank test; Figure 7B) compared with KT patients. Thus,allograft acceptance is observed in patient groups with highHLA-G and IL-10 plasma levels and overrepresentation of periph-eral blood CD3�CD4low and CD3�CD8low T-cell subsets (ie, LTand LKT groups).
Discussion
HLA-G inhibits CD4� T-cell proliferation, induces CD4� T-celllong-term unresponsiveness, and causes the differentiation of Tcells into immunosuppressive/regulatory T cells.9,21,25 First, atten-tion has been focused on naturally occurring CD4�CD25� regula-tory T cells. Injection of HLA-G tetramer–coated beads to recipientmice just before skin allograft induced expansion of CD4�CD25�
regulatory T cells among splenocytes and allowed skin grafttolerance.10,11,30 However, current studies in humans have failed todemonstrate that HLA-G induces expansion of such CD4�CD25�
T cells.21,22 The aim of the present work was to characterize theseHLA-G–induced T cells phenotypically and functionally, and toprovide evidence of their clinical relevance in humans.
Here, we report that membrane-bound HLA-G1 on APCs, aswell as soluble HLA-G5, induces T cells with suppressive function.The level of suppression is directly linked to the suppressor T-cellnumber added in the mixed lymphocyte reaction and remainssignificant with 4-fold fewer suppressors than responders. TheseHLA-G–induced suppressive T cells express lowered levels ofCD4 and CD8 coreceptors and are phenotypically defined asCD3�CD4low and CD3�CD8low T cells. We found that the down-modulation of CD4 and CD8 surface expression on HLA-G–driven
Figure 4. HLA-G affects both CD4 and CD8 gene transcription and expression.T cells were primed either with APCs or APC-HLA-G1s or with HLA-G5 or HLA-G5�
SNs for 6 days. T cells and supernatants were then collected for further analysis.(A,B) Total RNA was isolated from T-cell populations and used for real-time RT-PCRanalysis using specific CD4 (A) or CD8 (B) primer and probe. Relative quantities ofCD4 (A) and CD8 (B) transcripts in each T-cell population are shown in comparisonwith those of control healthy donor’s PBMCs (assigned a value of 1). Resultsare expressed as mean plus or minus SEM from 4 independent experiments.(C,D) Levels of soluble CD4 (C) and CD8 (D) molecules were measured by specificELISA in supernatants from T cells primed either with APCs or APC-HLA-G1s or withHLA-G5 or HLA-G5� SNs. Concentrations are given as mean plus or minus SEM.
HLA-G DRIVES SUPPRESSOR CD4low AND CD8low T CELLS 3943BLOOD, 1 DECEMBER 2007 � VOLUME 110, NUMBER 12
For personal use only. by guest on June 2, 2013. bloodjournal.hematologylibrary.orgFrom
T cells results from both transcriptional and posttranslationalregulation. Indeed, HLA-G induces a decrease of CD4 and CD8mRNA transcription as well as an increase of release of bothcoreceptors from T-cell surface. The CD8 downmodulation may bedue to direct interaction between HLA-G and CD8 coreceptor.Such hypothesis is supported by previous works demonstrating thatHLA-G �3 domain interacts with CD8.31 In agreement with ourpresent data, HLA-G was found to down-regulate the expression ofboth CD8� mRNA and protein in IFN-�–treated PBMCs withoutinducing apoptosis.32,33 Since we previously demonstrated thatblocking HLA-G receptors ILT-2 and ILT-4 prevent HLA-Ginhibitory effects on T cells,21,24 we postulate that induction ofCD3�CD4low and CD3�CD8low T cells is due mainly to HLA-Ginteraction with ILT-2/ILT-4 expressed by T cells and/or APCs.
These CD3�CD4low and CD3�CD8low T cells show an increasedrepresentation of CD45RA� cells. It has been shown that primedCD4� T cells expressing CD45RA secreted high amounts of IL-4,IL-10, and IL-13, whereas the production of IFN-� was very low.34
This pattern of cytokine production is akin to lymphocytes with aTh2 phenotype. HLA-DR� cells were also overrepresented in theHLA-G–driven CD3�CD4low and CD3�CD8low T cells comparedwith CD4high and CD8high T cells. Similar increased percentage ofCD8�HLA-DR� peripheral T cells was observed in human immu-nodeficiency virus 1 (HIV-1)–infected patients.35 Notably, HIV-1–infected patients were also described to express HLA-G.36 We also
show a reduced percentage of CD62L� cells among HLA-G–driven T cells. CD62L cells are defined as memory T cells knownto be less responsive to allostimulation than CD62L� naive Tcells.37 In agreement with this, suppressor T cells induced byHLA-G are hyporesponsive to allostimulation.21
Different types of regulatory/suppressor T cells have beendescribed based on distinct expression patterns of markers andcytokines, suppressive mechanisms, and origin. Foxp3 is a transcrip-tion factor associated with the development of naturally occurringCD4�CD25� regulatory T cells that express this factor at highlevels constitutively.38 In the present study, HLA-G–inducedsuppressor T cells do not express high levels of CD25 or Foxp3.This expression pattern was previously observed for other regula-tory T-cell types such as the IL-10–secreting T-regulatory type 1(Tr1) cells.39 CD4�CD25� Foxp3� regulatory T cells exert theirsuppressive function via direct cell contact.40 The activity of Tr1and T-helper 3 regulatory T cells is not dependent on cell contactand is based mainly on cytokines such as IL-10 and TGF-�.41
Cytokines are not only essential for function but also important forthe generation of suppressor T cells.42 Here, IL-10 was identified asthe cytokine directly involved in the suppressive function ofHLA-G–induced T cells. This function did not occur throughdownmodulation of IL-2 secretion but rather through an up-regulation of IL-10 production counteracting the IL-2–mediatedT-cell proliferation signal. However, although increased IL-10
Figure 5. CD3�CD4low and CD3�CD8low cells are suppressor T-cell subsets whose CD45RA, CD62L, and HLA-DR expression is modulated. (A-C) T cells primed witheither APCs (left panel) or APC-HLA-G1s (right panel) were analyzed by 4-color flow cytometry at day 6 of MLR for expression of (A) CD45RA, (B) CD62L, and (C) HLA-DRamong CD4� and CD8� T cells. Results are shown as dot plots. Numbers represent the percentage of cells within the corresponding region. One representative experiment of3 is shown. (D-E) T cells were primed either with (D) APCs or APC-HLA-G1s or with (E) HLA-G5 or HLA-G5� SNs for 6 days. Then, CD4� and CD8� T cells were sorted. Thesepurified cells were used in an immunosuppressive assay as �-irradiated third-party cells in MLR with HLA-mismatched PBMCs at a responder–stimulator–third-party cell ratioof 1:1:1. Results are expressed as percentage of alloproliferation inhibition (%) � SEM in triplicate wells. Alloproliferation inhibition percentage observed with CD3�CD4low orCD3�CD8low T cells was calculated, based on the alloproliferation observed with CD3�CD4high and CD3�CD8high T cells, respectively.
3944 NAJI et al BLOOD, 1 DECEMBER 2007 � VOLUME 110, NUMBER 12
For personal use only. by guest on June 2, 2013. bloodjournal.hematologylibrary.orgFrom
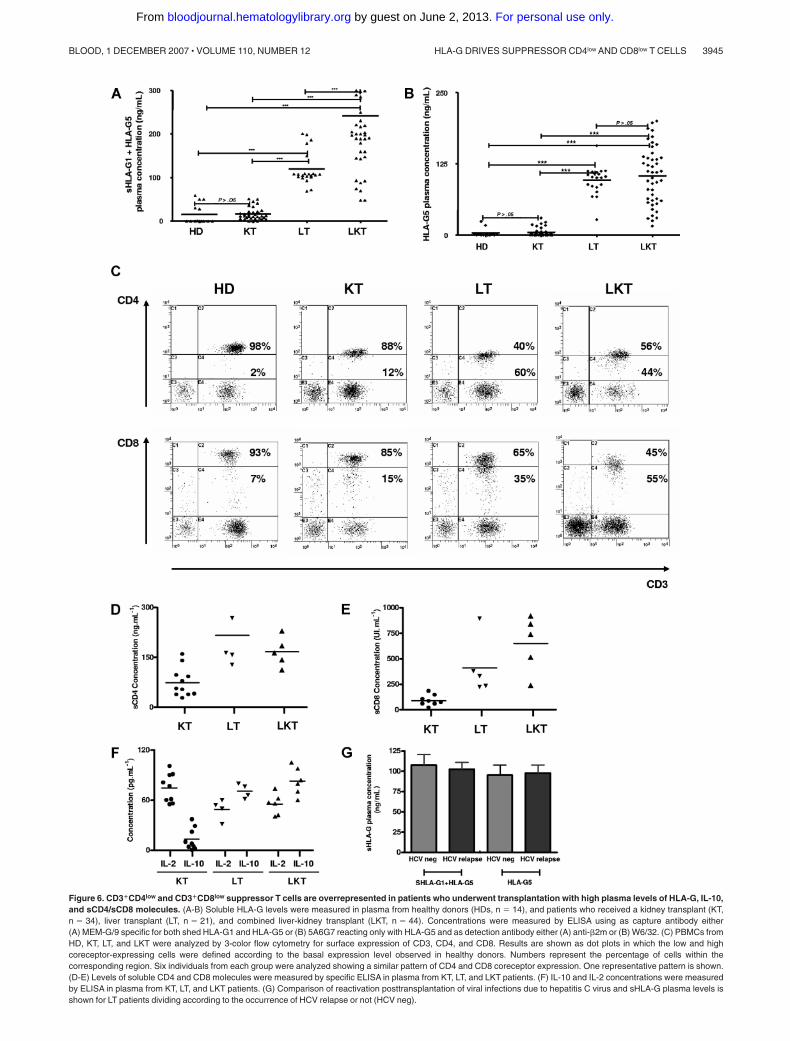
Figure 6. CD3�CD4low and CD3�CD8low suppressor T cells are overrepresented in patients who underwent transplantation with high plasma levels of HLA-G, IL-10,and sCD4/sCD8 molecules. (A-B) Soluble HLA-G levels were measured in plasma from healthy donors (HDs, n � 14), and patients who received a kidney transplant (KT,n � 34), liver transplant (LT, n � 21), and combined liver-kidney transplant (LKT, n � 44). Concentrations were measured by ELISA using as capture antibody either(A) MEM-G/9 specific for both shed HLA-G1 and HLA-G5 or (B) 5A6G7 reacting only with HLA-G5 and as detection antibody either (A) anti-�2m or (B) W6/32. (C) PBMCs fromHD, KT, LT, and LKT were analyzed by 3-color flow cytometry for surface expression of CD3, CD4, and CD8. Results are shown as dot plots in which the low and highcoreceptor-expressing cells were defined according to the basal expression level observed in healthy donors. Numbers represent the percentage of cells within thecorresponding region. Six individuals from each group were analyzed showing a similar pattern of CD4 and CD8 coreceptor expression. One representative pattern is shown.(D-E) Levels of soluble CD4 and CD8 molecules were measured by specific ELISA in plasma from KT, LT, and LKT patients. (F) IL-10 and IL-2 concentrations were measuredby ELISA in plasma from KT, LT, and LKT patients. (G) Comparison of reactivation posttransplantation of viral infections due to hepatitis C virus and sHLA-G plasma levels isshown for LT patients dividing according to the occurrence of HCV relapse or not (HCV neg).
HLA-G DRIVES SUPPRESSOR CD4low AND CD8low T CELLS 3945BLOOD, 1 DECEMBER 2007 � VOLUME 110, NUMBER 12
For personal use only. by guest on June 2, 2013. bloodjournal.hematologylibrary.orgFrom
levels correlated with the emergence of these HLA-G–inducedsuppressive T cells, IL-10 seems not necessary to their generation.
Biologic relevance was provided by analyzing groups ofpatients who underwent transplantation who express HLA-G at
high levels (ie, LT and LKT patients) in comparison with healthycontrols or KT patients who have baseline levels of HLA-G.Suppressor T cells induced by HLA-G in vitro were overrepre-sented in patients who express HLA-G. Indeed, we consistently
Figure 7. sHLA-G plasma levels correlate with IL-10plasma levels, percentage of CD3�CD4low andCD3�CD8low T cells, and graft survival in patients whounderwent transplantation. (A,B) Kaplan-Meier esti-mated graft survival without acute (A) or without acute andchronic (B) rejectionamong the3populations that receivedatransplant: KT, LT, and LKT. Survival differences are pro-vided with log-rank test. (C-G) Correlation and significancebetween IL-10 and CD3�CD4low (C), and CD3�CD8low (D);and between sHLA-G plasma levels and CD3�CD4low (E),and CD3�CD8low (F) and IL-10 (G) are shown usingANOVAtest and linear regression analyses. Correlation coefficientsand P values are shown for each analysis.
Table 4. Correlation between HLA-G and HLA-G–related immunologic parameters
KT, n � 9 LT, n � 6 LKT, n � 8 Correlation with HLA-G Correlation with IL-10
sHLA-G, ng/mL 19.4 � 18.1 154.8 � 45.9 178.6 � 44.7 — —
IL-10, pg/mL 10.7 � 13.1 32 � 20.9 36.3 � 12.4 r2 � 0.34; P � .05 —
CD3�CD4low, % 15.3 � 6.6 48.8 � 26.3 34.6 � 9.3 r2 � 0.21; P � .05 r2 � 0.05; ns
CD3�CD8low, % 18.6 � 3.0 38.8 � 13.7 38 � 12.5 r2 � 0.23; P � .05 r2 � 0.18; P � .05
Data are means plus or minus SD. sHLA-G corresponds to sHLA-G1 � HLA-G5 levels. Correlation of HLA-G–related immunologic parameters with HLA-G or IL-10 wasdetermined using ANOVA test and linear regression analyses. KT, LT, and LKT patients underwent their transplantation for more than 1 year.
— indicates not applicable.
3946 NAJI et al BLOOD, 1 DECEMBER 2007 � VOLUME 110, NUMBER 12
For personal use only. by guest on June 2, 2013. bloodjournal.hematologylibrary.orgFrom

observed an increased representation of CD3�CD4low andCD3�CD8low within the peripheral blood from both LT and LKTpatients. Notably, a correlation was clearly obtained betweenHLA-G, IL-10, and CD3�CD4low and CD3�CD8low T cells.Furthermore, the posttranslational mechanism by which HLA-Ginduces CD4 and CD8 down-regulation was supported by theincreased amount of soluble CD4 and CD8 molecules in plasmafrom LT and LKT versus KT patients. These findings show thatHLA-G but also its related immunologic parameters such as IL-10,soluble CD4/CD8, and CD3�CD4low/CD3�CD8low suppressor Tcells all would contribute to induce tolerance in HLA-G� patients.Incidentally, soluble CD4 and CD8 coreceptors are believed to bepotent inhibitors of T-cell activation by competing with membrane-anchored coreceptors, thus preventing T-cell activation via corecep-tor/CD3-TCR complex-peptide/MHC interaction.34
Better graft acceptance was observed in LT and LKT patient groupsthat all received a liver allograft. Therefore, HLA-G can be consideredas a graft acceptance–associated marker whose expression may beup-regulated by liver factors. The liver has long been known to have apositive effect on the induction of peripheral tolerance.43 Previousstudies showed that patients who received a combined liver-kidneytransplant experienced significantly less kidney rejection compared withpatients receiving a kidney transplant alone.44 Here, we detectedincreased levels of soluble HLA-G in plasma from all LT and LKTpatients compared with those observed in HD and KT patients. Thus, wepostulate that the liver allograft plays a role in HLA-G expression. Theliver may be directly involved in secretion of HLA-G since itsexpression was detected on biliary epithelial cells, as we previouslydescribed.19 However, only some patients were displaying HLA-G�
biliary epithelial cells in the grafted liver. Another nonexclusive hypoth-esis is that liver cells secrete soluble factors that up-regulate HLA-Gexpression in an endocrine manner. Thereby, the hepatocyte growthfactor (HGF) could be one candidate because its roles in vivo in graftacceptance45,46 and in vitro on monocyte differentiation into dendriticregulatory cells47 were recently reported. Besides, dendritic cells aredescribed as efficient HLA-G secretors under adequate stimuli.48
Another candidate is the anti-inflammatory cytokine IL-10, which isproduced by the liver49 and can up-regulate HLA-G expression indendritic cells and monocytes.50 HLA-G� dendritic cells may bepreferentially localized in draining lymph nodes, from which solubleHLA-G molecules are delivered in the blood circulation.
Otherwise, CD3�CD4low and CD3�CD8low cells have beenpreviously identified in 3 biologic contexts: in the thymus, inHIV-infected individuals, and in patients with chronic lymphocyticleukemia.51-53 Interestingly, HLA-G has also been described inthymic epithelial cells and in the course of the same patholo-gies,36,54,55 supporting our observation that HLA-G generatesCD3�CD4low and CD3�CD8low suppressive T cells.
Such peripheral suppressive T cells may contribute to maintainan immune tolerant environment improving graft acceptance in LTand LKT patients. Here, we propose HLA-G as a biomarker of graftacceptance in the clinical follow-up of patients who underwenttransplantation. HLA-G measurement in blood may be useful topredict graft outcome and provide physicians with a new approachto better manage patients who underwent transplantation. Further-more, this study reinforces the potential use of HLA-G as animmunosuppressive agent to prevent allograft rejection. Finally,our present findings can be extended to other contexts in whichHLA-G expression is up-regulated such as pregnancy,4 cancer,56
autoimmune disorders,57 and viral infections.36,58
Acknowledgments
This work was supported by the Commissariat a l’Energie Atom-ique and the Agence de la Biomedecine.
Authorship
Contribution: A.N., J.L., E.D.C., and N.R.-F. designed and ana-lyzed all experiments; A.N. and N.R.-F. wrote the paper; A.N.,S.L.R., I.K.-R., M.D., and J.C. performed experiments; A.D. andC.C. provided samples from patients who underwent transplanta-tion; A.D. analyzed all clinical data.
Conflict-of-interest disclosure: The authors declare no compet-ing financial interests.
Correspondence: Nathalie Rouas-Freiss, Service de Recherchesen Hemato-Immunologie, CEA-DSV-DRM, Hopital Saint-Louis,Institut Universitaire d’Hematologie, 1, avenue Claude Vellefaux,75010 Paris, France; e-mail: [email protected].
References
1. Lechler RI, Garden OA, Turka LA. The comple-mentary roles of deletion and regulation in trans-plantation tolerance. Nat Rev Immunol. 2003;3:147-158.
2. Walsh PT, Strom TB, Turka LA. Routes to trans-plant tolerance versus rejection: the role of cyto-kines. Immunity. 2004;20:121-131.
3. Holler PD, Kranz DM. Quantitative analysis of thecontribution of TCR/pepMHC affinity and CD8 toT cell activation. Immunity. 2003;18:255-264.
4. Carosella ED, Moreau P, Le Maoult J, Le Dis-corde M, Dausset J, Rouas-Freiss N. HLA-G mol-ecules: from maternal-fetal tolerance to tissueacceptance. Adv Immunol. 2003;81:199-252.
5. Gao GF, Willcox BE, Wyer JR, et al. Classical andnonclassical class I major histocompatibility com-plex molecules exhibit subtle conformational dif-ferences that affect binding to CD8alphaalpha.J Biol Chem. 2000;275:15232-15238.
6. Riteau B, Rouas-Freiss N, Menier C, Paul P,Dausset J, Carosella ED. HLA-G2, -G3, and -G4isoforms expressed as nonmature cell surfaceglycoproteins inhibit NK and antigen-specific CTLcytolysis. J Immunol. 2001;166:5018-5026.
7. Rajagopalan S, Long EO. A human histocompat-ibility leukocyte antigen (HLA)-G-specific receptorexpressed on all natural killer cells. J Exp Med.1999;189:1093-1100.
8. Colonna M, Samaridis J, Cella M, et al. Humanmyelomonocytic cells express an inhibitory re-ceptor for classical and nonclassical MHC class Imolecules. J Immunol. 1998;160:3096-3100.
9. LeMaoult J, Krawice-Radanne I, Dausset J,Carosella ED. HLA-G1-expressing antigen-pre-senting cells induce immunosuppressive CD4� Tcells. Proc Natl Acad Sci U S A. 2004;101:7064-7069.
10. Liang S, Baibakov B, Horuzsko A. HLA-G inhibitsthe functions of murine dendritic cells via thePIR-B immune inhibitory receptor. Eur J Immunol.2002;32:2418-2426.
11. Liang S, Horuzsko A. Mobilizing dendritic cells fortolerance by engagement of immune inhibitoryreceptors for HLA-G. Hum Immunol. 2003;64:1025-1032.
12. Rouas-Freiss N, Goncalves RM, Menier C, Daus-set J, Carosella ED. Direct evidence to supportthe role of HLA-G in protecting the fetus from ma-
ternal uterine natural killer cytolysis. Proc NatlAcad Sci U S A. 1997;94:11520-11525.
13. Rouas-Freiss N, LeMaoult J, Moreau P, DaussetJ, Carosella ED. HLA-G in transplantation: a rel-evant molecule for inhibition of graft rejection?Am J Transplant. 2003;3:11-16.
14. Lila N, Carpentier A, Amrein C, Khalil-Daher I,Dausset J, Carosella ED. Implication of HLA-Gmolecule in heart-graft acceptance. Lancet. 2000;355:2138.
15. Lila N, Amrein C, Guillemain R, et al. Human leu-kocyte antigen-G expression after heart trans-plantation is associated with a reduced incidenceof rejection. Circulation. 2002;105:1949-1954.
16. Luque J, Torres MI, Aumente MD, et al. SolubleHLA-G in heart transplantation: their relationshipto rejection episodes and immunosuppressivetherapy. Hum Immunol. 2006;67:257-263.
17. Qiu J, Terasaki PI, Miller J, Mizutani K, Cai J,Carosella ED. Soluble HLA-G expression andrenal graft acceptance. Am J Transplant. 2006;6:2152-2156.
18. Creput C, Le Friec G, Bahri R, et al. Detection ofHLA-G in serum and graft biopsy associated with
HLA-G DRIVES SUPPRESSOR CD4low AND CD8low T CELLS 3947BLOOD, 1 DECEMBER 2007 � VOLUME 110, NUMBER 12
For personal use only. by guest on June 2, 2013. bloodjournal.hematologylibrary.orgFrom

fewer acute rejections following combined liver-kidney transplantation: possible implications formonitoring patients. Hum Immunol. 2003;64:1033-1038.
19. Creput C, Durrbach A, Menier C, et al. Humanleukocyte antigen-G (HLA-G) expression in biliaryepithelial cells is associated with allograft accep-tance in liver-kidney transplantation. J Hepatol.2003;39:587-594.
20. Le Rond S, Le Maoult J, Creput C, et al. Alloreac-tive CD4� and CD8� T cells express the immu-notolerant HLA-G molecule in mixed lymphocytereactions: in vivo implications in transplanted pa-tients. Eur J Immunol. 2004;34:649-660.
21. Le Rond S, Azema C, Krawice-Radanne I, et al.Evidence to support the role of HLA-G5 in allo-graft acceptance through induction of immuno-suppressive/regulatory T cells. J Immunol. 2006;176:3266-3276.
22. Bahri R, Hirsch F, Josse A, et al. Soluble HLA-Ginhibits cell cycle progression in human alloreac-tive T lymphocytes. J Immunol. 2006;176:1331-1339.
23. Le Rond S, Gonzalez A, Gonzalez AS, CarosellaED, Rouas-Freiss N. Indoleamine 2,3 dioxygen-ase and human leucocyte antigen-G inhibit theT-cell alloproliferative response through two inde-pendent pathways. Immunology. 2005;116:297-307.
24. Naji A, Durrbach A, Carosella ED, Rouas-FreissN. Soluble HLA-G and HLA-G1 expressing anti-gen-presenting cells inhibit T-cell alloproliferationthrough ILT-2/ILT-4/FasL-mediated pathways.Hum Immunol. 2007;68:233-239.
25. Lila N, Rouas-Freiss N, Dausset J, Carpentier A,Carosella ED. Soluble HLA-G protein secreted byallo-specific CD4� T cells suppresses the allo-proliferative response: a CD4� T cell regulatorymechanism. Proc Natl Acad Sci U S A. 2001;98:12150-12155.
26. Wang J, Ioan-Facsinay A, van der Voort EI, Huiz-inga TW, Toes RE. Transient expression ofFOXP3 in human activated nonregulatory CD4�T cells. Eur J Immunol. 2007;37:129-138.
27. Ravirajan CT, Wang Y, Matis LA, et al. Effect ofneutralizing antibodies to IL-10 and C5 on therenal damage caused by a pathogenic humananti-dsDNA antibody. Rheumatology (Oxford).2004;43:442-447.
28. Rebmann V, Lemaoult J, Rouas-Freiss N,Carosella ED, Grosse-Wilde H. Report of the WetWorkshop for Quantification of Soluble HLA-G inEssen, 2004. Hum Immunol. 2005;66:853-863.
29. Rudstein-Svetlicky N, Loewenthal R, Horejsi V,Gazit E. HLA-G levels in serum and plasma. Tis-sue Antigens. 2006;67:111-116.
30. Ristich V, Liang S, Zhang W, Wu J, Horuzsko A.Tolerization of dendritic cells by HLA-G. Eur J Im-munol. 2005;35:1133-1142.
31. Sanders SK, Giblin PA, Kavathas P. Cell-cell ad-
hesion mediated by CD8 and human histocom-patibility leukocyte antigen G, a nonclassical ma-jor histocompatibility complex class 1 moleculeon cytotrophoblasts. J Exp Med. 1991;174:737-740.
32. Morales PJ, Pace JL, Platt JS, et al. Placental cellexpression of HLA-G2 isoforms is limited to theinvasive trophoblast phenotype. J Immunol.2003;171:6215-6224.
33. McIntire RH, Morales PJ, Petroff MG, Colonna M,Hunt JS. Recombinant HLA-G5 and -G6 driveU937 myelomonocytic cell production of TGF-beta1. J Leukoc Biol. 2004;76:1220-1228.
34. Suarez A, Mozo L, Gutierrez C. Generation ofCD4(�)CD45RA(�) effector T cells by stimula-tion in the presence of cyclic adenosine 5 -mono-phosphate-elevating agents. J Immunol. 2002;169:1159-1167.
35. Agostini C, Pizzolo G, Zambello R, et al. Shed-ding of the soluble form of the CD8 complex byCD8�/HLA-DR� cells in HIV-1-infected patients.AIDS. 1991;5:813-819.
36. Lozano JM, Gonzalez R, Kindelan JM, et al.Monocytes and T lymphocytes in HIV-1-positivepatients express HLA-G molecule. AIDS. 2002;16:347-351.
37. Foster AE, Marangolo M, Sartor MM, et al. Hu-man CD62L- memory T cells are less responsiveto alloantigen stimulation than CD62L� naive Tcells: potential for adoptive immunotherapy andallodepletion. Blood. 2004;104:2403-2409.
38. Sakaguchi S, Ono M, Setoguchi R, et al. Foxp3�CD25� CD4� natural regulatory T cells in domi-nant self-tolerance and autoimmune disease. Im-munol Rev. 2006;212:8-27.
39. Roncarolo MG, Gregori S, Battaglia M, BacchettaR, Fleischhauer K, Levings MK. Interleukin-10-secreting type 1 regulatory T cells in rodents andhumans. Immunol Rev. 2006;212:28-50.
40. von Boehmer H. Mechanisms of suppression bysuppressor T cells. Nat Immunol. 2005;6:338-344.
41. Levings MK, Gregori S, Tresoldi E, Cazzaniga S,Bonini C, Roncarolo MG. Differentiation of Tr1cells by immature dendritic cells requires IL-10but not CD25�CD4� Tr cells. Blood. 2005;105:1162-1169.
42. Wan YY, Flavell RA. The roles for cytokines in thegeneration and maintenance of regulatory T cells.Immunol Rev. 2006;212:114-130.
43. Racanelli V, Rehermann B. The liver as an immu-nological organ. Hepatology. 2006;43:S54-S62.
44. Creput C, Durrbach A, Samuel D, et al. Incidenceof renal and liver rejection and patient survivalrate following combined liver and kidney trans-plantation. Am J Transplant. 2003;3:348-356.
45. Yamaura K, Ito K, Tsukioka K, et al. Suppressionof acute and chronic rejection by hepatocytegrowth factor in a murine model of cardiac trans-plantation: induction of tolerance and prevention
of cardiac allograft vasculopathy. Circulation.2004;110:1650-1657.
46. Okunishi K, Dohi M, Nakagome K, et al. A novelrole of hepatocyte growth factor as an immuneregulator through suppressing dendritic cell func-tion. J Immunol. 2005;175:4745-4753.
47. Rutella S, Bonanno G, Procoli A, et al. Hepato-cyte growth factor favors monocyte differentiationinto regulatory interleukin (IL)-10��IL-12low/negaccessory cells with dendritic-cell features.Blood. 2006;108:218-227.
48. Le Friec G, Gros F, Sebti Y, et al. Capacity of my-eloid and plasmacytoid dendritic cells especiallyat mature stage to express and secrete HLA-Gmolecules. J Leukoc Biol. 2004;76:1125-1133.
49. Le Moine O, Marchant A, Durand F, et al. Sys-temic release of interleukin-10 during orthotopicliver transplantation. Hepatology. 1994;20:889-892.
50. Moreau P, Adrian-Cabestre F, Menier C, et al.IL-10 selectively induces HLA-G expression inhuman trophoblasts and monocytes. Int Immunol.1999;11:803-811.
51. Blue ML, Daley JF, Levine H, Branton KR Jr,Schlossman SF. Regulation of CD4 and CD8 sur-face expression on human thymocyte subpopula-tions by triggering through CD2 and the CD3-Tcell receptor. J Immunol. 1989;142:374-380.
52. Keir ME, Rosenberg MG, Sandberg JK, et al.Generation of CD3�CD8low thymocytes in theHIV type 1-infected thymus. J Immunol. 2002;169:2788-2796.
53. Dianzani U, Omede P, Marmont F, et al. Expan-sion of T cells expressing low CD4 or CD8 levelsin B-cell chronic lymphocytic leukemia: correla-tion with disease status and neoplastic pheno-type. Blood. 1994;83:2198-2205.
54. Crisa L, McMaster MT, Ishii JK, Fisher SJ,Salomon DR. Identification of a thymic epithelialcell subset sharing expression of the class IbHLA-G molecule with fetal trophoblasts. J ExpMed. 1997;186:289-298.
55. Nuckel H, Rebmann V, Durig J, Duhrsen U,Grosse-Wilde H. HLA-G expression is associatedwith an unfavorable outcome and immunodefi-ciency in chronic lymphocytic leukemia. Blood.2005;105:1694-1698.
56. Rouas-Freiss N, Moreau P, Ferrone S, CarosellaED. HLA-G proteins in cancer: do they providetumor cells with an escape mechanism? CancerRes. 2005;65:10139-10144.
57. Wiendl H, Feger U, Mittelbronn M, et al. Expres-sion of the immune-tolerogenic major histocom-patibility molecule HLA-G in multiple sclerosis:implications for CNS immunity. Brain. 2005;128:2689-2704.
58. Lafon M, Prehaud C, Megret F, et al. Modulationof HLA-G expression in human neural cells afterneurotropic viral infections. J Virol. 2005;79:15226-15237.
3948 NAJI et al BLOOD, 1 DECEMBER 2007 � VOLUME 110, NUMBER 12
For personal use only. by guest on June 2, 2013. bloodjournal.hematologylibrary.orgFrom
Copyright © 2022 FDOKUMEN