Phenolic profiles of Portuguese olive fruits ( Olea europaea L.): Influences of cultivar and...
8
Phenolic profiles of Portuguese olive fruits (Olea europaea L.): Influences of cultivar and geographical origin Ana F. Vinha a , Federico Ferreres b , Branca M. Silva a , Patr ıcia Valent~ ao a , Ana Gonc ßalves a , Jos e A. Pereira c , M. Beatriz Oliveira d , Rosa M. Seabra a, * , Paula B. Andrade a a REQUIMTE, Servic ßo de Farmacognosia, Faculdade de Farm acia, Universidade do Porto, R. An ıbal Cunha, 164, 4050-047 Porto, Portugal b Laboratorio de Fitoqu ımica, Departamento de Ciencia y Tecnolog ıa de los Alimentos, CEBAS (CSIC), P.O. Box 4195, E-30080 Murcia, Spain c CIMO/ESAB, Quinta de Sta. Apol onia, Apartado 1172, 5301-855 Braganc ßa, Portugal d REQUIMTE, Servic ßo de Bromatologia, Faculdade de Farm acia, Universidade do Porto, R. An ıbal Cunha, 164, 4050-047 Porto, Portugal Received 4 April 2003; received in revised form 8 March 2004; accepted 8 March 2004 Abstract The phenolic compounds present in 29 samples of olive fruits were analysed by reversed-phase HPLC/DAD and/or HPLC-DAD/ ESI-MS/MS. All samples were collected during the normal picking period for olive oil production, in north and central Portugal, and were obtained from 18 different olive cultivars. Two different extraction methods were necessary for the complete quantification of phenolic compounds, a methanolic extraction and an extraction which included a solid-phase extraction (SPE) cleaning step. The analyses showed that all samples presented a similar profile, which included at least six identified phenolic compounds: hydroxytyrosol, luteolin 7-O-glucoside, oleuropein, rutin, apigenin 7-O-glucoside and luteolin. Several samples also contained 5-O- caffeoylquinic acid, verbascoside, quercetin 3-O-rhamnoside, cyanidin 3-O-glucoside and cyanidin 3-O-rutinoside. In all samples, hydroxytyrosol and oleuropein were the major compounds identified while, in general, rutin and luteolin 7-O- glucoside were the two main flavonoids. The influences of maturation index, nature of the cultivar and geographical origin are discussed. Ó 2004 Elsevier Ltd. All rights reserved. Keywords: Olea europaea L.; Olive fruit; Portuguese olive cultivars; Anthocyanins; Phenolics; HPLC-DAD; HPLC-DAD/MS/MS – ESI 1. Introduction Phenolic compounds are secondary plant metabo- lites, with a great structural diversity and a wide phy- logenetic distribution (Harborne, 1989). The most important classes of phenolic compounds in olive fruit include phenolic acids, phenolic alcohols, flavonoids and secoiridoids (Macheix, Fleuriet, & Billot, 1990; Ryan & Robards, 1998; Soler-Rivas, Esp ın, & Wichers, 2000). The phenolic alcohols of olives are 3,4-dihydroxyphenylethanol (hydroxytyrosol) and p-hy- droxyphenylethanol (tyrosol) (Macheix et al., 1990; Mazza & Miniati, 1993; Romero, Brenes, Garc ıa, & Garrido, 2002; Ryan & Robards, 1998). The most frequently described flavonoids include luteolin 7-O- glucoside, rutin and apigenin 7-O-glucoside, and the anthocyanins, cyanidin 3-O-glucoside and cyanidin 3-O- rutinoside (Amiot, Fleuriet, & Macheix, 1986, 1989; Esti, Cinquanta, & La Notte, 1998; Romani, Mulinacci, Pi- nelli, Vincieri, & Cimato, 1999; Ryan & Robards, 1998). In some cultivars, a delphinidin glycoside has also been described (Macheix et al., 1990). Oleuropein and ligu- stroside are the predominant secoiridoids of olive fruit pulp. Some oleuropein derivatives have also been de- scribed, namely demethyloleuropein, oleuropein agly- cone and elenolic acid (Amiot et al., 1989; Esti et al., 1998; Romani et al., 1999; Soler-Rivas et al., 2000). Verbascoside is the main hydroxycinnamic acid * Corresponding author. Tel.: +351-222-078-934; fax: +351-222-003- 977. E-mail address: rseabra@ff.up.pt (R.M. Seabra). 0308-8146/$ - see front matter Ó 2004 Elsevier Ltd. All rights reserved. doi:10.1016/j.foodchem.2004.03.012 Food Chemistry 89 (2005) 561–568 www.elsevier.com/locate/foodchem Food Chemistry
-
Upload
independent -
Category
Documents
-
view
1 -
download
0
Transcript of Phenolic profiles of Portuguese olive fruits ( Olea europaea L.): Influences of cultivar and...
Food
Food Chemistry 89 (2005) 561–568
www.elsevier.com/locate/foodchem
Chemistry
Phenolic profiles of Portuguese olive fruits (Olea europaea L.):Influences of cultivar and geographical origin
Ana F. Vinha a, Federico Ferreres b, Branca M. Silva a, Patr�ıcia Valent~ao a,Ana Gonc�alves a, Jos�e A. Pereira c, M. Beatriz Oliveira d, Rosa M. Seabra a,*,
Paula B. Andrade a
a REQUIMTE, Servic�o de Farmacognosia, Faculdade de Farm�acia, Universidade do Porto, R. An�ıbal Cunha, 164, 4050-047 Porto, Portugalb Laboratorio de Fitoqu�ımica, Departamento de Ciencia y Tecnolog�ıa de los Alimentos, CEBAS (CSIC), P.O. Box 4195, E-30080 Murcia, Spain
c CIMO/ESAB, Quinta de Sta. Apol�onia, Apartado 1172, 5301-855 Braganc�a, Portugald REQUIMTE, Servic�o de Bromatologia, Faculdade de Farm�acia, Universidade do Porto, R. An�ıbal Cunha, 164, 4050-047 Porto, Portugal
Received 4 April 2003; received in revised form 8 March 2004; accepted 8 March 2004
Abstract
The phenolic compounds present in 29 samples of olive fruits were analysed by reversed-phase HPLC/DAD and/or HPLC-DAD/
ESI-MS/MS. All samples were collected during the normal picking period for olive oil production, in north and central Portugal,
and were obtained from 18 different olive cultivars.
Two different extraction methods were necessary for the complete quantification of phenolic compounds, a methanolic extraction
and an extraction which included a solid-phase extraction (SPE) cleaning step.
The analyses showed that all samples presented a similar profile, which included at least six identified phenolic compounds:
hydroxytyrosol, luteolin 7-O-glucoside, oleuropein, rutin, apigenin 7-O-glucoside and luteolin. Several samples also contained 5-O-
caffeoylquinic acid, verbascoside, quercetin 3-O-rhamnoside, cyanidin 3-O-glucoside and cyanidin 3-O-rutinoside.
In all samples, hydroxytyrosol and oleuropein were the major compounds identified while, in general, rutin and luteolin 7-O-
glucoside were the two main flavonoids.
The influences of maturation index, nature of the cultivar and geographical origin are discussed.
� 2004 Elsevier Ltd. All rights reserved.
Keywords: Olea europaea L.; Olive fruit; Portuguese olive cultivars; Anthocyanins; Phenolics; HPLC-DAD; HPLC-DAD/MS/MS – ESI
1. Introduction
Phenolic compounds are secondary plant metabo-
lites, with a great structural diversity and a wide phy-
logenetic distribution (Harborne, 1989).
The most important classes of phenolic compounds in
olive fruit include phenolic acids, phenolic alcohols,
flavonoids and secoiridoids (Macheix, Fleuriet, & Billot,
1990; Ryan & Robards, 1998; Soler-Rivas, Esp�ın, &
Wichers, 2000). The phenolic alcohols of olives are3,4-dihydroxyphenylethanol (hydroxytyrosol) and p-hy-
droxyphenylethanol (tyrosol) (Macheix et al., 1990;
* Corresponding author. Tel.: +351-222-078-934; fax: +351-222-003-
977.
E-mail address: [email protected] (R.M. Seabra).
0308-8146/$ - see front matter � 2004 Elsevier Ltd. All rights reserved.
doi:10.1016/j.foodchem.2004.03.012
Mazza & Miniati, 1993; Romero, Brenes, Garc�ıa, &
Garrido, 2002; Ryan & Robards, 1998). The mostfrequently described flavonoids include luteolin 7-O-
glucoside, rutin and apigenin 7-O-glucoside, and the
anthocyanins, cyanidin 3-O-glucoside and cyanidin 3-O-
rutinoside (Amiot, Fleuriet, &Macheix, 1986, 1989; Esti,
Cinquanta, & La Notte, 1998; Romani, Mulinacci, Pi-
nelli, Vincieri, & Cimato, 1999; Ryan & Robards, 1998).
In some cultivars, a delphinidin glycoside has also been
described (Macheix et al., 1990). Oleuropein and ligu-stroside are the predominant secoiridoids of olive fruit
pulp. Some oleuropein derivatives have also been de-
scribed, namely demethyloleuropein, oleuropein agly-
cone and elenolic acid (Amiot et al., 1989; Esti et al.,
1998; Romani et al., 1999; Soler-Rivas et al., 2000).
Verbascoside is the main hydroxycinnamic acid
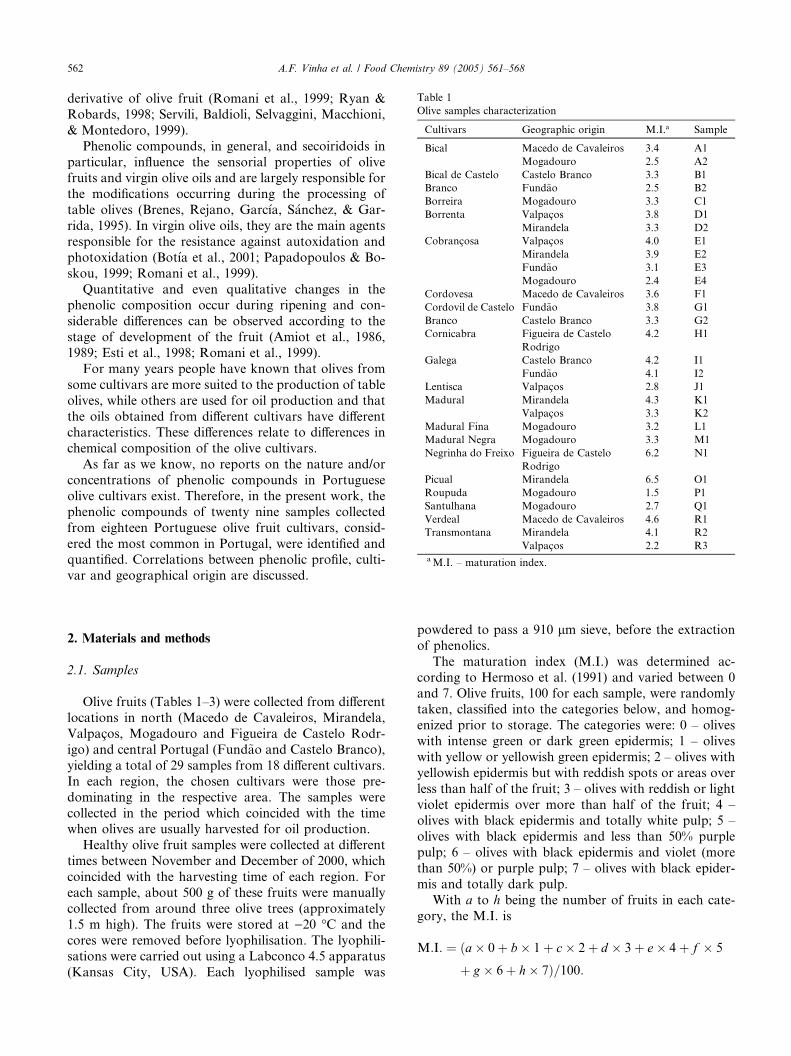
Table 1
Olive samples characterization
Cultivars Geographic origin M.I.a Sample
Bical Macedo de Cavaleiros 3.4 A1
Mogadouro 2.5 A2
Bical de Castelo
Branco
Castelo Branco 3.3 B1
Fund~ao 2.5 B2
Borreira Mogadouro 3.3 C1
Borrenta Valpac�os 3.8 D1
Mirandela 3.3 D2
Cobranc�osa Valpac�os 4.0 E1
Mirandela 3.9 E2
Fund~ao 3.1 E3
Mogadouro 2.4 E4
Cordovesa Macedo de Cavaleiros 3.6 F1
Cordovil de Castelo Fund~ao 3.8 G1
Branco Castelo Branco 3.3 G2
Cornicabra Figueira de Castelo
Rodrigo
4.2 H1
Galega Castelo Branco 4.2 I1
Fund~ao 4.1 I2
Lentisca Valpac�os 2.8 J1
Madural Mirandela 4.3 K1
Valpac�os 3.3 K2
Madural Fina Mogadouro 3.2 L1
Madural Negra Mogadouro 3.3 M1
Negrinha do Freixo Figueira de Castelo
Rodrigo
6.2 N1
Picual Mirandela 6.5 O1
Roupuda Mogadouro 1.5 P1
Santulhana Mogadouro 2.7 Q1
Verdeal Macedo de Cavaleiros 4.6 R1
Transmontana Mirandela 4.1 R2
Valpac�os 2.2 R3aM.I. – maturation index.
562 A.F. Vinha et al. / Food Chemistry 89 (2005) 561–568
derivative of olive fruit (Romani et al., 1999; Ryan &
Robards, 1998; Servili, Baldioli, Selvaggini, Macchioni,
& Montedoro, 1999).
Phenolic compounds, in general, and secoiridoids in
particular, influence the sensorial properties of olivefruits and virgin olive oils and are largely responsible for
the modifications occurring during the processing of
table olives (Brenes, Rejano, Garc�ıa, S�anchez, & Gar-
rida, 1995). In virgin olive oils, they are the main agents
responsible for the resistance against autoxidation and
photoxidation (Bot�ıa et al., 2001; Papadopoulos & Bo-
skou, 1999; Romani et al., 1999).
Quantitative and even qualitative changes in thephenolic composition occur during ripening and con-
siderable differences can be observed according to the
stage of development of the fruit (Amiot et al., 1986,
1989; Esti et al., 1998; Romani et al., 1999).
For many years people have known that olives from
some cultivars are more suited to the production of table
olives, while others are used for oil production and that
the oils obtained from different cultivars have differentcharacteristics. These differences relate to differences in
chemical composition of the olive cultivars.
As far as we know, no reports on the nature and/or
concentrations of phenolic compounds in Portuguese
olive cultivars exist. Therefore, in the present work, the
phenolic compounds of twenty nine samples collected
from eighteen Portuguese olive fruit cultivars, consid-
ered the most common in Portugal, were identified andquantified. Correlations between phenolic profile, culti-
var and geographical origin are discussed.
2. Materials and methods
2.1. Samples
Olive fruits (Tables 1–3) were collected from different
locations in north (Macedo de Cavaleiros, Mirandela,
Valpac�os, Mogadouro and Figueira de Castelo Rodr-
igo) and central Portugal (Fund~ao and Castelo Branco),
yielding a total of 29 samples from 18 different cultivars.
In each region, the chosen cultivars were those pre-
dominating in the respective area. The samples were
collected in the period which coincided with the timewhen olives are usually harvested for oil production.
Healthy olive fruit samples were collected at different
times between November and December of 2000, which
coincided with the harvesting time of each region. For
each sample, about 500 g of these fruits were manually
collected from around three olive trees (approximately
1.5 m high). The fruits were stored at )20 �C and the
cores were removed before lyophilisation. The lyophili-sations were carried out using a Labconco 4.5 apparatus
(Kansas City, USA). Each lyophilised sample was
powdered to pass a 910 lm sieve, before the extraction
of phenolics.
The maturation index (M.I.) was determined ac-
cording to Hermoso et al. (1991) and varied between 0and 7. Olive fruits, 100 for each sample, were randomly
taken, classified into the categories below, and homog-
enized prior to storage. The categories were: 0 – olives
with intense green or dark green epidermis; 1 – olives
with yellow or yellowish green epidermis; 2 – olives with
yellowish epidermis but with reddish spots or areas over
less than half of the fruit; 3 – olives with reddish or light
violet epidermis over more than half of the fruit; 4 –olives with black epidermis and totally white pulp; 5 –
olives with black epidermis and less than 50% purple
pulp; 6 – olives with black epidermis and violet (more
than 50%) or purple pulp; 7 – olives with black epider-
mis and totally dark pulp.
With a to h being the number of fruits in each cate-
gory, the M.I. is
M:I: ¼ ða� 0þ b� 1þ c� 2þ d � 3þ e� 4þ f � 5
þ g � 6þ h� 7Þ=100:

Table 2
Non-flavonoidic composition of olive fruit samples (mg/kg (dry weight))a
Sample Phenolic compositionP
Hydroxytyrosol Oleuropein 5-Caffeoylquinic acid Verbascoside3
RT¼ 8.89 min RT¼ 41.01 min RT¼ 16.91 min RT¼ 32.21 min
Comp 1 Comp 7 Comp 2 Comp 3
A1 13,105 (302) 7434 (159) 2.6 (0.10) 1.9 (0.0061) 20,543
A2 9342 (86.4) 1015 (1.51) 2.0 (0.25) 17.3 (0.28) 10,376
B1 4239 (128) 4025 (107) tr 69.5 (3.33) 8333
B2 3828 (22.2) 5856 (59.9) 1.7 (0.06) 2.9 (0.04) 9689
C1 12,940 (180.1) 1834 (303) 4.6 (0.30) 144 (9.21) 14,922
D1 6244 (58.13) 1842.8 (39.22) tr 191.9 (2.27) 8279
D2 2781 (6.30) 388 (6.08) 1.6 (0.04) 27.9 (0.46) 3198
E1 2735 (12.2) 1493 (31.5) 5.7 (0.12) 164.4 (5.60) 4400
E2 5408.6 (169.72) 2335 (123) 9.3 (0.39) 76.6 (2.60) 7823
E3 15,200 (435.6) 966 (5.83) 3.2 (0.18) 100 (1.67) 16,269
E4 8150 (127) 1276 (7.53) 2.6 (0.71) 0.7 (0.017) 9429
F1 3741 (14.5) 3681 (31.5) 8.1 (0.10) 32.8 (0.70) 7463
G1 10,901 (584) 4901 (122) tr 89.3 (0.29) 15,892
G2 397 (27.9) 3090 (224) 3.4 (0.09) 24.7 (0.05) 7088
H1 5519 (227) 13703 (227) 4.6 (0.13) 84.7 (0.55) 19,311
I1 2312 (58.6) 479 (6.97) 3.5 (0.16) 32.5 (0.36) 2827
I2 3498 (132) 757 (1.40) tr 111 (2.85) 4366
J1 27,673 (55.1) 21,681 (466) 3.9 (0.12) 9.2 (0.05) 49,367
K1 4843 (179.8) 1860 (2.84) 9.1 (0.27) 209 (1.30) 6921
K2 7288 (93) 4398 (60.1) 0.6 (0.03) 164 (2.74) 11,851
L1 71,354 (39.5) 2113 (10.2) 4.7 (0.22) 69.5 (3.43) 73,541
M1 2163 (108) 930 (2.10) 2.4 (0.54) 2.7 (0.07) 3097
N1 2821 (166) 9943 (46.2) tr 106 (1.70) 12,870
O1 8100 (289) 10324 (58.9) 2.1 (0.46) 25.3 (0.37) 18,452
P1 9347 (169) 4365 (105) 12.5 (0.29) 114 (0.45) 13,839
Q1 10,626 (5.98) 1580 (13.2) 2.4 (0.03) 28.8 (0.039) 12,237
R1 15,763 (260) 13643 (90.3) 2.3 (0.043) 174 (1.58) 29,583
R2 5451 (42.1) 509 (30.9) 1.9 (0.06) tr 5962
R3 1477 (8.11) 2799 (8.15) 1.0 (0.12) 0.9 (0.06) 4278aValues are expressed as means (standard derivation) of three assays for each sample. tr, traces;
P, sum of the determined compounds; RT –
retention time.
A.F. Vinha et al. / Food Chemistry 89 (2005) 561–568 563
2.2. Standards
The standards used were from Sigma (St. Louis, MO,
USA) or Extrasynth�ese (Genay, France) and cyanidin 3-O-glucoside and cyanidin 3-O-rutinoside were from
Polyphenols (Sandnes, Norway). Methanol, formic and
hydrochloric acids and n-hexane were obtained from
Merck (Darmstadt, Germany). The water was treated in
a Milli-Q water purification system (Millipore, Bedford,
MA, USA) before use.
2.3. Solid-phase extraction columns
The ISOLUTE C18 non-end-capped (NEC) solid-
phase extraction (SPE) columns (50 lm particle size, 60�A porosity; 10 g sorbent mass/70 ml reservoir volume)
were purchased from International Sorbent Technology
Ltd. (Mid Glamorgan, UK).
2.4. Extraction of phenolic compounds
The extraction was achieved as previously reported
(Vinha et al., 2002): each sample (ca. 1.5 g) was thor-
oughly mixed with methanol until complete extraction
of these compounds (negative reaction to NaOH 20%).
The methanolic extract was filtered, evaporated to dry-
ness under reduced pressure (40 �C) and redissolved inmethanol (4 ml) of which 20 ll were injected for HPLC
analysis.
2.5. Purification of phenolic extract by SPE column
About 1.5 g of each sample were subjected to ex-
traction as previously described. The methanolic extract
obtained was taken to dryness under reduced pressure(40 �C), and redissolved in 50 ml of acidified water (pH 2
with HCl) to avoid the ionisation of the phenolic com-
pounds. The aqueous solution was then passed through
an ISOLUTE C18 (NEC) column, previously condi-
tioned with 60 ml of methanol and 140 ml of acidified
water (pH 2 with HCl). The loaded cartridge was wa-
shed with 60 ml of n-hexane to eliminate the lipid frac-
tion (Pirisi, Cabras, Cao, Migliorini, & Muggelli, 2000)and the retained phenolic compounds were then eluted
with methanol (60 ml). The methanolic extract was
concentrated to dryness under reduced pressure (40 �C)
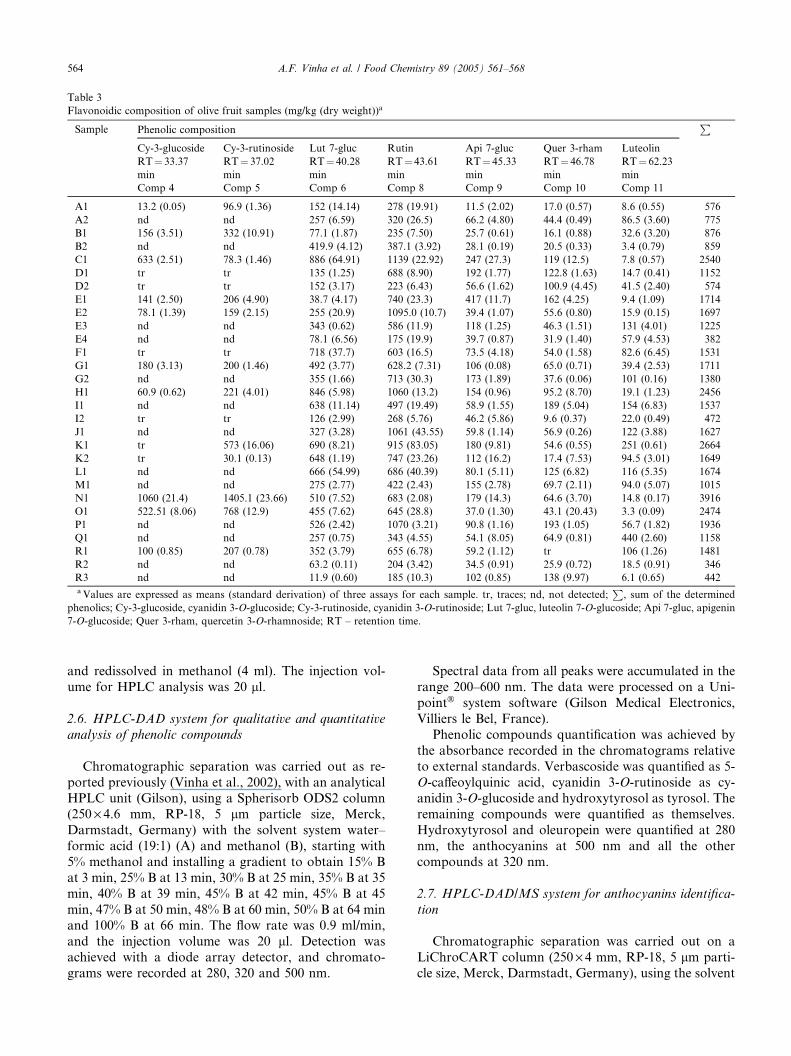
Table 3
Flavonoidic composition of olive fruit samples (mg/kg (dry weight))a
Sample Phenolic compositionP
Cy-3-glucoside Cy-3-rutinoside Lut 7-gluc Rutin Api 7-gluc Quer 3-rham Luteolin
RT¼ 33.37
min
RT¼ 37.02
min
RT¼ 40.28
min
RT¼ 43.61
min
RT¼ 45.33
min
RT¼ 46.78
min
RT¼ 62.23
min
Comp 4 Comp 5 Comp 6 Comp 8 Comp 9 Comp 10 Comp 11
A1 13.2 (0.05) 96.9 (1.36) 152 (14.14) 278 (19.91) 11.5 (2.02) 17.0 (0.57) 8.6 (0.55) 576
A2 nd nd 257 (6.59) 320 (26.5) 66.2 (4.80) 44.4 (0.49) 86.5 (3.60) 775
B1 156 (3.51) 332 (10.91) 77.1 (1.87) 235 (7.50) 25.7 (0.61) 16.1 (0.88) 32.6 (3.20) 876
B2 nd nd 419.9 (4.12) 387.1 (3.92) 28.1 (0.19) 20.5 (0.33) 3.4 (0.79) 859
C1 633 (2.51) 78.3 (1.46) 886 (64.91) 1139 (22.92) 247 (27.3) 119 (12.5) 7.8 (0.57) 2540
D1 tr tr 135 (1.25) 688 (8.90) 192 (1.77) 122.8 (1.63) 14.7 (0.41) 1152
D2 tr tr 152 (3.17) 223 (6.43) 56.6 (1.62) 100.9 (4.45) 41.5 (2.40) 574
E1 141 (2.50) 206 (4.90) 38.7 (4.17) 740 (23.3) 417 (11.7) 162 (4.25) 9.4 (1.09) 1714
E2 78.1 (1.39) 159 (2.15) 255 (20.9) 1095.0 (10.7) 39.4 (1.07) 55.6 (0.80) 15.9 (0.15) 1697
E3 nd nd 343 (0.62) 586 (11.9) 118 (1.25) 46.3 (1.51) 131 (4.01) 1225
E4 nd nd 78.1 (6.56) 175 (19.9) 39.7 (0.87) 31.9 (1.40) 57.9 (4.53) 382
F1 tr tr 718 (37.7) 603 (16.5) 73.5 (4.18) 54.0 (1.58) 82.6 (6.45) 1531
G1 180 (3.13) 200 (1.46) 492 (3.77) 628.2 (7.31) 106 (0.08) 65.0 (0.71) 39.4 (2.53) 1711
G2 nd nd 355 (1.66) 713 (30.3) 173 (1.89) 37.6 (0.06) 101 (0.16) 1380
H1 60.9 (0.62) 221 (4.01) 846 (5.98) 1060 (13.2) 154 (0.96) 95.2 (8.70) 19.1 (1.23) 2456
I1 nd nd 638 (11.14) 497 (19.49) 58.9 (1.55) 189 (5.04) 154 (6.83) 1537
I2 tr tr 126 (2.99) 268 (5.76) 46.2 (5.86) 9.6 (0.37) 22.0 (0.49) 472
J1 nd nd 327 (3.28) 1061 (43.55) 59.8 (1.14) 56.9 (0.26) 122 (3.88) 1627
K1 tr 573 (16.06) 690 (8.21) 915 (83.05) 180 (9.81) 54.6 (0.55) 251 (0.61) 2664
K2 tr 30.1 (0.13) 648 (1.19) 747 (23.26) 112 (16.2) 17.4 (7.53) 94.5 (3.01) 1649
L1 nd nd 666 (54.99) 686 (40.39) 80.1 (5.11) 125 (6.82) 116 (5.35) 1674
M1 nd nd 275 (2.77) 422 (2.43) 155 (2.78) 69.7 (2.11) 94.0 (5.07) 1015
N1 1060 (21.4) 1405.1 (23.66) 510 (7.52) 683 (2.08) 179 (14.3) 64.6 (3.70) 14.8 (0.17) 3916
O1 522.51 (8.06) 768 (12.9) 455 (7.62) 645 (28.8) 37.0 (1.30) 43.1 (20.43) 3.3 (0.09) 2474
P1 nd nd 526 (2.42) 1070 (3.21) 90.8 (1.16) 193 (1.05) 56.7 (1.82) 1936
Q1 nd nd 257 (0.75) 343 (4.55) 54.1 (8.05) 64.9 (0.81) 440 (2.60) 1158
R1 100 (0.85) 207 (0.78) 352 (3.79) 655 (6.78) 59.2 (1.12) tr 106 (1.26) 1481
R2 nd nd 63.2 (0.11) 204 (3.42) 34.5 (0.91) 25.9 (0.72) 18.5 (0.91) 346
R3 nd nd 11.9 (0.60) 185 (10.3) 102 (0.85) 138 (9.97) 6.1 (0.65) 442aValues are expressed as means (standard derivation) of three assays for each sample. tr, traces; nd, not detected;
P, sum of the determined
phenolics; Cy-3-glucoside, cyanidin 3-O-glucoside; Cy-3-rutinoside, cyanidin 3-O-rutinoside; Lut 7-gluc, luteolin 7-O-glucoside; Api 7-gluc, apigenin
7-O-glucoside; Quer 3-rham, quercetin 3-O-rhamnoside; RT – retention time.
564 A.F. Vinha et al. / Food Chemistry 89 (2005) 561–568
and redissolved in methanol (4 ml). The injection vol-
ume for HPLC analysis was 20 ll.
2.6. HPLC-DAD system for qualitative and quantitative
analysis of phenolic compounds
Chromatographic separation was carried out as re-
ported previously (Vinha et al., 2002), with an analyticalHPLC unit (Gilson), using a Spherisorb ODS2 column
(250 · 4.6 mm, RP-18, 5 lm particle size, Merck,
Darmstadt, Germany) with the solvent system water–
formic acid (19:1) (A) and methanol (B), starting with
5% methanol and installing a gradient to obtain 15% B
at 3 min, 25% B at 13 min, 30% B at 25 min, 35% B at 35
min, 40% B at 39 min, 45% B at 42 min, 45% B at 45
min, 47% B at 50 min, 48% B at 60 min, 50% B at 64 minand 100% B at 66 min. The flow rate was 0.9 ml/min,
and the injection volume was 20 ll. Detection was
achieved with a diode array detector, and chromato-
grams were recorded at 280, 320 and 500 nm.
Spectral data from all peaks were accumulated in the
range 200–600 nm. The data were processed on a Uni-
point� system software (Gilson Medical Electronics,
Villiers le Bel, France).
Phenolic compounds quantification was achieved by
the absorbance recorded in the chromatograms relative
to external standards. Verbascoside was quantified as 5-
O-caffeoylquinic acid, cyanidin 3-O-rutinoside as cy-anidin 3-O-glucoside and hydroxytyrosol as tyrosol. The
remaining compounds were quantified as themselves.
Hydroxytyrosol and oleuropein were quantified at 280
nm, the anthocyanins at 500 nm and all the other
compounds at 320 nm.
2.7. HPLC-DAD/MS system for anthocyanins identifica-
tion
Chromatographic separation was carried out on a
LiChroCART column (250 · 4 mm, RP-18, 5 lm parti-
cle size, Merck, Darmstadt, Germany), using the solvent

A.F. Vinha et al. / Food Chemistry 89 (2005) 561–568 565
system water–formic acid (19:1) (A) and methanol (B),
starting with 5% methanol and installing a gradient to
obtain at 3 min – 15% B, 13 min – 25% B, 25 min – 30%
B, 35 min – 35% B, 39 min – 40% B, 42 min – 45% B, 45
min – 45% B, 50 min – 47% B, 60 min – 48% B, 64 min –50% B and 66 min – 100% B. The flow rate was 0.9 ml/
min, and the injection volume was 80 ll. Spectral datafrom all peaks were accumulated in the 240–600 nm
range and chromatograms were recorded at 500 nm.
The HPLC system was equipped with a DAD and
mass detector in series (Agilent 1100 Series LC/MSD
Trap). It consisted of an Agilent G1312A HPLC binary
pump, an Agilent G1313A autosampler, an AgilentG1322A degasser and an Agilent G1315B photo-diode
array detector controlled by Agilent software v. A.08.03
(Agilent Technologies, Waldbronn, Germany). The mass
detector was an Agilent G2445A ion-trap mass spec-
trometer (Agilent Technologies, Waldbronn, Germany)
equipped with an electrospray ionisation (ESI) system
and controlled by Agilent Software v. 4.0.25. Nitrogen
was used as nebulizing gas at a pressure of 65 psi and theflow was adjusted to 11 l/min. The heated capillary and
voltage were maintained at 350 �C and 4 kV, respectively.
The full scan mass spectra of the phenolic compounds
were measured from m=z 100 up to m=z 2000. Collision-induced fragmentation experiments were performed in
the ion trap, using helium as the collision gas, while the
collision energy was set at 100%. Mass spectrometry data
were acquired in the positive ionisation mode.
3. Results and discussion
3.1. Identification of the compounds
The peaks on the chromatogram at 500 nm (Fig. 1,
peaks 4 and 5) showed identical spectra, with twomaxima at 280 and 516–518 nm, which suggested the
presence of anthocyanins or anthocyanin derivatives.
Upon HPLC–MS analysis, peak 4 showed a pseudo-
molecular ion [M+H]þ at m=z 449 and the MS2 event
yielded a fragment ion at m=z at 287, typical mass in the
positive mode of the cyanidin aglycone, corresponding
to the loss of glucose (m=z 162). An authentic standard
of cyanidin 3-O-glucoside was injected and the retentiontime, UV and MS spectra matched those of peak 4.
Therefore, peak 4 was identified as cyanidin 3-O-
glucoside.
Peak 5 showed a pseudomolecular ion [M+H]þ at
m=z 595 and the MS2 event yielded a fragment ion at
m=z at 287, typical mass in the positive mode of the
cyanidin aglycone, corresponding to the loss of rutino-
side (m=z 308). An authentic standard of cyanidin 3-O-rutinoside was injected and the retention time, UV and
MS spectra matched those of peak 5. Therefore, peak 5
was identified as cyanidin 3-O-rutinoside.
The non-coloured phenolic compounds were identi-
fied by comparison of their retention times and UV–Vis
spectra in the 200–600 nm range with those obtained
from standards. Verbascoside was identified by com-
parison with the compound already described by usfrom Lippia citriodora (Valent~ao, Andrade, Areias,
Ferreres, & Seabra, 1999).
The majority of olive samples presented the same
chemical profile, composed of 11 identified phenolic
compounds: hydroxytyrosol, 5-O-caffeoylquinic acid,
verbascoside, luteolin 7-O-glucoside, oleuropein, rutin,
apigenin 7-O-glucoside, quercetin 3-O-rhamnoside, lu-
teolin, cyanidin 3-O-glucoside and cyanidin 3-O-ruti-noside (Fig. 1). Some samples revealed the presence of
two unidentified compound (compounds a and b), with
retention time 35.20 and 50.41 min, respectively. These
compounds presented as UV spectrum closely related to
that of oleuropein, leading us to presume that they could
be an oleuropein derivative, as was observed in some
Australian cultivars (Ryan et al., 2002).
3.2. Quantitative results
As a general rule, when the cleaning step was used the
amount of each phenolic compound extracted was
higher. However, when this cleaning step was used,
oleuropein presented a lower recovery rate (Vinha et al.,
2002). To check what happened to oleuropein, a given
amount of this standard was subjected to the sametreatment; when the eluate was analysed we found that
oleuropein was degradated and a peak with a higher
retention time (47.04 min) and with the same spectra
(probably oleuropein aglycone) was also found (data
not shown). Therefore, the quantification of oleuropein
was made in the extract without pre-treatment on a SPE
column (Table 2).
Among the identified compounds, hydroxytyrosoland oleuropein were the major phenolic compounds
(Table 2). The analysis of Table 2 reveals considerable
quantitative differences in oleuropein contents among
the different cultivars: the amount of oleuropein ranged
from 388 mg/kg (D2) to 21,681 mg/kg (J1), with a mean
value of 4549 mg/kg. In 48% of the analysed cultivars,
the oleuropein content was above 3000 mg/kg. These
values are higher than those reported by Romani et al.(1999) and Esti et al. (1998) for Italian cultivars but
lower than some values reported by Amiot et al. (1986)
for French cultivars.
In general the values found for hydroxytyrosol can
also be considered as high, when compared with pub-
lished data. In fact, 27 of the 29 samples analysed
showed levels ranging from 1477 mg/kg (R3) to 15,763
mg/kg (R1) but two samples (J1 and L1) presentedvalues even greater, amounting to 27,872 and 71,354
mg/kg, respectively, while most values found in the lit-
erature range from about 300 mg/kg (Esti et al., 1998) to

Fig. 1. HPLC phenolic profile of Picual sample. (1) hydroxytyrosol; (2) 5-O-caffeoylquinic acid; (3) verbascoside; (4) cyanidin 3-O-glucoside; (5)
cyanidin 3-O-rutinoside; (6) luteolin 7-O-glucoside; (7) oleuropein; (8) rutin; (9) apigenin 7-O-glucoside; (10) quercetin 3-O-rhamnoside; (11) luteolin;
(a and b) unidentified secoiridoid compounds.
566 A.F. Vinha et al. / Food Chemistry 89 (2005) 561–568
8000 mg/kg (Romani et al., 1999). In addition, hy-
droxytyrosol contents were generally higher than oleu-
ropein concentrations which contrasts with the previous
studies by Esti et al. (1998) and Servili et al. (1999).
Although hydroxytyrosol is sometimes considered as a
degradation product of oleuropein (which leads someauthors to believe that during maturation oleuropein
decreases as hydroxytyrosol increases), this observation
could not be confirmed in this study: in fact, samples
with higher M.I. did not show high values for the ratio
hydroxytyrosol/oleuropein and no correlation was
found between M.I. and hydroxytyrosol contents, even
for the same cultivar.
Tyrosol is a phenolic alcohol, usually present in ol-
ives, although in lower amounts than hydroxytyrosol
(Romani et al., 1999). However, in the analysed samples,
it was only found in vestigial amounts (Lentisca, Borr-
enta and Santulhana cultivars) or even absent (data not
shown).Chlorogenic acid, first reported to occur in leaves of
Olea europaea, was found for the first time in olives by
Ryan et al. (2002) and is now confirmed and quantified
in 23 of the 29 analysed samples, although in amounts
below 12.5 mg/kg.
The Portuguese studied cultivars showed very low
amounts of verbascoside (below 0.02%) when compared
A.F. Vinha et al. / Food Chemistry 89 (2005) 561–568 567
with those from other studied cultivars, namely the
Italian ones studied by Romani et al. (1999) and the
French ones studied by Amiot et al. (1986) who found
values around 0.5%. This observation corroborates the
correlation already noticed by Amiot et al. (1986) andlater reasonably confirmed by Esti et al. (1998), that the
cultivars with the highest oleuropein content were those
with the least verbascoside.
Five non-coloured flavonoids were identified and
quantified. In 25, out of the 29 analysed samples, luteolin
7-O-glucoside and rutin were the predominant flavonoids
and, in general, rutin was present in higher amounts than
the luteolin derivative. This seems to be a fact common toother olive cultivars, since these two compounds are al-
ways reported to occur in olive fruits, even when other
compounds are not present (Esti et al., 1998; Servili et al.,
1999). Free luteolin is always present in low amounts
(usually below 100mg/kg) except in the case of sample Q1
(434 mg/kg, M.I. 2.72) and in sample K1 (251 mg/kg,
M.I. 4.25). Although it is generally accepted that free
flavonoids appear at the end of the maturation stage as aconsequence of hydrolytic processes, no correlation was
found between maturation index and the levels of free
luteolin. Therefore, we may hypothesise that at least the
high levels found in Santulhana (sample Q1) may be a
characteristic of this cultivar.
Besides cyanidin 3-O-glucoside and cyanidin 3-O-ru-
tinoside, no other anthocyanins were detected. In all
cases, cyanidin 3-O-rutinoside was present in higheramounts than cyanidin 3-O-glucoside, a fact that has
already been verified in cultivars analysed by Romani
et al. (1999). As expected, the samples with higher levels
of anthocyanins were those with higher maturation in-
dices, namely sample N1 (M.I. 6.2, with 2465 mg/kg)
and sample O1 (M.I. 6.5, with 1291 mg/kg). However, a
strict correlation between M.I. and the amount of an-
thocyanins was not found. For instance sample B1, witha M.I. of 3.3, presented higher amounts of anthocyanins
than many other samples with higher M.I., leading to
the assumption that factors other than ripeness influence
the anthocyanin content. The high levels of anthocya-
nins in Negrinha do Freixo (sample N1) and Picual
(sample O1) can be explained by the fact that the fruits
of these cultivars are usually consumed as naturally
black table olives, which means that they are collectedwhen almost black (the other cultivars are usually used
for oil production and are collected before they reach
complete maturation).
3.3. Factors influencing the phenolic profile
Several factors are known to affect the quantitative
phenolic profiles of olive fruits. Among these factors, thedegree of ripeness, the geographical origin and the na-
ture of the cultivar are certainly those that have a pro-
nounced influence on the composition. Some studies are
already published concerning the influence of these
factors on some French (Amiot et al., 1986) Spanish
(Bot�ıa et al., 2001) and Italian (Esti et al., 1998; Romani
et al., 1999) cultivars.
The samples that were the object of the study pre-sented herein have different geographical origins and
different maturation indices and were collected from
different cultivars. Although the strict influence of one
factor can only be evaluated when all other factors re-
main constant, some clear conclusions can be drawn
from the results herein obtained. For example, samples
B1 and B2, two samples from the same cultivar but with
different M.I. and geographical origins, have similarphenolic profiles for the major compounds, pointing to a
strong influence of the cultivar. However, when com-
paring other samples, we can observe a stronger influ-
ence of the geographical origin. For instance, on
comparing samples A2, E4, and Q1, three samples from
the same geographical origin and with similar M.I. (2.5,
2.4 and 2.7, respectively), but collected from different
cultivars, there are very similar phenolic profiles, de-noting a strong influence of geographical origin. The
same can be observed for the samples N1 and H1, that
exhibit similar profiles, even with very different M.I.s.
The influence of the geographical origin can also be
observed when comparing samples from the same cul-
tivar and with very similar M.I.s as shown for the
sample pairs R1/R2 and G1/G2 and E1/E2.
Although the geographical origin seems to play animportant role in the pattern of phenolic profiles, some
of the Portuguese cultivars now analysed seem to have
characteristic phenolic profiles: Santulhana (sample Q1)
for its high amount of free luteolin, Lentisca (sample J1)
for its high level of hydroxytyrosol plus oleuropein and
Madural Fina (sample L1) for its very high hydroxyty-
rosol/oleuropein ratio (33.8:1). Samples B2, H1, N1, R3
and O1 are the only ones where oleuropein clearly sur-passes the level of hydroxytyrosol; it is not possible to
prove whether this is a characteristic of the cultivar or
alternatively related to geographical origin; this can only
be confirmed from more analysis in samples collected
during future years.
If future analysis confirms the results now obtained,
we can conclude that at least two Portuguese cultivars
may produce excellent olive oils in terms of oxidativeresistance, given their very high levels of hydroxytyrosol
and oleuropein, two compounds that are considered to
give strong protection against autoxidation and ther-
moxidation of olive oil (Papadopoulos & Boskou, 1999).
Acknowledgements
Branca M. Silva is grateful to Fundac�~ao para a
Ciencia e a Tecnologia for a Grant (PRAXIS XXI/BD/
21339/99).

568 A.F. Vinha et al. / Food Chemistry 89 (2005) 561–568
References
Amiot, M. J., Fleuriet, A., & Macheix, J. J. (1986). Importance and
evolution of phenolic compounds in olive during growth and
maturation. Journal ofAgricultural andFoodChemistry, 34, 823–826.
Amiot, M. J., Fleuriet, A., & Macheix, J. J. (1989). Accumulation of
oleuropein derivatives during olive maturation. Phytochemistry, 28,
67–69.
Bot�ıa, J. M., Ortu~no, A., Benavente-Garc�ıa, O., B�aidez, A. G., Fr�ıas,
J., Marcos, D., & Del R�ıo, J. A. (2001). Modulation of the
biosynthesis of some phenolic compounds in Olea europaea L.
fruits: Their influence on olive oil quality. Journal of Agricultural
and Food Chemistry, 49, 355–358.
Brenes, M., Rejano, L., Garc�ıa, P., S�anchez, H., & Garrida, A. (1995).
Biochemical changes in phenolic compounds during spanish-style
green olive processing. Journal of Agricultural and Food Chemistry,
43, 2702–2706.
Esti, M., Cinquanta, L., & La Notte, E. (1998). Phenolic compounds in
different olive varieties. Journal of Agricultural and Food Chemistry,
46, 32–35.
Harborne, J. B. (1989). General procedures and measurement of total
phenolics. In P. M. Dey & J. B. Harborne (Eds.), Methods in plant
phenolics (pp. 2–9). London: Academic Press.
Hermoso, M., Uceda, M., Garc�ıa, A., Morales, B., Frias, M. L., &
Fern�andez, A. (1991). Elaboraci�on de aceite de calidad. Consejeria
de Agricultura y Pesca, Serie Apuntes, 5/92., Sevilla.
Macheix, J. J., Fleuriet, A., & Billot, J. (1990). Fruit phenolics (pp. 1–
126). Boca Raton, FL: CRC Press.
Mazza, G., & Miniati, E. (1993). Anthocyanins in fruits, vegetables and
grains (pp. 64–67). Boca Raton, FL: CRC Press.
Papadopoulos, G., & Boskou, D. (1999). Antioxidant effect of natural
phenols on olive oil. JAOCS, 68, 669–671.
Pirisi, F. M., Cabras, P., Cao, C. F., Migliorini, M., & Muggelli, M.
(2000). Phenolic compounds in virgin olive oil. 2. Reappraisal
of the extraction, hplc separation, and quantification proce-
dures. Journal of Agricultural and Food Chemistry, 48,
1191–1196.
Romani, A., Mulinacci, N., Pinelli, P., Vincieri, F. F., & Cimato, A.
(1999). Polyphenolic content in five Tuscany cultivars of Olea
europaea L. Journal of Agricultural and Food Chemistry, 47, 964–
967.
Romero, C., Brenes, M., Garc�ıa, P., & Garrido, A. (2002). Hydroxy-
tyrosol 4-b-DD-glucoside, an important phenolic compound in olive
fruits and derived products. Journal of Agricultural and Food
Chemistry, 50, 3835–3839.
Ryan, D., Antolovich, M., Herlt, T., Prenzler, P. D., Lavee, S., &
Robards, K. (2002). Identification of phenolic compounds in
tissues of the novel olive cultivar Hardy’s Mammoth. Journal of
Agricultural and Food Chemistry, 50, 6716–6724.
Ryan, D., & Robards, K. (1998). Phenolic compounds in olives.
Analyst, 123, 31R–44R.
Servili, M., Baldioli, M., Selvaggini, R., Macchioni, A., & Montedoro,
G. (1999). Phenolic compounds of olive fruits: One- and two-
dimensional nuclear magnetic resonance characterization of nuz-
henide and its distribution in the constitutive parts of fruit. Journal
of Agricultural and Food Chemistry, 47, 12–18.
Soler-Rivas, C., Esp�ın, J. C., & Wichers, H. J. (2000). Oleuropein and
related compounds. Journal of the Science of Food and Agriculture,
80, 1013–1023.
Valent~ao, P., Andrade, P. B., Areias, F., Ferreres, F., & Seabra, R. M.
(1999). Analysis of vervain flavanoids by HPLC/Diode array
detector method. Its application to quality control. Journal of
Agricultural and Food Chemistry, 47, 4579–4582.
Vinha, A. F., Silva, B. M., Andrade, P. B., Seabra, R. M., Pereira, J.
A., & Oliveira, M. B. (2002). Development and evaluation of an
HPLC/DAD method for the analysis of phenolic compounds from
olive fruits. Journal of Liquid Chromatography & Related Technol-
ogy, 25, 151–160.