Batch variability and cultivar keeping quality of cucumber
12
Postharvest Biology and Technology 32 (2004) 299–310 Batch variability and cultivar keeping quality of cucumber Rob E. Schouten a,∗ , Geurt Jongbloed b , L.M.M. Tijskens a,c , Olaf van Kooten a a Horticultural Production Chains, Wageningen University, Marijkeweg 22, 6709 PG Wageningen, The Netherlands b Department of Mathematics, The Vrije Universiteit, De Boelelaan 1081A, 1081 HV Amsterdam, The Netherlands c Agrotechnological Research Institute (ATO), P.O. Box 17, 6700 AA Wageningen, The Netherlands Received 11 March 2003; accepted 24 December 2003 Abstract A batch model is presented for the interpretation of batch behaviour in terms of current maturity, biological variation and maximal maturity towards keeping quality of cucumbers. The batch model describes the influence of one source of biological variation, here assumed to be variation in light conditions during the pre-harvest period, on the variation of precursor concentra- tions. The batch model consists of a kinetic part, describing the behaviour of the precursor for individuals, and a stochastic part, describing the precursor variation. The stochastic part is generic, but the kinetic part depends on the processes that determine keeping quality. The batch model is tested and validated using colour data of two sets of cucumber batches. Applying a previously developed cucumber colour model [Postharvest Biol. Technol. 26 (2002) 209], the precursor concentration determining the keeping quality at harvest was estimated. The amount of colour precursor at maximal maturity could be estimated in common for batches of the same cultivar and was defined as cultivar keeping quality. The batch model enables estimation of cultivar-specific information. It thereby takes advantage of the biological variation present in all biological batches, instead of treating it as a nuisance. © 2004 Elsevier B.V. All rights reserved. Keywords: Colour; Maturity; Precursor; Biological variation; Stochastic 1. Introduction Daily quality control routines applied at auctions and wholesale markets aim at quickly estimating the acceptability of batches. A batch may be defined as all individuals sharing the same harvest date, grower and cultivar (Schouten and Van Kooten, 1998), implying a common growth history. If all individuals in a batch were identical and stored under the same conditions, ∗ Corresponding author. Tel.: +31-317-482408; fax: +31-317-484709. E-mail address: [email protected] (R.E. Schouten). they would all reach the quality limit, the end of keep- ing quality, at the same time. Deciding whether a batch is acceptable would then only require the examination of one individual per batch. However, because of the presence of biological variation, this is not the case. Quality controllers are therefore required to inspect a representative part of a batch. Biological variation can be described as the com- posite of biological properties that differentiate indi- vidual units of a batch (adapted from Tijskens and Konopacki (2003)). One of those properties may be maturity. Maturity at harvest has often a decisive in- fluence on the behaviour of the product after harvest 0925-5214/$ – see front matter © 2004 Elsevier B.V. All rights reserved. doi:10.1016/j.postharvbio.2003.12.005
-
Upload
wageningenur -
Category
Documents
-
view
1 -
download
0
Transcript of Batch variability and cultivar keeping quality of cucumber
Postharvest Biology and Technology 32 (2004) 299–310
Batch variability and cultivar keeping quality of cucumber
Rob E. Schoutena,∗, Geurt Jongbloedb, L.M.M. Tijskensa,c, Olaf van Kootena
a Horticultural Production Chains, Wageningen University, Marijkeweg 22, 6709 PG Wageningen, The Netherlandsb Department of Mathematics, The Vrije Universiteit, De Boelelaan 1081A, 1081 HV Amsterdam, The Netherlands
c Agrotechnological Research Institute (ATO), P.O. Box 17, 6700 AA Wageningen, The Netherlands
Received 11 March 2003; accepted 24 December 2003
Abstract
A batch model is presented for the interpretation of batch behaviour in terms of current maturity, biological variation andmaximal maturity towards keeping quality of cucumbers. The batch model describes the influence of one source of biologicalvariation, here assumed to be variation in light conditions during the pre-harvest period, on the variation of precursor concentra-tions. The batch model consists of a kinetic part, describing the behaviour of the precursor for individuals, and a stochastic part,describing the precursor variation. The stochastic part is generic, but the kinetic part depends on the processes that determinekeeping quality.
The batch model is tested and validated using colour data of two sets of cucumber batches. Applying a previously developedcucumber colour model [Postharvest Biol. Technol. 26 (2002) 209], the precursor concentration determining the keeping qualityat harvest was estimated. The amount of colour precursor at maximal maturity could be estimated in common for batches of thesame cultivar and was defined as cultivar keeping quality. The batch model enables estimation of cultivar-specific information.It thereby takesadvantage of the biological variation present in all biological batches, instead of treating it as a nuisance.© 2004 Elsevier B.V. All rights reserved.
Keywords: Colour; Maturity; Precursor; Biological variation; Stochastic
1. Introduction
Daily quality control routines applied at auctionsand wholesale markets aim at quickly estimating theacceptability of batches. A batch may be defined as allindividuals sharing the same harvest date, grower andcultivar (Schouten and Van Kooten, 1998), implyinga common growth history. If all individuals in a batchwere identical and stored under the same conditions,
∗ Corresponding author. Tel.:+31-317-482408;fax: +31-317-484709.
E-mail address: [email protected] (R.E. Schouten).
they would all reach the quality limit, the end of keep-ing quality, at the same time. Deciding whether a batchis acceptable would then only require the examinationof one individual per batch. However, because of thepresence of biological variation, this is not the case.Quality controllers are therefore required to inspect arepresentative part of a batch.
Biological variation can be described as the com-posite of biological properties that differentiate indi-vidual units of a batch (adapted fromTijskens andKonopacki (2003)). One of those properties may bematurity. Maturity at harvest has often a decisive in-fluence on the behaviour of the product after harvest
0925-5214/$ – see front matter © 2004 Elsevier B.V. All rights reserved.doi:10.1016/j.postharvbio.2003.12.005
300 R.E. Schouten et al. / Postharvest Biology and Technology 32 (2004) 299–310
(Hertog et al., 1997; Schouten et al., 1997). For ex-ternal quality attributes like colour and texture, anddifferences in maturity within a batch and betweenbatches are hard to observe and to evaluate; for inter-nal quality attributes like vitamin or sugar content itis even harder.
Mathematical tools to deal with biological variationon a fundamental level are scarce. In practise, it isoften assumed that the quality attribute under observa-tion is normally distributed which means that standardstatistical techniques, such as ANOVA, can be applied.When the quality attribute is clearly not normallydistributed problems may arise. Another approachmight be to use known distributions that allow skewedstochastic behaviour. The binomial or the Poissondistribution might be applied, where the developmentof the quality attribute over time can be approximatedby a logistic or a exponential mechanism, respectively(Tijskens, 2003). These approaches are, however,purely descriptive and lack any link to the physiologi-cal processes that govern the behaviour of individuals.
Recently,Hertog (2002)outlined a mathematicalapproach to interpret batch behaviour for shrivellingof apples and colour change of avocados that is basedon the underlying processes occurring at the individ-ual level. A similar approach will be shown here todescribe cucumber batch behaviour with regard tocolour retention. Previous research pointed out thatthe amount of colour precursor available at harvestis indicative for the colour retention of cucumberbatches, not so much the colour at harvest. A kineticmodel was proposed that describes the individualcucumber colour development over time and tempera-ture in terms of the precursor concentration at harvest(Schouten et al., 2002). The aim of this paper is todevelop a batch methodology that combines kineticmodels with stochastic theory to describe the variationin precursor concentrations for cucumber batches.The batch methodology is developed and tested byanalysing the stochastic behaviour of precursor con-centration for two sets of cucumber batches.
2. Modelling
Legend of symbols and abbreviations used in themodelling section is shown inTable 1for referencepurposes.
Table 1Legend and abbreviations
σ Biological variation and standard deviation of errorfunctionΦ
Φ Normalised cumulative normal distribution functionψ Undefined cumulative distribution functionchl Chlorophyllide concentrationCHL Chlorophyll concentrationkf Reaction rate constant for the decay of Pchlkt Reaction rate constant for the formation of Pchl
from TPchlPchl Protochlorophyllide concentrationPchl0 Protochlorophyllide concentration at harvestPchlminvar Protochlorophyllide concentration at minimal
variation and cultivar-specific keeping qualityparameter
Pr Probabilityqa, qb Class border a or b, expressed as Pchl0
tm Maturity of an individualtbm Maturity for a batchtminvar Time after start growth when minimal variation in
Pchl or prec occursT-Pchl Pchl concentration stored in a ternary complexT-Pchls Pchl concentration stored in a ternary complex at
start cucumber growth
2.1. Batch keeping quality for cucumbers
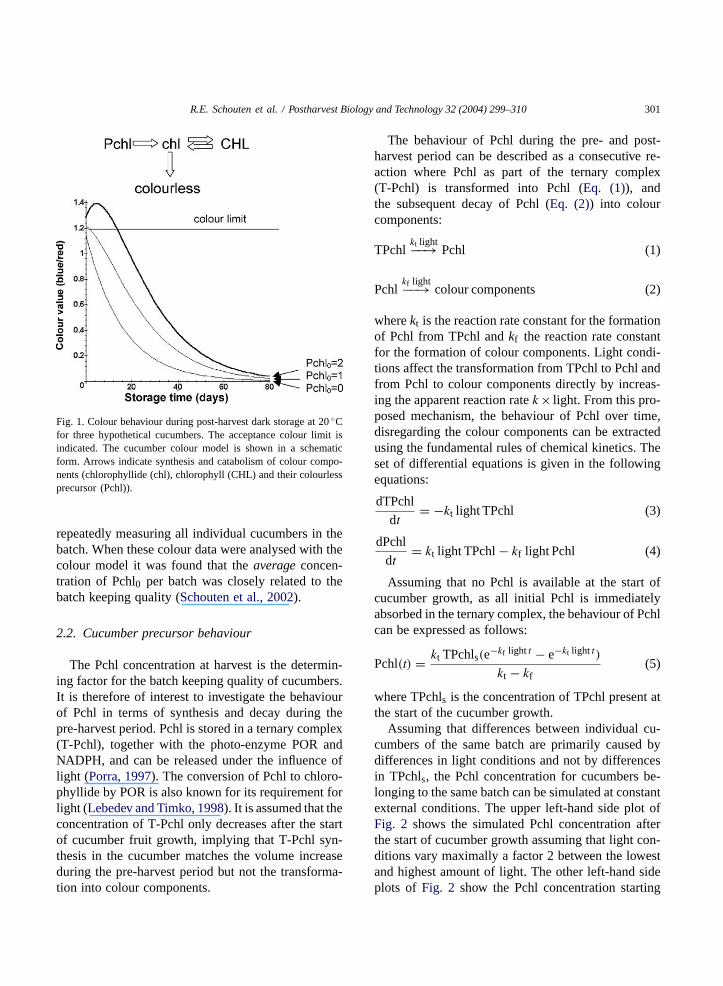
A colour model was developed describing thechange in concentration of the compounds with greencolour (chlorophyll (CHL) and chlorophyllide (chl))and their precursor (protochlorophyllide (Pchl)) overtime and temperature. It was assumed that no pre-cursor would be synthesised after harvest. Colour isdefined as the sum of CHL and chl (Schouten et al.,2002). The mechanism is shown inFig. 1, togetherwith an indication of the colour behaviour in time forthree hypothetical cucumbers. These cucumbers dif-fer only in Pchl0, with Pchl0 being the concentrationof Pchl present at harvest time. The colour model isgeneric and does not contain or need cultivar factors(Schouten et al., 2002).
The batch keeping quality was defined as the timeit takes until 5% of all cucumbers in a batch reach thecolour limit (Schouten and Van Kooten, 1998). Batchkeeping quality can be obtained by estimating the timeit takes for every cucumber in a batch to cross thecolour limit and applying a simple linear interpola-tion procedure to estimate when 5% of the individu-als in a batch crossed the colour limit. To do this, thecolour development in time needs to be assessed by
R.E. Schouten et al. / Postharvest Biology and Technology 32 (2004) 299–310 301
Fig. 1. Colour behaviour during post-harvest dark storage at 20◦Cfor three hypothetical cucumbers. The acceptance colour limit isindicated. The cucumber colour model is shown in a schematicform. Arrows indicate synthesis and catabolism of colour compo-nents (chlorophyllide (chl), chlorophyll (CHL) and their colourlessprecursor (Pchl)).
repeatedly measuring all individual cucumbers in thebatch. When these colour data were analysed with thecolour model it was found that theaverage concen-tration of Pchl0 per batch was closely related to thebatch keeping quality (Schouten et al., 2002).
2.2. Cucumber precursor behaviour
The Pchl concentration at harvest is the determin-ing factor for the batch keeping quality of cucumbers.It is therefore of interest to investigate the behaviourof Pchl in terms of synthesis and decay during thepre-harvest period. Pchl is stored in a ternary complex(T-Pchl), together with the photo-enzyme POR andNADPH, and can be released under the influence oflight (Porra, 1997). The conversion of Pchl to chloro-phyllide by POR is also known for its requirement forlight (Lebedev and Timko, 1998). It is assumed that theconcentration of T-Pchl only decreases after the startof cucumber fruit growth, implying that T-Pchl syn-thesis in the cucumber matches the volume increaseduring the pre-harvest period but not the transforma-tion into colour components.
The behaviour of Pchl during the pre- and post-harvest period can be described as a consecutive re-action where Pchl as part of the ternary complex(T-Pchl) is transformed into Pchl (Eq. (1)), andthe subsequent decay of Pchl (Eq. (2)) into colourcomponents:
TPchlkt light−−→ Pchl (1)
Pchlkf light−−→ colour components (2)
wherekt is the reaction rate constant for the formationof Pchl from TPchl andkf the reaction rate constantfor the formation of colour components. Light condi-tions affect the transformation from TPchl to Pchl andfrom Pchl to colour components directly by increas-ing the apparent reaction ratek× light. From this pro-posed mechanism, the behaviour of Pchl over time,disregarding the colour components can be extractedusing the fundamental rules of chemical kinetics. Theset of differential equations is given in the followingequations:
dTPchl
dt= −kt light TPchl (3)
dPchl
dt= kt light TPchl− kf light Pchl (4)
Assuming that no Pchl is available at the start ofcucumber growth, as all initial Pchl is immediatelyabsorbed in the ternary complex, the behaviour of Pchlcan be expressed as follows:
Pchl(t) = kt TPchls(e−kf light t − e−kt light t)
kt − kf(5)
where TPchls is the concentration of TPchl present atthe start of the cucumber growth.
Assuming that differences between individual cu-cumbers of the same batch are primarily caused bydifferences in light conditions and not by differencesin TPchls, the Pchl concentration for cucumbers be-longing to the same batch can be simulated at constantexternal conditions. The upper left-hand side plot ofFig. 2 shows the simulated Pchl concentration afterthe start of cucumber growth assuming that light con-ditions vary maximally a factor 2 between the lowestand highest amount of light. The other left-hand sideplots of Fig. 2 show the Pchl concentration starting
302 R.E. Schouten et al. / Postharvest Biology and Technology 32 (2004) 299–310
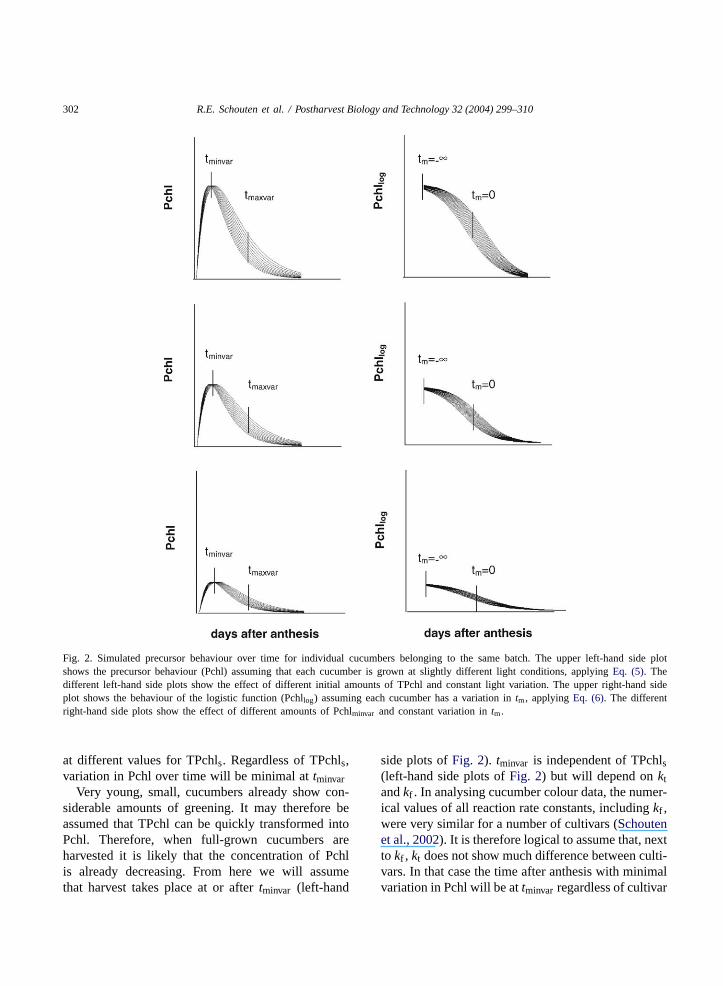
Fig. 2. Simulated precursor behaviour over time for individual cucumbers belonging to the same batch. The upper left-hand side plotshows the precursor behaviour (Pchl) assuming that each cucumber is grown at slightly different light conditions, applyingEq. (5). Thedifferent left-hand side plots show the effect of different initial amounts of TPchl and constant light variation. The upper right-hand sideplot shows the behaviour of the logistic function (Pchllog) assuming each cucumber has a variation intm, applyingEq. (6). The differentright-hand side plots show the effect of different amounts of Pchlminvar and constant variation intm.
at different values for TPchls. Regardless of TPchls,variation in Pchl over time will be minimal attminvar
Very young, small, cucumbers already show con-siderable amounts of greening. It may therefore beassumed that TPchl can be quickly transformed intoPchl. Therefore, when full-grown cucumbers areharvested it is likely that the concentration of Pchlis already decreasing. From here we will assumethat harvest takes place at or aftertminvar (left-hand
side plots ofFig. 2). tminvar is independent of TPchls(left-hand side plots ofFig. 2) but will depend onktandkf . In analysing cucumber colour data, the numer-ical values of all reaction rate constants, includingkf ,were very similar for a number of cultivars (Schoutenet al., 2002). It is therefore logical to assume that, nextto kf , kt does not show much difference between culti-vars. In that case the time after anthesis with minimalvariation in Pchl will be attminvar regardless of cultivar

R.E. Schouten et al. / Postharvest Biology and Technology 32 (2004) 299–310 303
when grown at the same temperature. Interestingly,the behaviour of Pchl over time, starting attminvar,resembles a s-curve (left-hand side plots ofFig. 2).
2.3. The batch model formulation
The batch model aims to describe the variation inthe precursor concentrations encountered at harvest.To do so, we need to invert the precursor function fora mathematical reason described below. With the cur-rent representation of the precursor function, this isnot possible because the Pchl function (Eq. (5)) is firstincreasing and later decreasing over time (left-handside plots ofFig. 2). So, we need to find a represen-tation of the precursor function that may be inverted.Here, we propose that the Pchl function (Eq. (5)) aftertminvar may be approximated by a decreasing logisticbetween Pchlminvar and 0:
Pchllog(tm) = Pchlminvar
1 + e(Pchlminvar tm)with tminvar ≤ tm
(6)
When variation is assumed ontm, minimal variationin Pchllog is reached attm = −∞. After tm = −∞the variation increases, reaching the maximal varia-tion at tm = 0, and then decreases again (upper plotof Fig. 3). The variation pattern is symmetrical aroundtm = 0. This Pchllog variation pattern is similar tothe Pchl variation pattern aftertminvar (upper row ofFig. 2). Applying different values for Pchlminvar andconstant variation intm (right-hand side column ofFig. 2), the variation patterns of Pchl for different val-ues of TPchls (left-hand side column ofFig. 2) canbe simulated satisfactorily. It seems, therefore, that adecreasing logistic function with variation intm, cansimulate the variation in Pchl, caused by the varia-tion in light conditions during the pre-harvest period.So, although the actual behaviour of the Pchl equation(Eq. (5)) and the logistic function (Eq. (6)) over timediffer, the variation patterns are similar; variation inlight conditions during the pre-harvest period is rep-resented by variation intm.
By using the logistic function (Eq. (6)) for the Pchlequation (Eq. (5)) over time, a time transformation isintroduced. InEq. (5), t stands for the time from thestart of cucumber growth, but inEq. (6)it is replacedby tm, the maturity with regard to keeping quality. Nor-mally, maturity is used in terms of fitness for harvest
Fig. 3. Simulation of the Pchl function as function of maturity,indicated by tm (upper plot). Simulation of the (rescaled) Pchlprobability density function for one batch harvested at differentmaturity stages, indicated bytbm. Simulation was carried out usingPchlminvar = 1 andσ = 0.5 and class sizeqb − qa = 0.1, applyingEq. (13) (lower plot).
or in terms of fitness for human consumption duringthe pre- and post-harvest period, respectively. Neitherdescription of maturity is suitable with regard to thekeeping quality, and we propose thattm can be re-garded as an index of maturity towards keeping qual-ity. At tm = −∞ the maximal maturity and attm =

304 R.E. Schouten et al. / Postharvest Biology and Technology 32 (2004) 299–310
+∞ the minimal maturity is defined for an individualcucumber. Harvest attm = −∞ will result in a max-imal amount of Pchl, and therefore also the maximalkeeping quality for this cucumber. Attm = +∞ noPchl is left and harvest at this point will result in thecucumber losing colour quickly, in spite of the initialcolour (Pchl0 = 0 in Fig. 1).
The batch model aims to describe the stochasticbehaviour of Pchl0 concentrations of cucumbers interms of light variation during the pre-harvest period.Mathematically, this can be expressed in terms of theprobability (Pr) that Pchl0 values belong to a class (qa,qb], which includes class borderqb and excludes classborderqa. The probability that Pchl0 values are partof the class (qa, qb] is by definition equal toEq. (7):
Pr(Pchl0(t) ∈ (qa, qb]) = Pr(Pchl0(t) ≤ qb)
−Pr(Pchl0(t) ≤ qa) (7)
Furthermore, it is assumed that Pchl0(t) is approxi-mated well by Pchllog(tm):
Pr(Pchl0(t) ≤ q) ≈ Pr(Pchllog(tm) ≤ q) (8)
If we assume thattm is a random variable with acontinuous cumulative distribution functionψ we canrewrite the right-hand side ofEq. (8) into Eq. (9):
Pr(Pchllog(tm) ≤ q) = Pr(tm ≥ Pchl−1log(q))
= 1 − ψ(Pchl−1log(q)) (9)
with Pchl−1log being the inverse of Pchllog, because
Pchllog is a monotonously decreasing function oftm. The logistic function (Eq. (6)) can be inverted(Eq. (10)):
Pchl−1log(q) = ln(−(q− Pchlminvar)/q)
Pchlminvar(10)
Substitution ofEq. (10) into Eq. (9) and subsequentsubstitution inEq. (7)yieldsEq. (11):
Pr(Pchl0(t) ∈ (qa, qb]
≈ ψ
[ln(−(qa − Pchlminvar)/qa)
Pchlminvar
]
−ψ[
ln(−(qb − Pchlminvar)/qb)
Pchlminvar
](11)
The last step in the formulation of the batch modelis the choice for the cumulative distribution function
ψ(tm). If we assume, by convenience,tm to be nor-mally distributed, with meantbm (batch maturity) andstandard deviationσ (biological variation), thenψ(tm)can be expressed as:
ψ(tm) = Φ
[tm − tbm
σ
](12)
with Φ the cumulative standard normal distribution,which is closely connected to the erf (error) function(Φ(i) = 0.5+ 0.5× erf(i/SQRT(2))). BothΦ and erfare available in most statistical packages. Hence, thebatch model formulation can now be expressed in itsfinal formulation:
Pr(Pchl0(t) ∈ (qa, qb])
≈ Φ
[ln(−(qa − Pchlminvar)/qa)/Pchlminvar − tbm
σ
]
−Φ[
ln(−(qb − Pchlminvar)/qb)/Pchlminvar − tbm
σ
]
(13)
An indication of the batch behaviour for one batchvarying in maturity (having Pchlminvar = 1), is shownin the lower plot of Fig. 3. Variation in Pchl0 atharvest can now be described on a batch level interms of maturity (tbm), biological variation (σ) andPchlminvar.
3. Material and methods
3.1. Cucumber batches
For the development of the batch model six batchesof 80–100 cucumbers, each belonging to either culti-var ‘Volcan’, ‘Borja’ or ‘Beluga’, were used. Threebatches were harvested September 1998 (autumnseason) and three batches were harvested June 1999(spring season) in the Almeria region of Spain. TheseSpanish cucumbers were grown under equal, com-mercial growing conditions and were of marketablesize and colour (Schouten et al., 2002).
For the validation of the batch model cucumbersfrom 12 experimental cultivars (isogenic lines) wereused, cultivars a to l. For each cultivar 12 cucumberplants were grown at two randomly assigned plots in
R.E. Schouten et al. / Postharvest Biology and Technology 32 (2004) 299–310 305
a greenhouse in the west of The Netherlands. TheseDutch cucumbers were harvested from the stem or thevine part of the cucumber plants and were of mar-ketable size and colour. Stem and vine cucumbers wereharvested in June and July 2002, respectively. A to-tal of 48 batches were harvested with on average 24cucumbers per batch. Forty batches were used for thevalidation of the batch model. For eight batches theminimal amount of 20 cucumbers per batch was notreached.
Upon arrival at the measuring facility, all cucumberswere individually tagged on the lightest side and storedin the dark at 20◦C and 100% RH.
3.2. Cucumber colour measurements
Colour was measured on individual cucumberstwice a week using an image analysis system(Schouten et al., 1997). Colour was expressed as theratio of the blue/red (B/R) values from the separate in-tensities of the blue and red values of the RGB colourscale. Colour measurements for the cucumbers started1 day after arrival at the measuring facility and endedwhen yellowing was complete or when decay of thecucumber was imminent (Schouten et al., 2002).
3.3. Statistical analysis
Precursor concentrations at harvest (Pchl0) wereestimated for the Spanish and Dutch cucumbercolour data set applying the calibrated colour model(Schouten et al., 2002). Precursor concentrations ofall batches were analysed statistically to obtaintbmandσ per batch and Pchlminvar per cultivar applyingEq. (13)(seeTable 1for description of symbols). Thevalue for the class size (qb − qa), expressed as Pchlvalue, was chosen to avoid having more than 40% ofall precursor values in the most crowded class. Theclass size was chosen as 0.45 and 0.30 for the Spanishand Dutch cucumbers, respectively.
For the statistical analysis, the non-linear regres-sion routine of Genstat 5 (release 3.2, Lawes Agri-cultural Trust, Rothamsted Experimental Station, UK)was used. The equations and mathematical descrip-tion of the batch variation model were developed usingMaple V (release 4, Waterloo Maple Software, Water-loo, Canada).
4. Results and discussion
4.1. Spanish cucumber batches
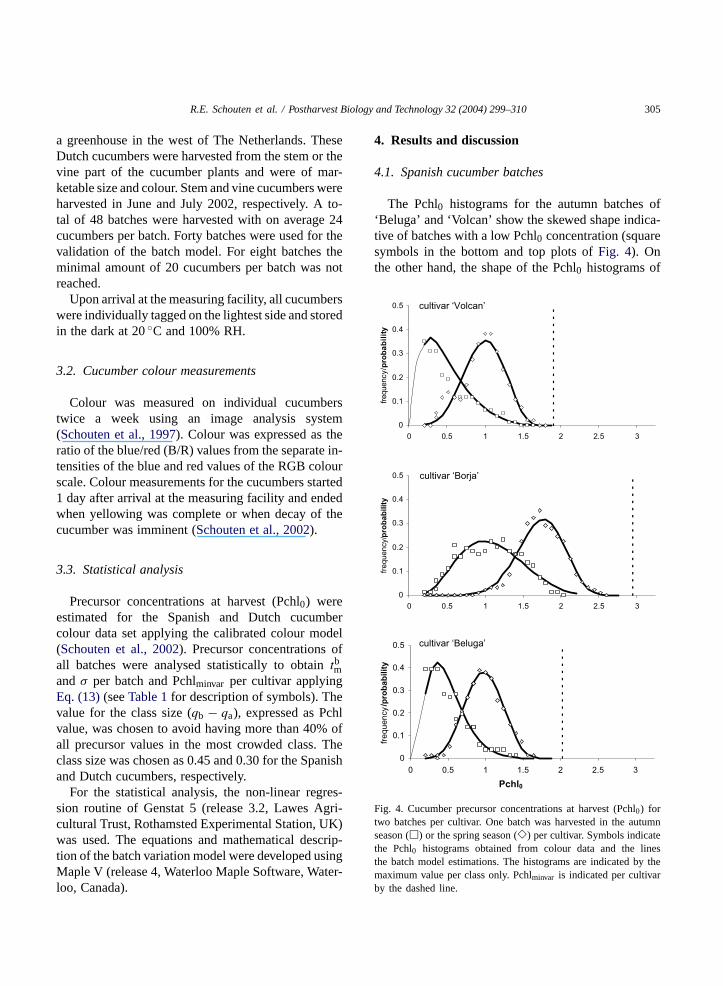
The Pchl0 histograms for the autumn batches of‘Beluga’ and ‘Volcan’ show the skewed shape indica-tive of batches with a low Pchl0 concentration (squaresymbols in the bottom and top plots ofFig. 4). Onthe other hand, the shape of the Pchl0 histograms of
0
0.1
0.2
0.3
0.4
0.5
0 0.5 1 1.5 2 2.5 3
fre
qu
en
cy/probability
0
0.1
0.2
0.3
0.4
0.5
0 0.5 1 1.5 2 2.5 3
fre
qu
en
cy/probability
cultivar ‘Borja’
cultivar ‘Beluga’
0
0.1
0.2
0.3
0.4
0.5
0 0.5 1 1.5 2 2.5 3
frequency/probability
cultivar ‘Volcan’
Pchl0
Fig. 4. Cucumber precursor concentrations at harvest (Pchl0) fortwo batches per cultivar. One batch was harvested in the autumnseason (�) or the spring season (�) per cultivar. Symbols indicatethe Pchl0 histograms obtained from colour data and the linesthe batch model estimations. The histograms are indicated by themaximum value per class only. Pchlminvar is indicated per cultivarby the dashed line.
306 R.E. Schouten et al. / Postharvest Biology and Technology 32 (2004) 299–310
Table 2Overview of parameter estimates and their standard error (S.E.) for the six cucumber batches for the analysis ofN observations (R2
adj (%) =92.3, N = 282)
Cultivar Season Batch keepingquality (days)
tbm σ Pchlminvar
Estimate S.E. Estimate S.E. Estimate S.E.
‘Volcan’ Autumn 3.8 0.666 0.025 0.519 0.059 1.906 0.137‘Volcan’ Spring 6.8 −0.131 0.105 0.336 0.061‘Borja’ Autumn 8.4 0.175 0.034 0.226 0.032 2.946 0.242‘Borja’ Spring 13.1 −0.170 0.092 0.157 0.036‘Beluga’ Autumn 4.3 0.638 0.015 0.364 0.015 2.025 0.106‘Beluga’ Spring 7.2 −0.022 0.067 0.267 0.011
the spring batches of ‘Volcan’, ‘Borja’ and ‘Beluga’is almost symmetrical (shown as diamond symbols inFig. 4).
Applying Eq. (13)during initial analysis resulted inthe estimation of the parameterstbm, σ and Pchlminvarper batch. Pchlminvar estimations were similar per cul-tivar, so that for the second analysistbm andσ were es-timated per batch and Pchlminvar per cultivar (Table 2).From these parameters the Pchl0 probability densityfunction per batch was calculated (shown as lines inFig. 4; lack of measurements is indicated by the thinpart of each line). It is remarkable that all autumnbatches have a positive and all spring batches have anegative value oftbm. This indicates that all cucum-bers belonging to the spring batches have a maturitycloser totm = −∞, the maximal maturity. In otherwords, the spring batches may be considered youngerthan the autumn batches. Furthermore, a three-fold dif-ference in the biological variation (σ) is encounteredbetween the spring batch of ‘Borja’ (0.157) and theautumn batch of ‘Volcan’ (0.519). This indicates thateven though batches were grown under equal condi-tions and all cucumbers were of marketable size, largebiological variation is present. The spring batch of‘Borja’ shares the highest value of Pchlminvar, a matu-rity closest to the maximal maturity (tm = −∞) andthe smallest biological variation, resulting in a batchkeeping quality of more than 13 days (Table 2).
Pchlminvar is largest for ’Borja’ followed by‘Beluga’ and finally ‘Volcan’. This apparent cultivar-dependent parameter may be defined as the cultivarkeeping quality, the keeping quality at maximal ma-turity for batches of the same cultivar. As a relationis present between the level of Pchlminvar and TPchls(left-hand side plots ofFig. 2), it seems that the initial
amount of TPchl at the start of the cucumber growthshows very little variation for cucumbers of the samecultivar. It might therefore be a determining factor forthe cultivar keeping quality.
4.2. Dutch cucumber batches
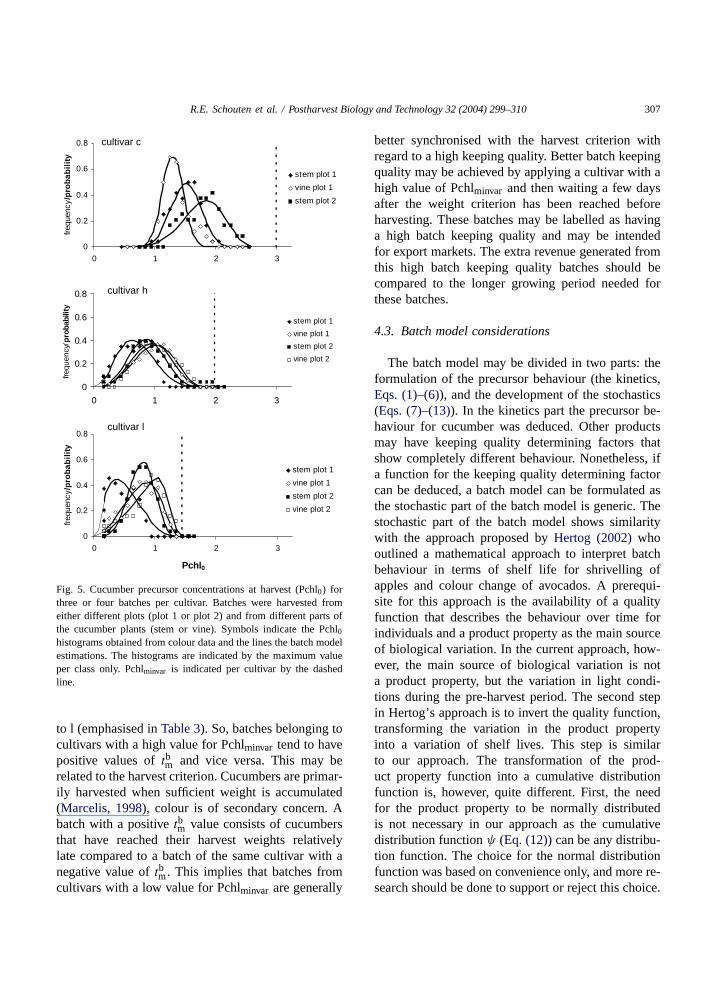
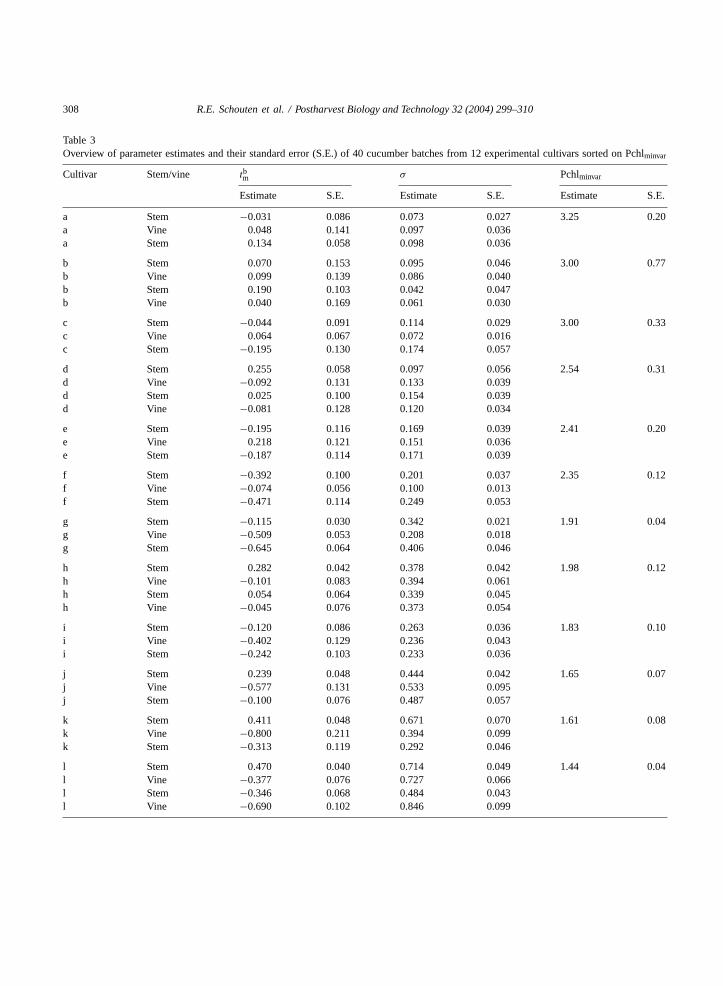
Pchl0 histograms for the batches belonging to threeexperimental cultivars are shown as symbols inFig. 5as an example. For cultivar l, the shape of the his-tograms varies between two limits, in which vicin-ity they are skewed. On the other hand, for cultivar chistograms are encountered which have an almost nor-mal shape. Applying the batch model resulted in esti-mations oftbm, σ per batch and Pchlminvar per cultivar(Table 3and lines inFig. 5; lack of measurements isindicated by the thin part of each line). All cultivarsin Table 3are listed with decreasing Pchlminvar value.Differences in Pchlminvar, the cultivar keeping quality,are considerable among the 12 experimental cultivars.Variation in σ, the biological variation, between thebatches is even larger, up to a factor 20 (Table 3). Theaverage value forσ of batches belonging to the samecultivar is correlated with Pchlminvar (R2
adj = 75% (notshown)), indicating that the amount of biological vari-ation might be cultivar dependent.
A common value of Pchlminvar was estimatedfor batches harvested from stem or vine parts ofthe same cucumber plants. This may indicate thatcultivar-induced effects on keeping quality remainunchanged for cucumbers, regardless of changingsink–source relations in the ageing cucumber plant.Of the batches belonging to experimental cultivars ato f, 10 batches positive negative values fortbm. Thisis encountered for only five batches of the cultivars g
R.E. Schouten et al. / Postharvest Biology and Technology 32 (2004) 299–310 307
0
0.2
0.4
0.6
0.8
0 1 2 3
Pchl0
frequ
ency
/pro
bab
ilit
y
stem plot 1
vine plot 1
stem plot 2
vine plot 2
0
0.2
0.4
0.6
0.8
0 1 2 3
frequ
ency
/pro
bab
ilit
y
stem plot 1
vine plot 1
stem plot 2
cultivar l
cultivar c
0
0.2
0.4
0.6
0.8
0 1 2 3
frequ
ency
/pro
babi
lity
stem plot 1
vine plot 1
stem plot 2
vine plot 2
cultivar h
Fig. 5. Cucumber precursor concentrations at harvest (Pchl0) forthree or four batches per cultivar. Batches were harvested fromeither different plots (plot 1 or plot 2) and from different parts ofthe cucumber plants (stem or vine). Symbols indicate the Pchl0
histograms obtained from colour data and the lines the batch modelestimations. The histograms are indicated by the maximum valueper class only. Pchlminvar is indicated per cultivar by the dashedline.
to l (emphasised inTable 3). So, batches belonging tocultivars with a high value for Pchlminvar tend to havepositive values oftbm and vice versa. This may berelated to the harvest criterion. Cucumbers are primar-ily harvested when sufficient weight is accumulated(Marcelis, 1998), colour is of secondary concern. Abatch with a positivetbm value consists of cucumbersthat have reached their harvest weights relativelylate compared to a batch of the same cultivar with anegative value oftbm. This implies that batches fromcultivars with a low value for Pchlminvar are generally
better synchronised with the harvest criterion withregard to a high keeping quality. Better batch keepingquality may be achieved by applying a cultivar with ahigh value of Pchlminvar and then waiting a few daysafter the weight criterion has been reached beforeharvesting. These batches may be labelled as havinga high batch keeping quality and may be intendedfor export markets. The extra revenue generated fromthis high batch keeping quality batches should becompared to the longer growing period needed forthese batches.
4.3. Batch model considerations
The batch model may be divided in two parts: theformulation of the precursor behaviour (the kinetics,Eqs. (1)–(6)), and the development of the stochastics(Eqs. (7)–(13)). In the kinetics part the precursor be-haviour for cucumber was deduced. Other productsmay have keeping quality determining factors thatshow completely different behaviour. Nonetheless, ifa function for the keeping quality determining factorcan be deduced, a batch model can be formulated asthe stochastic part of the batch model is generic. Thestochastic part of the batch model shows similaritywith the approach proposed byHertog (2002)whooutlined a mathematical approach to interpret batchbehaviour in terms of shelf life for shrivelling ofapples and colour change of avocados. A prerequi-site for this approach is the availability of a qualityfunction that describes the behaviour over time forindividuals and a product property as the main sourceof biological variation. In the current approach, how-ever, the main source of biological variation is nota product property, but the variation in light condi-tions during the pre-harvest period. The second stepin Hertog’s approach is to invert the quality function,transforming the variation in the product propertyinto a variation of shelf lives. This step is similarto our approach. The transformation of the prod-uct property function into a cumulative distributionfunction is, however, quite different. First, the needfor the product property to be normally distributedis not necessary in our approach as the cumulativedistribution functionψ (Eq. (12)) can be any distribu-tion function. The choice for the normal distributionfunction was based on convenience only, and more re-search should be done to support or reject this choice.
308 R.E. Schouten et al. / Postharvest Biology and Technology 32 (2004) 299–310
Table 3Overview of parameter estimates and their standard error (S.E.) of 40 cucumber batches from 12 experimental cultivars sorted on Pchlminvar
Cultivar Stem/vine tbm σ Pchlminvar
Estimate S.E. Estimate S.E. Estimate S.E.
a Stem −0.031 0.086 0.073 0.027 3.25 0.20a Vine 0.048 0.141 0.097 0.036a Stem 0.134 0.058 0.098 0.036
b Stem 0.070 0.153 0.095 0.046 3.00 0.77b Vine 0.099 0.139 0.086 0.040b Stem 0.190 0.103 0.042 0.047b Vine 0.040 0.169 0.061 0.030
c Stem −0.044 0.091 0.114 0.029 3.00 0.33c Vine 0.064 0.067 0.072 0.016c Stem −0.195 0.130 0.174 0.057
d Stem 0.255 0.058 0.097 0.056 2.54 0.31d Vine −0.092 0.131 0.133 0.039d Stem 0.025 0.100 0.154 0.039d Vine −0.081 0.128 0.120 0.034
e Stem −0.195 0.116 0.169 0.039 2.41 0.20e Vine 0.218 0.121 0.151 0.036e Stem −0.187 0.114 0.171 0.039
f Stem −0.392 0.100 0.201 0.037 2.35 0.12f Vine −0.074 0.056 0.100 0.013f Stem −0.471 0.114 0.249 0.053
g Stem −0.115 0.030 0.342 0.021 1.91 0.04g Vine −0.509 0.053 0.208 0.018g Stem −0.645 0.064 0.406 0.046
h Stem 0.282 0.042 0.378 0.042 1.98 0.12h Vine −0.101 0.083 0.394 0.061h Stem 0.054 0.064 0.339 0.045h Vine −0.045 0.076 0.373 0.054
i Stem −0.120 0.086 0.263 0.036 1.83 0.10i Vine −0.402 0.129 0.236 0.043i Stem −0.242 0.103 0.233 0.036
j Stem 0.239 0.048 0.444 0.042 1.65 0.07j Vine −0.577 0.131 0.533 0.095j Stem −0.100 0.076 0.487 0.057
k Stem 0.411 0.048 0.671 0.070 1.61 0.08k Vine −0.800 0.211 0.394 0.099k Stem −0.313 0.119 0.292 0.046
l Stem 0.470 0.040 0.714 0.049 1.44 0.04l Vine −0.377 0.076 0.727 0.066l Stem −0.346 0.068 0.484 0.043l Vine −0.690 0.102 0.846 0.099
R.E. Schouten et al. / Postharvest Biology and Technology 32 (2004) 299–310 309
Secondly, the cumulative normal distribution func-tion used in both approaches has indeed no analyticalsolution, but statistical packages like Genstat haveno problem analysing data with the error function(Eq. (13)). The use of the ‘logistic binomial’ func-tion by Hertog is therefore unnecessary. Also, whena comparison is made between the cumulative nor-mal distribution and the logistical binomial function,such as shown byHertog (2002), the most deviat-ing part is at low (and high) distribution values. Anumber of products have a batch acceptance limit at5%, like cucumber (colour), strawberries (spoilage),apples and pears (weight loss). Therefore, by us-ing the ‘logistic binomial’ a methodological error isintroduced.
Traditionally, biological variation is treated like anever-present nuisance which should be minimised asmuch as possible. The most commonly used techniqueto deal with biological variation is sorting and gradingon external quality attributes (Tijskens et al., 2003).Colour sorting based on averages is, however, not suf-ficient for cucumber with regard to keeping quality(Schouten et al., 2002). Incorporating biological vari-ation on the level oftm for the precursor behaviourseems to be a step towards understanding biologi-cal variation and linking post-harvest methodology topre-harvest information.
Variation in the precursor at harvest for cucumberbatches from the same cultivar is assumed to be causedby variation in light conditions during the pre-harvestperiod. While variation in light conditions is proba-bly an important source of biological variation, it issurely not the only source. A number of pre-harvestfactors, including water stress, pest management andinsufficient availability of micronutrients may have aninfluence on the variation in precursor concentrationencountered at harvest. The correct description and in-clusion of multiple sources of biological variation isone of the challenges for future work on batch modelformulations.
An application of the batch model might be thedetermination of cultivar keeping quality as a testtool for the development of new cultivars by cu-cumber breeding companies. However, suitabilityfor long-term storage and optimal harvest date, forexample, batches of apples and pears might also beassessed, provided a function for the (keeping) qualitydetermining factor is available.
5. Conclusions
A batch model is presented to assess the variation inkeeping quality precursor concentrations in terms ofmaturity and biological variation for cucumber batchesof the same cultivar. The model describes the influenceof one source of biological variation, here assumed tobe variation in light conditions during the pre-harvestperiod, on the variation of precursor concentrations atharvest. Estimations on cucumber batches grown indifferent seasons and cultivars revealed that next tolight variation, cultivar is also a source of biologicalvariation.
The batch model consists of a kinetic part, describ-ing the behaviour of the precursor for individuals, anda stochastic part, describing the precursor variation.The stochastic part is generic, but the kinetic part de-pends on processes determining the keeping quality.This means that the application of the batch model islimited only to the availability of fundamental, kinetic,models that describe individual quality determiningbehaviour.
References
Hertog, M.L.A.T.M., Tijskens, L.M.M., Pak, P.S., 1997. The effectsof temperature and senescence on the accumulation of reducingsugars during storage of potato (Solanum tuberosum L.) tubers:a mathematical model. Postharvest Biol. Technol. 10, 67–79.
Hertog, M.L.A.T.M., 2002. The impact of biological variation onpostharvest population dynamics. Postharvest Biol. Technol.26, 253–263.
Lebedev, N., Timko, M.P., 1998. Protochlorophyllide photo-reduction. Photosynth. Res. 58, 5–23.
Marcelis, L.F.M., 1998. Evaluation under commercial conditionsof a model of prediction of the yield and quality of cucumberfruits. Sci. Hortic. 76, 171–181.
Porra, R.J., 1997. Recent progress in porphyrin andchlorophyll biosynthesis. Photochem. Photobiol. 65, 492–516.
Schouten, R.E., Otma, E.C., Van Kooten, O., Tijskens, L.M.M.,1997. Keeping quality of cucumber fruits predicted bythe biological age. Postharvest Biol. Technol. 12, 175–181.
Schouten, R.E., Van Kooten, O., 1998. Keeping quality ofcucumber batches: Is it predictable? Acta Hortic. 476, 349–355.
Schouten, R.E., Tijskens, L.M.M., Van Kooten, O., 2002.Predicting keeping quality of batches of cucumber fruit based

310 R.E. Schouten et al. / Postharvest Biology and Technology 32 (2004) 299–310
on a physiological mechanism. Postharvest Biol. Technol. 26,209–220.
Tijskens, L.M.M., Konopacki, P., 2003. Biological variance inagricultural products. Theoretical considerations. Acta Hortic.600, 661–670.
Tijskens, L.M.M., Konopacki, P., Simcic, M., 2003. Biologicalvariance, burden or benefit. Postharvest Biol. Technol. 27, 15–25.
Tijskens, L.M.M., 2003. Quality modelling. Acta Hortic. 604, 123–136.