Linking NE1545 gene expression with cell volume changes in Nitrosomonas europaea cells exposed to...
15
Linking NE1545 gene expression with cell volume changes in Nitrosomonas europaea cells exposed to aromatic hydrocarbons Tyler S. Radniecki ⇑ , Caslin A. Gilroy, Lewis Semprini 102 Gleeson Hall, School of Chemical, Biological and Environmental Engineering, Oregon State University, Corvallis, OR 97331, USA article info Article history: Received 14 June 2010 Received in revised form 25 October 2010 Accepted 26 October 2010 Available online 23 November 2010 Keywords: Nitrosomonas europaea Cell volume change Coulter counter Aromatic hydrocarbons NE1545 Gene expression abstract Nitrosomonas europaea, a model ammonia oxidizing bacterium, was exposed to a wide variety of aromatic hydrocarbons in 3 h batch assays. The expression of NE1545, a phenol sentinel gene involved in fatty acid metabolism, was monitored via quantitative real-time polymerase chain reaction (qRT-PCR) and a Coul- ter Counter technique was used to monitor changes in cell volume. Decreases in cell volume and NE1545 gene expression correlated strongly with exposure to aromatic hydrocarbons that possessed a single polar group substitution (e.g. phenol and aniline). Aromatic hydrocarbons that contain no polar group substitutions (e.g. toluene) or multiple polar group substitutions (e.g. p-hydroquinone) caused negligible changes in NE1545 expression and cell volume. The oxidation of aromatic hydrocarbons by N. europaea from configurations without a single polar group to one with two polar groups (e.g. p-cresol oxidized to 4- hydroxybenzyl alcohol) and from configurations with no polar groups to one with a single polar group (e.g. ethylbenzene oxidized to 4-ethylphenol) greatly influenced NE1545 gene expression and observed changes in cell volume. Nitrification inhibition in N. europaea by the aromatic hydrocarbons was found to be completely reversible; however, the decreases in cell volume were not reversible suggesting a phys- ical change in cell membrane composition. Ammonia monooxygenase blocking studies showed that the chemical exposure that was responsible for the cell volume decrease and up-regulation in gene expres- sion and not the observed inhibition. N. europaea is the first bacterium shown to experience significant changes in cell volume when exposed to lM concentrations of aromatic hydrocarbons, three orders of magnitude lower than previous studies with other bacteria. Ó 2010 Elsevier Ltd. All rights reserved. 1. Introduction Ammonia oxidizing bacteria (AOB) are responsible for the cru- cial first step in the removal of ammonia from wastewater treat- ments plants (WWTPs) through the oxidation of ammonia to nitrite. However, AOB are widely considered to be the most sensi- tive fauna in wastewater treatment plants (US EPA, 1993) and are inhibited by a wide range of wastewater components including aromatic hydrocarbons (Keener and Arp, 1994; Chang et al., 2002; Juliastuti et al., 2003; Zepeda et al., 2006). Part of the ex- treme sensitivity of AOB to aromatic hydrocarbons is due to their ammonia monooxygenase (AMO) which has been shown to oxidize a wide range of substrates including aromatic hydrocarbons (Keener and Arp, 1994; Chang et al., 2002). However, AOB are inca- pable of deriving energy from the oxidation of aromatic hydrocar- bons and this leads to dramatic reductions in nitrifying activity resulting in biological nitrogen removal failure in WWTPs. Thus, having the ability to detect the presence and bioavailability of aro- matic hydrocarbons in WWTPs through the detection of changes in AOB gene expression or physiology may be of use in monitoring the treatment process. In our earlier work, whole genome microarray studies with pure cultures of Nitrosomonas europaea, a model AOB, revealed an up- regulation of a gene cluster involved with fatty acid metabolism, NE1545-NE1551, upon exposure to phenol but saw no changes in gene expression when inhibitory concentrations of toluene were present (Radniecki et al., 2008). This study expands upon that pre- vious work by measuring the expression of NE1545 in N. europaea cells exposed to a variety of single ring aromatic hydrocarbons that have similar substitutions to both phenol and toluene and will help elucidate what chemical properties of the aromatic hydrocarbons are necessary to trigger NE1545 expression. The aromatic hydro- carbons examined include phenol, toluene, aniline, m-, o- and p-cresol, p-hydroquinone and ethylbenzene. Additionally, in our earlier work, transmission electron micros- copy (TEM) images revealed an increase in membrane structure and a 31% decrease in membrane thickness in N. europaea cells exposed to benzene that was oxidized to phenol but no changes in the membrane were observed in N. europaea cells exposed to toluene (Radniecki et al., 2008). Phenol exposure was shown to 0045-6535/$ - see front matter Ó 2010 Elsevier Ltd. All rights reserved. doi:10.1016/j.chemosphere.2010.10.083 ⇑ Corresponding author. Tel.: +1 541 737 6895; fax: +1 541 737 3052. E-mail addresses: [email protected] (T.S. Radniecki), caslinanne@ gmail.com (C.A. Gilroy), [email protected] (L. Semprini). Chemosphere 82 (2011) 514–520 Contents lists available at ScienceDirect Chemosphere journal homepage: www.elsevier.com/locate/chemosphere
-
Upload
oregonstate -
Category
Documents
-
view
0 -
download
0
Transcript of Linking NE1545 gene expression with cell volume changes in Nitrosomonas europaea cells exposed to...

Chemosphere 82 (2011) 514–520
Contents lists available at ScienceDirect
Chemosphere
journal homepage: www.elsevier .com/locate /chemosphere
Linking NE1545 gene expression with cell volume changes in Nitrosomonaseuropaea cells exposed to aromatic hydrocarbons
Tyler S. Radniecki ⇑, Caslin A. Gilroy, Lewis Semprini102 Gleeson Hall, School of Chemical, Biological and Environmental Engineering, Oregon State University, Corvallis, OR 97331, USA
a r t i c l e i n f o a b s t r a c t
Article history:Received 14 June 2010Received in revised form 25 October 2010Accepted 26 October 2010Available online 23 November 2010
Keywords:Nitrosomonas europaeaCell volume changeCoulter counterAromatic hydrocarbonsNE1545Gene expression
0045-6535/$ - see front matter � 2010 Elsevier Ltd. Adoi:10.1016/j.chemosphere.2010.10.083
⇑ Corresponding author. Tel.: +1 541 737 6895; faxE-mail addresses: [email protected]
gmail.com (C.A. Gilroy), [email protected]
Nitrosomonas europaea, a model ammonia oxidizing bacterium, was exposed to a wide variety of aromatichydrocarbons in 3 h batch assays. The expression of NE1545, a phenol sentinel gene involved in fatty acidmetabolism, was monitored via quantitative real-time polymerase chain reaction (qRT-PCR) and a Coul-ter Counter technique was used to monitor changes in cell volume. Decreases in cell volume and NE1545gene expression correlated strongly with exposure to aromatic hydrocarbons that possessed a singlepolar group substitution (e.g. phenol and aniline). Aromatic hydrocarbons that contain no polar groupsubstitutions (e.g. toluene) or multiple polar group substitutions (e.g. p-hydroquinone) caused negligiblechanges in NE1545 expression and cell volume. The oxidation of aromatic hydrocarbons by N. europaeafrom configurations without a single polar group to one with two polar groups (e.g. p-cresol oxidized to 4-hydroxybenzyl alcohol) and from configurations with no polar groups to one with a single polar group(e.g. ethylbenzene oxidized to 4-ethylphenol) greatly influenced NE1545 gene expression and observedchanges in cell volume. Nitrification inhibition in N. europaea by the aromatic hydrocarbons was foundto be completely reversible; however, the decreases in cell volume were not reversible suggesting a phys-ical change in cell membrane composition. Ammonia monooxygenase blocking studies showed that thechemical exposure that was responsible for the cell volume decrease and up-regulation in gene expres-sion and not the observed inhibition. N. europaea is the first bacterium shown to experience significantchanges in cell volume when exposed to lM concentrations of aromatic hydrocarbons, three orders ofmagnitude lower than previous studies with other bacteria.
� 2010 Elsevier Ltd. All rights reserved.
1. Introduction
Ammonia oxidizing bacteria (AOB) are responsible for the cru-cial first step in the removal of ammonia from wastewater treat-ments plants (WWTPs) through the oxidation of ammonia tonitrite. However, AOB are widely considered to be the most sensi-tive fauna in wastewater treatment plants (US EPA, 1993) and areinhibited by a wide range of wastewater components includingaromatic hydrocarbons (Keener and Arp, 1994; Chang et al.,2002; Juliastuti et al., 2003; Zepeda et al., 2006). Part of the ex-treme sensitivity of AOB to aromatic hydrocarbons is due to theirammonia monooxygenase (AMO) which has been shown to oxidizea wide range of substrates including aromatic hydrocarbons(Keener and Arp, 1994; Chang et al., 2002). However, AOB are inca-pable of deriving energy from the oxidation of aromatic hydrocar-bons and this leads to dramatic reductions in nitrifying activityresulting in biological nitrogen removal failure in WWTPs. Thus,having the ability to detect the presence and bioavailability of aro-
ll rights reserved.
: +1 541 737 3052.(T.S. Radniecki), caslinanne@du (L. Semprini).
matic hydrocarbons in WWTPs through the detection of changes inAOB gene expression or physiology may be of use in monitoringthe treatment process.
In our earlier work, whole genome microarray studies with purecultures of Nitrosomonas europaea, a model AOB, revealed an up-regulation of a gene cluster involved with fatty acid metabolism,NE1545-NE1551, upon exposure to phenol but saw no changes ingene expression when inhibitory concentrations of toluene werepresent (Radniecki et al., 2008). This study expands upon that pre-vious work by measuring the expression of NE1545 in N. europaeacells exposed to a variety of single ring aromatic hydrocarbons thathave similar substitutions to both phenol and toluene and will helpelucidate what chemical properties of the aromatic hydrocarbonsare necessary to trigger NE1545 expression. The aromatic hydro-carbons examined include phenol, toluene, aniline, m-, o- andp-cresol, p-hydroquinone and ethylbenzene.
Additionally, in our earlier work, transmission electron micros-copy (TEM) images revealed an increase in membrane structureand a 31% decrease in membrane thickness in N. europaea cellsexposed to benzene that was oxidized to phenol but no changesin the membrane were observed in N. europaea cells exposed totoluene (Radniecki et al., 2008). Phenol exposure was shown to

T.S. Radniecki et al. / Chemosphere 82 (2011) 514–520 515
be responsible for these changes. Similar studies with other bacte-ria have shown changes in membrane composition (Sikkema et al.,1995; Isken and de Bont, 1998; Tsitko et al., 1999; Segura et al.,2004) and decreases in cell size (Fakhruddin and Quilty, 2006;Gaur and Khare, 2009) when exposed to various aromatic hydro-carbons, but require aromatic hydrocarbon concentrations 3–6 or-ders of magnitude higher than those evaluated here. In this study,changes in cell volumes, measured using a Coulter Counter tech-nique, were compared with the expression of NE1545. Experi-ments were carried out to determine if the observed decreases incell volumes were reversible and associated with the observed de-creases in nitrification activity. Additionally, systematic experi-ments were conducted to determine what chemical properties ofthe aromatic hydrocarbons were necessary to trigger the decreasesin cell volumes and up-regulation in NE1545 expression.
2. Materials and methods
2.1. N. europaea culturing protocol
N. europaea ATCC 19718 cells (kindly supplied by Dr. LuisSayavedra-Soto, Oregon State University) were cultured in a mini-mal growth media (pH 7.8) consisting of 25 mM (NH4)2SO4, 43 mMKH2PO4, 3.92 mM NaH2PO4, 3.77 mM Na2CO3, 750 lM MgSO4,270 lM CaCl2, 18 lM FeSO4, 17 lM EDTA Free Acid and 1 lMCuSO4. Cells were inoculated into fresh media at a 1:100 dilutionand were shaken in the dark at 100 rpm and 30 �C. 1 mL of cellswas periodically plated onto Luria broth agar plates to check forheterotrophic contamination. After 3 d, cells were in mid-exponen-tial growth (OD600 � 0.070) and harvested via centrifugation. Cellswere centrifuged at 9000 rpm (5625 g) for 30 min, decanted andsuspended in 250 mL of fresh 40 mM KH2PO4 buffer pH 7.8. Cellswere centrifuged again at 9000 rpm (5625 g) for 20 min, decantedand suspended in 30 mL of 40 mM KH2PO4 pH 7.8.
2.2. Aromatic hydrocarbon inhibition studies
N. europaea cells, to a final concentration of 5 mg protein L�1 (asdetermined using the biuret method), were placed into a 155 mLbatch reactor with 50 mL of fresh growth medium, containing only2.5 mM (NH4)2SO4, and an aromatic hydrocarbon. Batch reactorswithout the addition of an aromatic hydrocarbon were run as thecontrols. Batch reactors were shaken at 250 rpm, in the dark, at25 �C. All batch reactor conditions were run in triplicate. Nitriteproduction, via colorimetric assay (Hageman and Hucklesby,1971), was monitored at 30 min intervals over the course of 3 h.Nitrification activity was defined as the linear average of lmol ofnitrite produced per mg of protein per min. Excess NH3 and O2
were present in the batch reactors and neither NH3 nor O2 wasdetermined to be rate limiting during the experiments. The linearproduction of NO�2 in the control bottles (Supplementary material(SM) Figs. SM1–SM4) further exemplifies this conclusion.
2.3. Coulter Counter cell volume measurements
Exposure to aromatic hydrocarbons has been reported to causechanges in bacterial cell size as measured by either scanning elec-tron microscopy (Fakhruddin and Quilty, 2006; Sharma et al.,2007) or TEM (Gaur and Khare, 2009) or through the use of a Coul-ter Counter measurement (Neumann et al., 2005). Due to its min-imal cell preparation requirements, and thus its suitability for largedata set screening, we chose to use the Coulter Counter measure-ment technique to measure changes in cell volume for this work.N. europaea cell diameters, from the triplicate batch reactors, weremeasured using a Coulter Counter (Multisizer III; Beckman Coulter,
Brea, CA). At the end of the 3 h inhibition test, 40 lL of N. europaeacells were diluted into 20 mL of Isotone II electrolyte solution(Beckman Coulter, Brea, CA). The cell diameters were immediatelymeasured using a 20 lm aperture tube (size range 0.55–10 lm).Based on previous TEM imaging (Radniecki et al., 2008), N. europaeacells were assumed to be spherical in shape and the followingequation was used to determine cell volume; V (lm3) =4/3p(d/2)3, where d is the cell diameter and V is the cell volume.Changes in cell volumes were determined by comparing the modecell volume of the control versus the aromatic hydrocarbon treatedcells.
2.4. Analytic measurements of aromatic hydrocarbons
Ethylbenzene and toluene were measured in the headspace gassamples from the batch reactors. Chromatographic separation wasachieved with 30-m megabore HP-624 column (Agilent, New Cas-tle, DE) installed on a HP6890 series (Hewlett Packard, Palo Alto,CA) gas chromatograph (GC) with a photo ionization detector fol-lowed by a flame ionization detector (FID). The gas flows wereoperated in splitless mode with helium (5.2 mL min�1) as a carriergas, hydrogen flow (35 mL min�1) and air flow (165 mL min�1) asthe FID flame ionization gases. The GC oven temperature was170 �C.
Aniline, m-, o- and p-cresol, p-hydroquinone and phenol weremeasured with a Dionex-500 HPLC chromatograph (Dionex, Sun-nyvale, CA) equipped with a UV/Vis detector operated at 257 nmand an Alltech Platinum C18 column (Alltech Associates, Deerfield,IL). The eluent, composed of 25 mM KH2PO4 with 10% acetonitrileat pH 2.5, was metered through the column at 2 mL min�1.
2.5. Inhibition and cell volume change reversibility experiments
Triplicate batch reactors were prepared as described in Section2.2 with N. europaea cells being exposed to either 200 lM aniline,or 120 lM p-cresol, or 100 lM ethylbenzene, or 22 lM phenol.Batch reactors without aromatic hydrocarbon additions served ascontrols. After NO�2 production was monitored for 3 h and cell vol-umes were measured as described in Section 2.3, cells were har-vested, for the reversibility tests. The cells were washed 5 timeswith 40 mM KH2PO4 buffer pH 7.8 and placed into fresh mediacontaining 2.5 mM (NH4)2SO4. NO�2 production was monitoredfor an additional 3 h and cell volumes were measured at the endof the additional 3 h to determine if inhibition and cell volumechanges were reversible. Cell concentrations, calculated via proteinmass, were calculated for the washed cells and used to normalizethe NO�2 production rates for the washed cells. Typical cell loss of10–15% was observed.
2.6. NE1545. gene expression measurements
Quantitative reverse-transcriptase polymerase chain reaction(qRT-PCR) analysis was conducted to measure the expression ofthe gene NE1545 in N. europaea cells exposed to the aromatichydrocarbons at concentrations high enough to cause either 50%or 90% decrease in nitrification activity (EC50 and EC90, respec-tively). There was an exception with p-cresol in which NE1545gene expression was measured at EC40 (causing 40% decrease innitrification activity) and EC90 concentrations. NE1545 geneexpression was also measured in N. europaea cells not exposed toaromatic hydrocarbons and served as the control gene expression.
After the 3 h batch tests, Total RNA from 40 mL of N. europaeacells were stabilized in Trizol (Invitrogen, Carlsbad, CA) and ex-tracted using the Qiagen RNeasy Mini Kit (Qiagen, Valencia, CA)per manufacturer’s instructions. Total RNA concentrations andquality were determined spectrophotometrically using the

516 T.S. Radniecki et al. / Chemosphere 82 (2011) 514–520
Nanodrop ND-1000 (Thermo Fisher Scientific, Waltham, MA) permanufacturer’s instructions. cDNA was generated from 1 lg of to-tal RNA using the iScript cDNA Synthesis kit (Bio-Rad, Hercules,CA) per manufacturer’s instructions and diluted 100-fold in TE buf-fer pH 8.
Gene Runner v. 3.00 (Hastings Software, Hastings on Hudson,NY) was used to generate qRT-PCR primers from 16S and NE1545DNA sequences. The qRT-PCR primers are as follows; 16S For: 50-GGCTTCACACGTAATACAATGG-30, 16S Rev: 50-CCTCACCCCAGTCAT-GACC-30, NE1545 For: 50-GGATGATCTGACGCAAGTGA-30 andNE1545 Rev: 50-CTGCGACAAAGTCGAAAGTG-30. The qRT-PCR prim-ers were optimized for annealing temperature (55 �C) and primerconcentrations (125 nM for 16S and 250 nM for NE1545) via PCRto achieve high efficiency with only one product detected. qRT-PCR was carried out in triplicate on an ABI Prism 7000 SequenceDetection System (Applied Biosystems, Foster City, CA) using theiQ SYBR Green Supermix kit (Bio-Rad) as described previously(Radniecki et al., 2008). The relative expression values for the reac-tions were determined using Data Analysis for Real Time-PCR anal-ysis (Peirson et al., 2003) taking into account the efficiency of thereaction and normalizing the data to the amount of 16S RNA quan-tified in each reaction.
2.7. Ammonia monooxygenase blocking experiments
Studies were conducted to evaluate the responses to aromatichydrocarbon exposure in N. europaea cells that had their AMO activ-ity (and thus their ability to oxidize the aromatic hydrocarbons)blocked. Triplicate batch reactors were prepared as described inSection 2.2 with N. europaea cells being exposed to either 200 lManiline, or 40 lM p-cresol, or 100 lM p-cresol, or 22.5 lM phenol,or 120 lM ethylbenzene. Batch reactors without aromatic hydro-carbon additions served as controls. Additionally, allylthiourea(ATU) was added to all batch reactors (100 lM) to inhibit the activ-ity of the AMO enzyme. After a 3 h incubation, cell volumes weremeasured as described in Section 2.3.
Fig. 1. Summary of aromatic hydrocarbon oxidations by N. europaea and changes incell volume and NE1545 gene expression. Exposure to aromatic hydrocarbonsshown in bold resulted in a decrease in N. europaea cell volume and increase inNE1545 gene expression while those that are non-bold did not. Size and color ofarrows classifies the transformation rates of the aromatic hydrocarbons (asreported in this study and previously (Keener and Arp, 1994; Radniecki et al.,2008)) with large white arrows indicating >75% transformation, medium greyarrows indicating 50–60% transformation and small black arrows indicating <17%transformation after 3 h of exposure.
3. Results and discussion
The nitrification activity of N. europaea cells was inhibited byeach aromatic hydrocarbon tested in a linear time-dependent fash-ion with the exception of p-cresol which resulted in a concave inhi-bition curve (Figs. SM-1–SM-4). The concave shape of the p-cresolinhibition curve is believed to be due to the oxidation of p-cresol to4-hydroxybenzyl alcohol and 4-hydroxybenzaldehyde (Fig. 1). Pre-vious research has demonstrated that benzyl alcohol and benzal-dehyde are also non-inhibitory to N. europaea (Radniecki et al.,2008). The degree of sensitivity to each inhibitor varied widelywith the EC50 varying from 5 to 174 lM (Table 1). The order of sen-sitivity, as defined by nitrification inhibition, for the aromatichydrocarbons is as follows (with EC50 in parenthesis); o-cresol(5 lM) > m-cresol (8 lM) > phenol (9 lM) > toluene (37 lM) > ani-line (54 lM) > p-cresol (68 lM) > ethylbenzene (74 lM) > p-hydroquinone (174 lM) (Fig. 2).
The toxicity of aromatic hydrocarbons has often been creditedto its partitioning into the bacterial outer membrane and thusthe expected toxicity of any given aromatic hydrocarbon is ex-pected to be positively correlated with its octanol–water partition(Log KOW) (Salter and Kell, 1995; Sikkema et al., 1995; Isken and deBont, 1998; Fujita et al., 2006). However, in the case of N. europaea,there does not appear to be a strong correlation between Log KOW
and EC50 (r = �0.40, p = 0.33, Table 1, Fig. SM-5) suggesting thatother factors besides membrane disruption are involved, such asthe reported inhibition of AMO via direct competition for the activesite, decrease in reductant supply for AMO or the interaction of the
aromatic hydrocarbons with other cellular constituents (Keenerand Arp, 1994; Radniecki et al., 2008).
N. europaea cells exposed to aromatic hydrocarbons decreasedin cell volume at concentrations three orders of magnitude lowerthan those previously reported to cause cell size changes (Neu-mann et al., 2005; Fakhruddin and Quilty, 2006; Sharma et al.,2007; Gaur and Khare, 2009) (Fig. 2). However, the amount of de-crease in cell volume was highly variable (0–16%) and was not con-sistent with concentration (e.g. toluene and p-hydroquinone). Thedecreases in cell volume appear to be dependent on the physicalparameters of the aromatic hydrocarbons and their chemical struc-ture. The presence of a single polar group (OH or NH2) promoteddecreases in cell volume. In general, aromatic hydrocarbons witha single polar group (e.g., phenol, aniline and p-cresol) caused a15–16% decrease in cell volume while aromatic hydrocarbonswith either multiple (e.g., p-hydroquinone) or no polar groups

Table 1Chemical properties of the aromatic hydrocarbons used in this test and the physiological and transcriptional responses of N. europaea to their presence. aThe concentration usedfor p-cresol here was the EC40. This was to allow the comparison of the NE1545 gene expression at 0% and -15% decreases in cell volume.
Percent NE1545 Percent NE1545Log EC50 Cell Volume Fold-Change EC90 Cell Volume Fold-change
Compound Kow lM Change at EC50 at EC90 lM Change at EC90 at EC90
Aniline 0.90 54 �13 9.0 ± 2.0 185 �15 18.6 ± 3.9Phenol 1 50 9 �11 5.7 ± 0.5 21 �16 14.9 ± 1.0p-Cresol 1.98 68 0a 0 9 ± 0.4 116 �15 17.2 ± 07m-Cresol 1.98 S �5 09 ± 0.7 16 �8 2.1 ± 0.5o-Cresol 1 98 5 �2 0.9 ± 0 6 11 �6 2.4 ± 0.6Ethylbenzene 3.15 74 �8 1.8 ± 0.8 117 �11 6.8 ± 3 1Toluene 2.70 37 �5 1.5 ± 0.2 63 0 1 9 ± 06p-Hydroquinone 0.60 174 �5 2.7 ± 04 218 �2 4 6 ± 1.0
Fig. 2. Percent nitrification activity (j) and decrease in cell volume (4) of N. europaea cells exposed to various aromatic hydrocarbons. Error bars represent 95% confidenceintervals (may be hidden behind the data point symbols).
T.S. Radniecki et al. / Chemosphere 82 (2011) 514–520 517

518 T.S. Radniecki et al. / Chemosphere 82 (2011) 514–520
(e.g., toluene) caused only a 5% decrease in cell volume (Table 1,Fig. 1). Interestingly, there appears to be a maximum cell volumechange of roughly 15% as indicated by the plateau in decreases incell volume observed for aniline and p-cresol and what may bethe beginning of a plateau for phenol (Fig. 2a,c and d). Further re-search is needed to determine if this plateau in cell volume de-creases in related to a biological maximum in cell volumechanges or if it is related to the physical/chemical properties ofthe aromatic hydrocarbons tested.
It should be noted that no changes in cell volume were observedwith p-cresol at sub-EC50 concentrations (<60 lM) (Fig. 2d). Thiswas due to the rapid oxidation of p-cresol (Fig. 3) to 4-hydroxyben-zyl alcohol and to a lesser extent 4-hydroxybenzaldehyde (Keenerand Arp, 1994). Both oxidation products are hydrophilic on bothsides of the aromatic ring (Fig. 1) which does not appear to pro-mote cell volume decreases. Only at higher p-cresol concentra-tions, when there was residual p-cresol remaining in reactorsafter the 3 h experiment (Fig. 3), were decreases in cell volume ob-served (Fig. 2d). This was further confirmed when N. europaea’sAMO activity was blocked using ATU. Upon blocking AMO activityand exposing cells to 40 lM of p-cresol a decrease in cell volume(�9%) was observed that increased to �15% at 100 lM of p-cresol(Fig. 4).
There appears to be noticeable exceptions to this trend with m-cresol, o-cresol and ethylbenzene. m- and o-cresol, each with asingle OH group and no other polar groups, caused only 8% and6% decreases in cell volume, respectively, while ethylbenzene, anaromatic hydrocarbon with no polar groups, caused an 11% de-crease in cell volume. In the case of m- and o-cresol, there is a slighttrend in decreasing cell volume with increasing m- and o-cresolconcentrations. However, the sensitivity of nitrification to m- and
Fig. 3. The disappearance of 40 lM (j), 80 lM (s) and 120 lM (N) p-cresol fromN. europaea batch reactors. Error bars represent 95% confidence intervals (may behidden behind the data point symbols).
Fig. 4. Percent cell volume decreases of N. europaea cells exposed to variousaromatic hydrocarbons and ATU to block AMO activity. Error bars represent 95%confidence intervals (may be hidden behind the data point symbols).
o-cresol was extremely high (EC50 of 5 and 8 lM, respectively)and prevented the testing of higher concentrations more similarto the less inhibitory p-cresol (EC50 of 68 lM).
In the case of ethylbenzene, the observed decrease in cell vol-ume resulted from the oxidation of ethylbenzene by AMO to 4-eth-ylphenol, which contains a single OH group (Keener and Arp,1994). This is further supported by the lack of change in cell vol-ume (�1%) in ethylbenzene exposed N. europaea cells with AMOactivity blocked by ATU (Fig. 4). This pathway is consistent withour previous observation that it was the phenol produced fromthe oxidation of benzene that was responsible for the decreasesin nitrification activity and changes in membrane structure (Rad-niecki et al., 2008). The similarity of the two pathways is shownin Fig. 1.
This observed correlation of cell volume change with exposureto aromatic hydrocarbons possessing a single polar group and ahydrophobic and hydrophilic ends may be related to how easilythe aromatic hydrocarbons pass through the cell membrane. Paststudies have shown that aromatic hydrocarbons with a single polargroup, such as phenol, tend to accumulate in cell membranes andthat accumulation can increase membrane fluidity (Heipieperet al., 1991; Sikkema et al., 1994). Bacteria can respond by decreas-ing its membrane fluidity through the isomerization of cis-fattyacids to trans-fatty acids (Isken and de Bont, 1998; Heipieperet al., 2003) and by increasing the ratio of saturated to unsaturatedfatty acids (Sikkema et al., 1995; Ramos et al., 2002). These changesresult in a more compact cell membrane and a decrease in cell vol-ume (Fakhruddin and Quilty, 2006; Sharma et al., 2007; Gaur andKhare, 2009). Further research is needed to determine if changes incis/trans ratios or saturated/unsaturated ratios are responsible forthe changes in cell membrane morphology and decreases in N.europaea cell volume observed in this study.
Interestingly, toluene, which lacks a polar group, has been re-ported to not cause changes in membrane composition (Ingram,1976; Radniecki et al., 2008) and would not be expected to signif-icantly change the cell volume as has been shown in this study(Fig. 2b). Thus, it is conceivable that the aromatic hydrocarbonstested here with a single polar group and no other polar ring sub-stitutions accumulate in the cell membranes, due in part to theirsimilarity with phospholipid fatty acids that are hydrophilic onone end and hydrophobic on the other, and trigger a significantchange in N. europaea cell volume.
The changes in cell volume did not appear to be a reversiblewithin the 3 h time frame of this study as N. europaea cells exposedto EC90 concentrations of phenol, aniline, p-cresol and ethylben-zene were able to recover 100% of their nitrification activity imme-diately after the removal of the aromatic hydrocarbon (Fig. 5a) butdid not return to their original cell volume (Fig. 5b). While it hasbeen proposed that decreases in cell size and changes in mem-brane composition increases the tolerance of bacteria to solventssuch as aromatic hydrocarbons (Sikkema et al., 1995; Ramoset al., 2002), this does not appear to be the case with N. europaea.N. europaea cells that were originally exposed to 15 lM phenol for3 h, had the phenol removed and were then exposed again to15 lM phenol were even more sensitive to the second additionof phenol (p = 0.004) (Fig. 6). However, cells exposed in the samemanner to 22.5 lM phenol did not show statistically significant de-creases in nitrification activity (p = 0.89). This may be attributed tothe high level of nitrification inhibition observed during the origi-nal exposure (95% ± 3%) which does not leave much room for fur-ther inhibition without complete failure of all nitrification activity.
The expression of NE1545 was evaluated in response to all ofthe aromatic hydrocarbons tested at both their EC50 and EC90.The notable exception was p-cresol in which NE1545 gene expres-sion was measured at its EC40, a concentration that did not result ina change in cell volume, and its EC90, a concentration that resulted

Fig. 6. Percent nitrification activity of N. europaea cells that were originally exposedto phenol for 3 h (j), decreased in cell volume, had the phenol removed and weresubjected to another round of phenol exposure at the same concentrations (h).Error bars represent 95% confidence intervals (may be hidden behind the data pointsymbols).
Fig. 5. (a) Percent nitrification activity of N. europaea cells exposed to variousaromatic hydrocarbons (j) and after the aromatic hydrocarbons had been removed(h). (b) Percent cell volume decreases in N. europaea cells exposed to variousaromatic hydrocarbons (j) and after the aromatic hydrocarbons had been removed(h). Error bars represent 95% confidence intervals (may be hidden behind the datapoint symbols).
T.S. Radniecki et al. / Chemosphere 82 (2011) 514–520 519
in a 15% decrease in cell volume. A strong correlation was observed(r = 0.84, p = 0.00005) between the up-regulation of NE1545 andthe measured decreases in cell volume (Table 1, Fig. 1, Fig. SM-6). At EC50 concentrations, only phenol and aniline showed a signif-icant increase in NE1545 expression (5.7 and 9-fold up-regulation,respectively) which corresponded with their decreases in cell vol-ume (11% and 13%, respectively). At EC90 concentrations, phenol,aniline, p-cresol and ethylbenzene all showed significant increasesin NE1545 expression (14.9, 18.6, 17.2 and 6.8-fold up-regulation,respectively) which corresponded with their greater decreases incell volume (16%, 15%, 15% and 11%, respectively). Once again,the increased expression of NE1545 at EC90 concentrations for p-cresol and ethylbenzene resulted from the residual p-cresol and in-creased 4-ethylphenol concentrations present in the reactors at theend of 3 h exposures.
Fig. 1 summarizes the results of our previous and present workand expected observations for compounds in the transformationpathways. The rapid oxidation of benzene to phenol results in a
reduction in cell volume and an up-regulation of NE1545. Phenolis slowly oxidized to p-hydroquinone, which does not cause asignificant up-regulation of NE1545 or a change in cell volume.Ethylbenzene follows a similar pattern to benzene as it is oxidizedto 4-ethylphenol which promotes both the up-regulation ofNE1545 and a decrease in cell volume. The oxidation of tolueneoccurs on the methyl group to produce benzyl alcohol which isslowly oxidized to benzyldehyde. Neither of these products causesup-regulation or a change in cell volume, as the oxidation occurson the substituted group. p-cresol, which causes both changes incell volume and the up-regulation of NE1545, is also oxidized onthe methyl group which results in products that are hydrophilicon both ends. Like p-hydroquinone, they do not promote changesin cell volume or in NE1545 up-regulation. Aniline, with its singlepolar group, causes a reduction in cell volume and NE1545 up-regulation. It is oxidized to nitrobenzene, which can be slowlyoxidized to 3-nitrophenol. Although neither of these products havebeen directly tested, we would expect nitrobenzene to cause theup-regulation of NE1545 and a decrease in cell volume, while3-nitrophenol would not.
4. Conclusions
N. europaea cells showed a high sensitivity to aromatic hydro-carbon exposure although all inhibition was found to be com-pletely reversible. The presence of a single polar group wasrequired to induce the observed irreversible decrease in cell vol-ume, which appears to have a biological maximum of 15%, and in-crease in NE1545 gene expression (Fig. 1). This is presumably dueto the higher similarity of these aromatic hydrocarbons to cellmembrane phospholipid fatty acids than those aromatic hydrocar-bons that contained multiple polar groups, or had two hydrophilicgroups, which resulted in minimal changes in cell volume andNE1545 gene expression even at EC90 concentrations. Based onthe results of this study, NE1545 should now be considered a sen-tinel gene for a broad range of aromatic hydrocarbons with a singlepolar group, not just for phenol as believed at the beginning of thiswork. The concentrations required to initiate the decreases in cellvolume and the increase in NE1545 expression are three ordersof magnitude lower than those reported with other bacteria mak-ing these changes in N. europaea an excellent biomarker for thepresence of inhibitory levels of certain aromatic hydrocarbons inthe natural environment and in wastewater treatment plants.
Acknowledgements
We thank Luis Sayavedra-Soto for the N. europaea culture andDan Arp, Mark Dolan and Peter Bottomley for providing construc-tive input on the work. We thank Mohammad Azizian for help withthe analytical techniques used, Jeff Nason for help with the CoulterCounter measurements and the Oregon State University Centerfor Genome Research and Biocomputing for qRT-PCR assistance.Funding was provided by a Biocomplexity Grant (#0412711) fromthe National Science Foundation’s Division of Bioengineering andEnvironmental Sciences and Engineering Program. Caslin Gilroyreceived summer internships through the Howard Hughes MedicalInstitute and the Subsurface Biosphere Initiative of Oregon StateUniversity.
Appendix A. Supplementary material
Supplementary data associated with this article can be found, inthe online version, at doi:10.1016/j.chemosphere.2010.10.083.

520 T.S. Radniecki et al. / Chemosphere 82 (2011) 514–520
References
Chang, S.W., Hyman, M.R., Williamson, K.J., 2002. Cooxidation of naphthalene andother polycyclic aromatic hydrocarbons by the nitrifying bacterium,Nitrosomonas europaea. Biodegradation 13, 373–381.
Fakhruddin, A.N.M., Quilty, B., 2006. The response of Pseudomonas putida CP1 cellsto nutritional, chemical and environmental stresses. World J. Microbiol.Biotechnol. 22, 507–514.
Fujita, K., Hagishita, T., Kurita, S., Kawakura, Y., Kobayashi, Y., Matsuyama, A.,Iwahashi, H., 2006. The cell structural properties of Kocuria rhizophila foraliphatic alcohol exposure. Enzyme Microbial Technol. 39, 511–518.
Gaur, R., Khare, S.K., 2009. Cellular response mechanisms in Pseudomonas aeruginosaPseA during growth in organic solvents. Lett. Appl. Microbiol. 49, 372–377.
Hageman, R.H., Hucklesby, D.P., 1971. Nitrate reductase from higher plants.Methods Enzymol. 23, 491–503.
Heipieper, H.J., Keweloh, H., Rehm, H.J., 1991. Influence of phenols on growth andmembrane permeability of free and immobilized Escherichia coli. Appl. Environ.Microbiol. 57, 1213–1217.
Heipieper, H.J., Meinhardt, F., Segura, A., 2003. The cis–trans isomerase ofunsaturated fatty acids in Pseudomonas and Vibrio: biochemistry, molecularbiology and physiological function of a unique stress adaptive mechanism.FEMS Microbiol. Lett. 229, 1–7.
Ingram, L.O., 1976. Adaptation of membrane lipids to alcohols. J Bacteriol 125, 670–678.
Isken, S., de Bont, J.A.M., 1998. Bacteria tolerant to organic solvents. Extremophiles2, 229–238.
Juliastuti, S.R., Baeyens, J., Creemers, C., Bixio, D., Lodewyckx, E., 2003. Theinhibitory effects of heavy metals and organic compounds on the netmaximum specific growth rate of the autotrophic biomass in activatedsludge. J. Hazard. Mater. 100, 271–283.
Keener, W.K., Arp, D.J., 1994. Transformations of aromatic compounds byNitrosomonas europaea. Appl. Environ. Microbiol. 60, 1914–1920.
Neumann, G., Veeranagouda, Y., Karegoudar, T.B., Sahin, O., Mausezahl, I., Kabelitz,N., Kappelmeyer, U., Heipieper, H.J., 2005. Cells of Pseudomonas putida andEnterobacter sp. Adapt to toxic organic compounds by increasing their size.Extremophiles 9, 163–168.
Peirson, S.N., Butler, J.N., Foster, R.G., 2003. Experimental validation of novel andconventional approaches to quantitative real-time PCR data analysis. NucleicAcids Res. 31, e73.
Radniecki, T.S., Dolan, M.E., Semprini, L., 2008. Physiological and transcriptionalresponses of Nitrosomonas europaea to toluene and benzene inhibition. Environ.Sci. Technol. 42, 4093–4098.
Ramos, J.L., Duque, E., Gallegos, M.T., Godoy, P., Ramos-Gonzalez, M.I., Rojas, A.,Teran, W., Segura, A., 2002. Mechanisms of solvent tolerance in gram-negativebacteria. Ann. Rev. Microbiol. 56, 743–768.
Salter, G.J., Kell, D.B., 1995. Solvent selection for whole-cell biotransformations inorganic media. Crit. Rev. Biotechnol. 15, 139–177.
Segura, A., Duque, E., Rojas, A., Godoy, P., Delgado, A., Hurtado, A., Cronan, J.E.,Ramos, J.L., 2004. Fatty acid biosynthesis is involved in solvent tolerance inPseudomonas putida DOT-T1E. Environ. Microbiol. 6, 416–423.
Sharma, N.K., Pandey, J., Gupta, N., Jain, R.K., 2007. Growth and physiologicalresponse of Arthrobacter protophormiae RKJ100 toward higher concentrations ofo-nitrobenzoate and p-hydroxybenzoate. FEMS Microbiol. Lett. 271, 65–70.
Sikkema, J., de Bont, J.A.M., Poolman, B., 1994. Interactions of cyclic hydrocarbonswith biological membranes. J. Biol. Chem. 269, 8022–8028.
Sikkema, J., Debont, J.A.M., Poolman, B., 1995. Mechanisms of membrane toxicity ofhydrocarbons. Microbiol. Rev. 59, 201–222.
Tsitko, I.V., Zaitsev, G.M., Lobanok, A.G., Salkinoja-Salonen, M.S., 1999. Effect ofaromatic compounds on cellular fatty acid composition of Rhodococcus opacus.Appl. Environ. Microbiol. 65, 853–855.
US EPA, 1993. Process Design Manual: Nitrogen Control. US EnvironmentalProtection Agency, Washington, DC.
Zepeda, A., Texier, A.C., Razo-Flores, E., Gomez, J., 2006. Kinetic and metabolic studyof benzene, toluene and m-xylene in nitrifying batch cultures. Water Res. 40,1643–1649.

Linking NE1545 gene expression with cell volume changes in Nitrosomonas europaea cells exposed to aromatic hydrocarbons – Supplementary Material
Tyler S. Radniecki*
102 Gleeson Hall
School of Chemical, Biological and Environmental Engineering
Oregon State University
Corvallis, OR 97331, United States of America
Phone: (541)737-6895
Fax : (541)737-3052
*Corresponding Author
Caslin A. Gilroy
102 Gleeson Hall
School of Chemical, Biological and Environmental Engineering
Oregon State University
Corvallis, OR 97331, United States of America
Lewis Semprini
102 Gleeson Hall
School of Chemical, Biological and Environmental Engineering
Oregon State University
Corvallis, OR 97331, United States of America

Raw Nitrite Production Data
The figures below (Fig. S1-S4) are representative raw nitrite production data for the inhibition tests for each of the aromatic hydrocarbons examined in this study. The nitrite production in the control batch reactors was linear throughout the entire experiment (Fig. S1-S4). The Ks of NH3 for N. europaea has been documented to be around 40 µM NH3. The batch reactors contained 5 mM NH4
+ total at pH 7.8 which results in a NH3 concentration of 145 µM, well above the Ks and not in the portions of the activity curve that is dependent on Ks.
As shown in Fig. S1-S4, all aromatic hydrocarbons inhibited Nitrosomonas europaea’s nitrite production in a linear fashion with the exception of higher p-cresol concentrations which resulted in a concave inhibition curve, hypothesized to be due to the oxidation of p-cresol to 4-hydroxybenzyl alcohol.
Figure SM-1. Representative nitrite production inhibition curves for triplicate p-cresol assays. (■) Control, (∆) 40 µM p-cresol, (●) 80 µM p-cresol and (○) 120 µM p-cresol. Error bars represent 95% confidence intervals (may be hidden behind the data point symbols).

Figure SM-2. Representative nitrite production inhibition curves for triplicate phenol, aniline and toluene assays. (■) Control, (∆) 5 µM phenol, (●) 55 µM aniline and (○) 45 µM toluene. Error bars represent 95% confidence intervals (may be hidden behind the data point symbols).
Figure SM-3. Representative nitrite production inhibition curves for triplicate o-cresol and m-cresol assays. (■) Control, (∆) 4 µM o-cresol, (●) 8 µM m-cresol. Error bars represent 95% confidence intervals (may be hidden behind the data point symbols).

Figure SM-4. Representative nitrite production inhibition curves for triplicate p-hydroquinone and ethylbenzene assays. (■) Control, (∆) 40 µM ethylbenze, (●) 140 µM p-hydroquinone. Error bars represent 95% confidence intervals (may be hidden behind the data point symbols).
Calculation of Percent Nitrification Inhibition
Percent of nitrite production inhibition was calculated in the following manner. The average nitrite production rate per mg of protein over the 3 h experiment was calculated for each batch reactor. The average of these nitrite production rates were calculated for the triplicate groups of batch reactors (e.g. the average of the control bottle averages). The standard deviation of the average of triplicate bottles was also calculated. The variability between triplicate control bottles was very low with 96% confidence intervals of the control nitrification rates typically ranging from 2-6%.
To calculate percent nitrification inhibition, the average nitrite production rates of the treatment bottles were divided by the average nitrite production of the control bottles and multiplied by 100. To calculate the standard deviation of the percent nitrification inhibition, the product standard deviation was used;
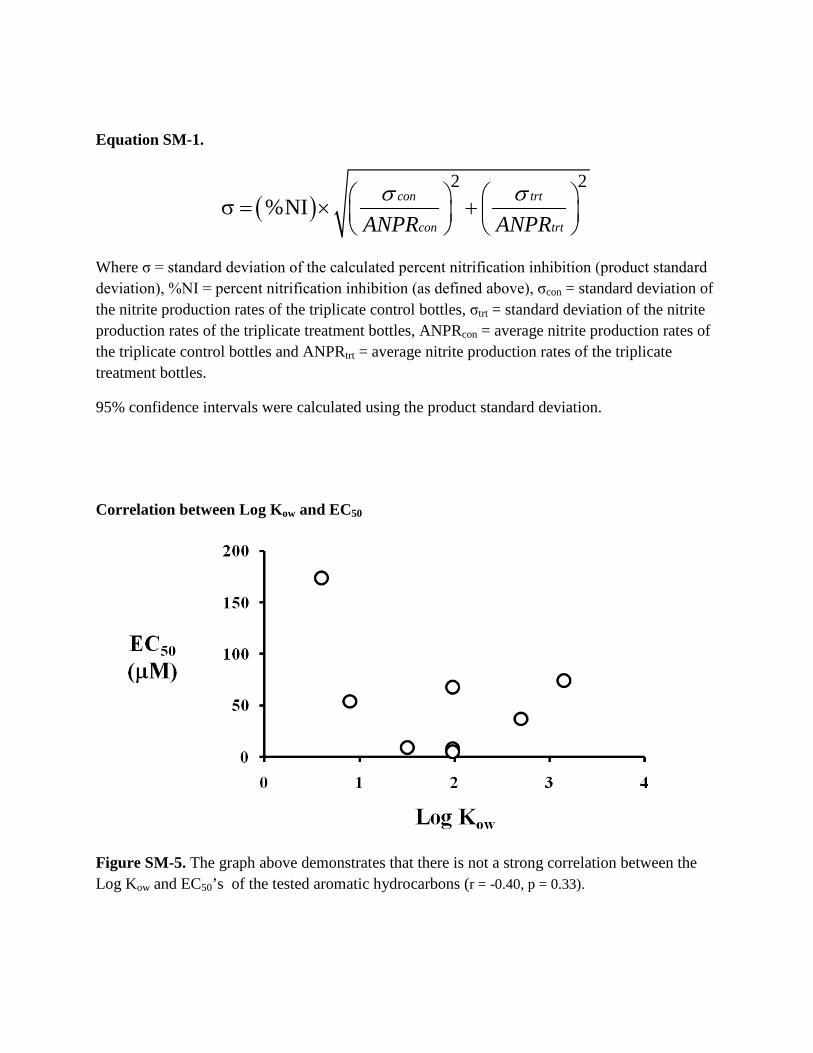
Equation SM-1.
( )2 2
%NI con trt
con trtANPR ANPRσ σ σ = × +
Where σ = standard deviation of the calculated percent nitrification inhibition (product standard deviation), %NI = percent nitrification inhibition (as defined above), σcon = standard deviation of the nitrite production rates of the triplicate control bottles, σtrt = standard deviation of the nitrite production rates of the triplicate treatment bottles, ANPRcon = average nitrite production rates of the triplicate control bottles and ANPRtrt = average nitrite production rates of the triplicate treatment bottles.
95% confidence intervals were calculated using the product standard deviation.
Correlation between Log Kow and EC50
Figure SM-5. The graph above demonstrates that there is not a strong correlation between the Log Kow and EC50’s of the tested aromatic hydrocarbons (r = -0.40, p = 0.33).

Correlation between Percent Change in Cell Volume and NE1545 Expression
Figure SM-6. The graph above demonstrates that there is a strong correlation between the percent change in cell volume and the expression of NE1545 induced by the tested aromatic hydrocarbons (r = 0.84, p = 0.00005).

Reversibility of Aromatic Hydrocarbon Nitrification Inhibition
Figure SM-7. Nitrite production curves for triplicate bioreactors exposed to various aromatics hydrocarbons (a) and after the hydrocarbons have been removed via washing (b). (□) Control, (▲) 200 µM aniline, (●) 120 µM p-cresol, (∆) 100 µM ethylbenzene and (○) 22 µM phenol. Error bars represent 95% confidence intervals (may be hidden behind the data point symbols).
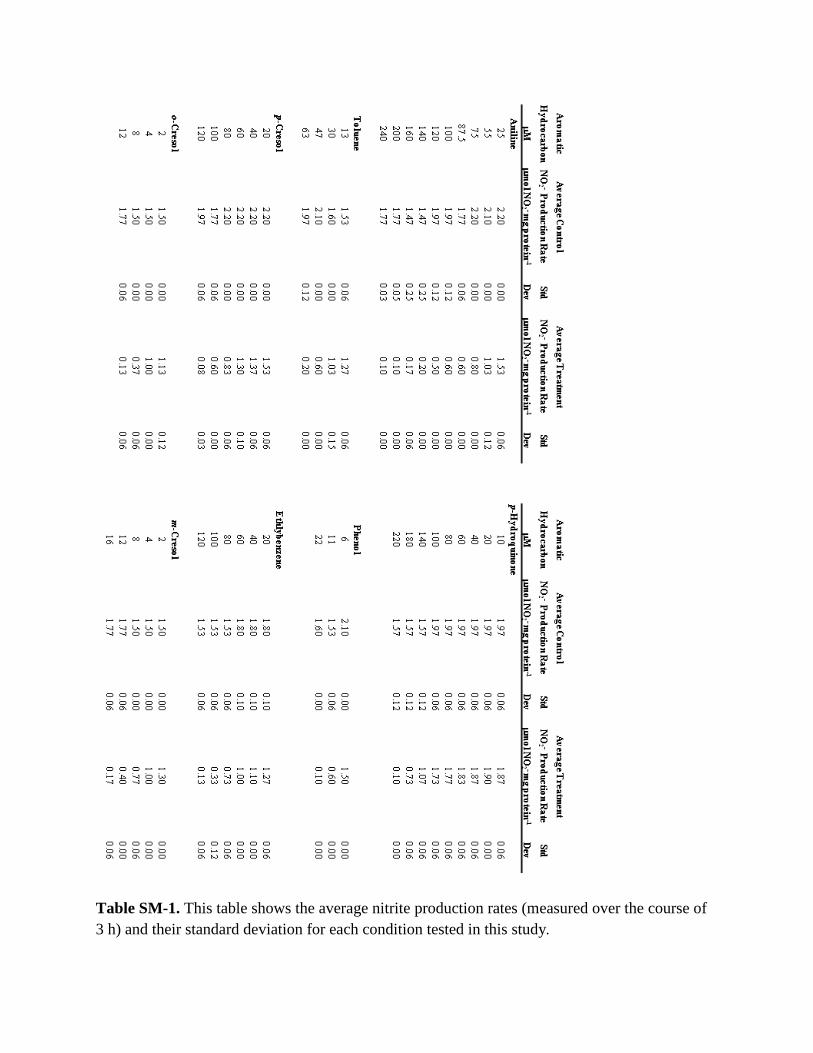
Table SM-1. This table shows the average nitrite production rates (measured over the course of 3 h) and their standard deviation for each condition tested in this study.