Phase Diagrams and Thermodynamic Properties of the 70 ...
54
Journal of Physical and Chemical Reference Data 16, 509 (1987); https://doi.org/10.1063/1.555803 16, 509 © 1987 American Institute of Physics for the National Institute of Standards and Technology. Phase Diagrams and Thermodynamic Properties of the 70 Binary Alkali Halide Systems Having Common Ions Cite as: Journal of Physical and Chemical Reference Data 16, 509 (1987); https://doi.org/10.1063/1.555803 Submitted: 25 October 1985 . Published Online: 15 October 2009 James Sangster, and Arthur D. Pelton ARTICLES YOU MAY BE INTERESTED IN Coupled Phase Diagram-Thermodynamic Analysis of the 24 Binary Systems, A 2 CO 3 -AX and A 2 SO 4 -AX Where A=Li, Na, K and X=Cl, F, NO 3 , OH Journal of Physical and Chemical Reference Data 19, 1149 (1990); https:// doi.org/10.1063/1.555866 Molten salts: Volume 4, part 2, chlorides and mixtures—electrical conductance, density, viscosity, and surface tension data Journal of Physical and Chemical Reference Data 4, 871 (1975); https:// doi.org/10.1063/1.555527 Molten Salts Data: Diffusion Coefficients in Single and Multi-Component Salt Systems Journal of Physical and Chemical Reference Data 11, 505 (1982); https:// doi.org/10.1063/1.555665
-
Upload
khangminh22 -
Category
Documents
-
view
1 -
download
0
Transcript of Phase Diagrams and Thermodynamic Properties of the 70 ...
Journal of Physical and Chemical Reference Data 16, 509 (1987); https://doi.org/10.1063/1.555803 16, 509
© 1987 American Institute of Physics for the National Institute of Standards and Technology.
Phase Diagrams and ThermodynamicProperties of the 70 Binary Alkali HalideSystems Having Common IonsCite as: Journal of Physical and Chemical Reference Data 16, 509 (1987); https://doi.org/10.1063/1.555803Submitted: 25 October 1985 . Published Online: 15 October 2009
James Sangster, and Arthur D. Pelton
ARTICLES YOU MAY BE INTERESTED IN
Coupled Phase Diagram-Thermodynamic Analysis of the 24 Binary Systems, A2CO3-AX and
A2SO4-AX Where A=Li, Na, K and X=Cl, F, NO3, OH
Journal of Physical and Chemical Reference Data 19, 1149 (1990); https://doi.org/10.1063/1.555866
Molten salts: Volume 4, part 2, chlorides and mixtures—electrical conductance, density,viscosity, and surface tension dataJournal of Physical and Chemical Reference Data 4, 871 (1975); https://doi.org/10.1063/1.555527
Molten Salts Data: Diffusion Coefficients in Single and Multi-Component Salt SystemsJournal of Physical and Chemical Reference Data 11, 505 (1982); https://doi.org/10.1063/1.555665
Phase Diagrams and Thermodynamic Properties of the 70 Binary Alkali Halide Systems Having Common Ions
James Sangster) and Arthur D. Pelton
Centre de Recherche en Calcul Thermochimique Ecole Poly technique, Campus de I'Universite de Montreal P. O. Box 6079, Station A, Montreal, Quebec, Canada H3C 3A 7
Received October 25, 1985; revised manuscript received April 6, 1987
A very extensive literature survey of all available phase diagram and thermodynamic data has been carried out for all 40 possible common-anion binary systems (AX -BX) and all 30 possible common-cation binary systems (AX-A Y) involving the alkali halides (A,B = Li, Na, K, Rb, Cs; X, Y = F, CI, Br, 1). A critical analysis and evaluation of these
data have been performed with a view to obtaining a "best" evaluated phase diagram and a set of "best" evaluated thermodynamic parameters for each system. To this end, a computer-assisted coupled analysis of the phase diagram data and the thermodynamic data for each system has been employed. Mathematical expressions for the thermodynamic properties of all known phases have been obtained which are consistent with the measured thermodynamic properties and phase diagrams as well as with established thermodynam- . ic principles and theories of solution behavior. The parameters of these expressions are reported here and have been used to generate the computer-calculated diagrams in the compilation.
Key words: alkali halides; molten salts; phase diagrams; thermodynamic properties.
Contents
1. Introduction ...................................................... 511 2. Computer-Coupled Thermodynamic/Phase
Diagram Analysis ... ....... ..... ................. ........ ..... 511 2.1. Introduction ............................................. 511 2.2. Thermodynamic Relationships ................ 512 2.3. Polynomial Expansions of Excess Proper-
ties ............................................................ 512 2.4. Solid Solutions with Limited Solubility:
Henrian Behavior .......... .... ....... ................ 513 2.5. Limiting Slopes of Liquidus Lines: Esti-
mation of Solid Solubility .. ;...................... 513 2.6. Optimization Procedure ........................... 513
3. The Evaluations ................................................ 514 3.1. Common-Anion Systems ......................... 514
a. Fluorides: ........................................... 514 LiF(A) + NaF(B) ............................ 514 KF(A) + LiF(B) .............................. 514 LiF(A) + RbF(B) ............................ 515 CSF(A) + LiF(B) ............................ 515 KF(A) + NaF(B) ............................ 516 NaF(A) + RbF(B) ...................... ~.... 517 CsF(A) + NaF(B) ........................... 517 KF(A) + RbF(B) ............................ 517
a) Permanent address: Sangster Research Laboratories, Suite M-3, 1270 Sherbrooke St. W., Montreal, Quebec, Canada H3G IH7
© 1987 by the U.S. Secretary of Commerce on behalf of the United States. This copyright is assigned to the American Institute· of Physics and the American Chemical Society. Reprints Available from ACS; see ReVliuts List i:lL ua~k of is:;ue.
CsF(A) + KF(B) ............................ . CsF(A) + RbF(B) ......................... ..
b. Chlorides: .......................................... . LiCl(A) + NaCI(B) ........ ~ ............... . KC1(A) + LiCl(B) ........................... . LiCl(A) + RbCl(B) ....................... .. CsCl(A) + LiCl(B) ......................... . KCl(A) + NaCl(B) ........................ .. NaCI(A) + RbCl(B) ....................... . CsCl(A) + NaCl(B) ........................ . KCl(A) + RbCl(B) ......................... . CsCl(A) + KCl(B) ......................... . CsCl(A) + RbCl(B) ........................ .
c. Bromides: ......................................... .. LiBr(A) + NaBr(B) ........................ . KBr(A) + LiBr(B) ......................... . LiBr(A) + RbBr(B) ........................ . CsBr{A) + LiBr(B) ........................ . KBr(A) + NaBr(B) ........................ . NaBr(A) + RbBr(B) ...................... . CsBr(A) + NaBr(B) ....................... . KBr(A) + RbBr(B) ........................ . CsBr(A) + KBr(B) ......................... . CsBr(A) + RbBr{B) ........... ~ ........... .
d. Iodides: .............................................. . LiI(A) + NaI(B) ............................. . KI(A) + LiI(B) .............................. . LiI(A) + RbI(B) ............................. . CsI(A) + LiI(B) ............................. . KI(A) + NaI(B) ............................. . NaI(A) + RbI(D) ........................... .
518 518 519 519 520 520 521 522 523 523 524 525 525 526 526 527 528 528 529 530 530 530 531 . 532 -533 533 533 534 534 535 535
0047-2689/87/030509-54/$08.00 509 J. Phys. Chem. Ref. Data, Vol •. 16, No.3, 1987
510 J. SANGSTER AND A. D. PEL TON
Csl(A) + NaI(B) ............................. 536 KI(A) + RbI(B) .............................. 537 Csl(A) + KI('S) ............................... 537 CsI(A) + RbI (B) ............................. 538
3.2. Common-cation Systems .......................... 538 a. Lithium: ............................................. 538
LiC1{A) + LiF(R) ............................ 538 LiBr(A) + LiF(B) ............................ 539 LiF(A) + LiI(B) .............................. 539 LiBr(A) + LiCJ(B) .......................... 540 Liel(A} + LiI(B) ............................. 541 LiRr(A) + LiI(B) ............................. 541
b. Sodium: .............................................. 541 NaCl(A) + NaF(B) ';41 NaBr(A) + NaF(B) ......................... 542 NaP (A) + Nal(B) ........................... 542 NaBr(A) + NaCl(B) ........................ 542 NaCI(A) + NaI(B) "'''''''''''''''''''''''' 543 NaBrCA) + Nal(B) """"'''''''''''''''''' 544
c. Potassium: .......................................... 544-KCI(A) + KF(B) ............................. 544 KBr(A) + KF(B) ............................ 545 KF(A) + KI(B) ............................... 545 KBr(A) + KCl(B) ........................... 545 KC1(A) + Kr(B) .............................. 546 KBr(A) + KI(B) ............................. 547
d. Rubidium: .......................................... 548 RbCl(A) + RbF(B) ......................... 548 RbBr(A) + RbF(B) ......................... 548 RbF(A) + RbI (B) ........................ ".. 549 RbBr(A) + RbCl(B) ........................ 549 RbCl(Aj + RbI(B) .......................... 550 RbBr(A) + RbI(B) .......................... 550
e. Cesium: .............................................. 5:>1 CsCl(A) + CsF(B) ........................... 551 CsBr(A) + CsF(B) .......................... 551 CsF(A) + Csl(B) ............................. 551 CsDr(A) + CsCl(B) ......................... 552 CsCl(A) + Csl(B) ............................ 553 CsBr{A) + Csl(B) ........................... 553
4. Acknowledgments............................................. 554 5. Appenrux........................................................... 554 6. References ......................................................... 55&
List of Tables
1. S-ystemKCI(A) + NaCl(B):excesschemica\potential ofNaCl in the liquid as determined by emf and phase diagramftheunodynanric analysis
AI. Melting points and Gibbs energies of fusion of pure halides ....................................................... 555
A2. Excess enthalpy and entropy ofthe liquid state faT the 40 common-anion systems, expressed as Legendre polynomials ....................................... 555
A3. Excess enthalpy and entropy of tIle liquid state for the 30 common-cation systems. expressed as Legendre polynomials ....................................... 556
A4. Gibbs energies of fns~on and of formation of in-termediate compounds.. .................. ....... ...... ..... 557
AS. Summary of the thermodynamic properties of the solid state in common-anion systems .......... 557
A6. Summary of the thermodynamic properties of the solid state in common-cation systems ......... 557
A 7. Classification of the 70 binary alkali halide phase aiagrams according to type ..................... 557
AS. Phase diagram types among series of binary al-kali halide systems ............................................ SSS
LIst ot Figures
L ThesystemLiF(A)+NaF(B) ....................... 514 2. The system KF(A) + LiF(B; ........................ 51) 3. The system LiF(A) + RbF(B) ....................... 515 4. The system CsF(A) + LiF(B) ....................... 516 5. ThesystemKF(A}+NaF(B) ....................... 516 6. The system NaF(A) + RbF(B) ..................... 517 7. ThesystemCsF(A) + NaF(B) ...................... 517 8. ThesystemKF(A) + RbF(B) ....................... Sl8 9. The system CsF(A) + KF(D) ;....................... 518
10. The system CsF(A) + RbF(B) ...................... S19 11. ThesystemLiCl(A)+NaCl(B) .................... 520 12. The system KC1(A) + LiC/(B) ...................... 520 13. The system LiCI(A) + RbC!(B} .................... 521 14. The system CsC1(A) + Uel(B) ..................... 522 ISa. The system KC1(A) + NaC1(B), high tem-
perature ................... ......................... ......... ....... 523 151,. The system KCl(A) + NaCJ(B), low tem-
perature ................................... .................... .... 523 16. The system NaCI(A) + RbCI(B) ................... 524 17. The system CsCl(A) + NaCl(B) .................... S24 18. The system KCl( A) + RbCl(B) ..................... 525 19. The system CsCl(A) + KCl(B) ..................... 526 20. The system CsCl(A) + RbCJ(B) .................... 526 21a. The. system LiBrIA) + NaBr(B), high tem-
peratuce ........................................................... . 527 21b. The system LiBr(A) + NaBr(B), low tem-
perature ........................................................... . 22. The system KBr(A} + LiBr(B) ................... .. 23. The system LiBr(A) + RbBr(B) .................. .. 24. The system CsBr(A} + LiBr(D) .................. ..
techniques ........................................................... . 514 25. The system RETIA) + NaBt(R) .................. ..
527 528 528 529 530 530 531 531 532 533 533 5,04 534
2. Reported minima and invariant points of the sys- 26. The system NaBr(A) + RbBr(B) ................. . tem LiCl(A) + NaCl(B) ................................... . 519 27. The system CsBr(Al + NaBr(Bl ................. ..
3. Reported invariant points of the system CsCl(A) 28. The system KBr(A) + RbBr(B) ................... . + LiCl(B) ......................................................... .. 521 29. The system CsBr(A) + Kllr(B) ................... ..
4. Reported minima and invariant points of the sys- 3~. The system CsBr(A) + RbBr(B) ................. .. tem LiBr(A) + NaBr(B) ................................... . 527 . 31. The system LiI(A) + NaI(B) ....................... ..
5. Reported invariant points of the system :i1. 1:he\\ye.tem K1(A) + UI(B) ......................... . LiBr(A) + RbBr(B) .......................................... . 528 33. The system Lil(A) + RbI(B) ....................... ..
J. Plln. Chem. Ref. Data. Vol. 16. No.3. 19&7
PHASE DIAGRAMS AND THERMODYNAMICS OF BINARY ALKALI HALIDES 511
34-. The system CsI(A) + UI(B) ......................... 535 35. The system KI(A) + NaI(B) ......................... 535 36. The system NaI(A) + RbI(B) ....................... 536 37. The system Csl(A) + NaI(B) ........................ 536 38. The system K!(A) + RbI(B) ......................... 537 39. The system Cs1(A) + KI(B) .......................... 538 40. The system Cs1(A) + RbI(B) ........................ 539 41. Th"l;Yl;l"lll LiCl(A) 1- LiF(lI) ....................... 539 42. The system LiBr(A) + LiF(B) ...................... 540 43. The system LiF(A) + LiI(B) ......................... 540 44. The system LiBr(A) + LiCl(B) ..................... 540 45. The system LiCI(A) + LiI(B) ........................ 541 46. The system LiBr(A) + LiI(B) ....................... 541 47. The system NaCI(A) + NaF(B) .................... .542 48. The system NaBr(A) + NaF(B) .................... 542 49. The system NaP(A) + NaI(B) ...................... 543 50. The system NaBr(A) + NaCICB) .................. 543 51- The system NaCl(A) + NaI(B) ..................... 544 n. Thl: S)'tltl:lU NaBr(A) -t- NaI(B) .. ., ................. J44 53. The system KCI(A) + KF(B) ........................ 545 54. The system KBr(A) + KF(B) ....................... 545 55. The system KF(A) + Kf(B) .......................... 546
1. Introduction Molten salt phase diagrams are of central importance in
metallurgy and materials science. They contribute to our knowledge of the behavior of materials in many applications and provide information relating to ionic interactions in solution.
There exists a wealth of data on phase diagrams of the alkali halides, particularly in compendia. 1-7 In these sources, as in the general literature, there is a relative lack of critical evaluation of these data. There lwve been some attempts at systematic evaluatioD,2,4 but these have not exploited the contribution of a thermodynamic simultaneous analysis of the data.
For the common-ion binary alkali halide systems, there exists also a large amount of data on mixing and excess properties,8 in both the liquid and solid states. The following sectioll of the present report describes the computer-coupled thermodynamic/phase diagram analysis used in the critical evaluation of phaoc diagrrun data. This procedure enables the evaluator to test the thermodynamic consistency within and among all reparted phase diagram and excess property measurements. This procedure, we believe, results in a much more rigorous and objective assessment of all data than has hitherto been possible. Furthermore, it enables a thermodynamically correct "smoothing" of the experimental data to be performed, and a "best" phase diagram to be calculated.
For each of the 70 systems, the details of the evaluation procedure and the phase diagram for that system are grouped together. Not all reported experimental points are shown on the phase diagram in each caSe. Howe'{er, aU references found for each system have been included and discussed. The evaluated "best" equations for the thermodynamic properties of 1,1.11 plwses are given. The phase diagrams shown were calculated from these equations and are consid-
56. The system KBr(A) + KCl(B) ...................... 546 57. The system KCl(A) + KI(B) ........................ 547 58. The system KBr(A) + KI(B) ........................ 548 59. The system RbCI(A) + RbF(B) .................... 548 60. The system RbBr(A) + RbF(B) .................... 549 61. The system RbF(A) + RbI(B) ...................... 549 62. The system RbBr(A) + RbCl(B) ................... 550 63. The system RbC1(A) 1- RbI(B) ..................... 550 64. The system RbBr(A) + RbI(B) ..................... 55] 65. The system CsCl(A) + CsF(B) ...................... 551 66. The system CsBr(A) + CsF(B) ..................... 551 67. The system CsF(A) + CsI(B) ........................ 552 68a. The system CsBr(A) + CsCl(B), high tem-
peraturc ............................................................ 553 68b. The system CsBr(A) + CsCl(B), low tem-
perature ............................................................ 553 69. The system CsCl(A) + CsI(B) ....................... 553 70. The system CsBr(A) + CsI(B) ...................... 554 71. The three Legendre polynomial coefficients
(ao. a,. a2) for the excess enthalpy function HE (l)/XA Xv oftheLi~containjngcommon-an-ion systems ....................................................... 557
ered to be the "best" evaluated diagrams which can be deduced from the data currently available. The "probable maximum inaccuracy" of the evaluated phase diagram has been estimated for each system. Phase boundaries indicated by <tashed lines are cODBidered to be less accurately known.
Tabulated summaries of the thermodynamic properties of aU phases represented in the evaluated phase diagrams, together with a topological classification of the diagrams, i.e., according to type (simple eutectic, etc.) are found in the Appendix. There is also a summary ofthe temperatures and Gibbs energies of fusion and transformation of the pure halides. While most of the pure component data were taken from a recent standard source,9 a fe-evaluation using more up-to-date data was found necessary in a few cases as indicated.
It should be noted that for all 70 binary systems reported here, one consistent set of melting points for the pure salts has been adopted. In many reported experimental binary phase diagrams. the melting points of the pure salts differ significantly from these values. Account was taken of this problem in the evaluations.
.2. Computer-Coupled Thermodynamic/ Phase Diagram Analysis
2. t. Introduction
As well as providing a set of self-consiste!lt thetmod'Jnamic equations which simultaneously reproduce the tllermodynamic properties and the phase diagram of the system, the technique of coupled thermodynamic/phase diagnHl. analysis yields a thermodynamically correct "smoothing" of the experimental data. Fnrthermore, discrepancies among various sets of data can often be resolved in thi& way, and error limits can more easily be assigned. Unknown or uncer-
J. Phys. Chem. Ref. Oatil, Vol. 1&, No.3, 1987
512 J. SANGSTER AND A. D. PELTON
tain phase boundaries can often be estimated with good precision and, conversely, some reported phase boundaries can be rejected as being inconsistent with the thermodynamic properties of the system. Finally, such a thermodynamic analysis is the first step in estimating ternary and higher order phase diagrams from binary data. A short bibliography on computer-coupled thermodynamic/phase diagram analysis and calculation 10-17 should suffice to orient the reader. The principles of simultaneous least-squares optimization of thermodynamic and phase diagram data are described in Ref. 10. The interactive computer programs which were used in the optimizations and phase diagram calculations are described in Ref. 11. (These programs are available "on-line" or on diskette, and further information may be obtained from the authors.)
2.2. Thermodynamic Relationships
For equilibrium between a" solid and a liquid phase in a binary system with components A and B, we may write
(1)
where a~ and a~ are the activities of A on the liquidus and solidus at temperature T. Here, 6.fus G ~ is the Gibbs energy offusion of A at T and R is the gas constant. Setting the ideal activities equal to the mole fractions Xl and X S we may write
RTlnx~/x~ + G!(I) - G!(S) = - JlfusG~, (2)
where GE(l) and GE(s) are the partial excess Gibbs energies of A in the liquid and solid! These are zero in an ideal solution. Note that
(3)
G!(S) =RTln~, (4)
where rand r are the activity coefficients in the liquid and solid.
An equation identical to Eq. (2) can be written for the other component, B. If the Gibbs energies of fusion are known, and if the excess Gibbs energies are also known as functions of temperature and composition, then these two equations can be solved simultaneously by numerical methods to calculate the liquidus and solidus lines. Conversely, if the liquidus and solidus are known along with the excess Gibbs energies for one phase, then the excess Gibbs energies for the other phase can be calculated.
The integral excess Gibbs energy G E is related to the partial excess Gibbs energies by the following equation:
G E = X A G! + X B G ~. (5)
Conversely, the partial properties can.be obtained from the integral property from the following equation:
EEl ) dGE
G i = G + ( - Xi --, dx;
(6)
where i = A or B. The excess Gibbs energy can be written as
G E = HE - TS E, (7)
where HE and SE are the excess enthalpy and entropy, respectively. In most cases it can be assumed that HE and SE are independent of temperature. In only four of the 70 sys-
J. Phys. Chern. Ref. Data, Vol. 16, No.3, 1987
terns in the present compilaton were the data of sufficient precision and available over a wide enough temperature range to merit inclusion of a temperature-dependent term in the expressions for HE and SE. The details are discussed under the evaluations for these particular systems. For the remainder of the present section, it will be assumed that HE and SE are independent of temperature.
2.3. Polynomial Expressions of Excess Properties
For phases (solid and liquid) with extended ranges of solubility, HE and SE may be expanded as polynomials in the mole fractions as follows:
HE = XAXB (ho + hixB + hr~ + ... ), SE = XAXB (so + SjXB + sr~ + ... ),
(8)
(9)
where the hi and Sj are empirical coefficients. Corresponding expressions fOf the partial properties can be obtained by differentiating Eqs. (8) and (9) via Eq. (6) to give
H E-"'h( . )i+l A -.£.t i X B - IX A X B , ;=0
S E '" ( .) i+ I A = .£.t Si X B - IX A X B , i=O
H~ = xi L hi (i + l)x~, i=O
s: = xi I Si (i + 1)x~, i=O
whence:
G! =RTlnYA =H! - TS!,
G~ =RTlnYB =H~ - TS~.
(10)
(11)
(12)
( 13)
(14)
(15)
The empirical coefficients hi and Si are found by the simultaneous optimization of the thermodynamic and phase diagram data. If only the first terms (ho,so) in the empirical series Eqs. (8) and (9) are nonzero, then the solution is termed "regular." If two terms are required to fit the data then the system is called "subregular." Experience has shown that most alkali halide solutions approximate quite closely to regular or subreguial- behavior.Nu lllun:: than fuur terms were required in Eqs. (8) and (9) for any of the 70 systems, and usually one or two terms sufficed. If only limited experimental data are available, then the assumption of regular or subregular behavior will yield an acceptable approximation.
Experience with alkali halide solutions has also shown that the enthalpic term HE in Eq. (7) is generally larger in magnitude than the entropic term TSE. Hence, if available data are limited, it is a reasonable assumption to set SE = 0 and to assume that G E is temperature independent.
As a general rule, the larger the cations and/or anions and the smaller the difference between the radii of the two cations in a common-anion binary system (or between the two anions in a common-cation binary system), the more clQsely the above approximations (one- or two-term polynomial expansions; SE = 0) are obeyed.
PHASE DIAGRAMS AND THERMODYNAMICS OF BINARY ALKALI HALIDES 513
2.4. Solid Solutions with Limited Solubility: Henrian Behavior
In certain systems, limited solid solubility of only a few mole percent of one component in the other is observed. Such solid solutions may be considered to be Henrian solutions. That is, letting component A be the solvent, the activity of A is ideal (Raoultian):
a~ = x~ and G!(S) = O. (16)
For the solute, B, the activity coefficient 1B = aB/~ is independent of composition. Hence, G :(S) = RT In rs is also independent of composition, and can, to a reasonable approximation, be taken to be independent of temperature:
G :(S) = R T In YB = constant. ( 17)
In such cases of limited solid solubility of solute B in solvent A, we note that Eq. (2) alone is sufficient to permit G!(1) to be calculated along the liquidus, if the solidus and liquidus lines are known, since G !(S) = O.
2.5. Limiting Slopes of Liquidus Lines: Estimation of Solid Solubility
In some systems, the extent of solid solubility is not known. In such cases, the measured limiting slope of the liquidus line (~/dT) at Xl = 1 (pure A) can permit the extent of solid solubility to be estimated. In the limit at XA = 1; both the liquid and solid phases become Henrian such that GE(s) and GE(l) both approach zero. Similarly, for x A :::::: 1, the Gibbs energy of fusion of A is well approximated by the expression AfusH °A (1 - TIT fus(A) , whereAfusHoA is the enthalpy of fusion of A at its melting point, T fus(A) . Differentiation of Eq. (2) in the limit at X A = 1 then gives
dx~ _ ~A __ AfusH~ -----., whenxA = 1. (18)
dT dT R(T~(A»2
From the known enthalpy of fusion and the measured limiting liquidus slope, dxl
/ dT, the limiting solidus slope dxS / dT
can be calculated. If this is close to zero, then the solid solubility is of limited extent.
2.6. Optimization Procedure
The actual steps followed in an optimization will vary from system to system. Details are given under the evaluation for each system. However, some general observations can be enunciated.
In 53 of the 70 systems, HE(l) in the liquid phase has been measured calorimetrically by Prof. O. Kleppa and coworkers. These data, which are very reliable, have been fitted to 1-,2-, or 3-membered series as in Eq. (8).
In the cases of systems with limited solid solubility, Eq. (2) was then used under the assumption of Henrian solid behavior, to calculate excess Gibbs energies along the A- and B-liquidus lines. That is, G !(S) was set equal to zero for the solvent, according to Eq. (16). Combining these excess Gibbs energies with the already fitted calorimetric liquid enthalpies permitted the excess liquid entropy SE(l) to be calculated and then smoothed by representation as a 1- or 2-member (very exceptionally a 3 or 4 member) polynomial as in Eq. (9). The Henrian constant of Eq. (17) could then be
calculated from the measured solubility limits for each of the two solid solptions. In those few systems for which calorimetric liquid enthalpies were not available, SE(l) was set equal to zero, and the values of GEO) = HE(l) obtained from the phase diagram were then smoothed by polynomial representation as in Eq. (8).
In the cases of systems with complete solid miscibility, HE(s) has been measured calorimetrically in only a few cases. In general, in these systems it must be assumed that SE = 0 in either the liquid or solid phase or in both. If GE(s)
for the completely miscible solid phase is positive, then there will be a zone of demixing (i.e., a miscibility gap) in the solid whose boundaries and consolute point can be calculated from the equation for GE(S) • Conversely, if the miscibility gap has been measured experimentally, then these data can be used to help determine the coefficients in the expression for GE(s) (Ref. 10).
Some of the systems studied contain intermediate compounds. In no cases have the Gibbs energies of fusion of these compounds been measured. However, once HE(l) and SE(1) have been determined, the Gibbs energies of fusion of the compounds can be calculated from their measured liquidus lines via Eq. (2) if the;;y are;; assumed to be stoichiometric compounds. Their Gibbs energies of formation from the pure component salts can then also be calculated.
In a few systems, activities of components have been measured by auxiliary methods. The number of such systems is small. The following is a summary showing the number of systems for which different data types were available.
Systems with phase diagram andlor thermodynamic data: 70 Systems with emf (electromotive force) data: 7 Systems with vapor pressure data: 2 Systems with mass spectrometric data: 2
For all those systems having auxiliary data, the pertinent sources are mentioned and discussed under the section for the appropriate system, and all references have been retained. These data could also be used in principle in the data optimization, but were in fact not used for this purpose. This is because these data, compared to available calorimetric or phase diagram data, were too sparse or ina.ccura.te.
An example will illustrate this conclusion. The system KCI(A) + NaCI(B) has been widely studied; good phase diagram and thermodynamic data exist for both liquid and solid phases (26 references); From the phase diagram/thermodynamic property optimization for this system, as reported in this work, it was found that the quantities
SE (1) = 0, (20)
(assumed independent of temperature) were sufficient to describe the liquid phase. Equation (19) represents the excess enthalpy as determined calorimetrically by Kleppa. 18
Measurements of activities by other methods have also been reported. In Table 1, results for the excess chemical potential of NaCI in the liquid are shown, as found by three methods:
J. Phys. Chern. Ref. Data, Vol. 16, No.3, 1987
514 J. SANGSTER AND A.. D. PELTON
TABLE 1. System KCl(A) + NaCl(B). Excess chemical potential ofNaCI, G:, in the liquid as detennined by emf and phase diagram/thennodynamic analysis technique
XB
0.24 0.29 0.40 0.43 0.47 0.51 0.58 0.63 0.72 0.75 0.78 .0.82 0.88 0.91 0.95
This worka
-1.26 -1.11 -0.82 -0.74 -0.65 -0.56 -0.54 -0.33 -0.19 -0.15 -0.12 -0.08 -0.04 -0.02 -0.01
emfb
3.51 2.34 2.90 2.43 2.41 1.59
1.15 1.34
0.21
a Quantity assumed to be independent of temperature. bReference 19, data at 880 °C. cReference 20, data at 885 °C.
emfC
3.63 3.21 1.45
0.85
0.17
0.70
0.28
0.13
(i)Eqs. (19) and (20), (ii)emfRef. -19, and (iii) emf Ref. 20. Both emf studies report rather large positive deviations from ideality. If Eq. (19) is taken to represent the excess enthalpy, then the partial excess entropy of NaCI, as determined by emf, may be as large as - 3 J mol-I K -I at the equimolar composition. As Forland and Thulin20 point out, this is an improbably large deviation for this system, and instead they attribute the deviation to the presence of a liquid junction potential in the original emf measurements. That this is probably the case is supported also by independent NaCI activity measurements made by mass spectrometry21 on the liquid. The results of these measurements, done in the interval 700-81 0 °C and extrapolated to 880 °C, indicate that G: is slightly negative, and that the partial excess entropy S: is very small ( zO.4 J mol- I K -I at the equimolar composition).
In conclusion, we favored phase diagram and thermodynamic data in our optimization and excluded other types of data, because the latter were sparse and uncertain. Electromotive force measurements in systems containing alkali metals are particularly difficult, due to spurious effects. The interpretation of vapor pressure data is not entirely unambiguous and precise measurement is difficult. The mass spectrometric data may be accurate, depending upon the species whose ion currents are used to derive activities.
Only in the case where no phase diagram or thermodynamic data were at hand, but auxiliary data were available, would we consider the use of auxiliary data in the optimization. This was never the case among the 70 systems reported here. In such a hypothetical case, auxiliary data would be considered together with qualitative and quantitative estimates drawn from phase diagram and thermodynamic properties of analogous systems already studied.
J. Phys. Chem. Ref. Data, Vol. 16, No.3, 1987
3. The Evaluations 3.1. Common-Anion Systems
a. Fluorides
LiF(A) + NaF(8)
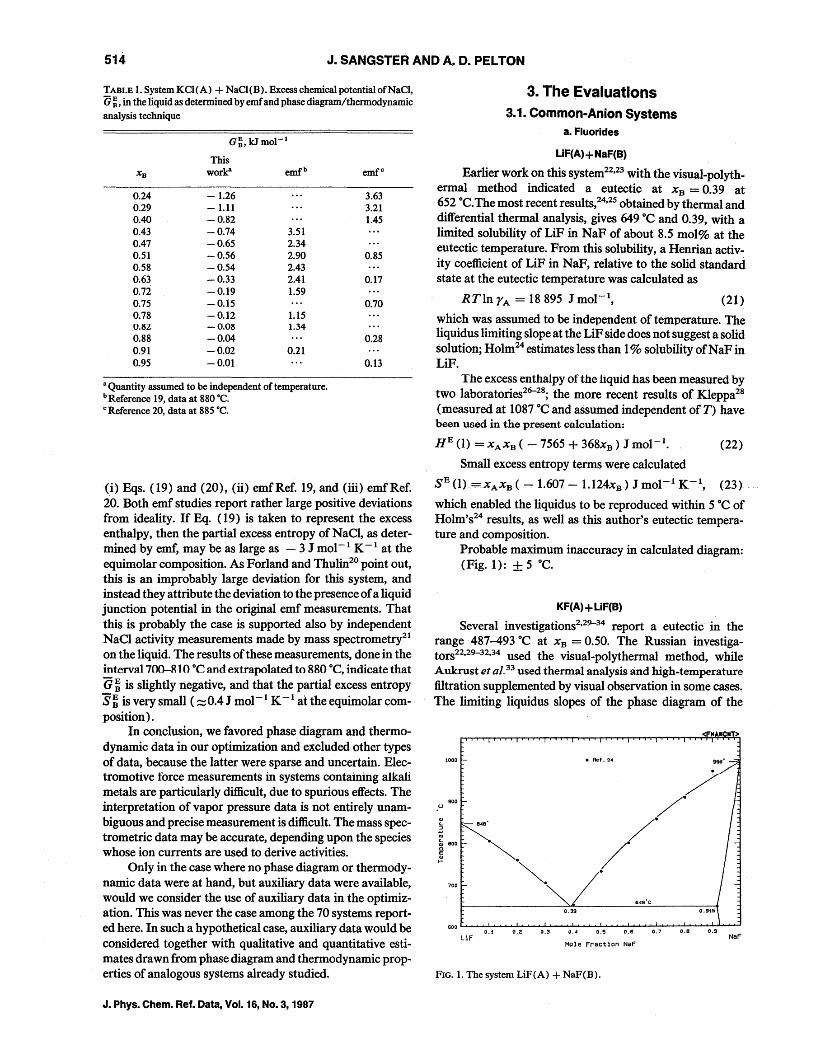
Earlier work on this system22,23 with the visual-polythermal method indicated a eutectic at X B = 0.39 at 652 °C. The most recent results,24,25 obtained by thermal and differential thermal analysis, gives 649°C and 0.39, with a limited solubility of LiF in NaF of about 8.5 mol% at the eutectic temperature. From this solubility, a Henrian activity coefficient of LiF in NaF, relative to the solid standard state at the eutectic temperature was calculated as
RTln r A = 18 895 J mol-I, (21)
which was assumed to be independent of temperature. The liquidus limiting slope at the LiF side does not suggest a solid solution; Holm24 estimates less than 1 % solubility ofNaF in LiF.
The excess enthalpy of the liquid has been measured by two laboratories26-28; the more recent results of Kleppa28
(measured at 1087 °C and aSsumed independent of T) have been used in the present calculation:
HE (1) = XAXB ( -1565 + 368xB ) J mol-I. (22)
Small excess entropy terms were calculated
SE (1) =XAXB ( - 1.607 - 1. I 24xB ) J mol- 1 K-t, (23)
which enabled the liquidus to be reproduced within 5 °C of Holm's24 results, as well as this author's eutectic temperature and composition.
Probable maximum inaccuracy in calculated diagram: (Fig. 1): ± 5 °C.
KF(A) + LiF(8)
Several investigations2,29-34 report a eutectic in the range·487-493 °C at X B = 0.50. The Russian investigators22,29-32,34 used the visual-poly thermal method, while Aukrust et al.33 used thermal analysis and high-temperature filtration supplemented by visual observation in some cases. The limiting liquidus slopes of the phase diagram of the
1000
900 .u
OJ t. :J
IU
; BOO Q.
~
700
.~
.~.
0.39
• Ref. 24
600 L...............J0.~1 ........ ..J0 ..... 2 .......... ...J.0
...... 3
......... ~...L.4~ ..... 0.J...5 ............... 0..L...6 ............. 0.l...o.7 ............... 0'-".B----.o...IO ....... 9 ...............
LiF NaF Mole Fraction NaF
FIG. 1. The system LiF(A) + NaF(B).
PHASE DIAGRAMS AND THERMODYNAMICS OF BINARY ALKALI HALIDES 515
American authors33 suggest a solid solubility of no more than 2 % at either end, and calculations were performed under the assumption of no solid solubility.
The excess enthalpy of this system has been reported by two laboratories26,28,35 and the more recent and reliable data of Hong and Kleppa28 were used in the present work:
HE (1) = XAXB ( - 19251 - 1205xA
+ 4732xi) J mol-I.
The use of small excess entropy terms
SE (1) = XAXB ( - 1.375
- 3. 146xB ) J mol- 1 K-t,
(24)
(25)
enabled a good fit (within 5 °C) to the liquidus of Aukrust et al.33
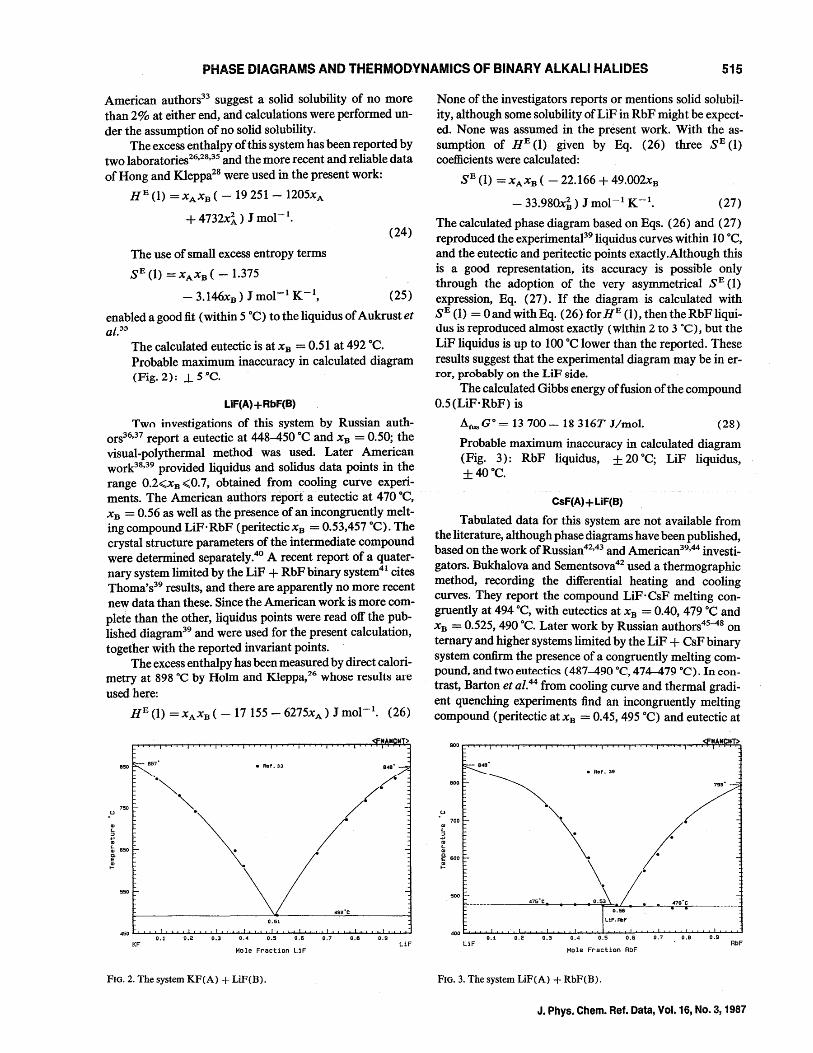
The calculated eutectic is at XB = 0.51 at 492°C. Probable maximum inaccuracy in calculated diagram (Fig. 2): J.. SoC.
LiF(A) + RbF(B)
Two investigations of this system by Russian authors36,37 report a eutectic at 448-450°C and XB = 0.50; the visual-polythermal method was used. Later American work38,39 provided liquidus and solidus data points in the range 0.2<;XB <;0.7, obtained from cooling curve experiments. The American authors report a eutectic at 470°C, XB = 0.56 as well as the presence of an incongruently melting compound LiF· RbF (peritecticxB = 0.53,457 °C). The crystal structure parameters of the intermediate compound were determined separately.40 A recent report of a quaternary system limited by the LiF + RbF binary system4I cites Thoma's39 results, and there are apparently no more recent new data than these. Since the American work is more complete than the other, liquidus points were read off the published diagram39 and were used for the present calculation, together with the reported invariant points.
The excess enthalpy has been measured by direct calorimetry at 898 ftC by Holm and KIeppa,26 whose results are used here:
.u ., t.. :J
III
HE (1) = XAXB ( - 17 155 - 6275xA ) J mol-I. (26)
M M M >
850 --- 857' • Ref. 33
750
f;; 650
! 550
0.51
450 ......... -'-'::-'":"-"'~':'-'-"-':"':~'--':-'-:'-'-'-':'.I.: ............ ~~~ ......... .Io...I...I. ......... &..J....r..~ 0.1 0.2 0.3 0.4 0.5 0.6 0.7 0.8 0.9
KF LiF Mole Fraction LiF
FIG. 2. The system KF(A) + LiF(B).
None of the investigators reports or mentions solid solubility, although some solubility ofLiF in RbF might be expected. None was assumed in the present work. With the assumption of HE (1) given by Eq. (26) three SE (1) coefficients were calculated:
SE (1) = XAXB ( - 22.166 + 49.002xB
- 33.980x~) J mol- I K- I. (27)
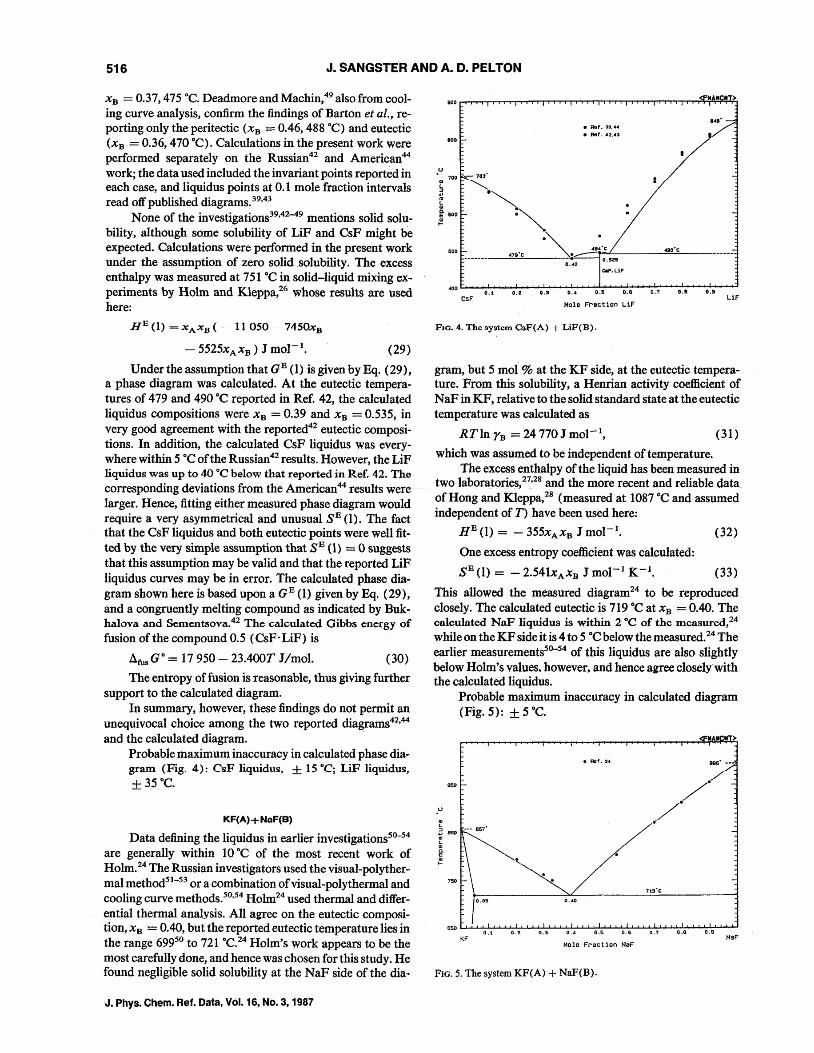
The calculated phase diagram based on Eqs. (26) and (27) reproduced the experimentaP9liquidus curves within 10°C, and the eutectic and peritectic points exactly. Although this is a good representation, its accuracy is possible only through the adoption of the very asymmetrical SE (1) expression, Eq. (27). If the diagram is calculated with SE (1) = o and withEq. (26) forHE (1), then the RbFliquidus is reproduced almost exactly (within 2 to 3 °C), but the LiF liquidus is up to 100°C lower than the reported. These results suggest that the experimental diagram may be in error, probably on the LiF side.
The calculated Gibbs energy of fusion of the compound 0.5(LiF·RbF) is
(28)
Probable maximum inaccuracy in calculated diagram (Fig. 3) : RbF liquidus, ± 20°C; LiF liquidus, ±40°C.
CsF(A) + LiF(B)
Tabulated data for this system are not available from the literature, although phase diagrams have been published, based on the work of Russian42,43 and American39,44 investigators. Bukhalova and Sementsova42 used a thermographic method, recording the differential heating and cooling curves. They report the compound LiF'CsF melting congruently at 494°C, with eutectics at XB = 0.40,479 °C and XB = 0.525, 490°C. Later work by Russian authors45-48 on ternary and higher systems limited by the LiF + CsF binary system confirm the presence of a congruently melting compound, and two eutectics (487-490 °C,474-479 °C). In contrast, Barton et al.44 from cooling curve and thermal gradient quenching experiments find an incongruently melting compound (peritectic at XB = 0.45, 495°C) and eutectic at
.u ., t.. :J .... III t.. .,
700
! 600
500
~"
475'C
• Ret. 39
793' -
\ \. /
470'C
0.56
400 L...o...o.~i..J-..J............J~..r......J. ......... ........t. ........... ........L .......... ......L-.......... ~'-'-'-.t....L... ......... ...J.....""""""": 0.1 0.2 0.3 0.4 0.5 0.6 0.7 O.B 0.9
LiF RbF Mole Fraction RbF
FIG. 3. The system LiF(A) + RbF(B).
J. Phys. Chern. Ref. Data, Vol. 16, No.3, 1987
516 J. SANGSTER AND A. D. PELTON
X B = 0.37,475 DC. Deadmore and Machin,49 also from cooling curve analysis, confirm the findings of Barton et al., reporting only the peritectic (xB = 0.46, 488 DC) and eutectic (xB = 0.36, 470 DC). Calculations in the present work were performed separately on the Russian42 and American44
work; the data used included the invariant points reported in each case, and liquidus points at 0.1 mole fraction intervals read off published diagrams. 39,43
None of the investigations39,42-49 mentions solid solubility, although some solubility of LiF and CsF might be expected. Calculations were performed in the present work under the assumption of zero solid solubility. The excess enthalpy was measured at 751°C in solid-liquid mixing experiments by Holm and Kleppa,26 whose results are used here:
HE (1) = XAXB ( 11 050 7450xB
- 5525xA XB) J mol-I. (29)
Under the assumption that GE (1) is given by Eq. (29), a phase diagram was calculated. At the eutectic temperatures of 479 and 490 DC reported in Ref. 42, the calculated liquidus compositions were XB = 0.39 and XB = 0.535, in very good agreement with the reported42 eutectic compositions. In addition, the calculated CsF liquidus was everywhere within 5 DC of the Russian42 results. However, the LiF liquidus was up to 40 DC below that reported in Ref. 42. The corresponding deviations from the American 44 results were larger. Hence, fitting either measured phase diagram would require a very asymmetrical and unusual SE (1). The fact that the CsF liquidus and both eutectic points were well fitted by the very simple assumption that SE (1) = 0 suggests that this assumption may be valid and that the reported LiF liquidus curves may be in error. The calculated phase diagram shown here is based upon a G E (1) given by Eq. (29), and a congruently melting compound as indicated by Bukhalova and Scmentsova.42 The calculated Gibbs energy of fusion of the compound 0.5 (CsF'LiF) is
Afus GD = 17950 - 23.400T J/mol. (30)
The entropy of fusion is reasonable, thus giving further support to the calculated diagram.
In summary, however, these findings do not permit an unequivocal choice among the two reported diagrams42.44
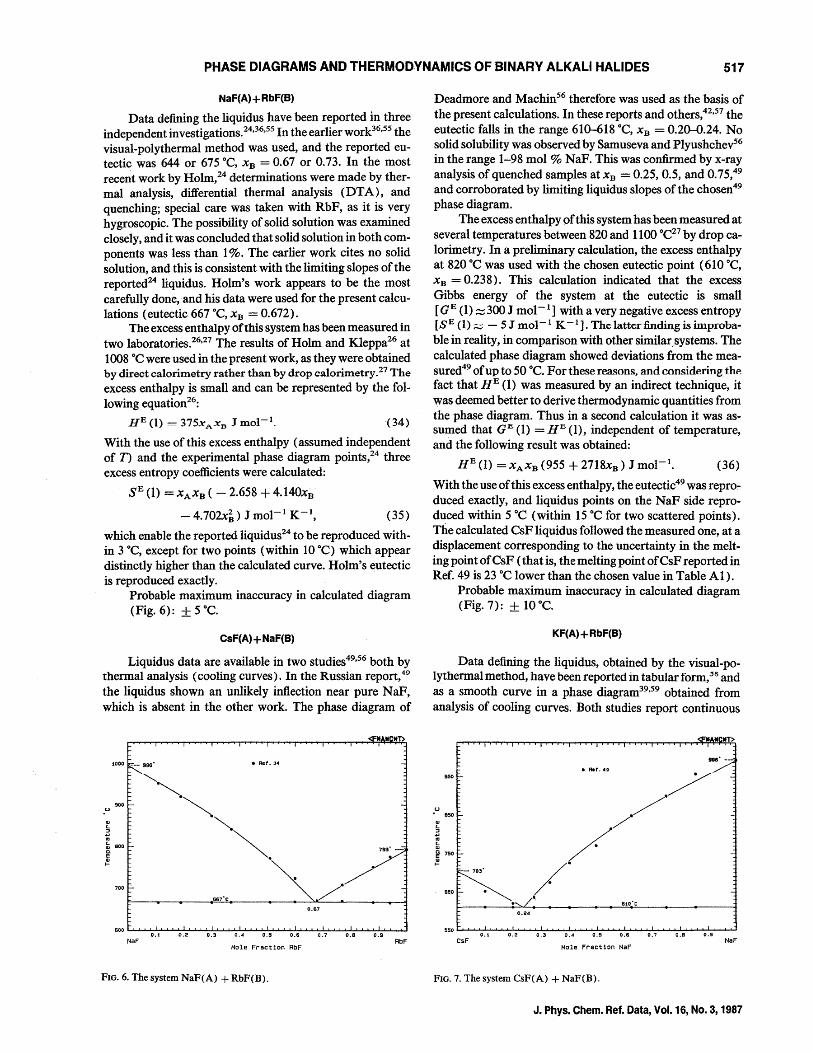
and the calculated diagram. Probable maximum inaccuracy in calculated phase diagram (Fig. 4): CsF liquidus, ± 15 DC; LiF liquidus, ± 35 DC.
KF(A) + NaF(B)
Data defining the liquidus in earlier investigations5O-
54
are generally within 10°C of the most recent work of Holm.24 The Russian investigators used the visual-polythermal method51-53 or a combination of visual-poly thermal and cooling curve methods.50.54 Holm24 used thermal and differential thermal analysis. All agree on the eutectic composition, X B = 0.40, but the reported eutectic temperature lies in the range 69950 to 721 °C.24 Holm's work appears to be the most carefully done, and hence was chosen for this study. He found negligible solid solubility at the NaF side of the dia-
J. Phys. Chem. Ref. Data, Vol. 16, No.3, 1987
8-48' • Ref. 39.U
• Ref. 42.43
/ 800
500 ~·c
0.525
0.1 0.8 0.11 CsF
O. S 0.2 0.3 0.4 0.$ 0.6 LiF
Mole Fraction L1F
FlO. 4. The system CaF(A) + LiF(B).
gram, but 5 mol % at the KF side, at the eutectic temperature. From this solubility, a Henrian activity coefficient of NaF in KF, relative to the solid standard state at the eutectic temperature was calculated as
RTlnYB = 24770Jmol- 1, (31)
which was assumed to be independent of temperature. The excess enthalpy of the liquid has been measured in
two laboratories,27.28 and the more recent and reliable data of Hong and Kleppa,28 (measured at 1087 °c and assumed independent of T) have been used here:
HE (1) = - 355xA XB J mol-I. (32)
One excess entropy coefficient was calculated:
SE (1) = - 2.541xAxB J mol- 1 K- I. (33)
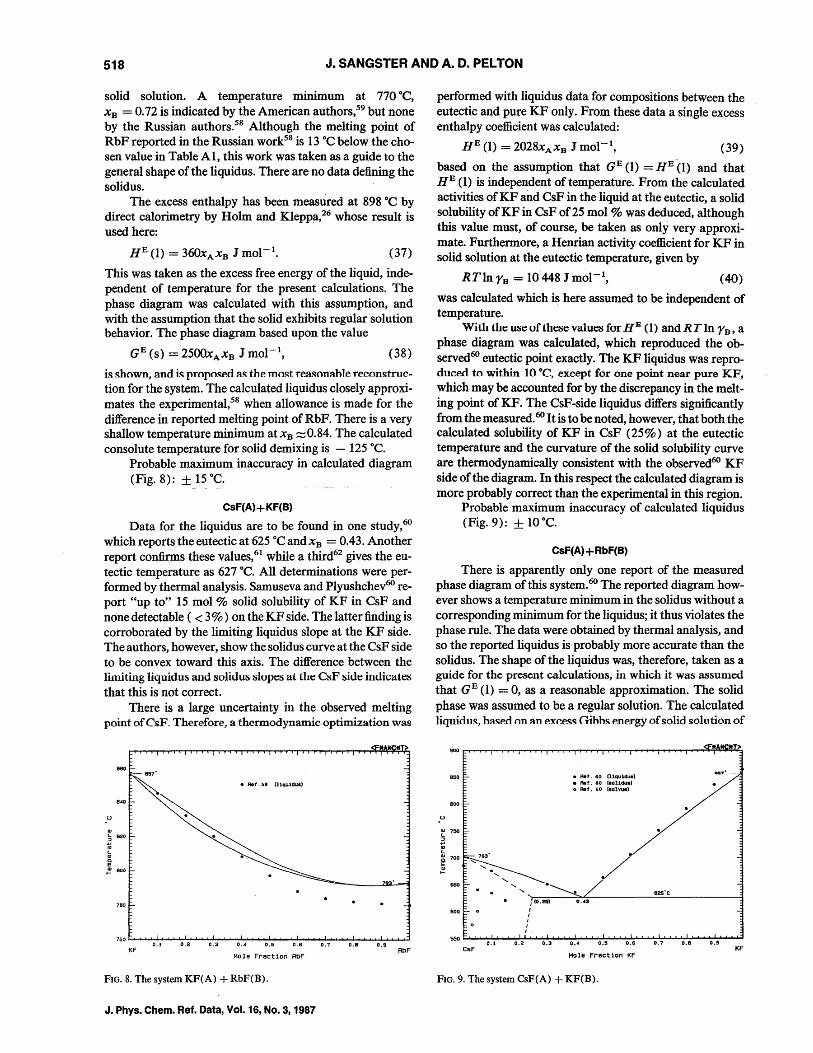
This allowed the measured diagram24 to be reproduced closely. The calculated eutectic is 719 DC at XB = 0.40. The calculated NaP liquidus is within 2 °C of the measured,24 while on the KF side it is 4 to 5 DC below the measured.24 The earlier measurements5
0-54 of this liquidus are also slightly
below Holm's values. however. and hence agree closely' with the calculated liquidUS.
Probable maximum inaccuracy in calculated diagram (Fig. 5): ± 5 DC.
.u
Cll
950
5 --- 857' I 850
~
0.05
If If >
996' --
719"C
0.40
650 W-I.~Q,Ut .....t...J...-':-"o.l.:oJ.a -'-'-':-lO,3::-'-1-.I....1:-'--'-'-I-IO:-L:.$:-'-I-'~:-'-..I....I-':-'::.L.J,..,J.'"':O..l:-.81.-J,..1.~'-'-'-........ KF NaF
Mole Fraction NsF
FIG. 5. The system KF(A) + NaF(B).
PHASE DIAGRAMS AND THERMODYNAMICS OF BINARY ALKALI HALIDES 517
NaF(A) + RbF(B)
Data defining the liquidus have been reported in three independent investigations.24,36,55 In the earlier work36,55 the visual-poly thermal method was used, and the reported eutectic was 644 or 675 DC, XB = 0.67 or 0.73. In the most rece~t work by Holm,24 determinations were made by thermal analysis, differential thermal analysis (DTA), and quenching; special care was taken with RbF, as it is very hygroscopic. The possibility of solid solution was examined closely, and it was concluded that solid solution in both components was less than 1 %. The earlier work cites no solid solution, and this is consistent with the limiting slopes of the reported24 liquidus. Holm's work appears to be the most carefully done, and his data were used for the present calculations (eutectic 667 DC, X B = 0.672).
The excess enthalpy of this system has been measured in two laboratories.26,27 The results of Holm and Kleppa26 at 1008 °C were used in the present work, as they were obtained by direct calorimetry rather than by drop calorimetry. 27 The excess enthalpy is small and can be represented by the following equation26:
HE (1) 375xA X B J mol-I. '(34)
With the use of this excess enthalpy (assumed independent of T) and the experimental phase diagram points,24 three excess entropy coefficients were calculated:
SE (1) = XAXB ( - 2.658 + 4. 140x:s
(35)
which enable the reported liquidus24 to be reproduced within 3°C, except for two points (within 10 DC) which appear distinctly higher than the calculated curve. Holm's eutectic is reproduced exactly.
Probable maximum inaccuracy in calculated diagram (Fig. 6): ± 5°C.
CsF(A)+ NaF(B)
Liquidus data are available in two studies49,56 both by thermal analysis (cooling curves). In the Russian report, 49
the liquidus shown an unlikely inflection near pure NaF, which is absent in the other work. The phase diagram of
900 .u
700 .
667'C
SOO ........... -'-';:-0.7'1 ........... "'::"'0 .'='"2 -'-'-~O. 3~""'0:-l-. 47"'-'-"'-':0:-1:. 5~~O...L... S ............... O.I....J. 7 '-'-'-.... O.uB ........... .....Jo ...... 9 ...............
NaF AbF Mole Fraction AbF
FIG. 6. The system NaF(A) + RbF(B).
Deadmore and Machin56 therefore was used as the basis of the present calculations. In these reports and others,42,57 the eutectic falls in the range 610-618 DC, X B = 0.20-0.24. No solid solubility was observed by Samuseva and Plyushchey56 in the range 1-98 mol % NaF. This was confirmed by x-ray analysis of quenched samples at X B = 0.25, 0.5, and 0.75,49 and corroborated by limiting liquidus slopes of the chosen49
phase diagram. The excess enthalpy of this system has been measured at
several temperatures between 820 and 1100 DC27 by drop calorimetry. In a preliminary calculation, the excess enthalpy at 820 DC was used with the chosen eutectic point (610 DC, XB = 0.238). This calculation indicated that the excess Gibbs energy of the system at the eutectic is small [GE (1) z300 J mol-I] with a very negative excess entropy [SE (1);;;;;; - 5 J mol- 1 K -1]. The latter finding is improbable in reality, in comparison with other similar,systems. The calculated phase diagram showed deviations from the measured49 of up to 50°C. For these reasons. and com:idering the fact that HE (1) was measured by an indirect technique, it was deemed better to derive thermodynamic quantities from the phase diagram. Thus in a second calculation it was assumed that G B (1) = HB (1), independent of temperature, and the following result was obtained:
HE (1) = XAXB (955 + 2718xB ) J mol-I. (36)
With the use of this excess enthalpy, the eutectic49 was repro:duced exactly, and liquidus points on the NaF side reproduced within 5°C (within 15 DC for two scattered points). The calculated CsF liquidus followed the measured one, at a displacement corresponding to the uncertainty in the melting point of CsF (that is, the melting point of CsF reported in Ref. 49 is 23°C lower than the chosen value in Table AI).
Probable maximum inaccuracy in calculated diagram (Fig. 7): ± 10°C.
KF(A) + RbF(B)
Data defining the liquidus, obtained by the visual-polythermal methOd, have been reported in tabular form,"~ and as a smooth curve in a phase diagram39,59 obtained from analysis of cooling curves. Both studies report continuous
III t.
~ ! 750
SliO
* * *T>
9118' --
0.24
550 ......... -'-';:-0.7'1 ......... "':"0.'"='"2 .......... ':-'0.-:"'-3 ............ ':-l-O.4 ............... 0:-1:.S::'-'-' ...... o.J.....S ................... O.J...o.7'-'-'-.... OL...S ......... ...Jo.l..o.s...........:J
CsF NaF Mole Fraction NaF
FIG. 7. The system CsF(A) + NaF(B).
J. Phys. Chern. Ref. Data, Vol. 16, No.3, 1987
518 J. SANGSTER AND A .. D. PELTON
solid solution. A temperature minimum at 770 °c, XB = 0.72 is indicated by the American authors,59 but none by the Russian authors. 58 Although the melting point of RbF reported in the Russian work58 is 13 °C below the chosen value in Table AI, this work was taken as a guide to the general shape of the liquidUS. There are no data defining the solidus.
The excess enthalpy has been measnred at 898°C by direct calorimetry by Holm and Kleppa,26 whose result is used here:
(37)
This was taken as the excess free energy of the liquid, independent of temperature for the present calculations. The phase diagram was calculated with this assumption, and with the assumption that the solid exhibits regular solution behavior. The phase diagram based upon the value
GE (s) = 2500XAXB J mol-I, (38)
i~ ~hown. and i~ proposed as the mo~t rf"Jl~onahle reconstnlction for the system. The calculated liquidus closely approximates the experimental,58 when allowance is made for the difference in reported melting point of RbF. There is a very shallow temperature minimum at XB :::::;0.84. The calculated consolute temperature for solid demixing is - 125 °C.
Probable maximum inaccuracy in calculated diagram (Fig. 8): ± 15 °C.
CsF(A) + KF(8)
Data for the liquidus are to be found in one study, 60 which reports the eutectic at 625 °C and XB = 0.43. Another report confirms these values,61 while a third62 gives the eutectic temperature as 627°C. All determinations were performed by thermal analysis. Samuseva and Plyushchev60 report "up to" 15 mol % solid solubility of KF in CsF and none detectable ( < 3 % ) on the KF side. The latter finding is corroborated by the limiting liquidus slope at the KF side. The authors, however, show the solidus curve at the CsF side to be convex toward this axis. The difference between the limiting liquidus and solidus slopes at the CsF side indicates that this is not correct.
There is a large uncertainty in the observed melting point of Cs.F. Therefore, a thermodynamic optimization was
It M
• Ret. 58 Il1qulduo)
II> t. 820
t E ::. 800
780
750 t:.....~O~.l ......... "":O"':. 2 ......... "":0"':. 3 ............... 0..L... 4 ............... 0..L...S ............... o..L... s .............. o..L... , ............... o..L... s .............. o..L... s ........... ...,.j KF RbF
Mole Fraction RbF
FIG. 8. The system KF(A) + RbF(B).
J. Phys. Chem. Ref. Data, Vol. 16, No.3, 1987
performed with liquidus data for compositions between the eutectic and pure KF only. From these data a single excess enthalpy coefficient was calculated:
HE (1) = 2028xA X B J mol-I, (39)
based on the assumption that GE (1) = HE (1) and that HE (1) is independent of temperature. From the calculated activities of KF and CsF in the liquid at the eutectic, a solid solubility of KF in CsF of 25 mol % was deduced, although this value must, of course, be taken as only veryapproximate. Furthermore, a Henrian activity coefficient for KF in solid solution at the eutectic temperature, given by
RTlnYB = 10448 Jmol- 1, (40)
was calculated which is here assumed to be independent of temperature.
With the useufthese values for HE (1) andRTln rB' a phase diagram was calculated, which reproduced the observed60 eutectic point exactly. The KF liquidus was reproduced to within 10°C, except for one point near pure KF, which may be accounted for by the discrepancy in the melting point of KF. The CsF-side liquidus differs significantly from the measured.60 It is to be noted, however, that both the calculated solubility of KF in CsF (25%) at the eutectic temperature and the curvature of the solid solubility curve are thermodynamically consistent with the observed60 KF side of the diagram. In this respect the calculated diagram is more probably correct than the experimental in this region.
Probable maximum inaccuracy of calculated liquidus (Fig. 9): ± 10°C.
CsF(A)+ RbF(8)
There is apparently only one report of the measured phase diagram of this system.60 The reported diagram however shows a temperature minimum in the solidus without a corresponding minimum for the liquidus; it thus violates the phase rule. The data were obtained by thermal analysis, and so the reported liquidus is probably more accurate than the solidus. The shape of the liquidus was, therefore, taken as a guide for the present calculations, in which it was assumed that G E (I) = 0, as a reasonable approximation. The solid phase was assumed to be a regular solution. The calculated Hqnidus, has:erl on an excess Gibbs energy of solid s.olution of
..... .....
650 ...... ......
600
110.1!!51
I I I I I
• Rat. 60 111qu 1duo) • Ret. 60 10011duol o Ret. 60 (oolvuol
./ 0.43
857" ---
B25'c
~O~~O~.1~~O.~2~~O.~3~~0.~4~~O.~S~~0.~S~~0.~'~~O.~B~~O.~9~~ CsF I<F
Hole Fraction KF
FIG. 9. The system CsF(A) + KF(B).
PHASE DIAGRAMS AND THERMODYNAMICS OF BINARY ALKALI HALIDES 519
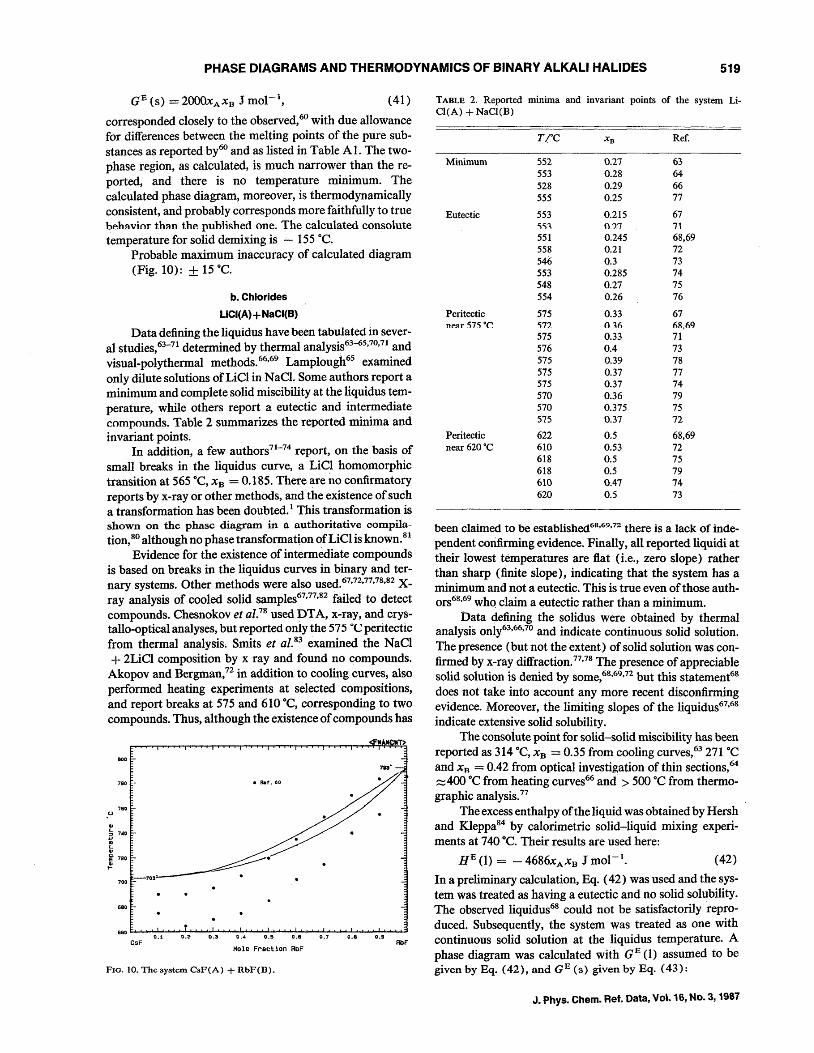
(41)
corresponded closely to the observed,6O with due allowance for differences between the melting points of the pure substances as reported by60 and as listed in Table AI. The twophase region, as calculated, is much narrower than the reported, and there is no temperature minimum. The calculated phase diagram, moreover, is thermodynamically consistent, and probably corresponds more faithfully to true behavior than the published one. The calculated consolute temperature for solid demixing is ~ 155°C.
Probable maximum inaccuracy of calculated diagram (Fig. 10): ± 15°C.
b. Chlorides
LiCI(A) + NaCI(B)
Data defining the liquidus have been tabulated in several studies,63-71 determined by thermal analysis63-65,70,71 and visual-polythermal methods.66,69 Lamplough65 examined only dilute solutions of LiCl in NaCl. Some authors report a minimum and complete solid miscibility at the liquidus temperature, while others report a eutectic and intermediate compounds. Table 2 summarizes the reported minima and invariant points.
In addition, a few authors 71-74 report, on the basis of small breaks in the liquidus curve, a LiC~ homomorphic transition at 565°C, XB = 0.185. There are no confirmatory reports by x-ray or other methods, and the existence of such a transformation has been doubted. I This transformation is shown on the phase diagram in a authoritative compilation,80 although no phase transformation of LiCI is known. 8
I
Evidence for the existence of intermediate compounds is based on breaks in the liquidus curves in binary and ternary systems. Other methods were also used.67,72,77,78,82 xray analysis of cooled solid samples67,77,82 failed to detect compounds. Chesnokov et al.78 used DTA, x-ray, and crystallo-optical analyses, but reported only the 575 "C peritectiC from thermal analysis. Smits et al. 83 examined the NaCI + 2LiCI composition by x ray and found no compounds. Akopov and Bergman,72 in addition to cooling curves, also performed heating experiments at selected compositions, and report breaks at 575 and 610°C, corresponding to two compounds. Thus, although the existence of compounds has
.u
QI
17~O
! 720
CsF
• Ret. eo
~.
0.4 0.5 O.B 0.7
Mole Fraction RbF
FlO. 10. The system CsF(A) + RbF(B).
.H.lfT>
783·
0.9 RbF
TABLE 2. Reported minima and invariant points of the system Li-Cl(A) + NaCl(B)
TIC XB Ref.
Minimum 552 0.27 63 553 0.28 64 528 0.29 66 555 0.25 77
Eutectic 553 0.215 67 55." O?7 71
551 0.245 68,69 558 0.21 72 546 0.3 73 553 0.285 74 548 0.27 75 554 0.26 76
Peritectic 575 0.33 67 neo.ar 575°C 572 0.36 n&,69
575 0.33 71 576 0.4 73 575 0.39 78 575 0.37 77 575 0.37 74 570 0.36 79 570 0.375 75 575 0.37 72
Peritectic 622 0.5 68,69 near 620°C 610 0.53 72
618 0.5 75 618 0.5 79 610 0.47 74 620 0.5 73
been claimed to be established68,69,72 there is a lack ofinde
pendent confirming evidence. Finally) all reported liquidi at their lowest temperatures are flat (i.e., zero slope) rather than sharp (finite slope), indicating that the system has a minimum and not a eutectic. This is true even of those authors68,69 who claim a eutectic rather than a minimum.
Data defining the solidus were obtained by thermal analysis only63,66,7o and indicate continuous solid solution. The presence (but not the extent) of solid solution was confirmed by x-ray diffraction.77,78 The presence of appreciable solid solution is denied by some,68,69,n but this statement68
does not take intd account any more recent disconfirming evidence. Moreover, the limiting slopes of the liquidus67.68
indicate extensive solid solubility. The consoiute point for solid-solid miscibility has been
reported as 314°C, XB = 0.35 from cooling curves,63 271°C and XR = 0.42 from optical investigation of thin sections, 64
~ 400 °C from heating curves66 and > 500 °C from thermographic analysis. 77
The excess enthalpy ofthe liquid was obtained by Hersh and KJeppa84 by calorimetric solid-liquid mixing experiments at 740 °C. Their results are used here:
HE (I) = - 4686xA XB J mol-I. (42)
In a preliminary calculation, Eq. (42) was used and the system was treated as having a eutectic and Iio solid solubility. The observed liquidus68 could not be satisfactorily reproduced. Subsequently, the system was treated as one with continuous solid solution at the liquidus temperature. A phase diagram was calculated with G E (1) assumed to be given by Eq. (42), and G E (s) given by Eq. (43):
J. Phys. Chem. Ref. Data, Vo," 16, No.3, 1987
520 J. SANGSTER AND A~ D. PELTON
GB (s) = XBXA (9800 - 5200xB) J mol- 1 (43)
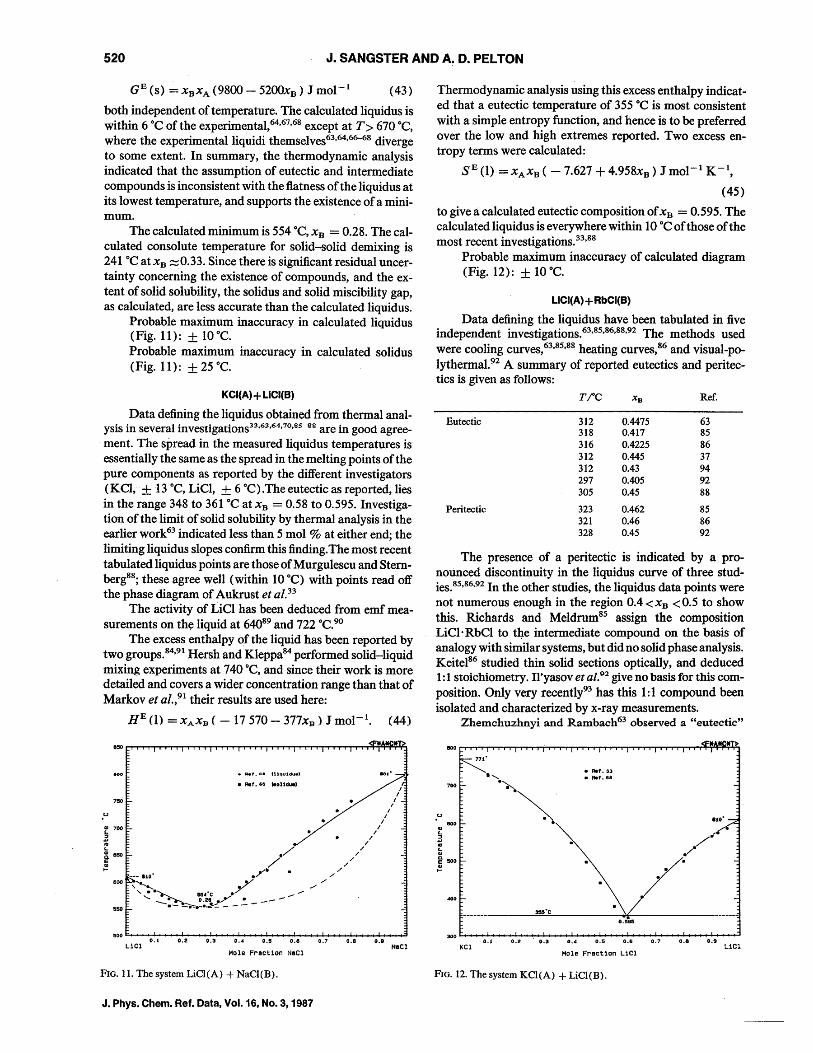
both independent of temperature. The calculated liquidus is within 6°C of the experimental,64,67,68 except at T> 670°C, where the experimentalliquidi themselves63,64,66-68 diverge to some extent. In summary, the thermodynamic analysis indicated that the assumption of eutectic and intermediate compounds is inconsistent with the flatness of the liquidus at its lowest temperature, and supports the existence of a minimum.
The calculated minimum is 554°C, XB = 0.28. The calculated consolute temperature for solid-solid demixing is 241°C atxB ~0.33. Since there is significant residual uncertainty concerning the existence of compounds, and the extent of solid solubility, the solidus and solid miscibility gap, as calculated, are less accurate than the calculated liquidUS.
Probable maximum inaccuracy in calculated liquidus (Fig. 11): ± 10°C. Probable maximum inaccuracy in calculated solidus (Fig. 11): ± 25°C.
KCI(A)+LICI(B)
Data defining the liquidus obtained from thermal analysis in several investigations33,6l,64,7o,Bs gg are in good agree-ment. The spread in the measured liquidus temperatures is essentially the same as the spread in the melting points of the pure components as reported by the different investigators (KCI,± 13°C, LiCI, ± 6 °C).The eutectic as reported, lies in the range 348 to 361°C at XB = 0.58 to 0.595. Investigation of the limit of solid solubility by thermal analysis in the earlier work63 indicated less than 5 mol % at either end' the limiting liquidus slopes confirm this finding. The most re~ent tabulated liquidus points are those ofMurgulescu and Sternberg88; these agree well (within 10°C) with points read off the phase diagram of Aukrust et al.33
The activity of LiCI has been deduced from emf measurements on the liquid at 64089 and 722°C. 90
The excess enthalpy of the liquid has been reported by two groupS.84,91 Hersh and Kleppa84 performed solid-liquid mixing experiments at 740°C. and since their work is more detailed and covers a wider concentration range than that of Markov et al.,91 their results are used here:
HE (I) = XAXB ( - 17570 - 377xB ) J mol-I, (44)
• ~f. ce iU.t!luldU.)
750
./ ,I
/ ./ ./A //
eoo ,'........ _ y ./ /' " .~ 5e4·C.Y ....-
....... ___ ~~ 0.28 .,,"'" • __ ..-"--.- -P.~.~ - - - -550
/ /
/
It It >
I /
I
I I
I I
I
500~~O~.j--~0~.2--~O~.3--~O~.4--~0~.5--~O~.8--~0~.7--~0~.a---o~.I--~ Liel NaCl
Mole Fraction NaCl
FIG. 11. The system LiCl(A) + NaCl(B).
J. Phys. Chem. Ref. Data, Vol. 16, No.3, 1987
Thermodynamic analysis using this excess enthalpy indicated that a eutectic temperature of 355°C is most consistent with a simple entropy function, and hence is to be preferred over the low and high extremes reported. Two excess entropy terms were calculated:
SB (1) =XAXB ( -7.627 + 4.958xB ) J mol-1 K- 1,
(45)
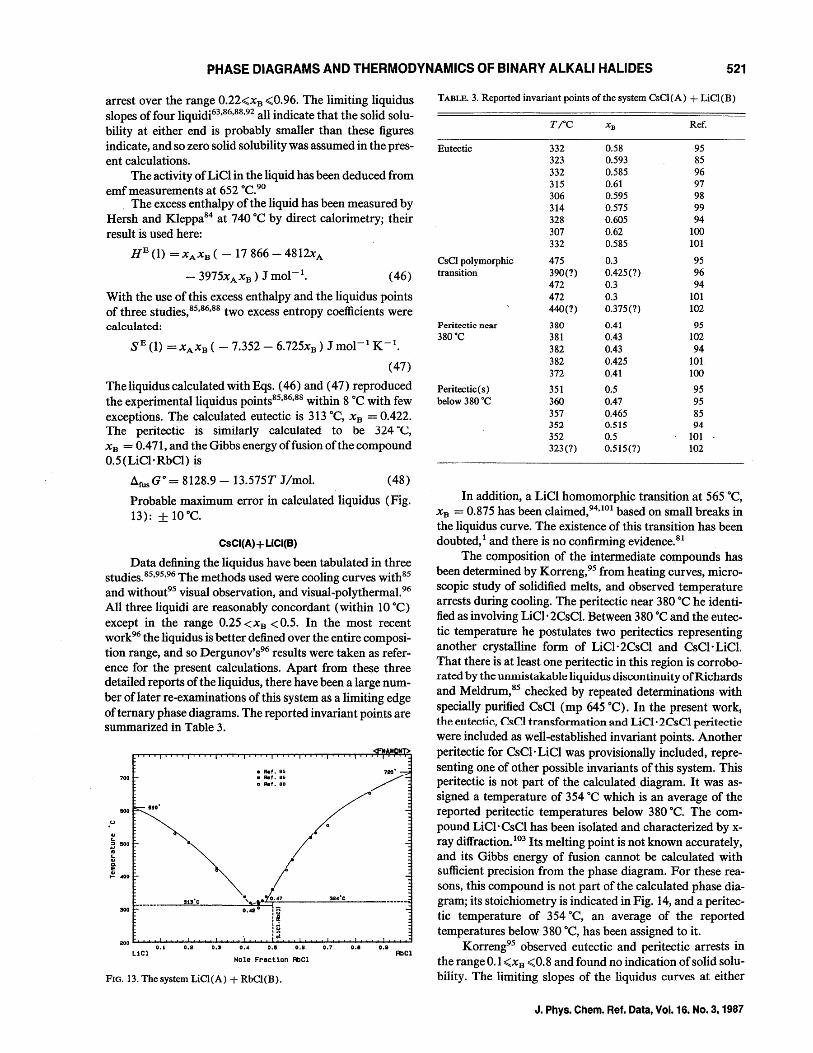
to give a: calculated eutectic composition of XB = 0.595. The calculated liquidus is everywhere within 10°C of those of the most recent investigations. 33,88
Probable maximum inaccuracy of calculated diagram (Fig. 12): ± 10°C.
LiCI(A) + RbCI(B)
Data defining the liquidus have been tabulated in five independent investigations.63,85,86,88,92 The methods used were cooling curves,63,85,88 heating curves,86 and visual-polythermal. 92 A summary of reported eutectics and peritectics is given as follows:
T;oC XB Ref.
Eutectic 312 0.4475 63 318 0.417 85 316 0.4225 86 312 0.445 37 312 0.43 94 297 0.405 92 305 0.45 88
Peritectic 323 0.462 85 321 0.46 86 328 0.45 92
The presence of a peritectic is indicated by a pronounced discontinuity in the liquidus curve of three stud-. 85 86 92 I th th t d" . h I" "d d . les. " n e 0 er s u les, t e IqUl us ata pomts were not numerous enough in the region 0.4<XB <0.5 to show this. Richards and Meldrum85 assign the composition LiCI' RbCI to the intermediate compound on the basis of analogy with similar systems, but did no solid phase analysis. Keitel86 studied thin solid sections optically, and deduced 1: 1 stoichiometry. Il'yasov et al.92 give no basis for this composition. Only very recently93 has this 1:1 compound been isolated and characterized by x-ray measurements.
II L
~ ! soo
300
Zhemchuzhnyi and Rambach63 observed a "eutectic"
• AIIf.33 • AIIf.88
955'C
o.!I~
0.1 0.2 0.3 o.~ 0.5 0.6 0.7 KCl LiCl
Mole Fraction LiCl
FIG. 12. The system KCI(A) + LiCI(B).
PHASE DIAGRAMS AND THERMODYNAMICS OF BINARY ALKALI HALIDES 521
atrest over the range 0.22<XB <0.96. The limiting liquidus slopes of four liquidi63.86,88.92 all indicate that the solid solubility at either end is probably smaller than these figures indicate, and so zero solid solubility was assumed in the present calculations.
The activity ofLiCI in the liquid has been deduced from emf measurements at 652 °C.90
The excess enthalpy of the liquid has been measured by Hersh and Kleppa84 at 740 °C by direct calorimetry; their result is used here:
HE (I) = XAXB ( - 17 866 - 4812xA
(46)
With the use of this excess enthalpy and the liquidus points of three studies,85,86,88 two excess entropy coefficients were calculated:
SE (1) = XAXB ( - 7.352 - 6.725xB) J mol- 1 K- 1•
(47)
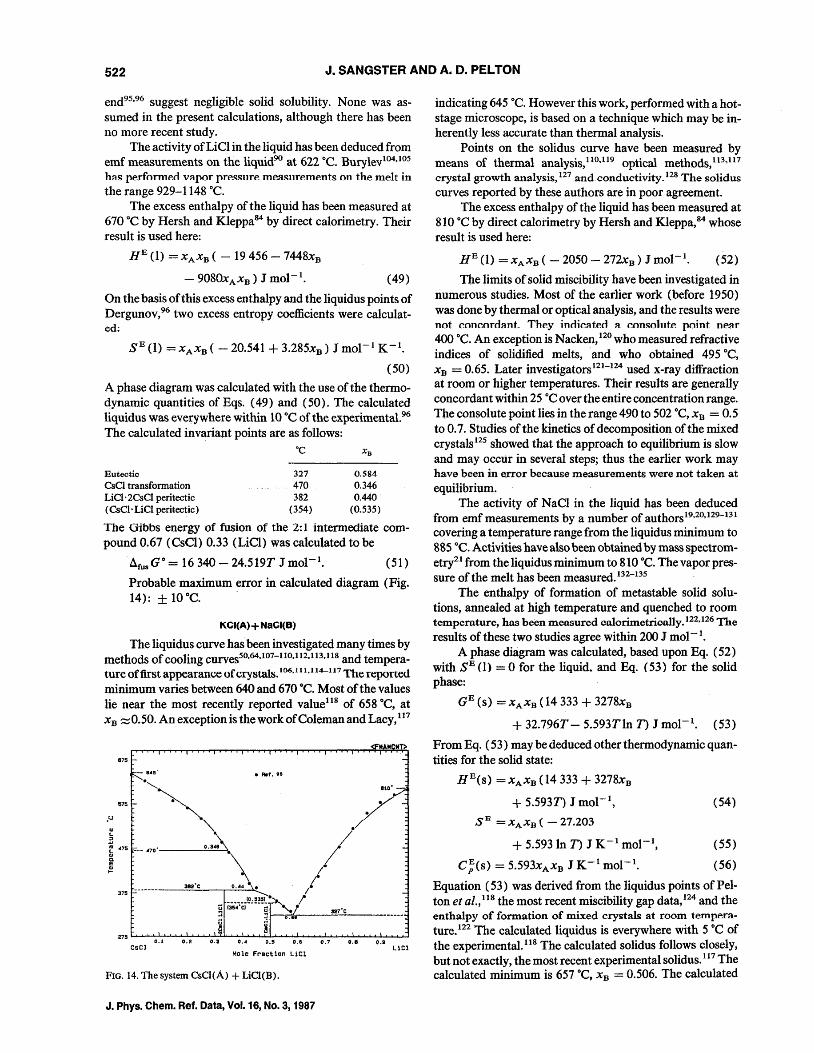
The liquidus calculated with Eqs. (46) and ( 47) reproduced the experimental liquidus points85,86.88 within 8 °C with few exceptions. The calculated eutectic is 313 °C, XB = 0.422. The peritectic is similarly calculated to be 324 "C, XB = 0.471, and the Gibbs energy offusion of the compound 0.5 (LiCI' RbCI) is
AfusG o = 8128.9 - 13.575T J/mol. (48)
Probable maximum error in calculated liquidus (Fig. 13): ± 10°C.
CsCI(A)+ UCI(8)
Data defining the liquidus have been tabulated in three studies.85,95,96 The methods used were cooling curves with85
and without95 visual observation, and visual-poly thermal. 96 All three liquidi are reasonably concordant (within 10°C) except in the range 0.25 <xB < 0.5. In the most recent work96 the liquidus is better defined over the entire composition range, and so Dergunov's96 results were taken as reference for the present calculations. Apart from these three detailed reports of the liquidus, there have been a large number of later re-examinations of this system as a limiting edge oftemary phase diagrams. The reported invariant points are summarized in Table 3.
III t.
700
800
i 500
~ ....... 00
uel
• Ret. 85 • Ret. 86 o Ret. 88
Mole Fraction AbCl
FIG. 13. The system LiCI(A) + RbCI(B).
0.8 0.11 RbCl
TABLE. 3. Reported invariant points of the system CsCl(A) + LiQ(B)
Eutectic
CsC) polymorphic transition
Peritectic near 380°C
Peritectic (s ) below 380°C
TiC
332 323 332 315 306 314 328 307 332
475 390(?) 472 472 440(?)
380 381 382 382 372
351 360 357 352 352 323(?)
X B Ref.
0.58 95 0.593 85 0.585 96 0.61 97 0.595 98 0.575 99 0.605 94 0.62 100 0.585 101
0.3 95 0.425(?) 96 0.3 94 0.3 101 0.375(?) 102
0.41 95 0.43 102 0.43 94 0.425 101 0.41 100
0.5 95 0.47 95 0.465 85 0.515 94 0.5 101 0.515(?) 102
In addition, a LiCI homomorphic transition at· 565°C, XB = 0.875 has been claimed,94.IOl based on small breaks in the liquidus curve. The existence of this transition has been doubted,1 and there is no confirming evidence.81
The composition of the intermediate compounds has been determined by Korreng,95 from heating curves, microscopic study of solidified melts, and observed temperature arrests during cooling. The peritectic near 380 °C he identified as involving LiCI· 2CsCI. Between 380 °C and the eutectic temperature he postulates two peritectics representing another crystalline form of LiCl· 2CsCI and CsCl· LiCl. That there is at least one peritectic in this region is corroborated by the unmistakable liquidu:s discuntinuity of Richards and Meldrum,85 checked by repeated determinations· with specially purified esCI (mp 645°C). In the present work, the eutectic, esC} transformation and Liel· 2esel peritectic
were included as well-established invariant points. Another peritectic for CsCl· Liel was provisionally included, representing one of other possible invariants of this system. This peritectic is not part of the calculated diagram. It was assigned a temperature of 354°C which is an average of the reported peritectic temperatures below 380 °C. The compound LiCI·esCI has been isolated and characterized by xray diffraction. 103 Its melting point is not known accurately, and its Gibbs energy of fusion cannot be calculated with sufficient precision from the phase diagram. For these reasons, this compound is not part of the calculated phase diagram; its stoichiometry is indicated in Fig. 14, and a peritectic temperature of 354°C, an average of the reported temperatures below 380 °C, has been assigned to it.
Korreng95 observed eutectic and peritectic arrests in the range 0.1 <xB <0.8 and found no indication of solid solubility. The limiting slopes of the liquidus curves at either
J. Phys. Chern. Ref. Data, Vol. 16. No.3, 1987
522 J. SANGSTER AND A. D. PELTON
end95.96 suggest negligible solid solubility. None was assumed in the present calculations, although there has been no more recent study.
The activity of LiCI in the liquid has been deduced from emf measurements on the liquid90 at 622°C. Burylev104,105 h::ts performerl v::tpor pressure mea~nrements on the melt in the range 929-1148 °C.
The excess enthalpy of the liquid has been measured at 670°C by Hersh and Kleppa84 by direct calorimetry. Their result is used here:
HE (1) = XAXB ( - 19456 - 7448xB
(49)
On the basis of this excess enthalpy and the liquidus points of Dergunov,96 two excess entropy coefficients were calculat-ed: '
SE (1) = XAXB ( - 20.541 + 3.285xB ) J mol-1 K- 1•
(50)
A phase diagram was calculated with the use of the thermodynamic quantities of Eqs. (49) and (50). The calculated liquidus was everywhere within 10°C of the experimenta1.96
The calculated invariant points are as follows: ·C X B
Eutectic 327 0.584 CsCl transformation 470 0.346 LiCl'2CsCl peritectic 382 0.440 ' (CsCl'LiQperitectic) (354) (0.535)
The Gibbs energy of fusion of the 2: 1 intermediate compound 0.67 (CsC}) 0.33 (LiCl) was calculated to be
£lfu! GO = 16340 - 24.519T J mol-I. (51)
Probable maximum error in calculated diagram (Fig. 14): ± 10°C.
KCI(A) + NaCI(B)
The liquidus curve has been investigated many times by methods of cooling curves50,64.107-110.112,1l3,1l8 and tempera-ture offirst appearance of crystals. 106.1 11.
114-117 The reported
minimum varies between 640 and 670°C. Most of the values lie near the most recently reported value118 of 658°C, at XB :::; 0.50. An exception is the work of Coleman and Lacy, 117
.. III If
875
0.2 0.3 0.4 O.!! 0.& 0.7 0.8 0.11 csel Liel
Mole Fraction Liel
FIG. 14. The system CsCl(A) + LiCl(B).
J. Phys. Chern. Ref. Data, Vol. 16, No.3, 1987
indicating 645°C. However this work, performed with a hotstage microscope, is based on a technique which may be inherently less accurate than thermal analysis.
Points on the solidus curve have been measured by means of thermal analysis,110,119 optical methods, 113.117
crystal growth analysis, 127 and,conductivity.128 The solidus curves reported by these authors are in poor agreement.
The excess enthalpy of the liquid has been measured at 810°C by direct calorimetry by Hersh and Kleppa,84 whose result is used here:
(52)
The limits of solid miscibility have been investigated in numerous studies. Most of the earlier work (before 1950) was done by thermal or optical analysis, and the results were not concordant. They indicated a conso1ute point near 400 °e. An exception is Nacken, 120 who measured refractive indices of solidified melts, 'and who obtained 495°C, XB = 0.65. Later investigators121-124 used x-ray diffraction at room or higher temperatures. Their results are generally concordant within 25 °C over the entire concentration range. The consolute point lies in the range 490 to 502 °C, XB = 0.5 to 0.7. Studies of the kinetics of decomposition of the mixed crystals125 showed that the approach to equilibrium is slow and may occur in several steps; thus the earlier work may have been in e,rror because measurements were not taken at equilibrium.
The activity of NaCI in the liquid has been deduced from emf measurements by a number of authors 19.20, 129-131 covering a temperature range from the liquidus minimum to 885 °C. Activities have also been obtained by mass spectrometry21 from the liquidus minimum to 810 °C. The vapor pressure of the melt has been measured. 132-135
The enthalpy of formation of metastable solid solutions, annealed at high temperature and quenched to room temperature, hns been measured olllorimetrioally.122.126 The results of these two studies agree within 200 J mol-I,
A phase diagram was calculated, based upon Eq. (52) with SE (1) = 0 for the liquid. and Eq. (53) for the solid phase:
GE (s) = XAXB (14333 + 3278xB
+ 32.796T - 5.593Tln T) J mol-I. (53)
From Eq. (53) may be deduced other thermodynamic quantities for the solid state:
HE(S) = XAXB (14 333 + 3278xB
+ 5.593T) J mol-I, (54)
SFl = XAXB ( 27.203
+ 5.593 In T) J K-1 mol-I, (55)
C;(s) = 5.593xAXB J K- 1 mol-I. (56)
Equation (53) was derived from the liquidus points of Pelton et 01.,118 the most recent miscibility gap data,124 and the enthalpy of formation of mixed crystals at room temperature.122 The calculated liquidus is everywhere with 5 °e of the experimental. 118 The calculated solidus follows closely, but not exactly, the most recent experimental solidus. Il7 The calculated minimum is 657°C, xB = 0.506. The calculated
PHASE DIAGRAMS AND THERM0I:?YNAMICS OF BINARY ALKALI HALIDES 523
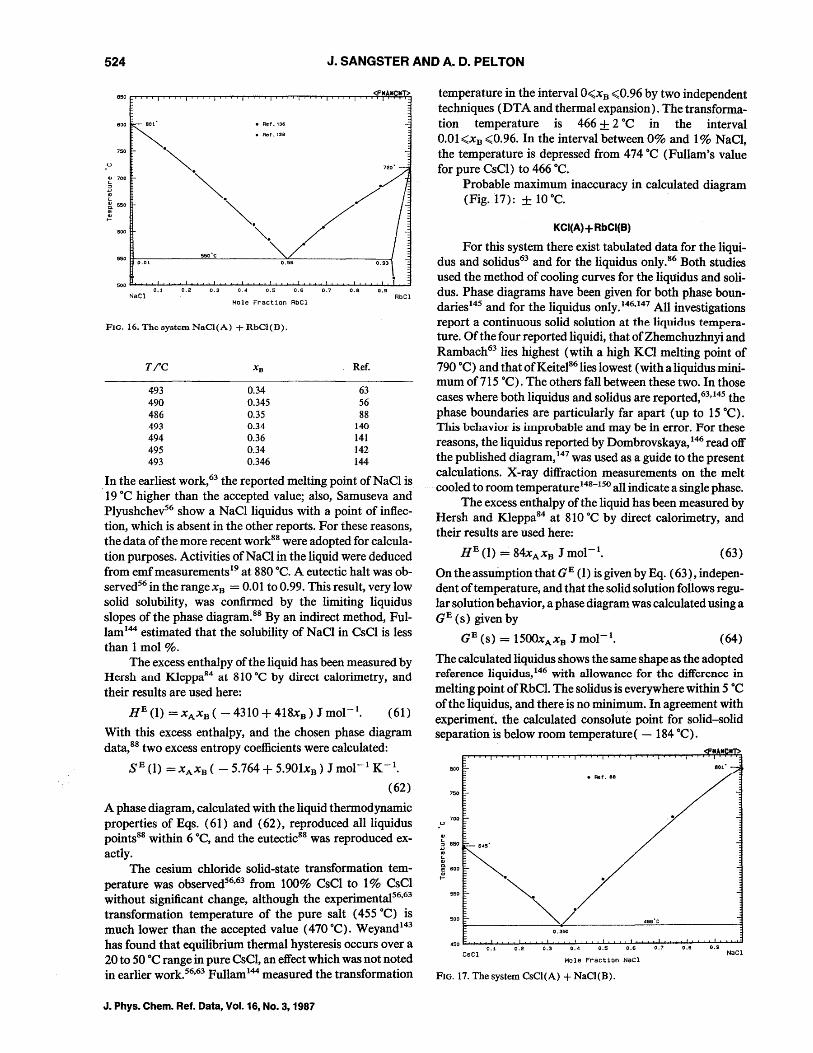
consolute point is 500 °C, XB ::::;0.58, and the envelope is within 30°C of the experimental. 124 Equation (54) reproduces the experimental heats offormation at 25 °C122 within 235 J mol-I.
Probable maximum inaccuracy in calculated liquidus [Fig. 15(a)]: ± 5°C. Probable maximum inaccuracy in calculated solidus [Fig. 15(a)]: ± 15°C. Probable maximum inaccuracy in calculated consolute temperature (Fig. I5b): ± 20°C.
NaCI(A) + RbCI(B)
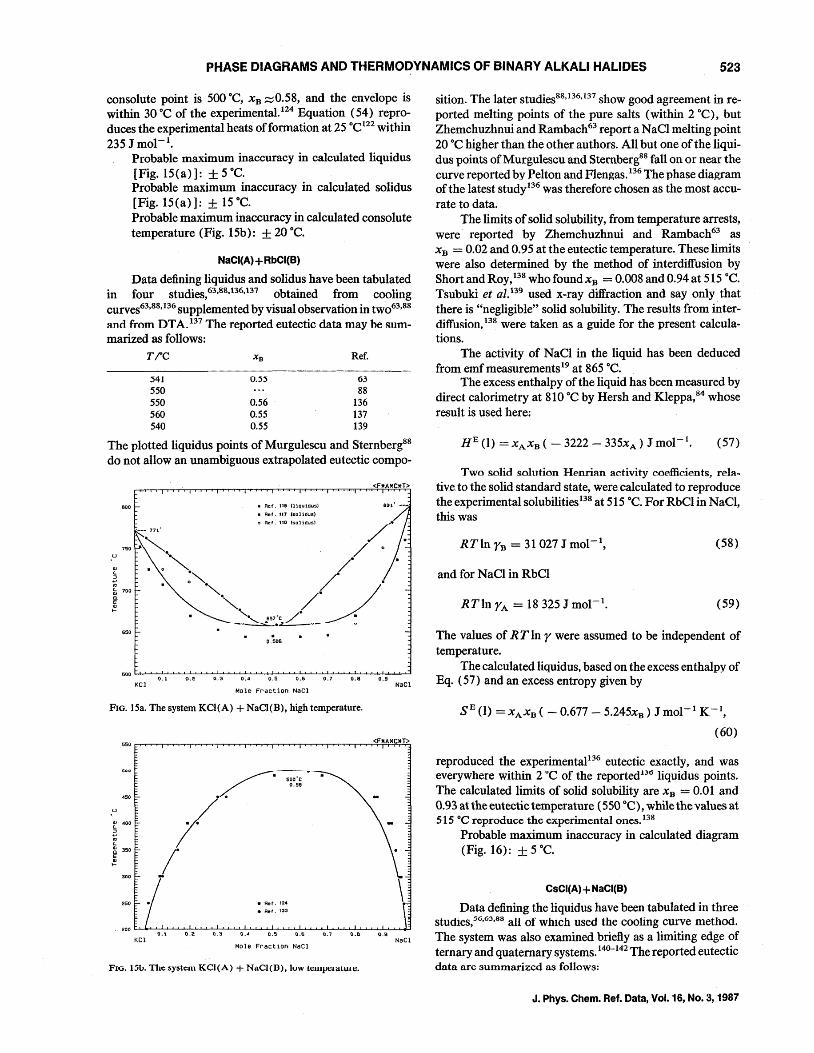
Data defining liquidus and solidus have been tabulated in four studies,63,88,136,137 obtained from cooling curves63,88.136 supplemented by visual observation in tw063.88
and from DT A. 137 The reported eutectic data may he ~ummarizedas follows:
T('C XB Ref.
:>41 550 550 560 540
0.:5:5
0.56 0.55 0.55
63 88
136 137 139
The plotted liquidus points of Murgulescu and Sternberg88
do not allow an unambiguous extrapolated eutectic compo-
800
650
KCl
• Ref. 118 (liquidus)
• Ref. 117 (solidus)
. 0.506
0.5
Mole Fraction NaCl
FIG. 15a. The system KCl(A) + NaCl(B), high temperature.
450
~ 400
~ c.. ~ 350
~
250
KCl
. / soo'c 0.58
/ /'
• Ref. 124
• Ref. 123
0.1 0.2 0.5
Mole Fraction NaCl
0.7 0.8
FlO. I5b. The system KCl(A) + NaCl(D), low tCll1jJt:Iatuu;.
80t' --
NaCl
NaCl
sition. The later studies88,136,137 show good agreement in reported melting points of the pure salts (within 2°C), but Zhemchuzhnui and Rambach63 report a NaCI melting point 20°C higher than the other authors. All but one of the liquidus points of Murgulescu and Sternberg88 fall on or near the curve reported by Pelton and Flengas. 136 The phase diagram of the latest study136 was therefore chosen as the most accurate to data.
The limits of solid solubility, from temperature arrests, were reported by Zhemchuzhnui and Rambach63 as XB = 0.02 and 0.95 at the eutectic temperature. These limits were also detennined by the method of interdiffusion by Short and Roy,138 who foundxB = 0.008 and 0.94 at 515°C. Tsubuki et al.139 used x-ray diffraction and say only that there is "negligible" solid solubility. The results from mterdiffusion.138 were taken as a guide for the present calculations.
The activity of N aCI in the liquid has been deduced from emf measurements 19 at 865°C.
The excess enthalpy of the liquid has been measured by direct calorimetry at 810°C by Hersh and Kleppa,84 whose result is used here:
(57)
Two solid solution Henrian activity coefficients, relative to the solid standard state, were calculated to reproduce the experimental solubilities 138 at 515°C. For RbCI in NaCI, this was
RTln rn = 31027 J mol-I, (58)
and for NaCI in RbCl
RTln rA = 18325 J mol-I. (59)
The values of RT In r were assumed to be independent of temperature.
The calculated liquidus. based on the excess enthalpy of Eq. (57) and an excess entropy given by
SE(l) =XAXB ( -0.677 5.245xB) Jmol- 1 K-I,
(60)
reproduced the experimental136 eutectic exactly, and was everywhere within 2 DC of the reported 136 liquidus points . The calculated limits of solid solubility are XB = 0.01 and 0.93 at the eutectic temperature (550°C), while the values at 515°C reproduce the experimental ones. 138
Probable maximum inaccuracy in calculated diagram (Fig. 16): ± 5°C.
CsCI(A) + NaCI(B)
Data defining the liquidus have been tabulated in three studies,56,6;),88 all of which used the COOling curve method. The system was also examined briefly as a limiting edge of ternary and quaternary systems. 140-142 The reported eutectic data are summarized as follows:
J. Phys. Chern. Ref. Data, Vol. 16, No.3, 1987
524 J. SANGSTER AND A. D. PELTON
800 -- B01' • Ref. 136
~ 700
~ 650
~ 600
0.01
NaCl
.~.
~. ~.
• Ret. 138
"'-. 550'C
0.56
0.1 0.3 0.4 0.5 0.6 0.7 0.8 0.9
Mole Fraction AbCI
FIG. 16. The system NaCl(A) + RbCl(D).
T;oC
493 490 486
0.34 0.345 0.35
Ref.
63 56 88
493 0.34 140 494 0.36 141 495 0.34 142 493 0.346 144
RbCI
In the earliest work,63 the reported melting point ofNaCI is 19°C higher than the accepted value; also, Samuseva and Plyushchev56 show a NaClliquidus with a point of inflection, which is absent in the other reports. For these reasons, the data of the more recent work88 were adopted for calculation purposes. Activities of NaCI in the liquid were deduced from emf measurements 19 at 880°C. A eutectic halt was observed56 in the range XB = 0.01 to 0.99. This result, very low solid solubility, was confirmed by the limiting liquidus slopes of the phase diagram.88 By an indirect method, Fullam 144 estimated that the solubility of NaCI in esCI is less than 1 mol %.
The excess enthalpy of the liquid has been measured by Hersh and KleppaR4 at 810°C by direct calorimetry, and their results are used here:
HE (I) =XAXB ( -4310+418xB) Jmol- I• (61)
With this excess enthalpy, and the chosen phase diagram data,88 two excess entropy coefficients were calculated:
SE (1) XAXB ( 5.764 + 5.901xB) J mol- 1 K- 1•
(62)
A phase diagram, calculated with the liquid thermodynamic properties of Eqs. (61) and (62), reproduced all liquidus points88 within 6°C, and the eutectic88 was reproduced exactly.
The cesium chloride solid-state transformation temperature was observed56,63 from 100% CsCI to 1 % CsCI without significant change, although the experimental56,63 transformation temperature of the pure salt (455°C) is much lower than the accepted value (470 DC). Weyand143
has found that equilibrium thermal hysteresis occurs over a 20 to 50°C range in pure CsCI, an effect which was not noted in earlier work. 56,63 Fullam 144 measured the transformation
J. Phys. Chem. Ref. Data, Vol. 16, No.3, 1987
temperature in the interval O<XB <0.96 by two independent techniques (DT A and thermal expansion). The transformation temperature is 466 ± 2 °C in the interval O.OI<xB <0.96. In the interval between 0% and 1 % NaCl, the temperature is depressed from 474°C (Fullam's value for pure CsCI) to 466°C.
Probable maximum inaccuracy in calculated diagram (Fig. 17): ± 10 DC.
KCI(A) + RbCI(B)
For this system there exist tabulated data for the liquidus and solidus63 and for the liquidus only. 86 Both studies used the method of cooling curves for the liquidus and solidus. Phase diagrams have been given for both phase boundaries145 and for the liquidus only. 146,147 All investigations report a continuous solid solution at the liquidus temperature. Of the four reported liquidi, that ofZhemchuzhnyi and Rambach63 lies highest (wtih a high KCI melting point of 790°C) and that of Keitel86 lies lowest (with a liquidus minimum of 715°C). The others fall between these two. In those cases where both liquidus and solidus are reported,63,145 the phase boundaries are particularly far apart (up to 15°C). TIllS behaviol· is imprubable and may be in error, For these reasons, the liquidus reported by Dombrovskaya, 146 read off the published diagram,147 was used as a guide to the present calculations. X -ray diffraction measurements on the melt cooled to room temperaturel48-150 all indicate a single phase.
The excess enthalpy of the liquid has been measured by Hersh and KIeppa84 at 810°C by direct calorimetry, and their results are used here:
HE (I) = 84xAXB J mol-I, (63)
On the assumption that GE (I) is given by Eq. (63), independent of temperature, and that the solid solution follows regular solution behavior, a phase diagram was calculated using a GE (s) given by
(64)
The calculated liquidus shows the same shape as the adopted reference liquidus,146 with allowance for the difference in melting point of RbCl. The solidus is everywhere within 5 °C of the liquidus, and there is no minimum. In agreement with experiment. the calculated consolute point for solid-solid separation is below room temperature ( - 184°C).
BOO _ ~r. 88
750
700 .-,u
550 .~
500 ~ ____ ~_~/~· ____ ~486~'C'--____ ~ 0.350
0.1 0.2 0.<1 0.5 0.6 0.7 0.9 0.8 NaCI CsCI
Mole Fraction NaCl
FIG. 17. The system CsCl(A) + NaCl(B).
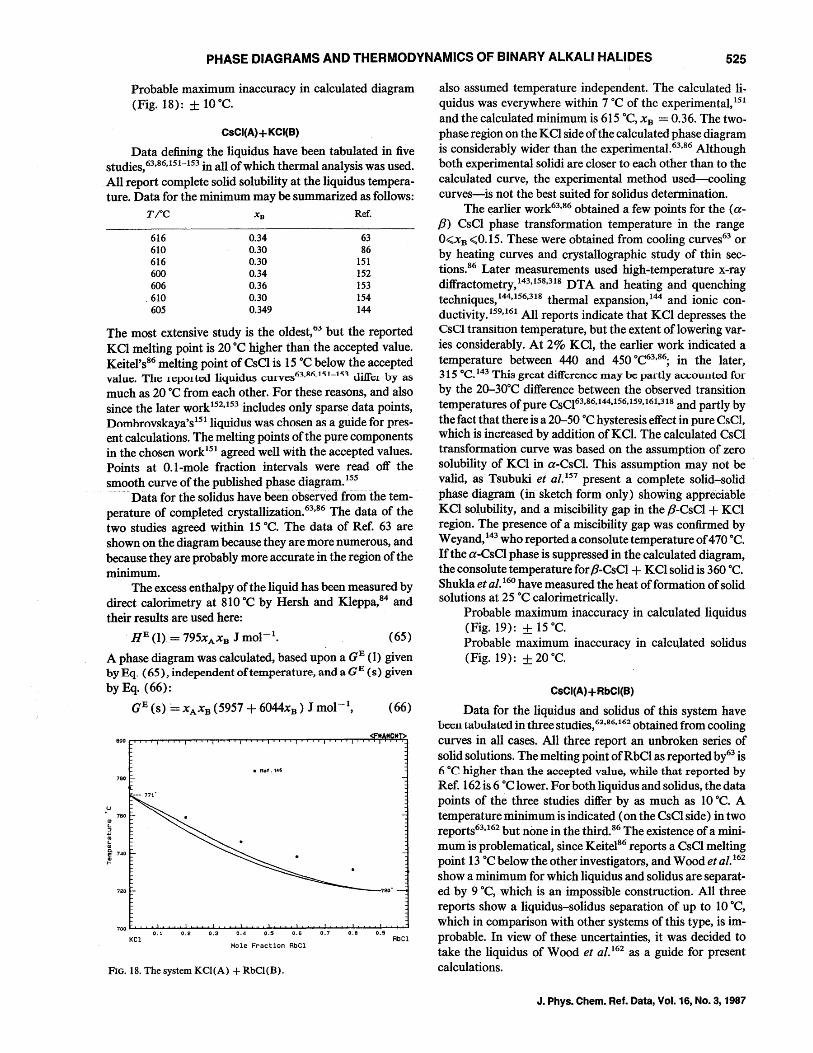
PHASE DIAGRAMS AND THERMODYNAMICS OF BINARY ALKALI HALIDES 525
Probable maximum inaccuracy in calculated diagram (Fig. 18): ± 10°C.
CsCI(A) + KCI(B)
Data defining the liquidus have been tabulated in five studies,63,86,151-153 in all of which thermal analysis was used. All report complete solid solubility at the liquidus temperature. Data for the minimum may be summarized as follows:
TiC XB Ref.
616 610 616 600 606
.610 605
0.34 0.30 0.30 0.34 0.36 0.30 0.349
63 86
151 152 153 154 144
The most extensive study is the 0ldest,63 but the reported KCI melting point is 20°C higher than the accepted value. Keitel's86 melting point of CsCI is 15°C below the accepted value. The ICP01tcd liquidus curycs6 "l,R6,151-15"l diffea" by as
much as 20°C from each other. For these reasons, and also since the later work152,153 includes only sparse data points, Dornbrovskaya'sl51 liquidus was chosen as a guide for present calculations. The melting points of the pure components in the chosen work151 agreed well with the accepted values. Points at O.l-mole fraction intervals were read off the smooth curve of the published phase diagram. 155
" Data for the solidus have been observed from the temperature of completed crystallization.63,86 The data of the two studies agreed within 15°C. The data of Ref. 63 are shown on the diagram because they are more numerous, and because they are probably more accurate in the region of the minimum.
The excess enthalpy of the liquid has been measured by direct calorimetry at 810°C by Hersh and Kleppa,84 and their results are used here:
. HE (1) = 795xA xB J mol-I. (65)
A phase diagram was calculated, based upon a GE (1) given byEq. (65), independent of temperature, and a G E (s) given by Eq. (66):
(66)
• Ret. 146
t ! 740
720
700~"""""L..................J1...,&..o...........J. .......... .........J.. ........... .......L .......... .......J.... ........ ........J...; ........... ....J...... .......... ....J.,....""""""'" 0.1 0.2 0.3 0.4 0.5 0.7 0.8 0.9
KCl AbCl Mole Fraction AbCl
FIG. 18. The system KCl(A) + RbCl(B).
also assumed temperature independent. The calculated liquidus was everywhere within 7 °C of the experimental,151 and the calculated minimum is 615°C, xB = 0.36. The twophase region on the KCl side of the calculated phase diagram is considerably wider than the experimental. 63,86 Although both experimental solidi are closer to each other than to the calculated curve, the experimental method used--cooling curves-is not the best suited for solidus determination.
The earlier work63,86 obtained a few points for the (a
P) CsCI phase transformation temperature in the range O<XB <0.15. These were obtained from cooling curves63 or by heating curves and crystallographic study of thin sections.86 Later measurements used high-temperature x-ray diffractometry,t43,158,318 DTA and heating and quenching techniques,I44,156,318 thermal expansion,144 and ionic conductivity.159,161 All reports indicate that KCI depresses the CsC} transition temperature, but the extent oflowering varies considerably. At 2% KCI, the earlier work indicated a temperature between 440 and 450 °C63,86; in the later, 315 °e. 143 This great difference may be partly accounted fur by the 20-30DC difference between the observed transition temperatures of pure CSCI63,86,144,156,159,161,318 and partly by
the fact that there is a 20-50 °C hysteresis effect in pure CsCI, which is increased by addition of KCl. The calculated CsCI transformation curve was based on the assumption of zero solubility of KCl in a-CsCl. This assumption may not be valid, as Tsubuki et al. 157 present a complete solid-solid phase diagram (in sketch form only) showing appreCiable KCl solubility, and a miscibility gap in the P-CsCI + KCl region. The presence of a miscibility gap was confirmed by Weyand,143 who reported a consolute temperature of 470°C. If the a-CsCI phase is suppressed in the calculated diagram, the consolute temperature for P-CsCI + KCl solid is 360 °C. Shukla et al. 160 have measured the heat of formation of solid solutions at 25°C calorimetrically.
Probable maximum inaccuracy in calculated liquidus (Fig. 19): ± 15°C . Probable maximum inaccuracy in calculated solidus (Fig. 19): ± 20°C.
CsCI(A) +RbCI(B)
Data for the liquidus and solidus of this system have been tabulated in three stUdies, 63,86,162 obtained from cooling curves in all cases. All three report an unbroken series of solid solutions. The melting point ofRbCI as reported by63 is 6°C higher than the accepted value, while that reported by Ref. 162 is 6 °C lower. For both liquidus and solidus, the data points of the three studies differ by as much as 10°C. A temperature minimum is indicated (on the CsCI side) in two reports63,162 but none in the third.86 The existence of a minimum is problematical, since Keitel86 reports a CsCI melting point 13°C below the other investigators, and Wood et al. 162
show a minimum for which liquidus and solidus are separated by 9°C, which is an impossible construction. All three reports show a liquidus-solidus separation of up to 10°C, which in comparison with other systems of this type, is improbable. In view of these uncertainties, it was decided to take the liquidus of Wood et al. 162 as a guide for present calculations.
J. Phys. Chem. Ref. Data, Vol. 16, No.3, 1987
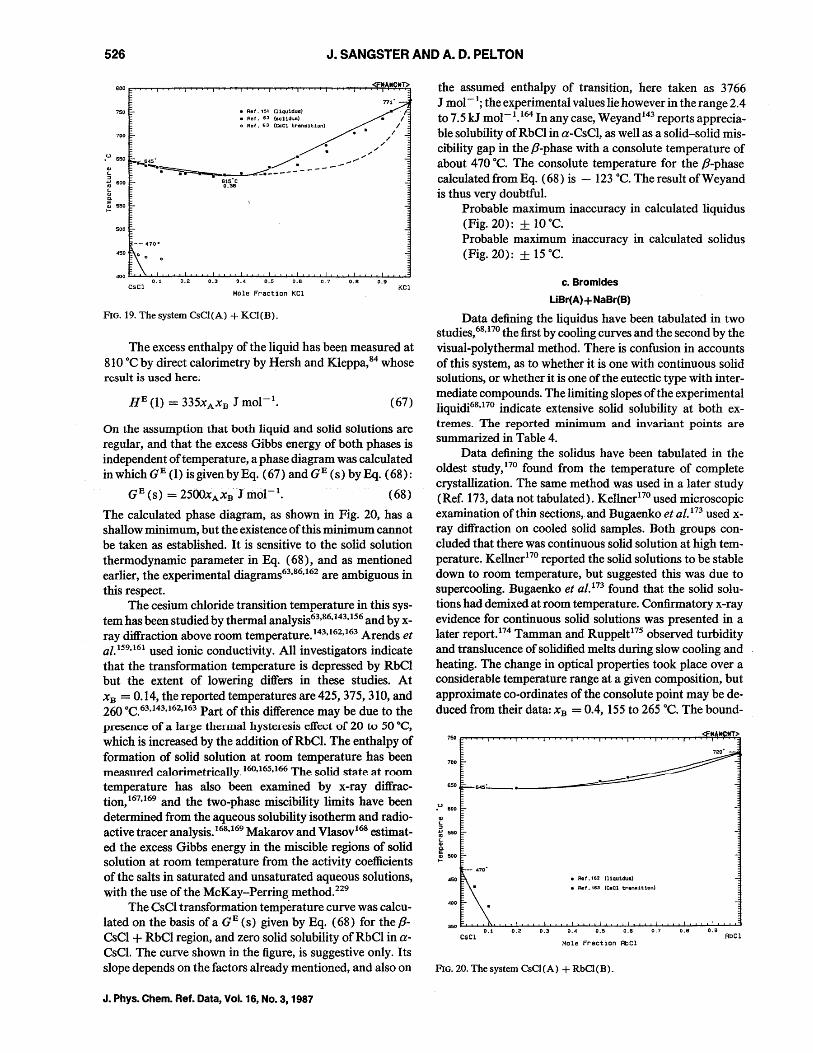
526 J. SANGSTER AND A. D. PELTON
BOO .".,.... .......... .,....,....., .......... .,....,....., .......... .,....,....., .......... .,....,.....,....,........"T"T'""!..,.......,...,....,,...,....,....,...,....,.....,..,...,...,....~~*~*~T>
750
700
.u 650
500
• Rol. 151 (liquIdus) • Rol. 63 (so l1dus) I o Rol. 63 (eBCl tranllt1on) /
. . ...,,"'/ -S4S' ~ .... ---
~-.~~:---:------
CsCl
B1S'C 0.36
Mole Fraction KCl
./
/ ./
KCl
FIG, 19, The system CsCl(A) + Kel(B),
The excess enthalpy of the liquid has been measured at 810°C by direct calorimetry by Hersh and Kleppa,84 whose result is used here;
(67)
On the assumption that both liquid and solid solutions are regular, and that the excess Gibbs energy. of both phases is independent of temperature, a phase diagram was calculated in which GE (1) is given by Eq. (67) and G E (s) by Eq. (68):
GE(s) = 2500xA xB Jmol- 1• (68)
The calculated phase diagram, as shown in Fig. 20, has a shallow minimum, but the existence of this minimum cannot be taken as established. It is sensitive to the solid solution thermodynamic parameter in Eq. (68), and as mentioned earlier, the experimental diagrams63,86,162 are ambiguous in this respect.
The cesium chloride transition temperature in this system has been studied by thermal analysis63,86,143,156 and by xray diffraction above room temperature.143,162,163 Arends et al}59,161 used ionic conductivity. All investigators indicate that the transformation temperature is depressed by RbCI but the extent of lowering differs in these studies. At XB = 0.14, the reported temperatures are 425, 375, 310, and 260°C.63,143,162,163 Part of this difference may be due to the pn~sence of a large thenllal hysten~~sis effect of 20 to .sO °c, which is increased by the addition of RbCl. The enthalpy of formation of solid solution at room temperature has been mea~nred ca1orimetrically.I60,165,166 The solid state at room temperature has also been examined by x-ray diffraction,167,169 and the two-phase miscibility limits have been determined from the aqueous solubility isotherm and radioactive tracer analysis. 168,169 Makarov and Vlasov168 estimated the excess Gibbs energy in the miscible regions of solid solution at room temperature from the activity coefficients of the salts in saturated and unsaturated aqueous solutions, with the use of the McKay-Perring method. 229
The CsCI transformation temperature curve was calculated on the basis of aGE (s) given by Eq. (68) for the pCsCI + RbCI region, and zero solid solubility of RbCI in aCsCl. The curve shown in the figure, is suggestive only. Its slope depends on the factors already mentioned, and also on
J. Phys. Chem. Ref. Data, Vol. 16, No.3, 1987
the assumed enthalpy of transition, here taken as 3766 J mol -1; the experimental values lie however in the range 2.4 to 7.5 kJ mol- l
•164 In any case, Weyand143 reports apprecia
ble solubility of RbCI in a-CsCI, as well as a solid-solid miscibility gap in the p-phase with a consolute temperature of about 470°C. The consolute temperature for the p-phase calculated from Eq. (68) is - 123°C. The result of Weyand is thus very doubtful.
Probable maximum inaccuracy in calculated liquidus (Fig. 20): ± 10°C. Probable maximum inaccuracy in calculated solidus (Fig. 20): ± 15°C.
c. Bromides
LiBr(A) + NaBr(B)
Data defining the liquidus have been tabulated in two studies,68,170 the first by cooling curves and the second by the visual-poly thermal method. There is confusion in accounts of this system, as to whether it is one with continuous solid :solution:s, or whether it is one of the eutectic type with intermediate compounds. The limiting slopes of the experimental liquidi68,170 indicate extensive solid solubility at both extremes. The reported minimum and invariant points are summarized in Table 4.
Data defining the solidus have been tabulated in the oldest study,170 found from the temperature of complete crystallization. The same method was used in a later study (Ref. 173, data not tabulated). Kellner170 used microscopic examination of thin sections, and Bugaenko et af. 173 used xray diffraction on cooled solid samples. Both groups concluded that there was continuous solid solution at high temperature. Kellner170 reported the solid solutions to be stable down to room temperature, but suggested this was due to supercooling. Bugaenko et al. 173 found that the solid solutions had demixed at room temperature. Confirmatory x-ray evidence for continuous solid solutions was presented in a later report. 174 Tamman and Ruppelt175 observed turbidity and translucence of solidified melts during slow cooling and heating. The change in optical properties took place over a considerable temperature range at a given composition, but approximate co-ordinates of the consolute point may be deduced from their data: XB = 0.4, 155 to 265°C. The bound-
750 t::"I-r' ........... ,...........,...,....r'""""I' ........ ,...........,...,..,......... .......... ,......... __ ,...........,...,...,...........,....,...,....,.....,.~*~1f I:;.*T:,:;,>
700
----~ 650 se_' _e ___ ----==-.u 600
011 L ::J I sso
~ soo
~o
- 470'
• Ret. 162 1l1qu1dua)
• RaI.163 rc.Cl tr.nolt1on)
350 ~ ............ .u....... ............ ~ ............ .I....I....r. ............ .I....I....r. ............ .I....I....r. ............ .I....I....r. ............ ~ ............ .I....I....r. ............ ~........,.;J 0.1 0.2 0.3 0.4 0.5 0.6 0.7 O.B 0.9
CsCl RbCl Mole Fraction AbCl
FIG. 20, The system CsCl(A) + RbCl(B).
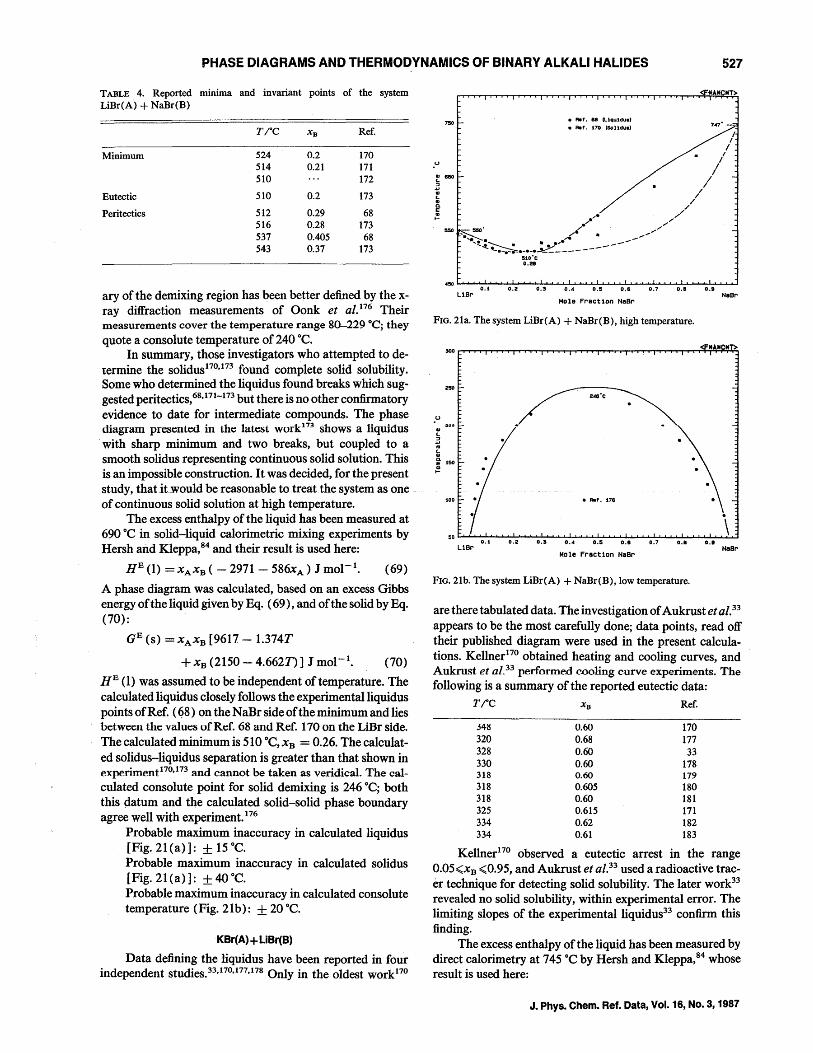
PHASE DIAGRAMS AND THERMODYNAMICS OF BINARY ALKALI HALIDES 527
TABLE 4. Reported minima and invariant points of the system LiBr(A) + NaBr(B)
TiC X B Ref.
Minimum 524 0.2 170 514 0.21 171 510 172
Eutectic 510 0.2 173
Peritectics 512 0.29 68 516 0.28 173 537 0.405 68 543 0.37 173
ary of the demixing region has been better defined by the xray diffraction measurements of Oonk et al. 176 Their measurements cover the temperature range 80-229 °C; they quote a consolute temperature of 240°C.
In summary, those investigators who attempted to determine the solidusl70.173 found complete solid solubility. Some who determined the liquidus found breaks which sug· gested peritectics,68, 171-173 but there is no other confirmatory evidence to date for intermediate compounds. The phase diagram presented in the latest work17
:J shows a liquidus . with sharp minimum and two breaks, but coupled to a smooth solidus representing continuous solid solution. This is an impossible construction. It was decided, for the present study, that itwould be reasonable to treat the system as one of continuous solid solution at high temperature.
The excess enthalpy of the liquid has been measured at 690°C in solid-liquid calorimetric mixing experiments by Hersh and Kleppa,84 and their result is used here:
HE (1) = XAXB ( - 2971 - 586xA ) J mol-I. (69)
A phase diagram was calculated, based on an excess Gibbs energy of the liquid given by Eq. (69), and of the solid by Eq. (70):
GE (s) = XAXB [9617 - 1.374T
+ XB (2150 - 4.662T)] J mol-I. (70)
HB (1) was assumed to be independent of temperature. The calculated liquidus closely follows the experimental liquidus points of Ref. (~8) on the NaBr side of the minimum and lies between the values ofR~f. 68 and Ref. 170 on the LiBr side. The calculated minimum is 510°C, XB = 0.26. The calculated solidus-liquidus separation is greater than that shown in experiment 170. 173 and cannot be taken as veridical. The calculated consolute point for solid demixing is 246°C; both this datum and the calculated solid-solid phase boundary agree well with experiment. 176
Probable maximum inaccuracy in calculated liquidus [Fig. 21 (a) ]: ± 15°C. Probable maximum inaccuracy in calculated solidus [Fig. 21 (a)]: ± 40°C. Probable maximum inaccuracy in calculated consolute temperature (Fig. 21 b): ± 20°C.
KBr(A)+ LiBr(B)
Data defining the liquidus have been reported in four independent studies.33.170.177.178 Only in the oldest work170
tlAti tiT>
• Rolf. B8 (l.lquldu.)
• Rolf. 170 lSOl1du.) 747' -
~~~~~~~~~~~~~~~~~~~~~ 0.1 0.2 0.3 0.4 0.5 O.B 0.7 0.' 0.1
LiBr NaBr Mole Fraction NaBr
FIG. 21a. The system LiBr(A) + NaBr(B), high temperature.
100
0.1 0.2 0.3 0.4 0.5 0.8 0.7 0.' 0.' LiBr HaBr
Mole Fraction NeBr
FIG. 21b. The system LiBr(A) + NaBr(B), low temperature.
are there tabulated data. The investigation of Aukrust et al.33
appears to be the most carefully done; data points, read off their published diagram were used in the present calculations. Kellner170 obtained heating and cooling curves, and Aukrust et al. 33 performed cooling curve experiments. The following is a summary of the reported eutectic data:
TiC XB Ref.
348 0.60 170 320 0.68 177 328 0.60 33 330 0.60 178 318 0.60 179 318 0.605 180 318 0.60 181 325 0.615 171 334 0.62 182 334 0.61 183
Kellner170 observed a eutectic arrest in the range 0.05<;xB <;0.95, and Aukrust et al.33 used a radioactive tracer technique for detecting solid solubility. The later work33
revealed no solid solubility, within experimental error. The limiting slopes of the experimental liquidus33 confirm this finding.
The excess enthalpy of the liquid has been measured by direct calorimetry at 745°C by Hersh and Kleppa,84 whose result is used here:
J. Phys. Chem. Ref. Data, Vol. 16, No.3, 1987
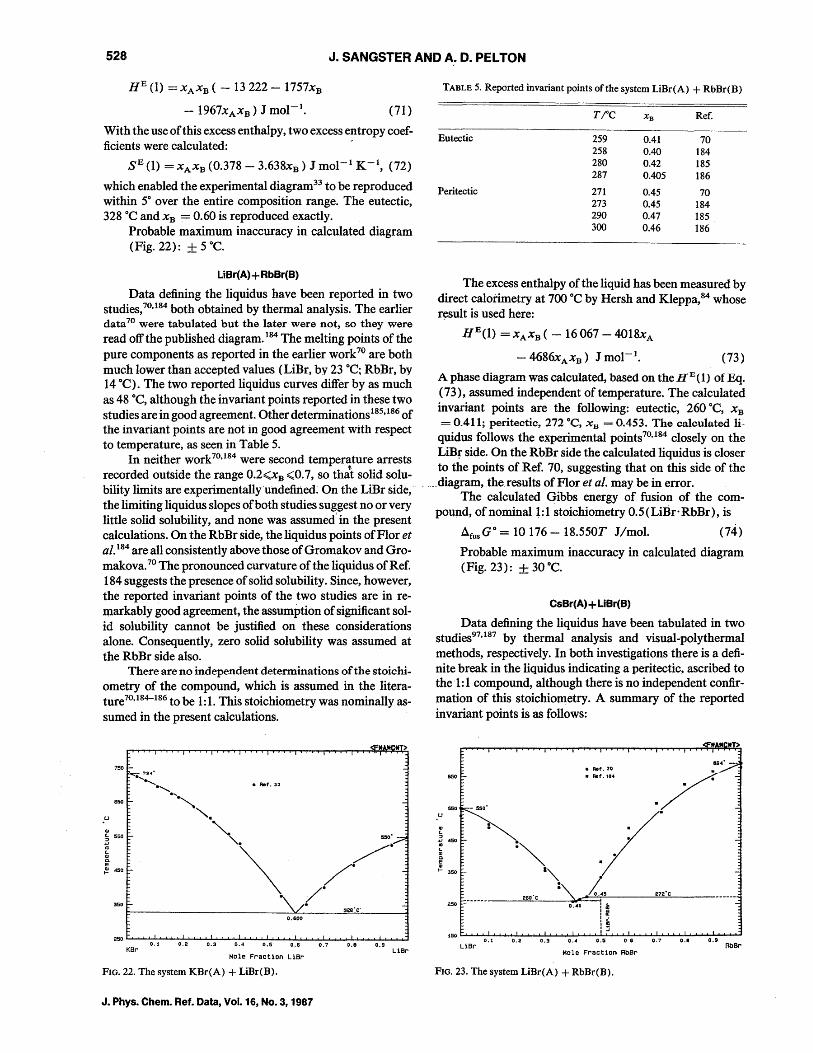
528 J. SANGSTER AND A,o D. PELTON
HE (1) = XAXB ( - 13222 - 1757xB
- 1 967xAXB ) J mol-I. (71)
With the use of this excess enthalpy, two excess entropy coef-ficients were calculated: >
SE (1) = XAXB (0.378 - 3.638xB) J mol- I K- 1, (72)
which enabled the experimental diagram33 to be reproduced within 5° over the entire composition range. The eutectic, 328°C and XB = 0.60 is reproduced exactly.
Probable maximum inaccuracy in calculated diagram (Fig. 22): ± 5°C.
LiBr(A) + RbBr(B)
Data defining the liquidus have been reported in two studies,7o,I84 both obtained by thermal analysis. The earlier data 70 were tabulated but the later were not, so they were read off the published diagram. 184 The melting points of the pure components as reported in the earlier work 70 are both much lower than accepted values (LiBr, by 23°C; RbBr, by 14°C). The two reported liquidus curves differ by as much as 48°C, although the invariant points reported in these two studies are in good agreement. Other determinations 185. 186 of the invariant pOints are not in good agreement with respect to temperature, as seen in Table 5.
In neither work70,184 were second temperature arrests recorded outside the range 0.2<XB <;;0.7, so th:t solid solubility limits are experimentally undefined. On the LiBr side, the limiting liquidus slopes of both studies suggest no or very little solid solubility, and none was assumed'in the present calculations. On the RbBr side, the liquidus points ofFIor et al. 184 are all consistently above those of Gromakov and Gromakova.70 The pronounced curvature of the liquidus of Ref. 184 suggests the presence of solid solubility. Since, however, the reported invariant points of the two studies are in remarkably good agreement, the assumption of significant solid solubility cannot be justified on these considerations alone. Consequently, zero solid solubility was assumed at the RbBr side also.
There are no independent determinations of the stoichiometry of the compound, which is assumed in the literature70,184-186 to be 1: 1. This stoichiometry was nominally assumed in the present calculations.
.u
II>
750
S50
i 550
E {!!. 450
• Ref. 33
!IlIO'
O.SOO
250 &......I.~o 1-;', 1 ........... "':;"0 .~2 .......... ~O .-::-3 ............. :-ta.-:-4 ............ :-lo .5:"-'-' ....... 0..1... S ................. o.L. 7 ................. 0..L...B .............. OL.. 9 ........... ..3 KBr LiBr
Mole Fraction LiBr
FIG. 22. The system KBr(A) + LiBr(B).
J. Phys. Chem. Ref. Data, Vol. 16, NO.3, 1987
TABLE 5. Reported invariant points ofthe system LiBr(A) + RbBr(B)
r;oc X B Ref.
Eutectic 259 0.41 70 258 0.40 184 280 0.42 185 287 0.405 186
Peritectic 271 0.45 70 273 0.45 184 290 0.47 185 300 0.46 186
The excess enthalpy of the liquid has been measured by direct calorimetry at 700 °C by Hersh and Kleppa,84 whose result is used here:
HE(l) =XAXB ( -16067 -4018xA
(73)
A phase diagram was calculated, based on the HE (1) of Eq. (73), assumed independent of temperature. The calculated invariant points are the following: eutectic, 260°C, XB = 0.411; peritectic, 272°e, Xu """ 0.453. The calculated li
quidus follows the experimental points7o,184 closely on the LiBfside. On the RbBr side the calculated liquidus is closer to the points of Ref. 70, suggesting that on this side of the
.... diagram, the results ofFIor et al. may be in error. The calculated Gibbs energy of fusion of the com-
pound, of nominal 1: 1 stoichiometry 0.5 (LiBr· RbBr), is
AfusGo = 10176 - 18.550T J/mol. (74)
Probable maximum inaccuracy in calculated diagram (Fig. 23): ± 30°C.
CsBr(A)+ LiBr(B)
Data defining the liquidus have been tabulated in two studies97,187 by thermal analysis and visual-poly thermal methods, respectively. In both investigations there is a definite break in the liquidus indicating a peritectic. ascribed to the 1:1 compound, although there is no independent confir· mation of this stoichiometry. A summary of the reported invariant points is as follows:
B50
sso
zso
• AIIf. 70
./ :~ ./:'
."
• AIIf.la4
: 1. 260'C '" C 0.;5 272'C
0 .• 1 : .t; :~
!~ 150 ........... -'-'::"0 .L.;-"1 .......... '::7~<::-Io .:'"3 ............ :-Lo ................. o:-L:.s:'-'-' ..... oJ..s ................. o..L... 7 .............. 0..L....8 ~ ..... 0.1...I9 .......... .u
LiBr ROBr Mole Fraction RbBr
FIG. 23. The system LiBr(A) + RbBr(B).
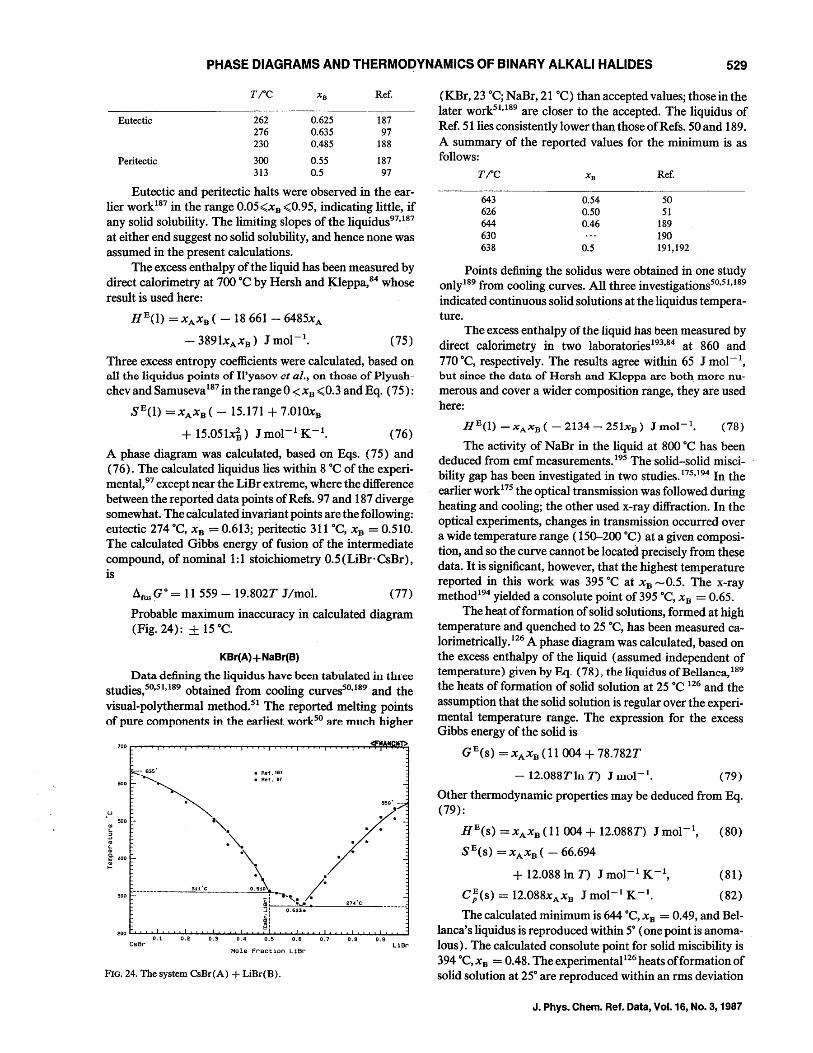
PHASE DIAGRAMS AND THERMO~YNAMICS OF BINARY ALKALI HALIDES 529
TiC X B Ref.
Eutectic 262 0.625 187 276 0.635 97 230 0.485 188
Peritectic 300 0.55 187 313 0.5 97
Eutectic and peritectic halts were observed in the earlier work187 in the range 0.05<xB <0.95, indicating little, if any solid solubility. The limiting slopes of the liquidus97,187 at either end suggest no solid solubility, and hence none was assumed in the present calculations.
The excess enthalpy of the liquid has been measured by direct calorimetry at 700 °C by Hersh and Kleppa,84 whose result is used here:
HE(l) = XAXB ( - 18661 - 6485xA
(75)
Three excess entropy coefficients were calculated, based on all the liquidus points of Il'yasov ct al., on those of PlyushchevandSamuseva187 in therangeO<xB <;0.3 andEq. (75):
SE(l) = XAXB ( - 15.171 + 7.010xB
+ 15.051x~) J mol-1 K- 1. (76)
A phase diagram was calculated, based on Eqs. (75) and (76). The calculated liquidus lies within 8°C of the experimental,97 except near the LiBr extreme, where the difference between the reported data points of Refs. 97 and 187 diverge somewhat. The calculated invariant points are the following: eutectic 274°C, xB = 0.613; peritectic 311 °C, X B = 0.510. The calculated Gibbs energy of fusion of the intermediate compound, of nominal 1:1 stoichiometry 0.5(LiBr·CsBr), is
afugGo = 11 559 - 19.802T J/mo!. (77)
Probable maximum inaccuracy in calculated diagram (Fig. 24): ± 15°C.
KBr(A) + NaBr(B)
Data defining the liquidus have been tabulated in tluee studies,5°,51,189 obtained from cooling curves50,189 and the visual-polythermal method.51 The reported melting points of pure cornponent~ in the earli~t work50 are much higher
635'
.u -~. .~'" /550 .. -~ 500 ". • •
~ .". . . 01 .\.. • ! 400
~ . ____ ~9~U~·C ______ O~.5~~10~. /-
-: .-.,~.. 27.·C
~; O.6~3: •
_ Ref .187
0.1 0.2 0.3 0.4 0.5 0.6 0.7 0.8 0.9 CsBr LiBr
Mole Fraction LiBr
FIG. 24. The system CsBr(A) + LiBr(B).
(KBr, 23°C; NaBr, 21°C) than accepted values; those in the later work51,189 are closer to the accepted. The liquidus of Ref. 51 lies consistently lower than those of Refs. 50 and 189. A summary of the reported values for the minimum is as follows:
TiC X B Ref.
643 626 644 630 638
0.54 0.50 0.46
0.5
50 51
189 190 191,192
Points defining the solidus were obtained in one study only189 from cooling.curves. All three investigations5o,51,189 indicated continuous solid solutions at the liquidus temperature.
The excess enthalpy of the liquid has been measured by direct calorimetry in two laboratoriesl93.84 at 860 and 770°C, respectively. The results agree within 65 J mol-I, but since the data of Hcrsh and Klcppa are both more numerous and cover a wider composition range, they are used here:
HE(1) = XAXB ( - 2134 - 251xB) J mol-I. (78)
The activity of NaBr in the liquid at 800°C has been deduced from emf measurements. 195 The solid-solid miscibility gap has been investigated in two studies. 175,194 In the earlier work 175 the optical transmission was followed during heating and cooling; the other used x-ray diffraction. In the optical experiments, changes in transmission occurred over a wide temperature range (150-200 °C) at a given composition, and so the curve cannot be located precisely from these data~ It is significant, however, that the highest temperature reported in this work was 395°C at xB ---0.5. The x-ray method194 yielded a consolute point of 395 DC, X B = 0.65.
The heat of formation of solid solutions, formed at high temperature and quenched to 25 DC, has been measured calorimetrically. 126 A phase diagram was calculated, based on the excess enthalpy of the liquid (assumed independent of temperature) given by Eq. (78), the liquidus of Bellanca, 189
the heats of formation of solid solution at 25°C 126 and the assumption that the solid solution is regular over the experimental temperature range. The expression for the excess Gibbs energy of the solid is
GE(s) = XAXB (11004 + 78.782T
- 12.088TIll T) J mol-to (79)
Other thermodynamic properties may be deduced from Eq. (79):
HE(s) =xA xB (11 004+ 12.088T) Jmol-t, (80)
SEes) =XAXB ( - 66.694
+ 12.088 In T) J mol- 1 K- 1, (81)
C;(s) = 12.088xA x B J mol- 1 K- 1. (82)
The calculated minimum is 644 DC, X B = 0.49, and Bellanca's liquidus is reproduced within 5° (one point is anomalous). The calculated consolute point for solid miscibility is 394°C,xB = 0.48. The experimental 126 heats off ormation of solid solution at 25° are reproduced within an rms deviation
J. Phys. Chern. Ref. Data, Vol. 16, No.3, 1987
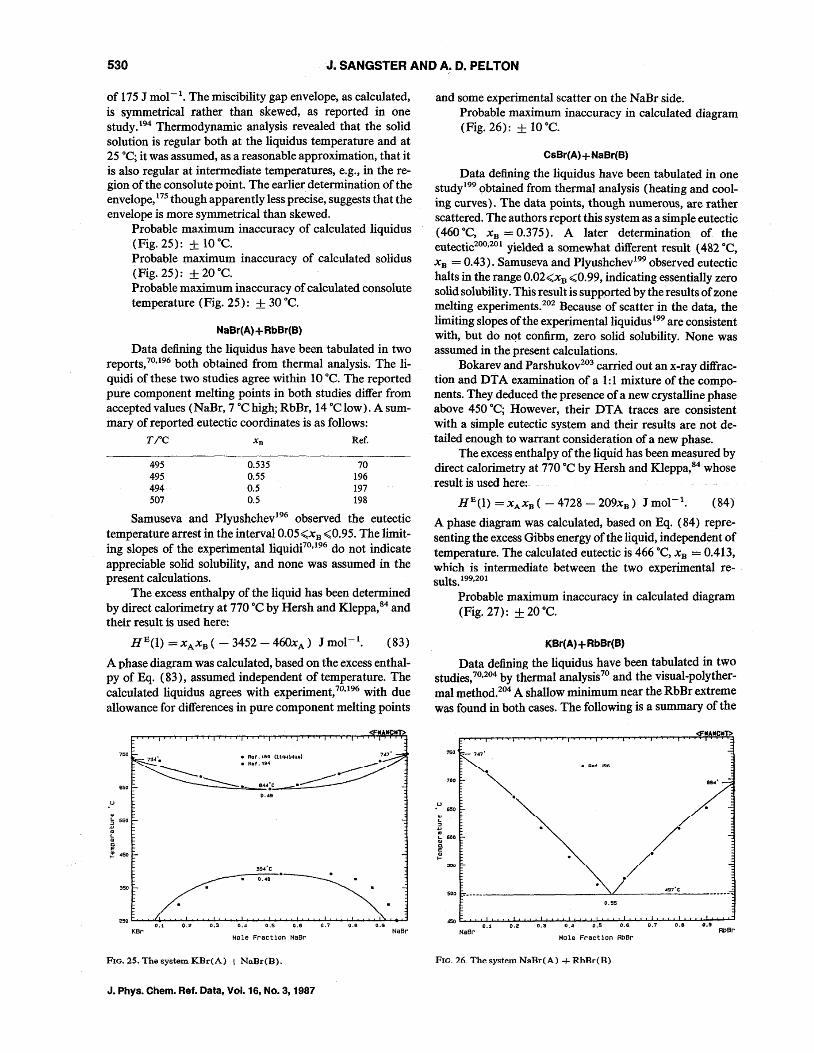
530 J. SANGSTER AND A. D. PELTON
of 175 J mol-I. The miscibility gap envelope, as calculated, is symmetrical rather than skewed, as reported in one study.194 Thermodynamic analysis revealed that the solid solution is regular both at the liquidus temperature and at 25°C; it was assumed, as a reasonable approximation, that it is also regular at intermediate temperatures, e.g., in the region of the consolute point. The earlier determination of the envelope, 175 though apparently less precise, suggests that the envelope is more symmetrical than skewed.
Probable maximum inaccuracy of calculated liquidus (Fig. 25): ± 10°C. Probable maximum inaccuracy of calculated solidus (Fig. 25): ± 20°C. Probable maximum inaccuracy of calculated consolute temperature (Fig. 25): ± 30°C.
NaBr(A} + RbBr(B}
Data defining the liquidus have been tabulated in two reports,70,196 both obtained from thermal analysis. The liquidi of these two studies agree within 10°C. The reported pure component melting points in both studies differ from accepted values (NaBr, 7 °Chigh; RbBr, 14 °Clow). A summary of reported eutectic coordinates is as follows:
TiC X B Ref.
495 495 494 507
0.535 0.55 0.5 0.5
70 196 197 198
Samuseva and Plyushchev196 observed the eutectic temperature arrest in the interval 0.05<xB <0.95. The limiting slopes of the experimentalliquidFO,196 do not indicate appreciable solid solubility, and none was assumed in the present calculations.
The excess enthalpy of the liquid has been determined by direct calorimetry at 770°C by Hersh and Kleppa,84 and their result is used here:
HE(1) =XAXB ( -3452 -460xA ) Jmol- 1• (83)
A phase diagram was calculated, based on the excess enthalpy of Eq. (83), assumed independent of temperature. The calculated liquidus agrees with experiment,70,196 with due allowance for differences in pure component melting points
750
650
0.1 0.2 0.3 0.4 0.5 0.6 0.7 0.8 0.9 KBr NaBr
Mole Fraction Naar
FIG. 25. The system KBr(A) + NaBr(B).
J. Phys. Chern. Ref. Data, Vol. 16, No.3, 1987
and some experimental scatter on the NaBr side. Probable maximum inaccuracy in calculated diagram (Fig. 26): ± 10°C.
CsBr(A)+ NaBr(B)
Data defining the liquidus have been tabulated in one studyl99 obtained from thermal analysis (heating and cooling curves). The data points, though numerous, are rather scattered. The authors report this system as a simple eutectic (460°C, X B =0.375). A later determination of the eutectic2°O,201 yielded a somewhat different result (482°C, X B = 0.43). Samuseva and Plyushchev199 observed eutectic halts in the range 0.02<xB <0.99, indicating essentially zero solid solubility. This result is supported by the results of zone melting experiments.202 Because of scatter in the data, the limiting slopes of the experimental liquidus 199 are consistent with, but do not confirm, zero solid solubility. None was assumed in the present calculations.
Bokarev and Parshukov203 carried out an x-ray diffraction and DTA examination of a 1: 1 mixture of the components. They deduced the presence of a new crystalline phase above 450°C; However, their DT A traces are consistent with a simple eutectic system and their results are not detailed enough to warrant consideration of a new phase.
The excess enthalpy of the liquid has been measured by direct calorimetry at 770°C by Hersh and Kleppa, 84 whose result is used here:
HE(l) = XAXB ( - 4728 - 209xB ) J mol-I. (84)
A phase diagram was calculated, based on Eq. (84) representing the excess Gibbs energy of the liquid, independent of temperature. The calculated eutectic is 466°C, xB = 0.413, which is intermediate between the two experimental resuIts. 199,201
Probable maximum inaccuracy in calculated diagram (Fig. 27): ± 20°C.
KBr(A)+ RbBr(B)
Data defining the liquidus have been tabulated in two studies,7o,204 by thermal analysis 70 and the visual-polyther-mal method.204 A shallow minimum near the RbBr extreme was found in both cases. The following is a summary of the
750 _ 7~7'
700 0",-u
• 1150
0.55
~~~O.~1~UO.~2~O~.3~~O~.4~~O~.5~~O~.6~~O~.7~~O~.6~~O.~9~R-~B~r NaBr
Mole Fraction RbBr
FIG_ 26. The system NaBr(A) + RbBr(B)
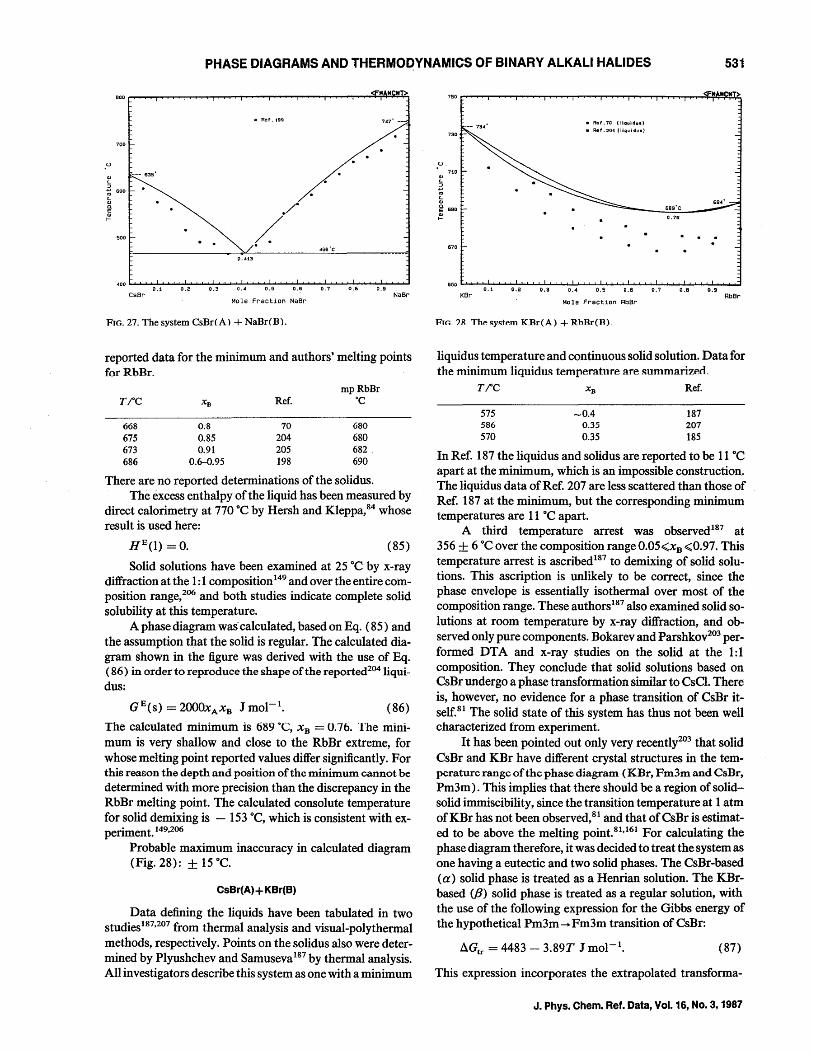
PHASE DIAGRAMS AND THERMO~YNAMICS OF BINARY ALKALI HALIDES 531
• Ref. 199 747' ---
700
--- 635'
500 . . 0.413
0.1 0.5 0.6 0.& 0.9 CsBr NaBr
Mole Fraction NaBr
FIG. 27. The system CsBr(A) + NaBr(B).
reported data for the minimum and authors' melting points for RbBr.
mpRhBr TiC XII Ref. °C
668 0.8 70 680 675 0.85 204 680 673 0.91 205 682 686 0.6-0.95 198 690
There are no reported determinations of the solidus. The excess enthalpy of the liquid has been measured by
direct calorimetry at 770 DC by Hersh and Kleppa,84 whose result is used here:
(85)
Solid solutions have been examined at 25 DC by x-ray diffraction at the 1: 1 composition 149 and over the entire composition range,206 and both studies indicate complete solid solubility at this temperature.
A phase diagram was' calculated, based on Eq. (85) and the assumption that the solid is regular. The calculated diagram shown in the figure was derived with the use of Eq. ( 86) in order to reproduce the shape of the reported204 liquidus:
GE(s) = 2000XA XB J mol-I. (86)
The calculated minimum is 689 "C, xB = 0.76. The minimum is very shallow and close to the RbBr extreme, for whose melting point reported values differ significantly. For this reason the depth and position of the minimum cannot be determined with more precision than the discrepancy in the RbBr melting point. The calculated consolute temperature for solid demixing is - 153 DC, which is consistent with experiment.149.206
Probable maximum inaccuracy in calculated diagram (Fig. 28): ± 15 DC.
CsBr(A) + KBr(B)
Data defining the liquids have been tabulated in two studiesl87.207 from thermal analysis and visual-poly thermal methods, respectively. Points on the solidus also were determined by Plyushchev and Samuseva 187 by thermal analysis. All investigators describe this system as one with a minimum
• Aet.70 (liquidUI)
730 • Ref. 204 t liquidus}
~ 710
'" '-QI 694' -! 690
6B9'C
0.76
670
0.1 o.a 0.3 0.4 0.5 0.6 0.7 0.8 0.9 KBr RbBr
Mole Fraction RbBr
FTr.. ?R. Thp. ~ystp.m KRr(A) + RbBr(R)
liquidus temperature and continuous solid solution. Data for the minimum liquidll!O: temperatnre are !O:llmmari7':ed.
TiC X B Ref.
575 586 570
-0.4 0.35 0.35
187 207 185
In Ref. 187 the liquidus and solidus are reported to be 11 DC apart at the minimum, which is an impossible construction. The liquidus data of Ref. 207 are less scattered than those of Ref. 187 at the minimum, but the corresponding minimum temperatures are 11 DC apart.
A third temperature arrest was observed 187 at 356 ± 6 DC over the composition range 0.05<xB <0.97. This temperature arrest is ascribed 187 to demixing of solid solutions. This ascription is unlikely to be correct, since the phase envelope is essentially isothermal over most of the composition range. These authors 187 also examined solid solutions at room temperature by x-ray diffraction, and observed only pure components. Bokarev and Parshkov203 performed DTA and x-ray studies on the solid at the 1:1 composition. They conclude that solid solutions based on CsBr undergo a phase transformation similar to CsCl. There is, however, no evidence for a phase transition of CsBr itself.81 The solid state of this system has thus not been well characterized from experiment.
It has been pointed out only very recently203 that solid CsBr and KBr have different crystal structures in the temperature range of the phase diagram (KBr, Fm3m and CsBr, Pm3m). This implies that there should be a region of solidsolid immiscibility, since the transition temperature at 1 atm of KBr has not been observed,81 and that of CsBr is estimated to be above the melting point.81.161 For Calculating the phase diagram therefore, it was decided to treat the system as one having a eutectic and two solid phases. The CsBr-based (a) solid phase is treated as a Henrian solution. The KBrbased (/3) solid phase is treated as a regular solution, with the use of the following expression for the Gibbs energy of the hypothetical Pm3m - Fm3m transition of CsBr:
AGtr = 4483 - 3.89T Jmol- 1• (87)
This expression incorporates the extrapolated transforma-
J. Phys. Chem. Ref. Data, Vol. 16, No.3, 1987
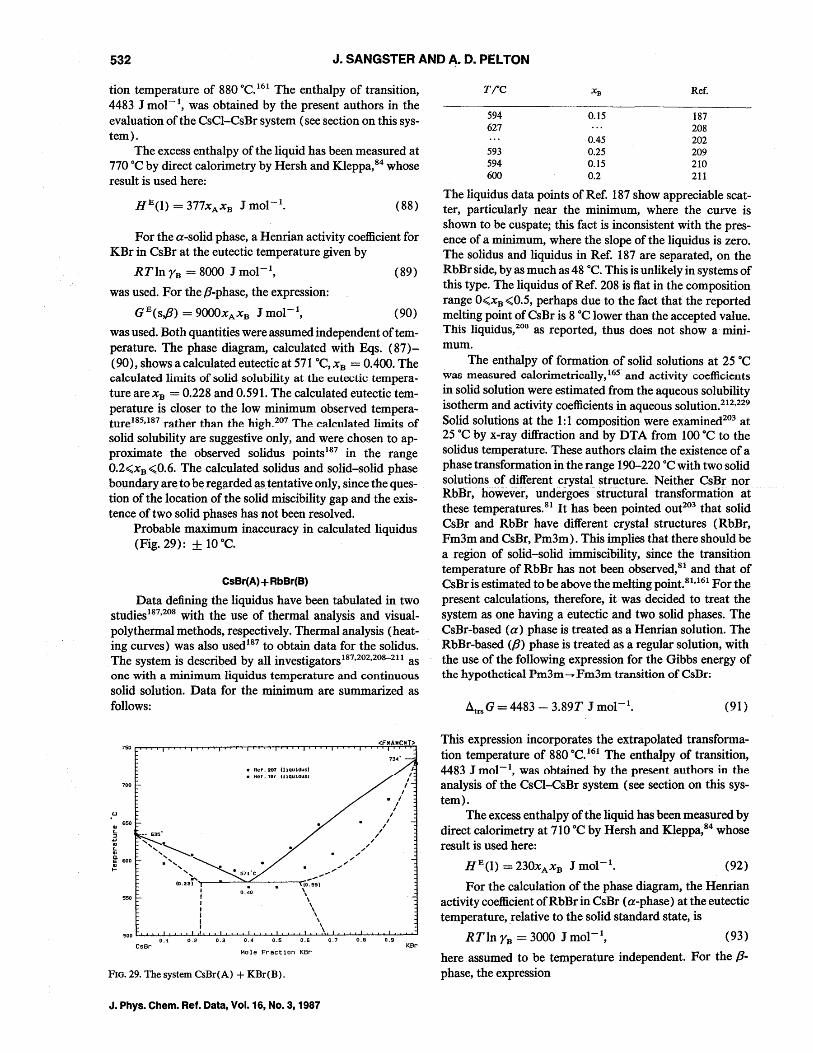
532 J. SANGSTER AND ~. D. PELTON
tion temperature of 880 °C.161 The enthalpy of transition, 4483 J mol-I, was obtained by the present authors in the evaluation of the CsCI-CsBr system (see section on this system).
The excess enthalpy of the liquid has been measured at 770°C by direct calorimetry by Hersh and Kleppa,84 whose result is used here:
(88)
For the a-solid phase, a Henrian activity coefficient for KBr in CsBr at the eutectic temperature given by
RTln YB = 8000 J mol-I, (89)
was used. For the /3-phase, the expression:
G E (s,/3) = 9000XA XB J mol-I, (90)
was used. Both quantities were assumed independent of temperature. The phase diagram, calculated with Eqs. (87)(90), shows a calculated eutectic at 571°C, XB = 0.400. The calculated limits of solid solubility at the eutectic temperature arexB = 0.228 and 0.591. The calculated eutectic temperature is closer to the low minimum observed temperature185,187 rather than the high.207 The calculated limits of solid solubility are suggestive only, and were chosen to approximate the observed solidus points187 in the range 0.2<XB <0.6. The calculated solidus and solid-solid phase boundary are to be regarded as_ tentative only, since the question of the location of the solid miscibility gap and the existence of two solid phases has not been resolved.
Probable maximum inaccuracy in calculated liquidus (Fig. 29): ± 10°C.
CsBr(A) + RbBr(B)
Data defining the liquidus have been tabulated in two studiesl87,208 with the use of thermal analysis and visualpolythermal methods, respectively. Thermal analysis (heating curves) was also used 187 to obtain data for the solidus. The system is described by all investigatorsI87,202,2o8-211 as one with a minimum liquidus temperature and continuous solid solution. Data for the minimum are summarized as follows:
700
II 650 L
~ ~ ~ 600
t-
550
C5Br
• Ref. 207 (liquidUS' • Hef. lltl U1QU1GUSJ
0.1 0.2 0.3 0.4 0.5 0.6 0.7 O.B 0.9
Mole Fraction KBr
FIG. 29. The system CsBr(A) + KBr(B).
J. Phys. Chern. Ref. Data, Vol. 16, No.3, 1987
KBr
TiC Ref.
594 0.15 187 627 208
0.45 202 m Q~ W9 594 0.15 210 600 0.2 211
The liquidus data points of Ref. 187 show appreciable scatter, particularly near the minimum, where the curve is shown to be cuspate; this fact is inconsistent with the presence of a minimum, where the slope of the liquidus is zero. The solidus and liquidus in Ref. 187 are separated, on the RbBr side, by as much as 48°C. This is unlikely in systems of this type. The liquidus of Ref. 208 is flat in the composition range O<xB <0.5, perhaps due to the fact that the reported melting point of CsBr is 8 °C lower than the accepted value. This liquidus,206 as reported, thus does not show a' minimum.
The enthalpy of formation of solid solutions at 25°C was measured oalorimetrioally,165 and activity coefficients in solid solution were estimated from the aqueous solubility isotherm and activity coefficients in aqueous solution.212,229 Solid solutions at the 1: 1 composition were examined203 at 25°C by x-ray diffraction and by DTA from 100 °C to the solidus temperature. These authors claim the existence of a phase transformation in the range 190-220 °C with two solid solutions of different crystal structure. Neither CsBr nor RbBr, ·h.owever, undergoes- structural transformation· at these temperatures.81 It has been pointed oue03 that solid CsBr and RbBr have different crystal structures (RbBr, Fm3m and CsBr, Pm3m). This implies that there should be a region of solid-solid immiscibility, since the transition temperature of RbBr has not been observed,81 and that of CsBr is estimated to be above the melting point.81,161 For the present calculations, therefore, it was decided to treat the system as one having a eutectic and two solid phases. The CsBr-based (a) phase is treated as a Henrian solution. The RbBr-based (/3) phase is treated as a regular solution, with the use of the following expression for the Gibbs energy of the hypothetical Pm3m --Fm3m transition of CsDr;
(91)
This expression incorporates the extrapolated transformation temperature of 880°C. 161 The enthalpy of transition, 4483 J mol-I, was obtained by the present authors in the analysis of the CsCI-CsBr system (see section on this system).
The excess enthalpy of the liquid has been measured by direct calorimetry at 710°C by Hersh and Kleppa,84 whose result is used here:
(92)
For the calculation of the phase diagram, the Henrian activity coefficient ofRbBr in CsBr (a-phase) at the eutectic temperature, .relative to the solid standard state, is
RTln rB = 3000 J mol-I, (93)
here. assumed to be temperature independent. For the /3-phase, the expression
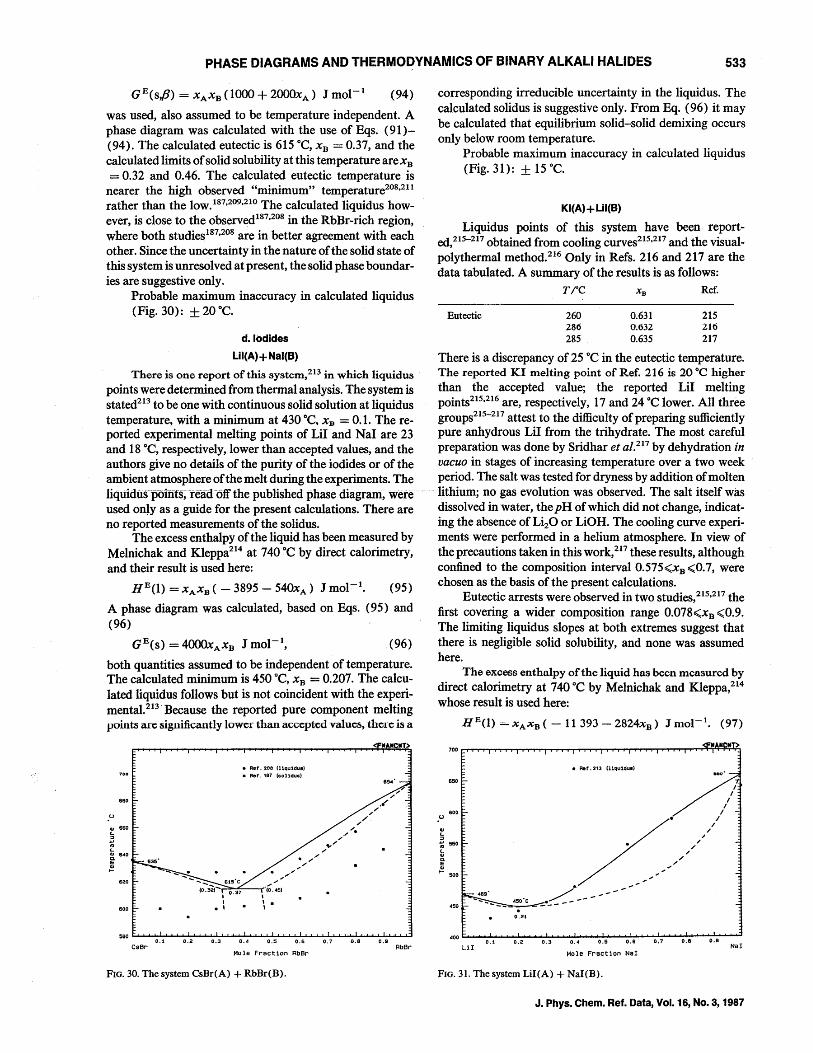
PHASE DIAGRAMS AND THERM0I:?YNAMICS OF BINARY ALKALI HALIDES 533
G E (s,{3) = XAXB (1000 + 2000xA ) J mol- 1 (94)
was used, also assumed to be temperature independent. A phase diagram was calculated with the use of Eqs. (91)(94). The calculated eutectic is 615°C, xB = 0.37, and the calculated limits of solid solubility at this temperature are xB
= 0.32 and 0.46. The calculated eutectic temperature is nearer the high observed "minimum" temperature208,211 rather than the IOW. 187,209,21O The calculated liquidus however, is close to the observed187,208 in the RbBr-rich region, where both studies187,208 are in better agreement with each other. Since the uncertainty in the nature of the solid state of this system is unresolved at present, the solid phase boundaries are suggestive only.
Probable maximum inaccuracy in calculated liquidus (Fig. 30): ± 20°C.
d.lodldes
LiI(A) + Nal(B)
There is one report of this system,213 in whieh liquidus points were determined from thermal analysis. The system is stated213 to be one with continuous solid solution at liquidus temperature, with a minimum at 430°C. X:o = 0.1. The reported experimental melting points of Lil and NaI are 23 and 18°C, respectively, lower than accepted values, and the authors give no details of the purity of the iodides or of the ambient atmosphere of the melt during the experiments. The liquiduKpoinfS; -fead off the published phase diagram, were used only as a guide for the present calculations. There are no reported measurements of the solidus.
The excess enthalpy of the liquid has been measured by Melnichak and Kleppa214 at 740°C by direct calorimetry, and their result is used here:
HE(l) = XAXB ( - 3895 - 540xA ) J mol-I. (95)
A phase diagram was calculated, based on Eqs. (95) and (96)
(96)
both quantities assumed to be independent of temperature. The calculated minimum is 450°C, xB = 0.207. The calculated liquidus follows but is not coincident with the experimental. 213' Because the reported pure component melting points are significantly lower than accepted values, there is a
tI tI >
• Ref. 208 (l1quidus)
• Ref. 187 (solidus)
6BO
.u
~ 660
~ 6~0
~ - 635'
800
580 U""O'~0.l.:"1 ............ ·0.~2 ............ ..I..l.J .......... ...J...J ............ •0
.J....5
............ ·0.J....6
............ ·0.J....7 ~ ..... O.I....oB ~ ..... o.l....og ~...:I
CsBr RbBr Mole Fraction RbBr
FIG. 30. The system CsBr(A) + RbBr(B).
corresponding irreducible uncertainty in the liquidus. The calculated solidus is suggestive only. From Eq. (96) it may be calculated that equilibrium solid-solid demixing occurs only below room temperature.
Probable maximum inaccuracy in calculated liquidus (Fig. 31): ± 15°C.
KI(A) + LiI(B)
Liquidus points of this system have been reported,215-217 obtained from cooling curves215,217 and the visual-polythermal method.216 Only in Refs. 216 and 217 are the data tabulated. A summary of the results is as follows:
Eutectic
TiC X B Ref.
260 286 285
0.631 0.632 0.635
215 216 217
There is a discrepancy of 25°C in the eutectic temperature. The reported KI melting point of Ref. 216 is 20°C higher than the accepted value; the reported Lil melting points215,216 are, respectively, 17 and 24°C lower. All three groups215-217 attest to the difficulty of preparing sufficiently pure anhydrous Lil from the trihydrate. The most careful preparation was done by Sridhar et al.217 by dehydration in vacuo in stages of increasing temperature over a two week period. The salt was tested for dryness by addition of molten
~ lithium; no gas evolution' was observed. The salt itself was dissolved in water, the pH of which did not change, indicating the absence of Li20 or LiOH. The cooling curve experiments were performed in a helium atmosphere. In view of the precautions taken in this work,217 these results, although confined to the composition interval 0.575,xB ,0.7, were chosen as the basis of the present calculations.
Eutectic arrests were observed in two studies,215,217 the first covering a wider composition range 0.078,xB ,0.9. The limiting liquidus slopes at both extremes suggest that there is negligible solid solubility, and none was assumed here.
The exeess enthalpy of the liquid has been measured by direct calorimetry at 740 °C by Melnichak and Kleppa,214 whose result is used here:
.u
HE(1) = XAXB ( - 11 393 - 2824xB) J ll1ol- 1• (97)
700 .....,....,...,.....,..,.......,...,.....,..,.......,...,.....,..,.......,...,.....,..,.......,...,.....,..,.......,...,.....,..T""I""'I'..,.....,..,.......,...,.....,..,.......,.~~~
600
. 0.21
• Ret. 213 (liquidus)
400 U""O'~.w.....~O~.2"""""" ..... 0.L...3"""""" ..... 0.L...4 ............. 0.L...5 ............... 0.Lo.6 ................ 0""::".7 .......... "':'O""::".8 .......... "':'O":'.9 ................
NaI LiI Mole Fraction NaI
FIG. 31. The system LH(A) + NaI(B).
J. Phys. Chern. Ref. Data, Vol. 16, No.3, 1987
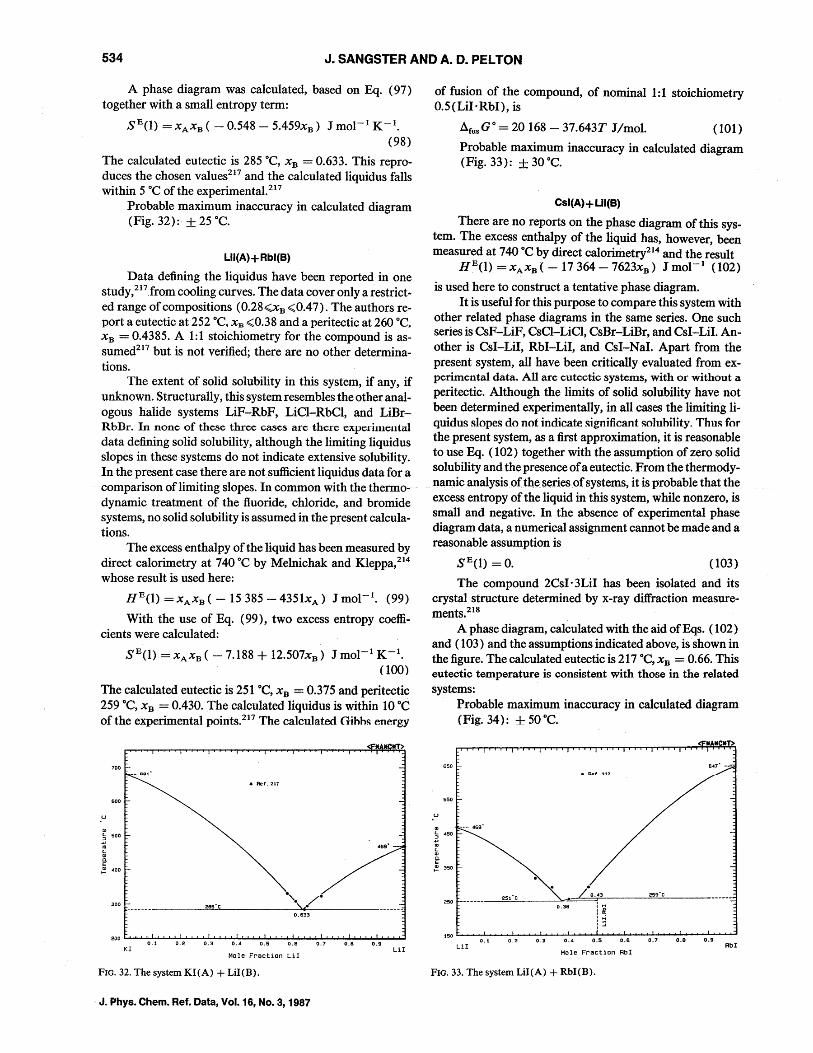
534 J. SANGSTER AND A. D. PELTON
A phase diagram was calculated, based on Eq. (97) together with a small entropy term:
SE(l) = XAXB ( - 0.548 - 5.459xB ) J mol- 1 K- 1. (98)
The calculated eutectic is 285°C, x B = 0.633. This reproduces the chosen values217 and the calculated liquidus falls within 5 °C of the experimental.217
Probable maximum inaccuracy in calculated diagram (Fig. 32): ± 25°C.
LiI(A) + Rbl(B)
Data defining the liquidus have been reported in one study,217.from cooling curves. The data cover only a restricted range of compositions (0.28 <xB <0.47). The authors report a eutectic at 252°C. X B <0.38 and a peritectic at 260°C. X B = 0.4385. A 1:1 stoichiometry for the compound is assumed217 but is not verified; there are no other determinations.
The extent of solid solubility in this system, if any, if unknown. Structurally, this system resembles the other analogous halide systems LiF-RbF, LiCI-RbCI, and LiBrRbDr. In none of these three cases are there experimental data defining solid solubility, although the limiting liquidus slopes in these systems do not indicate extensive solubility. In the present case there are not sufficient liquidus data for a comparison oflimiting slopes. In common with the thermo- -dynamic treatment of the fluoride, chloride, and bromide systems, no solid solubility is assumed in the present calculations.
The excess enthalpy of the liquid has been measured by direct calorimetry at 740°C by Melnichak and Kleppa,214 whose result is used here:
HE(l) = XAXB ( - 15385 -4351xA ) J mol-I. (99)
With the use of Eq. (99), two excess entropy coefficients were calculated:
SE(l) = XAXB ( - 7.188 + 12.507xB ) J mol- 1 K- 1. (100)
The calculated eutectic is 251°C, XB = 0.375 and peritectic 259°C, X B = 0.430. The calculated liquidus is within 10°C of the experimental points.217 The calculated Gihh~ energy
700 -- sat'"
• Ref. 217
600
.u
Q.I <- sao ::> .... '" <-Q.I C.
~ 400
28S'C
0.633
200 0.1 0.2 0.3 0.4 0.5 0.7
KI LiI Mole Fraction LiI
FIG. 32. The system KI(A) + LiI(B).
J. Phys. Chem. Ref. Data, Vol. 16, No.3, 1987
of fusion of the compound, of nominal 1: 1 stoichiometry 0.5(LiI·RbI), is
Afus G o = 20168 - 37.643T J/mol. (101)
Probable maximum inaccuracy in calculated diagram (Fig. 33): ± 30°C.
Csl(A) + LiI(S)
There are no reports on the phase diagram of this system. The excess enthalpy of the liquid has, however, been measured at 740 °C by direct calorimetry2I4 and the result
HE(l) = XAXB ( - 17364 -7623xB ) J mol- 1 (102)
is used here to construct a tentative phase diagram. It is useful for this purpose to compare this system with
other related phase diagrams in the same series. One such series is CsF-LiF, CsCI-LiCI, CsBr-LiBr, and CsI-Lil. Another is CsI-LiI, RbI-LiI, and CsI-Nal. Apart from the present system, all have been critically evaluated from experimental data. All are eutectic systems, with or without a peritectic. Although the limits of solid solubility have not been determined experimentally, in all cases the limititig liquidus slopes do not indicate significant solubility. Thus for the present system, as a first approximation, it is reasonable to use Eq. (102) together with the assumption of zero solid solubility and the presence of a eutectic. From the thermodynamic analysis of the series of systems, it is probable that the excess entropy of the liquid in this system, while nonzero, is small and negative. In the absence of experimental phase diagram data, a numerical assignment cannot be made and a reasonable assumption is
SE(l) = O. (103)
The compound 2CsI' 3LiI has been isolated and its crystal structure determined by x-ray diffraction measurements.218
A phase diagram, calculated with the aid ofEqs. (102) and (103) and the assumptions indicated above, isshown in the figure. The calculated eutectic is 217°C, X B = 0.66. This eutectic temperature is consistent with those in the related systems:
150
Probable maximum inaccuracy in calculated diagram (Fig. 34): ± 50°C.
2S1'C 259·C
0.38 ~ I
3 0.1 0.2 0.3 0.4 O.S 0.6 0.7 0.8 0.9
LiI RbI Mole Fraction RbI
FIG. 33. The system LiI(A) + RbI (B).
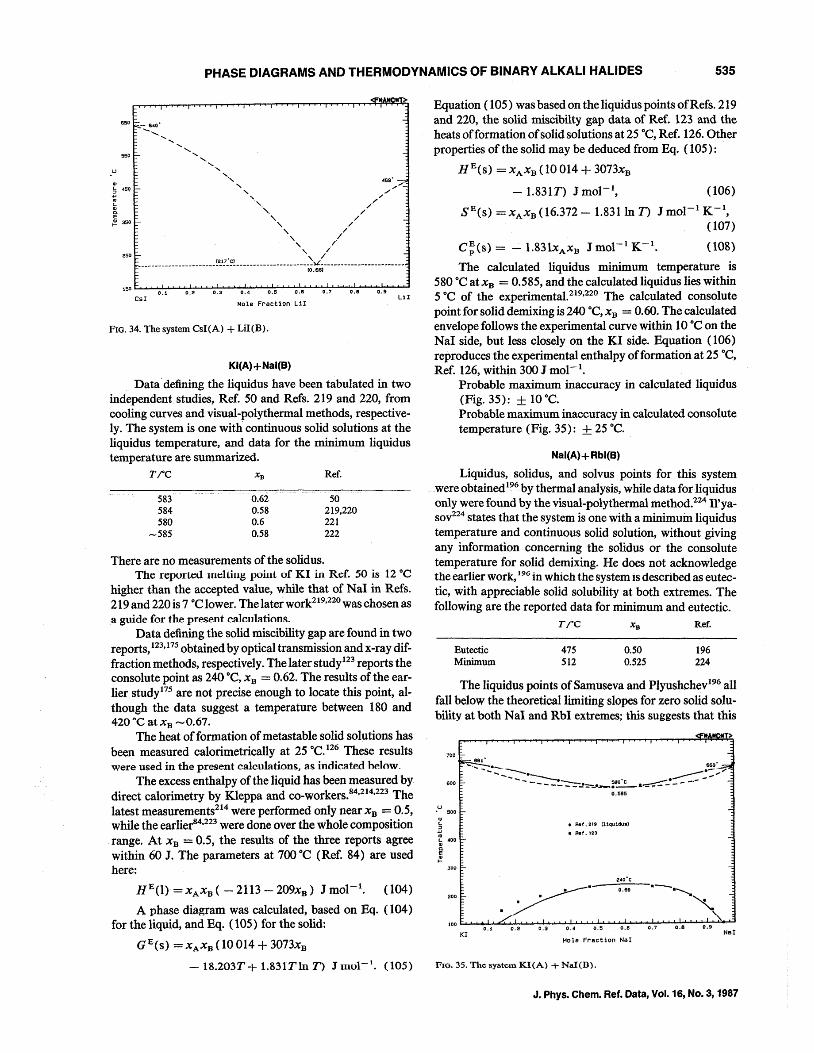
PHASE DIAGRAMS AND THERMODYNAMICS OF BINARY ALKALI HALIDES 535
.... If
- 640'
............................
"- , ,. , ., , " , ~/ , / , /
" ,,/,' " /
" / , ./ , //
", /
" // _______________________ ~::S.?~:~ ______________________ ~')./.. ________________________ _ (0.66)
0.5 0.6 0.7 0.9 0.2 CsI
Mole Fraction LiI LiI
FIG. 34. The system CsI(A) + LiI(B).
KI(A) + Nal(8)
Data defining the liquidus have been tabulated in two independent studies, Ref. 50 and Refs. 219 and 220, from cooling curves and visual-polythermal methods, respectively. The system is one with' continuous solid solutions at the liquidus temperature, and data for the minimum liquidus temperature are summarized.
TiC XB Ref.
583 584 580
,....585
0.62 0.58 0.6 0.58
There are no measurements of the solidus.
50 219,220 221 222
The repurteu IIleltillg poillt of KI in Ref. 50 is 12°C higher than the accepted value, while that of NaI in Refs. 219 and 220 is 7 °C lower. The later work219
,22o was chosen as a guide for the present calculations.
Data defining the solid miscibility gap are found in two reports, 123.175 obtained by optical transmission and x-ray diffraction methods, respectively. The later study 123 reports the consolute point as 240 °C, xB = 0.62. The results of the earlier study175 are not precise enough to locate this point, although the data suggest a temperature between 180 and 420 ftC at XB --0.67.
The heat of formation of metastable solid solutions has been measured calorimetrically at 25°C. 126 These results were used in the present calculations, as indicated below.
The excess enthalpy of the liquid has been measured by direct calorimetry by Kleppa and co_workers.84
,214,223 The latest measurements214 were performed only near X B = 0.5, while the earlier84,223 were done over the whole composition range. At XB = 0.5, the results of the three reports agree within 60 J. The parameters at 700 °C (Ref. 84) are used here:
H E(l) = X A XB ( - 2113 - 209xB) J mol-I. (104)
A phase diagram was calculated, based on Eq. (104) for the liquid, and Eq. (105) for the solid:
GE(s) = XAXB (10014 + 3073xB
-18.203T+ 1.831Tln T) Jlnul- 1• (lOS)
Equation ( 105) was based on the liquidus points of Refs. 219 and 220, the solid miscibilty gap data of Ref. 123 and the heats offormation of solid solutions at 25°C, Ref. 126. Other properties of the solid may be deduced from Eq. (105):
HE(S) = XAXB (10014 + 3073xB
- 1.831T) J mol-I, (106)
SEes) = XAXB (16.372 - 1.831 In T) J mol- 1 K-I, (107)
C;(s) = -1.831xA xB Jmol- 1 K- 1• (108)
The calculated liquidus minimum temperature is 580°C at X B = 0.585, and the calculated liquidus lies within 5°C of the experimenta1.219,220 The calculated consolute point for solid demixing is 240°C, X B = 0.60. The calculated envelope follows the experimental curve within 10°C on the NaI side, but less closely on the KI side. Equation (106) reproduces the experimental enthalpy of formation at 25°C, Ref. 126, within 300 J mol-I.
Probable maximum inaccuracy in calculated liquidus (Fig. 35): ± 10°C. Probable maximum inaccuracy in calculated consolute temperature (Fig. 35): ± 25°C.
Nal(A)+ Rbl{B)
Liquidus, solidus, and solvus points for this system were obtained 196 by thermal analysis, while data for liquidus only were found by the visual-poly thermal method.224 Il'yaSOV
224 states that the system is one with a minimuin liquidus temperature and continuous solid solution, without giving any information concerning the solidus or the consolute temperature for solid demixing. He does not acknowledge the earlier work, 196 in which the system is described as eutectic, with appreciable solid solubility at both extremes. The following are the reported data for minimum and eutectic.
Eutectic Minimum
Trc
475 512
0.50 0.525
Ref.
196 224
The liquidus points of Samuseva and Plyushchev196 all fall below the theoretical limiting slopes for zero solid solubility at both NaI and RbI extremes; this suggests that this
700
1i00
u • !i00
II> t..
~ ~ AOO
!
200
• Ret. 219 Il1quldu.)
• Ret. 123
240'C
0.60 ............. .~
\. 100 I:..IKI .............. 0.us....o:::A..J.JO.i.:-I.2 ............ &...10.-:-'-3 ............ ...u. ............ 0-":.5~-':.I.:: ........ -'::O..!::.7 .......... ~o~.e ............ .I;:'O.'="9 ....,...Na ...... r
Mole Fraction NaI
FlO. 35. The system Kl(A) + NaI(D}.
J. Phys. Chern. Ref. Data, Vol. 16, No.3, 1987
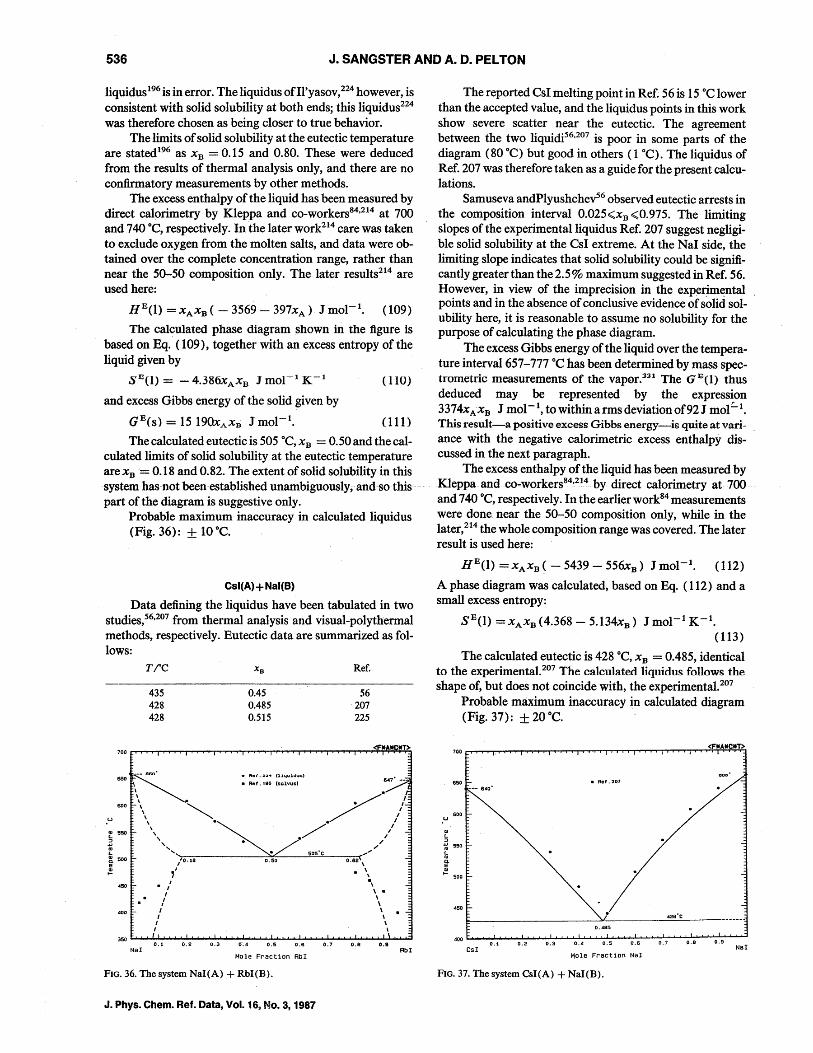
536 J. SANGSTER AND A. D. PELTON
liquidus196 is in error. The liquidus ofIl'yasov,224 however, is consistent with solid solubility at both ends; this liquidus224
was therefore chosen as being closer to true behavior. The limits of solid solubility at the eutectic temperature
are statedl96 as X B = 0.15 and 0.80. These were deduced from the results of thermal analysis only, and there are no confirmatory measurements by other methods.
The excess enthalpy of the liquid has been measured by direct calorimetry by Kleppa and co-workers84,214 at 700 and 740°C, respectively. In the later work214 care was taken to exclude oxygen from the molten salts, and data were obtained over the complete concentration range, rather than near the 50--50 composition only. The later results214 are used here:
HE(l) = XAXB ( - 3569 - 397xA ) J mol-I. (l09)
The calculated phase diagram shown in the figure is based on Eq. (109), together with an excess entropy of the liquid given by
SE(l) = - 4.386xA X B J mol- 1 K- 1
and excess Gibbs energy of the solid given by
GE(s) = 15 190xA xB J mol-I.
(110)
(111)
The calculated eutectic is 505°C, X B = 0.50 and the calculated limits of solid solubility at the eutectic temperature arexB = 0.18 and 0.82. The extent of solid solubility in this system has-not been established unambiguously, and so this part of the diagram is suggestive only.
Probable maximum inaccuracy in calculated liquidus (Fig. 36): ± 10°C.
Cst(A) + Nat(B)
Data defining the liquidus have been tabulated· in two studies,56,207 from thermal analysis and visual-polythermal methods, respectively. Eutectic data are summarized as follows:
TiC
435 428 428
700
060· 650
0.45 0.485 0.515
• flcf. "24 (llQUldU15)
• Rat .• 96 Isolvus)
Ref.
56 207 225
.u
\
\, ''''-. / / \\\\ ~. / /,,' i 5S0
~ SOD
~ 4SO
NaI
'" ..... 'T,.-::---~--·-~./~_·-=S=05'-".C---=-OB::=(2(" ....... " ,'0.18 0.50 . \
.' \ I ~
I I
I
" I I
I I
0.1
\ \ . \ \ \ \ \ \
0.2 0.3 0·.4 0.5 0.7 O.B 0.9
Mole Fraction RbI
FIG. 36. The system NaI(A) + RbI(B).
J. Phys. Chern. Ref. Data, Vol. 16, No.3, 1987
RbI
The reported CsI melting point in Ref; 56 is 15°C lower than the accepted value, and the liquidus points in this work show severe scatter near the eutectic. The agreement between the two liquidi56,207 is poor in some parts of the diagram (80°C) but good in others (1°C). The liquidus of Ref. 207 was therefore taken as a guide for the present calculations.
Samuseva andPlyushchev>6 observed eutectic arrests in the composition interval 0.025<xB <0.975. The limiting slopes of the experimental liquidus Ref. 207 suggest negligible solid solubility at the CsI extreme. At the NaI side, the limiting slope indicates that solid solubility could be significantly greater than the 2.5% maximum suggested in Ref. 56. However, in view of the imprecision in the experjm~ntal points and in the absence of conclusive evidence of solid solubility here, it is reasonable to assume no solubility for the purpose of calculating the phase diagram.
The excess Gibbs energy of the liquid over the temperature interval 657-777 °C has been determined by mass spectrometric measurements of the vap0r.331 The a B (1) thus deduced may be represented by the expression 3374xA X B J mol-I, to within a rms deviation of92J mol!'.. 1.
This result-a positive excess Gibbs energy-is quite at variance with the negative calorimetric excess enthalpy discussed in the next paragraph.
The excess enthalpy of the liquid has been measured by Kleppa-and co-workers84,21~ by direct calorimetry at 700 and 740 °C, respectively. In the earlier work84 measurements were done. near the 50--50 composition only, while in the later,214 the whole composition range was covered. The later result is used here:
HE(l) =XAXB ( - 5439 - 556xB ) Jmol- I. (112)
A phase diagram was calculated, based on Eq. (112) and a small excess entropy:
SE(l) =XA xB (4.368 - 5.134xB ) Jmol-1 K- 1•
( 113)
The calculated eutectic is 428°C, x B = 0.485, identical to the experimental207 The calculated liquidus follows the shape of, but does not coincide with, the experimental. 207
Probable maximum inaccuracy in calculated diagram (Fig. 37): ± 20°C.
420'C
0.48S
0.1 0.3 0.4 0.5 0.7 0.0 0.9 NaI CsI
Mole Fraction NaI
FIG. 37. The system CsI(A) + NaI(B).
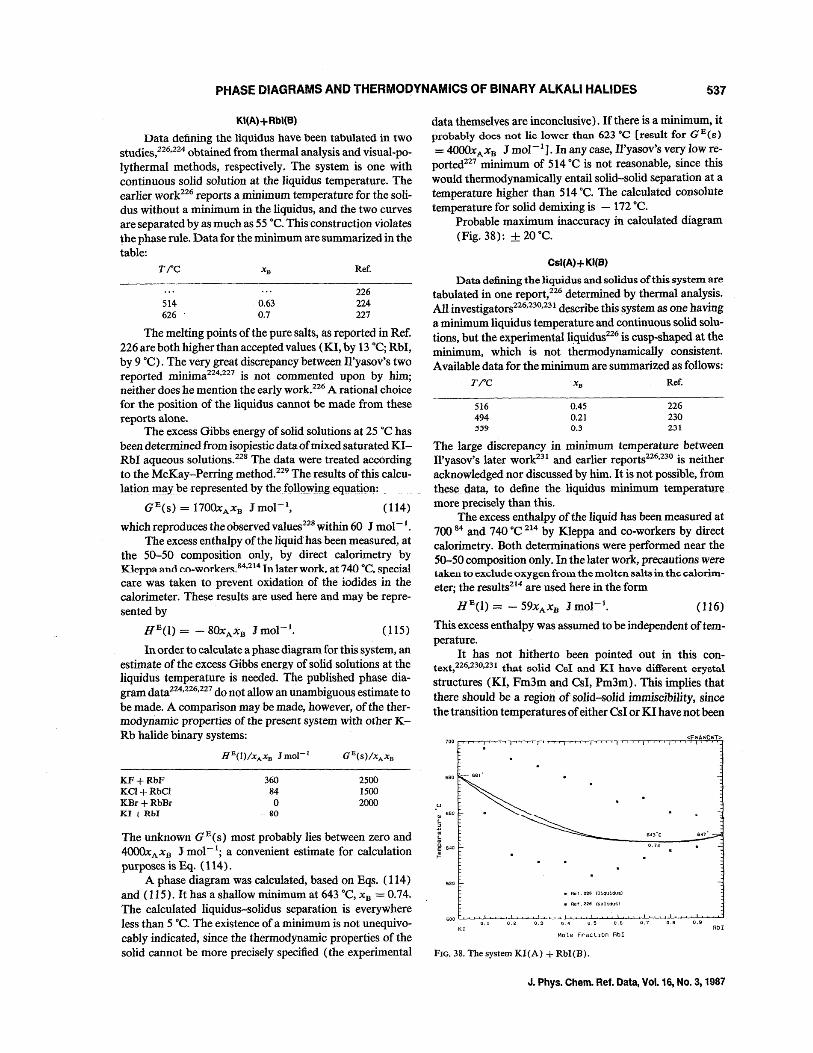
PHASE DIAGRAMS AND THERMOQYNAMICS OF BINARY ALKALI HALIDES 537
KI(A)+ Rbl(B)
Data defining the liquidus have been tabulated in two studies,226.224 obtained from thermal analysis and visual-polythermal methods, respectively. The system is one with continuous solid solution at the liquidus temperature. The earlier work226 reports a minimum temperature for the solidus without a minimum in the liquidus, and the two curves are separated by as much as 55°C. This construction violates ~he phase rule. Data for the minimum are summarized in the table:
TiC Ref.
226 514 0.63 224 626 0.7 227
The melting points of the pure salts, as reported in Ref. 226 are both higher than accepted values (KI, by 13°C; RbI, by 9°C). The very great discrepancy between Il'yasov's two reported minima224.227 is not commented upon by him; neither does he mention the early work. 226 A rational choice for the position of the liquidus cannot be made from these reports alone.
The excess Gibbs energy of solid solutions at 25°C has been determined from isopiestic data of mixed saturated KIRbI aqueous solutions.228 The data were treated according to the McKay-Perring method.229 The results of this calculation may be represented by the~ foll()wing equation:
GE(s) = 1700xA x B Jmol-t, (114)
which reproduces the observed values228 within 60 J mol-I. The excess enthalpy of the liquid'has been measured, at
the 50-50 composition only, by direct calorimetry by Kleppa and co-worker~. 84.2I4 1n later work. at 740°C. special care was taken to prevent oxidation of the iodides in the calorimeter. These results are used here and may be repre~ sented by
(115)
In order to calculate a phase diagram for this system, an estimate of the excess Gibbs energy of solid solutions at the liquidus temperature is needed. The published phase diagram data224,226,227 do not allow an unambiguous estimate to be made. A comparison may be made, however, of the thermodynamic properties of the present system with other KRb halide binary systems:
KF+RbF KCI+RbCI KBr+RbBr KI I RbI
360 84 o
80
2500 1500 2000
The unknown GE(s) most probably lies between zero and 4000x A X B J mol- 1; a convenient estimate for calculation purposes is Eq. (114).
A phase diagram was calculated, based on Eqs. (114) and (115). It has a shallow minimum at 643°C, X B = 0.7.4. The calculated liquidus-solidus separation is everywhere less than 5°C. The existence of a minimum is not unequivocably indicated, since the thermodynamic properties of the solid cannot be more precisely specified (the experimental
data themselves are inconclusive). If there is a minimum, it probably does not lie lower than 623°C [result for GE(s} = 4000x A X B J mol-I]. In any case, Il'yasov's very low reported227 minimum of 514°C is not reasonable, since this would thermodynamically entail solid-solid separation at a temperature higher than 514°C. The calculated consolute temperature for solid demixing is - 172°C.
Probable maximum inaccuracy in calculated diagram (Fig. 38): ± 20°C.
Csl(A)+ KI(B)
Data defining the liquidus and solidus of this system are tabulated in one report,226 determined by thermal analysis. AUinvestigators226,23o,231 describe this system as one having a minimum liquidus temperature and continuous solid solutions, but the experimental ~quidus226 is cusp-shaped at the minimum, which is not thermodynamically consistent. Available data for the minimum are summarized as follows:
TI"C X B Ref.
516 494 ~'9
0.45 0.21 0.3
226 230 231
The large discrepancy in minimum temperature between Il'yasov's later work231 and earlier reports226,230 is neither acknowledged nor discussed by him. It is not possible, from
~ these data, to define the liquidus minimum temperature more precisely than this.
The excess enthalpy of the liquid has been measured at 700 84 and 740°C 214 by Kleppa and co-workers by direct calorimetry. Both determinations were performed near the 50-50 composition only. In the later work, precautions were taken to exclude oxygen. fJ:on.1. the molten salts in the calorimeter; the results214 are used here in the form
HE(l) = - 59xA x B J mol-I. (116)
This excess enthalpy was assumed to be independent oftemperature.
It has not hitherto been pointed out in this context,226.230,231 that solid Csl and Kl have different crystal
structures (KI, Fm3m and CsI, Pm3m). This implies that there should be a region of solid-solid immiscibility, since the transition temperatures of either CsI or KI have not been
• Ref.226 (liquidus)
• Aef. 226 'soliduS)
KI RbI Mole Fraction RbI
FIG. 38. The system KI(A) + RbI(B).
J. Phys. Chern. Ref. Data, Vol. 16, No.3, 1987
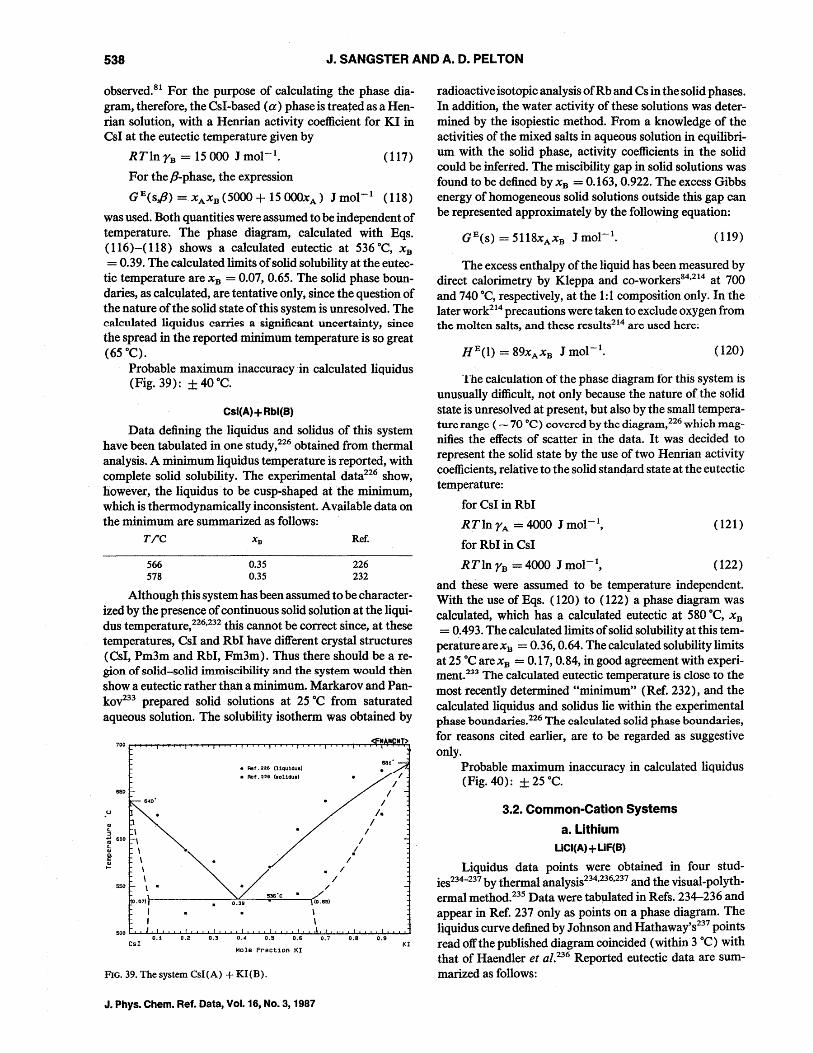
538 J. SANGSTER AND A. D. PELTON
observed.81 For the purpose of calculating the phase diagram, therefore, the CsI -based (a) phase is treated as a Henrian solution, with a Henrian activity coefficient for KI in CsI at the eutectic temperature given by
RTln rB = 15000 J mol-I. (117)
For the !J-phase, the expression
GE(s,{J) =XAXB (5000 + 15 oooxA ) J mol-I (118)
was used. Both quantities were assumed to be independent of temperature. The phase diagram, calculated with Eqs. (116)-( 118) shows a calculated eutectic at 536°C, X B = 0.39. The calculated limits of solid solubility at the eutec-
tic temperature are XB = 0.07,0.65. The solid phase boundaries, as calcqlated, are tentative only, since the question of the nature of the solid state of this system is unresolved. The calculated liquidus carries a significant uncertainty, since the spread in the reported minimum temperature is so great (65°C).
Probable maximum inaccuracy in calculated liquidus (Fig. 39): ± 40 DC.
Csl(A) + Rbl(B)
Data defining the liquidus and solidus of this system have been tabulated in one study,226 obtained from thermal analysis. A minimum liquidus temperature is reported, with complete solid solubility. The experimental data226 show, however, -the liquidus -to be cusl':'shaped at the minimum, which is thermodynamically inconsistent. Available data on the minimum are summarized as follows:
T;oC XB Ref.
566 578
0.35 0.35
226 232
Although this system has been assumed to be characterized by the presence of continuous solid solution at the liquidus temperature,226,232 this cannot be correct since, at these temperatures, CsI and RbI have different crystal structures (CsI, Pm3m and RbI, Fm3m). Thus there should be a region of solid-solid immiscibility and the system would then show a eutectic rather than a minimum. Markarov and PankOV233 prepared solid solutions at 25°C from saturated aqueous solution. The solubility isotherm was obtained by
650
- 640'
• u
., 5 \ ~ 600 \
~ \
~ \ \ \
550 \ . .07) l
I I
500
• Ref. 226 (UquiduI)
• Ref. 226 (lol1dul)
/ . // \(0.65)
\ \ \
I /
I I
I I
I·
68t' -
I I •
/ I
I
0.1 0.2 0.3 0.4 0.5 0.6 0.7 O.B 0.9 CsI KI
Mole FrBction KI
FIG. 39. The system CsI(A) + KI(B).
J. Phys. Chern. Ref. Data, Vol. 16, No.3, 1987
radioactive isotopic analysis ofRb and Cs in the solid phases. In addition, the water activity of these solutions was determined by the isopiestic method. From a knowledge of the activities of the mixed salts in aqueous solution in equilibrium with the solid phase, activity coefficients in the solid could be inferred. The miscibility gap in solid solutions was found to be defined by X B = 0.163, 0.922. The excess Gibbs energy of homogeneous solid solutions outside this gap can be represented approximately by the following equation:
(119)
The excess enthalpy of the liquid has been measured by direct calorimetry by Kleppa and co-workers84,214 at 700 and 740 DC, respectively, at the 1:1 composition only. In the later work214 precautions were taken to exclude oxygen from the molten salts, and these results214 are used here;
(120)
'I 'he calculation of the phase diagram for this system is unusually difficult, not only because the nature of the solid state is unresolved at present, but also by the small temperature range ( ~ 70°C) covered by the diagram,226 which magnifies the effects of scatter in the data. It was decided to represent the solid state by the use of two Henrian activity coefficients, relative to the solid standard state at the eutectic temperature:
for CsI in RbI
RTln rA = 4000 J mol-I,
for RbI in CsI
RTln rB = 4000 J mol-I,
(121)
(122)
and these were assumed to be temperature independent. With the use of Eqs. (120) to (122) a phase diagram was calculated, which has a calculated eutectic at 580°C, xB
= 0.493. The calculated limits of solid solubility at this temperature are X B = 0.36,0.64. The calculated solubility limits at 25°C arexB = 0.17, 0.84, in good agreement with experiment.233 The calculated eutectic temperature is close to the most recently determined "minimumH (Ref. 232), and the calculated liquidus and solidus lie within the experimental phase boundaries.226 The calculated solid ·phase boundaries, for reasons cited earlier, are to be regarded as suggestive only.
Probable maximum inaccuracy in calculated liquidus (Fig. 40): ± 25°C.
3.2. Common-Cation Systems
a. Lithium LiCI(A) + LiF(B)
Liquidus data points were obtained in four studies234-237 by thermal analysis234,236,237 and the visual-polyth-ermal method.235 Data were tabulated in Refs. 234-236 and appear in Ref. 237 only as points on a phase diagram. The liquidus curve defined by Johnson and Hathaway's237 points read off the published diagram coincided (within 3 °C) with that of Haendler et al. 236 Reported eutectic data are summarized as follows:
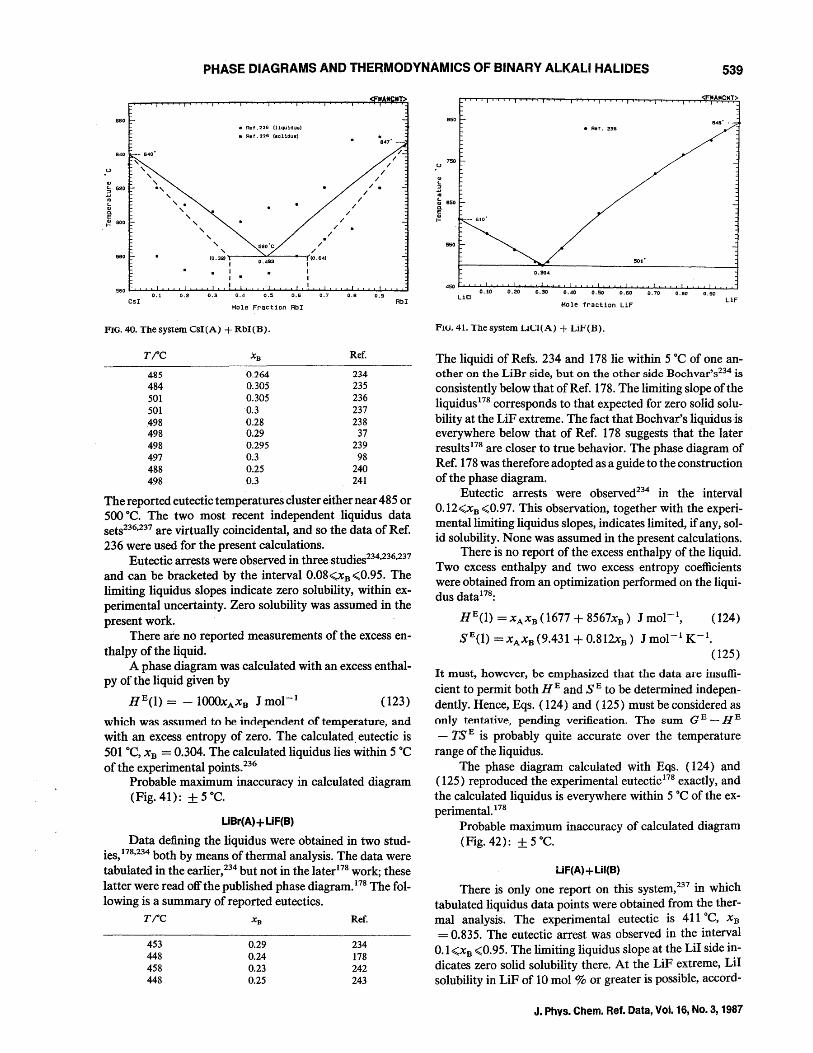
PHASE DIAGRAMS AND THERMODYNAMICS OF BINARY ALKALI HALIDES 539
660
- 6~0
SBO
0.1 esI
• Ret. 226 (lIquidusl
• Ret. 226 (soUdusl
, . / , / , / , / , / . , I
, 5BO'C /. , / (0.321'1-. -~0.-.£493---f'1 (0.641
I I • • I I •
.. ..
/ . /
0.2 O.S 0.8 0.9 RbI
Mole Fraction RbI
FIG. 40. The system CSI(A) + Rbl(B).
rrc 485 484 501 501 498 498 498 497 488 498
0.264 0.305 0.305 0.3 0.28 0.29 0.295 0.3 0.25 0.3
Ref.
234 235 236 237 238
37 239
98 240 241
The reponed eutectic temperatures cluster either near 485 or 500 DC. The two most recent independent liquidus data sets236.237 are virtually coincidental, and so the data of Ref. 236 were used for the present calculations.
Eutectic arrests were observed in three studies234.236.237 and can be bracketed by the interval 0.08<XB <0.95. The limiting liquidus slopes indicate zero solubility, withIn experimental uncertainty. Zero solubility was assumed in the present work.
There are no reported measurements of the excess enthalpy of the liquid.
A phase diagram was calculated with an excess enthalpy of the liquid given by
(123)
whlch wa.<:: a.!i:~llmed to he independent of temperature, and with an excess entropy of zero. The calculated. eutectic is 501°C, X B = 0.304. The calculated liquidus lies within 5 °C of the experimental points.236
Probable maximum inaccuracy in calculated diagram (Fig. 41): ± 5°C.
LlBr(A) + LlF(B)
Data defining the liquidus were obtained in two studies, 178.234 both by means of thermal analysis. The data were tabulated in the earlier,234 but not in the later178 work; these latter were read off the published phase diagram. 178 The following is a summary of reported eutectics.
rrc X B Ref.
453 448 458 448
0.29 0.24 0.23 0.25
234 178 242 243
<FtfAtfCIIT>
850
• Rot. 236
750 .u
550
sos·
0.3U
450 ........... '"'""':""0 .'=to ............. 70 .~20 ............. 70 .~30 ............. ~0 .~40 .................. 0 .L...ISo ............. ~ .................. o .L...I70
................. 0
.L.....80 .................. 0 .L.....90
............. ....J Liel LiF
Mole fraction LiF
FlU. 41. The system LiCl(A) + UF(B).
The liquidi of Refs. 234 and 178 lie within 5 °C of one another on the LiBr side, but on the other side Bochvar's234 is consistently below that of Ref. 178. The limiting slope of the liquidus178 corresponds to that expected for zero solid solubility at the LiF extreme. The fact that Bochvar's liquidus is everywhere below that of Ref. 178 suggests that the later results178 are closer to true behavior. The phase diagram of Ref. 178 was therefore adopted as a guide to the construction of the phase diagram.
Eutectic arrests were observed234 in the interval 0.12<xB <0.97. This observation, together with the experimental limiting liquidus slopes, indicates limited, if any, solid solubility. None was assumed in the present calculations.
There is no report of the excess enthalpy of the liquid. Two excess enthalpy and two excess entropy coefficients were obtained from an optimization performed on the liquidus datal78:
HE(l) = XAXB (1677 + 8567xB ) J mol-I, (124)
SE(l) = XAXB (9.431 + 0.812xB ) J mol- l K- 1•
(125)
It must, however, be emphasized that the data arc insufficient to permit both HE and SE to be determined independently. Hence, Eqs. (124) and (125) must be considered as only t~nt::ttlve, pending verification. The sum G E - HE - TS E is probably quite accurate over the temperature
range of the liquidus. The phase diagram calculated with Eqs. (124) and
(125) reproduced the experimental eutecticl78 exactly, and the calculated liquidus is everywhere within 5 °C of the experimental. l78
Probable maximum inaccuracy of calculated diagram (Fig. 42): ± 5°C.
LiF(A) + LiI(B)
There is only one report on this system,237 in which tabulated liquidus data points were obtained from the thermal analysis. The experimental eutectic is 411°e, X B
= 0.835. The eutectic arrest was observed in the interval 0.1 <xB <0.95. The limiting liquidus slope at the Lil side indicates zero solid solubility there. At the LiF extreme, LiI solubility in LiF of 10 mol % or greater is possible, accord-
J. Phys. Chern. Ref. Data, Vol. 16, No.3, 1987
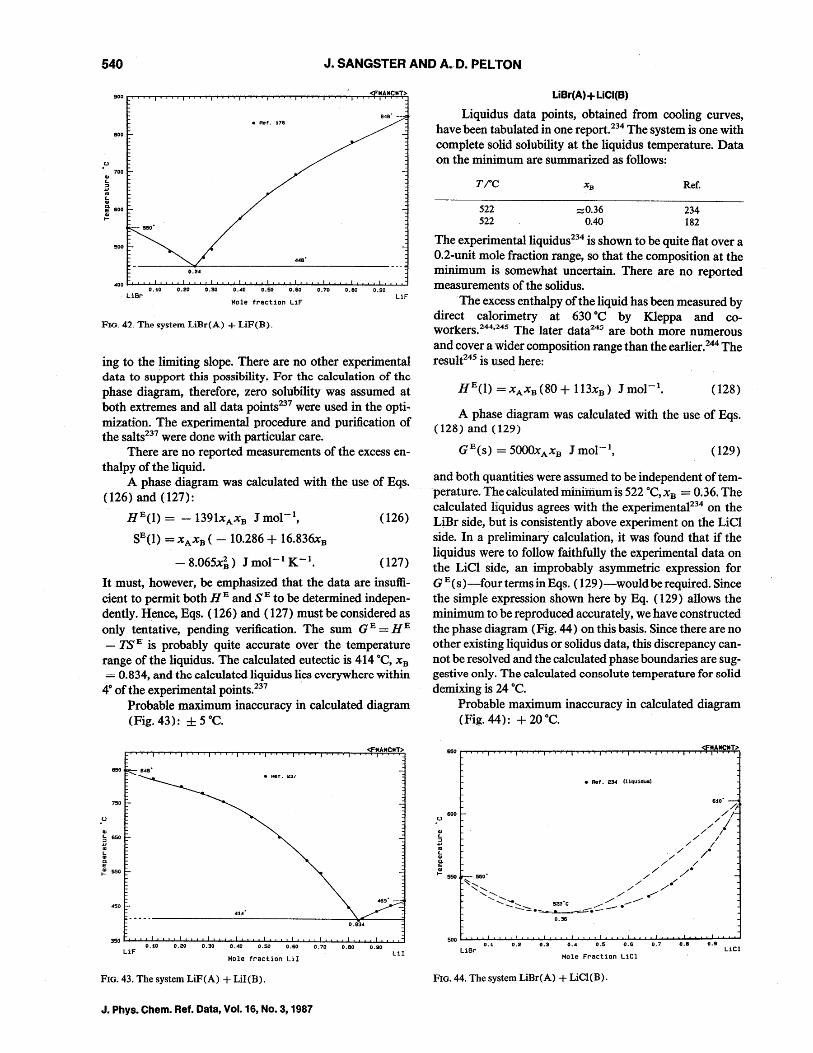
540 J. SANGSTER AND A.cD. PELTON
.<.l
... '-
~ ~
BOO
700
! 500
500
848" --• Ret. 178
<100 L-.I,...o. .......... L-.I,...o. .......... J...o....I. .......... J...o....I. .......... .I...<...&. .......... .I...<...&. .......... .I...<...&. .......... .I...<...&. ............ .r......... ............ .r....................:J O.SO 0.20 0.30 0.<10 0.50 0.50 0.70 0.80 0.90
. LiBr LiF Mole fraction LiF
FIG. 42. The system LiBr(A) + LiF(B).
ing to the limiting slope. There are no other experimental data to support this possibility. For thc calculation of thc phase diagram, therefore, zero solubility was assumed at both extremes and all data points237 were used in the optimization. The experimental procedure and purification of the salts237 were done with particular care.
There are no reported measurements of the excess enthalpy of the liquid.
A phase diagram was calculated with the use of Eqs. (126) and (127):
HE(l) = - 1391xA x B J mol-I,
SE(l) = XAXB ( - 10.286 + 16.836xB
- 8.065.xi.) J mol- 1 K- 1•
(126)
(127)
It must, however, be emphasized that the data are insufficient to permit both HE and SE to be determined independently. Hence, Eqs. (126) and (127) must be considered as only tentative, pending verification. The sum G E = HE - TS E is probably quite accurate over the temperature
range of the liquidus. The calculated eutectic is 414°C, xB
= 0.834, and the calculated liquidus lies everywhere within 4° of the experimental points.237 '
Probable maximum inaccuracy in calculated diagram (Fig. 43): ± 5°C.
.<.l
... i ~o E ~ 550
<ISO
<FMAMCMT>
<114
350 ....... ...1..1:-0 • .i:':soL..&...L.-':-o .~20L..&...L.-':-0 .~30L..L..L-L.O .J...<loL..&...L.-L.o ,J...soL..L..L-L.o .J...so ........ -L.o .L70
......... -L.O
.Lao .............. o .Lgo ......... -w LiF
Mole fraction LiI LiI
FIG. 43. The system LiF(A) + LiI(B).
J. Phys. Chern. Ref. Data, Vol. 16, No.3, 1987
LiBr(A)+ LiCI(B)
Liquidus data points, obtained from cooling curves, have been tabulated in one report.234 The system is one with complete solid solubility at the liquidus temperature. Data on the minimum are summarized as follows:
TiC
522 522
:;::::0.36 0.40
Ref.
234 182
The experimentalliquidus234 is shown to be quite fiat over a D.2-unit mole fraction range, so that the composition at the minimum is somewhat uncertain. There are no reported measurements of the solidus.
The excess enthalpy of the liquid has been measured by direct calorimetry at 630°C by Kleppa and coworkers.244
,245 The later data245 are both more numerous and cover a wider composition range than the earlier.244 The resultz45 is used here:
(128)
A phase diagram was calculated with the use of Eqs. (128) and (129)
(129)
and both quantities were assumed to be independent of temperature. The calculated minimum is 522°C, xB = 0.36. The calculated liquidus agrees with the experimental234 on the LiBr side, but is consistently above experiment on the LiCI side. In a preliminary calculation, it was found that if the liquidus were to follow faithfully the experimental data on the LiCI side, an improbably asymmetric expression for GE(s)-fourtermsinEqs. (129)-would be required. Since the simple expression shown here by Eq. (129) allows the minimum to be reproduced accurately, we have constructed the phase diagram (Fig. 44) on this basis. Since there are no other existing liquidus or solidus data, this discrepancy cannot be resolved and the calculated phase boundaries are suggestive only. The calculated consolute temperature for solid demixing is 24°C.
Probable maximum inaccuracy in calculated diagram (Fig. 44): + 2D DC.
0,1 0.2 0.3 0.4 0.5 0.5 0.7 0.8 0.9 LiBr LiCl
Mole Fraction LiCl
FIG. 44. The system LiBr(A) + LiCl(B).
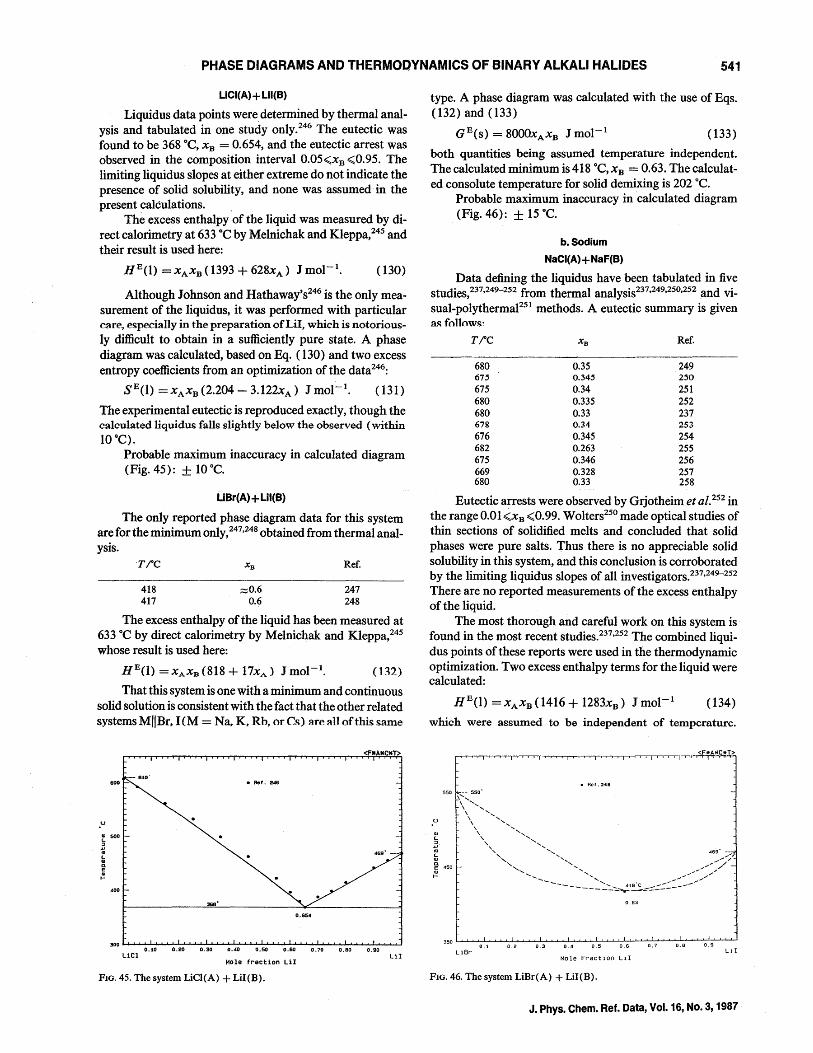
PHASE DIAGRAMS AND THERMODYNAMICS OF BINARY ALKALI HALIDES 541
LiCI(A) + LiI(B)
Liquidus data points were determined by thermal analysis and tabulated in one study only.246 The eutectic was found to be 368 DC, X B = 0.654, and the eutectic arrest was observed in the composition interval 0.05<;xB <;0.95. The limiting liquidus slopes at either extreme do not indicate the presence of solid solubility, and none was assumed in the present calculations.
The excess enthalpy of the liquid was measured by direct calorimetry at 633 DC by Melnichak and Kleppa,245 and their result is used here:
(130)
Although Johnson and Hathaway's246 is the only measurement of the liquidus, it was performed with particular care, especially in the preparation ofLiI, which is notoriously difficult to obtain in a sufficiently pure state. A phase diagram was calculated, based on Eq. (130) and two excess entropy coefficients from an optimization of the data246:
SE(l) = XAXB (2.204 - 3. 122xA ) J mol-I. (131)
The experimental eutectic is reproduced exactly, though the calculated liquidus falls slightly below the observed (within 10 DC).
Probable maximum inaccuracy in calculated diagram (Fig. 45): ± 10 DC.
LiBr(A) + LiI(B)
The only reported phase diagram data for this system are for the minimum only,247,248 obtained from thermal analysis.
TiC Ref.
418 ::::;0.6 247 417 0.6 248
The excess enthalpy of the liquid has been measured at 633 DC by direct calorimetry by Melnichak and Kleppa,245 whose result is used here:
(132)
That this system is one with a minimum and continuous solid solution is consistent with the fact that the other related systems MIIBr.I(M = Na. K. Rh. or Cs) are all of this same
<FMAMCMT>
600 • Ret. 246
469' --
400
0.65~
300~""""'L-.o...L...,o...I...JL-.o...L.""""'''''''''''''''''''''''''-'--'-''''''''''-'--'-'''''''''''''''''''''''''''''''''''''''''''''''''''''''''''''"""""",,,,,,,,,,,,,,,,,,,,,,,,,,,,,,,,,,,,, 0.10 0.20 0.30 0.40 0.50 0.60 0.70 0.80 0.90
Liel LiI Hole fraction LiI
FIG. 45. The system LiCl{A) + LiI(B).
type. A phase diagram was calculated with the use of Eqs. (132) and (133)
(133)
both quantities being assumed temperature independent. The calculated minimum is 418 DC, X B = 0.63. The calculated consolute temperature for solid demixing is 202 DC.
Probable maximum inaccuracy in calculated diagram (Fig. 46): ± 15 DC.
b.Sodium
NaCI(A) + NaF(B)
Data defining the liquidus have been tabulated in five studies,237,249-252 from thermal analysis237,249,25o,252 and vi-sual-polythermal251 methods. A eutectic summary is given as follows~
TiC XB Ref.
680 0.35 249 675 0.34' 2'0 675 0.34 251 680 0.335 252 680 0.33 237 67& 0.34 253 676 0.345 254 682 0.263 255 675 0.346 256 669 0.328 257 680 0.33 258
Eutectic arrests were observed by Grjotheim et al.252 in the range O.OI<;xB <;0.99. Wolters25o made optical studies of thin sections of solidified melts and concluded that solid phases were pure salts. Thus there is no appreciable solid solubility in this system, and this conclusion is corroborated by the limiting liquidus slopes of all investigators.237,249-252 There are no reported measurements of the excess enthalpy of the liquid.
The most thorough and careful work on this system is found in the most recent studies.237,252 The combined liquidus points of these reports were used in the thermodynamic optimization. Two excess enthalpy terms for the liquid were calculated:
(134)
which were assumed to be independent of temperature.
• Ref.248
0.3 0.5 0.7 LiBr L11
Mole Fraction L1I
FIG. 46. The system LiBr(A) + LiI(B).
J. Phys. Chern. Ref. Data, Vol. 16, No.3, 1987
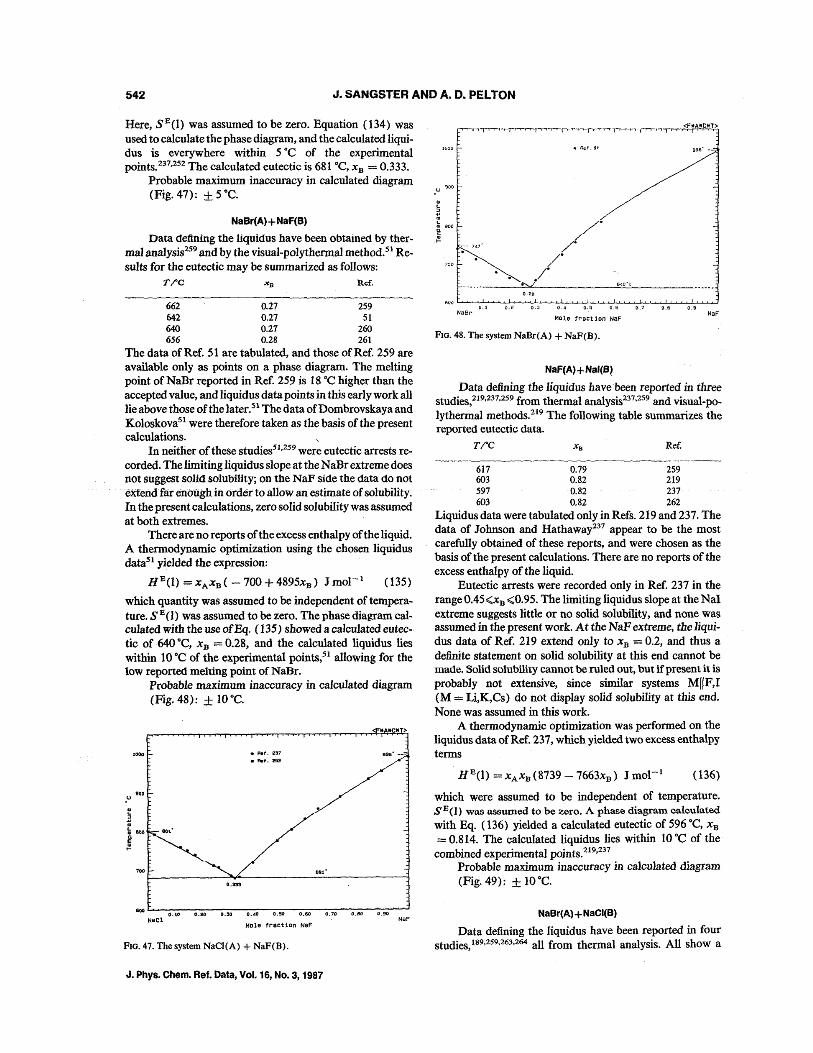
542 J. SANGSTER AND A,. D. PELTON
Here, SE(1) was assumed to be zero. Equation (134) was used to calculate the phase diagram, and the calculated liquidus is everywhere within 5 °C of the experimental points.237.252 The calculated eutectic is 681°C, X B = 0.333.
996' ---
Probable maximum inaccuracy in calculated diagram (Fig. 47): ± 50C. ,u 900
NaBr(A) + NaF(B)
Data defining the liquidus have been obtained by ther· mal analysis259 and by the visual·polythennal method.51 Re· sults for the eutectic may be summarized as follows:
TI'C Ref.
662 0.27 259 642 0.27 51 640 0.27 260 656 0.28 261
The data of Ref. 51 are tabulated, and those of Ref. 259 are available only as points on a phase diagram. The melting point of NaBr reported in Ref. 259 is 18°C higher than the accepted value, and liquidus data points in this early work all lie above those of the later. 51 The data ofDombrovskaya and Koloskova51 were therefore taken as the basis of the present calculations. "-
In neither of these studies51.259 were eutectic arrests recorded. The limiting liquidus slope at the NaBr extreme does not suggest solid solubility; on the NaF side the data do not extend far enough in order to allow an estimate of solubility. In the present calculations, zero solid solubility was assumed at both extremes.
There are no reports of the excess enthalpy of the liquid. A thermodynamic optimization using the chosen liquidus data51 yielded the expression:
HE(l) = xAxn ( 700 + 4895xB) J mol-1 (135)
which quantity was assumed to be independent of tempera· ture. SE(l) was assumed to be zero. The phase diagram calculated with the use ofEq. (135) showed a calculated eutectic of 640 °C, xB = 0.28, and the calculated liquidus lies within 10°C of the experimental points,Sl allowing for the low reported melting point of NaBr.
Probable maximum inaccuracy in calculated diagram (Fig. 48): ± 10°C.
IfAIfCIfT>
1000 • Ret. 237 996' ---• Ref. 252
700 681'
0.3.33
600~------------------------------~~~ 0.50 0.90 0.10 NaCl
Mole fraction NaF
FIG. 47. The system NaCl(A) + NaF(B).
J. Phys. Chern. Ref. Data, Vol. 16, NO.3, 1987
NaF
o.aa
0.3 O.!i 0.7 NeBr
Mole fraction NaF NaF
FIG. 48. The system NaBr(A) + NaF(B).
NaF(A) + Nal(B)
Data defining the liquidus have been reported in three studies,219,237,259 from thermal analysis237,259 and visual-po-lythermal methods.219 The following table summarizes the reported eutectic data.
TI"C Xa Ref.
617 0.79 259 603 0.82 219
"' Q~ D7 ~ Q~ 2~
Liquidus data were tabulated only in Refs. 219 and 237. The data of Johnson and Hathaway237 appear to be the most carefully obtained of these reports, and were chosen as the basis of the present calculations. There are no reports of the excess enthalpy of the liquid.
Eutectic arrests were recorded only in Ref. 237 in the range 0.45<XB <0.95. The limiting liquidus slope at the NaI extreme suggests little or no solid solubility, and none was assumed in the present work. At the NaF extreme, the liquidus data of Ref. 219 extend only to XB = 0.2, and thus a definite statement on solid solubility at this end cannot be lllade. Solid solubility cannot be ruled out, but if present it is probably not extensive, since similar systems MUF,I (M = Li,K,Cs) do not display solid solubility at this end. None was assumed in this work.
A thermodynamic optimization was performed on the liquidus data of Ref. 237, which yielded two excess enthalpy terms
. HE(l) =XAXB(8739 7663xB ) Jmol- 1 (136)
which were assumed to be independent of temperature. SE(l} was assumed to be zero. A phase diagram calculated with Eq. (136) yielded a calculated eutectic of 596°C, xB
= 0.814. The calculated liquidus lies within 10°C of the combined experimental points.219,237
Probable maximum inaccuracy in calculated diagram (Fig. 49): ± 10°C.
NaBr(A) + NaCl(B)
Data defining the liquidus have been reported in four studies,189,259,263,264 all from thermal analysis. All show a
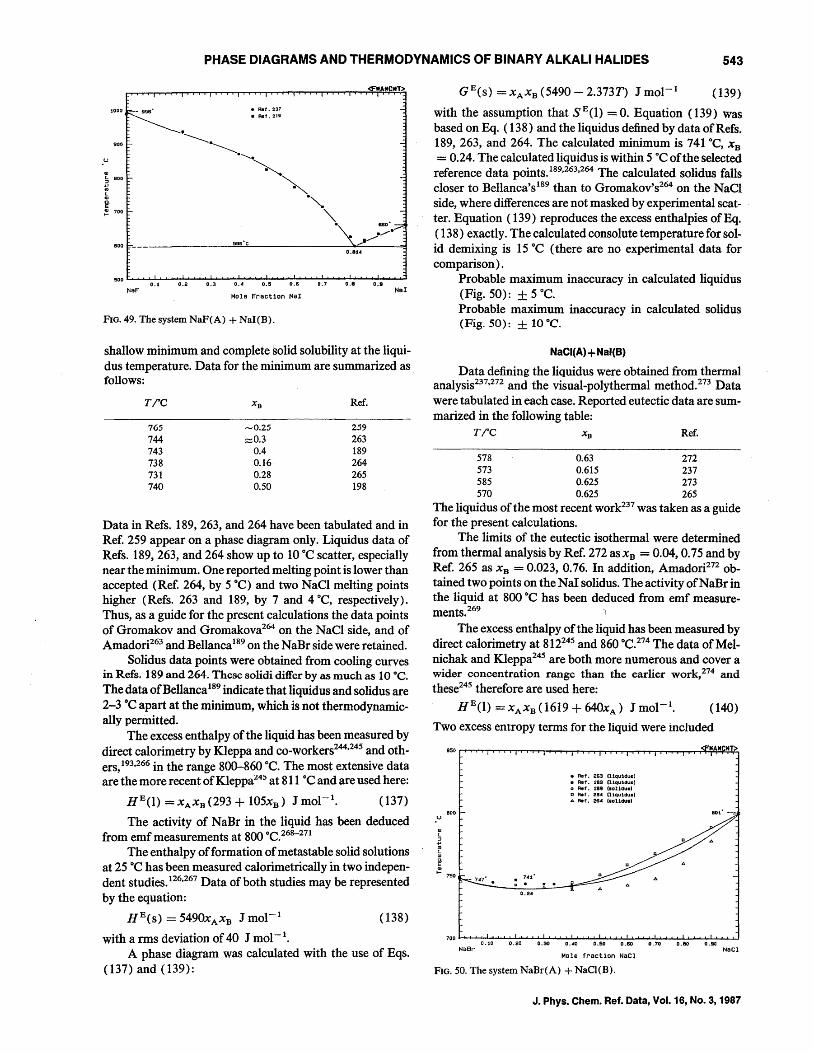
PHASE DIAGRAMS AND THERMODYNAMICS OF BINARY ALKALI HALIDES 543
• Ret. 231 • ReI. 218
900
GI
1800
e ~ 700
600
500 ~...........JL.............-.......J ............ ..........J.-"-'-..........L. ........... ...o..J...~..--I-......... ..&....1...o ........... ......L...o.-"-,-a...J....."""""""; 0.2 0.3 O.~ 0.5 0.6 0.7 0.8 0.9
NaF NaI Mole f.raction NaI
FIG. 49. The system NaF(A) + NaI(B).
shallow minimum and complete solid solubility at the liquidus temperature. Data for the minimum are summarized as follows:
TiC Xo Ref.
765 -0.25 259
744 ;::::0.3 263 743 0.4 189 738 0.16 264 731 0.28 265 740 0.50 198
Data in Refs. 189,263, and 264 have been tabulated and in Ref. 259 appear on a phase diagram only. Liquidus data of Refs. 189,263, and 264 show up to 10°C scatter, especially near the minimum. One reported melting point is lower than accepted (Ref. 264, by 5 °C) and two N aCI melting points higher (Refs. 263 and 189, by 7 and 4°C, respectively). Thus, as a guide for the present calculations the data points of Gromakov and Gromakova264 on the NaCI side, and of Amadori263 and BellancaI89 on the NaBr side were retained.
Solidus data points were obtained from cooling curves in Refs. 189 and 264. These solidi differ by as much as 10°C. The data of Bellanca 189 indicate that liquidus and solidus are 2-3 DC apart at the minimum, which is not thermodynamically permitted.
The excess enthalpy of the liquid has been measured by direct calorimetry by Kleppa and co_workers244,245 and others,193,266 in the range 800-860°C. The most extensive data are the more recent ofKleppa24
;) at 811°C and are used here:
HE(1) = XAXB (293 + 105xB ) J mol-I. (137)
The activity of NaBr in the liquid has been deduced from emf measurements at 800 °C.268-271
The enthalpy of formation of metastable solid solutions at 25°C has been measured calorimetrically in two independent studies.126.267 Data of both studies may be represented by the equation:
HE(S) = 5490xA xB J mol- I (138)
with a rms deviation of 40 J mol-I. A phase diagram was calculated with the use of Eqs.
(137) and (139):
(139)
with the assumption that SE(1) = O. Equation (139) was based on Eq. (138) and the liquidus defined by data of Refs. 189, 263, and 264. The calculated minimum is 741°C, xB
= 0.24. The calculated liquidus is within 5 DC ofthe selected reference data points.189,263,264 The calculated solidus falls closer to Bellanca'sl89 than to Gromakov's264 on the NaCl side, where differences are not masked by experimental scatter. Equation (139) reproduces the excess enthalpies ofEq. ( 138) exactly. The calculated consolute temperature for solid demixing is 15°C (there are no experimental data for comparison) .
Probable maximum inaccuracy in calculated liquidus (Fig. 50): ± 5 DC. Probable maximum inaccuracy in calculated solidus (Fig. 50): ± 10 DC.
NaCI(A) + Nal(B)
Data defining the liquidus were obtained from thermal analysis237
,272 and the visual-polythermal method.273 Data were tabulated in each case. Reported eutectic data are summarized in the following table:
TiC Xo Ref.
578 0.63 272 573 0.615 237 585 0.625 273 570 0.625 265
The liquidus of the most recent work237 was taken as a guide for the present calculations.
The limits of the eutectic isothermal were determined from thermal analysis by Ref. 272 as x B = 0.04, 0.75 and by Ref. 265 as XB = 0.023, 0.76. In addition, Amadori272 obtained two points on the Nal solidus. The activity of NaBr in the liquid at 800 °C has been deduced from emf measurements.269
The excess enthalpy of the liquid has been measured by direct calorimetry at 812245 and 860 °C.274 The data of Melnichak and Kleppa245 are both more numerous and cover a wider concentration range than the earlier work,274 and these245 therefore are used here:
HE(l) = XAXB (1619 + 640xA ) J mol-I, (140)
Two excess entropy terms for the liquid were included
OJ '::J .... 10
'.. tl
~ I- 750
- 747' • • 7~1'
o • 0.2~
• Ret. 263 (llqu1duo) • Ret. 189 (l1qu1duo) o Ret. 189 (oaUau.1 D Rat. 264 (l1qulauol '" Ret. 26~ (.aUduol
801' ---
700 1-4-+-'-':-':':'-'-"""-':-'~..&..,O",I~..........J.""""'o....o...L. ........... ....&..J....~...L-l..... ........ ..&...I....o ........... .u..................J 0.10 0.20 0.30 0.<10 O.SO 0.60 0.70 0.90
NaBr NaCl Mole fraction NaCl
FIG. 50. The system NaBr(A) + NaCl(B).
J. Phys. Chem. Ref. Data, Vol. 16, No.3, 1987
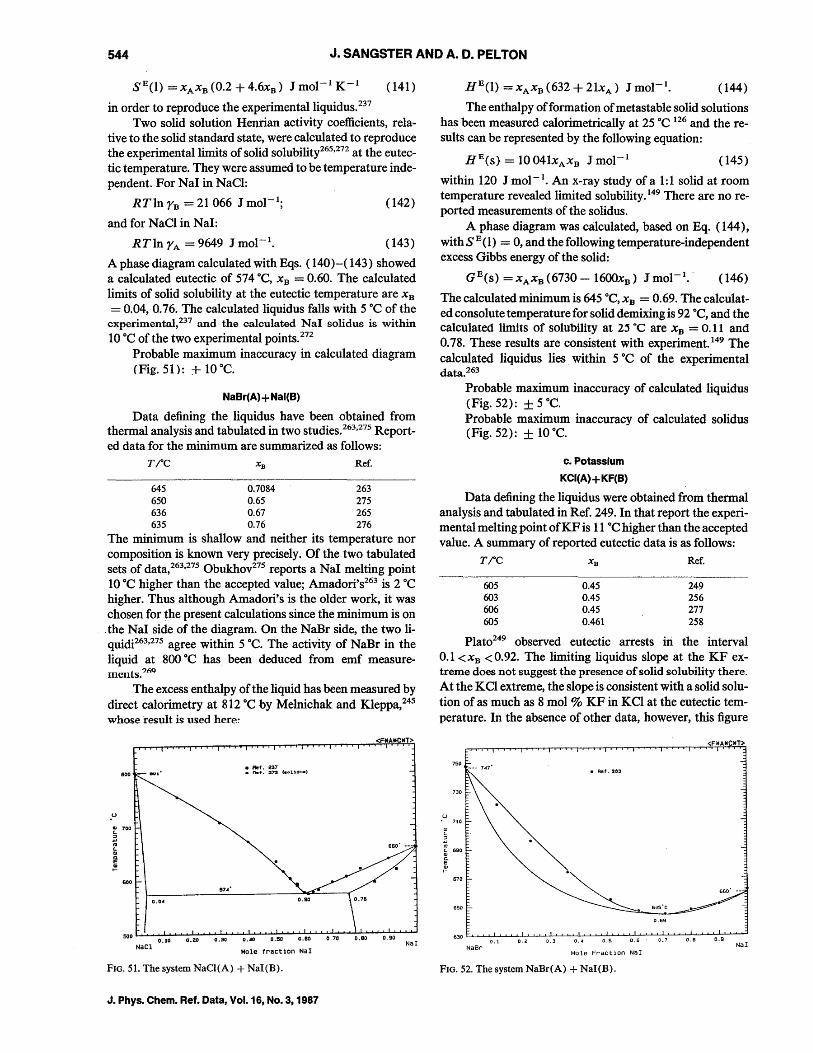
544 J. SANGSTER AND A. D. PELTON
(141)
in order to reproduce the experimental liquidus. 237 Two solid solution Henrian activity coefficients, rela
tive to the solid standard state, were calculated to reproduce the experimental limits of solid solubility265,272 at the eutectic temperature. They were assumed to be temperature independent. For NaI in NaCl:
RTln rB = 21066 J mol-I; (142)
and for NaCl in NaI:
RT In r A = 9649 J mol-I. (143)
A phase diagram calculated with Eqs. (140)-( 143) showed a calculated eutectic of 574°C, X B = 0.60. The calculated limits of solid solubility at the eutectic temperature are X B
= 0.04, 0.76. The calculated liquidus falls with 5 °C of the experimental,237 and the calculated No.1 solidus is within 10°C of the two experimental points.272
Probable maximum inaccuracy in calculated diagram (Fig~ 51): + 10°C.
NaBr(A) + Nal(B)
Data defining the liquidus have been obtained from thermal analysis and tabulated in two studies.263,275 Reported data for the minimum are summarized as follows:
TiC X B Ref.
645 0.7084 263 ~ Q~ m ~6 Q~ 2~
~5 Q% n6
The minimum is shallow and neither its temperature nor composition is known very precisely. Of the two tabulated sets of data,263,275 Obukhov275 reports a NaI melting point 10°C higher than the accepted value; Amadori's263 is 2 °C higher. Thus although Amadori's is the older work, it was chosen for the present calculations since the minimum is on the NaI side of the diagram. On the NaBr side, the two liquidi263,275 agree within 5°C. The activity of NaBr in the liquid at 800 °C has been deduced from emf measureInents. ?nQ
The excess enthalpy of the liquid has been measured by direct calorimetry at 812°C by Melnichak and Kleppa, 245
whose result is used here:
.u .. '-
~ II
!
• ReI. 237 aoo aUI- • nat. 2'13 (aol.t.doa]
700
660' --
BOO 57~'
O.O~ 0.76
~O~~0.~IO~OU.2~O~D~.~~~O~.4~O~O~.50~~O~.60~~O.~70~70.~BO~70.~90~~ NaI
Mole fraction NaI NaCl
FIG. 51. The system NaC1(A) + NaI(B).
J. Phys. Chem. Ref. Data, Vol. 16, No.3, 1987
(144)
The enthalpy offormation of metastable solid solutions has been measured calorimetrically at 25 DC 126 and the results can be represented by the following equation:
HE(s) = 10041xA X B J mol- I (145)
within 120 J mol-I. An x-ray study of a 1: 1 solid at room temperature revealed limited solubility. 149 There are no reported measurements of the solidus.
A phase diagram was calculated, based on Eq. (144), withSE(I) = 0, and the following temperature-independent excess Gibbs energy of the solid:
GE(s) = XAXB (6730 - 1600xB ) J mol-I.' (146)
The calculated minimum is 645°C, X B = 0.69. The calculated consolute temperature for solid demixiog is 92°C, and the calculated limits of solubility at 2'''C are xB = 0.11 and 0.78. These results are consistent with experiment. 149 The calculated liquidus lies. within 5 DC of the experimental data.263
Probable maximum inaccuracy of calculated liquidus (Fig. 52): ± 5°C. Probable maximum inaccuracy of calculated solidus (Fig. 52): ± 10°C.
C. Potassium
KCI(A)+ KF(B)
Data defining the liquidus were obtained from thermal analysis and tabulated in Ref. 249. In that report the experimental melting point ofKF is 11°C higher than the accepted value. A summary of reported eutectic data is as follows:
TiC X B Ref.
605 603 606 605
0.45 0.45 0.45 0.461
249 256 277 258
Plat0249 observed eutectic arrests in the interval 0.1 <XB <0.92. The limiting liquidus slope at the KF extreme does not suggest .the presence of solid solubility there. At the KCI extreme, the slope is consistent with a solid solution of as much as 8 mol % KF in KCl at the eutectic temperature. In the absence of other data, however, this figure
750
730
u • 710
'" '-::J .., f1I
~ 690
~
NaBr
• Ref. 283
.~. 64S·C~·
0.69
0.5 0.6' 0.7 O.B 0.9
Mole Fraction NaI
FIG. 52. The system NaBr(A) + NaI(B).
NaI
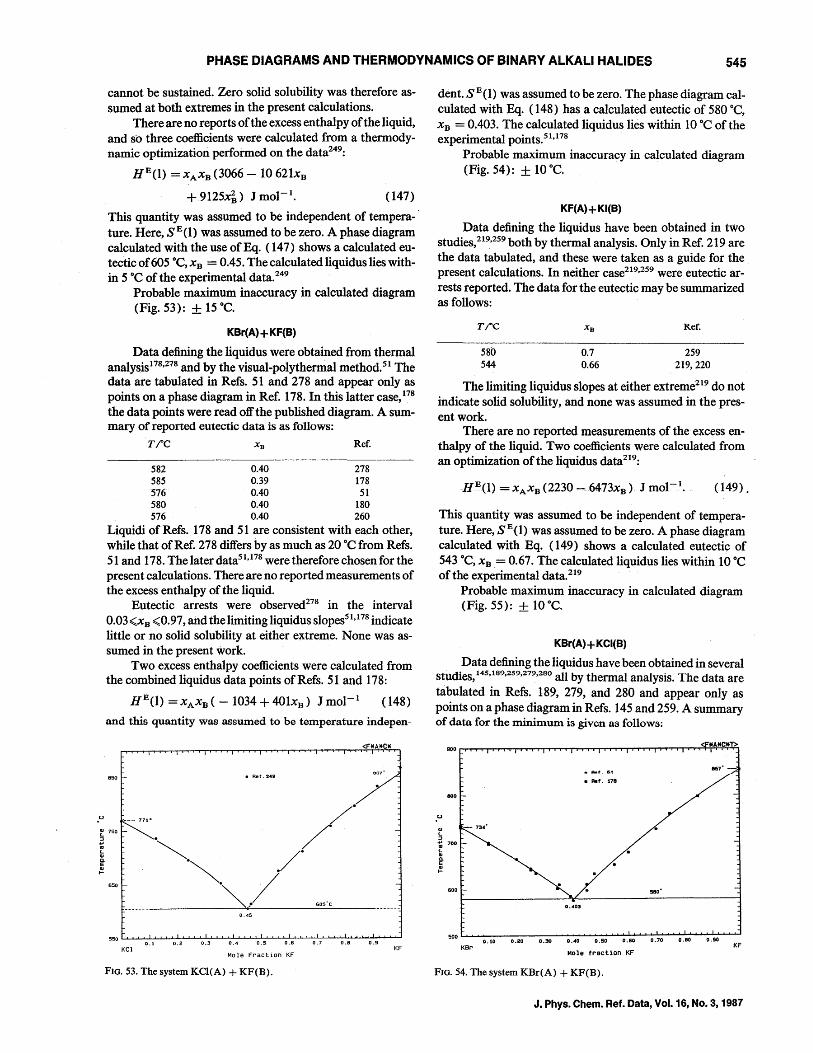
PHASE DIAGRAMS AND THERMODYNAMICS OF BINARY ALKALI HALIDES 545
cannot be sustained. Zero solid solubility was therefore assumed at both extremes in the present calculations.
There are no reports of the excess enthalpy of the liquid, and so three coefficients were calculated from a thermodynamic optimization performed on the data249:
HE(1) = XAXB (3066 - 10621xB
(147)
This quantity was assumed to be independent of tempera- . ture. Here, SE(1) was assumed to be zero. A phase diagram calculated with the use ofEq. (147) shows a calculated eutectic of 605 °C, XB = 0.45. The calculated liquidus lies within 5 °C of the experimental data. 249
Probable maximum inaccuracy in calculated diagram (Fig. 53): ± 15 °C.
KBr(A) + KF(B)
Data defining the liquidus were obtained from thermal analysis178,278 and by the visual~polythermal method.sl The data are tabulated in Refs. 51 and 278 and appear only as points on a phase diagram in Ref. 178. In this latter case, 178 the data points were read off the published diagram. A summary of reported eutectic data is as follows:
TiC X B Ref.
582 0.40 278 585 0.39 178 576 0.40 51 580 0.40 180 576 0.40 260
Liquidi of Refs. 178 and 51 are consistent with each other, while that of Ref. 278 differs by as much as 20 °C from Refs. 51 and 178. The later data51,178 were therefore chosen for the present calculations. There are no reported measurements of the excess enthalpy of the liquid.
Eutectic arrests were observed278 in the interval 0.03<XB <0.97, and the limiting liquidus slopes51,178 indicate little or no solid solubility at either extreme. None was assumed in the present work.
Two excess enthalpy coefficients were calculated from the combined liquidus data points of Refs. 51 and 178:
HE(1) = XAXB ( - 1034 + 401xB) J mol- 1 (148)
and this quantity was assumed to be temperature indepen-
<FIIAIICII
• Ref.249 O~7·
.u ___ 771' /
~7S0~. /
~~" /" ~~. ~~l/
60S'C
0.45
KCl KF Mole Fraction KF
FIG. 53. The system KCl(A) + KF(B).
dent. SE(1) was assumed to be zero. The phase diagram calculated with Eq. (148) has a calculated eutectic of 580 °C, XB = 0.403. The calculated liquidus lies within 10 °C of the experimental points.51,178
Probable maximum inaccuracy in calculated diagram (Fig. 54): ± 10°C.
KF(A)+ KI(B)
Data defining the liquidus have been obtained in two studies,219,259 both by thermal analysis. Only in Ref. 219 are the data tabulated, and these were taken as a guide for the present calculations. In neither case219,259 were eutectic arrests reported. The data for the eutectic may be summarized as follows:
TiC
580 544
0.7 0.66
Ref.
259 219,220
The limiting liquidus slopes at either extreme219 do not indicate solid solubility, and none was assumed in the present work.
There are no reported measurements of the excess enthalpy of the liquid. Two coefficients were calculated from an optimization of the liquidus data219:
(149),
This quantity was assumed to be independent of temperature. Here, SE(1) was assumed to be zero. A phase diagram calculated with Eq. (149) shows a calculated eutectic of 543 °C, XB.= 0.67. The calculated liquidus lies within 10°C of the experimental data. 219
Probable maximum inaccuracy in calculated diagram (Fig. 55): ± 10°C.
KBr(A) + KCI(B)
Data defining the liquidus have been obtained in several studies,145,189,259,279,280 all by thermal analysis. The data are
ta.bulated in Refs. 189, 279, and 280 and appear only as points on a phase diagram in Refs. 145 and 259. A summary of data for the minimum is given as follows:
857'
• Ret. 178
800
-- 73~'
600 SBO'
O.~03
500 r......... ......... O.-10--0.20--0-.30~ ..... O-.4-0 ............ 0~.SO ............... O..l...60 ............ 0 • .L...70 ............... 0.L:'BO ........... ~O.9'::"O-'-'-'-' KF
Mole fraction KF KBr
FIG. 54. The system KBr(A) + KF(B).
J. Phys. Chem. Ref. Data, Vol. 16, No.3, 1987
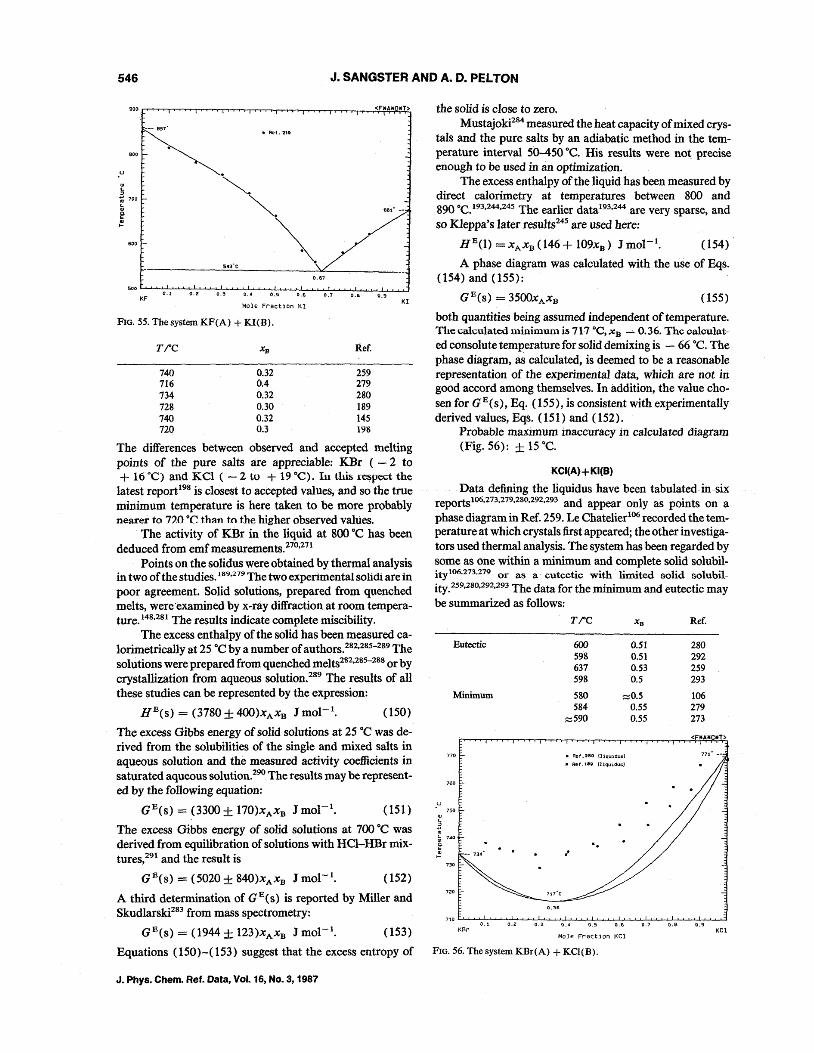
546 J. SANGSTER AND A. D. PELTON
--- 857' • Ref. 21a
800
600
SOOK L..JF'-'-'-"';;O.'-;'j -L...J...~""""""~~~~:-L0.5::'-'-L...':0:-L.6""""""'~..L..L..&.....-L"""""''''''''O..l-.9 ............ ..jKI
Mole Fraction KI
FIG. 55. The system KF(A) + KI(B).
r;oc Xs
740 0.32 716 0.4 734 0.32 728 0.30 740 0.32 720 0.3
Ref.
259 279 280 189 145 19~
The differences between observed and accepted melting points of the pure salts are appreciable: KBr (- 2 to + 16 "'C) and KCI ( - 2 to + 19°C). III this respect the
latest report198 is closest to accepted values,and so the true minimum temperature is here taken to be more probably nearer to 720°C than to the higher observed values.
The activity of KBr in the liquid at 800 °C has been deduced from emf measurements. 270,271
Points on the solidus were obtained by thermal analysis in two of the studies. 189,279 The two experimental solidi are in poor agreement. Solid solutions, prepared from quenched melts, were'examined by x·ray diffraction at room temperature. 148,281 The results indicate complete miscibility.
The excess enthalpy of the solid has been measured calorimetrically at 25°C by a number of authors. 282,285-289 The solutions were prepared from quenched melts2S2,28s-288 or by crystallization from aqueous solution.289 The results of all these studies can be represented by the expression:
HE(S) = (3780 ± 4OO)XAXB J mol-I. (150)
The excess Gibbs energy of solid solutions at 25°C was derived from the solubilities of the single and mixed salts in aqueous solution and the measured activity coefficients in saturated aqueous solution.290 The results may be represented by the following equation:
GE(s) = (3300 ± 170)xA xB J mol-I. (151)
The excess Gibbs energy of solid solutions at 700 °C was derived from equilibration of solutions with HCI-HBr mixtures,291 and the result is
GE(s) = (5020 ± 840)XA XB J mol-I. (152)
A third determination of GE(s) is reported by Miller and Skudlarski283 from mass spectrometry:
GE(s) = (1944 ± 123)xA xB J mol-I. (153)
the solid is close to zero. Mustajoki284 measured the heat capacity of mixed crys·
tais and the pure salts by an adiabatic method in the tern· perature interval 50-450 °C. His results were no~ precise enough to be used in an optimization.
The excess enthalpy of the liquid has been measured by direct calorimetry at temperatures between 800 and 890°C.193,244,245 The earlier data 193,244 are very sparse, and so Kleppa's later results245 are used here:
HEO) = XAXB (146 + 109xB ) J mol-I. (154) .
A phase diagram was calculated with the use of Eqs. (154) and (155):
(155)
both quantities being assumed independent of temperature. The calculated minimum is 717°C, xB -= 0.36. The oaloulated consolute temperature for solid demixing is - 66°C. The phase diagram, as calculated, is deemed to be a reasonable representation of the experimental data, which are not in good accord among themselves. In addition, the value chosen for GE(s), Eq. (155), is consistent with experimentally derived values, Eqs. (151) and (152).
Probable maximum inaccuracy in calculated diagram (Fig. 56): ± 15°C.
KCI(A)+ KI(B)
Data defining the liquidus have been tabulated~ in six reports 1 06,273 ,279,280,292,293 and appear only as points on a
phase diagram in Ref. 259. Le Chatelier106 recorded the temperature at which crystals first appeared; the other investigators used thermal analysis. The system has been regarded by some as one within a minimum and complete solid solubilityl06.273.279 or as a· eutectio with limited solid solubility.259.28o,292,293 The data for the minimum and eutectic may be summarized as follows:
.u
41 c.. ::l
10
Eutectic
Minimum
750
~ 740
~
KBr
r;oc XB
600 0.51 598 0.51 637 0.53 598 0.5
580 ~0.5 584 0.55
~590 0.55
• Ref.280 (liquidus)
• Ref. 189 !liquidus)
a. ..
0.5 0.6 0.7 0.8
Mole Frac:tion KCl
Ref.
280 292 259 293
106 279 273
<FJlAJlCIfT>
KCl
Equations (150)-( 153) suggest that the excess entropy of FIG. 56. The system KBr(A) + KCl(B).
J. Phys. Chem. Ref. Data, Vol. 16, No.3, 1987

PHASE DIAGRAMS AND THERMO~YNAMICS OF BINARY ALKALI HALIDES 547
The scatter among the liquidus data points of the later investigators273,279,280,292,293 is as much as 24°C, and the mini-mum (or eutectic) temperature is not well defined.
Points on the solidus were obtained by thermal analysis in Refs. 279, 280, and 292. All reports indicate extensive solid solubility on the KI side; this is confirmed by the limiting liquidus slope.273,279,280,292,293 On the KCI side, the limit-ing slope indicates quite clear only limited solubility. Thus Wrzesnewsky's279 solidus is in error, and support is given instead to Amadori's data.28o,292 His earlier280 data indicate a KI solubility in KCI of 10 mol %, and his later re-investigation292 indicates 5 mol %.
Wrzesnewsky279 reported third temperature arrests, which are about 100°C below his reported solidus. He ascribes this envelope to demixing of solid solutions. This is unlikely, as the envelope as reported is concave upward, whereas a solubility gap is indicated by a curve which is concave downward. Tamman and Ruppelt175 recorded the onset and completion of turbidity in slowly heated and cooled solidified melts, as shown by transmitted light. At a given composition the transformation from complete translucence to complete turbidity occupied a temperature interval of between 50 and 100 °e. The data do not allow any unambiguous conclusion to be drawn, although the suggested general shape of the envelope is concave downward. Thus the nature of the solid state of this system has not been resolved by experiment.
The excess enthalpy of the liquid has been measured by direct calorimetry at 812°C by Melnichak and Kleppa, 245 whose result is used here:
HE(1) = XAXB (1238 + 268xA ) J mol-I. (156)
A phase diagram was calculated with: the use of Eq. ( 156) following Amadori,28o,292 with the assdmption oflimited solid solubility at the KCI side. Here, SE(l) was assumed to be zero. A Henrian activity coefficient for KI in KCI at the eutectic temperature was used:
RTlnrB = 20000 J mol-I, (157)
and the solid solution at the KI side was taken to he regular with an excess Gibbs energy given by
GE(s) 13500xA xB J mol-I. (158)
The quantities in Eqs. (156)-(158) were all assumed to be temperature independent. The calculate eutectic is 598°C, X B = 0.497 and the calculated liquidus is within 10°C of experiment.280,292 The calculated limits of solid solubility are xB = 0.04,0.55 at the eutectic temperature. The calculated solidus on the KI side falls below the experimental,280 and for reasons stated above the solid phase boundaries of this system remain poorly defined.
Probable maximum inaccuracy in calculated liquidus (Fig. 57): ± 10°C. Probable maximum inaccuracy in calculated solidus (Fig. 57): ± 25°C.
KBr(A) + KI(B)
Data defining the liquidus have been obtained in four studies,259,279,280,294 all through thermal analysis. The data in Refs. 279 and 280 are tabulated and appear only as points on
.u
II) c.. :>
750
~ 700
~ ,... 650
600
.""'.
• Ref. 280 (liquidus) • Ref. 292 (solidus) o Ref. 280 (.ol1dus)
. /
./0/// r. ••• "--.~,; ./:///
; ~2.. ___ ._--
(
I I
! (0.55)
550 .......... """":-'-:""""~:'"-'-~:"-'-'''"''':-'-........ ~ ................................ .....w ........... .....J..,.,. ............. I-L.o............::J 0.1 0.3 0.4 0.5 0.6 0.7 O.B 0.9
KCl KI Mole Fraction KI
FIG. 57. The system KCl(A) + KI(B).
a phase diagram.259,294 Points were read off the diagram in the latest work. 294 Data for the minimum may be summarized as follows!
TiC Ref.
705 259 6M =Q~ uo 589 0.5 279 ~ QM ~4
The liquidi of Refs. 280 and 294 are remarkably concordant (within 2°C). The high minimum temperatllre ofReL259 is rejected because the melting points of the pure salts are 16 and 24°C higher than accepted values. The low value279 is rejected also because it entails a consolute temperature for solid-solid demixing of ~450 °C, which is not supported by experimental data. 175,296 The liquidi of Refs. 280 and 294 were therefore chosen as a basis for the present calculations.
Data defining the solidus have been obtained by thermal analysis.279,294 For the reason given above, Wrznewsky's279 data are rejected and the data of the later work294 are retained. The data were read off the published phase diagram. 294
The excess enthalpy of the liquid has been measured by direct calorimetry at 812°C by Melnichak and Kleppa, 24~ whose result is used here:
HE(l) = XAXB (452 - 13xA ) J mol-I. (159)
The solid state of this system has been the object of a number of studies. 126,I48,150,I75,295-301 Lattice constants of quenched solid solutions, obtained by x-ray diffraction, are reported. 148,150,295,296 The optical transmission during heat-ing and cooling was recorded. 175 The excess enthalpy of metastable quenched single-phase solid solutions has been measured calorimetrically at 25 °C126 and the results may be represented by the following equation:
HE(S, 25°C) = 7354xA XB J mol-1 (160)
with a rms deviation of74 J mol-I. The excess Gibbs energy has been determined from the aqueous solubility isotherm, together with data from isopiestic measurements on saturated solutions of the single and mixed salts at 25°C. 297 The results may be represented by the following equation:
GE(s, 25°C) = 5151xA xB J mol- 1 (161)
J. Phys. Chern. Ref. Data, Vol. 16, No.3, 1987
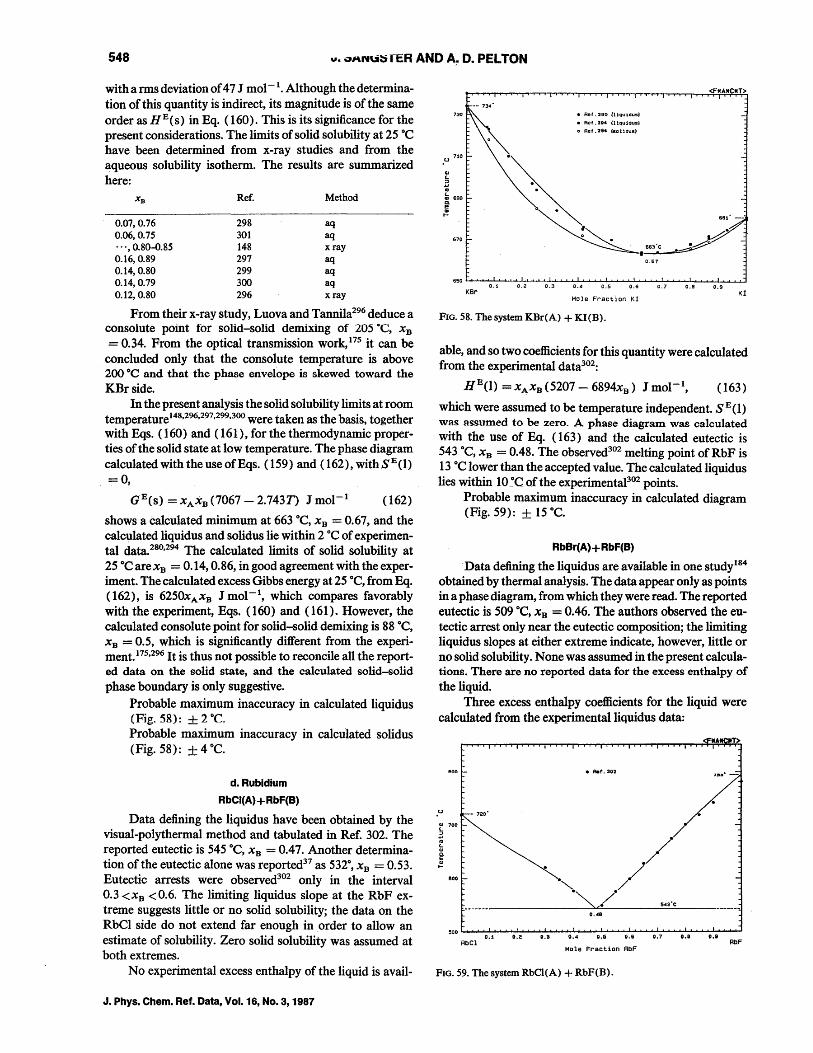
548 v. "",n\:i::; TER AND A~ D. PELTON
with a rms deviation of 4 7 J mol-I. Although the determination of this quantity is indirect, its magnitude is of the same order as HE(S) in Eq. (160). This is its significance for the present considerations. The limits of solid solubility at 25°C have been determined from x-ray studies and from the ~queous solubility isotherm. The results are summarized here:
X B Ref. Method
0.07,0.76 298 aq 0.06,0.75 301 aq .. ',0.80-0.85 148 xray 0.16,0.89 297 aq 0.14,0.80 299 aq 0.14,0.79 300 aq 0.12,0.80 296 xray
From their x-ray study, Luova and Tannila296 deduce a consolute point for solid-solid demixing of 205 ·C, xB = 0.34. From the optical transmission work,175 it can be concluded only that the consolute temperature is above 200 °C and that the phase envelope is skewed toward the KBrside.
In the present analysis the solid solubility limits at room temperature148,296,297,299.300 were taken as the basis. together with Eqs. (160) and (161), for the thermodynamic properties of the solid state at low temperature. The phase diagram calculated with the use ofEqs. (159) and (162), withSE(l) =0,
GE(s) = XAXB (7067 - 2.743n J mol- 1 (162)
shows a calculated minimum at 663°C, XB = 0.67, and the calculated liquidus and solidus lie within 2 °c of experimental data.28o
,294 The calculated limits of solid solubility at 25 °CarexB = 0.14,0.86, in good agreement with theexperiment. The calculated excess Gibbs energy at 25°C, from Eq. (162), is 6250XA XB J mol-I, which compares favorably with the experiment, Eqs. (160) and (161). However, the calculated consolute point for solid-solid demixing is 88°C, XB = 0.5, which is significantly different from the experiment.175,296 It is thus not possible to reconcile all the reported data on the solid state, and the calculated solid-solid phase boundary is only suggestive.
Probable maximum inaccuracy in calculated liquidus (Fig. 58): ± 2°e. Probable maximum inaccuracy in calculated solidus (Fig. 58): ± 4°C.
d.Rubldium
RbCI(A)+ RbF(B)
Data defining the liquidus have been obtained by the visual-polythermal method and tabulated in Ref. 302. The reported eutectic is 545°C, XB = 0.47. Another determination of the eutectic alone was reported37 as 532°, XB = 0.53. Eutectic arrests were observed302 only in the interval 0.3 <XB <0.6. The limiting liquidus slope at the RbF extreme suggests little or no solid solubility; the data on the RbCI side do not extend far enough in order to allow an estimate of solubility. Zero solid solubility was assumed at both extremes.
No experimental excess enthalpy of the liquid is avail-
J. Phys. Chem. Ref. Data, Vol. 16, No.3, 1987
.u
G> L
~ L
730
710
III 690 a.
~
670
KBr
• Ref. 280 (lIquidus)
• Ret. 284 !lIquidus)
~ o Ret. 284 (sDlidUs)
.~~. .. 6S1'---
! I~· . . ........" 663'C ~~ .~~
0.61
0.1 0.2 0.3 0.5 0.6 0.7 0.8 0.9 KI
Mole Fraction Kl
FIG. 58. The system KBr(A) + KI(B).
able, and so two coefficients for this quantity were calculated from the experimental data302:
HE(I) = XAXB (5207 - 6894xB) J mol-I, (163)
which were assumed to be temperature independent. S E(l) was assumed to be zero. A phase diagram was calculated with the use of Eq. (163) and the calculated eutectic is 543°C, XB = 0.48. The observed302 melting point of RbF is 13°C lower than the accepted value. The calculated liquidus lies within 1 O~C of the experimental302 points.
Probable maximum inaccuracy in calculated diagram (Fig. 59): ± 15°C.
RbBr(A)+ RbF(B)
Data defining the liquidus are available in one studyI84 obtained by thermal analysis. The data appear only as points in a phase diagram, from which they were read. The reported eutectic is 509°C, xB = 0.46. The authors observed the eutectic arrest only near the eutectic composition; the limiting liquidus slopes at either extreme indicate, however, little or no solid solubility. None was assumed in the present calculations. There are no reported data for the excess enthalpy of the liquid.
Three excess enthalpy coefficients for the liquid were calculated from the experimental liquidus data:
itA 1fT>
• RIot. 302
720'
~ 700
i ~
1100
0.4S
500 L.................Jo.w,s .......... UO
...... 2
........ ..J.O.' ................. O...l...4 .............. 0....L..5 ............. 0..L..Ii ............... OJ......7 .............. 0.L...&S .......... .-..JO.W,9 .......... u
RbCl RbF Mole Fraction RbF
FIG. 59. The system RbCl(A) + RbF(B).
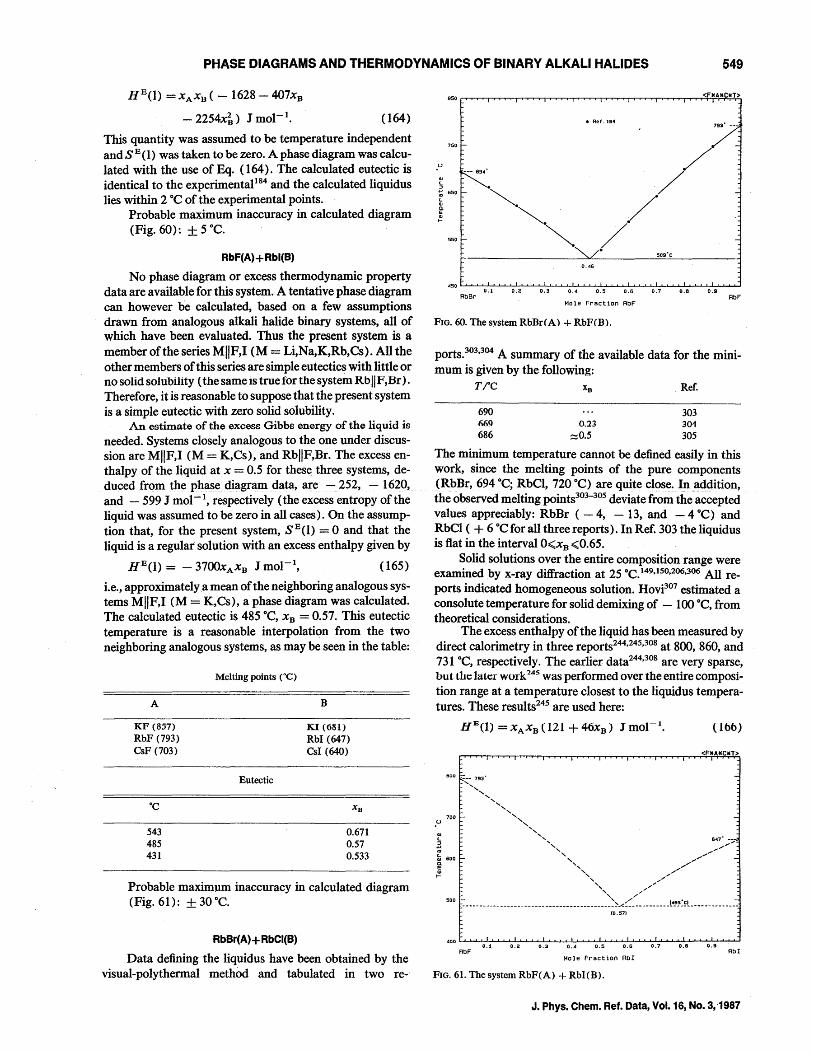
PHASE DIAGRAMS AND THERMODYNAMICS OF BINARY ALKALI HALIDES 549
HE(1) = XAXB ( - 1628 - 407xB
- 2254x~) J mol-to (164)
This quantity was assumed to be temperature independent and S E(1) was taken to be zero. A phase diagram was calculated with the use of Eq. (164). The calculated eutectic is identical to the experimental184 and the calculated liquidus lies within 2 °C of the experimental points.
Probable maximum inaccuracy in calculated diagram (Fig. 60): ± 5°C.
RbF(A)+ Rbl(B)
No phase diagram or excess thermodynamic property data are available for this system. A tentative phase diagram can however be calculated, based on a few assumptions drawn from analogous alkali halide binary systems, all of which have been evaluated. Thus the present system is a member of the series MIIF,I (M = Li,Na,K,Rb,Cs). All the other members of this series are simple eutectics with little or no solid solubility (the same is true for the system RbllF',Br). Therefore, it is reasonable to suppose that the present system is a simple eutectic with zero solid solubility.
An estimate of the excess Gibbs energy of the liquid is needed. Systems closely analogous to the one under discussion are MIIF,I (M = K,Cs), and RbIlF,Br. The excess enthalpy of the liquid at x = 0.5 for these three systems, deduced from the phase diagram data, are - 252, - 1620,_ and - 599 J mol- t, respectively (the excess entropy of the liquid was assumed to be zero in all cases). On the assumption that, for the present system, SE(l) = 0 and that the liquid is a regular solution with an excess enthalpy given by
HE(1) = - 3700XA XB J mol-I, (165)
i.e., approximately a mean of the neighboring analogous systems MIIF,I (M = K,Cs), a phase diagram was calculated. The calculated eutectic is 485 °C, xB = 0.57. This eutectic temperature is a reasonable interpolation from the two neighboring analogous systems, as may be seen in the table:
A
KF (8.57) RbF (793) CsF (703)
543 485 431
Melting points CC)
Eutectic
B
KI (681) RbI (647) CsI (640)
0.671 0.57 0.533
Probable maximum inaccuracy in calculated diagram (Fig. 61): ± 30°C.
RbBr(A)+ RbCI(B)
Data defining the liquidus have been obtained by the visual-polythermal method and tabulated in two re-
450 ............. ..L...L...I-'-'-"----'.....I._'_'_L...L-1.~L....I-L ............ ....t...J....L..J.....L....t.....I-L-J.....L.-&....LI-'-'-.L..L...L_'_'_ ............ ~ 0.1 o.~ 0.3 0.4 0.5 0.6 0.7 0.8 0.9
RbBr RbF Mole Fraction RbF
FIG. 60. The system RbBr(A) + RbF(B).
portS.303,304 A summary of the available data for the minimum is given by the following:
TI'C XB Ref.
690 1169 686
0.23 :::::0.5
303 301\ 305
The minimum temperature cannot be defined easily in this work, since the melting points of the pure components (RbBr, 694°C; RbCI, 720°C) are quite close. In addition, the observed melting points303-305 deviate from the-~ccepted values appreciably: RbBr ( - 4, - 13, and - 4°C) and RbCI ( + 6 °C for all three reports). In Ref. 303 the liquidus is flat in the interval O<xB <0.65.
Solid solutions over the entire composition range were examined by x-ray diffraction at 25 °C.149,150,206.306 All re-ports indicated homogeneous solution. Hovi307 estimated a consolute temperature for solid demixing of - 100 °C, from theoretical considerations.
The excess enthalpy of the liquid has been measured by direct calorimetry in three reports244,245.308 at 800, 860, and 731 °C, respectively. The earlier data244.308 are very sparse, but the latc::r work 245 was performed over the entire composi,.. tion range at a temperature closest to the liquidus temperatures. These results245 are used here:
HE(l) = XAXB (121 + 46xB ) J mor- l• (166)
.u
OJ L ::J ... ID
700 r-
~ 600 :-
~
RbF
<FMAMCMT>
-
-
RbI Mole Fraction RbI
FIG. 61. The system RbF(A) + RbI(B).
J. Phys. Chern. Ref. Data, Vol. 16, No. 3,1987
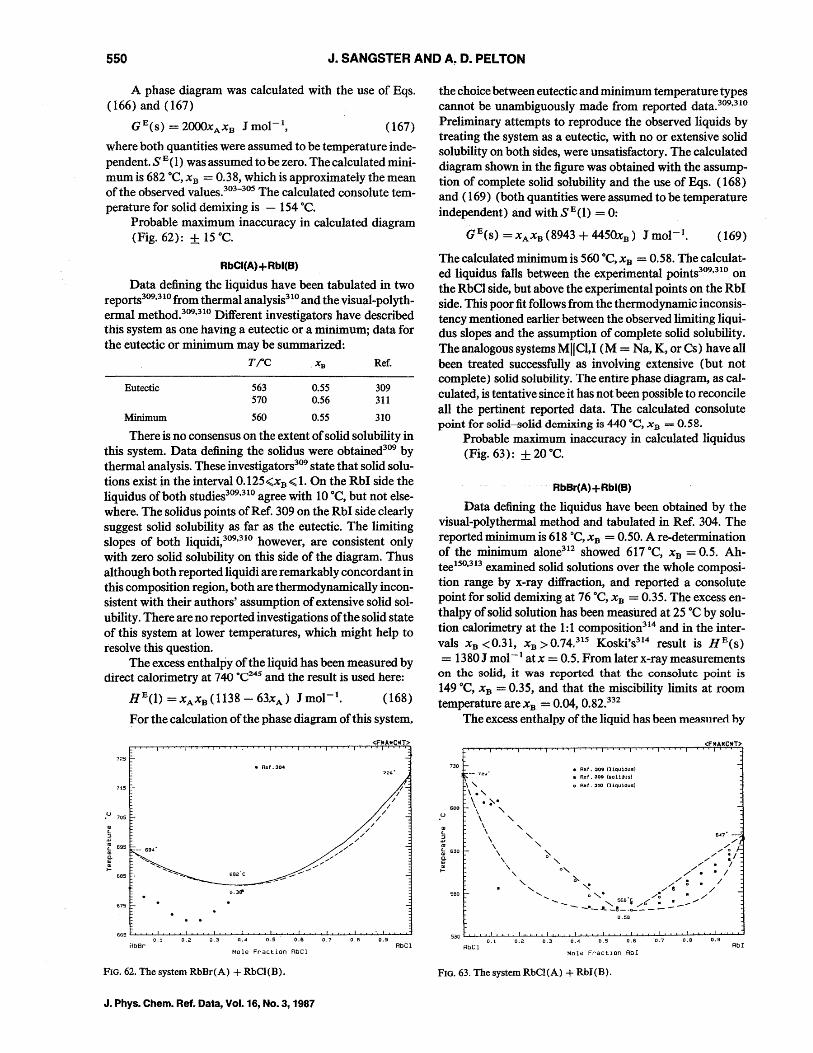
550 J. SANGSTER AND A~ D. PELTON
A phase diagram was calculated with the use of Eqs. (166) and (167)
(167)
where both quantities were assumed to be temperature independent. S E(l) was assumed to be zero. The calculated minimum is 682°C, X B = 0.38, which is approximately the mean of the observed values.303-305 The calculated consolute temperature for solid demixing is - 154°C.
Probable maximum inaccuracy in calculated diagram (Fig. 62): ± 15°C.
RbCI(A)+ Rbl(B)
Data defining the liquidus have been tabulated in two reports309,310 from thermal analysis310 and the visual-polythermal method.309,310 Different investigators have described this system as one having a eutectic or a minimum; data for the eutectic or minimum may be summarized:
Eutectic
Minimum
T ;oC _ XB Ref.
563 570
560
0.55 0.56
0.55
309 311
310
There is no consensus on the extent of solid solubility in this system. Data defining the solidus were obtained309 by thermal analysis. These investigators309 state that solid solutions exist in the interval 0.125 <;~B <; 1. On _ the RbI side the liquidus of both studies309,31o agree with 10°C, but not elsewhere. The solidus points of Ref. 309 on the RbI side clearly suggest solid solubility as far as the eutectic. The limiting slopes of both liquidi,309,31O however, are consistent only with zero solid solubility on this side of the diagram. Thus although both reported liquidi are remarkably concordant in this composition region, both are thermodynamically inconsistent with their authors' assumption of extensive solid solubility. There are no reported investigations of the solid state of this system at lower temperatures, which might help to resolve this question.
The excess enthalpy of the liquid has been measured by direct calorimetry at 740 °CZ
-45 and the result is used here:
.u 705
III t. :l ..., ~ 695
~ I-
675
HE(l) = XAXB (1138 63xA ) J mol-I. (168)
For the calculation of the phase diagram of this system.
• Ref.304
0_38"
0_2 0_3 0.4 0_5 0.6 0_7 0.9 tIber AbCl
Mole Fraction AbCl
FIG. 62. The system RbBr(A) + RbCI(B).
J. Phys. Chem. Ref. Data, Vol. 16, No.3, 1987
the choice between eutectic and minimum temperature types cannot be unambiguously made from reported data.309,31O Preliminary attempts to reproduce the observed liquids by treating the system as a eutectic, with no or extensive solid solubility on both sides, were unsatisfactory. The calculated diagram shown in the figure was obtained with the assumption of complete solid solubility and the use of Eqs. (168) and (169) (both quantities were assumed to be temperature independent) and withSE(l) = 0:
GE(s) =XA xB (8943 + 4450xB ) Jmol- 1• (169)
The calculated minimum is 560°C, X B = 0.58. The calculated liquidus falls between the experimental points309,31O on the RbCl side, but above the experimental points on the RbI side. This poor fit follows from the thermodynamic inconsistency mentioned earlier between the observed limiting liquidus slopes and the assumption of complete solid solubility. TheanalogoussystemsMIICI,I (M = Na,K, orCs) have all been treated successfully as involving extensive (but not complete) solid solubility. The entire phase diagram, as calculated, is tentative since it has not been possible to reconcile all the pertinent reported data. The calculated consolute point for solid-solid demixing is 440°C, XB = 0.58.
Probable maximum inaccuracy in calculated liquidus (Fig. 63): ± 20°C.
RbBr(A) +Rbl(B)
Data defining the liquidus have been obtained by the visual-polythermal method and tabulated in Ref. 304. The reported minimum is 618°C, X B = 0.50. A re-determination of the minimum alone312 showed 617°C, XB = 0.5. Ah'tee150,313 examined solid solutions over the whole composition range by x-ray diffraction, and reported a consolute point for solid demixing at 76°C, X B = 0.35. The excess enthalpy of solid solution has been measured at 25°C by solution calorimetry at the 1:1 composition3I4 and in the intervals X B <0.31, x B >0.74.315 Koski'S314 result is HE(s) = 1380J mol- l atx = 0.5. From later x-ray measurements
on the solid, it was reported that the consolute point is 149°C, xB = 0.35, and that the miscibility limits at room temperature are xB = 0.04, 0.82.332
III t. :l .... '"
The excess enthalpy of the liquid ha.q been mea~lIrerl hy
730 I- • Ref. 309 (Uquldus)
• Ref. 309 (Balidus)
o Ref. 3.0 (l1quldus)
~ 630 I-
~ I-
560 I-
530 ~..........JL.a.-....~O_--'-2 -'-'---'w........L-J..-J-o..L.4..L...L-J...LO..L_5.L-J..-J---'-OJ...6~--L-oL_7'---'--"-..L.o~_a -'--'-~O.~9 ......... J-J
AbI Mole Fraction AbI
RbCl
FIG. 63. The system RbCl(A) + RbI(B).
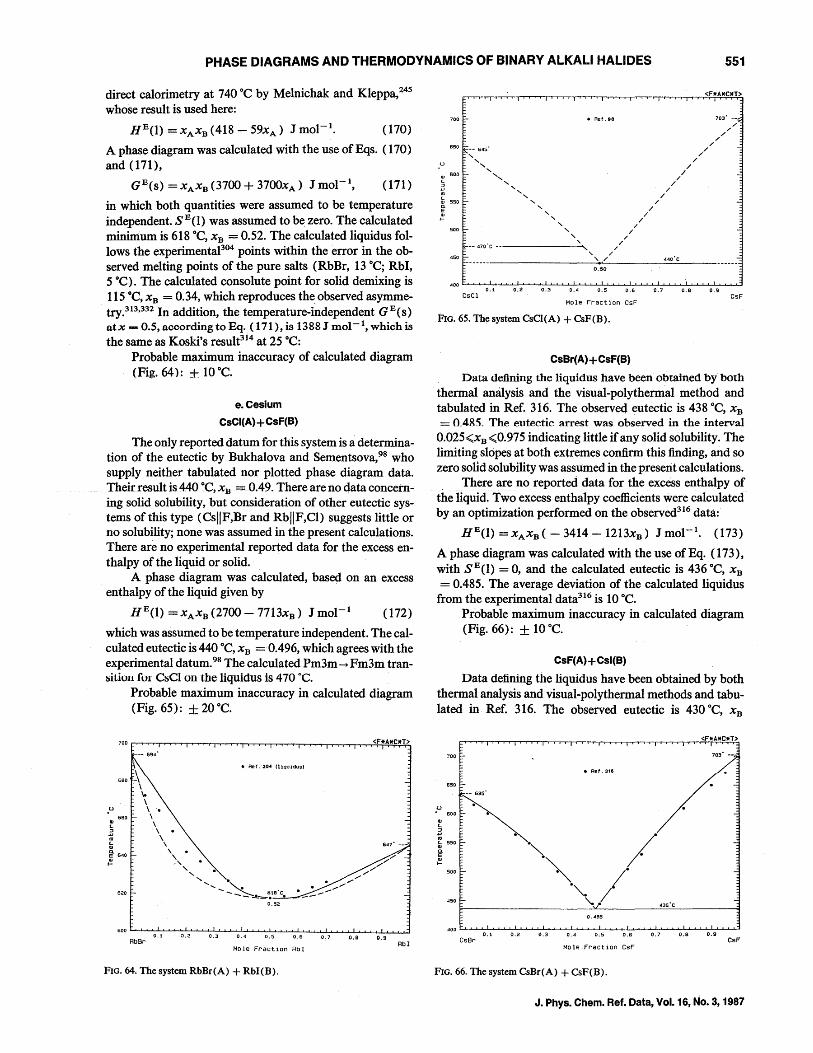
PHASE DIAGRAMS AND THERMODYNAMICS OF BINARY ALKALI HALIDES 551
direct calorimetry at 740°C by Melnichak and Kleppa,245 whose result is used here:
(170)
A phase diagram was calculated with the use of Eqs. (170) and (171),
GE(s) = XAXB (3700 + 3700XA) J mol-I, (171)
in which both quantities were assumed to be temperature independent. SE(l) was assumed to be zero. The calculated minimum is 618°C, xB = 0.52. The calculated liquidus follows the experimental304 points within the error in the observed melting points of the pure salts (RbBr, 13°C; RbI, 5 °C). The calculated consolute point for solid demixing is 115°C, XB = 0.34, which reproduces the observed asymmetry.313,332 In addition, the temperature-independent GE(s) atx - 0.5, according to Eq .. (171), is 1388J mol-I, which is the same as Koski's result314 at 25°C:
Probable maximum inaccuracy of calculated diagram (Fig. 64): :t: 10°C.
e.Cesium
CsCI(A)+ CsF(B)
The only reported datum for this system is a determination of the eutectic by Bukhalova and Sementsova,98 who supply neither tabulated nor plotted phase diagram data. Their result is 440°C, X B === 0.49. There are no data concerning solid solubility, but consideration of other eutectic systems of this type (CsIIF,Br and RbIlF,Cl) suggests little or no solubility; none was assumed in the present calculations. There are no experimental reported data for the excess enthalpy of the liquid or solid.
A phase diagram was calculated, based on an excess enthalpy of the liquid given by
HE(l) = XAXB (2700 - 7713xB ) J mol- l (172)
which was assumed to be temperature independent. The calculated eutectic is 440 °C, XB =0.496, which agrees with the experimental datum.98 The calculated Pm3m -+ Fm3m transition for CsCI on the liquidus is 470 "C.
.u
III ':l
., ~ ~ 640
Probable maximum inaccuracy in calculated diagram (Fig. 65): ± 20°C.
0.2 0.7 0.8 0.9 RbSr
Mole Fraction ,4bI RbI
FIG. 64. The system RbBr(A) + RbI(B).
650 __ 645' ,
500
, , , " , , , , , , , , , ,
• Aef.98
/ / "
,,-,,-
/ /
/ /
/ /
/ /
/ /
/ /
/ /
. --470'c - •. -------->. // 450
, / '. ;' 440·C
0.50
0.1 0.2 0.4 0.5 0.6 0.7 0.8 0.9 CsCl
Mole Fraction CsF
,,,,;'
CsF
FIG. 65. The system CsCI(A) + CsF(B).
CsBr(A) +CsF(B)
Data defining the liquidus have been obtained by both thermal analysis and the visual-poly thermal method and tabulated in Ref. 316. The observeq eutectic is 438°C, xB
0.485. The eutectic arrest was observed in the interval 0.025<;xB <;0.975 indicating little if any solid solubility. The limiting slopes at both extremes confirm this finding, and so zero solid solubility was assumed in the present calculations. . There are no reported data for the excess enthalpy of
the liquid. Two excess enthalpy coefficients were calculated by an optimization performed on the observed316 data:
HE(l) =XAXB ( - 3414 -1213xB ) Jmol- l. (173)
A phase diagram was calculated with the use of Eq. (173), with SE(l) = 0, and the calculated eutectic is 436°C, XB
= 0.485. The average deviation of the calculated liquidus from the experimental data316 is 10°C.
Probable maximum inaccuracy in calculated diagram (Fig. 66): ± 10°C.
CsF(A) + Csl(B)
Data defining the liquidus have been obtained by both thermal analysis and visual-poly thermal methods and tabulated in. Ref. 316. The observed eutectic is 430 DC, XB
-- 635'
III
~ ~ 550
~ SOD
450
• R.f.316
'" / ~ / "'. / '\.,.
0.4S5
400 ~~o.L....o. 1 -'-'-.L..o .L..I2
-'-'-.!....I....a-'-'-.!....I....a-'-'--'-o .Ws -'-'-.......L.-'-'--'-OW. 7 -'-'-...... oW. B ............. -'-0 W. 9 -,-,-....::l
CsBr CsF Mole Fraction CsF
FIG. 66. The system CsBr(A) + CsF(B).
J. Phys. Chem. Ref. Data, Vol. 16, No.3, 1987
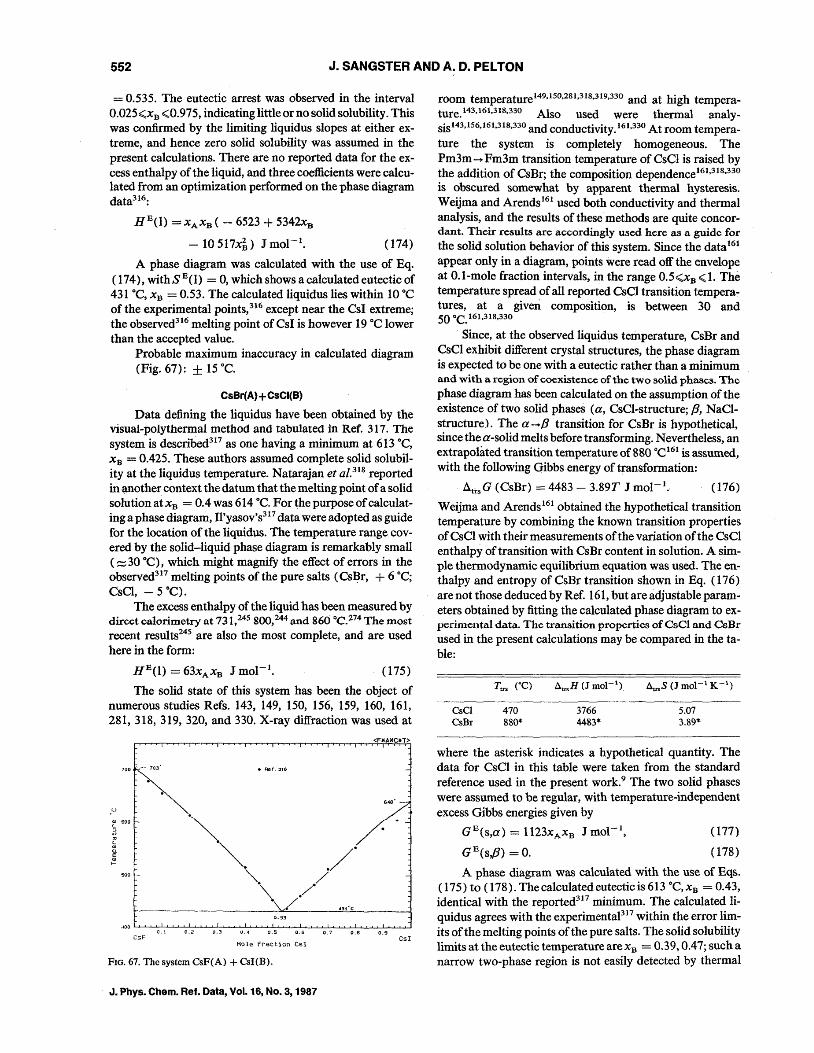
552 J. SANGSTER AND A. D. PELTON
= 0.535. The eutectic arrest was observed in the interval 0.025<xB <0.975, indicating little or no solid solubility. This was confirmed by the limiting liquidus slopes at either extreme, and hence zero solid solubility was assumed in the present calculations. There are no reported data for the excess enthalpy of the liquid, and three coefficients were calculated from an optimization performed on the phase diagram data316:
HE(1) = XAXB ( - 6523 + 5342xB
(174)
A phase diagram was calculated with the use of Eq. (174), withSE(l) = 0, which shows a calculated eutectic of 431°C, XB = 0.53. The calculated liquidus lies within 10°C of the experimental points,316 except near the CsI extreme; the observed316 melting point ofCsI is however 19°C lower than the accepted value.
Probable maximum inaccuracy in calculated diagram (Fig. 67): ± 15°C.
CsBr(A)+ CsCI(B)
Data defining the liquidus have been obtained by the visual-polythermal method and tabulated in Ref. 317. The system is described317 as one having a minimum at 613°C, X B = 0.425. These authors assumed complete solid solubility at the liquidus temperature. Natarajan et al.318 reported in another context the datum that the melting point of a solid solutionatxB = 0.4 was 614 DC. For the purpose of cal cui ating a phase diagram, Il'yasov's317 data were adopted as guide for the location of the liquidus. The temperature range covered by the solid-liquid phase diagram is remarkably small ( ~ 30°C), which might magnify the effect of errors in the observed317 melting points of the pure salts (CsBr, + 6°C; CsCl, - 5°C).
The excess enthalpy of the liquid has been measured by dircct calorimetry at 731,245 800,244 and 860°C. 274 The most recent results245 are also the most complete, and are used here in the form:
aE(l) = 63xA X B Jmol- 1• (175)
The solid state of this system has been the object of numerous studies Refs. 143, 149, 150, 156, 159, 160, 161, 281, 318, 319, 320, and 330. X-ray diffraction was used at
700 ' .. -- 7Q3
.u
~ 600
~ ~ ~
CsF 0.5
Mole Fraction CsI
FIG. 67. The system CsF(A) + CsI(B).
J. Phys. Chem. Ref. Data, Vol. 16, No.3, 1987
<FI!AI!CIIT>
640' -
CsI
room temperature149,150,281,318.319,330 and at high temperature. 143,161,318.330 Also used were thermal analySiS143,156,161.3I8.330 and condnctivity.161.330 At room tempera-ture the system is completely homogeneous. The Pm3m - Fm3m transition temperature of CsCI is raised by the addition of CsBr; the composition dependence161,318.330 is obscured somewhat by apparent thermal hysteresis. Weijma and Arends161 used both conductivity and thermal analysis, and the results of these methods are quite concordant. Their results are accordingly used here as a guidc for the solid solution behavior of this system. Since the data 161
appear only in a diagram, points were read off the envelope at O.l-mole fraction intervals, in the range 0.5<XB <1. The temperature spread of all reported CsCl transition tempera~ tnres, at it given composition, is between 30 and 50°C.161.318.330
. Since, at the observed liquidus temperature, CsBr and CsCl exhibit different crystal structures, the phase diagram is expected to be one with a eutectic rather than a minimum and with a region of coexistence of the two solid phascs. The phase diagram has been calculated on the assumption of the existence of two solid phases (a, CsCI-structure; (3, NaClstructure). The a - B transition for CsBr is hypothetical. since the a-solid melts before transforming. Nevertheless, an extrapolated transition temperature of 880 °C161 is assumed, with the following Gibbs energy of transformation:
AtrsG (CsBr) = 4483 - 3.89T J mol-I. (176)
Weijma and Arends161 obtained the hypothetical transition temperature by combining the known transition properties of esCI with their measurements of the variation of the CsC} enthalpy of transition with CsBr content in solution. A simple thermodynamic equilibrium equation was used. The enthalpy and entropy of CsBr transition shown in Eq. (176) are not those deduced by Ref. 161, but are adjustable parameters obtained by fitting the calculated phase diagram to experim.cntal data. The transition propcrties of CsC} and CsBr used in the present calculations may be compared in the table:
CsCl CsBr
Ttrs rC)
470 880*
3766 4483*
5.07 3.89*
where the asterisk indicates a hypothetical quantity. The data for CsCI in this table were taken from the standard reference used in the present work. 9 The two solid phases were assumed to be regular, with temperature-independent excess Gibbs energies given by
GE(s,a) = 1123xA xB J mol-I,
G E(S,{3) = o. (177)
(178)
A phase diagram was calculated with the use of Eqs. ( 175) to (178). The calculated eutectic is 613°C, XB = 0.43, identical with the reported317 minimum. The calculated liquidus agrees with the experimental317 within the error limits of the melting points ofthe pure salts. The solid solubility limits at the eutectic temperature arexB = 0.39,0.47; such a narrow two-phase region is not easily detected by thermal
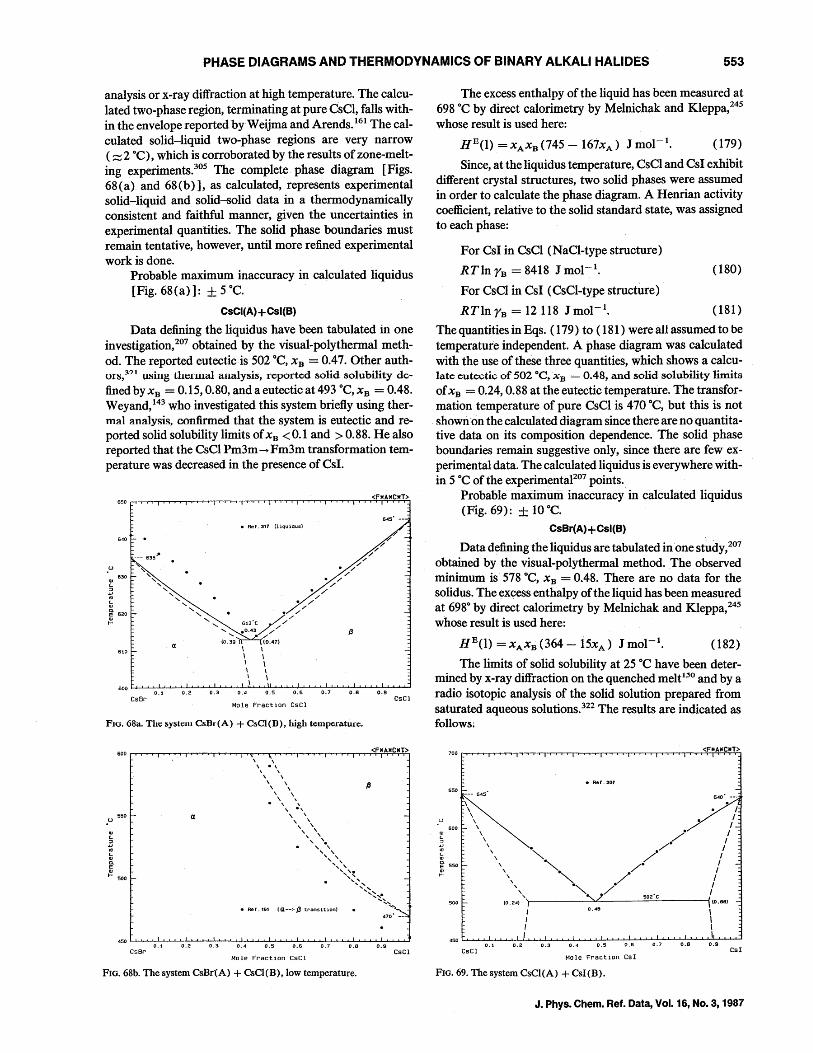
PHASE DIAGRAMS AND THERMODYNAMICS OF BINARY ALKALI HALIDES 553
analysis or x-ray diffraction at high temperature. The calculated two-phase region, terminating at pure CsCI, falls within the envelope reported byWeijma and Arends. 161 The calculated solid-liquid two-phase regions are very narrow (~2 DC), which is corroborated by the results of zone-melting experiments.305 The complete phase diagram [Figs. 68(a) and 68(b)], as calculated, represents experimental solid-liquid and solid-solid data in a thermodynamically consistent and faithful manner, given the uncertainties in experimental quantities. The solid phase boundaries must remain tentative, however, until more refined experimental work is done.
Probable maximum inaccuracy in calculated liquidus [Fig. 68(a)]: ± 5°C.
CsCI(A)+Csl(B)
Data defining the liquidus· have been tabulated in one investigation,207 obtained by the visual-polythermal method. The reported eutectic·is 502°C, xB = 0.47. Other auth~ urs,~?l using thenual analysis, reported solid solubility defined by XB = 0.15,0.80, and a eutectic at 493°C, XB = 0.48. Weyand,143 who investigated this system briefly using thermal analy~i~. confirmed that the system is eutectic and reported solid solubility limits of X B < 0.1 and> 0.88. He also reported that the CsCI Pm3m ~ Fm3m transformation temperature was decreased in the presence of CsI.
., 630
i ~ 620
I-
(0.39 )
• Ref. 317 n iquidus}
\ \ \ \ \
<FlfAlfClfT>
645' --
(3
\ 600 L...l....L...t....J....;L...l....L..s......\.....I....t:...I.....s......\.....'::-'-'-..I....L..J-:"-'-.J....I..JJ-:'-'-~-:'-'-~-:'-'-~-:'-'-~-:'-'-..........,
o. t 0.2 0.3 0.4 0.5 0.6 0.7 0.8 0.9 CsBr
Mole Fraction CsC]
FIG. 68a. The syslem CsBl'(A) + CsCl(D), high tClllpccat1.uc.
.u
OJ L
t ~
550 r-
I- 500 t-
CsBr 0.1
a
• Ref. 161 (a--> (3 transition)
0.5 0.7
Mole Fraction CsCl
FIG. 68b. The system CsBr(A) + CsCl(B), low temperature.
CsC]
-
0.9 CsCl
The excess enthalpy of the liquid has been measured at 698°C by direct calorimetry by Melnichak and Kleppa, 245 whose result is used here:
(179)
Since, at the liquidus temperature, esCI and CsI exhibit different crystal structures, two solid phases were assumed in order to calculate the phase diagram. A Henrian activity coefficient, relative to the solid standard state, was assigned to each phase:
For CsI in CsCI (NaCI-type structure)
RTln rB = 8418 J mol-I.
For CsCI in CsI (CsCI-type structure)
RTln rB = 12 118 J mol-I.
(180)
(181)
The quantities in Eqs. (179) to ( 181) were all assumed to be temperature independent. A phase diagram was calculated with the use of these three quantities, which shows a calculate eutectic of 502 °C,XB "- 0.48, and solid solubility limits of XB = 0.24, 0.88 at the eutectic temperature. The transformation temperature of pure CsCI is 470°C, but this is not shown on the calculated diagram since there are no quantitative data on its composition dependence. The solid phase boundaries remain suggestive only, since there are few experimental data. The calculated liquidus is everywhere within 5 °C of the experimental207 points.
Probable maXiinum inaccuracy in calculated liquidus (Fig. 69): ± 10°C.
CsBr(A) +Csl(B)
Data defining the liquidus are tabulated in one study, 207 obtained by the visual-polythermal method. The observed minimum is 578°C, X B = 0.48. There are no data for the solidus. The excess enthalpy of the liquid has been measured at 698° by direct calorimetry by Melnichak and Kleppa, 245 whose result is used here:
RE(l) = XAXB (364 - 15xA ) J mol-I. (182)
The limits of solid solubility at 25°C have been deter~ mined by x-ray diffraction on the quenched mele:5Q and by a radio isotopic analysis of the solid solution prepared from saturated aqueous solutions.322 The results are indicated as follows;
• Ref. 207
650 -- 645
640' --
\ I \ I \ I
\ / / \ /. \\." /. / \" /. /
\ '" /. I " -, /. I
" ' ____ I 502'C I (0.24) ')-, ----~-----==....::.----;((O.BBI
I 0.4B ,
.u 600
cu L ::l
'" L OJ ! 550
I , I I I I
0.2 0.3 0.5 0.6 0.7 0.8 0.9 CsCl CsI
Mole Fraction CsI
FIG. 69. The system CsCl(A) + CsI(B).
J. Phys. Chern. Ref. Data, Vol. 16, No.3, 1987
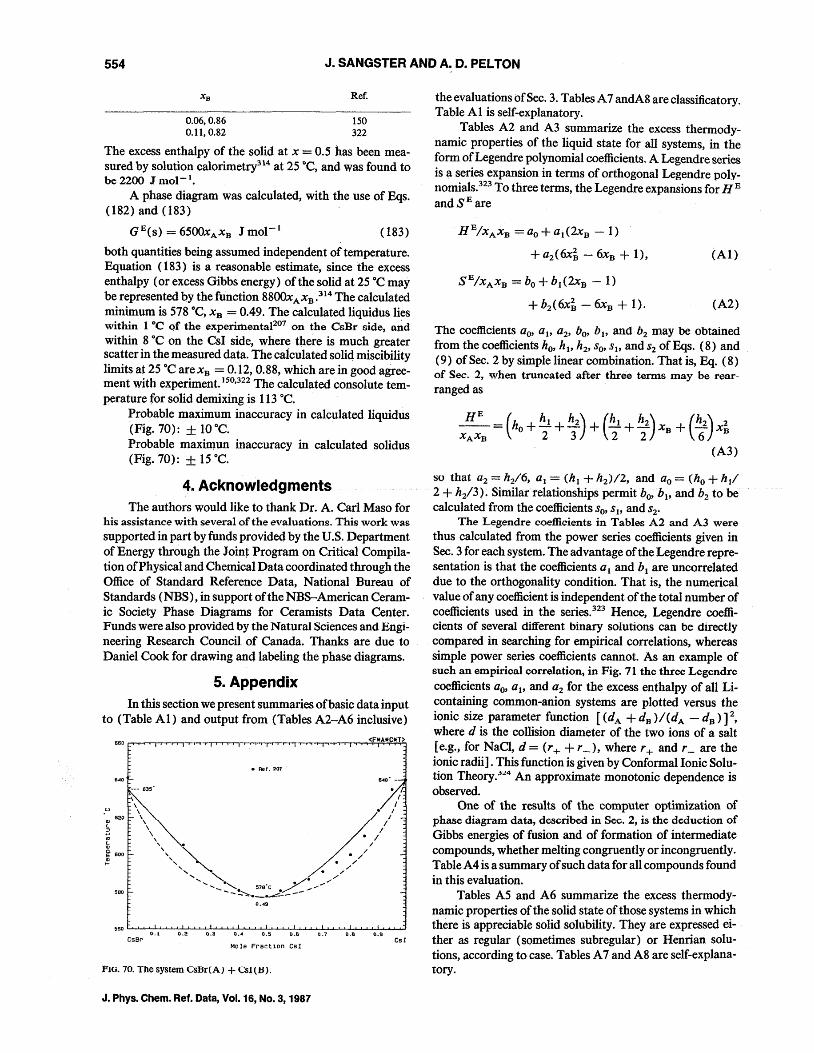
554 J. SANGSTER AND A~ D. PELTON
Ref.
0.06,0.86 150 0.11, 0.82 322
The excess enthalpy of the solid at x = 0.5 has been measured by solution calorimetry314 at 25°C, and was found to be 2200 J mol-to
A phase diagram was calculated, with the use of Eqs. (182) and (183)
(183)
both quantities being assumed independent of temperature. Equation (183) is a reasonable estimate, since the excess enthalpy (or excess Gibbs energy) of the solid at 25°C may be represented QY the function 8800x A X B • 314 The calculated minimum is 578°C, xB = 0.49. The calculated liquidus lies within 1 °C of the experimental207 on the CsBr side, and within 8 °C on the CsI side, where there is much greater scatter in the measured data. The caiculated soliel miscibility limits at 25°C are xB = 0.12, 0.88, which are in good agreement with experiment. 150.322 The calculated consolute tem-perature for solid demixing is 113 °e.
Probable maximum inaccuracy in calculated liquidus (Fig. 70): ± 10 oe. Probable maxim-un inaccuracy in calculated solidus (Fig. 70): ± 15 °e.
4. Acknowledgments The authors would like to thank Dr. A. Carl Maso for
his assistance with several of the evaluations. This work was supported in part by funds provided by the U.S. Department of Energy through the Joint Program on Critical Compilation of Physical and Chemical Data coordinated through the Office of Standard Reference Data, National Bureau of Standards (NBS), in support of the NBS-American Ceramic Society Phase Diagrams for Ceramists Data Center. Funds were also provided by the Natural Sciences and Engineering Research Council of Canada. Thanks are due to Daniel Cook for drawing and labeling the phase diagrams.
5. Appendix In this section we present summaries of basic data input
to (Table AI) and output from (Tables A2-A6 inclusive)
.u IU 620
c..
~ 1u ! 600
580
0.3 0.5 o.a CsBr
Mole Fraction CsI
Fm. 70. The system CsBr(A) + CsI(B).
J. Phys. Chem. Ref. Data, Vol. 16, No.3, 1987
O.!I CsI
the evaluations bfSec. 3. Tables A 7 andA8 are classificatory. Table Al is self-explanatory.
Tables A2 and A3 summarize the excess thermodynamic properties of the liquid state for all systems, in the form of Legendre polynomial coefficients. A Legendre series is a series expansion in terms of orthogonal Legendre polynomials.323 To three terms, the Legendre expansions for HE
andSEare
HE/XAXB = ao + a1(2xB -1)
+ a2(6x~ - 6xB + 1), (Al)
SE/XAXB = bo + b1(2xB - 1)
+ b2(6x~ - 6xB + 1). (A2)
The coefficients ao' a 11 a2, bo, b1, andb2 may be obtained from the coefficients ho, hi' h2' So, S 1, and S2 of Eqs. (8) and (9) of Sec. 2 by simple linear combination. That is, Eq. (8) of Sec. 2, when truncated after three terms may be rearranged as
so that a2 = h2/6, a l = (hi + h2)/2, and ao = (ho + hl/ 2 + h2/3). Similar-relationships permit bo,b1, and b2 to be calculated from the coefficients So, SI' and S2'
The Legendre coefficients in Tables A2 and A3 were thus calculated from the power series coefficients given in Sec. 3 for each system. The advantage of the Legendre representation is that the coefficients a1 and bi are uncorrelated due to the orthogonality condition. That is, the numerical value of any coefficient is independent of the total number of coefficients used in the series.323 Hence, Legendre coefficients of several ditIerent binary solutions can be directly compared in searching for empirical correlations, whereas simple power series coefficients cannot. As an example of such an empirical correlation, in Fig. 71 the three Legendre
coefficients ao, ai' and a2 for the excess enthalpy of all Licontaining common-anion systems are plotted versus the ionic size parameter function [(dA + dB )/(dA - dB )]2, where d is the collision diameter of the two ions of a salt [e.g., for NaCI, d = (r + + r _), where r + and r _ are the ionic radii]. This function is given by Conformal Ionic Solution Theory. ;:!:.!4 An approximate monotonic dependence is observed.
One of the results of the computer optimization of phase diagram data, described in Sec. 2, is the deduction of Gibbs energies of fusion and of formation of intermediate compounds, whether melting congruently or incongruently. Table A4 is a summary of such data for all compounds found in this evaluation.
Tables A5 and A6 summarize the excess thermodynamic properties of the solid state of those systems in which there is appreciable solid solubility. They are expressed either as regular (sometimes subregular) or Henrian solutions, according to case. Tables A 7 and A8 are self-explanatory.
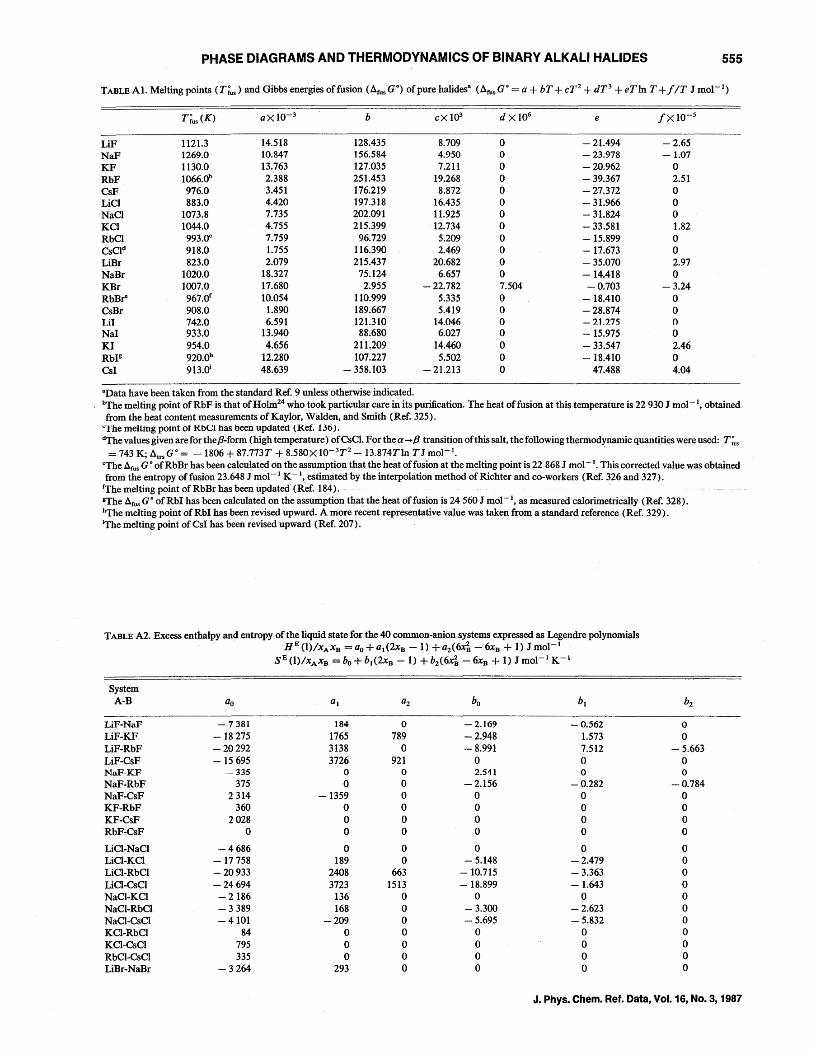
PHASE DIAGRAMS AND THERMODYNAMICS OF BINARY ALKALI HALIDES 555
TABLE AI. Melting points (T;us) and Gibbs energies offusion (~fusGO) of pure halidesa (~fusGo = a + bT + CT2 + dT3 + eTln T + / IT J mol-I)
T;us (K) aX 10-3 b cXl()3 dX106 e /XIO-5
LiF 1121.3 14.518 128.435 8.709 0 - 21.494 -2.65 NaP 1269.0 10.847 156.584 4.950 0 - 23.978 -1.07 KF 1130.0 13.763 127.035 7.211 0 -20.962 0 RbF 1066.0b 2.388 251.453 19.268 0 - 39.367 2.51 CsF 976.0 3.451 176.219 8.872 0 -27.372 0 LiCI 883.0 4.420 197.318 16.435 0 - 31.966 0 NaCI 1073.8 7.735 202.091 11.925 0 - 31.824 0 KCI 1044.0 4.755 215.399 12.734 0 - 33.581 1.82 RbCI 993.0c 7.759 96.729 5.209 0 -15.899 0 CsCld 918.0 1.755 116.390 2.469 0 - 17.673 0 LiBr 823.0 2.079 215.437 20.682 0 - 35.070 2.97 NaBr 1020.0 18.327 75.124 6.657 0 - 14.418 0 KBr 1007.0 17.680 2.955 - 22.782 7.504 -0.703 -3.24 RbBre 967.0£ 10.054 110.999 5.335 0 -18.410 0 CsBr 908.0 1.890 189.667 5.419 0 - 28.874 0 Lil 742.0 6.591 121.310 14.046 0 - 21.275 0
NaI 933.0 13.940 88.680 6.027 0 -15.975 0 KI 954.0 4.656 211.209 14.460 0 - 33.547 2.46 RbI8 920.()h 12.280 107.227 5.502 0 18.410 0 CsI 913.cY 48.639 358.103 ..,... 21.213 0 47.488 4.04
aData have been taken from the standard Ref. 9 unless otherwise indicated. ~he melting point ofRbF is that of Holm24 who took particular care in its purification. The heat offusion at this temperature is 22 930 J mol-I, obtained from the heat content measurements of Kaylor, Walden, and Smith (Ref. 325).
'The meltmg point of RbCI has been updated (Ref. 136). dThe values given are for the f3-form (high temperature) ofCsCl. For the a -+ f3 transition of this salt, the following thermodynamic quantities were used: T;rs
= 743 K; ~trs GO = - 1806 + 87.773T + 8.580X 1O-3T 2 - 13.874Tln TJ mol-I. . ~he ~fus GO of RbBr has been calculated on the assumption that the heat of fusion at the melting point is 22 868 J mol-I. This corrected value was obtained from the entropy offusion 23.648 J mol- I K- I, estimated by the interpolation method of Richter and co-workers (Ref. 326 and 327).
fThe melting point of RbBrhas been updated' (Ref. 184). . . S'fhe ~fus GO of RbI has been calculated on the assumption that the heat offusion is 24 560 J mol-I, as measured calorimetrically (Ref. 328). hThe melting point of RbI has been revised upward. A more recent representative value was taken from a standard reference (Ref. 329). iThe melting point ofCsI has been revised upward (Ref. 207).
TABLE A2. Excess enthalpy and entropy of the liquid state for the 40 common-anion systems expressed as Legendre polynomials HE (l)/xAxB = ao + a I(2xB -1) + a2(Ws - 6xB + 1) J mol- I
SE(l)/xAxB =bo+bl (2xB -1) +b2(6xi -6XB + 1) Jmol- 1 K- 1
System A-B ao a l a2 bo bl b2
LiP-NaP -7381 184 0 - 2.169 -0.562 0 LiF-KF -18275 1765 789 - 2.948 1.573 0 LiF-RbF - 20292 3138 0 - 8.991 7.512 - 5.663 LiF-CsF -15695 3726 921 0 0 0 NaF··KF 335 0 0 2.541 0 0 NaF-RbF 375 0 0 - 2.156 -0.282 -0.784 NaF-CsF 2314 -1359 0 0 0 0 KF-RbF 360 0 0 0 0 0 KF-CsF 2028 0 0 0 0 0 RbF-CsF 0 0 0 0 0 0
LiCI-NaCI -4686 0 0 0 0 0 LiCI-KCI - 17758 189 0 - 5.148 -2.479 0 LiCI-RbCI - 20933 2408 663 - 10.715 - 3.363 0 LiCI-CsCI -24694 3723 1513 -18.899 - 1.643 0 NaCI-KCI -2186 136 0 0 0 0 NaCI-RbCl -3389 168 0 - 3.300 - 2.623 0 NaCI-CsCI -4101 -209 0 - 5.695 - 5.832 0 KCI-RbCI 84 0 0 0 0 0 KCI-CsCI 795 0 0 0 0 0 RbCI-CsCI 335 0 0 0 0 0 LiBr-NaBr -3264 293 0 0 0 0
J. Phys. Chem. Ref. Data, Vol. 16, No.3, 1987
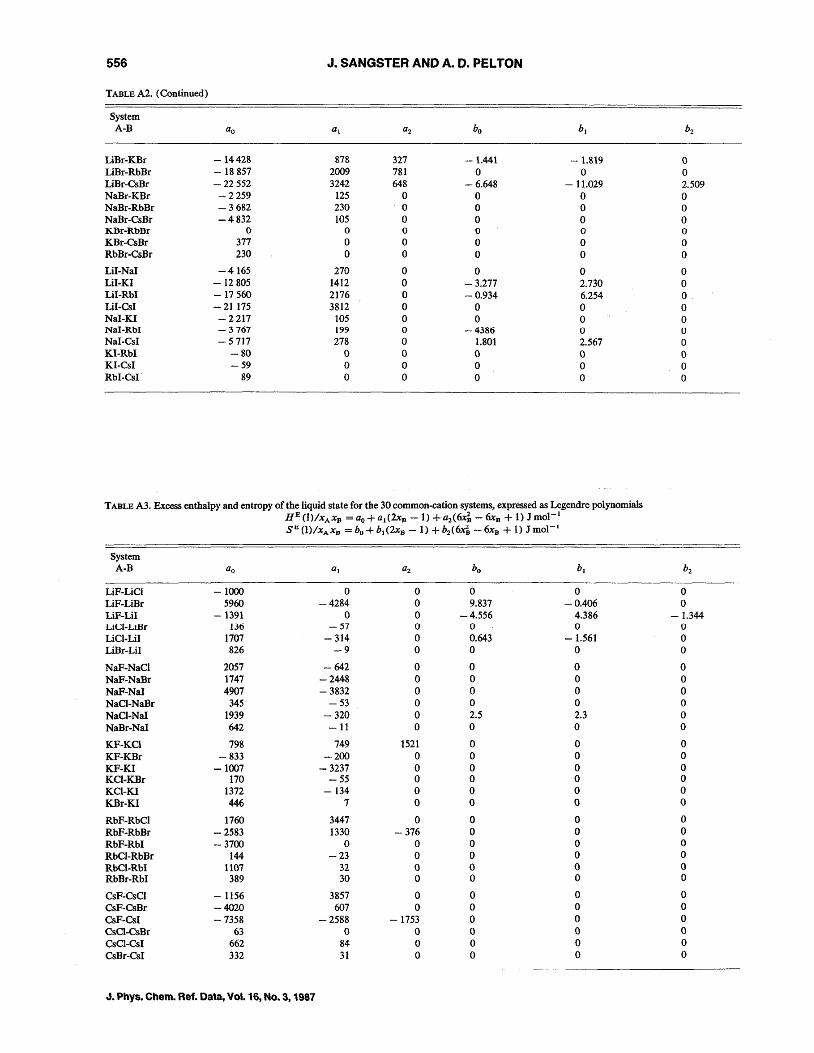
556 J. SANGSTER AND A. D. PEL TON
TABLE A2. (Continued)
System A-B ao a1 a2 bo b1 b2
LiBr-KBr -14428 878 327 -1.441 -1.819 0 LiBr-RbBr - 18857 2009 781 0 0 0 LiBr-CsBr - 22 552 3242 648 -6.648 -11.029 2.509 NaBr-KBr -2259 125 0 0 0 0 NaBr-RbBr -3682 230 0 0 0 0 NaBr-CsBr -4832 105 0 0 0 0 KBr-RbBr 0 0 0 0 0 0 KBr-CsBr 377 0 0 0 0 0 RbBr-CsBr 230 0 0 0 0 0
LiI-NaI -4165 270 0 0 0 0 LiI-KI - 12805 1412 0 - 3.277 2.730 0 LiI-RbI -17560 2176 0 -0.934 6.254 0 LiI-CsI - 21175 3812 0 0 0 0 NaI-KI -2217 105 0 0 0 0 NaI-RbI -3767 199 0 -4386 0 U NaI-CsI -5717 278 0 1.801 2.567 0 KI-RbI -80 0 0 0 0 0 KI-CsI -59 0 0 0 0 0 RbI-CsI 89 0 0 0 0 0
TABLE A3. Excess enthalpy and entropy of the liquid state for the 30 common-cation systems, expressed as Legendre polynomials HE (1)/XA XB =ao+a1(2xB -1) +a2(6xi -6xB + 1) Jmol- 1
SI:;(1)/XA XB =bo+bJ(2xB -1) +b2(6xi -6xB + 1) Jmol- 1
System A-B ao a J az bo bl bz
LiF-LiCI -1000 0 0 0 0 0 LiF-LiBr 5960 -4284 0 9.837 -0.406 0 LiF-LiI -1391 0 0 -4.556 4.386 - 1.344 LiCJ-LiHr 136 -~7 0 0 0 0
LiCI-LiI 1707 -314 0 0.643 - 1.561 0 LiBr-LiI 826 -9 0 0 0 0
NaP-NaCI 2057 -642 0 0 0 0 NaF-NaBr 1747 -2448 0 0 0 0 NaP-NaI 4907 - 3832 0 0 0 0 NaO-NaBr 345 -53 0 0 0 0 NaCI-NaI 1939 -320 0 2.5 2.3 0 NaBr-NaI 642 -11 0 0 0 0
KF-KCl 798 749 1521 0 0 0 KF-KBr -833 -200 0 0 0 0 KF-KI -1007 -3237 0 0 0 0 KCI-KBr 170 -55 0 0 0 0 KCI-KI 1372 -134 0 0 0 0 KBr-KI 446 7 0 0 0 0
RbF-RbO 1760 3447 0 0 0 0 RbF-RbBr -2583 1330 -376 0 0 0 RbF-RbI -3700 0 0 0 0 0 RbCI-RbBr 144 -23 0 0 0 0 RbCI-RbI 1107 32 0 0 0 0 RbBr-RbI 389 30 0 0 0 0
CsF-CsCI -1156 3857 0 0 0 0 CsF-CsBr -4020 607 0 0 0 0 CsF-CsI -7358 -2588 -1753 0 0 0 CsCI-CsBr 63 0 0 0 0 0 CsCI-CsI 662 84 0 0 0 0 CsBr-CsI 332 31 0 0 0 0
J. Phys. Chern. Ref. Data, Vol. 16, No.3, 1987
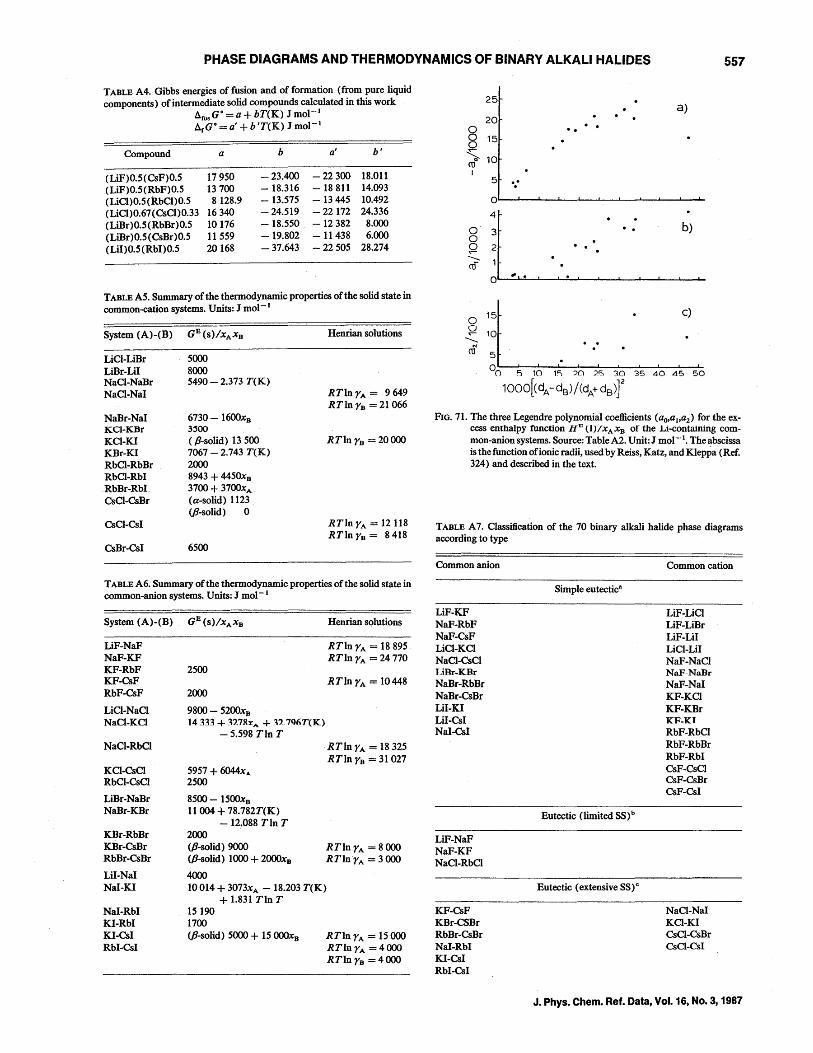
PHASE DIAGRAMS AND THERMODYNAMICS OF BINARY ALKALI HALIDES 557
TABLE A4. Gibbs energies of fusion and of formation (from pure liquid components) of intermediate solid compounds calculated in this work
arusG o = 0 + bT(K) J mol- 1
arGo = 0' + b 'T(K) J mol- 1
Compound o b 0' b'
(LiF)O.5(CsF)0.5 17950 -23.400 -22300 18.011 (LiF)0.5(RbF)0.5 13700 - 18.316 - 18811 14.093 (LiCI)0.5(RbCl)O.5 8128.9 -13.575 -13 445 10.492 (LiCl)O.67 (CsCI)O.33 16340 - 24.519 -22172 24.336 (LiBr)0.5(RbBr)O.5 10 176 -18.550 -12382 8.000 (LiBr)0.5(CsBr)O.5 11559 -19.802 -11438 6.000 (LiI)0.5(RbI)O.5 20168 - 37.643 - 22505 28.274
TABLE AS. Summary of the thermodynamic properties of the solid state in common-cation systems. Units: J mol- 1
System (A)-(B)
LiCI-LiBr LiBr-LiI NaCI-NaBr NaCI-NaI
NaBr-NaI KCl-KBr KCI-KI KBr-KI RbCI-RbBr RbCI-RbI RbBr-RbI CsCI-CsBr
CsCI-CsI
CsBr-CsI
GE(S)/XAXB
5000 8000 5490 - 2.373 T(K)
6730 - 1600xB 3~OO
( P-solid) 13 500 7067 - 2.743 T(K) 2000 8943 + 4450xB 3700 + 3700xA
(a-solid) 1123 (P-solid) 0
6500
Henrian solutions
RTln rA = 9649 RTln rB 21066
RTln rB = 20000
RTln rA = 12118 RTln rB = 8418
TABLE A6. Summary of the thermodynamic properties of the solid state in common-anion systems. Units: J mol- 1
System (A)-(B)
LiF-NaP NaF-KF KF-RbF KF-CsF RbF-CsF
LiCl-NaCI NaCl-KCl
NaCI-RbCl
KCI-CsCl RbCI-CsCl
LiBr-NaBr NaBr-KBr
KBr-RbBr KBr-CsBr RbBr-CsBr
LiI-NaI NaI-Kl
NaI-RbI KI-RbI Kl-CsI RbI-CsI
GE (S)/XAXB Henrian solutions
2500
2000
9800 - 5200XB 14333 + 327Rr. ... + 32_796T(IC)
-5.598 Tln T
5957 + 6044xA
2500
8500 - 1500xB 110044- 78.782T(K)
-12.088 TIn T 2000 (P-solid) 9000 (p-solid) 1000 + 2000XB
4000
RTln rA = 18895 RTln rA = 24770
RTlnrA = 10448
RTln rA = 18325 RTln rB = 31027
RTln rA = 8 000 RTlnrA = 3000
10 014 + 3073xA - 18.203 T(K) + 1.831 TIn T
15190 1700 (P-solid) 5000 + 15 OOOxB RTln rA = 15000
RTlnrA =4000 RTln rB = 4000
0 0 0 ~ 0 en I
0 0 0 , ro
25
20
15
10
5
0
jl
.:
.. , .
. . ..
, .
a)
• • b)
~ :;t , , , , .. ~ , o ~ 1() 1") ?O ,C; 30
1000[( dA - de) / (dA+ dB)r
c)
, I ! I
35 40 4S 50
FIG. 71. The three Legendre polynomial coefficients (OO,OV02) for the excess enthalpy function HDU)lxAXB of the Li-containing common-anion systems. Source: Table A2. Unit: J mol-to The abscissa is the function of ionic radii, used by Reiss, Katz, and Kleppa (Ref. 324) and described in the text.
TABLE A7. Classification of the 70 binary alkali halide phase diagrams according to type
Common anion
LiF-KF NaF-RbF NaP-CsF LiCI-KCI NaCI-CsCI LiBr-ICBr NaBr-RbBr NaBr-CsBr Lil-KI LiI-CsI NaI-CsI
LiF-NaP NaP-KF NaCI-RbCI
KF-CsF KBr-CSBr RbBr-CsBr NaI-RbI Kl-CsI RbI-CsI
Simple eutectica
Eutectic (limited SS)b
Eutectic (extensive SS)C
Common cation
LiF-LiCl LiF-LiBr LiF-LiI LiCI-LiI NaP-NaCI NaF-NaBr NaF-NaI KF-KCl KF-KBr KF-KT RbF-RbCl RbF-RbBr RbF-RbI CsF-CsCI CsF-CsBr CsF-CsI
NaCl-NaI KCl-KI CsCl-CsBr CsCI-CsI
J. Phys. Chem. Ref. Data, Vol. 16, No.3, 1987
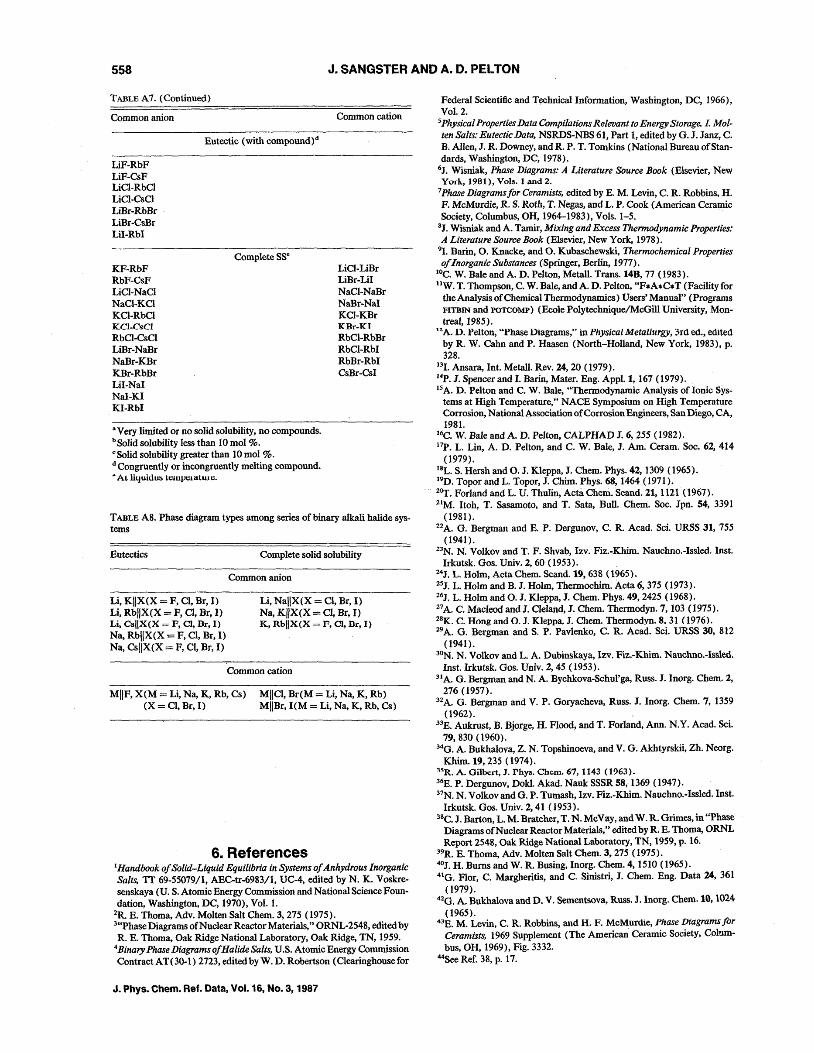
558 J. SANGSTER AND A. D. PELTON
TABLE A1. (Continued)
Common anion
LiF-RbF LiF-CsF LiCI-RbCl LiCI-CsCl LiBr-RbBr LiBr~sBr LiI-RbI
KF-RbF RbF-CsF LiCI-NaCl NaCl-KCl KCI-RbCl KCI-CsCI RbCI-CsCl LiBr-NaBr NaBr-KBr KBr-RbBr LiI·NaI NaI-KI KI-RbI
Eutectic (with compound) d
Complete sse
a Very limited or no solid solubility, no compounds. bSolid solubility less than 10 mol %. cSolid solubility greater than 10 mol %. d Congruently or incongruently melting compound. .. At liyuiuus tCllljJt:lilt.WC.
Common cation
LiCl-LiBr LiBr-LiI NaCI-NaBr NaBr-Nal KCI-KBr KBr-KI RbCI-RbBr RbCI-RbI RbBr-RbI CsBr-CsI
TABLE A8. Phase diagram types among series of binary alkali halide sys~ tems
Eutectics Complete solid solubility
Common anion
Li, KIIX(X = F, CI, Br, I) Li, RbIlX(X = F, CI, Br, I) Li, CsIIX(X = P, CI, Dr, I)
Na, RbIlX(X = F, CI, Br, I) Na, CsIIX(X = F, CI, Br, I)
Li, NaIlX(X = Cl, Br, I) Na, KIIX(X = CI, Br, 1) K, RbllX(X ~ P, CI, Dr, I)
Common cation
MIIF, X{M = Li, Na, K, Rb, Cs) (X = CI, Br, I)
MIIC}, Br(M = Li, Na, K, Rb) MIIBr, I(M = Li, Na, K, Rb, Cs)
6. References 1 Handbook of Solid-Liquid Equilibria in Systems of Anhydrous Inorganic Salts, TT 69-55079/1, AEC-tr-6983/1, UC-4, edited by N. K. Voskresenskaya (u. S. Atomic Energy Commission and National Science Foundation, Washington, DC, 1970), Vol. 1.
2R. E. Thoma. Adv. Molten Salt Chem. 3, 215 (1975). 3"Phase Diagrams of Nuclear Reactor Materials," ORNL-2548, edited by R. E. Thoma, Oak Ridge National Laboratory, Oak Ridge, TN, 1959.
4Binary Phase Diagrams of Halide Salts, U.S. Atomic Energy Commission ContractAT(30-l) 2723, editedbyW. D. Robertson (Clearingbousefor
J. Phys. Chern. Ref. Data, Vol. 16, NO.3, 1987
Federal Scientific and Technical Information, Washington, DC, 1966), Vol. 2.
5 Physical Properties Data Compilations Relevant to Energy Storage. L Molten Salts: Eutectic Data. NSRDS-NBS 61, Part 1, edited by G. J. Janz, C. B. Allen, J. R. Downey, and R. P. T. Tomkins (National Bureau of Standards, Washington, DC, 1918).
6J. Wisniak, Phase Diagrams: A Literature Source Book (Elsevier, New York, 1981), Vols. land 2.
7Phase Diagrams for Ceramists. edited by E. M. Levin, C. R. Robbins, H. F. McMurdie, R. S. Roth, T. Negas, and L. P. Cook (American Ceramic Society, Columbus, OH, 1964-1983), Vols. 1-5.
8J. Wisniak and A. Tamir,Mixing and Excess Thermodynamic Properties: A Literature Source Book (Elsevier, New York, 1978).
91. Barin, O. Knacke, and O. Kubaschewski, Thermochemical Properties ofInorganicSuhstances (Springer, Berlin, 1977).
10C. W. Bale and A. D. Pelton, Metall. Trans. 14B, 77 (1983). llW. T. Thompson, C. W. Bale, and A. D. Pelton, "F.A.C.T (Facility for
theAnalysis of Chemical Thermodynamics) Users' Manual" (Programs FITBIN and POTCOMP) (Ecole Polytechnique!McGill University, Mon· treal, 1985).
t7.A. D. Pelton, "Phase Diagrams," in Physical Metallurgy, 3rd ed., edited by R. W. Cahn and P. Haasen (North-Holland, New York, 1983), p. 328.
131. Ansara, Int. Metall. Rev. 24,20 (1979). 14p. J. Spencer and 1. Barin, Mater. Eng. App1.1, 167 (1979). 15 A. D. Pelton and C. W. Bale, "Thermodynamic Analysis of Ionic Sys
tems at High Temperature," NACE Symposium on High Temperature Corrosion, National Association of Corrosion Engineers, San Diego, CA, 1981.
16C. W. Bale and A. D. Pelton, CALPHAD J. 6, 255 (1982). 17p. L. Lin, A. D. Pelton, and C. W. Bale, J. Am. Ceram. Soc. 62,414
( 1979). 18L. S. Hersh and O. J. Kleppa, J. Chern. Phys.42, 1309 (1965) . l~. Topor and L. Topor, J. Chim. Phys. 68,1464 (1971). 211J'. Forland and L. U. Thulin, Acta Chem. Scand. 21,1121 (1967). 21M. Itoh, T. Sasamoto, and T. Sata, Bull. Chem. Soc. Jpn. 54, 3391
(1981). 22A. G. Bergman and E. P. Dergunov, C. R. Acad. Sci. URSS 31, 755
(1941). 23N. N. Volkov and T. F. Shvab, Izv. Fiz.-Khim. Nauchno.-Issled. Inst.
Irkutsk. Gos. Univ. 2, 60 (1953). . 24J. L. Holm, Acta Chem. Scand. 19,638 (1965). 25J. L. Holm and B. J. Holm, Thermochim. Acta 6,375 (1913). 26J, L. Holm and O. 1. Kleppa, J. Chem. Phys. 49, 2425 (1968). 27A. C. Macleod and J. Cleland, J. Chem. Thermodyn. 7, 103 (1975). 28K. C. Hong and O. 1. Kleppa. J. Chem. Thermodyn. 8. 31 (1976). z9A. G. Bergman and S. P. Pavlenko, C. R. Acad. Sci. URSS 30, 812 (1941)~
JON. N. Volkov and L. A. Dubinskaya, lzv. Fiz.-Khim. Nauchno.-Issled. Inst. Irkutsk. Oos. Univ. 2, 45 (1953).
llA. G. Bergman and N. A. Bychkova-Schul'ga, Russ. 1. Inorg. Chem. 2, 276 (1957).
32A. G. Bergman and V. P. Ooryacheva, Russ. J. Inorg. Chem.7, 1359 (1962).
33E. Aukrust, B. Bjorge, H. Flood, and T. Forland, Ann. N.Y. Acad. Sci. 79,830 (1960).
34G. A. Bukhalova, Z. N. Topshinoeva, and V. G. Akhtyrskii, Zh. Neorg. Khim.19,235 (1974).
~'iR. A. Gilbert, 1. rhY6. Chern. 67,1143 (1963). 36E. P. Dergunov, Dokl. Akad. Nauk SSSR 58, 1369 (1947). 37N. N. Volkov and O. P. Tumash, Izv. Fiz.wKhim. Nauchno.-Issled. Inst.
Irkutsk. Gos. Univ. 2,41 (1953). 38C. J. Barton, L. M. Bratcher, T. N. McVay, and W. R. Grimes, in "Phase
Diagrams of Nuclear Reactor Materials," edited by R. E. Thoma, ORNL Report 2548, Oak Ridge National Laboratory, TN, 1959, p. 16.
39R. E. Thoma, Adv. Molten Salt Chern. 3, 275 (1975). 4OJ. H. Bums and W. R. Busing, Inorg. Chern. 4,1510 (1965). 41G. Flor, C. Margheritis, and C. Sinistri, J. Cbem. Eng. Data 24, 361
( 1979). 42G. A. Bukhalova and D. V. Sementsova, Russ. J. Inorg. Chem.lO, 1024
(1965). 43E. M. Levin, C. R. Robbins, and H. F. McMurdie, Phase Diagrams/or
Ceramists, 1969 Supplement (The American· Ceramic Society, Columbus,OH, 1969), Fig. 3332.
44See Ref. 38, p. 17.
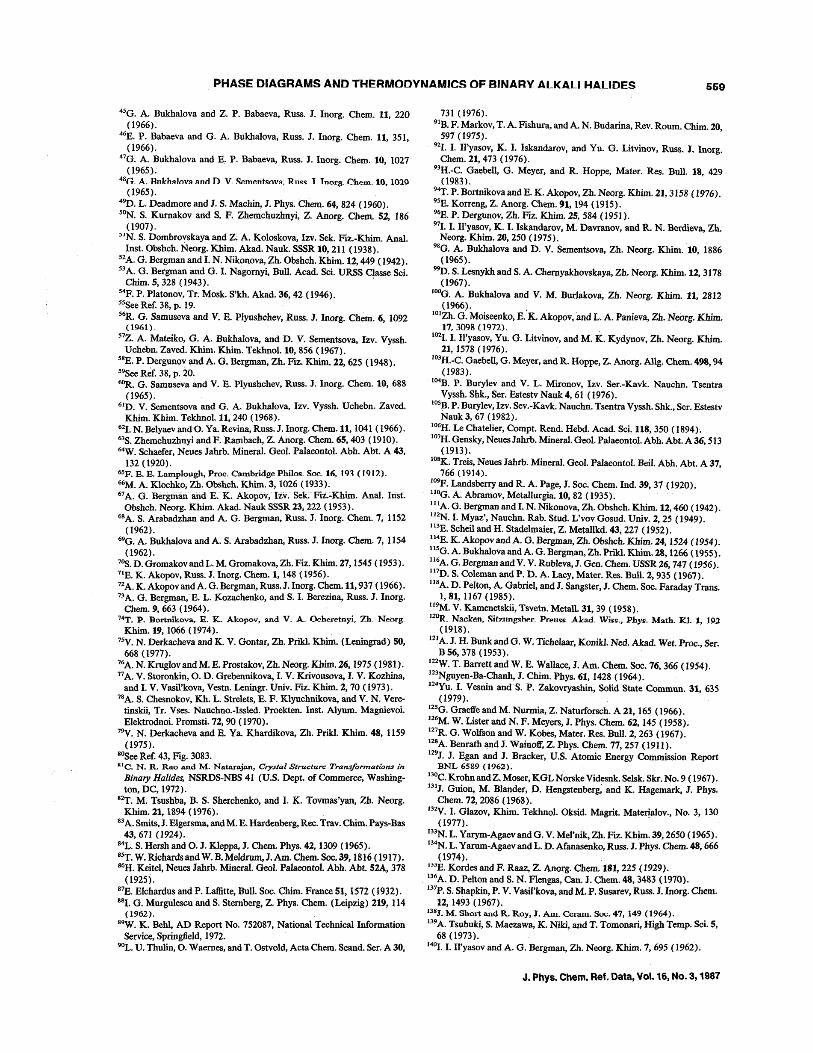
, PHASE DIAGRAMS AND THERMODYNAMICS OF BINARY ALKALI HALIDES 559
45G. A. Bukhalova and Z. P. Babaeva, Russ. J. Inorg. Chem. 11, 220 ( 1966).
46E. P. Babaeva and G. A. Bukhalova, Russ. J. Inorg. Chem. 11, 351, (1966).
47G. A. Bukhalova and E, P. Babaeva, Russ. J. lnorg. Chem. 10, 1027 (1965).
48n A. Hnlch~Jl"IV,:a ,:ann n v. ~p.mp.ntjl(\v,:a, Rm:o::: 1 Inorg. Chem..l0, 1019 (1965).
49J). L. Deadmore and J. S. Machin, 1. Phys. Chem. 64, 824 (1960). SON. S. Kurnakov and S. F. Zhemchuzhnyi, Z. Anorg. Chern. 52, 186
(1907). ~JN. S. Dombrovskaya and Z. A. Koloskova, Izv. Sek. Fiz.-Khim. Anal.
lnst. Obshch. Neorg. Khim. Akad. Nauk. SSSR 10, 211 (1938). s2A. G. Bergman and 1. N. Nikonova, Zh. Obshch. Khim.12, 449 (1942). 53A. G. Bergman and G. I. Nagornyi, Bull. Acad. Sci. URSS Classe Sci.
Chim. 5, 328 (1943). ' 54F. P. Platonov, Tr. Mosk. S'kh. Akad. 36, 42 (1946). 55See Ref. 38, p. 19.
56R. G. Samuseva and V. E. Plyushchev, Russ. J. Inorg. Chern. 6, 1092 (1961).
57Z. A. Mateiko, G. A. Bukhalova, and D. V. Sementsova, Izv. Vyssh. Uchebn. Zaved. Khim. Khim. Tekhno1.10, 856 (1967).
58E. P. Dergunov and A. G. Bergman, Zh. Fiz. Khim. 22, 625 (1948). S9See Ref. 38, p. 20. 6~. G. Samuseva and V. E. Plyushchev, Russ. J. Inorg. Chern. 10, 688
( 1965). 61D. V. Sementsova and G. A. Bukhalova, Izv. Vyssh. Uchebn. Zaved.
Khirn.Khim. Tekhnol.ll, 240 (1968). 621. N. Belyaev andO. Ya. Revina, Russ. J. Inorg. Chem.ll, 1041 (1966). 63S. Zhemchuzhnyi and F. Rambach, Z. Anorg. Chem. 65, 403 (1910). 64W. Schaefer, Neues Jahrb. Mineral. Geol. Palaeontol. Abh. Abt. A 43,
132 (1920). 6Sp. E. E. Lamplough, Proc. Cambridge Philos. Soc. 16; 193 (1912). 66M. A. Klochko, Zh. Obshch. Khim. 3,1026 (1933). 67A. G.Bergman and E.'K. Akopov, Izv. Sek. Fii.:'Khim. Anal. Inst.
Obshch. Neorg. Khim. Akad. NaukSSSR23, 222 (1953). 68A. S. Arabadzhan and A. G. Bergman, Russ. J. lnorg. Chem. 7, 1152
(1962). 69G. A. Bukhalova and A. S. Afabadzhan, Russ. J. Inorg. Chem. 7, 1154
( 1962). 70s. D. Gromakov and L. M. Gromakova, Zh. Fiz. Khim.27, 1545 (1953). 7lE. K. Akopov, Russ. J. Inorg. Chem. 1, 148 (1956). 72 A. K. Akopov and A. G. Bergman, Russ. J. Inorg. Chem.ll, 937 (1966). 73A. G. Bergman,E. L. Kozachenko, and S. I. Berezina, Russ. J. Inorg.
Chem. 9, 663 (1964). 74T. P. Bortnikova, R. :K. Akopov, and V. A. Ocheretnyi, Zh Nearg
Khim.19, 1066 (1974). 75V. N. Derkacheva and K. V. Gontar, Zh. Prlkl. Khim. (Leningrad) 50,
668 (1977). 76A. N. Kruglov and M. E. Prostakov, Zh. Noorg. Khim. 26, 1975 (1981). 77A. V. Storonkin, O. D. Grebennikova, I. V. Krivousova, I. V. Kozhina,
and I. V. Vasil'kova, Vestn. Leningr. Univ. Fiz. Khim. 2, 70 (1973). 78A. S. Chesnokov, Kh. L. Strelets, E. F. Klyuchnikova, and V. N. Vere
tinskii, Tr. Vses. Nauchno.-Issled. Proekten. Inst. Alyum. Magnievoi. Elektrodnoi. Promsti. 72, 90 (1970).
79y. N. Derkacheva and E. Ya. Khardikova, Zh. Prlkl. Khim. 48, 1159 (1975).
80See Ref. 43, Fig. 3083. IIIC. N. R. Rao and M. Natarajan, Crystal Structure Transformations in
Binary Halides, NSRDS-NBS 41 (U.S. Dept. of Commerce, Washington, DC, 1972).
82T. M. Tsushba, B., S. Sherchenko, and I. K. Tovmas'yan, Zh. Noorg. Khim.21, 1894 (1976).
83 A. Smits, J. Elgersma, and M. E. Hardenberg, Rec. Trav. Chim. Pays-Bas 43, 671 (1924).
84L. S. Hersh and O. J. Kleppa, J. Chem. Phys. 42, 1309 (1965). 85T. W. Richards and W. B. Meldrum, J. Am. Chem. Soc. 39,1816 (1917). 86H. Keitel, Neues Jahrb. Mineral. Gool. Palaeontol. Abh. Abt. 52A, 378
(1925). 87E. Elchardus and P. Laffitte, Bull. Soc. CWm. France 51, 1572 (1932). 881. G. Murgulescu and S. Sternberg, Z. Phys. Chern. (Leipzig) 219, 114
( 1962). 8~. K. Behl, AD Report No. 752087, National Technical Information
Service, Springfield, 1972. ~. U. Thulin,O. Waernes, andT. Ostvold,ActaChem. Scand.Ser. A 30,
731 (1976). 91B. F. Markov, T. A. Fishura, andA. N. Budarina, Rev. Roum. Chim. 20,
597 (1975). 921. I. Il'yasov, K. I. Iskandarov, and Yu. G. Litvinov, Russ. J. Inorg.
Chem. 21, 473 (1976). 93H._C. Gaebell, G. Meyer, and R. Hoppe, Mater. Res. Bull. 18, 429
(1983). 94T. P. Bortnikova and E. K. Akopov, Zh. NeQrg. Khim. 21, 3158 ( 1976). 95E. Korreng, Z. Anorg. Chem. 91, 194 (1915). 96E. P. Dergunov, Zh. Fiz. Khirn. 25,584 (1951). 971. I. ll'yasov, K. I. Iskandarov, M. Davranov, and R. N. Berdieva, Zh.
Noorg. Khim. 20, 250 (1975). 98G. A. Bukhalova and D. V. Sementsova, Zh. Neorg. Khim.10, 1886
( 1965). 99D. S. Lesnykh and S. A. Chernyakhovskaya, Zh. Neorg. Khim. 12, 3178
(1967). to°G. A. Bukhalova and V. M. Burlakova, Zh. Neorg. Khim. 11, 2812
(1966). 101Zh. G~ Moiseenko, E.'K. Akopov, and L. A. Panieva, Zh. Neorg. Khim.
17,3098 (1972). 1021.1. Il'yasov, Yu. G. Litvinov, and M. K. Kydynov, Zh. Neorg. Khim.
21, 1578 (1976). 103H._C. Gaebell, G. Meyer, and R. Hoppe, Z. Anorg. Alig. Chem. 498, 94
(1983). 104B. P. Burylev and V. L. Mironov, lzv. Ser.-Kavk. Nauchn. Tsentra
Vyssh. Shk., Ser. Estestv Nauk 4,61 (1976). 105B. P. Burylev, Izv. Sev.-Kavk. Nauchn. Tsentra Vyssh. Shk., Ser. Estestv
Nauk 3,67 (1982). 106H. Le Chatelier, Compt. Rend. Hebd. Acad. Sci. 118, 350 (1894). 107H. Gensky, Neues Jahrb. Mineral., Gool. Palaeontol. Abh. Abt. A 36, 513
(1913). I08K. Treis, Neues Jahrb. Mineral. Oeo!. PalaeontoI. Beil. Abh. Abt. A 37,
766 (1914). 109F. Landsberry and R. A. Page, J. Soc. Chem. Ind. 39, 37 (1920). lIOG. A. Abramov, Metallurgia. 10,82 (1935). lltA. G. Bergman and I. N. Nikonova, Zh. Obshch. Khim.12, 460 (1942). 112N. I. Myaz', Nauchn. Rab. Stud. L'vov Gosud. Univ. 2, 25 (1949). 113E. Scheil and H. Stadelmaier, Z. Metallkd. 43, 227 (1952). 114E. K. Akopovand A. G. Bergman, Zh. Obshch. Khim. 24, 1524 (1954). 115G. A. Bukhalova and A. G. Bergman, Zh. Prikl. Khim. 28,1266 (1955). 116A. G. Bergman and V. V. Rubleva, J. Gen. Chem. USSR 26, 747 (1956). 117D. S. Coleman and P. D. A. Lacy, Mater. Res. Bull. 2, 935 (1967). 118 A. D. Pelton, A. Gabriel, and J. Sangster, J. Chem. Soc. Faraday Trans.
1,81, 1167 (1985). 119M. V. Kamenetskii, Tsvetn. Metall. 31, 39 (1958). 120R. Nacken. Slt7.11n~bt-r. Preuss. Akad. Willll., Phys. Math. Kl. 1, 192
(1918).
121A. J. H. Bunk and G. W. Tichelaar, Konikl. Ned. Akad. Wet. Proc., Ser. B 56, 378 (1953).
122W. T. Barrett and W. E. Wallace, J. Am. Chern. Soc. 76, 366 (1954). 123Nguyen-Ba-Chanh, J. Chim. Phys. 61, 1428 (1964). 124yu. I. Vesnin andS. P. Zakovryashin, Solid State Commun. 31, 635
(1979). 12SG. Graeffe and M. Nurmia, Z. Naturforsch. A 21, 165 (1966). 126M. W.Lister and N. F. Meyers, J. Phys. Chem. 62, 145 (1958). 127R. G. Wolfson and W. Kobes, Mater. Res. Bull. 2, 263 (1967). 128A. Benrath ~dJ. Wainotf, Z. Phys. Chem. 77, 257 (1911). 129J. J. Egan and J. Bracker, U.S. Atomic Energy Commission Report
BNL 6589 (1962).
130C. Krohn and Z. Moser, KGL Norske Videsnk. Selsk. Skr. No.9 (1967). 131J. Guion, M. Blander, D. Hengstenberg; and K. Hagemark, J. Phys.
Chem. 72, 2086 (1968). l32V. I. Glazov, Khim. Tekhno!' Oksid. Magrit. Matetialov., No.3, 130
(1977). 133N. L. Yarym-Agaevand G. V. Mel'nik, Zh. Fiz. Kbim. 39, 2650 (1965). 134N. L. Yarum-Agaev and L. D. Afanasenko, Russ. J. Phys. Chem. 48, 666
(1974). U;JE. Kordes and F. Raaz, Z. Anorg. Chem. 181, 225 (1929).
, 13iiA. D. Pelton and S. N. Flengas, Can. J. Chem. 48,3483 (1970). 137p. S. Shapkin, P. V. Vasil'kova, and M. P. Susarev, Russ. J. Inorg. Chem.
12, 1493 (1967). 138J. M. Short and R. Roy, J. Am. O:l·am. Soc. 47,149 (1964). 139 A. Tsubuki, S. Maezawa, K. Niki, and T. Tomonari, High Temp. Sci. 5,
68 (1973). J401. I. I1'yasov and A. G. Bergman, Zh. Neorg. Khim. 7, 695 (1962).
J. Phys. Chem. Ref. Data, Vol. 16, No.3, 1987
560 J. SANGSTER AND A. D. PELTON
141N. M. Ryutkina, N. Y. Maksina, and N. A. Finkel'shtein, Zh. Neorg. Khim.18, 1101 (1973).
142E. K. Akopov and T. P. Bortnikova, Zh. Neorg. Khirn.18, 498 (1973). 143J. D. Weyand, Diss. Abstr. Int. B 32,7014 (1972). 144H. T. Fullarn, Mater. Res. Bull. 7, 289 (1972). 145G. Tamman and W. Krings, Z. Anorg. Chem.l30, 229 (1923). 1460. S. Dombrovskaya, Zh. Obshch. Khim. 3,1022 (1933). 141See Ref. 43, Fig. 3051. 148R. J. Havighurst, E. Mack, and F. C. Blake, J. Am. Chern. Soc. 47, 29
(1925). . 149E. B. Thornas and L. J. Wood, J. Am. Chern. Soc. 57, 822 (1935). 15~. Ahtee, Ann. Acad. Sci. Fenn. Ser. A6, No. 312 (1969). 1510. S. Dombrovskaya, Zh. Obshch. Khim. 3, 1017 (1933). 1521. Y. Yasil'kova, A. I. Efimov, L. Y. Ryazantseva, and A. Y. Storonkin,
Russ. J. Phys. Chern. 51, 480 (1977). 1531. I. Il'yasov and A. G. Bergman, Russ. J. Inorg. Chem. 7, 355 (1962). 154E. K. Akopov, L. A. Yashchenko, and L. A. Panieva, Zh. Neorg. Khim.
24,2774 (1979). 155See Ref. 43, Fig. 3024. 156K. J. Rao, G. Y. S. Rao, and C. N. R. Rao, Trans. Faraday Soc. 63, 1013
(1967)_
151 A. Tsubuki, S. Maezawa, K. Niki, and T. Tomonari, High Temp. Sci. 5, 68 (1973).
158S. S. Batsanov, Y. P. Bokarev, and I. Kh. Moroz, Russ. J. Inorg. Chern. 26, 1557 (1981).
1591. Arends and H. Nijboer, Phys. Status Solidi 26,537 (1968). 160A. K. Shukla, J. C. Ahluwalia, and C. N. R. Rao, J. Chern. Soc. Faraday
Trans. 1,72, 1288 (1976). 161H. Weijma and 1. Arends, Phys. Status Solidi 35,205 (1969). 1bZL. J. Wood, C. Sweeney, and M. T. Derbes, J. Arn. Chem. Soc. 81, 6148
( 1959). 163L. J. Wood,G. J. Riconalla, and J. D. Laposa, J. Phys.Chern. 65, 377
(1961). 164 JANAF Thermochemical Tables, 2nd ed. (U.S. GPO, Washington, DC
1971), NSRDS.:;NBS 37. 165B. L. Seleznev and Yu. G. Ylasov, Russ. J. Phys. Chem. 50, 971 (1976). 166H. Koski, Suorn. Kemistil. B43, 482 (1970). 161H. Koski, Ann. Acad. Sci. Fenn. Ser. A6, No. 314 (1969). 168L. L. Makarov and Yu. G. Ylasov, Dokl. Akad. Nauk SSSR 120, 111
(1958). 169S. M. Arkhipov, N. I. Kashina, and Y. A. Kuzina, Zh. Neorg. Khim. 15,
1640 (1970). 110G. Kellner, Z. Anorg. Allg. Chem. 99,137 (1917). 111 A. I. Agaev, Uch. Zap. Azerb. Gos. Univ. Ser. Fiz. Mat. Khirn. Nauk,
No.2, .61 (1961). 112N. ·N. Yolkov and M. N. Zakhvalinskii, Izv. Fiz.-Khirn. Nauchno.
Issled. Inst. Irkutsk. Go. Univ. 2, 69 (1953). my. Y. Bugaenko, R. V. Chernov, and Yu. P. Krasan, Ukr. Khim. Zh.
Russ. Ed. 43, 1215 (1977). 11~. M. Tsushba. B. S. Shevchenko. and I. K. Tovmas'yan. Zh. Neorg.
Kh4n.21, 1894 (1976). l7S0. Tamman and A. Ruppelt, Z. Anorg. AUg. Chern. 197, 65 (1931). 116D. Doornhof, H. J. Van Wijk, and H. A. J. Oonk, Thermochim. Acta 76,
171 (1984). 177p. D. Oam, Bell Lab. Ree. 33, 452 (1955). l78C. Margheritis, O. Flor, and C. Sinistri, Z. Naturforseh A 34, 836
(1979). . 179N. A. Reshetnikovand G. M. Unshakov, Izv. Fiz.-Khim. Nauchno.
Issled. Inst. Irkutsk. Gos. Univ. 2, 23 (1953). 18~. N. Yolkov and L. A. Dubinskaya, Izv. Fiz. Khim. Nauchno.-Issled.
Inst. Irkutsk. Gos. Univ. 2, 45 (1953). 181G. G. Diogenov, N. N. Nurminskii, and E. A. Anisimova, Trudy Ir
kutsk. Politekh. Inst. 69, 119 (1971). 182 A. S. Arabadzhan and A. G. Bergman, Zh. Neorg. Khim. 8, 365 (1963). 1831. I. Il'yasov,. K. I. Iskandarov, and A. G. Palobekov, Izv. Yyssh.
Uchebn. Zaved. Khim. Khim. Tekhnol.17, 611 (1974). 184G. Flor, C. Margheritis, and C. Sinistri, J. Chem. Eng. Data 24, 361
(1979). 1850. G. Diogenovand Y. I. Ennachkov, Zh. Neorg. Khim.12, 827 (1967). 1861. I. Il'yasov, M. Davranov, and I. I. Grudyanov, Zh. Neorg. Khim. 20,
232 (1975). 181y. E. Plyushehev and R. G. Samuseva, Russ. 1. Inorg. Chem. 9, 1177
(1964). 188D. S. LesnykhandE. P. Garmatina, Zh. Neorg. Khim.12, 1307 (1967). 189A. Bellanca, Period. Mineral. 10,9(1939).
J. Phys. Chem. Ref. Data, Vol. 16, No.3, 1987
I90G. M. Unzhakov, Izv. Fiz.-Khim. Nauchno.-Issled. Inst. Irkutsk. Gos. Univ.2, 10 (1953).
1911. I. Il'yasov, Y. N. Mirsoyapov, and Yu. Y. Korotkov, Zh. Neorg. Khirn. 4,909 (1959).
1921. I. Il'yasov, Russ. J. Inorg. Chern. 7,86 (1962). 1931. G. Murgulescu and D. I. Marchldan, Rev. Rourn. Chirn, 9, 793
(1964). 194Nguyen-Ba-Chanh, J. Chim. Phys. 61,1428 (1964). 195y. Sabet and T. Ostvold, Acta Chem. Scand. 27, 396 (1973). 196R. O. Sarnuseva and Y. E. Plyushchev, Russ. J. Inorg. Chem. 9, 1315
(1964). 1911. I. Il'yasovand Y. Y. Yolchankaya,Zh. Neorg. Khim. 27, 3211 (1982). 1981. K. Tovmas'yan, T. M. Tsushba, and Y. P. Radina, Russ. J. Inorg.
Chem .. 15, 13 11 (1970). 199R. G. Samuseva and Y. E. Plyushchev, Russ. J. Inorg. Chern. 6, 1096
(1961). 2001. I. Il'yasov, Ukr. Khim. Zh. Russ. Ed. 31, 930 (1965). 2011. I. Il'yasov, Zh. Neorg. Khim.10, 2324 (1965). 202y. A. lsaenko, Zh. Neorg. Khim. 22, 1674 (1977). 203y. P. Bokarev and A. Y. Parshukov, Russ. J. Inorg. Chern. 27, 1650
(19&2).
2040. G. Diogenov and Y. I. Ermaehkov, Zh. Neorg. Khim.12, 573 (1967). 205M. Davranov, I. I. Il'yasov, and M. Ashurova, Zh. Neorg. Khim. 19,
1628 (1974). 206G. S. Durham. L. Alexander, D: Pitman, H_ Golub, and H. Klug, J.
Phys. Chern. 59, 561 (1955). 2011. I. Il'yasov and A. G. Bergman, Russ. J. Inorg. Chern. 9, 768 (1964). 2081. K. Tovmas'yan, T. M. Tsushba; and A. G. Bergman, Russ. J. Inorg.
Chern. 15, 1172 (1970). Z09K.1. Iskandarov, Yu. G. Litvinov, and I. I. Il'yasov, Zh. Neorg. Khim.
21, 1990 (1976). 21OA. G. Dudareva, A. K. Molodkin, Yu. E. Bogatov, Y. Y. Kurilkin, P. I.
Fedorov, and A. I. Ezhov, Zh. Neorg. Khim. 21,1905 (1976). 211S. D. Dionisev and L. A. Ryazantseva, Russ. 1. Inorg. Chem. 27, 1066
(1982). 212yU. G. Vlasov, B. L. Seleznov, and Y. Y. Kolodnikov, Zh. Fiz. Khim. 47,
2170 (1973). 213H. Ohno and K. Furukawa, J. Nuel. Mater. 64, 37 (1977). 214M. E. Melnichak and O. J. Kleppa, J. Chem. Phys. 52,1790 (1970). 215D. B. Leiser and O. J. Whittemore, J. Am. Ceram. Soc. SO, 60 (1967). 216C. H. Liu and L. R. Lieto, J. Chern. Eng. Data 14,83 (1969). 211R. Sridhar, C. E. Johnson, and E. 1. Cairns, J. Chem. Eng. Data 15, 244
(1970). 218H. C. Gaebell and G. Meyer, Mater. Res. Bull. 18, 1353 (1983). 219 A. G. Bergman and F. P. Platonov, Izv. Sekt. Fiz.-Khim. Anal. Inst.
Obshch. Neorg. Khim. Akad. Nauk SSSR 11, 253 (1937). 22Op. P. Platonov, Tr. Mosk. Skh. Akad. 36, 42 (1946). 2211. I. Il'yasov, O. G. Shchemeleva, and A. G. Bergman, Russ. J. Inorg.
Chem. 6, 355 (1961). 222 A. Oobaoz and S. Zuca. Rev. Roum. Chim. 11, 183 (1966)_ 223L. S. Hersh and O. J. Kleppa, Trans. Faraday Soc. 59, 1850 (1963). 2241. I. Il'yasov, Russ. J. Inorg. Chem. 11, 115 (1966). 2251. I. Il'yasovand A. O. Bergman, Zh. Neorg. Khim. 11, 681 (1966). 226R. O. Samuseva and Y. E. Plyushehev, Russ. J. Inorg. Chern. 9, 1313
(1964). 2271. I. Iryasov, M. Davranov, and K. I. Iskandarov, Russ. 1. Inorg. Chern.
21, 759 (1976). 228L. L. Makarov and D. Yu. Stupin, Russ. J. Phys. Chern. 35, 363 (1961). 2Z~. A. C. McKay and J. K. Perring, Trans. Faraday Soc. 49, 163 (1953). 2301. I. Il'yasov and A. G. Bergman, Zh. Neorg. Khim.10, 681 (l965). 2311. I. Il'yasov, N. I. Chaurski, and D. G. Barsegov, Zh. Neorg. Khim. 11,
1984 (1966). 2321. I. Il'yasov, M. Davranov, and K. I. Iskandarov, Zh. Neorg. Khim. 19,
1919 (1974). 233L. L Makarov and A. G. Pankov, Russ. J. Phys. Chern. 36, 1209 (1962). 234A. A. Bochvar, Z. Anorg. Allg. Chem. 210,163 (1933). 235 A. G. Bergman and E. I. Banashek, Izv. Sekt. Fiz.-Khim. Anal. Inst.
Obshch. Neorg. Khim. Akad. Nauk SSSR 23, 201 (1953). 236H. M. Haendler, P. S. Sennett, and C. M. Wheeler, J. Electrochem. Soc.
106,264 (1959). 231C. E. Johnson and E. J. Hathaway, J. Electrochern. Soc. 118, 631 (1971). 238G. A. Bukhalova and A. G. Bergman. Dokl. Akad. Nauk SSSR 66, 67
( 1949). 239 A. G. Bergman, E. L. Kozaehenko, and S. I. Berezina, Zh. Neorg. Khim.
9,663 (1964).
PHASE DIAGRAMS AND THERMODYNAMICS OF BINARY ALKALI HALIDES 561
240A. O. Bergman and A. S. Arabadzhan, Zh. Neorg. Khim. 8, 1228 (1963).
241S.1. Berezina, A. G. Bergman, and E. L. Bakumskaya, Russ. J. Inorg. Chem.8, 1118 (1963).
242N. N. Volkov and M. N. Zakhvalinskii, Izv. Fiz.-Khim. Nauchno.Issled. Inst. Irkutsk. Gos. Univ. 2, 45 (1953).
243 A. G. Bergman and A. S. Arabadzhan, Zh. Neorg. Khim. 8, 1228 (1963).
2440. J. Kleppa, L. S. Hersh, andJ. M. Toguri, Acta Chem. Scand.17, 2681 (1963).
245M. E. Melnichak and O. J. Kleppa, J. Chem. Phys. 57, 5231 (1972). 246C. R John!'>on and E. J. Hathaway. J. Chem. Eng. Data 14. 174 ( 1969). 247E. J. Cairns, C. E. Crouthamel, A. K. Fisher, M. S. Foster, J. C. Hesson,
C. E. Johnson, H. Shimotoke, and A. D. Teve1bauch, Argonne Natl. Lab. Report No. ANL-7316, 219 (1967).
248G. Flor, C. Margheritis, and C. Sinistri, J. Chem. Eng. Data 26, 152 (1981).
24~. Plato, Z. Phys. Chem. 58, 350 (1907). 250 A. Wolters, Neues Jahrb. Mineral. Geol. Palaeontol. Abh. Abt. A 30, 55
(1910). mG. A. Bukhalova, Izv. Sek. l<"iz.-Khim. Anal. Inst. Obshch. Neorg.
Khim. Akad. Nauk SSSR 26, 138 (1955). 2S2K. Grjotheim, T. Halvorsen, and J. L. Holm, Acta Chem. Scand. 21,
2300 (1967). 253G. A. Bukhalova, Zh. Neorg. Khim. 4, 117 (1959). 254N. N. Volkov and A. G. Bergman, C. R. Acad. Sci. URSS 27, 967
(1940). 255M. A. Kuvakin and P. S. Kusakin, Zh. Neorg. Khim. 4, 2577 (1959). 256R. F. Retl, 1. Am. Ceram. Soc. 21, 98 (1938). 257V. N. Storozhenko, S. F. Vazhenin, and L. N. Antipin, Zh. Fiz. Khim.
39,524 (1965). 258M. Ishaque, Bull. Soc. Chirn. France 127 (1952). 2590. Ruffand W. Plato, Berichte36, 2357 (1903). 2WV. D. Polyakov, lzv. Sekt. Fiz.~Khim. Anal.lnst. Obshch. Neorg. Khim.
Acad. Nauk SSSR 13, 299 (1940). . 261N. N. Volkov and M. N. Zakhvalinskii, Izv. Fiz.-Khim. Nauchno.
Issled. Inst. Irkutsk. Oos. Univ. 2, 69 (1953). 262N. S. Dombrovskaya, Izv. Sekt. Fiz.-Khim. Anal. Inst. Obshch. Neorg.
Khim. Acad. Nauk SSSR 20, 124 (1950). 263M. Amadori, Atti R. Accad. Naz. Lincei Mem. Cl. Sci. Fis. Mat. Nat. II
21,467 (1912). 264S. P. Gromakovand L. M. Grornakova, Zh. Fiz. Khirn. 29, 746 (1955). 265E. Schobert, Neues Jahrb. Mineral. Geol. Palaeont. Abh. Abt. 2, 186
(1913). 266]'. Ostvold, Acta Chem. Scand. 25, 2302 (1971). 267M. A. Fineman and W. E. Wallace, 1. Am. Chem. Soc. 70,4165 (1948). 268S. Sternberg and C. Herdlicka, Rev. Roum. Chim. 11,29 (1966). 269S. Sternberg and C. Herdlicka, Rev. Roum. Chirn.12, 771 (1967). 27~. Ostvold, Acta Chem. Scand. 22, 435 (1968). 271T. Ostvold, in Molten Salts, NSRDS-NBS 28 (National Bureau of Stan-
dards, Washington, DC, 1969), Vol. 2, Sec. 1. 272See Ref. 263, p. 471. 2731. I. II'yasov and A. G. Bergman, J. Oen. Chem. USSR 26, 1457 (1956). 274D. I. Marchidan and C. Telea, Rev. Roum. Chim. 13,291 (1968). 275A. P. Obukhov, Zh. Obshch. Khim. 3, 787 (1933). 276g. Okada, S. Voshizawa, and N. Watanabe, J. Chem. Soc. Jpn. 56, 79
(1953). 2771. E. Krauze and A. O. Bergman, C. R. Acad. URSS 35,20 (1942). 278N. S. Kumakov and J. B. Wrzesnewsky, Z. Anorg. Chern. 74, 89 (1912). 279J. B. Wrzesnewsky, Z. Anorg. Chem. 74, 95 (1912). 28~. Amadori and O. Pampanini, Atti R. Accad. Naz. Lincei Mem. Cl.
Sci. Fis. Mat. Nat. II, 20, 572 (1911). 281H. L. Link and L. J. Wood, J. Am. Chem. Soc. 62, 766 (1940). 282N. Fontell, Soc. Sci. Fenn. Comment. Physico-Math. X(6), 1 (1939). 283M. Miller and K. Skudlarski, Ber. Bunsenges. Phys. Chern. 89, 916
(1985). ?
R4A. Mu:stajoki, Allll. Acad. Sl;i. FCIIII. Sc:r. A198, 7 (19S1). 285V. Hovi, Ann. Acad. Sci. Fenn. A155, 1 (1948). 286M. M. Popoff and S. F. Jaworoskaja, Z. Phys. Chem.167A, 180 (1933). 287M. M. Popoff, Z. Phys. Chem.147A, 302 (1930). 288M. S. Ivankina, Izv. Tornsk. Politekh. lust. 95, 192 (1958).
289N. Fontell, V. Hovi, and H. Mikkola, Ann. Acad. Sci. Fenn. Al 54, 1 (1949).
290W. H. McCoy and W. E. Wallace, 1. Am. Chern. Soc. 78,5995 (1956). 291H. Brodowsky and W. Kock, Ber. Bunsenges. Phys. Chem. 79, 985
( 1975). 292See Ref. 263, p. 606. 293E. M. Chernotordik, Zh. Obshch. Khim. 4, 459 (1934). 294p. Luova and M. Muurinen, Ann. Univ. Turku. Ser. AI, 110 (1967). 295E. T. Teatum and N. O. Smith, J. Phys. Chem. 61, 697 (1957). 296p. Luova and O. Tannila, Suom. Kemistil. B 39,220 (1966). 297L. L. Makarov and K. K. Evstrop'ev, Russ~ J. Phys. Chem. 34, 934
(1960). 2980. Bruni and M. Amadori, Atti R. Inst. Veneto Sci. Lett. Arti Cl. Sci.
Mat. Nat. II 71 (1911112). 299M. Kantola, P. Luova, and L. Vinko, Ann. Acad. Sci. Fenn. Ser. A 6,
(1964). 300p. Luova, Suorn. Kemistil. B 38,32 (1965). 301M. Amadori and O. Pampanini, Atti R. Accad. Naz. Lincei, Mem. Cl.
Sci. Fis., Mat. Nat. II 20, 478 (1911). 302E. I. Banashek, Izv. Sek. Fiz.-Khim. Anal. Inst. Obshch. Neorg. Khim.
Akad. Nauk SSSR 20, 109 (1950). 3031. K. Tovmas'yan, T. M. Tsushba, and A. O. Bergman, Soviet Prog.
Chern. 36, 27 (1970). 3041. I. It'yasov and V. V. Volchanskaya, Soviet Prog. Chem. 40,56 (1974). 305V. A. Isaenko, N. A. Volchenkova, andA. N. Kirgintsev, Russ. J. Inorg.
Chern. 21, 1577 (1976). 306V. Hovi, Suom. Kemistil. B 28, 127 (1955). 307V. Hovi, Suom. Kemistil. B 27,33 (1954). 3081. G. Murgulescu and D. I. Marchidan, Rev. Roum. Chim. 11, 1031
(1966). 3091. K. Tovmas'yan and V. I. Sholokhova, Soviet Prog. Chem. 39, 55
(1973). 3101. I. It'yasov and Yu. O. Litvinov, Soviet. Prog. Chem. 40, 28 (1974). 3llV. 1. Sh010khova, Dokl. Mezhvus. Nauch.-Teor. Konf. Aspir. Rostov
na-Donu Pedagog. Inst. 430 (1971). 3121.1. II'yasov, K. I. Iskandarov, M. Kidynov, R. N. Berdieva, and M.
Davranov, Ukr. Khim. Zh. Russ. Ed. 41, 490 (1975). 313M. Ahtee and H. Koski, Ann. Acad. Sci. Fenn. Ser. A6, No. 297 (1968). 314H. Koski, Thermochim. Acta 5, 360 (1973). mV. P. Belousov, Y. O. Vlasov, and B. L. Seleznev, Izv. Vyssh. Uchebn.
Zaved. Khim. Khim. Tekhnol. 20, 76 (1977). 316G. A. Bukhalova, G. A. Shegurova, T. M. Khliyan, and E. S. Yagub'yan,
Russ. J. Inorg. Chem. 18,583 (1973). 3171. I. II'yasov, Russ. J. Inorg. Chern. 9, 766 (1964). 318M. Natarajan, K. J. Rao, and C.N.R. Rao, Trans. Faraday Soc. 66, 2497
(1970). 319V. Hovi, Ann. Univ. Turku, Ser. A I 26 (1957). 320 A. V. Storonkin, M. M. Shul'ts, and W. Korchagin, Fiz.-Khim. Svoistva
Rastvorov, Leningr. Oos. Univ. 227 (1964). 32l0. A. Bukhalova, O. A. Shegurova, and E. S. Yagub'yan, Russ. J. Inorg.
Chem. 18,1370 (1973). 322y. O. Vlasov, B. L. Seleznev, and E. A. Elchln, Zh. Neorg. Khim. 17,
3069 (1972). 323C. W. Bale and A. D. Pelton, Metall. Trans. 5,2323 (1974). 324H. Reiss, J. L. Katz, and O. J. Kleppa, J. Chem. Phys. 36,144 (1962). 32SC. E. Kaylor, G. E. Walden, and D. F. Smith, J. Am. Chern. Soc. 81, 4172
(1957). 326J. Richter and W. Vreuls, Ber. Bunsenges. Phys. Chern. 83,1023 (1979). 327J. Richter, W. Vreuls, and W. Winthagen, Ber. Bunsenges. Phys. Chem.
84,231 (1980). 328J. Bousquet, O. Perachon, and J.-C. Remy, Bull. Soc. Chim. Fr.t, 238
(1967). 329Handbook of Chemistry and Physics, 65th ed., edited by R. C. Weast
(CRC Press, Boca Raton, FL, 1984).
330L. J. Wood, W. Secunda, and C. H. McBride, J. Am. Chem. Soc. 80, 307 (1958).
:mO. KapOSi, L. Bencze, and L. V. Zhuravleva, J. Chern. Thermodyn. 18, 635 (1986).
332M. M. Reventos, N. B. Chanh, and 1. M. Amigo, Acta Geol. Hisp. 19, 223 (1984).
J. Phys. Chern. Ref. Data, Vol. 16, No.3, 1987