A Thesis entitled Ultrasound-mediated Topical Delivery of ...
Upload
khangminh22Category
view
0download
0
SANDIA REPORT SAND2016-8929Printed September 2016
ORIGINALLY SUBMITTED FOR DOE REVIEW, April 2016
Frontier Observatory for Research in Geothermal Energy: Phase 1 Topical Report Fallon, NV
Douglas Blankenship, Sandia National Laboratories, Albuquerque, New Mexico 87185
John Akerley1, Kelly Blake2, Wendy Calvin3, James E. Faulds4, Jonathan Glen5, Stephen Hickman5, Nick Hinz4, Ole Kaven5, Mike Lazaro2, David Meade2, Mack Kennedy6, Geoff Phelps5, Andrew Sabin2, Martin Schoenball5, Drew Silar6, Ann Robertson-Tait7, Colin Williams5
1Ormat Nevada Inc2U.S. Navy Geothermal Program Office, China Lake, 93555 3Department of Geological Sciences and Engineering, University of Nevada, Reno 89557 4Nevada Bureau of Mines and Geology, University of Nevada, Reno, Nevada 89557 5U.S. Geological Survey, Menlo Park, California 6Lawrence Berkeley National Laboratory, Berkeley, California 7GeothermEx/Schlumberger
Prepared by Sandia National Laboratories Albuquerque, New Mexico 87185
Sandia National Laboratories is a multi-mission laboratory managed and operated bySandia Corporation, a wholly owned subsidiary of Lockheed Martin Corporation, for the U.S. Department of Energy's National Nuclear Security Administration under contract DE-AC04-94AL85000.

2
Issued by Sandia National Laboratories, operated for the United States Department of Energy by
Sandia Corporation.
NOTICE: This report was prepared as an account of work sponsored by an agency of the United
States Government. Neither the United States Government, nor any agency thereof, nor any of their
employees, nor any of their contractors, subcontractors, or their employees, make any warranty,
express or implied, or assume any legal liability or responsibility for the accuracy, completeness, or
usefulness of any information, apparatus, product, or process disclosed, or represent that its use
would not infringe privately owned rights. Reference herein to any specific commercial product,
process, or service by trade name, trademark, manufacturer, or otherwise, does not necessarily
constitute or imply its endorsement, recommendation, or favoring by the United States Government,
any agency thereof, or any of their contractors or subcontractors. The views and opinions expressed
herein do not necessarily state or reflect those of the United States Government, any agency thereof,
or any of their contractors.

3
SAND2016-8929
Printed September 2016
FOR DOE REVIEW Frontier Observatory for Research
in Geothermal Energy: Phase 1 Topical Report
Fallon, NV
Douglas Blankenship, Sandia National Laboratories, Albuquerque, New Mexico 87185
John Akerley1, Kelly Blake2, Wendy Calvin3, James E. Faulds4, Jonathan Glen5, Stephen Hickman5, Nick
Hinz4, Ole Kaven5, Mike Lazaro2, David Meade2, Mack Kennedy6, Geoff Phelps5, Andrew Sabin2, Martin
Schoenball5, Drew Silar6, Ann Robertson-Tait7, Colin Williams5
1Ormat Nevada Inc2U.S. Navy Geothermal Program Office, China Lake, 93555
3Department of Geological Sciences and Engineering, University of Nevada, Reno 89557 4Nevada Bureau of Mines and Geology, University of Nevada, Reno, Nevada 89557
5U.S. Geological Survey, Menlo Park, California 6Lawrence Berkeley National Laboratory, Berkeley, California
7GeothermEx/Schlumberger
Sandia National Laboratories
P. O. Box 5800
Albuquerque, New Mexico 87185-MS1033
Further dissemination authorized to the Department of Energy and DOE contractors only; other requests shall be approved by the originating facility or higher DOE programmatic authority.

6
Page Intentionally Blank

5
TABLE OF CONTENTS
1. Overview of Phase 1 Activities ............................................................................................7
2. Results ..................................................................................................................................9 2.1. Geologic Model .......................................................................................................9 2.2. NEPA .....................................................................................................................11 2.3. Plan Development ..................................................................................................12
3. Lessons Learned.................................................................................................................15
4. Conclusion .........................................................................................................................17
Appendix A. Conceptual Geologic Model ............................................................................... 1-A
Appendix B. Update on Characterization Data Uploaded to the GDR Data Archive...............1-B
Appendix C. Environmental Information Synopsis ..................................................................1-C
Appendix D. Updated Site Characterization Data Inventory ................................................... 1-D
Appendix E. Updated Permitting Inventory.............................................................................. 1-E
Appendix F. Data Dissemination and Intellectual Property Plan ............................................. 1-F
Appendix G. Communications and Outreach Plan ................................................................... 1-G
Appendix H. Stakeholder Engagement Status Update ............................................................. 1-H
Appendix I. Sample and Core Curation Plan ............................................................................ 1-I
Appendix J. Preliminary Induced Seismicity Mitigation Plan .................................................. 1-J
Appendix K. Environmental Safety and Health Plan ............................................................... 1-K
Appendix L. Research and Development Implementation Plan ............................................... 1-L

6
Page Intentionally Blank
7
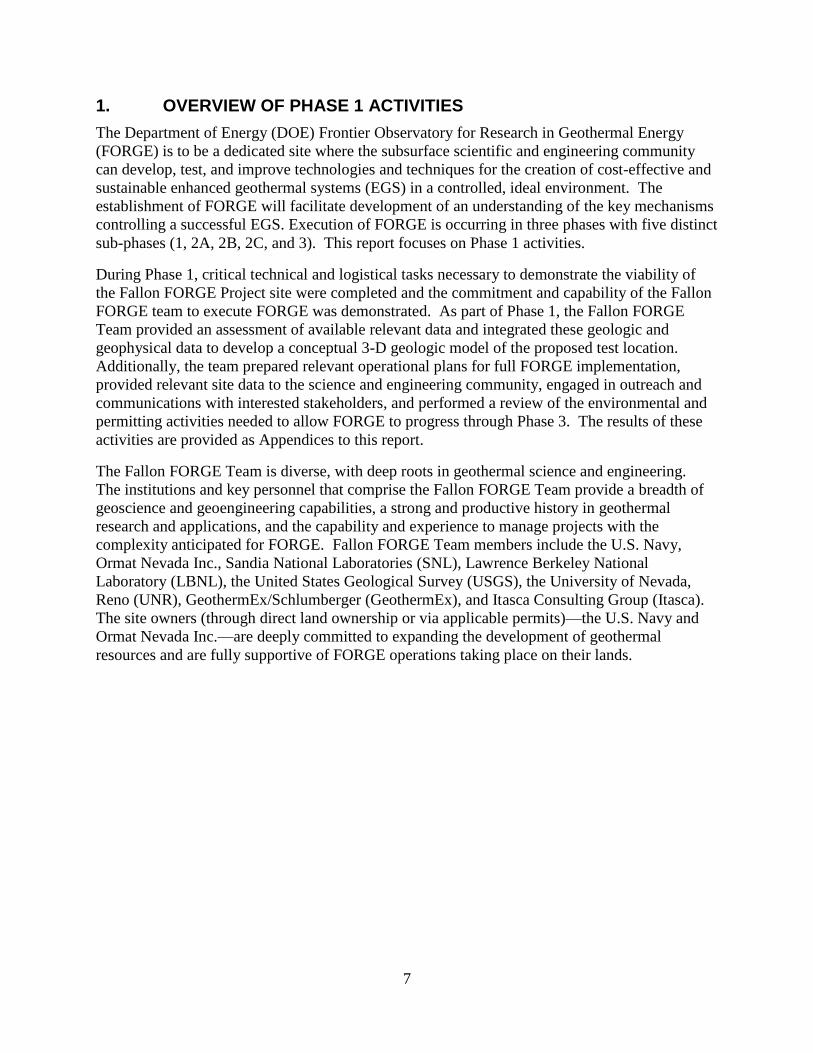
1. OVERVIEW OF PHASE 1 ACTIVITIES
The Department of Energy (DOE) Frontier Observatory for Research in Geothermal Energy
(FORGE) is to be a dedicated site where the subsurface scientific and engineering community
can develop, test, and improve technologies and techniques for the creation of cost-effective and
sustainable enhanced geothermal systems (EGS) in a controlled, ideal environment. The
establishment of FORGE will facilitate development of an understanding of the key mechanisms
controlling a successful EGS. Execution of FORGE is occurring in three phases with five distinct
sub-phases (1, 2A, 2B, 2C, and 3). This report focuses on Phase 1 activities.
During Phase 1, critical technical and logistical tasks necessary to demonstrate the viability of
the Fallon FORGE Project site were completed and the commitment and capability of the Fallon
FORGE team to execute FORGE was demonstrated. As part of Phase 1, the Fallon FORGE
Team provided an assessment of available relevant data and integrated these geologic and
geophysical data to develop a conceptual 3-D geologic model of the proposed test location.
Additionally, the team prepared relevant operational plans for full FORGE implementation,
provided relevant site data to the science and engineering community, engaged in outreach and
communications with interested stakeholders, and performed a review of the environmental and
permitting activities needed to allow FORGE to progress through Phase 3. The results of these
activities are provided as Appendices to this report.
The Fallon FORGE Team is diverse, with deep roots in geothermal science and engineering.
The institutions and key personnel that comprise the Fallon FORGE Team provide a breadth of
geoscience and geoengineering capabilities, a strong and productive history in geothermal
research and applications, and the capability and experience to manage projects with the
complexity anticipated for FORGE. Fallon FORGE Team members include the U.S. Navy,
Ormat Nevada Inc., Sandia National Laboratories (SNL), Lawrence Berkeley National
Laboratory (LBNL), the United States Geological Survey (USGS), the University of Nevada,
Reno (UNR), GeothermEx/Schlumberger (GeothermEx), and Itasca Consulting Group (Itasca).
The site owners (through direct land ownership or via applicable permits)—the U.S. Navy and
Ormat Nevada Inc.—are deeply committed to expanding the development of geothermal
resources and are fully supportive of FORGE operations taking place on their lands.

8
Page Intentionally Blank

9
2. RESULTS
2.1. Geologic Model
The proposed FORGE at Fallon, NV, covers ~4.5 km2 in the southeastern part of the Carson
Sink in west-central Nevada, ~12 km southeast of the City of Fallon. The Carson Sink is a large
late Miocene to recent composite basin within the Basin and Range geologic province. This site
was specifically selected for its extensional tectonic setting, abundance of available data, existing
infrastructure, and documented temperatures, permeability, and lithologic composition of target
test zones in crystalline basement beneath the basin. The site is located on two parcels that
include land owned by the Naval Air Station Fallon (NASF) and leased and owned by Ormat
Nevada, Inc. In addition, about 40 km2 of surrounding lands are open and available for
monitoring and instrumentation activities. Existing facilities at the Fallon FORGE site include
an excellent network of roads, abundant wells, available storage for equipment and supplies at
the NASF, and an established infrastructure for electrical and water resources, all of which will
facilitate significant research and development activities. The nearby communities of Fallon and
Reno also provide superior infrastructure and research facilities for this project. A total of 12
geothermal wells and 34 temperature gradient holes have been drilled for geothermal exploration
within the NASF and Ormat lease area. This includes 7 geothermal wells and 4 temperature
gradient holes on the FORGE site and 5 geothermal wells and 30 temperature gradient holes
within the NASF and Ormat monitoring areas.
Multiple preexisting data sets were reviewed to characterize the stratigraphic and structural
setting of the area and develop a 3D conceptual geologic model. Available geologic data sets
included detailed geologic maps, >14,000 m of cuttings and core, petrographic data, borehole
imaging of fractures, fault kinematic information, down-hole temperature logs, fluid
geochemistry, and well flow tests. In addition, available geophysical data sets included detailed
gravity, regional magnetic, magnetotelluric, seismologic, and ~270 km of seismic reflection
profiles. Data quality was generally good with relatively low uncertainty. Based on synthesis of
the above data sets, a 3D geologic model was developed for the Fallon FORGE site and
immediate surroundings, incorporating 100 km2 to a depth of 3.8 km. Details associated with the
model are provided in the Conceptual Geologic Model provided in Appendix A. The 3D model
depicts the major stratigraphic and structural relations, the 175 to 225°C thermal window for
FORGE, and location and volume of potential EGS reservoirs. In descending order, the main
stratigraphic units in the area include: (1) Late Miocene to Quaternary basin-fill sediments up to
1.5 km thick, (2) Miocene volcanic and lesser sedimentary rocks (0.7-1.1 km thick), and (3)
Mesozoic basement consisting of Triassic-Jurassic metavolcanic and metasedimentary rocks
intruded by Jurassic-Cretaceous granitic plutons. Four wells in the area penetrate the entire
Neogene section and terminate in Mesozoic basement. The seismic reflection profiles and
gravity models indicate that the site occupies a broad, gently west-tilted fault block or half
graben, which is cut by widely spaced (~0.4-3.5 km), northerly striking, primarily east-dipping
normal faults, all with less than ~200 m of relative displacement. Borehole imaging of drilling
induced fractures and fault kinematic data from nearby bedrock exposures indicate an
extensional stress regime and a WNW-trending extension direction. Quaternary faults have not
been observed within the proposed FORGE site.
The documented temperatures, permeability, lithologic composition of potential reservoirs, and
structural setting demonstrate that the Fallon FORGE site contains a sufficient volume of rock

10
that is within the criteria specified for FORGE, while also residing within a favorable stress
regime with no evidence of an active hydrothermal system. Requisite temperatures of 175 to
225°C are attained between required depths of 1.5 to 4 km, as evidenced by down-hole
temperature logs. Cuttings and core demonstrate that crystalline rocks abound in the Mesozoic
basement (e.g., granite, quartzite, and metavolcanic rocks) at these depths. Flow testing of wells,
a relatively simple Cenozoic structural setting, and high electrical resistivity values together
indicate low permeability within the basement rocks. Borehole imaging and modeling of the
stress regime further suggest that the basement contains abundant N- to NNE-striking preexisting
fractures, which approximately parallel SHmax and are therefore favorably oriented for
stimulation. High extensional strain rates in the area are also conducive to increasing
permeability through reactivation of shear fractures during hydraulic stimulation. Further,
multiple features indicate the absence of an active hydrothermal system, including lack of
permeability encountered in wells, lack of convective temperature profiles, lack of prominent
shallow thermal anomalies, lack of Quaternary faults, lack of a favorable structural setting for
geothermal activity, lack of surface hot springs or steam vents, and no indication of paleo-hot
spring activity, such as sinter or travertine. There are at least three possible, competent target
formations for stimulation, incorporating >3 km3 in the Mesozoic basement: (1) Triassic to
Jurassic felsic metavolcanic rocks, (2) Jurassic quartzite, and (3) Jurassic to Cretaceous granitic
intrusions.
In summary, while additional data will further refine the model, the Fallon site is an ideal
location for FORGE from both a regional and local perspective. On a local scale, key FORGE
criteria are met at Fallon, specifically requisite temperatures (175-225°C) between the required
depths (1.5-4 km) in competent crystalline lithologies with low permeability in a favorable stress
regime and no evidence of an active hydrothermal system. On a regional scale, Fallon is
experiencing relatively high strain rates, occupies part of an extensional basin (half graben)
characteristic of most of the Basin and Range province, and resides in an amagmatic setting,
which epitomizes the bulk of the existing geothermal systems and, more appropriately, potential
EGS development sites within the Great Basin region. We therefore conclude that Fallon is an
ideal location for a field laboratory dedicated to EGS research.

11
Figure 1. 3D model of potential EGS reservoirs in Mesozoic crystalline basement rock, including meta-rhyolite, quartzite, and granite in the central to eastern parts of the proposed FORGE site at Fallon. Several deep wells in this area provide lithologic, thermal, and permeability data for these volumes. These reservoirs lie between the 175oC and 225oC isotherms, as shown by the orange
and red planes projecting out of the model, respectively. Note the widely spaced faults and relatively coherent structural blocks between the faults lying at the requisite depths and
temperatures for development. The Mesozoic basement in this area is characterized by low permeabilities, as evidenced by well tests and high resistivity values.
2.2. NEPA
The proposed Fallon FORGE project area is approximately 1,115 acres (387 Ormat leased or
owned, 728 NASF) within and adjacent to the NAS Fallon (NASF) and Ormat lease areas. The
total acreage for monitoring is 9,856 acres (3,842 Ormat leased or owned plus 6,014 NASF,
exclusive of the main FORGE site and areas of no surface occupancy). Ormat has three BLM
leases (NVN-079104, NVN-079105, NVN-079106) that have been unitized under the Bunejug
Unit Agreement and two parcels of purchased private land.
Two NEPA documents serve as the primary foundation for permitting and additional
environmental and cultural work required at the Fallon FORGE site: the Salt Wells EIS (OEPC
Control Number FES 11-12) and the NAS Fallon Programmatic EIS.
The Salt Wells EIS (OEPC Control Number FES 11-12) was completed in 2011 (as was the
previous 2008 Environmental Assessment) to support geothermal development work at the Salt
Wells Known Geothermal Resources Area (KGRA) and focused on private and leased grounds
in the eastern Carson sink. It provides NEPA analysis for exploration and development of a
geothermal well field, power plant, and transmission line on private and leased properties. All of
the land outside the NAS Fallon fence-line and included in the Fallon FORGE site was covered
under this EIS. The Navy was a cooperating agent but not a signatory on this 2011 EIS.
The NAS Fallon Programmatic EIS served a similar purpose and includes all developable lands
inside the NAS Fallon fence line. In March, 1991 NAS Fallon (NASF) completed the
Programmatic EIS (PEIS) for Geothermal Energy Development, NASF. The purpose of the
PEIS was to support geothermal exploration and proposed development activities at NAS Fallon.
In 2005, a 50-year development contract (N62473-06-C-3021) was awarded by the Navy to

12
Ormat Nevada Inc. to develop and sell power from a geothermal plant to be constructed on NAS
Fallon. The NAS PEIS was the supporting environmental document allowing this agreement.
This contract was mutually dissolved in 2012 because Ormat determined through deep drilling
that the postulated hydrothermal resource in basement rocks beneath NAS Fallon did not exist.
Environmental analyses have been conducted by the BLM and Navy. The Exploration EA
completed in 2008 and Utilization EIS completed July 2011 (OEPC Control Number FES 11-12)
provide NEPA analysis for exploration and development of a geothermal well field, power plant,
and transmission line on private and BLM properties. The Navy’s PEIS for Geothermal Energy
Development at NAS Fallon provides the same level of analysis on NAS Fallon property. The
Fallon FORGE team believes that these documents are sufficient to support the commencement
of operations at the Fallon FORGE site. While the Navy will need to complete an internal
evaluation of all of these documents before this work will commence on the Navy-owned land,
the Navy acknowledges that data generated during both the EIS processes and other activities on
base are sufficient for completion of NEPA requirements on Navy land in support of FORGE.
The Navy is committed to working with BLM to complete all NEPA-related work on NAS
Fallon property before the close of Phase 2A. As evidence that a site development pathway
exists, numerous wells within and immediately surrounding the proposed Fallon FORGE site
have been permitted previously. An Environmental Information Synopsis is provided in
Appendix C.
2.3. Plan Development
Associated with Phase 1 activities, six separate planning documents were prepared. These
include the Fallon FORGE:
Data Dissemination and Intellectual Property Plan
Communications and Outreach Plan
Sample and Core Curation Plan
Preliminary Induced Seismicity Mitigation (PISM)Plan
Environmental Safety and Health (ES&H) Plan
Research and Development Implementation Plan
Each of these plans, inventories of data used in the development of the geologic model, data
uploaded to the GDR, and permitting data are provided as appendices. Additionally, an update
to the team’s stakeholder engagement is included as Appendix H.
During Phase 1, the Fallon FORGE team developed its plans through careful thought and
extensive discussion. The process of disseminating FORGE data in a manner that ensures data
integrity and distribution to the community in a timely manner requires careful consideration, as
addressed in the Data Dissemination Plan. The importance of communication and outreach to
stakeholders cannot be underestimated and as the Communications and Outreach plan shows,
there is a broad community that must be engaged as FORGE moves forward. The Sample and
Core Curation Plan was developed on the shoulders of giants, with the processes used at the San
Andreas Fault Observatory at Depth (SAFOD) serving as model for the collection, preservation,
and distribution of physical samples obtained at FORGE. While a final Induced Seismicity
Mitigation Plan (ISMP) will be developed in Phase 2, the information gathered to date and

13
described in the Preliminary ISMP indicates a very low risk of any significant impact related to
induced seismicity that would occur during operations at the Fallon FORGE site. Safety of the
worker and the environment is paramount in the execution of FORGE. DOE requires that all
work performed by the Department and its contractors follow a broad set of requirements for
Integrated Safety Management (ISM). The ES&H plan described in Appendix K complies with
this DOE requirement and is structured to design or engineer safety of the worker and the
environment into the execution of FORGE. The vision for FORGE is a dedicated Enhanced
Geothermal Systems (EGS) field laboratory and a complementary R&D program that focuses on
the science and technology necessary to bring the EGS concept to fruition and ultimately lead to
commercialization. The Research and Development plan, provided in Appendix L, describes our
team’s plan and vision for FORGE, the structure under which site activities will be conducted,
the process for issuing and managing R&D solicitations, interactions with DOE and the Science
and Technology Analysis Team (STAT), and dealing with conflicts of interest.

14
Page Intentionally Blank

15
3. LESSONS LEARNED
During Phase 1, at least two significant lessons were learned by members of the team. The first
being the importance of communication, both between team members and with interested
stakeholders, is critically important to project success. Of particular note with respect to
stakeholder interaction is the need to explain stimulation activities that are integral to the
development of EGS. More than any time in the past, the issue of “fracking” (the spelling
reflects that of the press) is now on the broader public’s radar. Making the distinction between
oil & gas stimulation activities and those planned at FORGE is vital to public acceptance of
FORGE. Our interactions with local stakeholders were quite positive; however, the Fallon
FORGE team knows it must remain vigilant and engaged to maintain excellent relations with the
community of Fallon.
The second lesson learned is that achieving the goals of FORGE will not come cheap. Working
in the subsurface is neither easy nor inexpensive. Within a constrained budget, the selection of
drillhole locations, construction methods, and number of holes (i.e., production, injection,
monitoring, and test holes) needs to be carefully considered. Drilling will be the second largest
expenditure (after competitive R&D solicitations) during FORGE operations. A robust geologic
model becomes even more important as it will constrain targeting of wells intended for
stimulation. Further, the resource depth will have a significant impact on drilling cost and,
therefore, on what FORGE can accomplish with fixed annual budgets. Additionally, because of
real-world budgetary constraints it is imperative to identify and focus on the most relevant
variables specific to understanding and implementing EGS development and breaking down
existing barriers to development—that will be a major charge for the Science and Technology
Analysis Team.

16
Page Intentionally Blank

17
4. CONCLUSION
The vision for FORGE is a dedicated EGS field laboratory and a complementary R&D program
that focuses on the science and technology necessary to bring the EGS concept to fruition and
ultimately lead to commercialization. This vison has driven the planning associated with Phase 2
and Phase 3 of the Fallon FORGE team.
During Phase 2A, 2B, and 2C, the Fallon FORGE site will be instrumented and readied to test
new technologies and techniques in Phase 3. In Phase 2A, an Environmental Information
Volume will be completed while a schedule to complete the NEPA process and obtain required
permits will be completed. Additionally, preliminary telemetered seismic monitoring of the site
will be deployed to complement existing seismic monitoring activities at the Fallon FORGE site.
During Phase 2B all reviews, permits, and approvals initiated in Phase 2A will be obtained in
accordance with NEPA and other local and state regulations. It is anticipated that these permits
will be obtained early in Phase 2B and additional site characterization allowed by NEPA and
applicable permits to begin. Phase 2B will also include the completion of the Induced Seismicity
Mitigation Plan that will incorporate recorded site MEQ data and associated analyses into a
Probabilistic Seismic Hazard Analysis, Criteria for Damage and Vibration, and Mitigation
Actions for field testing. In 2C the site is brought to readiness for FORGE implementation
through, at a minimum, additional surface and subsurface site characterization, deployment of
high resolution seismic monitoring, geologic model refinement, and reservoir modeling.
Additionally, a Science and Technology Analysis Team (STAT) will be assembled to provide
technical guidance to the FORGE team and to ensure DOE objectives are incorporated in
FORGE execution. As a result of working with the STAT to assess current technology, establish
technical baseline information and performance metrics for FORGE work, and review the
FORGE implementation plan, topics for the first round of competitive solicitations will be
developed and a draft solicitation produced. Where applicable and appropriate, DOE may elect
to have the Fallon FORGE team incorporate testing of methods and tools developed by
separately funded DOE researchers into FORGE activities.
Upon entering Phase 3 of the project, the Fallon FORGE site will move toward full
implementation, and at least two full-diameter wells will be constructed at appropriate sites,
incorporating directional and extended-reach drilling techniques as needed to best take advantage
of local geological conditions (e.g., rock types, geologic structures, and in-situ stress state)
determined in earlier phases. After baseline testing of each well, the subject rock mass will be
stimulated to create an operating reservoir, and testing will be performed to characterize
reservoir extent, hydraulic characteristics, and heat-exchange performance. Based on results of
these analyses, additional stimulations will then be designed, executed, and characterized as
needed. Alternative and experimental stimulation techniques will be employed as available. The
project will endeavor to create the most efficient and sustainable EGS to date that can serve as a
prototype for EGS development elsewhere. Alongside these EGS development efforts, R&D
directed toward EGS development and subsurface science and engineering will be supported
through an expansive and competitive R&D program open to the broader scientific and
engineering community. To the extent practicable, existing wells at the Fallon FORGE site will
be used to support these R&D efforts and additional fit-for-purpose wells will be constructed as
R&D requirements evolve.

1-M
Page Intentionally Blank

1-A
APPENDIX A. CONCEPTUAL GEOLOGIC MODEL

CONCEPTUAL GEOLOGIC MODEL Fallon, NV

Fallon, NV, Conceptual Geologic Model | i
Contents
1 Executive Summary .................................................................................................................................................................. 1
2 Introduction............................................................................................................................................................................... 2
3 Geologic setting ........................................................................................................................................................................ 7
3.1 Regional Setting ................................................................................................................................................................. 7
3.2 Local Setting of the Fallon FORGE Site .......................................................................................................................... 16
4 FORGE parameters – Description and Analysis of Data ........................................................................................................ 20
4.1 Stratigraphic Data ............................................................................................................................................................. 24
4.1.1 Surface Lithologic Data .......................................................................................................................................... 24
4.1.2 Well Lithology Data ............................................................................................................................................... 27
4.1.3 Petrographic Data ................................................................................................................................................... 34
4.2 Structural Data ................................................................................................................................................................. 35
4.2.1 General Structural Setting ....................................................................................................................................... 35
4.2.2 Geometry and Kinematics of Faults ....................................................................................................................... 36
4.2.3 Stress Regime ......................................................................................................................................................... 40
4.3 Thermal Data .................................................................................................................................................................... 46
4.4 Fluid Geochemical Data ................................................................................................................................................... 51
4.5 Alteration Data ................................................................................................................................................................. 56
4.6 Well Flow Testing Data ................................................................................................................................................... 58
4.7 Geophysical Data ............................................................................................................................................................. 65
4.7.1 Gravity and Magnetic Data ..................................................................................................................................... 65
4.7.2 Magnetotelluric Data .............................................................................................................................................. 75
4.7.3 Seismicity and Micro-Earthquake (MEQ) Data ...................................................................................................... 80
4.7.4 Seismic Reflection Data ......................................................................................................................................... 86
5 Discussion ............................................................................................................................................................................... 92
5.1 Summary of Stratigraphic and Structural Framework ...................................................................................................... 92
5.2 3D Geologic Model .......................................................................................................................................................... 94
5.3 Primary FORGE Criteria ................................................................................................................................................ 103
5.4 Future Work – Additional Data Needs ........................................................................................................................... 111
6 Conclusions........................................................................................................................................................................... 113
Attachment A: Well Data Summary ............................................................................................................................................. 115
Attachment B: Interpretations of Seismic Reflection Profiles ...................................................................................................... 118
Attachment C: Play Fairway Analysis .......................................................................................................................................... 127

Fallon, NV, Conceptual Geologic Model | 1
CONCEPTUAL GEOLOGIC MODEL
Fallon, NV
1 EXECUTIVE SUMMARY
The proposed Frontier Observatory for Research in Geothermal Energy (FORGE) at Fallon, NV,
covers ~4.5 km2 in the southeastern part of the Carson Sink in west-central Nevada, ~12 km
southeast of the City of Fallon. The Carson Sink is a large late Miocene to recent composite
basin within the Basin and Range province. This site was specifically selected for analysis of its
suitability for FORGE due to its extensional tectonic setting, abundance of available data,
existing infrastructure, and documented temperatures, permeability, and lithologic composition
of target test zones in crystalline basement beneath the basin. The site is located on two parcels
that include land owned by the Naval Air Station Fallon (NASF) and leased and owned by Ormat
Nevada, Inc. In addition, about 40 km2 of surrounding lands are open to monitoring and
instrumentation activities. Existing facilities at the Fallon FORGE site include an excellent
network of roads, abundant wells, available storage for equipment and supplies at the NASF, and
an established infrastructure for electrical and water resources, all of which will facilitate
significant research and development activities. The nearby communities of Fallon and Reno
also provide superior infrastructure and research facilities for this project. A total of 12
geothermal wells and 34 temperature gradient holes have been drilled for geothermal exploration
within the NASF and Ormat lease area. This includes 7 geothermal wells and 4 temperature
gradient holes on the FORGE site and 5 geothermal wells and 30 temperature gradient holes on
the NASF and Ormat monitoring areas.
Multiple preexisting data sets were reviewed to characterize the stratigraphic and structural
setting of the area and develop a 3D conceptual geologic model. Available geologic data sets
included detailed geologic maps, >14,000 m of cuttings and core, petrographic data, borehole
imaging of fractures, fault kinematic information, down-hole temperature logs, fluid
geochemistry, and well flow tests. In addition, available geophysical data sets included detailed
gravity, regional magnetic, magnetotelluric, seismologic, and ~270 km of seismic reflection
profiles. Based on synthesis of the above data sets, a 3D geologic model was developed for the
Fallon FORGE site and immediate surroundings, incorporating 100 km2 to a depth of 3.8 km.
The 3D model depicts the major stratigraphic and structural relations, the 175 to 225°C thermal
window for FORGE, and location and volume of potential EGS reservoirs. In descending order,
the main stratigraphic units in the area include: (1) Late Miocene to Quaternary basin-fill
sediments up to 1.5 km thick, (2) Miocene volcanic and lesser sedimentary rocks (0.7-1.1 km
thick), and (3) Mesozoic basement consisting of Triassic-Jurassic metavolcanic and
metasedimentary rocks intruded by Jurassic-Cretaceous granitic plutons. Four wells in the area
penetrate the entire Neogene section and terminate in Mesozoic basement. The seismic
reflection profiles and gravity models indicate that the site occupies a broad, gently west-tilted
fault block or half graben, which is cut by widely spaced (~0.4-3.5 km), northerly striking,
primarily east-dipping normal faults, all with less than ~200 m of displacement. Borehole
imaging of drilling induced fractures and fault kinematic data from nearby bedrock exposures

Fallon, NV, Conceptual Geologic Model | 2
indicate an extensional stress regime and a WNW-trending extension direction. Quaternary
faults have not been observed within the proposed FORGE site.
The documented temperatures, permeability, lithologic composition of potential reservoirs, and
structural setting demonstrate that the Fallon FORGE site contains sufficient rock volumes well
within the criteria specified for FORGE, while also residing within a favorable stress regime
with no evidence of an active hydrothermal system. Requisite temperatures of 175 to 225 °C are
attained between required depths of 1.5 to 4 km, as evidenced by down-hole temperature logs.
Cuttings and core demonstrate that crystalline rocks abound in the Mesozoic basement (e.g.,
granite, quartzite, and metavolcanic rocks) at these depths. Flow testing of wells, a relatively
simple Cenozoic structural setting, and high electrical resistivity values together indicate low
permeability within the basement rocks. Borehole imaging and modeling of the stress regime
further suggest that the basement contains abundant N- to NNE-striking preexisting fractures,
which approximately parallel SHmax and are therefore favorably oriented for stimulation. High
extensional strain rates in the area are also conducive to increasing permeability through
reactivation of shear fractures during hydraulic stimulation. Further, multiple features indicate
the absence of an active hydrothermal system, including lack of permeability encountered in
wells, lack of convective temperature profiles, lack of prominent shallow thermal anomalies,
lack of Quaternary faults, lack of a favorable structural setting for geothermal activity, lack of
surface hot springs or steam vents, and no indication of paleo-hot spring activity, such as sinter
or travertine. There are at least three possible, competent target formations for stimulation,
incorporating >3 km3 in the Mesozoic basement: (1) Triassic to Jurassic felsic metavolcanic
rocks, (2) Jurassic quartzite, and (3) Jurassic to Cretaceous granitic intrusions.
In summary, the Fallon site is an ideal location for FORGE from both a regional and local
perspective. On a regional scale, it is experiencing relatively high strain rates, occupies part of
an extensional basin (half graben) characteristic of most of the Basin and Range province, and
resides in an amagmatic setting, which epitomizes the bulk of the geothermal systems within the
Great Basin region. On a local scale, key FORGE criteria are met at Fallon, specifically
requisite temperatures (175-225°C) between the required depths (1.5-4 km) in competent
crystalline lithologies with low permeability in a favorable stress regime and no evidence of an
active hydrothermal system. We therefore conclude that Fallon is an ideal location for a field
laboratory dedicated to EGS research.
2 INTRODUCTION
The Frontier Observatory for Research in Geothermal Energy (FORGE) project offers a unique
opportunity to develop the technologies, techniques, and knowledge needed to make enhanced
geothermal systems (EGS) a commercially viable electricity generation option for the USA. The
objective of this project is to establish and manage FORGE as a dedicated site, where the
subsurface scientific and engineering community will be eligible to develop, test, and improve
new technologies and techniques in an ideal EGS environment. This will allow the geothermal
and other subsurface communities to gain a fundamental understanding of the key mechanisms
controlling EGS success, in particular how to generate and sustain fracture networks in the
spectrum of basement rock formations using different stimulation technologies and techniques.
This critical knowledge will be used to design and test methodologies for developing large,

Fallon, NV, Conceptual Geologic Model | 3
economically sustainable heat exchange systems, thereby paving the way for a rigorous and
reproducible approach that will reduce industry development risk. Essential to this process is a
comprehensive site for characterization, monitoring instrumentation, and data collection that will
capture a higher-fidelity picture of EGS creation and evolution processes than any prior
demonstration. A dedicated FORGE allows for the highly integrated comparison of technologies
and tools in a controlled and well-characterized environment, as well as the rapid dissemination
of technical data to the research community, developers, and other interested parties.
The objective of this document is to describe available geological, geophysical, and geochemical
data for the proposed FORGE site at Fallon, Nevada, and integrate these data sets into a
comprehensive, 3D conceptual geologic model for the site. The proposed Fallon FORGE site
lies within and adjacent to the Naval Air Station Fallon (NASF) ~12 km southeast of the town of
Fallon, Nevada, in the broad Carson Sink basin in west-central Nevada (Figure 1). Fallon was
specifically selected for analysis of its suitability for FORGE due to its extensional tectonic
setting, abundance of available data, existing infrastructure, and documented temperatures,
permeability, and lithologic composition of potential reservoirs in crystalline basement beneath
the basin, as described in detail below. All of these attributes facilitate development of a site
dedicated to testing and improving new EGS technologies and techniques by the subsurface
scientific and engineering community.
Previously completed geologic, geophysical, and geochemical studies in the region, as well as
ongoing research projects, provide a firm foundation upon which to evaluate the feasibility of the
Fallon site for FORGE. For example, detailed studies of the stratigraphic and structural
framework of the region, including in-depth analyses of most of the known geothermal fields in
the area, such as Salt Wells, Desert Peak, Brady’s, Soda Lake, and Lee-Allen (e.g., Hinz et al.,
2008, 2010, 2011, 2014; Faulds et al., 2006; 2010a, 2010b, 2011, 2012; McLachlan et al., 2011;
Blake and Davatzes, 2012), have been completed, allowing for direct comparison of the FORGE
site to known hydrothermal systems in the region. In addition, a detailed gravity survey and
derivative depth-to-basement maps of the entire Carson Sink were recently completed (Faulds et
al., 2014). Furthermore, the DOE-funded Nevada play fairways project involved detailed
analysis of the geothermal potential of the Carson Sink and surrounding region (Faulds et al.,
2016; Attachment C). Key available data sets from the proposed Fallon site include detailed
geologic mapping, numerous bore-holes, stress data, thermal data, well-test data, geochemistry,
detailed gravity surveys, magnetotelluric (MT) data, and seismic reflection profiles. As
described below, this abundance of data has allowed for detailed examination of the Fallon site,
with analysis of more than 14,000 m of cuttings and core and 270 km of seismic reflection
profiles underpinning development of the 3D model. Integration of the multiple data sets into
the 3D model has, in turn, permitted assessment of the volume, permeability, and structural and
stratigraphic character of potential EGS reservoirs at the Fallon site.

Fallon, NV, Conceptual Geologic Model | 4
Figure 1. A. General location map of the proposed Fallon FORGE site in west-central Nevada. B. More detailed location map showing land status and major access roads. Abbreviations for physiographic
features shown in italics: BM, Bunejug Moutains; LM, Lahontan Mountains; SSR, Sand Springs Range; WT, White Throne Mountains. Abbreviations for geothermal fields in the Carson Sink area shown in bold: Br, Bradys; DP, Desert Peak; DQ, Desert Queen; DV, Dixie Valley; LA, Lee-Allen; Pt, Patua; SL, Soda Lake; St,
Stillwater; SW, Salt Wells.
The Fallon FORGE site covers ~4.5 km2 in the southeastern part of the large composite basin of
the Carson Sink in west-central Nevada, ~12 km southeast of the City of Fallon (Figure 1A). The
site is located on two parcels that include land owned by the NASF and Ormat Nevada, Inc.
(Figure 1B and Figure 2). The site is bound by (1) the NASF on the northwest, (2) parts of the
Fallon agricultural district to the north, west, and south, (3) Carson Lake wetlands at the base of
the White Throne Mountains to the south, and (4) Ormat lease lands to the east, which include
parts of the Lahontan and Bunejug Mountains. Ormat has both privately held land and
geothermal leases. The Ormat lease area includes portions of 12 sections (7426 acres) used in
part for seasonal cattle grazing. A project Environmental Assessment (EA) covering geothermal
exploration and development was completed in 2008 for the Ormat lease area. Most of the
surrounding lands in the Ormat lease area and NASF are open to monitoring and instrumentation
activities. However, NASF will not allow any ground disturbance nor any activities that would
affect flight operations within and immediately surrounding their runways. In addition, the
northeastern part of the Ormat lease block, primarily in the higher ground of the Lahontan
Mountains, contain archeological sites and are therefore “no surface occupancy zones”.
However, per the Ormat lease agreements, if there becomes a need for surface occupancy for
FORGE related activities, the “no surface occupancy” contingency may be negotiated and

Fallon, NV, Conceptual Geologic Model | 5
revised if the BLM, with Native American consultation, and the FORGE operators both agree on
the perceived need for access and any access restrictions that might be imposed if occupancy is
granted. Despite these restrictions, this leaves ~4.5 km2 for development of infrastructure on the
FORGE site and another ~40 km2 for monitoring and instrumentation on the surrounding lands.
Existing facilities at the Fallon FORGE site include an excellent network of roads, abundant
wells, available storage for equipment and supplies at the NASF, and an established
infrastructure for electrical and water resources, all of which will facilitate significant research
and development activities. The network of paved and dirt roads makes the site fully accessible
(Figure 2 and Figure 3). For example, access to the site can be attained from multiple roads that
intersect U.S. Highway 50, including the paved access road of Macari Lane that traverses
southwest through the center of the Ormat lease area. Many additional paved and gravel roads
are present on the NASF and in the agricultural areas that border much of the site (Figure 3).
NASF facilities lie directly north-northwest of the proposed FORGE site (Figure 2 and Figure 3).
NASF is fully supportive of this project and will therefore supply equipment, storage, and other
needs, as necessary.
A total of 12 geothermal wells and 34 temperature gradient holes have been drilled for
geothermal exploration within the NASF and the Ormat lease area (Figure 2). This includes 7
geothermal wells, 4 temperature gradient holes on the FORGE site, 5 geothermal wells, and 30
temperature gradient holes on the NASF and Ormat monitoring areas. Four exploration wells
within the FORGE site (82-36, 61-36, 88-24, and 86-25; Figure 3) are available for use in the
project. Several additional wells are available for monitoring outside the central FORGE site
within the NASF and Ormat lease area, including numerous temperature gradient holes. Some
additional well sites have been permitted but not yet drilled. The abundant well data provide
significant subsurface control for the site. Data from these wells were synthesized with available
geophysical and geological data to generate a detailed 3D model of the FORGE site, as discussed
in subsequent sections of this report.
In addition to the wells, a wide range of equipment is available at the NASF for use in this
project. This includes one separator that is ~5 m high and 3 m in width, one weir box, a down-
hole pump with a surface drive, step up transformer, and surge protector. The NASF also has a
spare well-head kit and cable connect, which are used to connect power to a downhole
submersible pump. There are dirt/gravel roads to access each drill pad from existing public
gravel/dirt and paved roads (see Figure 2 and Figure 3). Drill pads range in size from 60 x 70 m
(200' x 225') to 90 x 76 m (300' x 250'). Three drill pads have existing sumps, with 82-36 being
the largest at 84 x 31 x 2.4 m (275' x 100' x 8'); 61-36 is large, but half the size of the 82-36 pad
at 31 x 6 x 2 m (100' x 20' x 7'), and the 86-25 pad is relatively small at 18 x 3 x 2 m (60' x 10' x
6'). Sumps have been backfilled on the 88-24 and 82-19 drill pads.
Water for the EGS experiments at the FORGE site will be sourced from well 84-31 within the
Ormat lease lands. This well lies ~11 km southeast of the edge of a well-defined basalt aquifer
that provides water to the community of Fallon and NASF (Figure 3). This basalt aquifer has
been studied thoroughly by the USGS (Glancy, 1986; Maurer and Welch, 2001) and does not
extend into the proposed FORGE site. The geothermal reservoir(s) proposed for use for FORGE
are neither hydraulically nor geologically connected to the Fallon basalt aquifer or to any ground
water aquifers used by the community. Fluids used in the FORGE project will be geothermal

Fallon, NV, Conceptual Geologic Model | 6
fluids, drawn from geothermal reservoirs. These waters do not meet drinking water standards
due to high temperature and chemistry.
Nearby communities also provide superior infrastructure for this project. For example, the town
center of Fallon (~12 km to the northwest) affords abundant hotels, restaurants, and stores for
personnel and supplies. In addition, the Reno metropolitan area, only 100 km west of Fallon,
offers all the accoutrements of a major city in terms of needed resources and equipment for
FORGE research activities, development, conference and workshop facilities, and a major
university that houses both the Great Basin Center for Geothermal Energy (GBCGE) and the
Great Basin Science Sample and Records Library (GBSSRL). The GBSSRL serves as a
repository for samples, records, and information on the geology of Nevada and the Great Basin
region, including cuttings, core, and logs from geothermal and oil-gas wells drilled in the Carson
Sink and other parts of Nevada.
Figure 2. Map of the Fallon FORGE site with adjacent FORGE monitor areas on the NASF and Ormat lease area with geothermal wells, temperature gradient holes, and accessible roads shown. Note that no surface occupancy zones correspond to the vicinity of the runways at NASF and the northeastern part of the Ormat
lease area. Other parts of the NASF and Ormat lease block are accessible for instrumentation and monitoring, and full research and development is allowed on the Fallon FORGE site. A close-up of the Forge
site is shown in Figure 3.

Fallon, NV, Conceptual Geologic Model | 7
Figure 3. Map of Fallon FORGE site, showing geothermal wells, temperature gradient holes, and accessible roads. Approximately 4.5 km2 has been cleared for research experiments and development.
3 GEOLOGIC SETTING
3.1 REGIONAL SETTING
The Carson Sink lies within the Basin and Range province directly northeast of the Walker Lane
belt (Figure 4; Stewart, 1988; Faulds and Henry, 2008). The Walker Lane is a system of strike-
slip faults that accommodates ~20% of the dextral motion (~1 cm/yr) between the North
American and Pacific plates (Hammond and Thatcher, 2004). Major tectonic events affecting
this region and relevant to the FORGE site include: (1) Mesozoic contractional tectonism,
involving arc volcanism, back arc sedimentation and volcanism, and some east-directed folding
and thrusting; (2) early Tertiary erosion, which beveled the preexisting arc and related thrust
sheets, producing an erosional surface with considerable relief by the Oligocene; (3) the
ignimbrite flare-up in late Oligocene time, involving eruption of voluminous ash-flows from
calderas in central Nevada and deposition of the ash-flow tuffs in deep paleovalleys across
western Nevada; (4) mafic to intermediate composition volcanism in Miocene time related to the
ancestral Cascade arc; (5) regional east-west to west-northwest extension from early Miocene
time to present; and (6) dextral shear from the late Miocene to present associated with Pacific-

Fallon, NV, Conceptual Geologic Model | 8
North American plate motion, northwestward propagation of the Walker Lane into the region,
and concomitant retreat of the ancestral Cascade arc to the northwest.
The present physiography of the region, including the broad basin of the Carson Sink and
adjacent mountain ranges, has been primarily shaped by Miocene to recent extensional
tectonism. Regional studies constrain the onset of regional extension to ~17-15 Ma to the
northeast of Fallon (Fosdick and Colgan, 2008) and ~15-12 Ma in the Wassuk Range area to the
south (Stockli et al., 2002). A 14 Ma north-striking basaltic dike swarm exposed in both the
Bunejug Mountains and in Rainbow Mountain may correspond to the onset of extension in the
Salt Wells area (Bell et al., 2010; Hinz et al., 2011). The base of the Miocene lacustrine
sedimentary section is locally interlayered with the upper part of the ~16 to 12 Ma basaltic
andesite and rhyolite lavas in the Lahontan Mountains (Bell et al., 2010). These sediments
probably represent initial sedimentary accumulation in half grabens in the region. Extensional
tectonism was primarily responsible for producing the composite basin of the Carson Sink, as
seismic reflection and gravity data indicate that a series of half grabens comprises the Carson
Sink. The deeper basins such as the Salt Wells basin and the southern Carson Sink probably
record a continuous basin-fill sedimentary record from ~12 Ma to present. Most of the
surrounding mountain ranges, especially on the east, north, and northwest sides of the Carson
Sink, are tilted fault blocks typical of the Basin and Range province (e.g., John, 1995a; Faulds et
al., 2010a, 2012; Hinz et al., 2011, 2014). Quaternary faults abound in the region but are scarce
in the southeastern Carson Sink (Figure 5), with Quaternary slip rates minimal in the vicinity of
the proposed FORGE site (Figure 6 and Figure 7).
Geodetic, fault kinematic and well-bore data indicate that a west-northwest-trending extension
direction has dominated the Carson Sink region from the late Miocene to present (Hickman and
Davatzes, 2010; Faulds et al., 2010a; Blake and Davatzes, 2012; Kreemer et al., 2012, 2014;
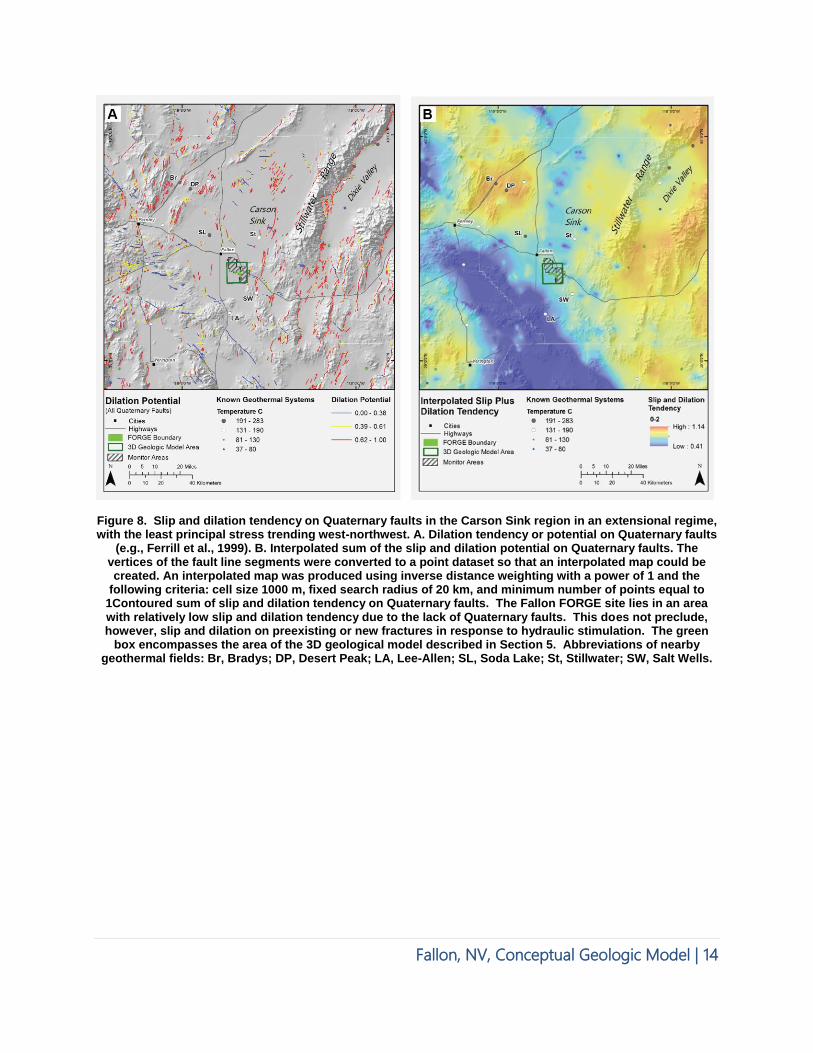
Hinz et al., 2014; Jolie et al., 2015). Slip and dilation tendency is therefore greatest on
moderately to steeply dipping, NNE-striking faults. Figure 8 shows dilation potential and
summed slip and dilation potential (e.g., Morris et al., 1996; Ferrill et al., 1999) on Quaternary
faults in the region.
The Walker Lane initially developed in late Miocene time (~10-9 Ma) and has been propagating
northwestward since its inception in concert with the San Andreas fault (Faulds and Henry,
2008). The San Andreas fault terminates northward at the Mendocino triple junction offshore of
northern California. The Walker Lane essentially mimics the San Andreas and terminates in
northeastern California directly inland of the triple junction. Despite its proximity to the Walker
Lane (Figure 4), the Carson Sink region is dominated by extensional structures rather than
dextral shear or wrench faulting. The terrane to the south and southwest of the Carson Sink is
dissected, however, by strike-slip faults of the Walker Lane (Hinz et al., 2008, 2010), and a
major northwest-striking dextral fault may bound the Carson Sink on the southwest.
The northern Walker Lane directly west and to the northwest of Fallon is one of the youngest
parts of the Pacific-North American plate boundary, having developed in the past ~5 Ma (Faulds
and Henry, 2008). As the Walker Lane terminates northwestward, ~1 cm/yr of dextral shear is
transferred to northwest-trending extension in the northwestern part of the Great Basin (Faulds et
al., 2004). Enhanced extension results in greater dilation, which in turn fosters fluid flow and
geothermal activity. This region of enhanced extension has a greater density of known

Fallon, NV, Conceptual Geologic Model | 9
hydrothermal systems than other parts of the Basin and Range province and currently hosts about
a dozen geothermal power plants (Figure 4; Faulds et al., 2012). Similar to most of the Great
Basin, however, geothermal activity in this region is amagmatic (i.e. no mid to upper crustal
magmatic heat sources), as volcanism generally ceased 10-3 Ma.
Due to its location directly northeast of the northern Walker Lane, the Carson Sink area has some
of the higher strain rates in the Great Basin region (Figure 4 and Figure 9), as evidenced by GPS
geodetic data (Kreemer et al., 2012, 2014). For example, dilatation in the Fallon area is twice
that of southwestern Utah and more than four times that of the Snake River Plain. High strain
rates and rocks that are critically stressed (or near critically stressed) for frictional failure in the
current stress field not only favor conventional geothermal energy production (Hickman et al.,
1998; Barton et al, 1998) but also facilitate EGS research and development, because the ability to
increase permeability through reactivation of shear fractures during hydraulic stimulation is more
readily accomplished under such conditions (e.g., Hickman and Davatzes, 2010; Chabora et al.,
2012; Dempsey et al., 2013). The lack of magmatism also imparts more predictability in
determining the stress field, as transient stress-field perturbations induced by mid to upper crustal
intrusions and associated inflation and/or deflation of magma chambers would be absent.
Although high heat flow (Blackwell and Richards, 2004) and high extensional to transtensional
strain rates (Kreemer et al., 2012) have generated relatively high geothermal gradients in the
Carson Sink and surrounding parts of the Great Basin (e.g., Coolbaugh et al., 2005),
development of conventional hydrothermal systems in this region is still challenging. An
abundance of hot dry wells in the region demonstrates the many challenges of locating adequate
permeability at depth. Favorable structural settings (Figure 10; Faulds et al., 2006, 2011, 2013;
Faulds and Hinz, 2015) and geophysical signatures (e.g., Wannamaker et al., 2013) for sufficient
permeability and fluid flow comprise a relatively small fraction of the region and involve limited
volumes of hot rock. Thus, finding sufficient permeability for geothermal production is clearly
more of an impediment for exploration and development of conventional hydrothermal resources
than temperature in this region. The volumetric extent of hot, impermeable rock is simply far
greater than that of hot permeable rock. Considering the high heat flow and high geothermal
gradient across nearly all of the Great Basin, there is clearly enormous potential for successful
EGS development throughout the region.
From a regional perspective, the proposed Fallon FORGE site thus represents an ideal site for a
field laboratory dedicated to EGS research, as it lies in a region experiencing relatively high
strain rates, occupies part of an extensional basin (half graben) characteristic of most of the Basin
and Range province, and resides in an amagmatic setting, which epitomizes the bulk of the
geothermal systems within the Great Basin region.

Fallon, NV, Conceptual Geologic Model | 10
Figure 4. Map of the Great Basin region showing strain rates (from Kreemer et al., 2012), known geothermal systems (black dots), and geothermal power plants (yellow stars). Strain rates reflect the second invariant strain rate tensor, with warmer colors showing higher strain rate (nonstrain, 10-9/yr). Red circle surrounds
the Fallon FORGE site.

Fallon, NV, Conceptual Geologic Model | 11
Figure 5. Age of Quaternary faults in the Carson Sink region. The green box encompasses the area of the 3D geological model described in Section 5. Abbreviations of nearby geothermal fields: Br, Bradys; DP,
Desert Peak; LA, Lee-Allen; SL, Soda Lake; St, Stillwater; SW, Salt Wells.

Fallon, NV, Conceptual Geologic Model | 12
Figure 6. Slip rates of Quaternary faults in the Carson Sink region. The green box encompasses the area of the 3D geological model described in Section 5. Abbreviations of nearby geothermal fields: Br, Bradys; DP,
Desert Peak; LA, Lee-Allen; SL, Soda Lake; St, Stillwater; SW, Salt Wells.

Fallon, NV, Conceptual Geologic Model | 13
Figure 7. Interpolation of slip rates on Quaternary faults in the Carson Sink region. The slip rate of normal and strike-slip faults was log-transformed (converted to Log10) for each fault segment. The vertices of the
fault line segments were converted to a point dataset so that an interpolated map could be generated. Interpolated maps of slip rate and log base 10 of the slip rate were created using inverse distance weighting
with a power of 1, using the following criteria: cell size 1000 m, fixed search radius of 20 km, minimum number of points = 1. Note that the proposed Fallon FORGE site lies in an area devoid of Quaternary faults
and thus also occupies an area with minimal slip rates. The green box encompasses the area of the 3D geological model described in Section 5. Abbreviations of nearby geothermal fields: Br, Bradys; DP, Desert
Peak; LA, Lee-Allen; SL, Soda Lake; St, Stillwater; SW, Salt Wells.
Fallon, NV, Conceptual Geologic Model | 14
Figure 8. Slip and dilation tendency on Quaternary faults in the Carson Sink region in an extensional regime, with the least principal stress trending west-northwest. A. Dilation tendency or potential on Quaternary faults
(e.g., Ferrill et al., 1999). B. Interpolated sum of the slip and dilation potential on Quaternary faults. The vertices of the fault line segments were converted to a point dataset so that an interpolated map could be created. An interpolated map was produced using inverse distance weighting with a power of 1 and the
following criteria: cell size 1000 m, fixed search radius of 20 km, and minimum number of points equal to 1Contoured sum of slip and dilation tendency on Quaternary faults. The Fallon FORGE site lies in an area with relatively low slip and dilation tendency due to the lack of Quaternary faults. This does not preclude, however, slip and dilation on preexisting or new fractures in response to hydraulic stimulation. The green
box encompasses the area of the 3D geological model described in Section 5. Abbreviations of nearby geothermal fields: Br, Bradys; DP, Desert Peak; LA, Lee-Allen; SL, Soda Lake; St, Stillwater; SW, Salt Wells.

Fallon, NV, Conceptual Geologic Model | 15
Figure 9. Second invariant of the geodetic strain rate for the Carson Sink region in western Nevada. The Fallon FORGE site lies in an area of relatively high regional strain rates, typical of most of the northwestern
Great Basin. The green box encompasses the area of the 3D geological model described in Section 5. Abbreviations of nearby geothermal fields: Br, Bradys; DP, Desert Peak; LA, Lee-Allen; SL, Soda Lake; St,
Stillwater; SW, Salt Wells.

Fallon, NV, Conceptual Geologic Model | 16
Figure 10. Favorable structural settings identified in the Carson Sink region. Colors denote local permeability scores based on relative weighting of type of structural setting and ages, slip rates, and slip and
dilation tendencies on Quaternary faults. Favorable structural settings cover ~10% of the area and are sparse in the southern Carson Sink and absent at the proposed FORGE site. The green box encompasses the area of the 3D geological model described in Section 5. Abbreviations of nearby geothermal fields: Br,
Bradys; DP, Desert Peak; LA, Lee-Allen; SL, Soda Lake; St, Stillwater; SW, Salt Wells.
3.2 LOCAL SETTING OF THE FALLON FORGE SITE
The Fallon site lies in the southeastern part of the large composite basin of the Carson Sink in
west-central Nevada (Figure 1 and Figure 11). Although high temperatures (>175oC) have been
encountered at depths of 1.5 to 3.0 km beneath the site (as described in detail in section 4.3
below), the lack of permeability has hampered conventional development of this resource. This
makes it an ideal test site for EGS research and development. It is also important to note that no
surface hot springs or fumaroles are present at the surface. In addition, no indications of paleo-

Fallon, NV, Conceptual Geologic Model | 17
hot spring activity, such as sinter or travertine, have been observed on the surface in the area.
Thus, there is no evidence for a recent, conventional hydrothermal system at Fallon.
The stratigraphic section of the Carson Sink in the vicinity of the Fallon site primarily consists of
late Miocene to Quaternary basin-fill sediments, Miocene volcanic and sedimentary rocks,
Oligocene ash-flow tuffs, and Mesozoic granitic and metamorphic basement (Faulds et al., 2015;
Hinz et al., 2016). The site is covered by Quaternary deposits, including alluvial fan, eolian, and
lacustrine sediments (Morrison, 1964; Bell and House, 2010). The underlying volcanic section is
dominated by middle Miocene mafic lavas, with lesser intermediate composition flows. The
volcanic units are associated with the ancestral Cascades arc, which has retreated to the
northwest since the late Miocene in response to the growth of the transform plate boundary and
northwestward propagation of the Walker Lane. The lower part of the Tertiary section may
locally contain late Oligocene ash-flow tuffs that fill paleovalleys cut into Mesozoic basement.
The Neogene section rests nonconformably on heterogeneous Mesozoic basement, which
consists of low- to medium-grade Triassic-Jurassic metasedimentary and metavolcanic rocks
intruded by granitic plutons of probable Cretaceous age. Mesozoic granitic plutons are
widespread in the area and comprise a large proportion of the basement rocks (Figure 11; Page,
1965; Stewart and Carlson, 1978; Satterfield, 2002; Hinz et al., 2008, 2010, 2014). The
Mesozoic units developed in a transitional region between a magmatic arc centered to the west in
the Sierra Nevada region and a back arc setting to the east. Notably, no bedrock units crop out at
the proposed site. However, four wells (61-36, FOH-3D, 82-36, and 84-31) penetrate the entire
Neogene section and bottom out in Mesozoic basement, and many additional wells bottom out in
the basin-fill sediments and Miocene volcanic section. As described in detail in subsequent
sections, cuttings and core from the abundant wells combined with geophysical data greatly
elucidate the subsurface distribution of rock types at Fallon.
The structural framework of the Carson Sink region is dominated by Miocene to recent
extensional features, including systems of north- to north-northeast-striking normal faults (Figure
12). Seismic reflection data reveal that the Carson Sink is composed of a series of half grabens,
including a west-tilted half graben in the Fallon area (Hastings, 1978; Gray et al., 2013; Faulds et
al., 2015; Hinz et al., 2016). Thus, the Carson Sink as a whole is a large composite basin formed
by late Miocene to recent regional extension (Hastings, 1979; Faulds et al., 2015). The Carson
Sink region also contains a series of extensional anticlines and synclines (i.e., extensional
accommodation zones; cf., Faulds and Varga, 1998), resulting from flips in the predominant dip
direction of normal fault systems. Extensional anticlines result from the overlap of oppositely
dipping systems of normal faults that dip toward one another, whereas extensional synclines
result from overlapping normal fault systems that dip away from one another. The west-tilted
half graben appears to compose the western limb of a northerly trending extensional anticline
(cf., Faulds and Varga, 1998) that lies directly east of the primary FORGE site beneath the
Ormat lease area (Hinz et al., 2014; 2016).
Quaternary faults have not been observed within the proposed FORGE site (Figure 5 and Figure
11), and no significant historic seismicity has occurred at the site. The nearest Quaternary scarp
lies ~5 km southeast of the southeastern corner of the primary FORGE site and cuts late
Pleistocene lacustrine sediments (Hinz et al., 2011). The USGS Quaternary fault and fold
database (USGS, 2006) does show a Quaternary fault 2.5 km east of the FORGE site, but recent

Fallon, NV, Conceptual Geologic Model | 18
analysis indicates that this scarp is probably a late Pleistocene shoreline rather than a fault (Bell
and Hinz, unpublished data). The Rainbow Mountains fault ~10 km east of the site (Figure 12)
ruptured in a M6.3 earthquake in 1954, accommodating oblique normal-dextral motion (Caskey
et al., 2004). The Rainbow Mountains fault terminates southward in the vicinity of the Salt
Wells geothermal field. Increased permeability associated with the horse-tailing southern end of
this fault probably accounts for the hydrothermal activity at Salt Wells (Hinz et al., 2014).
Because most geothermal systems in the Great Basin region are proximal to Quaternary faults
(Bell and Ramelli, 2007), the absence of Quaternary faulting at the Fallon FORGE site may
account for the lack of sufficient permeability in the area.
Figure 11. Generalized geologic map of the Carson Sink region. Quaternary faults are shown as black lines.

Fallon, NV, Conceptual Geologic Model | 19
Figure 12. Structural domain map for the Fallon FORGE area with color coded complete Bouguer anomaly gravity model draped over shaded relief; gravity lows are depicted as blue and gravity maximums depicted
as pink (modified from Hinz et al., 2014). The Salt Wells, Carson Lake, Fallon, and Lee-Allen shallow thermal anomalies are depicted by the semi-transparent pink-orange polygons (Edmiston and Benoit, 1984; Hinz et al., 2008, 2014). Extensional fold axes within accommodation zones are shown as solid purple lines, and a
single transverse (i.e., nearly orthogonal to structural grain) accommodation zone is shown as a dashed purple line. Major faults are shown as solid black lines with balls on down-thrown sides. Averaged strike
and dip direction are depicted with unannotated strike and dip symbols (Page, 1965; Bell et al., 2010; Bell and House, 2010; Hinz et al., 2008, 2010, 2011, 2014, unpublished mapping). Cross-section A-A’ is shown in Figure 22. BM, Bunejug Mountains; CL, Carson Lake geothermal area; F, Fallon geothermal area; FFFZ,
Fourmile Flat fault zone; L-A, Lee-Allen geothermal area; LM, Lahontan Mountains; RH, Rattlesnake Hill; RM, Rainbow Mountain; RMFZ, Rainbow Mountain fault zone; SSR, Sand Springs Range; SR, Stillwater Range;
WTM, White Throne Mountains.
Fallon, NV, Conceptual Geologic Model | 20
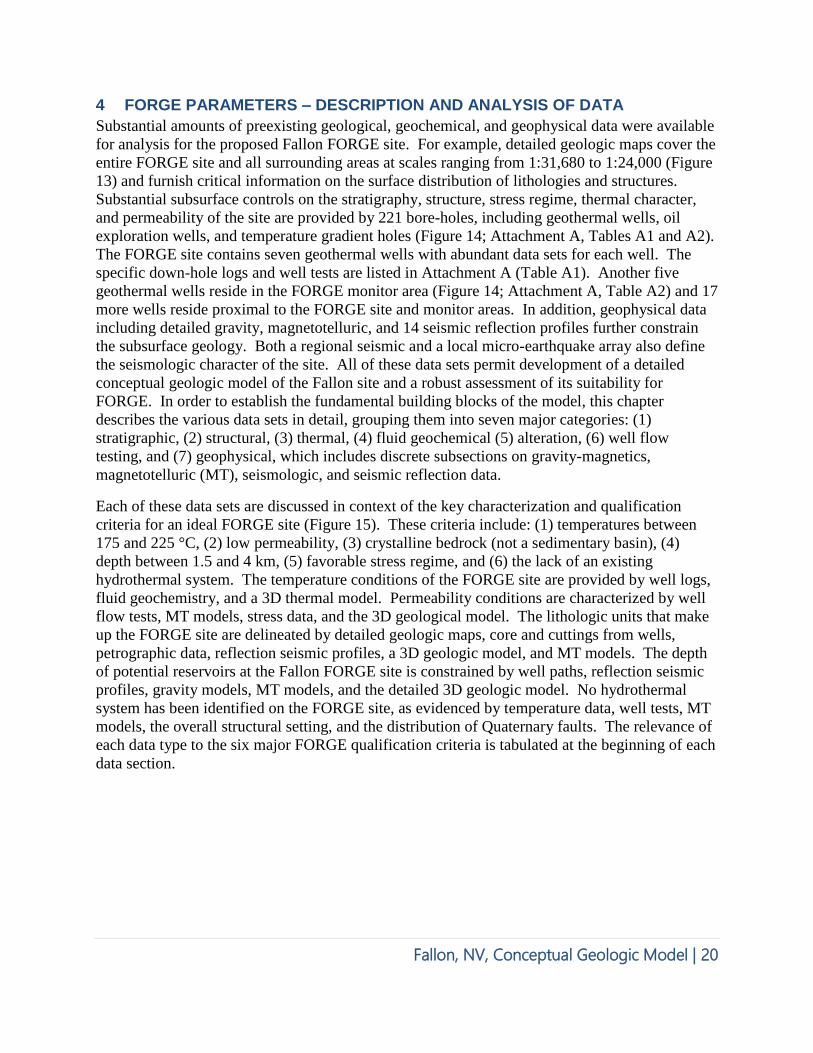
4 FORGE PARAMETERS – DESCRIPTION AND ANALYSIS OF DATA
Substantial amounts of preexisting geological, geochemical, and geophysical data were available
for analysis for the proposed Fallon FORGE site. For example, detailed geologic maps cover the
entire FORGE site and all surrounding areas at scales ranging from 1:31,680 to 1:24,000 (Figure
13) and furnish critical information on the surface distribution of lithologies and structures.
Substantial subsurface controls on the stratigraphy, structure, stress regime, thermal character,
and permeability of the site are provided by 221 bore-holes, including geothermal wells, oil
exploration wells, and temperature gradient holes (Figure 14; Attachment A, Tables A1 and A2).
The FORGE site contains seven geothermal wells with abundant data sets for each well. The
specific down-hole logs and well tests are listed in Attachment A (Table A1). Another five
geothermal wells reside in the FORGE monitor area (Figure 14; Attachment A, Table A2) and 17
more wells reside proximal to the FORGE site and monitor areas. In addition, geophysical data
including detailed gravity, magnetotelluric, and 14 seismic reflection profiles further constrain
the subsurface geology. Both a regional seismic and a local micro-earthquake array also define
the seismologic character of the site. All of these data sets permit development of a detailed
conceptual geologic model of the Fallon site and a robust assessment of its suitability for
FORGE. In order to establish the fundamental building blocks of the model, this chapter
describes the various data sets in detail, grouping them into seven major categories: (1)
stratigraphic, (2) structural, (3) thermal, (4) fluid geochemical (5) alteration, (6) well flow
testing, and (7) geophysical, which includes discrete subsections on gravity-magnetics,
magnetotelluric (MT), seismologic, and seismic reflection data.
Each of these data sets are discussed in context of the key characterization and qualification
criteria for an ideal FORGE site (Figure 15). These criteria include: (1) temperatures between
175 and 225 °C, (2) low permeability, (3) crystalline bedrock (not a sedimentary basin), (4)
depth between 1.5 and 4 km, (5) favorable stress regime, and (6) the lack of an existing
hydrothermal system. The temperature conditions of the FORGE site are provided by well logs,
fluid geochemistry, and a 3D thermal model. Permeability conditions are characterized by well
flow tests, MT models, stress data, and the 3D geological model. The lithologic units that make
up the FORGE site are delineated by detailed geologic maps, core and cuttings from wells,
petrographic data, reflection seismic profiles, a 3D geologic model, and MT models. The depth
of potential reservoirs at the Fallon FORGE site is constrained by well paths, reflection seismic
profiles, gravity models, MT models, and the detailed 3D geologic model. No hydrothermal
system has been identified on the FORGE site, as evidenced by temperature data, well tests, MT
models, the overall structural setting, and the distribution of Quaternary faults. The relevance of
each data type to the six major FORGE qualification criteria is tabulated at the beginning of each
data section.

Fallon, NV, Conceptual Geologic Model | 21
Figure 13. Existing published geologic maps for the Fallon FORGE site and surrounding area.

Fallon, NV, Conceptual Geologic Model | 22
Figure 14. A. Geothermal wells, temperature gradient holes, and oil exploration holes within an ~15 to 20 km radius of the FORGE site. Includes 76 wells and 145 TGHs in total. B. Geothermal wells on the FORGE site
(Attachment A, Table A1), on the FORGE monitor area (Attachment A, Table A2), and in the nearby area (Attachment A, Table A3) with available data listed per well.

Fallon, NV, Conceptual Geologic Model | 23
Figure 15. Major data sets utilized for documenting primary criteria for the FORGE program at the proposed Fallon site.

Fallon, NV, Conceptual Geologic Model | 24
4.1 STRATIGRAPHIC DATA
4.1.1 Surface Lithologic Data
Relevance to FORGE Criteria
Criteria Temperature Low
Permeability
Lithology
(crystalline)
Depth
(1.5-4 km)
Stress
Regime
No
Hydrothermal
System
Relevant
Published detailed geologic maps (Figure 13) define the stratigraphic framework of the Fallon
area and place constraints on the subsurface geology of the proposed FORGE site. The Carson
Sink in the vicinity of the Fallon site is covered by Quaternary deposits, including alluvial and
lacustrine sediments (Morrison, 1964; Bell and House, 2010). A sequence of Quaternary basalt
flows, ranging from 2.5 to 0.7 Ma (Maurer and Welch, 2001; Bell and House, 2010), is
interbedded with the QTs basin fill deposits near the City of Fallon (Figure 16). The base of this
section of basalts is ~180 m deep and provides an approximate local Quaternary/Tertiary marker
in the QTs stratigraphy, indicating that that most of the basin fill sediments are late Miocene to
Pliocene in age. No bedrock units crop out in the proposed site (Figure 17). However, bedrock
is exposed in the Lahontan Mountains to the east (Bell and House, 2010; Bell et al., 2010),
Bunejug Mountains to the southeast (Hinz et al., 2011, 2014), and White Throne Mountains/Lee-
Allen geothermal area to the south (Hinz et al., 2008, 2010). The stratigraphic section exposed
in the Lahontan and Bunejug Mountains consists of ~16 to 12 Ma basaltic andesite lavas and ~12
Ma dacite and rhyolite domes and lava flows interfingering with or capping the upper section of
Miocene mafic lavas. In the Lahontan Mountains the Miocene lavas are locally capped by ~12
to 4 Ma lacustrine sediments, and these late Miocene to Pliocene sediments are locally capped by
~4 Ma basalt flows. Similar to the Lahontan and Bunejug Mountains, a sequence of mafic and
felsic lavas, as well as fluvial-lacustrine sediments spanning ~12 to 5 Ma, is exposed in the
White Throne Mountains south of the FORGE site. The Miocene section locally rests on
Oligocene ash-flow tuffs and Mesozoic basement rocks, including metasedimentary and granitic
rocks in the Lee-Allen area. Mesozoic basement rocks are not exposed in the Lahontan or
Bunejug Mountains. Oligocene ash-flow tuffs are also not exposed in nearby mountain ranges
and have not been observed in cuttings and core at the Fallon site, but they do crop out in the
Lee-Allen area and are encountered in deep wells at Stillwater, about 20 km south and north of
the FORGE site, respectively. The exposures of Jurassic-Cretaceous quartz diorite and tonalite
and Triassic-Jurassic metamorphic rocks at Lee-Allen are the closest outcrops of Mesozoic
basement to the FORGE site. However, widespread exposures of the Mesozoic basement are
found in the Stillwater Range and Sand Springs Range to the east of the Fallon FORGE site.
Data Quality and Uncertainty: The published geologic maps of the area are high quality and
display stratigraphic relations in significant detail for both the Quaternary and bedrock geology.
Typically, contacts on these maps are located within ±10 m or less, thanks to excellent aerial
photo coverage and imagery for the entire area. The first detailed geologic map that covered the
area was by Morrison (1964) at 1:31,680 scale. Morrison focused primarily on the Quaternary
geology but also provided the first stratigraphic summary of the Tertiary volcanic stratigraphy in
the Bunejug and Lahontan Mountains. More recently, detailed 1:24,000 scale maps have been
completed (Figure 13) that include the Grimes Point quadrangle (Bell et al., 2010), Lahontan

Fallon, NV, Conceptual Geologic Model | 25
Mountains quadrangle (Bell et al., 2010), the Bunejug Mountains quadrangle (Hinz et al., 2011),
and the Lee-Allen Geothermal area (Hinz et al., 2010). Stratigraphic relations are nicely
constrained by geochronologic data, including nine 40Ar/39Ar dates from the Lahontan and
Bunejug Mountains (Hinz et al., 2011, 2014, unpublished data) and five additional 40Ar/39Ar
dates from the Lee-Allen geothermal area (Hinz et al., 2010, unpublished data).
Figure 16. Generalized stratigraphic column showing major lithologic units within and proximal to the proposed Fallon FORGE site. Qb-2.5 to 0.7 Ma basalt flows; QTs-late Miocene to Quaternary basin-fill
sediments; Tba, late Miocene-early Pliocene mafic lavas; Tr, ~12 Ma rhyolite lavas; Tvs-Miocene volcanic and lesser sedimentary rocks; Ttr, Oligocene ash-flow tuffs; Mzu-Mesozoic basement undivided.

Fallon, NV, Conceptual Geologic Model | 26
Figure 17. Detailed geologic map of the Fallon FORGE site (from Bell et al., 2010, and Morrison, 1964). The map units consist of middle to late Holocene lacustrine and alluvial sediments. Deep wells that intersect the
Mesozoic basement are shown for reference (purple dots).

Fallon, NV, Conceptual Geologic Model | 27
4.1.2 Well Lithology Data
Data Relevance to FORGE Criteria
Criteria Temperature Low
Permeability
Lithology
(crystalline)
Depth
(1.5-4 km)
Stress
Regime
No
Hydrothermal
System
Relevant
In phase 1 of this project, 14,135 m of core, cuttings, and thin sections of core and cuttings were
reviewed for wells from the Fallon FORGE site and monitor area to refine subsurface controls on
the stratigraphic and structural framework (Figure 18). In addition, ~20,000 m of core and
cuttings were briefly reviewed from publically available data in the surrounding areas. This
information is critical for defining the composition and depth of potential EGS targets at the
Fallon site and evaluating the site for any evidence of ongoing hydrothermal activity. Only three
wells had core available, and none of these had core from the Mesozoic basement. FOH-2 was
cored from 622-1234 m (2041 to 4048 ft) depth, but core was only preserved at 3 m (10 ft)
increments every 15 m (50 feet). Well 18-5 was cored from 107-914 m (352 to 3000 ft) depth,
and well 51-20 was cored from 216-1100 m depth (710 to 3610 ft). For the 18-5 well, 100% of
core is preserved, and a skeletonized sample set of the 51A-20 core is preserved with samples at
<15 m (< 50 ft) intervals. Core was evaluated by hand lens, and cuttings were examined in detail
under a high-power binocular microscope. Petrographic thin sections of core and cuttings were
also available for most wells at ~30 m (100 ft) intervals and were used in tandem with the
physical core and cuttings samples to confirm lithologic data (Figure 19; Table 1).
Within the primary FORGE footprint and designated surrounding FORGE monitor area, four
wells (Figure 18 and Figure 19; wells 61-36, FOH-3D, 82-36, and 84-31) penetrate the entire
Neogene section and terminate in Mesozoic basement. Late Miocene to Quaternary basin-fill
sediments (QTs) are 0.1 to 1.4 km thick and overlie Miocene volcanic and lesser sedimentary
rocks. The volcanic section is 0.7 to 1.1 km thick and is dominated by Miocene basaltic andesite
lavas (Tba). In addition to Tba, five other volcanic units were distinguished within the cuttings
and core, including volcanic breccia (Tvb), lithic tuff (Tlt), dacite (Td), andesite (Ta), and
hornblende andesite (Tha). As evidenced by numerous drill holes, seismic reflection profiles,
and gravity data, the total thickness of the Neogene section ranges from ~1.3 to 2.8 km in the
project area. Overall, the volcanic section remains close to 1 km thick, whereas the Neogene
sediments that sit on top of the volcanic rocks thicken toward the downthrown sides of discrete
half grabens. Based on stratigraphic position and mineralogy, units Tba, Td, Tha, and Tvb all
probably correlate with units mapped in the Bunejug Mountains and Lahontan Mountains (Hinz
et al., 2011; Bell and House, 2010; and Bell et al., 2010). No evidence for recent hydrothermal
activity (e.g., opaline sinter) was identified in samples from the basin-fill sediments.
The Neogene section rests nonconformably on heterogeneous Mesozoic basement, which
consists of low- to medium-grade Triassic-Jurassic metavolcanic and metasedimentary rocks
intruded by granitic plutons of probable Jurassic and/or Cretaceous age (Figure 19). The
Mesozoic units exposed in the wells include plutonic rocks (quartz monzonite, Mzqm),
metasedimentary rocks (quartzite, Mzq; and marble, Mzm), and metavolcanic rocks (ash-flow
tuffs and volcaniclastic sediments, Mzt; felsic volcaniclastic sediments and altered basaltic
andesite lavas, Mazba). The metavolcanic and metasedimentary rocks are locally contact

Fallon, NV, Conceptual Geologic Model | 28
metamorphosed and/or hydrothermally altered, probably as a result of intrusion by one or more
plutons. The highly altered basement units were logged as undivided metamorphic rocks
(Mzum), because the parent lithology could not be confirmed through petrography or evaluation
of the cuttings under high-power binocular microscope. All of these units are intersected by
deep geothermal wells directly south of the FORGE area in the Carson Sink and southeast in the
Salt Wells basin area (Figure 20).
In order of decreasing abundance, major lithologies in the Mesozoic basement include: (1)
metamorphosed felsic ash-flow tuff, (2) meta-basaltic andesite, (3) quartzite, (4) granite, (5)
slate, and (6) marble. The metamorphosed ash-flow tuff may correlate with the ~225± 30 Ma
Rochester Rhyolite (McKee and Burke, 1972; Vikre, 1997), a regionally extensive unit that is
well exposed in the Humboldt Range ~100 km to the north of the FORGE site. Overall, the
Mesozoic units are typical of much of western Nevada and formed in the back-arc region of the
Sierran arc (e.g., Oldow, 1984; Busby-Spera, 1988; Lutz and Hulen, 2002; Figure 20 and Figure
21).
Data Quality and Uncertainty: For wells with complete or partial core, including 18-5 and
FOH-1, respectively, the depths to unit contacts are very accurate, consistently <3 m (10 ft). For
wells with cuttings, the accuracy of depths of Cenozoic unit contacts are mostly ± 3 m (10 ft) and
locally ± 6 to 10 m (20 to 33 ft). The accuracy of depths of Mesozoic unit contacts recognized
through cuttings are mostly ± 3 m (10 ft) and locally ± 15 m (50 ft). The areas with the largest
error margin involve accurately defining the Cenozoic/Mesozoic nonconformity, where it
consists of altered Tertiary volcanic rocks in depositional or fault contact with altered Jurassic-
Triassic metavolcanic rocks. Locally, the nonconformity is defined by altered Tertiary mafic
lavas resting on altered metamorphosed mafic lavas, or altered Tertiary tuffs against altered
Mesozoic meta-tuffs. In these areas, petrographic data were closely evaluated to analyze subtle
differences in primary and secondary mineralogy. Accuracy for these intervals typically ranges
from ± 30 to 60 m (100 to 200 ft).

Fallon, NV, Conceptual Geologic Model | 29
Figure 18. Moderate to deep geothermal wells on the FORGE site, FORGE monitor area, and nearby region with cuttings or core available for evaluation. All wells on the FORGE site and FORGE monitor area were
reviewed in detail. Wells in the surrounding region were reviewed more generally, with a focus on the depth to basement and on distinguishing the basement lithologies.

Fallon, NV, Conceptual Geologic Model | 30
Table 1. Unit descriptions from wells at the FORGE site and FORGE monitor area (Figure 19)
Unit Name Description
Cenozoic
QTs Sediments
Light to medium gray silt to coarse sand, rounded grains of quartz, lithic fragments, feldspars, micas, and
clay (ordered from most to least abundant) in a clast-dominated, carbonate cemented lithic sandstone.
Uncommonly interlayered with reworked tuffs. Rarely altered to clays and chlorite. Miocene to Holocene in age.
Tvb Volcanic breccia Poly-lithologic, sub-rounded to sub-angular clast-dominated breccia. Mafic volcanic clasts include
porphyritic, aphanitic, or vesicular basaltic andesite. Clast size ranges from 1 mm to 10 cm. Probable Miocene age.
Tlt Lithic tuff Medium to dark gray tuff with sparsely dispersed lithic fragments (locally reworked as a mudflow deposit)
are within a commonly crystal rich matrix. Miocene.
Td Dacite Light gray, weakly vesicular, sparsely porphyritic (<5% of crystals are porphyritic acicular hornblende crystals) dacite; sparse biotite in some flows. Probable Miocene age and correlates with dacite mapped in
the southwest corner of the Lahontan Mountains quadrangle (Bell et al., 2010). Age is probably ~12 Ma.
Ta Andesite Medium gray, sparsely porphyritic andesite with phenocrysts of pyroxene up to 1 mm long. Groundmass
is aphanitic and glassy. Probable Miocene age.
Tha Hornblende
andesite
Light gray porphyritic hornblende andesite with 1-2 mm hornblende and plagioclase crystals in an
aphanitic, glassy matrix. May correlate with Tha mapped in the northwest corner of Bunejug Mountains
quadrangle, where Tha is locally interbedded in the upper part of the ~16 to 12 Ma section of Tba (Hinz et al., 2011).
Tba Basaltic andesite
Dark gray aphanitic and locally sparsely porphyritic basaltic andesite. Phenocrysts include mostly
plagioclase and lesser olivine and pyroxene. Chlorite, calcite and clay alteration is fairly common with
trace epidote and pyrite alteration. Quartz and calcite veins distributed sparsely throughout this unit. Unit correlates with Tba exposed in the Bunejug Mountains and Tb at Rainbow Mountain; both outcrops dated
at ~16 to 12 Ma (Hinz et al., 2011, 2014, unpublished data; Bell et al., 2010).
Mesozoic
Mzqm Quartz
monzonite
White, fine- to medium-grained quartz monzonite. Weak to moderate chlorite alteration with calcite and
trace prehnite in voids. Jurassic-Cretaceous. Numerous Jurassic to Cretaceous granitic intrusions in southern Stillwater and Sand Springs Ranges to east. Other nearby granitic outcrops, as at Lee-Allen
geothermal area, have not been dated, but are probably broadly correlative.
Mzum Metamorphics
undivided
Interlayered white to light gray quartzite, white marble, and tan to buff micaceous schist. Quartzite, the most common lithology, is fine-grained and weakly annealed. Marble, of moderate abundance, has minor
component of quartz in calcareous dominated matrix. Trace schist with moderate to strong foliation from
muscovite. Mzum is highly altered, possibly due to hydrothermal alteration and/or contact metamorphism in Mesozoic related to granite intrusion. Alteration locally increases near granite. Triassic- Jurassic.
Mzq Quartzite White to pale green quartzite with chlorite-pyrite alteration. May correlate with Jurassic Boyer Ranch
quartzite in Stillwater Range (Speed and Jones, 1969).
Mzqaba
Interlayered
quartzite and
meta-basaltic
andesite
White to light gray quartz, with trace interstitial calcite, weakly annealed quartzite interlayered with green-gray to brown weakly porphyritic altered basaltic andesite. Trace pyrite is disseminated in quartzite, and
basaltic andesite has significant clay alteration as well as chlorite overprinting groundmass. Jurassic.
Mzaba Meta-basaltic
andesite
Gray-green, aphanitic to fine-grained basaltic andesite, moderately to highly altered to clay and chlorite. Some sections are mottled red to purple color. Less commonly epidote and pyrite as alteration minerals.
Jurassic in age.
Mztba
Interlayered
metamorphosed
tuff and meta-
basaltic andesite
Pale green, gray, and red mottled ash-flow tuff, glassy matrix with trace to 0.5% pyrite and chlorite. Ash
layers <3 m (10 ft) thick and interlayered with aphanitic basaltic andesite flows with olivine and plagioclase
groundmass. Triassic-Jurassic.
Mzsba
Interlayered slate
and meta-basaltic
andesite Very fine-grained, dark gray, moderately foliated, locally carboniferous slate interlayered with dark gray
to brown weakly porphyritic plagioclase rich basalt. Triassic to Jurassic in age.
Mzt
Meta-ash-flow
tuffs and
volcaniclastic
sediments
Light gray-green, pale red and/or maroon fine-grained, generally non-welded, weakly metamorphose ash-
flow tuffs. Lithic fragments as well as porphyritic crystals of plagioclase and quartz common in a
microcrystalline groundmass. Chlorite, clay, and trace epidote alteration is common. Triassic to Jurassic
in age.
Mzm Marble White to light gray quartz-bearing marble. Triassic to Jurassic in age.

Fallon, NV, Conceptual Geologic Model | 31
Figure 19. Lithologies of the 8 deepest wells on the Fallon FORGE site and the surrounding monitor area (Figure 18). In this figure, depth corresponds to well path distance, not true vertical depth. All available cuttings, core, petrographic thin sections of cuttings and core, and down-hole logs for these wells were
reviewed in Phase 1 of this project. Detailed unit descriptions are in Table 1.

Fallon, NV, Conceptual Geologic Model | 32
Figure 20. Cenozoic and Mesozoic stratigraphy of all wells at Fallon FORGE and in the immediate surrounding area that penetrate the entire Cenozoic section and terminate in the Mesozoic basement.

Fallon, NV, Conceptual Geologic Model | 33
Figure 21. Regional geologic map of the Carson Sink area highlighting the distribution of known Mesozoic basement lithologies exposed in ranges and intersected by deep geothermal wells. The base map is
simplified from Stewart and Carlson (1978). Red stars correspond to known geothermal areas with basement characterized from outcrops and/or deep wells. Labels: BJ, Bunejug Mountains; HSM, Hot Springs
Mountains; LM Lahontan Mountains; WM, White Throne Mountains. References noted in this figure: 1Barton et al., 2000; 2Benoit et al., 1982; 3Buer and Miller, 2010; 4Dilek and Moores, 1995; 5Hinz et al., 2013b; 6Ernst et al., 2008; 7Garg et al., 2015; 8Hinz et al., 2014; 9Hinz et al., 2008; 10Hinz et al., 2010; 11John, 1995b; 12John and Silberling, 1994; 13Lutz and Hulen, 2002; 14Lutz et al., 2010; 15McLachlan, personal communication; 16UNR,
1962; 17Oldow, 1984; 18Sadowski, personal communication; 19Speed, 1974; 20Speed and Jones, 1969; 21Satterfield, 2002; 22Willden and Speed, 1974; 23Wyld, 2002.

Fallon, NV, Conceptual Geologic Model | 34
4.1.3 Petrographic Data
Relevance to FORGE Criteria
Criteria Temperature Low
Permeability
Lithology
(crystalline)
Depth
(1.5-4 km)
Stress
Regime
No
Hydrothermal
System
Relevant
Numerous thin sections exist for cuttings and core of samples from FORGE site wells, wells on
the monitor areas, and bedrock units exposed in nearby areas analyzed and mapped by Hinz et al.
(2008, 2010, 2011, 2014). These include 431 thin sections from wells and 96 thin sections from
surface outcrops in the Lahontan Mountains, Bunejug Mountains, Cocoon Mountains, and the
Lee-Allen geothermal area (Figure 13 and Table 2). Petrographic data are necessary for refining
the lithology and depth of potential EGS targets, as well as for characterizing hydrothermal
alteration and history. Most of the preexisting thin sections available from the FORGE area
wells were reviewed to confirm and/or modify the original lithologic logs, so that accurate
lithologic data would be available for comparison against 2D seismic profiles, MT profiles,
gravity inversions, and for constructing the 3D geologic model. In addition, no petrographic
evidence was found for recent geothermal activity. The petrographic data are summarized in the
preceding well lithology section of this report. Many of the thin sections of core and cuttings
from the FORGE site wells have been previously described in detail with a specific focus on
alteration mineralogy (Jones and Moore, 2013), and these results are summarized in the
alteration section of this report.
Thin sections were also available from previously completed detailed geologic mapping in
nearby areas to the south and east of the FORGE site. Thin sections form these areas have
previously been used to confirm lithologic map units and for selecting unaltered samples for
40Ar/39Ar dating. Multiple thin sections exist for the Mesozoic granitic and meta-sedimentary
units exposed at the Lee-Allen geothermal area, the closest surface outcrop of Mesozoic
basement units to the Fallon FORGE area (Figure 1).
Data Quality and Uncertainty: The manufacturing of thin sections was high quality in all cases,
both for samples from surface outcrops, core, and from cuttings. In the case of cuttings, there is
nearly always a small percentage of contamination, typically <1-5% of exotic cuttings that fall
down the well bore into any given sample interval. During evaluation of the cuttings in thin
section or under a binocular microscope, it is usually easy to identify the exotic chips and focus
the analysis on the in situ lithology.

Fallon, NV, Conceptual Geologic Model | 35
Table 2. Thin-section inventory of core and cutting samples
Well or Map Area Number of Thin
Sections
Depth Range (ft) Depth Range (m) Approx.
Interval (ft)
Approx.
Interval (m)
FOH 3D 87 70 - 8950 21 - 2728 100 31
82-36 100 160 - 9490 49 – 2893 95 29
84-31 62 100 - 5900 30 – 1798 95 29
18-5 29 358 - 3000 109 – 914 95 29
61-36 72 130 - 6970 40 - 2125 100 31
88-24 50 110 - 5910 34 – 1801 100 31
FDU-2D 31 1540 - 4500 469 - 1372 100 31
Bunejug and Cocoon
Mountains
54 Surface Outcrops Surface Outcrops N/A N/A
Lahontan Mountains 5 Surface Outcrops Surface Outcrops N/A N/A
Lee-Allen Geothermal
Area
37 Surface Outcrops Surface Outcrops N/A N/A
Note: Data were gleaned from wells and from nearby detailed geologic mapping (Jones and Moore, 2013; Hinz et al., 2010, 2011, unpublished mapping).
4.2 STRUCTURAL DATA
4.2.1 General Structural Setting
Relevance to FORGE Criteria
Criteria Temperature Low
Permeability
Lithology
(crystalline)
Depth
(1.5-4 km)
Stress
Regime
No
Hydrothermal
System
Relevant
Permeability, stress regime, and likelihood of discovering an active hydrothermal system are
critical parameters for developing a successful FORGE and are all strongly dependent on the
overall structural setting of an area (e.g., Curewitz and Karson, 1997; Faulds et al., 2011; Faulds
and Hinz, 2015). Detailed geologic maps, fault-slip data, and well-bore imaging collectively
provide a comprehensive data set with which to evaluate the structural setting of the Fallon
FORGE site. The structural framework within and surrounding the proposed Fallon FORGE site,
including the Carson Sink and bounding mountain ranges to the northwest, north, and east, is
characterized by northerly striking normal faults and gently to moderately tilted fault blocks
(Figure 12). The southwestern margin of the Carson Sink is probably bound by strands of the
Walker Lane dextral shear zone. The Carson Sink itself is largely composed of a series of half
grabens containing as much as 3 km of basin-fill sediments. In contrast to parts of the northern
Carson Sink (Faulds et al., 2015) and the neighboring Bunejug Mountains and Lee-Allen area
(Hinz et al., 2008, 2011, 2014), the structural setting of the southeastern Carson Sink in the
vicinity of the FORGE site appears to be relatively simple, with no major basin-bounding faults
and a paucity of mapped faults. The apparent lack of structural complexity, lack of Quaternary
faults, and absence of a favorable structural setting for geothermal activity (Figure 10; e.g.,
Faulds et al., 2011) in this area indicate that a hydrothermal system is unlikely, thus satisfying an
important criteria for the FORGE site.

Fallon, NV, Conceptual Geologic Model | 36
In the subsections below, we describe the geometry and kinematics of observed faults in the area,
as gleaned from detailed geologic maps to the east and south, and then discuss the stress regime,
as defined by borehole imaging of drilling-induced fractures and inversion of fault-kinematic
data from nearby bedrock exposures. As discussed in subsequent sections, detailed gravity
surveys and 14 seismic reflection profiles help to further constrain the structural setting,
demonstrating that a gently west-tilted half graben cut by widely spaced normal faults underlies
the entire FORGE site (Figure 12 and Figure 22).
4.2.2 Geometry and Kinematics of Faults
Relevance to FORGE Criteria
Criteria Temperature Low
Permeability
Lithology
(crystalline)
Depth
(1.5-4 km)
Stress
Regime
No
Hydrothermal
System
Relevant
The structural framework of rock units, including the age, geometry, density, and kinematics of
faults, greatly affects the mechanical properties of rocks and significantly affects both fluid flow
and the response to hydraulic stimulation (e.g., Genter et al., 2010). In the Fallon region
northerly striking normal faults dominate and bound gently to moderately tilted fault blocks, as
exemplified by excellent exposures in nearby mountain ranges (Hinz et al., 2010, 2011). The
Lahontan and Bunejug Mountains region directly east of the FORGE site contain two prominent
east-dipping faults, the ~25 km-long Rainbow Mountain fault zone and the ~15 km-long
Fourmile Flat fault zone (Figure 12). In addition, numerous north-northwest- to north-northeast-
striking normal faults with 10s to 100s of meters of displacement cut the Mio-Pliocene strata in
these ranges. These normal faults comprise multiple dip domains throughout the region, yielding
several accommodation zones (cf., Faulds and Varga, 1998), including three extensional
synclines, two extensional anticlines, and one transverse zone (Figure 12). The Fallon FORGE
site lies on the western limb of an anticlinal accommodation zone, the axis of which is exposed
in the western Bunejug and Lahontan Mountains. The extensional syncline in the Bunejug
Mountains is reflected by the distribution of poles to layering in the Miocene volcanic bedrock
(Figure 23). The extensional fold axis trends N17°E, consistent with a WNW-trending extension
direction in the area. The eastern limb of the syncline has fewer data points, because much of the
bedrock in this structural domain is concealed by Quaternary surficial deposits.
Most of the north-northwest- to north-northeast-striking faults in the Lahontan and Bunejug
Mountains have accommodated dip-slip normal or nearly pure normal slip (Figure 24),
indicating a west-northwest-trending extension direction (Hinz et al., 2014). However, the 1954
historic rupture of the north-striking Rainbow Mountain fault zone had a dextral component of
up to 1 m (strike-slip magnitude dominated over normal slip). Analysis of slip data collected
from exposed fault surfaces in the Bunejug Mountains along the Rainbow Mountain fault zone
indicate that episodic dextral slip has been accommodated by this fault zone throughout its
history. However, cumulative dextral slip relative to normal slip is probably very small (Hinz et
al., 2014).
In addition to the published geologic maps, high resolution Q1 quality LiDAR data and 1:12K
scale, low sun-angle aerial photos have previously been collected over the area to evaluate for

Fallon, NV, Conceptual Geologic Model | 37
potential Quaternary fault scarps. There are no documented Quaternary faults on the proposed
Fallon FORGE site or in the proposed NASF/Ormat FORGE monitor area (Calvin et al., 2012).
In addition to the 1954 earthquake, the Rainbow Mountain fault zone, ~10 km east of the
proposed Fallon FORGE area, ruptured two other times in the past ~20,000 years (Caskey et al.,
2004). A small Quaternary fault segment ~0.5 km long occupies the west-northwest part of the
Bunejug Mountains quadrangle (Hinz et al., 2011) and sits ~7-8 km southeast of the proposed
Fallon FORGE site.
Data Quality and Uncertainty: The distribution of Quaternary fault activity across the four
1:24K scale map areas, including coverage of the FORGE site, was evaluated with Q1 quality
LiDAR data and/or 1:24K scale, low sun-angle aerial photos. Thus, Quaternary faults are
located with a high level of precision and very low uncertainty for the entire area (±10 m or less).
Older faults cutting bedrock units in the nearby mountain ranges are generally located within
±10-30 m.
Figure 22. East-west geologic cross section across the proposed Fallon FORGE site. Margins of site are shown by dashed red lines. Location of cross section is shown in Figure 12.

Fallon, NV, Conceptual Geologic Model | 38
Figure 23. Equal-area stereographic projections of poles to bedding and layering of Miocene strata exposed in the Bunejug Mountains quadrangle (Hinz et al., 2011, 2014, unpublished data). Data points shown by black
dots. n = number of data points. Kamb contour intervals at 2 sigma, 2.4% of the area. Two clusters reflect extensional folding, with loci at ~N3°E, 27°E and ~N26°E, 24°W. Fold axis derived from cylindrical best fit =
trend N17°E, plunge 6°; significance = 3 sigma.

Fallon, NV, Conceptual Geologic Model | 39
Figure 24. (A, B, C) Lower hemisphere stereographic projection of great circles of exposed faults in the Bunejug Mountains quadrangle (Hinz et al., 2011, 2014, unpublished data). n = number of data points.
Arrows indicate slip directions inferred from striae and other kinematic indicators (e.g., Riedel shears). PBT axis diagrams, showing the orientations of principal strain axes for each measured fault. Large symbols are mean vectors to all P, B and T axes and represent the strain field. R-squared values of 88%, 86%, and 82%,
respectively for the P, B, and T axes in group C. (D) Histogram comparing angle of the measured versus calculated shear strain within the fault plane. Angles <15 to 20° generally correspond to a single stress field
(e.g. Sippel et al., 2009). (E) Mohr’s circle plot, stress ratio R = 0.45, which is typical of dominantly pure extensional versus transtensional or strike-slip.

Fallon, NV, Conceptual Geologic Model | 40
4.2.3 Stress Regime
Relevance to FORGE Criteria
Criteria Temperature Low
Permeability
Lithology
(crystalline)
Depth
(1.5-4 km)
Stress
Regime
No
Hydrothermal
System
Relevant
Detailed knowledge of the stress regime, combined with data on the strength parameters of rock
units and spacing and orientation of fractures and faults, will help to guide EGS experiments and
allow for predictive analysis of the results (e.g., Moeck et al., 2009; Davatzes and Hickman,
2009, 2010). The local stress regime for the Fallon FORGE site was determined through
previous studies (Blake and Davatzes, 2012; Blake et al., 2015) focusing on (1) the analysis of
geophysical image log data for wells FOH-3D, 61-36, 86-25 and 88-24 (Figure 3; Appendix A);
and (2) inversion of fault slip data from the Bunejug Mountains area directly east of the site,
which includes the Salt Wells geothermal field. The nature of the stress regime is one of the
most critical factors governing the mechanical response of rock units to hydraulic stimulation.
Well-Bore Imaging: In previous studies, image logs from these four wells were analyzed using
the software WellCAD to map the orientation of natural fractures and bedding orientation along
with drilling induced structures, such as breakouts, petal-centerline fractures, and tensile
fractures (Figure 25 and Figure 26; Table 3; Blake and Davatzes, 2012; Blake et al., 2015).
These induced structures result from concentration of normal stress acting tangentially to the
borehole wall, with the enhancement of compression or tension generating breakouts and tensile
fractures, respectively. Petal-centerline fractures form below the drill bit during drilling due to a
stress concentration that creates tension tangential to the wellbore floor (Li and Schmidt, 1999;
Davatzes and Hickman, 2010; Garza-Cruz and Davatzes, 2010).
Analysis of these data was performed in MATLAB using custom scripts (Blake and Davatzes,
2012; Blake et al., 2015). Both FOH-3D and 61-36 terminated within the depth range (>1.5 km)
and lithology (Mesozoic basement) that fall within the FORGE criteria. Data are available from
both the Cenozoic and Mesozoic sections. Wells 88-24 and 86-25 terminated in the Cenozoic
stratigraphy and did not reach the Mesozoic basement. Analyses from all wells provide
components for characterization of the local stress state in 3D space within the FORGE site
(Figure 25).
Table 3. Structural and Stress Data Derived from Image Logs
Exploration Hole 88-24 86-25 61-36 FOH-3D
Image Log Type UBI FMI FMI FMS, ABI
Depth analyzed in feet (meters) 2710-5010 (826-
1527)
1525-3050
(465-930)
2570-7025 (783-
2141)
6463-8950(1970-
2728)
Fracture Orientation (avg) 001 025 015 010
Fracture Dip (avg) 77.5 62.9 65.5 59.5
Bedding Orientation (avg) 001 025 015 015
Bedding Dip (avg) 65.9 68.4 55.3 56.2
SHmax Orientation (avg) 005±26 026±25 021±28 007±12

Fallon, NV, Conceptual Geologic Model | 41
The stress heterogeneity of the volume pierced by the wellbore is demonstrated in Figure 26. The
three types of induced structures are represented in each well and were used to calculate the
orientation of minimum horizontal stress. By aligning the induced structures, the stress
heterogeneity with depth is easier to visualize. FOH-3D and 61-36, the two wells that meet the
requirements for FORGE both in depth to basement and temperature have different distributions
of induced structures. The induced structures in FOH-3D fall tightly around the calculated
minimum principle horizontal stress within the crystalline rock. As depth increases with the 61-
36 data, the induced structures collapse around the mean minimum principal stress orientation
roughly within the bottom 300 m that intersect this same crystalline rock. Although the variation
in stress is smaller within the crystalline rock, it is still present. Overall, the slight variations
(~20o) found in these data sets, whether in the fracture strike orientation or in the maximum
horizontal stress orientation, will be useful for predictive analysis of future stimulation of an
EGS reservoir at the Fallon FORGE site. Some heterogeneity in fracture and stress orientation
results in an increase in the range of optimally-oriented fractures over the depths analyzed.
The strike orientations of the natural fractures calculated from the image logs appear to correlate
with the overall structural setting in this portion of the Carson Sink. The average strike of
fractures is ~013˚, and the average maximum horizontal stress is 015˚ (Figure 25). Within this
part of the Basin and Range province, the predominant strike of normal faults is ~N-S to NNE,
and the current extension direction trends WNW. Thus, the findings from the image logs are
compatible with the regional geologic setting (Figure 10). Figure 27 shows that the SHmax
orientations calculated for the Fallon FORGE site are also very similar to that determined for
several geothermal fields in the area.

Fallon, NV, Conceptual Geologic Model | 42
Figure 25. On the left are the contoured poles to planes of the fractures mapped within the image logs of the four wells analyzed and on the right are rose diagrams of fracture strikes that were mapped from these same
data.
As described above, a great amount of work had previously been completed to determine the
principal stress orientations at NASF by mapping natural and induced structures within image
logs from the 88-24, FOH-3D, 61-36, and 86-25 wells and analyzing those mapped structures.
Throughout the Basin and Range province, including the Carson Sink region, principal stress
orientations have also been acquired through focal mechanisms, in-situ stress measurements
(e.g., Hickman et al., 2000; Davatzes and Hickman, 2010), fault slip data (Bellier and Zoback,
1995), alignments of volcanic structures (Zoback et al., 1989), and geodetic measurements of
strain (Bennett et al., 2003; Hammond and Thatcher, 2004; Kreemer et al., 2009) as a way to
thoroughly understand the extensional setting and the state of stress (Figure 27). Detailed stress

Fallon, NV, Conceptual Geologic Model | 43
information from geothermal systems are helpful for development of a field, particularly in
locating wells and predicting reservoir response to pressure changes due to injection and/or
production activities (Barton et al., 1997; Curewitz and Karson, 1997; Heffer, 2002; Davatzes
and Hickman, 2009; Faulds et al., 2006). Recent work by Siler et al. (2016b) at the Brady’s
geothermal field synthesized the stress state, orientations, interactions, and likelihood to dilate or
slip of faults in order to visualize the areas within the field most useful to target for geothermal
fluid flow. Within the potential EGS system at Fallon, a complete understanding of stress state,
the structural setting, and the heterogeneity of the principal stresses is an important tool for
constraining the interaction of fractures during stimulation and the orientation that these fractures
will dilate, slip, and grow (Rutledge et al., 2004).
Figure 26. Mapped induced structures with depth along each of the studied boreholes with the calculated minimum horizontal stress based on these data. The stress heterogeneity decreases with depth, but the
stress does continue to vary within the crystalline rock (deeper than ~1800 m). X-axis in degrees.

Fallon, NV, Conceptual Geologic Model | 44
Figure 27. SHmax orientations shown by red lines with error margins shown by blue lines (modified from Blake and Davatzes, 2012; Blake et al., 2015). Data are plotted for all depth ranges in measured well bores. Data derived from the following for individual geothermal fields: Desert Peak, wells 23-1 (Robertson-Tait et al., 2004) and DP 27-15 (Davatzes and Hickman, 2009; Hickman and Davatzes, 2010); Brady’s (Moos et al.,
unpublished data); Dixie Valley (Barton et al., 1998; Hickman et al., 2000 and references therein); and Fallon (Blake and Davatzes, 2012).
Inversion of Fault-Slip Data: Previous studies on strain data and the inferred stress conditions in
the Bunejug Mountains and Salt Wells geothermal area complement the stress analyses from
well data at the Fallon FORGE site and include summaries of bedding attitudes, extensional fold
axes, fault kinematics, and vein orientations (Hinz et al., 2011, 2014, unpublished data). Fault
surface exposures in Miocene bedrock included a range of north-northwest- to east-northeast-
striking fault segments, and both west- and east-dipping fault populations (Figure 24a, Hinz et
al., 2011, 2014, unpublished data). Slip azimuths cluster into two primary sets, one indicating
approximate east-west extension and the other indicating north-south oriented dextral-oblique to
pure strike-slip motion on pre-existing normal faults (Figure 24b, c). Stress inversions of these
data for the extensional set indicate a vertically oriented maximum principle stress (σ1) and a
least principle stress (σ3) trending west-northwest (Figure 24b). The distribution of strain axes
in group (B) is generally consistent with a single stress field orientation (Figure 24d). The
results of analysis of the normal displacement group (B) are P= σ1, B= σ2 and T= σ3.
P=σ1=205°/82°; B= σ2=010°/08°; T= σ3=100°/02° (trend/plunge). The T-axis is the extension
direction, which trends N80°W.
Stress inversion of the kinematic data for the dextral slip data (Figure 24c, Hinz et al., 2011,
2014, unpublished data) indicate subhorizontal orientations for σ1 and σ3. These orientations are
similar to the derived focal mechanisms of the 1954 Rainbow Mountain and Dixie Valley
earthquakes (Doser, 1986), and to the results of stress-inversions of kinematic data collected
along the 1954 fault scarps in the central Nevada seismic belt (Caskey et al., 1996, 2004). The

Fallon, NV, Conceptual Geologic Model | 45
Rainbow Mountain fault zone is dominantly a normal-slip structure. However, the data from
fault surfaces collected in the bedrock exposures in the Bunejug Mountains area and from the
1954 faults indicate episodic dextral slip along north-northwest- to northeast-striking normal
fault segments. This pattern may characterize other key faults in the central Nevada seismic belt,
such as the Fairview Peak fault zone.
Silica veins in outcrops of Miocene bedrock and silicified late Quaternary sediments provide
additional data from which stress orientations have been inferred (Hinz et al., 2014, unpublished
data). Silica veins in the bedrock were only observed near silicified sediment and in areas of
hydrothermally altered bedrock, generally within the modern-day thermal anomaly at Salt Wells.
Figure 28 shows poles to planes of 28 veins. They have an average strike of N9°E and dip of
80°E. The average orientation of the silica veins implies a least principle stress (σ3) trending
N81°W, and along with bedding attitudes and fault slip data, collectively support a WNW-
trending extension direction in the Salt Wells-Bunejug Mountains area. These relations are
compatible with the stress orientations garnered from well-bore imaging at the Fallon FORGE
site.
Figure 28. Equal-area stereographic projections of density contour of poles to silica veins cutting Miocene bedrock and Quaternary sediments from the Salt Wells geothermal area (Hinz et al., 2011, 2014, unpublished
data). Kamb contour intervals = 2 sigma, 23.7% of the area. Mean attitude = N9°E, 80°SE; significance = 3 sigma.
Data Quality and Uncertainty: The fracture and stress data were calculated from structures
mapped from geophysical images of the borehole walls, and with these data comes certain
assumptions and uncertainties (Figure 26). Imaging of different geophysical properties and lack
of complete wellbore coverage introduce uncertainties within the data set. However, the
compilation of four detailed fracture and stress datasets provides overlap of these uncertainties.
In boreholes generally 1-5 km in depth, it is reasonable to assume that one principal stress is
vertical, consistent with Andersonian fault mechanics theory (Anderson, 1951). If the borehole
deviates less than 12°-15° from this stress direction, the azimuth of breakouts corresponds to the
azimuth of Shmin, the azimuth of tensile fractures to SHmax (Peska and Zoback, 1995), and the

Fallon, NV, Conceptual Geologic Model | 46
average of petal centerline fractures to the azimuth of Shmin (Davatzes and Hickman, 2010;
Garza-Cruz and Davatzes, 2010 and references therein). All of the lengths of wells analyzed
were less than 15° deviated.
Lastly, the image quality of the data sets can introduce uncertainty. All of the data sets analyzed,
however, had relatively good quality images of the recorded geophysical properties. Throughout
analysis, the quality of the data set was given a ‘1’ to ‘3’ ranking for each structure, which varied
based on the type of log analyzed and the mapped feature. This basis for uncertainty was
described in Blake and Davatzes (2012) and provided a measurement of relative uncertainty for
these analyses. A ‘1’ feature has very low uncertainty, whereas a ‘3’ feature has very high
uncertainty.
The primary uncertainty in the fault-slip data is the age of faulting. Many of the faults and veins
cut only Miocene strata and thus may reflect a preexisting stress field. However, data from faults
and veins cutting Miocene strata show no statistical difference from those cutting Quaternary
deposits. In addition, the inferred stress directions from the fault-slip data is very similar to that
derived from the borehole imaging. This suggests that the fault-slip data primarily reflect a
relatively recent stress field. We should also note that the derived stress orientations from fault
surface data have R-squared values of 88%, 86%, and 82%, respectively for the P, B, and T axes
(Figure 24b). R-squared is the fraction by which the variance of the errors is less than the
variance of the dependent variable. An R2 of 1 indicates that the regression line perfectly fits the
data, whereas an R2 of 0 indicates that the line does not fit the data at all. Generally, at least a
50% R-squared value is needed to validate regression models. The poles to bedding and poles to
silica veins were contoured with Kamb contour methodology. The Kamb contour method
employs a variable counting circle size that varies as a function of the number of data points.
Kamb contours can be advantageous to 1% area plots for data sets that have n < 100 or for data n
> 100 and that have moderate to high scatter. Cylindrical best fit of poles to bedding and
average pole to silica vein attitudes are both calculated at 3 sigma, and this error estimate clearly
confines the estimate of least principal stress to an orientation of about N80°W.
4.3 THERMAL DATA
Relevance to FORGE Criteria Criteria Temperature Low
Permeability
Lithology
(crystalline)
Depth
(1.5-4 km)
Stress
Regime
No
Hydrothermal
System
Relevant
Temperature data are absolutely critical for evaluating the suitability of a site for FORGE, as
relatively high temperatures (175-225oC) between 1.5 and 4 km are required for the site.
Abundant temperature data are available across the Fallon FORGE site and surrounding area
from 136 (combined count) temperature gradient holes and geothermal wells (Figure 29).
Temperature logs are available for all moderate to deep wells on the FORGE site and for most of
the wells in the surrounding area. Full profile equilibrated temperature logs are available for all
temperature gradient holes drilled post-2000 and for more than half of the wells drilled from the

Fallon, NV, Conceptual Geologic Model | 47
1970s through the 1990s. Maximum down-hole temperature data are available for the older
temperature gradient holes that do not have the full incremental temperature profiles preserved.
Geothermal exploration in the southeast portion of the Carson Sink has been ongoing since 1973,
when Phillips Petroleum initiated a drilling program that included 28 shallow gradient holes. In
total, about 60 temperature gradient holes were drilled in the area during the 1970s and 1980s
between Phillips Petroleum, Anadarko, Hunt Oil, the Navy GPO, and the USGS (Bruce, 1979;
Trexler et al., 1981; Katzenstein and Bjornstad, 1987; Benoit, 1990; Combs et al., 1995; Ross et
al., 1996; Desormier, 1997). This early work identified a prominent shallow thermal anomaly ~5
km long, elongate north-northeast, transecting the southeast part of the Ormat lease area, and
became known as the Carson Lake geothermal prospect (Benoit, 1990). The locus of this
anomaly lies ~3 km southeast of the southeast corner of the FORGE site (Figure 12 and Figure
29). The temperature gradient well with the greatest thermal gradient is TGH-6, which was
drilled to a 50 m depth, had a bottom-hole temperature of 77°C, and remains open and flowing
today. Silica and cation geothermometry from fluids collected in TGH-6 indicate apparent
equilibration temperatures of ~140°C (Figure 29; see section 4.4). In 1981, Unocal drilled
vertical slim hole 72-7 one km east of TGH-6 to 881 m total depth and recorded a maximum
down-hole temperature of 131°C. At the time petroleum companies were primarily interested in
resources >100 MWe, so after the 1980s, the petroleum companies moved on from the region
when it was clear that high enthalpy hydrothermal resources (e.g., similar to The Geysers or
Cerro Prieto) were unlikely. Ormat drilled a couple of wells within the Carson Lake shallow
thermal anomaly, including well 84-31 (Figure 30), which has an 82 °C/km temperature
gradient, marginally higher than the wells on the FORGE site. In addition to a slightly higher
temperature gradient, 84-31 exhibits a nearly isothermal profile from ~200 to 1000 m depth
(Figure 31), suggesting vertical fluid circulation and the presence of permeability in the Miocene
section. This fluid circulation is likely to be related to the Carson Lake geothermal system,
which does not extend to the FORGE site based on the conductive temperature gradients
observed in the deep FORGE wells.
Multiple deep exploration wells and additional temperature gradient holes were drilled on and
adjacent to what has become the FORGE site, about 3 km north and northwest of the primary
part of the Carson Lake shallow thermal anomaly. The three deepest wells include 61-36, 82-36,
and FOH-3D, with all drilled on NASF to 2124 to 2530 m true vertical depths. These wells
terminate in Mesozoic basement rocks, where they reach maximum bottom-hole temperatures of
192° to 214°C (Figure 30 and Figure 31). In the Miocene-Pliocene section of the wells in the
FORGE site (~ < 1500 m depth), there are some relatively minor steps in the temperature
profiles that are likely associated with some fluid movement at these shallow depths (Figure 31).
At deeper depths (>1500 m), the temperature profiles all follow similar, nearly linear gradients,
which are indicative of a conductive thermal regime. Assuming a seasonal average surface air
temperature of 20 °C, the temperature gradients for the deepest FORGE site geothermal wells are
75 °C/km (FOH-3D), 76 °C/km (82-36), 78 °C/km (61-36), and 79 °C/km (88-24). These fall
above the upper range of values determined in a Nevada statewide conductive temperature
gradient model constructed by Blackwell and Coolbaugh, which range from ~15 to 75°C/km
across the state (Coolbaugh et al., 2005).

Fallon, NV, Conceptual Geologic Model | 48
In summary, temperature data from several wells in the proposed FORGE site indicate that a
conductive regime is present in the Mesozoic basement, with measured temperatures above the
FORGE cutoff (175°C) at the necessary depth. Thus, the Fallon site satisfies multiple criteria for
the FORGE program.
Data Quality and Uncertainty: Prior to ~1990, temperature gradient-hole locations were
generally manually located on maps. From the 1990s forward, many of the temperature gradient
holes were located by GPS, and thus the locations are much more accurate. Geothermal wells
drilled prior to 1985 predate the required permitting by the Nevada Department of Minerals
(NDOM). Many of the geothermal well locations were also manually placed on maps. Wells
drilled after 1985 were required to have surveyed well locations filed with the NDOM permit.
Most pads for the geothermal wells can also be located in the field even if the wells have been
plugged and abandoned. These pads help to confirm the locations of the wells and were thus
cross-checked on air photos. During detailed geologic mapping by Hinz from 2007 to 2011 of
the Lee-Allen geothermal area, the Salt Wells geothermal area, and the Lahontan Mountains
(Hinz et al., 2008, 2011, unpublished data), the locations of many older abandoned temperature
gradient wells were measured with GPS coordinates, and the locations were updated in the well
databases as necessary.
All wells drilled on the Fallon FORGE site have accurate locations. The temperature data are
also accurate for the Fallon FORGE site wells in terms of measurement precision. However,
there is some uncertainty in whether the down-hole temperature logs were all fully equilibrated.
Non-equilibrated temperature profiles are usually offset from the in-situ geothermal gradient,
depending on whether they were collected following injection testing (in which case the
temperature profiles are usually cooler than natural temperatures at the same depths), or collected
after or during flow tests (in which case the temperature profiles are usually relatively elevated
for a given depth).

Fallon, NV, Conceptual Geologic Model | 49
Figure 29. Maximum down-hole temperatures for temperature gradient holes and geothermal wells for the Fallon FORGE region. These include 106 bore-holes >200 m deep, 16 holes 200 to 750 m deep, and 14 wells
>750 m deep.

Fallon, NV, Conceptual Geologic Model | 50
Figure 30. Fallon FORGE site with adjacent NASF and Ormat lease area showing the moderate to deep geothermal wells discussed in the text and/or with temperature profiles presented in Figure 31. Depths are true vertical depth (adjusted for deviated wells), and temperatures are maximum down-hole temperatures.

Fallon, NV, Conceptual Geologic Model | 51
Figure 31. Well temperature profiles for Fallon FORGE. Profiles from wells 61-36 and 82-36 are not equilibrated temperature (collected under flowing or injection conditions). All other wells are equilibrated
profiles. Depth is true vertical depth, adjusted for well path deviation from vertical. Depth to basement noted for the three wells that intersect the FORGE target zone. The target zone for FORGE is designated as 1.5 to 4
km depth and 175 to 225°C per DOE-GTO FOA guidelines.
4.4 FLUID GEOCHEMICAL DATA
Relevance to FORGE Criteria Criteria Temperature Low
Permeability
Lithology
(crystalline)
Depth
(1.5-4 km)
Stress
Regime
No
Hydrothermal
System
Relevant
Fluid geochemistry is imperative for evaluating a site for FORGE, as constraints are needed on
both subsurface temperatures and levels of mixing of fluids from various depths. For the Fallon
area, limited reliable fluid geochemistry data are available from wells in and near to the FORGE
site. However, analyses for samples from four wells that passed initial quality control criteria
(charge balance) are presented in Tables 4 and 5 below. Wells FOH-3D, 61-36, and 88-24 are
located within the central part of the proposed FORGE site (refer to Figure 29 for well
locations), and well TGH-6 is located to the southeast of the FORGE site in the FORGE
monitoring area of Ormat.

Fallon, NV, Conceptual Geologic Model | 52
Table 4. Available geochemistry data for wells within the proposed FORGE site.
Well FOH-
3D
FOH-
3D
FOH-
3D
FOH-
3D 61-36 88-24 88-24 88-24
Sample 2-0200 3-0300 4-0615 05-1045 Weir 5000 3500
pH 8.78 8.72 8.65 8.7 8.1 8.1 7.8 8.2
Li 2.77 2.99 2.48 2.519 2.2 1.8 1.7 1.8
Na 1345.8 1336 1234 1320 3000 3380 3320 3310
K 162.6 155 168.3 158.1 80 122 125 124
Ca 49.2 46.9 49.29 50.1 32.0 19.2 19.2 18.0
Mg 0.079 0.083 0.06 0.225 0.9 2.7 2.6 2.6
SiO2 205.7 326 204 239.9 230 177 173 176
B 15.87 15.11 13.7 14.5 69.0 98.6 95.9 96.2
Cl 2140 2120 2011 2105 4400 4570 4570 4580
F 3.9 3.9 3.7 4.2 0.0 1.0 1.1 1.0
SO4 214 210 176 172 350 450 425 433
HCO3 71.3 60.6 58.5 60.6 340 724 719 720
CO3 21 22.8 21 22.8 0.0 - - -
TDS 4220 4300 4080 4200 8700 9555* 9462* 9472*
Note: These data meet initial quality-control criteria (ionic charge balance within ± 5%). Units for dissolved
solutes are mg/L; pH in standard units. *Calculated TDS.
Table 5. Available geochemistry data for wells adjacent to FORGE site.
Well TGH-6 TGH-6 TGH-6 TGH-6
pH 6.9 8 7.1 6.6
Li - 2.3 - -
Na 1210 1350 1250 1400
K 41 41.5 34.5 32
Ca 68 70 71.7 70
Mg 2 3.1 3.78 2.9
SiO2 110 104 128 120
B 9.2 - 10.8 14
Cl 2034 2138 2090 2200
F 2 1.4 1.8 0.5
SO4 106 58 54.7 62
HCO3 182 189.7 158 -
CO3 - - - -
TDS 3764* 3958* 3803* 3904*
Note: These data meet initial quality-control criteria (ionic charge balance within ± 5%). Units for dissolved
solutes are mg/L; pH in standard units. *Calculated TDS.

Fallon, NV, Conceptual Geologic Model | 53
All samples are classified as alkali-chloride waters, containing relatively low dissolved sulfate
and bicarbonate. In addition, all fluids are mature fluids, given their low magnesium contents, as
elevated magnesium indicates that the fluids have mixed with shallower, non-equilibrated
groundwater.
Applying traditional cation geothermometry relationships to the geochemistry dataset indicates
apparent high temperatures at depth at the Fallon FORGE site. The data suggest that fluids have
partially equilibrated at two different temperatures: (1) a higher temperature between 240-260°C,
and (2) a more moderate temperature between 140-160°C (as indicated by Giggenbach’s Na-K
geothermometer relationship; Giggenbach, 1988) (Figure 32).
Samples from well FOH-3D indicate the highest apparent equilibration temperatures, ranging
between 220-260°C using various Na-K geothermometry relationships (Figure 32; Table 6). The
silica geothermometer suggests slightly lower equilibration temperatures (~190°C) for these
same samples, which are consistent with measured bottom-hole temperatures (BHT’s) in this
well. The silica geothermometer is believed to re-equilibrate more rapidly than the Na/K
geothermometers, and thus may be reflecting temperatures near the well bore, whereas the Na/K
geothermometer may be preserving a thermal signature from deeper parts of the system, as this
geothermometer is slower to re-equilibrate.
Samples from the two other wells inside the proposed FORGE site (61-36 and 88-24) overall
suggest more moderate fluid equilibration temperatures (~140-170 °C) for both the silica and
cation geothermometers (Table 6). This may suggest that the wells are accessing a fluid source at
shallower depths than the FOH-3D well. The data also suggest that this inferred shallower fluid
is chemically distinct from the deep fluid, with higher measured total dissolved salts (TDS). This
may reflect stratigraphic and/or structural separation from the deeper fluid, which has preserved
its unique chemical signature (Table 4). More data are required to resolve the characteristics of
the hydrochemical system at the proposed FORGE site.
Well TGH-6 lies more than 2 km south of the south edge of the FORGE footprint. It is located
in an area where an existing hydrothermal system may be active, specifically the Carson Lake
geothermal system (e.g., Benoit, 1990; see section 4.3). The silica and cation geothermometer
results for samples from this well demonstrate reasonable agreement, suggesting that the
geothermal fluids have equilibrated at ~140°C.

Fallon, NV, Conceptual Geologic Model | 54
Figure 32. Giggenbach plot illustrating the Na-K geothermometry relationships for the fluid samples within and adjacent to the FORGE project site (from Giggenbach, 1988). Temperatures in °C.

Fallon, NV, Conceptual Geologic Model | 55
Table 6. Geothermometry results for the Fallon water samples. All values in °C.
Sample Name
Quartz
cond.
(Fournier,
Potter,
1982)
Quartz
adiabatic
(Fournier,
1977)
Na/K
(Fournier,
1979)
Na-K-Ca
(Fournier,
Truesdell,
1973)
Na/K
(Giggenbach,
1988)
K/Mg
(Giggenbach,
1988)
TGH-6 142.8 137.2 139.0 148.7 158.5 126.8
TGH-6 139.6 134.6 133.2 145.6 152.9 120.4
TGH-6 151.7 144.7 126.9 139.3 146.9 111.9
TGH-6 147.8 141.5 116.4 132.9 136.8 113.6
FOH-3D2-0200 182.5 169.7 233.8 223.9 247.9 250.3
FOH-3D3-0300 217.4 197.1 230.1 221.6 244.4 246.4
FOH-3D4-0615 182.0 169.2 245.1 230.0 258.4 259.7
FOH-3D5-1045 193.6 178.5 233.0 222.7 247.1 222.1
61-36 190.5 176.0 124.9 157.7 145.0 162.8
88-24 172.3 161.5 142.8 179.7 162.2 159.1
88-24 170.7 160.2 145.5 181.7 164.8 160.2
88-24 171.9 161.2 145.1 181.9 164.5 160.4
Data Quality and Uncertainty: The analytical uncertainties associated with these data are low,
as analyses were conducted at commercial laboratories following established standard operating
protocols for analyzing the chemical composition of aqueous samples. The greatest uncertainty
surrounds the context and sampling location of these samples (i.e., from what depths and/or
geological units are these fluids sampled from). The results presented here represent fluids
sampled at the wellhead, and to better link the results to specific formations and depths,
knowledge of fluid feed zone locations in each well is required. The uncertainties associated
with the geothermometry results are also relatively high, because the application of
geothermometry equations to the raw aqueous geochemistry data requires multiple assumptions
about the reservoir conditions, reservoir mineralogy, timing of fluid equilibration, mixing
relationships, and flow history. Nonetheless, when integrated and interpreted alongside other
geoscientific datasets, geothermometry results are a useful addition to understand hydrologic and
geothermal systems. If selected as a potential site for FORGE in Phase 2, additional sampling
and data integration will be undertaken to better constrain these factors.

Fallon, NV, Conceptual Geologic Model | 56
4.5 ALTERATION DATA
Relevance to FORGE Criteria Criteria Temperature Low
Permeability
Lithology
(crystalline)
Depth
(1.5-4 km)
Stress
Regime
No
Hydrothermal
System
Relevant
Alteration data are important to compile to help determine the extent of any hydrothermal
activity and better define the mechanical properties and permeability of rock units. Alteration
mineralogy of core and cuttings samples from the FORGE area wells has previously been studied
for the purposes of hydrothermal exploration and general characterization of the physical
properties of the stratigraphic units. Petrographic analyses of hydrothermal vein and XRD
analyses of clays were completed in 2013 during a phase of geothermal exploration for
conventional hydrothermal resources on NASF (Jones and Moore, 2013). X-ray diffraction
(XRD) was performed on samples from FOH-3, 82-35, 61-36, 84-31, 88-24, FDU-2D, and 18-5
(Figure 18 and Figure 30) to evaluate the clay mineral distribution with depth. The chips were
analyzed by the Energy and Geoscience Institute (EGI) at the University of Utah using their
Bruker D8 Advance X-ray diffractometer. As described by Jones and Moore (2013), phases
were estimated using the TOPAS software with the Rietveld method, which fits the peak
intensities calculated from crystalline structure to the observed X-ray powder using a least
squares fit. In addition, a handheld reflectance spectro-radiometer was previously used on core
and cuttings, respectively from FOH-2 and 84-31 to assess the alteration mineralogy (Calvin and
Rasmussen, unpublished data). The technique is sensitive to molecular bonds and is particularly
useful for diagnostically identifying a wide range of clay minerals. In previous pilot studies on
geothermal drill core, phyllosilicates, zeolites, opal, calcite, iron oxides, and hydroxides have
been successfully identified (Calvin and Pace, 2016).
The alteration mineralogy within geothermal systems can be classified as argillic, phyllic and
propylitic. Argillic alteration occurs in the lower temperature portions of geothermal systems (<
225˚C); phyllic indicates temperatures of 225˚C to 250˚C; and propylitic reflects >250˚C.
Several types of alteration were observed in thin section in the core and cuttings from wells in
the Fallon area. Based on petrographic analyses, the main argillic alteration zone within the
analyzed wells lies within the Miocene to Pliocene sediments with little open vein fill. The
phyllic alteration zone within the studied wells was mainly in the volcanic and volcaniclastic
rocks and included veins filled with botryoidal quartz, chlorite, epidote, laumontite, and calcite
with some smectite overprinting. The propylitic alteration zone was within the crystalline rock
and is distinct from the metamorphism in these units. This zone includes actinolite, epidote,
adularia, and plagioclase overprinted by chlorite, illite, quartz, and calcite.
Clay minerals in geothermal systems are temperature sensitive. The occurrence of smectite
suggests temperatures less than 180˚C, interlayered smectite-illite or smectite-chlorite suggest
temperatures between 180˚C and 225˚C and, finally, illite and epidote are stable above 225˚C
(Henley and Ellis, 1983; Reyes, 1990, Jones and Moore, 2013). Within the wells sampled, the
occurrence of smectite was mainly within the Miocene to Pliocene sediments. A higher-

Fallon, NV, Conceptual Geologic Model | 57
temperature environment with interlayered smectite-illite was found deeper than smectite in all
of the analyzed wells, and illite was generally found at still deeper levels. One notable exception
includes a zone in well 82-36 where smectite-illite appears at ~2300 m depth at a level otherwise
dominated by illite alteration.
The presence of argillic alteration fits with the current temperature regime recorded in the
FORGE site wells. However, the phyllic and propylitic mineral alteration assemblages represent
higher temperatures than observed in the FORGE site wells and thus almost certainly represent
fossil hydrothermal activity. Epithermal mineralization and alteration associated with Miocene
volcanism was widespread across the region and was probably responsible for extensive
alteration of the Miocene volcanic and sedimentary rocks in the Rainbow Mountains-Lahontan
Mountains region (Morrison et al., 1964; Bell et al., 2010). Epithermal mineralization and
alteration was also associated with the Mesozoic arc magmatism. Alteration in the Mesozoic
basement may have a long and complicated history, including Mesozoic and Tertiary
hydrothermal activity. No age dates have been acquired on the hydrothermal veins identified in
thin section from the bore-hole samples at the FORGE site. The veins are found in Mesozoic
and Miocene strata, and may be found in Pliocene strata. However, strata of Pliocene age have
not been recognized at the Fallon FORGE site.
In summary, only the argillic alteration is compatible with the current thermal regime at the
FORGE site. The observed phyllic and propylitic alteration was observed in Miocene and
Mesozoic rocks and is not compatible with the current thermal conditions. Thus, it probably
represents an older (presumably pre-Pliocene) hydrothermal system. In addition, the well
temperature profiles show primarily conductive heat flow characteristics, and the permeability
measurements are low, particularly in the lower Tertiary and in the Mesozoic sections. These
relationships and the current thermal regime suggest that a major hydrothermal resource has not
been found on the FORGE site.
Data Quality and Uncertainty: X-ray diffraction (XRD) analysis is used to identify crystalline
structures of minerals and to estimate their volumetric contribution to a sample. The distribution
and abundance of clay minerals were determined through X-ray diffraction analysis on both
whole rock and clay samples. Two or more clay-sized fractions were taken of each sample for
analysis through grinding the sample, separating <2 micrometer size fraction, placing it in a
centrifuge, which is then placed on a glass slide where it is air dried, glycolated and heated
before analysis. The samples are then analyzed using an XRD to determine the spectra produced
by the crystalline structure of the clay mineral within the sample. To ensure accuracy of the
XRD analyses, the entire powder pattern was analyzed so that peak overlap was minimized
(Jones and Moore, 2013). The XRD detection limit of mineral proportions in mixed samples is
typically 2%. Thus, phases present in the samples that make up < 2% may not be reported.

Fallon, NV, Conceptual Geologic Model | 58
4.6 WELL FLOW TESTING DATA
Relevance to FORGE Criteria Criteria Temperature Low
Permeability
Lithology
(crystalline)
Depth
(1.5-4 km)
Stress
Regime
No
Hydrothermal
System
Relevant
Well flow testing is essential for defining the permeability of rock units and is thus critical for
evaluating a potential site for FORGE. There are a total of seven wells on the ~4.5 km2 Fallon
FORGE site, six of which have complete temperature data (Figure 30). Four of the wells (88-24,
86-25, FOH-2, and 82-19) terminate in the Miocene volcanic rocks, reaching depths of 528 to
1530 m, and three of the wells (82-36, 61-36, and FOH-3D) terminate in the Mesozoic basement,
reaching depths of 2125 to 2530 m. Multiple well tests have been conducted on five of the wells,
including two of the three wells that intersect basement (Table 1). The types of well tests have
included injectivity tests and multiple types of flow tests.
Well 82-36 was tested for production flow capacity, and this well did not provide sustainable
production due to low permeability. Production wells typically need an injectivity index of
greater than 1.00 gpm/psi (0.55 lpm/kPa). Based on the information from the injection test
carried out on the 82-36 well (GeothermEx; Figure 33, and Figure 34), the injectivity index was
calculated to be 0.27 gpm/psi (0.15 lpm.kPa) (Figure 33). Using the data collected from the
pressure fall-off after the injection test, reservoir parameters were estimated. The injectivity
index was calculated at a value of 0.14 gpm/psi (0.08 lpm/kPa; Figure 33) for the pressure fall-
off. A permeability-thickness product (kh) of 299 millidarcy-feet (md-ft) (0.092 µm2-m) was
calculated along with a skin factor (s) of -2.5 (Figure 34). These values indicate low permeability
of formations intercepted by this well during drilling and completion, and this is therefore a non-
productive well.
Well 61-36 was also tested for production capacity, and similar to the 82-36 well, this well did
not provide sustainable production due to low permeability. As mentioned above, production
wells typically need to have an injectivity index of greater than 1.00 gpm/psi (0.55 lpm/kPa).
Based on the information from the injection test carried out on the 61-36 well (GeothermEx;
Figure 36, Figure 37, and Figure 38), the injectivity index was calculated to be 0.62 gpm/psi
(0.34 lpm/kPa) (see Figure 37). Using the data collected from the pressure fall-off after the
injection test, reservoir parameters were estimated. The injectivity index was calculated at a
value of 0.80 gpm/psi (0.44 lpm/kPa; Figure 37) for the pressure fall-off. A permeability-
thickness product (kh) of 4,430 md-ft (1.37 µm2-m) was calculated along with a skin factor (s)
of 0.0 (Figure 38). These values are higher than for well 82-36, but still indicate low-
permeability of the intercepted rock units. Consequently, this is also a non-productive well.
After pump testing both 61-36 and 82-36 for 30 days each, the flow rate was determined to be
unsustainable based on downhole pressure bubbler tube data. The wells demonstrated pseudo-
steady-state flow behavior, based on a linear drawdown of pressure, suggesting the wells were
pulling from a closed reservoir. Analytical reservoir modeling of the data was performed using

Fallon, NV, Conceptual Geologic Model | 59
the data collected throughout the pump test. By using known temperatures at depth, known
geology, and assuming single-phase fluid and a reservoir height of ~300 m and diameter of 400
m, the permeability thickness (transmissivity) was calculated at 5,000 md-ft (1.52 µm²-m) by
GeothermEx.
Well 88-24 records the highest injectivity index at 9.50 gpm/psi (5.22 lpm/kPa). This well is
~1500 m deep and just touches the upper boundary of the FORGE target zone depth, but only
reaches 140°C and does not reach the FORGE target temperature. The permeability zones are
~610 to 637 m deep (~2000-2090 ft) in a layer of basaltic andesite lavas and possibly also at
1200 to 1300 m deep (4000 to 4300 ft) in Miocene volcanic rocks (Figure 19). It is not
surprising that layers of higher permeability are present in these formations, as would be
expected in nearly any Cenozoic basins or sequences of Miocene volcanic rock. Moreover, well
88-24 does not reach Mesozoic basement nor does it reach the requisite minimum temperature of
175°C. Thus, the higher-permeability zones in this well lie well above the FORGE target zone
in terms of depth, lithologies, and temperature.
Well 86-25 reaches nearly 1 km in depth and also has low injectivity. Injectivity tests in 82-19
show a range in values from 1 to 9.5 gpm/psi (0.55 to 5.22 lpm/kPa). However, this well only
reaches ~908 m depth, 100 °C, terminates in the Tertiary volcanic section, and does not provide
much constraint on the permeability in the FORGE target zone in the Mesozoic basement >1.5
km deep.
Well 84-31, ~1 km east of the FORGE site (on the Ormat lease area) has a permeable zone at
about 215 m depth (700 ft) at a probable fault contact between basin-fill sediments (QTs) and
Miocene volcanic rocks (Tvs). Unlike the well temperature profiles at the Fallon FORGE site,
well 84-31 also records a nearly isothermal profile between ~200 to 1000 m depth (Figure 31).
Both the permeability in the upper part of 84-31 and the shape of the well temperature profile are
consistent with a hydrothermal signature associated with the Carson Lake hydrothermal system
well to the east of the Fallon FORGE site, as evidenced by the shallow temperature anomaly
defined by temperature gradient holes (see Section 4.3). This signature is related to the Carson
Lake hydrothermal system east of the Fallon FORGE site, which, as mentioned previously, is
associated with a shallow temperature anomaly defined by temperature gradient holes.
In summary, wells 82-36 and 61-36 have low permeability based on the well testing results from
injection tests. These two wells constitute two of the three deep wells on the FORGE site that
were completed in Mesozoic basement and that intersect the target temperatures (175 to 225°C)
and depths (1.5 to 4 km deep) specified as FORGE criteria.
Data Quality and Uncertainty: Multiple tests have been conducted on two wells (82-36 and 61-
36) intersecting the Mesozoic basement at the requisite FORGE target depths. The
instrumentation for these well tests was of good quality, and the determinations of low
permeability were determined using two test methods (step-rate injection and pressure fall-off).
The consistency of the results indicates that there is little uncertainty in the conclusion that the
Mesozoic formations at the location of these two wells consistently have low permeability.
Additional uncertainties are associated with whether or not the wells were ideally placed with
respect to possible permeable structures within the FORGE site. However, the consistently
conductive temperature profiles do not show indications of nearby reservoirs, nor have any

Fallon, NV, Conceptual Geologic Model | 60
potential structures been observed at the surface, nor have they been imaged in seismic and
electrical surveys.
Table 7. Well test data on the Fallon FORGE site.
Exploration Hole 82-36 61-36 88-24 86-25 82-19
Depth (ft) Depth (m)
8301.0 2530
6970.9 2125
5000 1530
3000 930
1735 529
Injection Test
gpm/psi 0.27 0.62 9.50 1 1-9.5
lpm/kPa 0.14 0.34 5.22 0.55 0.55-5.22
Artesian Temp (°F/°C) 231/110.6 195/90.6 170/76.7 n/a n/a
Max Flow (gpm/lpm) 30/113.6 30/113.6 64/242.3 n/a n/a
Air Lift
Max Temp (°F/°C) n/a 248/120 160/71.1 n/a n/a
Ave. Temp (°F/°C) n/a 198/92.2 140/60 n/a n/a
Max Flow (gpm/lpm) n/a 950/3596.1 220/832.8 n/a n/a
Ave. Flow (gpm/lpm) n/a 60/227.1 91/344.5 n/a n/a
Nitrogen Lift
Max Temp (°F/°C) 311/155 236/113.3 194/90 n/a n/a
Ave. Temp (°F/°C) Surges n/a 85/29.4 n/a n/a
Max Flow (gpm/lpm) 796/3013.2 148/560.2 531/2010.1 n/a n/a
Ave. Flow (gpm/lpm) Surges n/a 80/302.8 n/a n/a
Pump Test
Max Temp (F/C) 255/123.9 240/115.6 n/a n/a n/a
Ave. Temp (F/C) 245/118.3 230/110 n/a n/a n/a
Max Flow (gpm/lpm) 100/378.5 450/1703.4 n/a n/a n/a
Ave. Flow (gpm/lpm) 60/227.1 230/870.6 n/a n/a n/a
Note: The injection tests provide information for calculation of the injectivity index, which is used for estimating the
production potential of the various wells.

Fallon, NV, Conceptual Geologic Model | 61
Figure 33. Data for injection test on well 82-36 on March 4, 2014, showing surface injection rate, surface injection pressure, downhole pressure, and downhole temperature data and graphs.
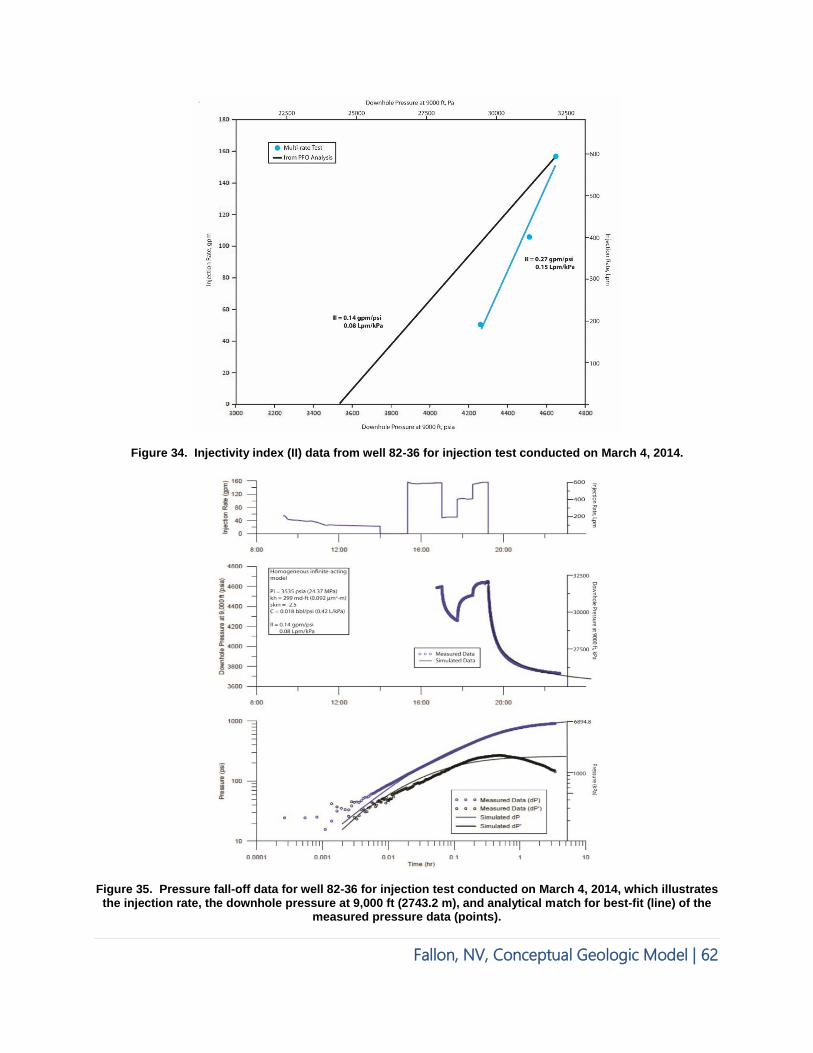
Fallon, NV, Conceptual Geologic Model | 62
Figure 34. Injectivity index (II) data from well 82-36 for injection test conducted on March 4, 2014.
Figure 35. Pressure fall-off data for well 82-36 for injection test conducted on March 4, 2014, which illustrates the injection rate, the downhole pressure at 9,000 ft (2743.2 m), and analytical match for best-fit (line) of the
measured pressure data (points).

Fallon, NV, Conceptual Geologic Model | 63
Figure 36. Injection test for well 61-36 conducted on March 7, 2014 showing surface injection rate, surface injection pressure, downhole pressure, and downhole temperature data and graphs.

Fallon, NV, Conceptual Geologic Model | 64
Figure 37. Injectivity index (II) data for well 61-36 for injection test conducted on March 7, 2014.
Figure 38. Fall-off pressure data for well 61-36 for injection test conducted on March 7, 2014. This figure is illustrating the injection rate, the downhole pressure at 9,000 ft (2743.2 m), and analytical match for best-fit
(line) of the measured pressure data (points).

Fallon, NV, Conceptual Geologic Model | 65
4.7 GEOPHYSICAL DATA
Substantial previously acquired geophysical data provide important subsurface controls on the
stratigraphic and structural framework of the Fallon FORGE site, particularly in regards to the
overall architecture of the Carson Sink basin, spacing of major faults, and vulnerability to
earthquakes. The most salient data sets include detailed gravity surveys, magnetotelluric data,
and seismic reflection data. In the latter case, 14 seismic reflection profiles criss-cross the
southern Carson Sink in and around the FORGE site. These data sets and their general quality
and uncertainty are described in the subsections below.
4.7.1 Gravity and Magnetic Data
Relevance to FORGE Criteria Criteria Temperature Low
Permeability
Lithology
(crystalline)
Depth
(1.5-4 km)
Stress
Regime
No
Hydrothermal
System
Relevant
Potential field methods are useful for imaging geologic units and structures that are associated
with lateral contrasts in crustal density and magnetic properties (remnant magnetization or the
concentration and type of magnetic minerals). Rock-property contrasts may arise from various
sources -- occurring within a rock unit, (e.g., lateral facies changes), across geologic structures
(faults or folds), or at contacts with other rock units. Such contrasts generate potential field
variations (or anomalies) that can facilitate mapping and modeling of the subsurface, because
they relate directly to shape, depth, and rock properties of a source. As a result, gravity and
magnetic data can be effectively used to resolve the geometry and origin of sources, particularly
when combined with other geologic constraints.
Potential field methods are useful in geothermal settings, because they commonly highlight
structural features (fault or fracture zones, or geologic contacts) that may play a role in guiding
geothermal fluids, or may be activated during stimulation of a geothermal field. They are
particularly useful in areas throughout the northwestern Great Basin, where the physical
properties of the Mesozoic basement or mafic-intermediate volcanic and intrusive rocks contrast
strongly with the surrounding tuffaceous and sedimentary rocks to produce prominent gravity
and magnetic anomalies. In addition, they may be used to map alteration and hydrothermal
deposits, where geothermal fluid flux results in characteristic changes to the density and rock-
magnetic properties. At the regional scale, they are also useful for constraining basin geometry.
In the Fallon FORGE study area, contrasts between basin-fill sediments, volcanic rocks, and
Mesozoic basement rocks generate a distinguishable pattern of gravity and magnetic anomalies
that can be used to infer subsurface geologic structure. We analyzed existing gravity and
aeromagnetic data to assess regional crustal structures and aid in development of the Fallon 3D
geologic model. Sources of data employed in this study include a gravity database of nearly 8000
gravity stations (collected both regionally and across several detailed surveys) and a regional
aeromagnetic compilation.

Fallon, NV, Conceptual Geologic Model | 66
Gravity Data: A database of nearly 8000 gravity stations spanning a ~130 x 130 km area
centered on the Carson Sink was compiled from databases developed by Zonge International and
Ormat Technologies, Inc. for the University of Nevada, Reno (UNR) (Figure 39). Data were
compiled from 15 sources, consisting of both public domain and privately contracted datasets
held under the care of UNR and made available for this study.
The largest data set (6898 stations comprising 13 of the 15 sources) was processed by Zonge in
2013. Data from the Zonge survey encompassed the entire Carson Sink and included 1,243 new
stations acquired at approximately 400, 800, and 1600 m intervals. The station distribution for
this survey was designed to complete regional gravity coverage in the Carson Sink area and
included available public and private gravity coverage from previous surveys. Specifically, the
Zonge gravity survey yielded the following products for the entire Carson Sink:
Complete Bouguer anomaly @ 2.67 gm/cc reduction density.
Complete Bouguer anomaly at 2.50 g/cc Contour Map (Figure 40).
Horizontal gradient magnitude contour map.
1st vertical derivative contour map.
Interpreted depth to Mesozoic basement (Figure 41), incorporating drill-hole intercept
values.
The Zonge data set provides excellent regional coverage of the Carson Sink and helps to infer the
location of major faults, as well as the thickness of basin-fill sediments and depth to Mesozoic
basement throughout the basin. Depth to basement profiles were derived from this data set for
each seismic reflection line and used to constrain interpretations of faults and thickness of the
Neogene sections along the profiles (Figure 39).
Two additional surveys, contracted and processed by Ormat, were provided for use in this study
and were merged with the Zonge data. The most important consists of a detailed survey (200 m
grid of stations) that covers the eastern portion of the proposed FORGE site (Figure 42). This
survey provides an exceptional opportunity to map density contrasts and infer geologic contacts
most relevant to FORGE activities. These data were incorporated into the interpretation of the
seismic reflection data, particularly in constraining the location of faults in the eastern part of the
FORGE site.
All data were reduced using standard gravity methods (Blakely, 1995) that correct for multiple
parameters (e.g., earth-tides, instrument-drift, latitude, elevation, Earth’s curvature, and terrain)
to yield complete Bouguer anomalies that reflect lateral variations in crustal density. Data were
gridded using minimum curvature algorithms at the regional scale (500m grid), using all of the
data, and for the high-resolution survey (100 m grid) spanning the eastern half of the FORGE
site (Figure 42 and Figure 43). In order to remove a regional field, a residual gravity map was
derived by subtracting an upward continued (by 1000 m) grid from the original survey. These
maps emphasize anomalies arising from variations in density in the shallow subsurface and can
aid in identifying faults and contacts.
Magnetic Data: Aeromagnetic data were derived from a statewide compilation of Nevada
(Kucks et al., 2006). A regional International Geomagnetic Reference Field (IGRF) was
removed from the data. The compilation spanning the study area and most of the regional

Fallon, NV, Conceptual Geologic Model | 67
surroundings consists of a single survey flown at 2743 m (9,000 ft) barometric elevation
(nominally 1524 m [5000’] above terrain in the immediate area around the FORGE site) with
flight lines oriented east-west and spaced 3218 m (2 mi) apart (U.S. Geological Survey, 1972).
The original digital line data are no longer available – a grid was created from digitizing contours
and individual locations of maxima and minima from the originally published maps. These data
are of low enough resolution to preclude resolving features at the local scale around the FORGE
site (in comparison typical modern high-resolution surveys are flown at 100-400 m (1/4-1/16 mi)
spacing at 30-60 m above terrain). However, these data do provide some constraints on regional
structures.
A pseudo-gravity (or magnetic potential) transformation (Blakely, 1995) was applied to magnetic
data in order to isolate broad magnetic features that are commonly masked by high-amplitude
shallow magnetic sources (Figure 44 and Figure 45). The pseudo-gravity transform converts a
magnetic anomaly into one that would be observed if the magnetic distribution of the body were
replaced by an identical density distribution. This results in simplifying magnetic anomalies by
centering them over their sources and facilitates interpretations. A residual magnetic map of the
pseudo-gravity was derived by subtracting an upward continued (by 100 m) grid from the
original survey, in order to remove a broad crustal field.
Various derivative and filtering methods can also be useful to delineate structures such as intra-
basin or basin-bounding faults or contacts. Maximum horizontal gradients (MHG; Blakely and
Simpson, 1986) of gravity and pseudo-gravity, which reflect abrupt lateral changes in the density
or magnetization of the underlying rocks, respectively, tend to lie over the edges of bodies with
near vertical boundaries and help in estimating the extent of buried sources. These were
calculated for both residual gravity (CBA) and magnetic (pseudo-gravity) grids.
The contrast in density and magnetic properties between pre-Cenozoic crystalline basement and
the overlying Tertiary volcanic rocks and unconsolidated alluvium produces a distinctive pattern
of gravity and magnetic anomalies at contacts or across faults that juxtapose contrasting units.
Distinct changes in character (amplitude and wavelength) can also result from alteration along
faults and fracture zones due to the circulation of hydrothermal fluids in the near-surface.
Gravity and magnetic maps of the study area and surroundings (Figure 40, Figure 42, Figure 43,
Figure 44, and Figure 45) reveal the extent of regional anomaly sources and were therefore used
to trace inferred faults, fractures, and contacts.
In general, the gravity lows over the valleys reflect moderately deep sedimentary basins filled
with lower density alluvial deposits, whereas gravity highs are associated with dense basement
and Tertiary igneous rocks. Steep gradients at several locations likely indicate the presence of
normal faults. Some of these correspond to mapped Quaternary fault scarps (e.g., in the southern
Carson Sink and along margins of the Salt Wells basin), but others are seen only through
geophysical methods (e.g., southwest of the Bunejug Mountains). Prominent gravity highs
correspond to the mountains bounding the southern Carson Sink (Dead Camel, White Throne,
and Blow Sand Mountains, Figure 42) and also follow the Bunejug and Lahontan Mountains
directly bounding the study area to the south and east, respectively (Figure 42). Prominent
gravity lows occur over the southern Carson Sink and Salt Wells basins.

Fallon, NV, Conceptual Geologic Model | 68
The available gravity data provide important constraints on the location of faults, thickness of
basin-fill sediments, and depth to Mesozoic basement within and adjacent to the Fallon FORGE
site. Depth to basement profiles were derived from the Zonge gravity survey for each of the
interpreted seismic reflection profiles and integrated with well data. Synthesis of these data was
then utilized to infer the location of major faults (with offsets > ~100 m) and thickness of the
Neogene section along each profile. In the eastern part of the study area, where high-resolution
surveys were available, data are sufficient to resolve subtler density contrasts that may reflect
fault zones that involve relatively small offsets (< ~100 m) or slight property changes (e.g., due
to alteration or precipitation of material along a fault or fracture zone).
Gravity station coverage is heterogeneous across the study area. In places where gravity stations
are sparse, structural interpretations are poorly constrained. A detailed survey spanning the
eastern half of the FORGE area (Figure 39 and Figure 43) reveals several relatively continuous,
elongate, north-south trending structures extending from the front of the Lahontan Mountains
westward into the valley. These structures are sub-parallel to mapped faults in the area and have
a similar spatial recurrence (nominally 0.5-1 km spacing).
Modeling of the gravity data (e.g., lack of abrupt gradients and major discontinuities) indicates
that the density of faulting is relatively low within the FORGE site (Figure 42 and Figure 43). In
contrast, higher fault densities are predicted east of the FORGE site in an area broadly coincident
with the Carson Lake geothermal system. These data corroborate other observations that an
active hydrothermal system is not present beneath the FORGE site.
High-amplitude magnetic anomalies in this region are generally caused by moderately to
strongly magnetic mafic volcanic rocks that crop out at the surface or are buried at shallow
depths. Moderate highs reflect moderately magnetic rocks (such as tuffs) or buried mafic
volcanic rocks within the basin. Magnetic lows are typically associated with weakly magnetic
silicic and sedimentary rocks or may be associated with reversely magnetized units. In areas of
active or fossil geothermal activity, neutral values may reflect hydrothermal alteration of an
originally magnetic unit. Magnetic highs in the area occur over the Bunejug and western
Lahontan Mountains that bound the FORGE site to the southeast and northeast, respectively, as
well as the White Throne and Blow Sand Mountains to the south of the Carson Sink and western
Stillwater Range directly east of the Carson Sink (Figure 44). The structural grain interpreted
from the magnetic data (Figure 44 and Figure 45) mimics the trend of mapped faults and/or
gravity-inferred contacts. However, structural interpretations made from the magnetic map are
limited by the relatively low-resolution of existing magnetic data.
Data Quality and Uncertainty: Gravity data in the Carson Sink were generally acquired using a
Scintrex CG-5 gravimeter and a LaCoste and Romberg (L&R) Model-G gravimeter. The CG-5
gravity meter has a reading resolution of 0.001 milligals and a typical repeatability of less than
0.005 milligals. The L&R gravity meter has a reading resolution of 0.01 milligals and a typical
repeatability of 0.02 milligals. The basic processing of gravimeter readings to calculate the
Complete Bouguer Anomaly was performed using the Gravity and Terrain Correction software
version 7.1 for Oasis Montaj by Geosoft LTD. The uncertainty in the aeromagnetic data is
estimated to be <5 nT based on analogous aeromagnetic surveys also conducted in the 1970’s
(e.g., Connard et al., 1983).

Fallon, NV, Conceptual Geologic Model | 69
Gravity and magnetic anomalies can be generated by more than one configuration of subsurface
lithologies, alteration, and faulting. For this reason, a significant degree of uncertainty is present
in the location of any structure modeled from these surveys alone. In this FORGE study,
however, the gravity and magnetic data are not used as a primary source for estimating any of the
critical FORGE site parameters. Instead, these data play a supporting role. The lack of
significant structures identified by these surveys confirms conclusions reached using more
definitive analyses (e.g., temperatures, well depths, and flow tests), and thus they reduce the
primary uncertainties in the critical parameters by providing a measure of corroboration.
Figure 39. Index of the Fallon FORGE area showing gravity station coverage. The Forge site is outlined in red at right center. A. Regional coverage. B. Coverage for the FORGE 3D model area (green box) and
immediate surroundings.

Fallon, NV, Conceptual Geologic Model | 70
Figure 40. Gravity complete Bouguer anomaly at 2.50 g/cc contour map (from Faulds et al., 2014).

Fallon, NV, Conceptual Geologic Model | 71
Figure 41. Interpreted depth to Mesozoic basement for the Carson Sink based on gravity data (from Faulds et al., 2014).

Fallon, NV, Conceptual Geologic Model | 72
Figure 42. Regional map of the residual CBA gravity across the Fallon FORGE area and surroundings showing inferred faults (brown) and density contrasts (blue) inferred from the maximum horizontal gravity gradients. Faults surrounding the Carson Sink were generally inferred from geologic mapping, whereas many of the faults within the Carson Sink, particularly those within and proximal to the FORGE site, were
inferred from seismic reflection profiles and do not cut the upper Quaternary basin-fill sediments. The FORGE site is shown in red at right center.

Fallon, NV, Conceptual Geologic Model | 73
Figure 43. Map of residual CBA gravity across the Fallon FORGE 3D model area, overlain with inferred faults (brown) and density contrasts (blue) inferred from the maximum horizontal gravity gradients. Faults within and directly adjacent to the FORGE site do not cut the upper Quaternary basin fill and were inferred from
interpretation of seismic reflection profiles. Inset shows a high-resolution residual gravity grid (and corresponding density contrasts) derived from a detailed survey spanning the eastern half of the FORGE
area (light purple station symbols that are distributed in a 200 m grid pattern).

Fallon, NV, Conceptual Geologic Model | 74
Figure 44. Regional map of the residual pseudo-gravity (magnetic potential) across the Fallon FORGE area and surroundings showing mapped faults (brown) and density contrasts (blue) inferred from the maximum horizontal magnetic gradients. Faults surrounding the Carson Sink were generally inferred from geologic mapping, whereas many of the faults within the Carson Sink, particularly those within and proximal to the FORGE site, were inferred from seismic reflection profiles and do not cut the upper Quaternary basin-fill
sediments.

Fallon, NV, Conceptual Geologic Model | 75
Figure 45. Map of the Residual Pseudo-gravity (Magnetic Potential) across the Fallon FORGE 3D model area, overlain with mapped faults (brown) and magnetic contrasts (blue) inferred from the maximum horizontal
pseudo-gravity gradients. Faults within and directly adjacent to the FORGE site do not cut the upper Quaternary basin fill and were inferred from interpretation of seismic reflection profiles.
4.7.2 Magnetotelluric Data
Relevance to FORGE Criteria Criteria Temperature Low
Permeability
Lithology
(crystalline)
Depth
(1.5-4 km)
Stress
Regime
No
Hydrothermal
System
Relevant
Magnetotelluric (MT) data provide information on the electrical resistivity of the subsurface.
Electrical resistivity (or the inverse electrical conductivity) is dependent on rock porosity, the
degree of fluid saturation, alteration, and the salinity of groundwater. In hydrothermal systems,
low resistivity areas have been shown to correspond in some cases to geothermal reservoirs.
Conceptual models integrating temperature, lithology, structure, alteration, and fluid
geochemistry have been successfully used to evaluate the presence and extent, or absence of a
hydrothermal system. MT data at Fallon are specifically utilized to assess the likelihood of
hydrothermal activity in the Mesozoic basement at the Fallon FORGE site and thus the potential
of these rocks to host an EGS reservoir.

Fallon, NV, Conceptual Geologic Model | 76
An MT study was conducted over the proposed Fallon FORGE site area by Fugro Gravity and
Magnetics Services under contract to CH2M Hill for the Navy Geothermal Program Office. The
survey included 181 soundings of full component tensor broadband MT and produced an average
of 9.5 MT soundings per day throughout the field session. Information about the acquisition,
analysis and interpretation of the MT survey are described in a final report from CGG and
Chinook Geoconsulting, Inc. The 181 MT sites were located on a 500 m by 500 m grid (Figure
47) and were designed to best assess the resistivity pattern over the southeast corner of NASF.
By coincidence, this MT survey was centered over the Fallon FORGE site.
The analysis of the data set was performed by Chinook Geoconsulting, Inc., which generated 1D,
2D and 3D inversions of the data. The 2D and 3D inversions were performed using CGG RLM-
2D and 3D MT codes. The 3D full tensor complex impedances used a frequency range of
0.0032 Hz to 3,162 Hz, using 4 frequencies per decade, on a 384 core cluster for the inversion.
Blind inversions were completed using varying 3D parameters to satisfy the data and to ensure it
was also geologically reasonable. The 1D MT modeling allows for variation in depth only and
provides a different way to characterize the data set. Static distortion effects (topography for
example) build up at this scale and make this form of modeling less accurate, whereas these
same effects are not seen in 2D or 3D modeling. Mesh details for both the 2D and 3D models
are provided in Table 8. Within the 3D model, because the survey area is relatively flat, the
layer thickness is 5 m for the cells within the topography, and it increases by 6% per layer up to
100 m at -1,500 m mean sea level (msl). Beneath these, the layer thickness increases by 20%
down to the bottom of the mesh.
The resistivity patterns in the MT data generally follow stratigraphy across the modeled FORGE
area. The Miocene to present basin-fill sediments (QTs) correspond to the upper, westward
thickening low-resistivity zone in the profiles (Figure 47 and Figure 48). Lithologic logs and
alteration data indicate substantial clay in the basin-fill sediments, consistent with the observed
low resistivity. The Miocene volcanic rocks (Tvs) generally correspond to intermediate
resistivity values, and the Mesozoic basement corresponds to high resistivity. In particular, the
MT profiles show a depth where the rocks become dramatically more resistive, from quite low
resistivity of ≤ 5 ohm-m into very high resistivity rocks with corresponding 100's of ohm-m
resistivity. The intermediate resistivity associated with the Miocene volcanic rocks is typical of
a rock unit that would have some alteration and/or have somewhat elevated porosity and
permeability due to fractures or sedimentary interbeds. Petrographic and XRD analyses indicate
alteration of the Miocene bedrock, and some wells indicate moderate permeability in some of the
volcanic layers in the upper ~1 km (e.g., well 88-24). Thus, both local alteration and/or
permeability within the Miocene volcanic rocks may contribute to the intermediate resistivity
values. The high resistivity in the Mesozoic basement signifies hard rock with very low porosity
and permeability with few open fractures. These patterns are generally consistent between
profiles across the model area. It should be noted that high temperature propylitic alteration and
dense metamorphic and plutonic rocks will produce similar MT signatures. No doming or
arching of the base of the conductive layer was observed that might indicate the central
upwelling portion of a geothermal system. Instead, the deep high resistivity zone is consistent
with the occurrence of propylitically altered metamorphic and plutonic rocks observed in the
wells, whose alteration is likely caused by older periods of intrusion, metamorphism, and
alteration.

Fallon, NV, Conceptual Geologic Model | 77
Data Quality and Uncertainty: The MT data were processed for impedances and magnetic
transfer functions by using a remote reference scheme performed in the field office in Fallon.
Prior to the survey, noise was expected from a variety of sources in the acquisition area,
including powerlines, pipelines, radar, communications, and electric fences. Pre-survey planning
moved or cancelled stations to try and minimize noise contamination, and the shape of the grid is
in part a result of this planning (Figure 46). Throughout the survey, the natural signal level
varied with artificial noises from powerlines, pipelines, and radar stations. However, data
quality was very good with only one repeated station, and little cultural noise contamination was
evident in the data. One factor possibly influencing the overall lack of noise is the low
conductivity in the near-surface over most of the survey area. In the shallow section, to a few
hundred meters in depth, the resistivity is (mostly) less than 6 ohm-m.
Uncertainty in the interpretation of the MT survey results is present, because, as mentioned
above, deep high-resistivity zones can be produced by either propylitic alteration associated with
an active geothermal system, propylitic alteration associated with older, extinct hydrothermal
alteration, or by dense metamorphic and plutonic rocks without alteration. However, this
uncertainty is reduced by consideration of other data types, including well logs, chips, core, and
subsurface temperature data, which indicate the lack of on-going hydrothermal flow.

Fallon, NV, Conceptual Geologic Model | 78
Figure 46. MT station locations on the Fallon FORGE site and adjacent areas. Locations of MT profiles MS-16 and MS-17 are shown by the lines A-A’ and B-B’, respectively.
Table 8. Properties of mesh for 2D and 3D Models
2D Model 3D Model
Property Specifications Property Specifications
Orientation 90˚ Orientation N0˚E
Number of cells in X/Z Direction
84-166 x 90-93 Number of cells in X/Y/Z Direction
100 x 110 x 112
Number of cells total 7,728-10,556 Number of cells total 1,232,000
Model size in X/Z Direction
112-116 km x 61 km
Model size in X/Y/Z Direction
134 km x 136 km x 52 km
Cell Area, Model Core 125 m x 5-100 m Cell Area, Model Core 167 m x 167 m
Cell Thickness, Topography
5 m Cell Thickness, Topography
5 m
Cell Thickness, Deep 100 m

Fallon, NV, Conceptual Geologic Model | 79
Figure 47. East-west MT profile MS-16 with projected well paths for 61-35, FOH-3D, 82-36, and 84-31 (west to east). View in this profile is looking north, west to the left, and east to the right. This line runs across wells 61-36, FOH-3D, and 82-36. 84-31 is projected a short distance from the north. The local boundaries of the
intersection with the FORGE site are bracketed by the green lines above the profile. Lithologic units correspond to units described in the well lithology section of this report. Scale is 1:1 with no vertical
exaggeration; meters are shown on vertical scale and feet on horizontal scale.

Fallon, NV, Conceptual Geologic Model | 80
Figure 48. East-west MT profile MS-17 with projected well paths for FOH-3D, 82-36, and 84-31 (west to east) from the north. View in this profile is looking north, west to the left, and east to the right. This is the next
east-west profile south of MS-16, wells are projected in from the north. Lithologic units correspond to units described in the well lithology section of this report. Scale is 1:1 with no vertical exaggeration; meters are
shown on vertical scale and feet on horizontal scale.
4.7.3 Seismicity and Micro-Earthquake (MEQ) Data
Relevance to FORGE Criteria Criteria Temperature Low
Permeability
Lithology
(crystalline)
Depth
(1.5-4 km)
Stress
Regime
No
Hydrothermal
System
Relevant
There are two main purposes in analyzing and ultimately carefully monitoring seismicity in
Enhanced Geothermal Systems (EGS) projects: (1) using and applying seismic data to
understand the dynamic response of the subsurface at the FORGE site, and (2) assessing the
hazard and risk associated with induced seismicity during EGS experiments. Available
seismological data for the study area was compiled using the Nevada earthquake catalogue of
Slemmons et al. (1965) for earlier events and the Nevada Seismological Laboratory (NSL)

Fallon, NV, Conceptual Geologic Model | 81
catalogue for instrumental events over the past several decades. This was supplemented with
additional events from the U.C. Berkeley Seismograph Stations catalogue, University of Utah
seismograph stations catalogue, published investigations of individual earthquakes, and historical
accounts.
Only low level seismicity has been recorded in the Fallon FORGE project area, although several
major earthquakes occurred 10 to 60 km east of the site in 1954 (Figure 49). The 1954
earthquakes had magnitudes ranging from 6.1 to 7.1, and each ruptured the ground surface. The
closest principal surface rupture was ~10 km to the east of the FORGE area along the Rainbow
Mountains fault zone. Table 9 lists the most significant recorded earthquakes in the vicinity of
the FORGE area on the regional seismic network. Since the early 1970s, the area has been
monitored by a regional seismic network that can record minor earthquakes. This network is
administered by the Nevada Seismological Laboratory (NSL) at UNR and contains more than
300 seismometers, with 9 stations lying within ~75 km of the Fallon FORGE site
(http://www.seismo.unr.edu/Monitoring).
The time-frequency of earthquakes and the distance from an earthquake epicenter to a point of
interest (grid cell in model) were considered for modeling. Accordingly, a hybrid map was
constructed that modeled earthquake occurrence density inversely weighted by distance (Figure
50). To approximate an inverse-distance-weighted sum of earthquake occurrence, the following
procedures were completed: (1) Earthquakes were summed for each grid cell in the model at four
different distances (radii): 20 km, 10 km, 5 km, and 2.5 km. (2) These four earthquake grids
were then summed together to produce an overall earthquake activity map, effectively weighted
inversely by distance (Figure 50). It should be noted that these data are restricted to the past
~150 years, with robust databases from only the past several decades. These data may be biased
depending on the position of a particular area within the overall earthquake cycle, which can be
thousands to tens of thousands of years long in this region. For example, the Dixie Valley area
~50 km to the east of the FORGE site shows a distinct loci of activity associated with the major
earthquakes in 1954 and subsequent aftershock sequences.
Within the southern Carson Sink, six earthquakes were recorded within 6.6 km of the FORGE
site (dePolo, unpublished). The largest occurred in 1930, a time when the ability to locate an
earthquake was poor. Thus, this location is probably poorly defined. The 1930 event was a
moderate earthquake, assigned a magnitude 4.5. In 1958 a magnitude 3.4 earthquake occurred in
the area, but its epicenter may also be slightly mislocated. None of the minor earthquakes
recorded in the area appear to have occurred directly under the FORGE project area.
Table 9. Earthquakes in the Fallon FORGE Project Area
Date Latitude Longitude Magnitude Distance - Direction
04/12/1930 39.4 N -118.8 W M4.5 6.6 km WNW
02/16/1958 39.4 N -118.6 W M3.4 5 km E
02/08/1974 39.334 N -118.702 W M2.2 5.4 km S
10/16/2004 39.3952 N -118.6184 W M1.97 3.8 km E
12/16/2010 39.4254 N -118.7017 W M1.5 3 km N
02/20/2011 39.364 N -118.5945 W M2.35 5.4 km E

Fallon, NV, Conceptual Geologic Model | 82
To begin better monitoring of the background seismicity, a micro-earthquake (MEQ) seismic
network at NASF started operating in 2004 prior to the possible development of a geothermal
resource at the southeast corner of the main side of the base. The network consists of ten 3-
component, 4.5 Hz short-period downhole sensors, which cover roughly a 10 by 10 km area
around the southeast corner of NASF (Figure 51). Each station uses Nanometrics Triden/Janus
system to record and then transmit data to a central site, where they are then forwarded to ports
of RM-4 Bridge multiplexers. The RM-4 converts serial data into UDP IP packets and places
them on an acquisition computer, which runs NaqsServer network data acquisition software.
Currently, the network has five stations that are transmitting data. A few additional stations are
deployed, but sensors on these instruments need to be repaired or replaced, which will be a
priority in Phase 2.
Data for the MEQ network were recorded from 2004 to 2008, in 2011, and then from 2014
through present. Although the goal was to record seismic activity in the southeast part of NASF,
most or all of the events that were recorded lie well beyond the outline of the array. Therefore,
the accuracy of event locations is lower than would be the case for events occurring within or
closer to the array. In the summer of 2015, it was determined that the sensor threshold was set
too high to record micro-seismic events, and it was therefore lowered to match the appropriate
level for use in the FORGE project. After this threshold was lowered, 134 events were recorded
through the middle of January 2016. All of these were regional events, with no events recorded
in the vicinity of the FORGE site. In combination with the Advanced National Seismic System
(ANSS) and NSL data (http://www.seismo.unr.edu/Monitoring), the data from the NASF
network suggest that the FORGE area is characterized by a low level of natural seismic activity.
The recent assessment of and changes to the equipment and parameters has enabled the network
to (1) provide important background data for the project site, and (2) be effectively utilized
during subsequent phases of the FORGE project.
Data Quality and Uncertainty: Seismic networks have expanded through time, and the ability to
record and accurately locate lower-magnitude earthquakes has improved dramatically. Thus, the
threshold of earthquake magnitudes was established for different time intervals (Table 10) based
on the density and quality of the seismic network for that period. Plots were made of
earthquakes that occurred during seven different time periods. These time periods were
determined by how the earthquakes were recorded, such as from historical accounts versus using
local instrumental data. The plots show the number of earthquakes versus their magnitudes and
tend to form a linear relationship, whereby the earthquakes of a given magnitude range are
"completely" recorded (this is the classic b-value relationship or magnitude-frequency
relationship for earthquakes in an area). A minimum magnitude estimate for each time period
was then made based on the level at which the number of events falls off of the linear
relationship, and events below that magnitude were not used in further analyses of these data.
Once the lower earthquake threshold was established for different time intervals, the distribution
of earthquakes across the study area was then established (Figure 49). In essence, the
seismological database summarizes the faulting history in the study area over the past ~150
years, but with relatively comprehensive data from only the past several decades. These data
may therefore be biased depending on the position of a particular area within the overall
earthquake cycle, which can be thousands to tens of thousands of years long in this region. Even
on modern networks, not all earthquakes are recorded, which leads to some uncertainties in

Fallon, NV, Conceptual Geologic Model | 83
earthquake completeness. Earthquake magnitudes are likely estimated within a few tenths of a
magnitude outside the seismic network, and more precisely within the network. For instrumental
recordings in recent decades, earthquake locations are likely within a few kilometers in western
Nevada, where the NSL network is focused.
For the inverse weighted sum of earthquake activity in the Carson Sink region (Figure 50),
estimated error (in log-scale units) ranges from a high of 0.5 at the low end of the earthquake
sum scale (-0.3) to a “low” of 0.25 at the high end of the earthquake sum scale (3.4). Because of
the log scale, the actual value of the error is higher at the high end. Low-end error of 0.5 is based
on ½ the value induced by earthquake clusters in low quake-prone areas of the map, times ½ the
value reduced in weight to account for less-likely occurrence of clusters in some parts of the
map. High-end error of 0.25 is based on ½ range of perceived likely variation in earthquake
density in high-earthquake-prone areas, based on observed heterogeneity on the map.
Table 10. Time Periods and Earthquake Magnitude Completeness Values
Time Period Lower Threshold Magnitude Notes
1860s - 1930 M5.5 Historical records
1931 - 1969 M4.5 Regional seismic networks
1970 - 1979 M2.75 Early UNR seismic network
1980 - 1992 M2.25 Increase of instruments in UNR seismic
network
1993 – May 9, 2006 M2.0 Addition of southern Nevada network
May 10, 2006 - March 21, 2008 M1.2 EarthScope Bigfoot Array Deployed
March 22, 2008 - Oct. 2014 M1.5 Contemporary NSL network

Fallon, NV, Conceptual Geologic Model | 84
Figure 49. Historic seismicity in the Carson Sink region.

Fallon, NV, Conceptual Geologic Model | 85
Figure 50. Inverse weighted sum of earthquake activity in the Carson Sink region. This is a model of the density of the time-frequency occurrence of earthquakes, inversely weighted by distance. Earthquakes were
summed for each grid cell in the model at four different distances (radii): 20 km, 10 km, 5 km, and 2.5 km. These four earthquake grids were then summed together to produce an overall earthquake activity map,
effectively weighted inversely by distance.

Fallon, NV, Conceptual Geologic Model | 86
Figure 51. Micro-seismic stations within and proximal to the proposed Fallon FORGE site.
4.7.4 Seismic Reflection Data
Relevance to FORGE Criteria Criteria Temperature Low
Permeability
Lithology
(crystalline)
Depth
(1.5-4 km)
Stress
Regime
No
Hydrothermal
System
Relevant
About 270 km (~167 miles) of seismic reflection profiles were interpreted for the southern
Carson Sink within and near the Fallon FORGE site (Figure 52). Interpreted profiles are shown
in Attachment B. The profiles constrained the general structural framework of the area,
including basin architecture, thickness of major stratigraphic units, and location and spacing of
faults. The profiles were also used as the basis for constructing cross sections across the project
area, which in turn were used as the primary building blocks of the 3D conceptual model.

Fallon, NV, Conceptual Geologic Model | 87
When properly processed, the peaks and troughs in a surface seismic reflection profile represent
abrupt changes in seismic impedance. Seismic impedance is the product of seismic propagation
velocity and density. Accordingly, these peaks and troughs, also called reflection events,
indicate marked changes in velocity and/or density. A major assumption in the surface seismic
reflection method is that these changes in velocity and density (the peaks and troughs)
correspond to changes in rock properties (e.g. lithology).
Surface seismic reflection methods have found widespread success in the oil and gas industry,
and are beginning to be used in the geothermal arena. In oil and gas environments, sedimentary
rocks are laid down in long nearly horizontal layers. These layers are locally cut by faults which
lead to vertical offsets of these beds. Seismic reflection profiles over such areas show a series of
reflection events which are coherent over long lateral distances. These reflection events
commonly correspond to changes in lithology, and show vertical offsets when cut by faults. As
part of the interpretation process, their lateral positions and arrival time on the profile can be
picked. With the wealth of velocity data available in these areas, time picks can be converted to
depth, leading to maps of fault locations, bed thickness, and depth.
In contrast, much of the Great Basin region is dominated by volcanic and metamorphosed rocks,
with a high degree of structural complexity. With the exception of valley fill, the long coherent
reflection events seen in sedimentary basins are lacking. One further complication in applying
reflection seismic methods in much of this region is the dearth of velocity information. In most
cases the only available velocity information needed to convert from time to depth are relatively
unreliable move out velocities generated during processing. Nonetheless, when integrated with
well data and gravity-derived depth estimates, arrival times of a limited number of formations
can be picked and converted to depth. Surface mapping and gravity data are also useful in
constraining fault locations. Although not nearly as detailed and reliable as maps produced in
broad sedimentary basins, these results can be integrated into a geological model to identify
structural style elements.
About 177 km (109 miles) of existing 2D seismic reflection data from nine separate profiles
were obtained from Seismic Exchange, Inc. (SEI) for the southern Carson Sink. In addition, 93
km from five profiles were provided by the Navy. The acquisition vintage of the SEI profiles
ranges from the early 1970's to mid-1980's; these data were originally acquired by the oil
industry. The Navy profiles were acquired in 1994 by Northern Geophysical of America, Inc.
Of the two groups of profiles, 83 km (51 miles) were proximal to the FORGE site, thus
providing an excellent grid with which to constrain the stratigraphic and structural framework of
the area.
The SEI profiles were only available as scanned images of paper plots of processed data. The
digital data (SEGY files) were available for the Navy profiles, but no re-processing was carried
out due to the limited scope and budget of Phase I of this project. Thus, for all Carson Sink
lines, we used the original processing applied by the companies in the case of the SEI profiles,
which did not include migration. The time domain, scanned paper plots were therefore used in
the interpretation. For the Navy profiles, we used migrated data processed by Optim, Inc., in
2011 using their proprietary method. Figure 52 shows a base map for the southern Carson Sink
seismic reflection lines, and interpreted profiles are shown in Attachment B.

Fallon, NV, Conceptual Geologic Model | 88

Fallon, NV, Conceptual Geologic Model | 89
Figure 52. A. Base map showing seismic reflection profiles from the southern Carson Sink overlain on sedimentary basin-fill depths and generalized geologic map. Black dots are wells in the area. Large red dots
are known geothermal systems. Quaternary faults are shown in red. The FORGE site is shaded in green, and the 3D model is outlined in green. B. Base map showing interpreted faults from seismic reflection
profiles (see interpreted profiles in Attachment B). All faults in the vicinity of the FORGE site are concealed beneath Quaternary sediments and do not cut late Pleistocene-Holocene sediments. Actual Quaternary
faults are shown in red. Bar-balls on downthrown sides of faults.
For scanned paper images of an un-migrated profile (the SEI profiles), a time domain flow was
pursued. Gravity derived depths to formation boundaries were available for the southern Carson
Sink and were converted from depth to time. Similarly, if nearby well data were available,
formation tops from these wells were converted from depth to time. These were then plotted on
top of the scanned seismic profile. These profiles were then interpreted for faults and lithologies
on the time domain images. Interpreted contacts and faults were then hand digitized. These
digitized points were then converted from time to depth. The result of this process was a table of
NAD83 UTM coordinates for each picked horizon or fault. These tables were incorporated into
the 3D geological models.
Time to depth and depth to time conversions were critical steps in this work flow. Before these
conversions can be performed, a detailed and reliable interval velocity model covering the area
of the seismic profile must be in hand. The quality of the time/depth conversion is directly
related to the quality of the interval velocity model. In oil and gas areas, interval velocity models
are typically developed using a combination of well sonic logs and vertical seismic profile (VSP)
velocity data, also called check-shot data. Well log sonic velocities are derived from very high
frequency measurements. They are commonly known to differ from low frequency seismic

Fallon, NV, Conceptual Geologic Model | 90
velocities by as much as 10%. For this reason, well log sonic velocities are usually “check-shot
corrected” before being incorporated into interval velocity models for time/depth conversion. In
modern times, interval velocity estimates can be supplemented by the expensive process of pre-
stack depth migration velocity analysis. With the wealth of velocity data available in many
sedimentary basins, reliable interval velocity models can be produced.
The situation in the Carson Sink is markedly different. Very few sonic logs are available, and
VSP or check-shot data are virtually nonexistent. An alternative is to use interval velocities
derived from stacking velocities, also called normal moveout (NMO) velocities. Interval
velocities inferred from NMO velocities therefore served as the method used in this project.
NMO velocities are derived during processing. In unstacked seismic data, reflection events from
a single reflector will arrive at later and later times with increasing offset between the source and
receiving geophone. NMO velocities are corrections, which flatten reflection events in
unstacked seismic data. They compensate for the additional time it takes a seismic wave to go
from source to reflecting boundary to geophone associated with offset.
NMO velocities can be closely approximated as a root mean square (RMS) average of the
interval velocities along the seismic ray path. Dix (1955) developed an algorithm for inverting
interval velocities from NMO velocities. This inversion process is notoriously unstable. Very
small changes in NMO velocities can lead to large changes in interval velocity. This instability
grows with increasing time or depth. In spite of this instability, NMO derived interval velocities
are commonly the only path open for performing time/depth conversions.
Fortunately, the NMO velocities derived in processing the seismic profiles used in this project
were listed on the scanned images. For each profile, an interval velocity model was obtained
from the NMO velocities using a program included in the Seismic Unix (SU) processing package
(Cohen and Stockwell, 2008). In particular, the SU program velconv implements the Dix (1955)
algorithm. It has options for converting NMO velocities to interval velocities in time or depth, as
well as producing tables of depth as a function of time or time as a function of depth. For each
scanned image profile, an interval velocity model was developed using the posted NMO
velocities and SU program velconv. If gravity and well log formation tops were available for
that particular profile, their depths were converted to time using the depth to time tables
produced by this same program. Figure 53 shows one such profile that extends through the
FORGE site in the southern Carson Sink. The magenta line in Figure 53 shows the top of the
Mesozoic basement inferred from gravity data after depth to time conversion.

Fallon, NV, Conceptual Geologic Model | 91
Figure 53. Seismic reflection profile FL2 of the southern Carson Sink (looking north). The magenta line shows the gravity inferred top of Mesozoic basement after depth to time conversion. Seismic data are owned or controlled by Seismic Exchange, Inc.; interpretation is that of the University of Nevada, Reno.
Guided by the well and gravity data, these profiles were then interpreted. Tops of a limited
number of lithologies and fault locations were drawn on the profiles. These were then hand
digitized and converted from time to depth. Figure 54 shows the interpreted profile FL2 from
the southern Carson Sink. Figure 55 displays the interpretation picks shown in Figure 54 after
conversion from time to depth using the NMO derived interval velocity model.
Figure 54. Interpreted profile FL2 from the southern Carson Sink (looking north). Normal faults are shown in red, and lithologic contacts are blue. QTs, Late Miocene to Quaternary basin-fill sediments; Tvs, Miocene
volcanic and sedimentary rocks; Mzu, Mesozoic basement undivided. Note that the Seismic data are owned or controlled by Seismic Exchange, Inc.; interpretation is that of the University of Nevada, Reno.
Figure 55. Time to depth converted picks of interpreted horizons and faults from profile FL2.

Fallon, NV, Conceptual Geologic Model | 92
For the migrated Navy profiles, a depth domain approach was followed. Since the gravity and
well data were already in depth, there was no need to convert these to time. These plots were
then used for interpretation. Since interpretations of the Navy profiles were already in depth,
they were passed on directly for incorporation into the geological model.
The seismic reflection data indicate that the proposed Fallon FORGE site is underlain by a gently
west-tilted half graben cut by widely spaced generally east-dipping normal faults (see interpreted
profiles in Attachment B). Most of the faults dip moderately to steeply and accommodated
relatively minor offset, typically ranging from ~100-200 m. The largest faults generally strike
north to north-northeast, but several minor faults (generally <100 m offset) strike ~east-west.
Typical spacing of the northerly striking normal faults ranges from ~0.4 to 3.5 km in the vicinity
of the project area (Figure 52B).
Data Quality and Uncertainty: The quality of the seismic reflection data is good in the Neogene
basin fill but degrades significantly below the top of the Miocene volcanic section. The seismic
waves are attenuated significantly in volcanic rocks and thus resolution of distinct reflectors and
contacts becomes difficult below that level. Thus, the gravity profiles and any available well
data were used to constrain the contact between the Tertiary volcanic section and Mesozoic
basement. Seismic resolution or uncertainty is the ability to distinguish separate features, or the
minimum distance between two features so that they can be defined separately. Seismic
resolution is controlled by wavelength (e.g., Yilmaz, 2001). In order for two nearby reflective
interfaces to be distinguished well, they have to be about 1/4 wavelength in thickness (Rayleigh
Criterion). The dominant frequency in profiles analyzed for this project is ~20 Hz. Typical
velocities are about 4 km/sec. Since wavelength equals velocity divided by frequency, typical
wavelength would be about 200 m. This would, in turn, imply that the resolution is as great as
~50 m in the basin-fill, possibly lower at shallow levels characterized by lower velocities. This
level of resolution only applies to well-imaged basin-fill Neogene sediments. Below that level,
resolution would be much poorer (>100-200 m). Although these data are not up to modern
standards in hydrocarbon-rich basins, they do provide critical data on the thickness of basin-fill
sediments, general basin architecture, and spacing of major faults. They also provide important
data with which to guide future seismic reflection surveys in a potential Phase 2 utilizing the
most modern techniques.
5 DISCUSSION
5.1 SUMMARY OF STRATIGRAPHIC AND STRUCTURAL FRAMEWORK
The stratigraphic and structural framework of the proposed Fallon FORGE site and surrounding
area is well characterized due to previously completed detailed geologic mapping (Figure 13),
abundant well data (Figure 14), and geophysical data sets, including detailed gravity (Figure 43)
and MT surveys (Figure 46), 14 seismic reflection profiles (Figure 52 and Attachment B), and
regional seismological data (Figure 49).
The detailed geologic mapping, detailed lithologic logs of >14,000 m of cuttings and core from
multiple wells (well lithology data), petrographic data from more than 500 thin sections from
cuttings, core, and nearby outcrops, and down-hole alteration and geochemical data constrain the
stratigraphy of the area. All data sets are compatible with one another and reveal a relatively

Fallon, NV, Conceptual Geologic Model | 93
consistent stratigraphic section across the area. In descending stratigraphic order, the major
lithologic units are as follows (Figure 16).
Late Miocene to Quaternary basin-fill sediments (QTs), consisting predominantly of
alluvial and lacustrine deposits (up to 1.5 km thick), with sparse lenses of mafic
volcanic rock. A sequence of 2.5 to 0.7 Ma basalt flows intercalated in the upper part
of the basin fill 8 km northwest of the FORGE site (Figure 16) indicates that most of
the basin fill is late Miocene to Pliocene in age. The basin-fill sediments thicken
from < 100 m to > 1.4 km thick from east to west in the area consistent with the
presence of a west-tilted half graben. The basin-fill sediments are characterized by
good reflectivity in the seismic reflection profiles, allowing for imaging of faults, and
relatively low-resistivity probably due to substantial clay, as supported by the analysis
of cuttings. The base of the basin-fill sediments is constrained by prominent
reflectors in the seismic profiles and by well data.
Middle to late Miocene volcanic and lesser sedimentary rocks (Tvs), dominated by
basaltic andesite lavas with lesser volcanic breccia, tuff, dacite, and andesite. The
Miocene rocks are well exposed in the nearby Bunejug and Lahontan Mountains,
with similar lithologies and thicknesses found in cuttings and core at the FORGE site.
The thickness of the Miocene volcanic rocks appears to be relatively consistent across
the region, ranging from ~0.7 to 1.1 km. The base of the Miocene section (i.e.,
nonconformity at the top of the Mesozoic basement) is difficult to discern on the
reflection profiles but was constrained by four wells and gravity modeling. The
volcanic section images poorly on the seismic reflection profiles and yields
intermediate resistivity values (Figure 47 and Figure 54). The total thickness of the
Neogene section (basin-fill sediments and Miocene volcanic rocks) ranges from ~1.7
to 2.8 km in the project area. Oligocene ash-flow tuffs, although present in the region,
were not observed in the cuttings and core from the Fallon site.
Mesozoic crystalline basement (Mzu) consisting of Triassic-Jurassic metavolcanic
and metasedimentary rock, including rhyolitic tuff, quartzite, marble, and mafic lavas,
all locally intruded by Jurassic-Cretaceous granite. The basement rocks consistently
yield high resistivity values, consistent with low permeability, as supported by the
well tests. The Mesozoic basement was penetrated by four wells. Available data
suggest that meta- rhyolite and quartzite are two dominant lithologies in the area,
attaining thicknesses of ~500 m and 200 m, respectively. It is important to note that
metamorphic rocks dominate over granite in much of the Great Basin region east of
the Sierra Nevada. Thus, the basement rocks at Fallon are broadly representative of
the region. As discussed below, the Mesozoic basement at Fallon contains several
potential reservoirs of sufficient volume for research and development of EGS
technologies. Although thus far penetrated by only four wells within or proximal to
the project site, excellent analogues of the basement lithologies are exposed in nearby
mountain ranges, including the Lee-Allen area ~20 km south of the FORGE site and
the Stillwater Range ~30 km to the northeast.

Fallon, NV, Conceptual Geologic Model | 94
Similar to the stratigraphy, the structural framework is well defined by multiple mutually
supporting data sets, including detailed geologic mapping, fault kinematic data, borehole
imaging, gravity data, and seismic reflection profiles. Collectively, these data sets indicate that
the structural framework of the proposed Fallon FORGE site has the following characteristics.
A gently west-tilted half graben underlies the entire site (Figure 22).
The half graben is cut by widely spaced, relatively minor normal faults (Figure 22 and
Figure 52B).
Faults in the area are characterized by the following:
o Displacement of generally <200 m.
o Spacing of ~0.4 to 3.5 km (Figure 52B).
o Moderate to steep dips. Note that subhorizontal to gently dipping faults in the
interpreted profiles (Attachment A) result from apparent dips on faults that are
subparallel to the profiles.
o North to north-northeast strikes, although sparse E-W-striking faults are also
present in some areas.
o East-dipping faults appear to dominate and accommodated the west tilt of the half
graben.
Borehole imaging of drilling induced fractures and fault kinematic data indicate an
extensional stress regime and a WNW-trending extension direction.
Extension in this region probably began in middle Miocene time and has continued episodically
to the present. Quaternary faults and historic earthquakes in the region (Figure 5 to Figure 7,
Figure 49 and Figure 50) attest to the active tectonic environment of the region. Accordingly,
geodetic data demonstrate that the Fallon area occupies a region of relatively high transtensional
to extensional strain (Figure 4). However, despite relatively high regional strain rates, no
Quaternary faults have been observed within or proximal to the Fallon FORGE site. This may
account for the lack of hydrothermal activity at Fallon, as most geothermal systems in the region
are associated with Quaternary faults (Bell and Ramelli, 2007). It is also important to note that
favorable structural settings for geothermal activity, such as step-overs, major fault terminations,
and accommodation zones (e.g., Faulds and Hinz, 2015), appear to be absent at the Fallon site,
which also suggests a low probability of the presence of an active hydrothermal system.
5.2 3D GEOLOGIC MODEL
In order to provide a conceptual model and assess the distribution and character of potential EGS
reservoirs, we developed a 3D geologic model encompassing the area within and around the
Fallon FORGE Site. The model spans 100 km2 and is centered on the Fallon site, extending 10
km in the north-south direction and 10 km in the east-west direction (Figure 11). The geologic
model extends from the surface, which ranges between ~1200 to 1350 m above sea level, to a
depth -2500 m below sea level, spanning ~3.8 km.
The 3D geologic modeling was done in EarthVision software, using methods similar to several
recent contributions in this arena (Moeck et al., 2009, 2010; Faulds et al., 2010b; Jolie et al.,
2012, 2015; Hinz et al., 2013a; Siler and Faulds, 2013; Siler et al., 2016a, b). The 3D geologic
model consists of 28 faults within the 100 km2 area. The fault geometries are constrained by the

Fallon, NV, Conceptual Geologic Model | 95
interpretations of 14 seismic reflection profiles (Figure 56) and the traces of faults mapped in the
Bunejug and Lahontan Mountains along the eastern edge of the 3D geologic model volume
(Figure 11, Figure 12, and Figure 13). The 3D model consists of four lithologic units, with the
contacts between units defined by interpretation of the 14 seismic reflection profiles and
downhole lithologic interpretations from 24 wells within and proximal to the 3D geologic model
(Figure 57 and Figure 58).
For effective 3D modeling of the stratigraphy and structural features, the stratigraphic units
described in detail in Section 4.1 (Table 1 and Figure 19) were lumped into four lithologic units.
The four units are, from oldest to youngest: (1) undivided Mesozoic basement, consisting of
Mesozoic metasedimentary, metavolcanic, and plutonic units (Mzu); (2) Oligocene rhyolitic ash-
flow tuffs (Ttr); (3) Miocene volcanic and sedimentary rocks, consisting primarily of basaltic and
basaltic andesite lava flows (Tvs); and (4) late Miocene to Quaternary undivided sediments
(QTs). The total modeled volume of 366.5 km3 consists of 130 km3 of Mzu, 3.5 km3 of Ttr, 111
km3 of Tvs, and 122 km3 of QTs (Figure 58 and Table 11).
Two major faults sets are evident in the modeled area, a primary north-striking set and a
secondary east-striking set (Figure 59 and Figure 60). The north-striking faults dip both east and
west, though the east-dipping faults dominate and primarily control the gently west-tilted half
graben that constitutes this portion of the Carson Sink (Figure 58 and Figure 60). The west-tilted
half graben occupies the western limb of an extensional anticline, the axis of which lies just east
of the eastern edge of the 3D geologic model. The dominant east-dipping faults are relatively
widely spaced (~1.5 km), all with displacement of less than ~200 m. This geometry of widely-
spaced subparallel faults, contrasts with significantly more complex structural settings at
similarly modeled conventional hydrothermal systems in the region. For example, the Brady’s
geothermal system contains dozens of closely spaced and intersecting fault strands within an
~1.5 km-wide step-over in a normal fault zone (Siler and Faulds, 2013; Siler et al., 2016b). Such
comparisons suggest that the fault structure at the Fallon FORGE site is not conducive to hosting
a conventional geothermal system (Figure 61).
It is also important to note that Figure 59 shows that faults within the 3D model volume have an
average strike of 003o, which is compatible with the average orientation of natural fractures
imaged in four wells at the site (Figure 25). This suggests a strong correspondence between
macro- and micro-scale structures at the Fallon FORGE site. It is also important to note that the
predominant orientation of the macro-scale faults and micro-scale fractures is approximately
orthogonal to SHmin, and thus these structures are in a favorable orientation for hydraulic
stimulation.

Fallon, NV, Conceptual Geologic Model | 96
Table 11. Volumes of Rock Units in 3D Model
Total volume
modeled (km3)
Total modeled
volume 175-225 °C
(km3)
Total volume within
FORGE area (km3)
Total volume 175-225
°C within FORGE area
(km3)
All Units 366.5 65 16.6 8
QTs 122 0.2 3.2 0.1
Tvs 111 18 4.8 4.7
Ttr 3.5 1.8 0 0
Mzu 130 45 8.6 3.2 Note: Volume of the geologic model for each of the 4 modeled lithologic units. Column 1, total modeled volume
(100 km2 areal extent). Column 2 modeled volumes falling within 175-225°C. Column 3 modeled volumes within
the Fallon Geothermal Research Observatory Site (4.6 km2 areal extent). Column 4 modeled volumes within the
Fallon Geothermal Research Observatory Site and falling within 175-225°C. All volumes calculated to a depth of -
2500 m bsl or ~3800 m bgs.
Uncertainty in the 3D geologic interpretations was calculated based on relative distance from the
input datasets (Figure 62 and Figure 63). The primary input datasets utilized for constraining the
subsurface 3D geologic geometry are the lithologic logs along the well paths and seismic
reflection profiles. The distance between the locations of these datasets and all locations within
the 3D geologic model were calculated. We also assume that uncertainty increases with depth, so
relative uncertainty with increasing distance from the surface was also calculated. Relative
uncertainty was calculated by fitting these distances to logarithmic relative uncertainty curves
(Figure 63). Very near to input data, relative uncertainty in the 3D modeled geologic
interpretation is very low (i.e. we have high confidence in the geologic interpretation). With
increasing distance from each input dataset, relative uncertainty increases progressively. Past a
distance of 500 m, the characteristic spacing of the wells used for lithologic analyses, the
progressive increase in relative uncertainty with distance lessens. Relative uncertainty between
zero and one was calculated for the twenty-four wellbores with lithologic data and the seismic
reflection profiles (Figure 62 and Figure 63). The relative uncertainty volumes for all the input
datasets were summed to produce a cumulative relative uncertainty for the 3D volume for which
the 3D geologic model was constructed (Figure 62 and Figure 63).
The relative uncertainty analysis indicates that we have relatively high confidence in the
modeled geologic relationships as a result of a high density of data within the Fallon FORGE site
(Figure 63). We also have relatively high confidence in the modeled geologic relationships
directly to the east of the Fallon site. However, adjacent to the Fallon site to the north, west, and
south the density of downhole lithologic data and seismic reflection data are less, relative to the
center of the Fallon site, and the uncertainty in the modeled geologic relationships is therefore
higher.
A 3D subsurface temperature model was interpolated based on downhole temperature
measurements in eight wells (FDU-1, FDU-2, 88-24, 82-19, 84-31, 82-36, FOH-3D, and 61-36)
within and proximal to the Fallon FORGE site (Figure 64). A minimum tension gridding
algorithm was used to interpolate temperatures into data-sparse areas. The subsurface
temperature model is well constrained within the Fallon FORGE site proper, with temperature

Fallon, NV, Conceptual Geologic Model | 97
logs from 88-24, 82-19, 82-36, FOH-3D, and 61-36, all within the FORGE site. Three of these
wells, 61-36, FOH-3D and 82-36, extend to ~2200-2600 m below ground surface (bgs), so the
3D temperature model is well constrained to at least 2600 m bgs. Based on this temperature
model, the spatial locations of the 175°C and 225°C isotherms were calculated. The 175°C
isotherm lies at ~1700-1900 m bgs, whereas the 225°C isotherm lies at ~2400-2800 m bgs
(Figure 64). Within the 366.5 km3 total modeled volume, 65 km3 of crystalline rock lie between
the 175°C and the 225°C isotherms (Figure 65 and Figure 66, Table 11). Within the Fallon
FORGE site 8 km3 of crystalline rock, including both Miocene volcanic rock and Mesozoic
granitic and metamorphic basement, lie between the 175°C and the 225°C isotherms (Table 11),
and all of this volume lies within the required depths for the project of 1.5 to 4.0 km.
Figure 56. 3D perspective looking north at the 14 seismic reflection profiles (in grey) that were interpreted and synthesized in construction of the 3D geologic model, which is shown in the center-left of the image.
Modeled fault planes are shown in green. The proposed Fallon FORGE site is shown within the 3D geologic model area in red outline.

Fallon, NV, Conceptual Geologic Model | 98
Figure 57. 3D perspective view looking north of the downhole lithologic logs that were synthesized in construction of the 3D geologic model. Green lithologies are Mesozoic basement units, blue are Tertiary volcanic and yellow are Quaternary-Tertiary sediments. The range of the 3D geologic model is shown in
blue. The proposed Fallon FORGE site is shown within the 3D geologic model area in red outline.
Figure 58. 3D perspective looking north at the 3D geologic model. Mesozoic undivided basement (Mzu) in green, Miocene volcanic rock (Tvs) in blue, and late Miocene-Quaternary sediments (QTs) in yellow. Modeled
fault planes are shown in gray. Green rig symbols denote the surface location of the 24 wells that were analyzed for downhole lithologic data. The proposed Fallon FORGE site is shown by the red outline.

Fallon, NV, Conceptual Geologic Model | 99
Figure 59. A) Poles to fault planes, and B) rose diagram of the strike of faults in the 3D geologic model. Fault planes were measured for strike and dip at 50 m spacing. Poles (A) indicate that north-striking and
east-dipping faults dominate the area. Rose diagram (B) shows the mean plane strikes 003°.
Figure 60. 3D perspective looking north of the 3D geologic model. The model is sliced in the east-west direction through the Fallon FORGE site. Mesozoic undivided basement (Mzu) in green, Miocene volcanic rocks (Tvs) in blue, and Quaternary-Tertiary sediments (QTs) in yellow. Modeled fault planes are shown in
gray. Green rig symbols denote the surface locations of the 24 wells that were analyzed for downhole lithologic data. The proposed Fallon FORGE site is shown by the red outline. The widely spaced (~1.5 km),
synthetic, east-dipping normal faults all have < 200 m displacement.

Fallon, NV, Conceptual Geologic Model | 100
Figure 61. Cross-sections through 3D geologic models at (A) Fallon FORGE site, and (B) Bradys geothermal system (Siler et al., 2016b). Both models were built with similar data and similar data density. The dense
anastomosing fault system at Bradys hosts natural geothermal fluid flow at several intervals between elevations of ~1000 to -500 m. The faults at Fallon are widely spaced by comparison and not conducive to
hosting a conventional geothermal system.

Fallon, NV, Conceptual Geologic Model | 101
Figure 62. 3D perspective looking north at relative uncertainty in the 3D geologic interpretations. Warm colors correspond to low relative uncertainty and cool colors correspond to high relative uncertainty. Green rig symbols denote the surface locations of the 24 wells analyzed for downhole lithologic data. Black planes denote the location of the seismic reflection profiles that pass through the proposed Fallon FORGE site. The
Fallon site is outlines in black.
Figure 63. 3D perspective looking north at relative uncertainty in the 3D geologic interpretations. The 3D relative uncertainty model is sliced in the east-west direction through the Fallon FORGE site. Warm colors correspond to low relative uncertainty and cool colors correspond to high relative uncertainty. Green rig symbols denote the surface locations of the 24 wells analyzed for downhole lithologic data. Black planes denote the location of the seismic reflection profiles that pass through the Fallon site. The Fallon site is
shown is outlined in black. Inset shows relative uncertainty vs. distance from data for the surface, the 24 well paths, and the 14 seismic reflection profiles used in construction of the 3D geologic model. Relative
uncertainty increases logarithmically with distance from the surface, the well paths with lithologic data, and the seismic reflection profiles. Each relative uncertainty curve was adjusted such that a relative uncertainty
of 0.5 corresponds to a distance of ~500 m.

Fallon, NV, Conceptual Geologic Model | 102
Figure 64. 3D perspective looking north at the interpolated 3D temperature model. The 8 wells with equilibrated temperature logs used in this interpolation are shown. The 3D temperature model is sliced at the
175°C isotherm. The 225°C isotherm is shown in orange extending from the 3D temperature model. The Fallon FORGE site is outlined in light red.
Figure 65. 3D perspective looking north at the 3D geologic model. The model is sliced in the east-west direction through the Fallon FORGE site. Mesozoic undivided basement (Mzu) is in green, Miocene volcanic rocks (Tvs) in blue, and late Miocene-Quaternary sediments (QTs) in yellow. The 175°C isotherm is shown in
orange, and the 225°C isotherm is shown in red extending from the 3D model. The Fallon FORGE site is outlined in red.

Fallon, NV, Conceptual Geologic Model | 103
Figure 66. Oblique view of the Fallon FORGE 3D geologic model looking ~NE. Model is sliced east-west and north-south through the Fallon FORGE site. The 175°C (orange, transparent) and 225°C (red,
transparent) modeled isotherms are both shown.
5.3 PRIMARY FORGE CRITERIA
Evaluation of the multiple geologic and geophysical data sets in Section 4, as well as
development of the 3D model, permitted assessment of the major qualifying criteria for FORGE
for the Fallon project area. Supporting data and interpretations for each criteria are summarized
below and listed in Table 12. All six criteria are satisfied for the Fallon site, each by multiple
data sets, greatly reducing uncertainty across all criteria.

Fallon, NV, Conceptual Geologic Model | 104
Table 12. Relevancy to FORGE Criteria
Relevance to FORGE Criteria
Criteria
Temperature (175-225
°C) Low
Permeability Lithology
(crystalline) Depth
(1.5-4 km) Stress
Regime
No Hydrothermal
System
General Stratigraphy
Well Lithology Data
Petrographic Data
Structural Data
Fault Kinematics
Stress Regime Thermal Data Fluid Geochemistry
Alteration Well Tests Gravity and Magnetic Data Magnetotelluric Data EQ Seismology Seismic Reflection Data
TOTAL
Temperature (175-225 °C): Well temperature data provide direct evidence that the Fallon
FORGE site has temperature conditions within the specified 175 to 225°C range. Three wells
penetrate the 175°C isotherm on the Fallon FORGE site and record maximum bottom-hole
temperatures (BHTs) of 192° to 214°C (Figure 30, Figure 31, Table 13). The depth to the 175°C
isotherm ranges from 1712 to 2079 m, is consistently below the requisite minimum depth of
1500 m below ground surface, and is also below the contact between the Cenozoic strata and the
Mesozoic metamorphic and granitic basement rocks (Figure 31). Well FOH-3D penetrates a
vertical thickness of 727 m between the 175°C isotherm and 203°C at the bottom of the hole.
Based on all available well data, the 3D thermal model indicates that the true vertical thickness
between the 175 and 225°C isotherms ranges from 700 to 900 m across the FORGE site.

Fallon, NV, Conceptual Geologic Model | 105
Table 13. Primary temperature and depth parameters for FORGE well intersecting the 175°C isotherm.
Well Depth of 175°C
isotherm (m) Bottom hole
temperature (°C) Total well depth
(m) Vertical range within 175 to
225 °C (m)
FOH-3D 1712 203 2439 727
61-36 1855 192 2124 269
82-36 2079 214 2530 451
13-36* 1826 181 1966 140
Note: All depths are true vertical depths for deviated wells in meters below ground surface *Well 13-36 is 0.5 km SSW of the FORGE site boundary on private property
Fluid geochemistry provides complementary evidence of the thermal regime. Samples from well
FOH-3D indicate equilibration temperatures of ~190°C using the silica geothermometer (Table
6). These are consistent with measured 203°C bottom-hole temperatures (BHT’s) in this well.
Cation geothermometers for this well suggest higher temperatures (220-260°C), which may be
reflecting slow fluid recharge from a hotter, deeper fluid source.
Clay alteration and hydrothermal vein minerals collected from chip and core samples indicate
phyllic alteration in the Tertiary volcanic rocks and propylitic alteration in the basement rocks.
These alteration assemblages are associated with 225 to 250°C and >250°C temperatures,
respectively, which are greater than the measured temperatures observed in the same wells that
these samples were collected from. It is probable that these minerals represent a fossil thermal
regime and do not correspond to the modern thermal regime as recorded in the wells. For
example, epithermal mineralization and alteration associated with Miocene volcanism was
widespread across the region and was probably responsible for appreciable alteration of the
Miocene volcanic strata at this site. The Mesozoic basement may have been altered in the
Tertiary and/or the Mesozoic.
In summary, the well temperature data demonstrate that the Fallon site satisfies the temperature
criteria for FORGE. Complementing the well temperature data, the geothermometry calculations
from fluid geochemistry data generally agree with the measured well temperatures.
Uncertainty in Temperatures: Temperatures at depth at the Fallon FORGE site are well
constrained by several downhole temperature logs, which collectively indicate that the Mesozoic
section at Fallon is within the FORGE temperature (175-225°C) and depth (1500-2500 m)
windows. Significant errors could occur if wells have not been given time to equilibrate after
drilling and before temperature surveys are conducted. Some individual temperature surveys at
the Fallon FORGE site are not believed to be fully equilibrated (refer to Section 4.3). However,
the effects of this are more prominent in the shallow Miocene-Pliocene section. In the Mesozoic
section, where the proposed FORGE reservoir would be located, all available deep temperature
logs indicate a dominantly conductive thermal regime and that the targeted temperature/depth
criteria are met. Thus, the overall uncertainty as to whether the Fallon FORGE site meets these
criteria is low.
Additional uncertainties are introduced when temperatures are interpolated from well data into
the remaining volume of the proposed FORGE site. The 3D temperature model (Figure 64 and
Figure 65) predicts a relatively smooth varying temperature surface, indicating that wells reached
broadly similar temperatures at similar depths. This lack of spatial variability increases

Fallon, NV, Conceptual Geologic Model | 106
confidence in the ability to interpolate temperatures throughout the modeled volume.
Additionally, the conductive temperature gradients support a consistent and smoothly varying
temperature regime at depth, because in the absence of convection, conductive heat flow seeks to
minimize temperature gradients.
Low Permeability: Well-test data provide direct evidence for low permeability conditions at
the Fallon FORGE site, particularly in the Mesozoic basement rocks (Table 7, Figure 33 to
Figure 38). Two of the three deep wells, 82-36 and 61-36, that intersect the Mesozoic basement
and the 175°C isotherm recorded sub-economic injectivity test results with values of 0.14 and
0.34 lpm/kPa, respectively. Several of the wells, (e.g., 88-24; Table 7) encountered moderate,
local permeability in the Miocene and Pliocene volcanic rocks and sediments, which are
generally confined to the uppermost 1 km of Cenozoic strata. Distributed stratigraphic
permeability in the Cenozoic strata is common in contemporary basins throughout the Basin and
Range province and does not indicate corresponding permeability in the Mesozoic basement nor
does it suggest the presence of a hydrothermal system.
In addition to direct well-test data, multiple other data sets provide additional evidence that the
strata below 1.5 km depth have low permeability. The resistivity patterns in the MT data
generally follow stratigraphy across the modeled FORGE area and are not disrupted laterally by
apparent localized hydrothermal activity (Figure 47, Figure 48). Most importantly, the MT
profiles show a consistent depth at 1.5 to 2.0 km where the rocks become dramatically more
resistive, from quite low resistivity of ≤ 5 ohm-m to very high resistivity rocks with
corresponding 100's of ohm-m resistivity. The high resistivity in the Mesozoic basement
signifies hard rock with very low porosity and permeability with few open fractures. The limited
fluid geochemistry data set suggests two fluid types in the FORGE area: (1) a cooler fluid with
high TDS (>8000 mg/L) that is inferred to flow from the Mio-Pliocene units, and (2) a hotter,
less saline fluid (~ 4000 mg/L TDS) that is inferred to originate from the Mesozoic basement.
The chemically distinct geochemical pattern implies limited mixing between the Mesozoic and
the Cenozoic strata, consistent with low permeability. Furthermore, the shape of the temperature
profiles for the deep wells are broadly conductive with relatively minor steps possibly associated
with minor fluid movement, principally in the Miocene volcanic and sedimentary rocks. The
absence of a strong convective signal in the temperature profiles indicates that there are not
major high-angle permeable zones, such as along faults within the proposed FORGE site.
The structural setting and absence of known Quaternary fault activity at the Fallon FORGE site
both correspond to limited permeability geologic settings. Faults interpreted through evaluation
of 2D reflection seismic profiles are widely spaced compared to structurally complex regions
associated with amagmatic hydrothermal systems (Siler et al., 2016b). Specific structural settings
known to be associated with enhanced permeability, such as major normal fault terminations or
step-overs are not observed in the 3D geologic model.
In summary, multiple data sets indicate low permeability conditions for the Fallon FORGE site,
particularly for the Mesozoic basement.
Uncertainty in Permeability: The most conclusive evidence of low permeability is provided by
the well tests, and errors associated with this determination can be considered minimal, provided
the wells have been properly drilled without damaging formation porosity and permeability.

Fallon, NV, Conceptual Geologic Model | 107
Additional data support the assessment of low permeability at well sites, thus reducing the
uncertainty in the conclusion. These additional data are also important for reducing uncertainty
in the conclusion that low permeability extends throughout the bulk of the proposed Fallon
FORGE site volume. Perhaps principal among these other data types is the conductive
temperature gradients observed at depths below 1 km, and the similar temperatures obtained in
multiple wells at similar depths, as shown by the 3-D temperature model. The lack of significant
vertical temperature perturbations and conductive temperature regimes reduce the uncertainty of
the conclusion that the 3-D model volume is dominated by low permeability. As described
above, the additional data sets of MT, Quaternary faults and structural patterns, seismic
reflection data, and fluid geochemistry are used to reach similar conclusions. Even though the
individual uncertainties of each of these additional data are higher than that of well tests and
temperature gradients, their combined effect is to produce a consistent prediction of low
permeability. In essence, the hypothesis of low permeability is being tested with multiple
perspectives, and each time a similar conclusion is reached, the hypothesis is strengthened. This
is reflected in part by the integrated result of a smoothly varying 3D temperature model.
Crystalline Lithology: Three wells penetrate the Mesozoic basement on the Fallon FORGE site
at about 1.5 to 1.7 km depth. Based on analyses of cuttings and core, including petrographic
analyses, the Mesozoic basement is composed of metavolcanic rocks, metasedimentary rocks,
and granitic rocks (Figure 18, Figure 19; Table 1). The parent lithologies of the metavolcanic
rocks consist mostly of felsic volcanics with lesser mafic rocks. The metasedimentary rocks are
almost entirely composed of quartzite. These units correlate with regional stratigraphy around
the Carson Sink and much of western Nevada, as exhibited in regional well lithologic logs in the
basins and extensive exposures in the mountain ranges (Figure 20 and Figure 21).
In addition to the well data, modeled depth to basement across the FORGE site, based on
inversions of gravity and MT data, both correspond to consistent metamorphic and/or granitic
basement (Figure 40 to Figure 43, Figure 47, Figure 48). The geophysical inversions in
combination with 2D reflection seismic profiles and well data have provided a framework for
depicting the top of the Mesozoic basement across the Fallon FORGE site. In summary, the data
sets are consistent with metamorphic and granitic basement across the entire FORGE site with
depths to basement ranging from ~1.5 km along the eastern margin of the FORGE site to > 2 km
at the western margin of the site.
Uncertainty in Crystalline Lithology: The uncertainty in identification of crystalline lithologies
in the drill cuttings can be considered negligible from the perspective of geological
identification. Of potentially greater significance is the interpolation of those crystalline
lithologies into the remaining volume of the proposed FORGE site. In this case, the availability
of detailed gravity data, MT data, and seismic profiles play key roles. Any one of these
geophysical surveys by itself carries an appreciable degree of uncertainty at the depths at which
crystalline rocks occur. However, combined together in the 3D model, they provide a more
powerful and consistent tool for interpolating/extrapolating depth to basement with reduced
uncertainty into the remaining FORGE volume. The geophysical data also consistently predict
that the elevation of the top of crystalline rocks forms a relatively gently dipping surface, only
moderately interrupted by faults. A smoothly varying surface is easier to model, thus further
reducing uncertainty.

Fallon, NV, Conceptual Geologic Model | 108
Depth (1.5-4 km): Multiple wells and geophysical data provide key indications of the lithologic
units, permeability, and the temperature conditions at depths below 1.5 km (Figure 19, Figure 30,
Figure 31, Figure 41, Figure 47, and Figure 48). In particular, three wells penetrate to 2124 to
2530 m depth (true vertical depth) within the FORGE site. All three of these wells penetrate the
top of the Mesozoic basement between 1.5 and 1.7 km depth and penetrate the 175°C isotherm at
1.7 to 1.9 km depth. Gravity inversions across the entire Carson Sink area provide regional
depth to Mesozoic basement with ±250 m resolution. Locally, the MT profiles across the
FORGE site show a consistent depth at 1.5 to 2.0 km where the rocks become dramatically more
resistive. This corresponds to the Mesozoic basement and signifies hard rock with very low
porosity and permeability and few open fractures. The 3D thermal model indicates the top of the
smoothed 175°C isotherm is at 1.7 to 1.9 km depth across the FORGE site. The three deep wells
at the Fallon FORGE site all indicate very low permeability in the Mesozoic basement, below
1.5 km depth (Table 7).
Uncertainty in depth: The three wells drilled into basement rocks reached from 600 to 900 m
below the minimum depth threshold for the FORGE volume. This overlap is much greater than
the uncertainty of the depth measurements in the holes themselves, especially since down-hole
surveys were used to compensate for deviations in the hole trajectories. The holes also served as
a constraint and guide for interpolating the depth of temperature contours and lithologies in the
model, as described above, reducing the uncertainty that the required parameters are present at
the necessary depths. The gravity inversions also helped calibrate the seismic sections and
interpret the MT survey, all of which were combined in a comprehensive 3D model whose
unified output also serves to increase confidence and reduce uncertainties in the depth
projections of critical parameters.
Stress Regime: Stress data inferred from drilling-induced fractures imaged in bore-hole logs and
from regional fault studies indicate that the Fallon FORGE site resides in a simple extensional
environment with σ1 oriented vertically and σ2 and σ3 oriented horizontally, with an R-value
stress ratio of ~0.5 = (σ2 - σ3)/(σ1 - σ3). Analyses of drilling-induced fractures from four of the
wells on the Fallon FORGE site indicate Shmin oriented N85°W to N64°W (Figure 26, Figure
27). Analyses of fault surface data and Quaternary hydrothermal veins from the Salt Wells
geothermal area indicate Shmin oriented N80°W (Figure 24, Figure 28). These data are also
similar to stress analyses at the Bradys and Desert Peak geothermal fields (Figure 27). The
consistency between the local and regional stress regime characterization reduces the uncertainty
of the analyses of the Fallon FORGE site. These stress data are also fitting with a structural
setting dominated by generally N- to NNE-striking normal faults in the Fallon FORGE area and
much of the surrounding region.
Uncertainty in Stress Regime: The availability of bore-hole measurements with which to model
the stress regime in several wells in the proposed FORGE site greatly reduces the uncertainty in
the stress regime assignment. Extrapolation of the stress regime over the remaining volume of
the proposed FORGE site is relatively easy, because stress regimes tend to be relatively constant
over broad regions, as evidenced by the similar stress conditions noted at the Bradys and Desert
Peak geothermal fields located some distance away. Additional data from surface faults and
veins, as described above, provide further corroboration to reduce uncertainty.

Fallon, NV, Conceptual Geologic Model | 109
No Hydrothermal System: The well test data, temperature profile data, MT data, fluid
geochemistry data, and structural data all individually and collectively indicate that the Fallon
FORGE site is not connected with a hydrothermal system. The well temperature profiles show a
dominantly conductive pattern rather than convective for the FORGE site. The resistivity
patterns in the MT data generally follow the primary stratigraphic units and do not appear to
reflect any significant hydrothermal activity. The fluid geochemistry indicates that fluids are not
readily mixing between the Mesozoic and Cenozoic stratigraphic units. The well tests
demonstrate ubiquitous low permeability at depths >1.5 km, particularly in the Mesozoic
basement. Additionally, the structural setting is not complex, is not associated with Quaternary
fault activity, and does not contain a favorable structural setting for geothermal activity (e.g.,
fault step-over or major fault termination). Thus, based on structural geology, this site is not
expected to have high permeability or to host a hydrothermal system. Finally, a regional play
fairway analysis shows that the area has relatively low values of combined permeability and play
fairway potential (Attachment C, Figure C3 and Figure C4), while also having a very high
degree-of-exploration (Attachment C, Figure C5). Collectively, these relationships indicate that
it is very unlikely that an active hydrothermal system resides within the proposed Fallon FORGE
site.
Uncertainty of Lack of Hydrothermal System: Given the presence of potentially economic
temperatures at potentially economic depths to produce electricity, the only missing parameter
for a viable geothermal system is permeability (over a sufficiently large interconnected volume).
Hence, the uncertainties of not having an active hydrothermal system are similar to the
uncertainties in defining permeability. Fundamental in this regard are the measurements of low
permeability in two wells that penetrate into the target FORGE depth range of 1.5 to 4.0 km.
Uncertainties in the permeability measurements themselves can be considered low, and the key
remaining uncertainty is the confidence in projecting low permeability to the remainder of the
proposed FORGE volume. This is especially true given the known tendencies of permeability to
vary drastically over short distances due to the presence or absence of suitable structure.
Fortunately, the other data sets provide key information for assessing permeability over broader
volumes. Key among these parameters is temperature gradient, which in all deep holes is
decidedly conductive in nature. This provides confidence (reduces uncertainty) that the wells are
not suffering from drill-related formation damage, nor do they represent “near-misses” at the
depths to which they penetrated, because otherwise, greater perturbations in the conductive
gradients would be present.
Further evidence that can be used to increase confidence in the lack of a viable geothermal
system at even greater distances from the tested wells includes the MT survey (no domal feature
in the overlying clay zone) and the structural assessment (low fault density and lack of favorable
structural setting). Interestingly, the overall pattern of hydrothermal alteration, beginning with a
clay zone at shallow depths and passing to a propylitic zone within basement rocks, is consistent
with geothermal activity, but in this case, uncertainty is high because a lack of interconnected
vein systems, the nearly ubiquitous presence of this style of alteration in older host rocks in
Nevada, and the lack of radiometric dating, all suggest that little confidence can be placed on the
alteration zoning itself in defining the presence of active geothermal flow. The lack of fluid
geochemical signatures, which could indicate fluids passing from one depth to another, suggests

Fallon, NV, Conceptual Geologic Model | 110
that, in fact, a viable hydrothermal system is not present. Combined modeling of all factors
yields one conclusion consistent with all data; that being that a hydrothermal system is not
present. The uncertainty of the combined model is less than the uncertainties of the component
parts.
Finally, a regional perspective on the likelihood of geothermal activity is provided by a recently
completed play fairway favorability model (Faulds et al., 2015; Attachment C), which supports
the low expectation of geothermal activity, and recognizes the relatively high degree of
exploration in the FORGE site, which, as expressed in the parameters above, reduces uncertainty
in the assignment. Potential targets for EGS experiments (Table 12) are satisfied within a
relatively large volume of the Mesozoic basement rocks in the proposed FORGE site at Fallon.
The 3D model shows that about 8 km3
of crystalline rock lie between the 175°C and the 225°C
isotherms at depths ranging from ~1.5 to 3.8 km. On the basis of the detailed lithologic logs and
petrographic data, we estimate that much of this volume (>3.2 km3) resides in competent
lithologies conducive to hydraulic stimulation, such as meta-rhyolite, quartzite, and granite
(Figure 19). These basement rocks have low permeability, as demonstrated by flow tests (Figure
33 to Figure 38), and consistently yield high resistivity values (Figure 47 and Figure 48),
suggesting little if any current hydrothermal activity. The structural framework is also conducive
to EGS research, because a favorable setting for geothermal activity is absent and faults are
widely spaced (Figure 10 and Figure 54). Nonetheless, borehole imaging demonstrates that
fractures are abundant and favorably oriented in the current stress field for stimulation, as the
dominant fracture sets are roughly parallel to SHmax, which is well defined in this area based on
analysis of both drilling induced fractures and fault kinematic data. Thus, there are several
relatively coherent blocks with sufficient volumes of competent rock primed for EGS
experiments.
There are at least three possible, competent target formations in Mesozoic basement for
stimulation in the FORGE project area: (1) Triassic to Jurassic felsic metavolcanic rocks, (2)
Jurassic quartzite, and (3) Jurassic to Cretaceous granitic intrusions. Figure 67 shows two
possible reservoirs within metavolcanic rocks and quartzite in the central to eastern part of the
FORGE site. It is also important to reiterate that relatively high strain rates in the region (Figure
4) would facilitate reactivation of shear fractures during hydraulic stimulation. Furthermore, the
lack of magmatic activity and minimal seismicity optimizes predictive analysis of the stress field
throughout the site, as local perturbations are unlikely in this relatively stable setting.

Fallon, NV, Conceptual Geologic Model | 111
Figure 67. 3D model of potential EGS reservoirs in Mesozoic crystalline basement rock, including meta-rhyolite, quartzite, and granite in the central to eastern parts of the proposed FORGE site at Fallon. Several
deep wells in this area provide lithologic, thermal, and permeability data for these volumes. These reservoirs lie between the 175oC and 225oC isotherms, as shown by the orange and red planes projecting out of the model, respectively. Note the widely spaced faults and relatively coherent structural blocks between the
faults lying at the requisite depths and temperatures for development. The Mesozoic basement in this area is characterized by low permeabilities, as evidenced by well tests and high resistivity values.
5.4 FUTURE WORK – ADDITIONAL DATA NEEDS
Although substantial geologic, geochemical, and geophysical data have previously been amassed
for the Fallon area, thus permitting assessment of its potential for hosting FORGE, additional
data are required for fully characterizing the site. These data needs primarily involve better
characterization of the subsurface in order to more specifically target potential EGS reservoirs
and select drilling sites. Data needs include the following:
Analogue studies of potential reservoir rocks: Analogue studies of Mesozoic basement
in nearby mountain ranges to better characterize composition and structural features.
This would include detailed analysis of the distribution, orientation, and density of
various structural features, such as bedding, foliations, and fractures. Excellent
exposures for such studies are present in the Stillwater Mountains, Sand Springs
Range, and in the Lee- Allen area (Figure 11).
Geochronology studies: 40Ar/39Ar dating of key volcanic units from cuttings and core,
including lenses of mafic lavas intercalated in the basin-fill sediments, to better
constrain the stratigraphy as well as the age of alteration and faulting.
Gravity and magnetic surveys: More work can be done with existing data, including
more extensive quality control and reprocessing of the data sets. Further processing
should be applied to help determine source depths and better constrain source
geometries. More importantly, high-resolution 2D ground profiles of gravity and
magnetics should be planned along key transects across the FORGE area and
coordinated with other geophysical investigations, such as seismic reflection surveys.
In addition, performing a dense gravity grid survey (e.g., similar to the existing high-
resolution survey spanning the eastern half of the FORGE area), as well as a high-
resolution aeromagnetic survey would facilitate high-resolution mapping of subsurface

Fallon, NV, Conceptual Geologic Model | 112
structures. High resolution gravity and magnetic data covering the entire FORGE area
will enable rigorous 3D modelling of the potential field data, a task which has not been
performed in previous work. 3D geophysical modelling of potential field data is
important because it can be used to help characterize basin geometry and resolve intra-
basin and basin-bounding faults and fracture zones that may be susceptible to
hydrothermal flow or activated during stimulation. Furthermore, such a potential field
modelling exercise can be used to validate the 3D geological model built for the
FORGE area using two independently derived datasets (i.e., gravity and magnetics).
MEQ network: Enhancement and expansion of the micro-earthquake network is needed
to provide a more detailed understanding of background seismicity and also fully
deploy a network capable of monitoring EGS activities at the site.
Fluid geochemistry: Additional analyses of fluid geochemistry in all available wells to
better characterize the fluids present at Fallon, understand potential fluid flow
pathways and mixing relationships, and improve the geothermometry estimates.
Seismic reflection data: Acquisition of 3D seismic within and proximal to the proposed site to better image fine-scale faults cutting basin-fill sediments and stratigraphic
relations. This may include a 3D seismic array covering the 100 km2
3D model area and a few additional 2D profiles extending across the margins of the southeastern Carson Sink, which would image basin-bounding faults and possibly define the structural margins of the Carson Lake geothermal system to the southeast of the proposed FORGE site.
Drilling (slimline) and core sampling: Drilling and collection of core from potential
EGS reservoir rocks and utilization of the most innovative borehole imaging techniques
to better constrain rock mechanical properties and reservoir characteristics at the site.
For example, core and borehole imaging from this hole would be used to better
delineate stratigraphic and structural relationships, determine strength parameters for
potential reservoir rocks and refine estimates of the stress regime. Collection of rock
property data from core samples (e.g., density, porosity, permeability, magnetic
susceptibility, and thermal conductivity) will be used to refine geophysical inversions
(gravity and magnetic) models, constrain formation permeability, and improve thermal
models.
Refine 3D conceptual model: Incorporate all new data and synthesize with previously
acquired data sets to refine the 3D model, with a specific aim of elucidating potential
EGS reservoir characteristics, such as location, volume, composition, geometry and
density of preexisting fractures, and permeability.

Fallon, NV, Conceptual Geologic Model | 113
6 CONCLUSIONS
This document described the geologic setting and available geological, geophysical, and
geochemical data sets for the proposed FORGE site at Fallon, Nevada, and integrated these data
sets into a comprehensive, 3D conceptual geologic model for the site (Figure 66). The Carson
Sink is a large late Miocene to recent composite basin within the northwestern Great Basin,
which is experiencing some of the highest extensional strain rates within the Basin and Range
province (Figure 4). The Fallon site occupies 4.5 km2 on two parcels that include land owned by
the Naval Air Station Fallon (NASF) and leased and owned by Ormat Nevada, Inc. (Figure 1 and
Figure 2). In addition, about 40 km2 of surrounding lands are open to monitoring and
instrumentation activities. The site has excellent infrastructure, including a well maintained
network of roads, abundant wells, available storage for equipment and supplies at the NASF, and
access to electrical and water resources. A total of 12 geothermal wells and 34 temperature
gradient holes have previously been drilled for geothermal exploration within the NASF and
Ormat lease area (Figure 14).
Multiple preexisting data sets were reviewed and analyzed in this report. These include the
following.
Comprehensive information on the stratigraphic framework provided by:
o Surface lithologic data as furnished by detailed geologic maps of the entire area
(Figure 13).
o Well lithologic data, including >14,000 m of cuttings and core (Figure 19).
o Petrographic data from cuttings and core, as well as nearby bedrock exposures.
Structural data from multiple data sets:
o General structural framework as provided by the detailed geologic maps and
regional syntheses (Figure 12 and Figure 13).
o Geometry and kinematics of faults.
o Stress regime, as furnished by borehole imaging of drilling induced fractures and
fault kinematic data (Figure 25 and Figure 27).
Thermal data, as provided by down-hole temperature logs from multiple wells (Figure
31).
Fluid geochemical data (Figure 32 and Table 4, Table 5, Table 6).
Alteration data gleaned from cuttings and geochemical analyses.
Well flow testing data (Figure 33 to Figure 38).
Gravity and magnetic data (Figure 40 and Figure 42).
Magnetotelluric data (Figure 46 and Figure 47).
Regional seismicity and local micro-earthquake data (Figure 49 and Figure 51).
Seismic reflection data, including 14 profiles totaling ~270 km across the southern
Carson Sink (Figure 52A).
The above data sets were utilized to define the stratigraphic and structural framework and
provide the building blocks for developing a comprehensive 3D geologic model of the proposed
Fallon site. In descending order, the main stratigraphic units in the area include: (1) Late
Miocene to Quaternary basin-fill sediments up to 1.5 km thick, (2) Miocene volcanic and lesser
sedimentary rocks (0.7-1.1 km thick), and (3) Mesozoic basement consisting of Triassic-Jurassic

Fallon, NV, Conceptual Geologic Model | 114
metavolcanic and metasedimentary rocks intruded by Jurassic-Cretaceous granitic plutons. The
structural framework is characterized by a broad, gently west-tilted fault block or half graben,
which is cut by widely spaced, northerly striking normal faults with relatively minor
displacements (< ~200 m displacement). These data sets were also reviewed in the context of
the key characterization and qualification criteria for an ideal FORGE site (Figure 15 and Table
12). These criteria include: (1) temperatures between 175oC and 225°C, (2) low permeability, 3)
crystalline bedrock (not a sedimentary basin), (4) depth between 1.5 and 4 km, (5) favorable
stress regime, and (6) the lack of an existing hydrothermal system. The 3D model provides
critical subsurface control on the stratigraphic, structural, and thermal framework of the area,
including delineating the location in 3D space of the 175oC and 225oC isotherms (Figure 65 and
Figure 66), and allows for evaluation of the FORGE criteria across the entire 3D volume of the
Fallon site.
All major criteria for FORGE are satisfied at the proposed Fallon site (Table 12 and Figure 15).
The required temperature conditions of the FORGE site were provided by well logs, fluid
geochemistry, and the 3D thermal model. Low permeability conditions were characterized by
well flow tests, MT models, stress data, and the 3D geological model. The crystalline lithologic
units that reside in the subsurface at the FORGE site were delineated by detailed geologic maps,
core and cuttings from wells, petrographic data, reflection seismic profiles, MT models, and the
3D geologic model. The 1.5-4 km depth of potential targets for EGS experiments was
constrained by well paths, reflection seismic profiles, gravity models, MT data, and the 3D
model. The lack of an active hydrothermal system was demonstrated by temperature data, well
tests, MT models, the overall structural setting, and the lack of Quaternary faults. Potential
competent target formations for stimulation at the site include Triassic to Jurassic felsic
metavolcanic rocks, Jurassic quartzite, and Jurassic to Cretaceous granitic intrusions. Moreover,
on the basis of the 3D model, we identified at least two possible target zones for EGS
experiments in the Mesozoic basement (Figure 67), which satisfy all FORGE criteria. Additional
data needs to refine these selections in a possible Phase II of this project were also described.
In summary, the documented temperatures, permeability, lithologic composition of potential
reservoirs, and structural setting demonstrate that the Fallon FORGE site contains sufficient rock
volumes well within the criteria specified for FORGE, while also residing within a favorable
stress regime with no evidence of an active hydrothermal system. All of these attributes
facilitate development at Fallon of a site dedicated to testing and improving new EGS
technologies and techniques by the subsurface scientific and engineering community.

Fallon, NV, Conceptual Geologic Model | 115
ATTACHMENT A: WELL DATA SUMMARY
Numerous wells exist on the FORGE site and in the surrounding region. These include
geothermal wells, temperature gradient holes, and oil exploration wells, each with variable
down-hole data. Listed in this attachment are geothermal wells organized according to location
on the FORGE site, FORGE monitor area, or surrounding area (Tables A1, A2, and A3). Well
locations are shown in Figure A1, following the tables.
Table A1. Geothermal wells on the FORGE site.
Well Name 61-36 82-19 82-36
(FOH-1A) 86-25 88-24 FOH-2 FOH-3D
Well Type - - Observation - - Observation Observation
Depth (ft) 7004 1733 8999 2990 4991 4488 8959
Depth (m) 2135 528 2743 911 1521 1368 2731
Temp. (°F) 378 161 417 226 280 320 379
Temp. (°C) 192 72 214 108 138 160 193
Year Completed
2013 2014 2014 2014 2012 1986 2005
Perforation depth span (ft)
2500-7021
1500-2000 4000-9000 2500-3050
3945-4022, 4215-5020
- 7000-9000
Perforation depth span (m)
762-2140
457-610 1216-2743 762-930 1202-1226, 1285-1530
- 2134-2743
Cuttings/Core Cuttings Cuttings Cuttings Cuttings Cuttings Cuttings +
Core Cuttings
Petrographic Thin Sections
Yes (72) - Yes (100) - Yes (50) - Yes (87)
Fluid Inclusion Analyses
- - Yes - - - Yes
Mudlogs 2013 - 2014 2014 2012 - 2005
Fluid Geochemistry
Yes - - - Yes - Yes
3 Month Equilibrated Temp
- 2014 2014 - 2012 - 2005
Static PTS 2013 2014 2014 2014 2012 - 2005
Flowing PTS 2013 - 2013 - - -
Injection Test 2014 2014 2014 2014 2014 - -
Air Lift 2013 2014 - 2014 2012 - 2005
Nitrogen Lift - - 2013 - 2013 -
Pump Test 2014 - 2014 - - - -
E-Logs 2013 2014 - 2014 2012 - 2005
Image Logs 2013 2014 - 2014 2012 - 2005

Fallon, NV, Conceptual Geologic Model | 116
Table A2. Geothermal wells on the FORGE monitor area.
Well Name 18-5 72-7 84-31 87-02 Carson Strat 1 (36-32)
Depth (ft) 3000 2992 5942 1915 1401
Depth (m) 914 912 1811 584 427
Temperature (°F)
255 268 264 140 190
Temperature (°C)
124 131 129 60 88
Date Completed
2012 1981 2008 - 1996
Mudlogs Yes - Yes - -
Cuttings/Core Cuttings + Core Cuttings Cuttings Cuttings Cuttings
Petrographic Thin Sections
Yes (29) - Yes (62) - -
Injection Test 2012 - - - -
Air Lift - - 2009 - -
Table A3. Geothermal wells in the area surrounding the FORGE site or monitor areas.
Well Name Depth (m) Depth (ft)
Date Completed Cuttings/Core Mudlogs
Temperature Logs E-Logs
13-36 1966 6450 2010 Cuttings yes - 2010
14-1 896 2940 2009 Cuttings yes - -
14-25 213 700 1985 - - - -
14-36 2591 8500 1981 - yes - -
17-16 2199 7213 2007 Cuttings yes 2007 2007
19-21 - - - - - - -
24-21 3051 10,011 - Cuttings - - -
34-33 3051 10,011 2009 Cuttings yes 2009 -
35A-11 3057 10,031 2009 Cuttings yes 2009 -
47-11 - - - - - - -
47A-11 230 755 2008 Cuttings yes -
51-20 110 3610 - Cuttings + Core - - -
51A-20 3176 10,421 - Cuttings yes -
56A-14 229 750 2008 Cuttings yes -
58-9 - - - - - - -
58A-9 117 385 2008 Cuttings yes -
62-15 2666 8745 2008 Cuttings yes - -
78-36 1689 5540 2010 Cuttings yes 2010 -
86-15 2134 7000 2007 Cuttings yes - -

Fallon, NV, Conceptual Geologic Model | 117
86A-15 229 750 2008 - yes - 2008
FDU-1 454 1490 1996 - - - -
FDU-2 1343 4407 1996 - - 2013 -
Figure A1. Geothermal wells, temperature gradient holes, and oil exploration holes within a ~15 to 20 km radius of the FORGE site. Includes 76 wells and 145 TGHs in total (left). Geothermal wells on the FORGE site (Table A1), on the FORGE monitor area (Table A2), in the nearby area (Table A3) with data listed available per
well (right).

Fallon, NV, Conceptual Geologic Model | 118
ATTACHMENT B: INTERPRETATIONS OF SEISMIC REFLECTION PROFILES
Fourteen seismic reflection profiles, totaling 270 km in length, were interpreted from the
southern Carson Sink within and proximal to the proposed Fallon FORGE site (Figure B1). All
interpreted profiles are shown below. Five profiles (N-1, N-3, N-4, N-5, and N-6) were provided
by the Navy Geothermal Program Office. The Navy profiles were originally acquired in 1994
and were reprocessed and migrated by Optim, Inc., in 2011. The Navy profiles are non-
proprietary, public domain data.
The license to interpret nine additional profiles (FL1 to FL9) was acquired from Seismic
Exchange, Inc. (SEI), in Houston, Texas. These profiles were originally acquired by the oil
industry in the 1970s and 1980s. These data are owned and controlled by SEI, but UNR has the
license to interpret the data and publish these interpretations upon review by SEI. Only scanned
images of un-migrated paper plots were available for the SEI profiles, but as discussed in the
text, velocity models and gravity data permitted time to depth conversions of interpreted contacts
and faults. However, details on the original velocity models and processing parameters
(including shotpoint locations) are proprietary for the SEI profiles. Thus, the interpreted profiles
obtained from SEI are shown below without such parameters. All interpreted profiles were
incorporated into the 3D geological model for the proposed Fallon FORGE site.
Figure B1. Generalized geologic map of the FORGE area near Fallon, NV, showing locations of interpreted seismic reflection profiles (red and black seismic lines highlighted in yellow to show areas interpreted),
Quaternary faults (red lines), and depth of Mesozoic basement. The FORGE area is in green and surrounding monitor areas are shown by gray hashes. Black dots are wells with available data from logs, cuttings, or
core.

Fallon, NV, Conceptual Geologic Model | 119
Profile N-1
Profile N-3
Profile N-4

Fallon, NV, Conceptual Geologic Model | 120
Profile N-5
Profile N-6
Profile FL-1
Seismic data owned or controlled by Seismic Exchange, Inc.; interpretation is that of the University of Nevada, Reno.

Fallon, NV, Conceptual Geologic Model | 121
Profile FL-2
Seismic data owned or controlled by Seismic Exchange, Inc.; interpretation is that of the University of Nevada, Reno. Profile FL-3
Seismic data owned or controlled by Seismic Exchange, Inc.; interpretation is that of the University of Nevada, Reno.

Fallon, NV, Conceptual Geologic Model | 122
Profile FL-4
Seismic data owned or controlled by Seismic Exchange, Inc.; interpretation is that of the University of Nevada, Reno. Profile FL-5
Seismic data owned or controlled by Seismic Exchange, Inc.; interpretation is that of the University of Nevada, Reno.

Fallon, NV, Conceptual Geologic Model | 123
Profile FL-6
Seismic data owned or controlled by Seismic Exchange, Inc.; interpretation is that of the University of Nevada, Reno.

Fallon, NV, Conceptual Geologic Model | 124
Profile FL-7
Seismic data owned or controlled by Seismic Exchange, Inc.; interpretation is that of the University of Nevada, Reno.

Fallon, NV, Conceptual Geologic Model | 125
Profile FL-8
Seismic data owned or controlled by Seismic Exchange, Inc.; interpretation is that of the University of Nevada, Reno.

Fallon, NV, Conceptual Geologic Model | 126
Profile FL-9
Seismic data owned or controlled by Seismic Exchange, Inc.; interpretation is that of the University of Nevada, Reno.

Fallon, NV, Conceptual Geologic Model | 127
ATTACHMENT C: PLAY FAIRWAY ANALYSIS
Several regional data sets were recently synthesized into a detailed statistical analysis of
geothermal play fairways of a broad transect across the Great Basin of Nevada (Figure ; Faulds
et al., 2015, 2016). This analysis employed an expert-guided, fuzzy logic system (e.g., Dixie
Valley; Iovenitti et al., 2012) guided and constrained by spatial statistics, including weights-of-
evidence and logistic regression. The model integrated each input data set into two key
hierarchal components considered necessary for an economic geothermal reservoir (the “play”)
to form: 1) permeability and 2) heat. The major contributing sections in this fairway model
include: 1) regional permeability (regional strain and stress), 2) intermediate-scale permeability
(distribution of Quaternary faults), 3) local permeability (favorable structural settings), and 4)
availability of heat. In addition, direct evidence from fluid geochemistry and degree of
exploration, which incorporates well data, depth to water table, and regional aquifers, were
integrated to better define exploration opportunities. A major aspect of developing the play
fairway model was determining the composition of the key hierarchal components (i.e.,
individual evidence layers) and the relative weights assigned to each both within and between
each parameter. The determination of weights was aided by establishing benchmarks based on
known geothermal activity and using weights-of-evidence and logistic regression to define
weights based on spatial correlations. Figure shows the modeling workflow. The methodology
is discussed in detail in Faulds et al. (2015). Of relevance here is how the proposed Fallon
FORGE site scores in the fairway model relative to known hydrothermal systems in the region
and thus whether it is likely to host a natural hydrothermal system itself.
The Fallon FORGE site yields relatively low values of combined permeability and overall
fairway scores. The fairway values are calculated from both the combined permeability and
heat. Values of combined permeability range from 13.9 to 49.75 across north-central Nevada,
with the values from 34 high-temperature (≥130oC) geothermal systems averaging 35.38. The
Fallon FORGE site has a significantly lower, combined permeability score of 26.5 (Figure ) due
primarily to the lack of both Quaternary faults and a favorable structural setting. The fairway
score at Fallon is 43 (Figure ), compared to a range from ~28 to near 65 in north-central Nevada,
with the 34 high-temperature geothermal systems yielding an average of 51.37.
An additional method for evaluating the likelihood of encountering an active geothermal system
is assessing the degree-of-exploration for a given area. The degree-of-exploration modeling for
the Carson Sink region incorporates two types of information (Faulds et al., 2015). The first
assesses the ability of a geothermal system to remain blind without active surface thermal
manifestations, and the second considers the thoroughness of past geothermal exploration efforts.
Blindness factors incorporated into the model include depth to the water table, the distribution of
Quaternary playa deposits and young alluvium, and the distribution of the carbonate aquifer. Hot
springs are less likely to form where the water table is deep, which is not the case at Fallon.
Thermal springs are also less likely to form where shallow permeable aquifers are present,
because these aquifers can capture and entrain thermal fluids rising from depth. The Carson Sink
does contain some shallow permeable aquifers, which could hinder development of thermal
springs. However, the second major component of the degree-of-exploration model involves
assessing the thoroughness of exploration through drilling. Degree-of-exploration assignments
were made to the well database depending on the depth of the hole and the depth of the water

Fallon, NV, Conceptual Geologic Model | 128
table. Degree-of-exploration increases with well depth. A 2-km-radius of influence was used for
the well data, and the maximum “degree-of-exploration” from wells within that radius was
assigned to each grid cell. Abundant drill holes and several relatively deep wells within the
proposed Fallon FORGE site indicate a very high degree-of-exploration (Figure ), among the
highest in the region. This indicates that discovery of a hydrothermal system is very unlikely
within the proposed FORGE site at Fallon, particularly within the 4.5 km2 footprint.
Figure C1. Geothermal play fairway model of central Nevada. The Fallon FORGE site lies in the western part of a broad region in which as many as 9 parameters were combined to estimate the favorability for
geothermal activity (Faulds et al., 2015). Warmer colors indicate higher fairway values. The proposed FORGE site lies in an area of moderate favorability.

Fallon, NV, Conceptual Geologic Model | 129
Figure C2. Nevada play fairway modeling workflow. Red numbers indicate relative weights determined from weights of evidence. Black numbers indicate expert driven weights used in the analysis. In all cases, the
expert driven weights took into account the statistical analyses.

Fallon, NV, Conceptual Geologic Model | 130
Figure C3. Combined permeability map for the Carson Sink region. Figure shows the major parameters and their relative weightings that are incorporated in the combined permeability model. The Fallon FORGE
project area has relatively low values of combined permeability.

Fallon, NV, Conceptual Geologic Model | 131
Figure C4. Play fairway map for the Carson Sink region. The Fallon FORGE site has a significantly lower score for play fairway compared to known geothermal systems in the region. Figure shows the major
parameters and their relative weightings that are incorporated in this model. See Faulds et al. (2015) for detailed descriptions of the methodology.

Fallon, NV, Conceptual Geologic Model | 132
Figure C5. Degree-of-exploration model for the Carson Sink region. Note that the Fallon FORGE site has a very high degree-of-exploration, suggesting that discovery of a new hydrothermal system is unlikely within
the proposed FORGE footprint.

Fallon, NV, Conceptual Geologic Model | 133
REFERENCES
Anderson, E.M., 1951, The dynamics of faulting and dyke formation with application to Britain: Oliver & Boyd, Edinburgh.
Barton, C.A., Hickman, S., Morin, R., Zoback, M.D., Finkbeiner, T., Sass, J. and Benoit, D., 1997, Fracture Permeability and its Relationship to In-Situ Stress in the Dixie Valley, Nevada, Geothermal Reservoir: Proceedings Twenty-Second Stanford University Geothermal Workshop.
Barton, C., Hickman, S., Morin, R., Zoback, M.D., and Benoit, R.,1998, Reservoir-scale fracture per-meability in the Dixie Valley, Nevada, geothermal field, in Rock Mechanics in Petroleum Engineering, vol. 2, R. M. Holt et al. (eds.), Society of Petroleum Engineers, Richardson, TX., p. 315-322.
Barton, M.D., Johnson, D.A., Dilles, J.H., and Einaudi,, M.T., 2000, Contrasting styles of intrusion-associated hydrothermal systems–A Preface, in Dilles, J.H., Barton, M.D., Johnson, D.A., Proffett, J.M., Einaudi, M.T., and Crafford, E.J., eds., Part I: Contrasting styles of intrusion-associated hydrothermal systems: Part II: Geology and gold deposits of the Getchell region: Society of Economic Geologists Guidebook Series, v. 32, p. 1-7.
Bell, J.W. and House, P.K., 2010, Geologic Map of the Grimes Point Quadrangle, Churchill County, Nevada: Nevada Bureau of Mines and Geology Map 173, 1:24,000 scale, 1 sheet, 24 p.
Bell, J.W., and Ramelli, A.R., 2007, Active faults and neotectonics at geothermal sites in the western Basin and Range: Preliminary results: Geothermal Resources Council Transactions, v. 31, p. 375-378.
Bell, J.W., Caskey, S.J., and House, P.K., 2010, Geologic Map of the Lahontan Mountains Quadrangle, Churchill County, Nevada: Nevada Bureau of Mines and Geology Map 168, 1:24,000 scale, 1 sheet.
Bellier, O. and Zoback, M.L., 1995, Recent state of stress change in the Walker Lane zone, western Basin and Range province, United States: Tectonics, v. 14, no. 3, p. 564-593.
Bennett, R.A., Wernicke, B.P., Niemi, N.A., Friedrich, A.M., and Davis, J.L., 2003, Contemporary strain rates in the northern Basin and Range province from GPS data: Tectonics, v. 22, no. 2, p. 1008-1020, doi:10.1029/ 2001TC001355.
Benoit, D., 1990, The Carson Lake Geothermal Prospect: Oxbow Power Corporation Report, 38 p. Benoit, W.R., J.E. Hiner, and Forest, R.T., 1982, Discovery and geology of the Desert Peak geothermal
field: a case history: Nevada Bureau of Mines and Geology Bulletin 97, 82 pages. Blackwell, D.D., and Richards M., 2004. Geothermal map of North America, Am. Assoc. Petroleum
Geologists (AAPG), 1 sheet, scale 1:6,500,000. Blake, K., and Davatzes, N.C., 2012, Borehole image log and statistical analysis of FOH-3D, Fallon Naval
Air Station, NV: Proceedings, Thirty-Seventh Workshop on Geothermal Reservoir Engineering, Stanford University, 14 p.
Blake, K., Tiedeman, A., Sabin, A., Lazaro, M., Meade, D., Huang, W-C., 2015, Naval Air Station Fallon Mainside: Update of geothermal exploration: Geothermal Resources Council Transactions, v. 39, p. 407-414.
Blakely, R.J., 1995, Potential theory in gravity and magnetic applications: New York, Cambridge University Press, 441 p.
Blakely, R.J., and Simpson, R.W., 1986, Approximating edges of source bodies from gravity or magnetic data: Geophysics, v. 51, p. 1494–1498, doi: 10.1190/1.1442197.
Bruce, J. L., 1979, Fallon exploration project, Naval Air Station, Fallon, Nevada: Technical publication No. 6194, Naval Weapons Center, China Lake, California.
Buer, N. J. Van, and Miller, E. L., 2010, Sahwave Batholith, NW Nevada: Cretaceous arc flare-up in a basinal terrane: Lithosphere, v. 2, no. 6, p. 423-446.

Fallon, NV, Conceptual Geologic Model | 134
Busby-Spera, C.J., 1988, Speculative tectonic model for the early Mesozoic arc of the southwest Cordilleran United States: Geology, v. 16, p. 1121-1125.
Calvin, W.M. and Pace, E.L., 2016, Alteration in geothermal drill core using a field-portable spectroradiometer: Geothermics, v. 61, p. 12-23.
Calvin, W.M., Bell, J.W., and Hinz, N.H., 2012, Final Technical Report: Geothermal assessment of NAS Fallon land: provided to the Navy Geothermal Program Office (GPO) as part of a grant deliverable (funded by the GPO), 51 p.
Caskey, S.J., Wesnousky, S.G., Zhang, P., and Slemmons, D.B., 1996, Surface Faulting of the 1954 Fairview Peak (Ms7.2) and Dixie Valley (Ms6.8) Earthquakes, Central Nevada: Bulletin of the Seismological Society of America, v. 86, no. 3, p. 761-787.
Caskey, S.J., Bell, J.W., Ramelli, A.R., and Wesnousky, S.G., 2004, Historical surface faulting and paleoseismicity in the area of the 1954 Rainbow Mountain-Stillwater earthquake sequence, central Nevada: Bulletin of the Seismological Society of America, v. 94, no. 4, p. 1255-1275.
Chabora, E., Zemach, E., Spielman, P., Drakos, P., Hickman, S., Lutz, S., Boyle, K., Falconer, A., Robertson-Tait, A., Davatzes, N., Rose, P., Majer E., and Jarpe, S., 2012, Hydraulic Stimulation of Well 27-15, Desert Peak Geothermal Field, Nevada, USA, Proc. 37th Stanford Geothermal Workshop, SGP-TR-194,12 p.
Cohen, J. K. and Stockwell, J. W., 2008, CWP/SU: Seismic Unix Release No. 41: An open source software package for seismic research and processing: Center for Wave Phenomena, Colorado School of Mines.
Combs, J., Monastero, F.C., Bonin, K.R., Sr., and Meade, D.M., 1995, Geothermal exploration, drilling, and reservoir assessment for a 30 MW project at the Naval Air Station, Fallon, Nevada, USA: Proceedings, World Geothermal Congress, p. 1371-1375.
Connard G., Couch R., Gemperle M., 1983, Analysis of aeromagnetic measurements from the Cascade Range in central Oregon: Geophysics, v. 48, no. 3, p. 376-390.
Coolbaugh, M., Zehner, R., Kreemer, C., Blackwell, D., Oppliger, G., Sawatzky, D., Blewitt, G., Pancha, A., Richards, M., Helm-Clark, C., Shevenell, L., Raines, G., Johnson, G., Minor, T., and Boyd, T., 2005, Geothermal potential map of the Great Basin, western United States: Nevada Bureau of Mines and Geology Map 151.
Curewitz, D., and Karson, J.A., 1997, Structural settings of hydrothermal outflow: Fracture permeability maintained by fault propagation and interaction: Journal of Volcanology and Geothermal Research, v. 79, p. 149–168.
Davatzes, N., and Hickman, S., 2009, Fractures, stress and fluid flow prior to stimulation of well 27-15, Desert Peak, Nevada, EGS project: Proceedings 34th Workshop on Geothermal Reservoir Engineering, Stanford Univ., Stanford, CA, SGP-TR-187, 11 p.
Davatzes, N.C. and Hickman, S., 2010, The feedback between stress, faulting, and fluid flow: Lessons from the Coso Geothermal Field, CA, USA: Proceedings World Geothermal Congress 2010, 14 p.
Dempsey, D., Kelkar, S., Lewis, K., Hickman, S., Davatzes, N., Moos and Zemach, E., 2013, Modeling Shear Stimulation of the Desert Peak EGS Well 27-15 Using a Coupled Thermal-Hydrological-Mechanical Simulator: 47th US Rock Mechanics/Geomechanics Symposium, San Francisco, CA, June 23-26, 2013, 12 p.
Desormier, W.L., 1997, A Case Study of the Geothermal Project at Carson Lake, Nevada: Proceedings, Twenty-First Workshop on Geothermal Reservoir Engineering, Stanford University, Stanford California, January 27-29, 1997, p. 105-112.
Dilek, Y., and Moores, E.M., 1995, Geology of the Humboldt igneous complex, Nevada, and tectonic implications for the Jurassic magmatism in the Cordilleran orogeny, in Miller and Busby, eds.,

Fallon, NV, Conceptual Geologic Model | 135
Jurassic magmatism and tectonics of the North American Cordillera: Geological Society of America Special Paper 299, p. 229-248.
Dix, C. H., 1955, Seismic velocities from surface measurements: Geophysics, v. 20, p. 68–86. Doser, D.I., 1986, Earthquake Processes in the Rainbow Mountain-Fairview Peak-Dixie Valley, Nevada,
Region 1954-1959: Journal of Geophysical Research, v. 91, no. B12, p. 12,572-12,586. Edmiston, R.C. and Benoit, W.R., 1984, Characteristics of basin and range geothermal systems with fluid
temperatures of 150°C to 200°C: Geothermal Resources Council Transactions, v. 8, p. 417-424. Ernst, W.G., Snow, C.A., and Scherer, H.H., 2008, Contrasting early and late Mesozoic petrotectonic
evolution of northern California: Geological Society of America Bulletin, v. 120, no. 1-2, p. 179-194. Faulds, J.E., and Varga, R., 1998, The role of accommodation zones and transfer zones in the regional
segmentation of extended terranes: Geological Society of America Special Paper 323, p. 1-46. Faulds, J.E., and Henry, C.D., 2008, Tectonic influences on the spatial and temporal evolution of the
Walker Lane: An incipient transform fault along the evolving Pacific – North American plate boundary, in Spencer, J.E., and Titley, S.R., eds., Ores and orogenesis: Circum-Pacific tectonics, geologic evolution, and ore deposits: Arizona Geological Society Digest 22, p. 437-470.
Faulds, J.E., Coolbaugh, M., Blewitt, G., and Henry, C.D., 2004, Why is Nevada in hot water? Structural controls and tectonic model of geothermal systems in the northwestern Great Basin: Geothermal Resources Council Transactions, v. 28, p. 649-654.
Faulds, J.E., Coolbaugh, M.F., Vice, G.S., and Edwards, M.L., 2006, Characterizing structural controls of geothermal fields in the north-western Great Basin: A progress report: Geothermal Resources Council Transactions, v. 30, p. 69-75.
Faulds, J.E., Coolbaugh, M.F., Benoit, D., Oppliger, G., Perkins, M., Moeck, I., and Drakos, P., 2010a, Structural controls of geothermal activity in the northern Hot Springs Mountains, western Nevada: The tale of three geothermal systems (Brady’s, Desert Perk, and Desert Queen): Geothermal Resources Council Transactions, v. 34, p. 675-683.
Faulds, J., Moeck, I., Drakos, P., and Zemach, E., 2010b, Structural Assessment and 3D Geological Modeling of the Brady's Geothermal Area, Churchill County (Nevada, USA): A preliminary report: Proceedings, Thirty-Fifth Workshop on Geothermal Reservoir Engineering, Stanford University, Stanford, California, February 1-3, 2010, SGP-TR-188, 5 p.
Faulds, J.E., Hinz, N.H., Coolbaugh, M.F., Cashman, P.H., Kratt, C., Dering, G., Edwards, J., Mayhew, B., and McLachlan, H., 2011, Assessment of favorable structural settings of geothermal systems in the Great Basin, Western USA: Geothermal Resources Council Transactions, v. 35, p. 777-784.
Faulds, J.E., Hinz, N.H., and Kreemer, C.W., 2012, Regional patterns of geothermal activity in the Great Basin Region, western USA: Correlation with strain rates: Geothermal Resources Council Transactions, v. 36, p. 897-902.
Faulds, J.E., Hinz, N.H., Dering, G.M., and Siler, D.L., 2013, The hybrid model – the most accommodating structural setting for geothermal power generation in the Great Basin, western USA: Geothermal Resources Council Transactions, v. 37, p. 3-10.
Faulds, J.E., Hinz, N.H., and many others, 2014, Characterizing Structural Controls of EGS-Candidate and Conventional Geothermal Reservoirs in the Great Basin: Developing Successful Exploration Strategies in Extended Terranes: Final report submitted to the Department of Energy, 54 p.
Faulds, J.E., and Hinz, N.H., 2015, Favorable tectonic and structural settings of geothermal systems in the Great Basin region, western USA: Proxies for discovering blind geothermal systems: Proceedings World Geothermal Congress, Melbourne, Australia, 19-25 April 2015, 6 p.
Faulds, J.E., Hinz, N.H., Coolbaugh, M.F., Siler, D.L., Shevenell, L.A., Queen, J.H., dePolo, C.M., Hammond, W.C., and Kreemer, C., 2016, Discovering geothermal systems in the Great Basin region: an integrated geologic, geochemical, and geophysical approach for establishing geothermal play fairways:

Fallon, NV, Conceptual Geologic Model | 136
Proceedings, 41st Workshop on Geothermal Reservoir Engineering, Stanford University, Stanford, CA, Feb. 22-24, 15 p.
Ferrill, D.A., Winterle, J., Wittmeyer, G., Sims, D., Colton, S., Armstrong, A., Horowitz, A.S., Meyers, W.B., and Simons, F.F., 1999, Stressed rock strains groundwater at Yucca Mountain, Nevada: GSA Today, v. 9, p. 2–9.
Fosdick, J.C., and Colgan, J.P., 2008, Miocene extension in the East Range, Nevada: A two-stage history of normal faulting in the northern Basin and Range: Geosphere, v. 120, no. 9/10, p. 1198-1213.
Fournier, R.O., Truesdell, A.H., 1973. An empirical Na-K-Ca geothermometer for natural waters: Geochimica et Cosmchimica Acta, v. 37, p. 1255–1275
Fournier, R.O., 1977. Chemical geothermometers and mixing models for geothermal systems: Geothermics, v. 5, p. 41-50.
Fournier, R.O., 1979. A revised equation for the Na/K geothermometer: Geothermal Resources Council Transactions, v. 3, p. 221–224.
Fournier, R.O., Potter, R.W., 1982. A revised and expanded silica (quartz) geothermometer: Geothermal Resources Council Bulletin, v. 11, no. 10, p. 3–12.
Garg, S.K., Goranson, C., Johnson, S., and Casteel, J., 2015, Reservoir testing and modeling of the Patua geothermal field, Nevada, USA: Proceedings World Geothermal Congress 2015, Melbourne, Australia, 16 p.
Garza-Cruz, T. and Davatzes, N.C., 2010, Numerical modeling of the nucleation conditions of petal-centerline fractures below a borehole flow, a sensitivity study and application to the Coso geothermal field: Geothermal Resources Council Transactions, v. 34, p. 549-556.
Genter, A., Goerke, X., Graff, J-J., Cuenot, N., Krall, G., Schindler, M., and Ravier, G., 2010, Current Status of the EGS Soultz Geothermal Project (France): Proceedings World Geothermal Congress, Bali, Indonesia, 25-29 April 2010, 6 p.
GeothermEx, 2013, Report on well tests of NAS Fallon 88-24 and FDU-2D: Report for Navy Geothermal Program Office, 86 p.
Giggenbach,W.F., 1988. Geothermal solute equilibria: Derivation of Na-K-Mg-Ca geoindicators: Geochimica et Cosmochimica Acta, v. 52, p. 2749–2765.
Glancy, P.A., 1986, Geohydrology of the basalt and unconsolidated sedimentary aquifers in the Fallon area, Churchill County, Nevada: United States Geological Survey Water-Supply Paper 2263, 70 p.
Gray, B., Unruh, J., Bjornstad, S., Blake, K., Alm, S., and Shoffner, J., 2013, Targeting geothermal resources in the Lahontan Valley, Nevada; Analysis of Neogene faulting through 2D seismic, topographic, and satellite imagery analysis: Geothermal Resources Council Transactions, v. 37, p. 1013-1018.
Hammond, W.C., and Thatcher, W., 2004, Contemporary tectonic deformation of the Basin and Range province, western United States: 10 years of observation with the Global Positioning System: Journal of Geophysical Research, v. 109, B08403.
Hastings, D. D., 1979, Results of exploratory drilling northern Fallon basin, western Nevada: RMAG-UGA – Basin and Range Symposium, p. 515-522.
Heffer, K., 2002, Geomechanical influences in water injection projects: an overview: Oil and Gas Science and Technology, v. 57, p. 415- 422.
Henley, R.W. and Ellis, A.J., 1983, Geothermal systems ancient and modern: A geochemical review: Earth-Science Reviews, v. 19, p. 1-50.
Hickman, S., Zoback, M.D., and Benoit, R., 1998, Tectonic controls on fault-zone permeability in a geothermal reservoir at Dixie Valley, Nevada, in Rock Mechanics in Petroleum Engineering, vol. 1, R. M. Holt et al. (eds.), Society of Petroleum Engineers, Richardson, TX., p. 79-86.

Fallon, NV, Conceptual Geologic Model | 137
Hickman, S.H., and Davatzes, N.C., 2010, In-situ stress and fracture characterization for planning of an EGS stimulation in the Desert Peak geothermal field, Nevada: Proceedings, Thirty-Fifth Workshop on Geothermal Reservoir Engineering, Stanford University, Stanford, California, February 1-3, 2010, SGP-TR-188.
Hickman, S., Zoback, M.D., Barton, C., Benoit, R., Svitek, J. and Summers, R., 2000, Stress and permeability heterogeneity within the Dixie Valley geothermal reservoir: Recent results from well 82-5: Proceedings of the Twenty-fifth Stanford University Geothermal Workshop, 7 p.
Hinz, N.H., Faulds, J.E. and Oppliger, G.L., 2008, Structural controls of Lee-Allen Hot Springs, southern Churchill County, western Nevada: A small pull-apart in the dextral shear zone of the Walker Lane: Geothermal Resources Council Transactions, v. 32, p. 285-290.
Hinz, N.H., Faulds, J.E., and Bell, J.W., 2011, Preliminary geologic map of the Bunejug Mountains Quadrangle, Churchill County, Nevada: Nevada Bureau of Mines and Geology Open-File Report 11-9, 1 sheet, 1:24,000 scale.
Hinz, N.H., Faulds, J.E., and Oppliger, G.L., 2010, Preliminary geologic map of the Lee-Allen geothermal area, Churchill County, Nevada: Nevada Bureau of Mines and Geology Open-File Report 10-6, 1 sheet, 1:24,000 scale with 1:8,000 scale inset.
Hinz, N. H., Faulds, J.E., and Siler, D.L., 2013a, Developing Systematic Workflow From Field Work to Quantitative 3D Modeling for Successful Exploration of Structurally Controlled Geothermal Systems: Geothermal Resources Council Transactions, v. 37, p. 275–279.
Hinz, N.H., Ramelli, A.R., and Faulds, J.E., 2013b, Preliminary geologic map of the Wabuska Quadrangle, Lyon County, Nevada: Nevada Bureau of Mines and Geology Open-File Report 13-08, 1 sheet, 1:24,000 scale.
Hinz, N.H., Faulds, J.E., Coolbaugh, M.F., 2014, Association of fault terminations with fluid flow in the Salt Wells geothermal field, Nevada, USA: GRC Transactions, v. 38, p. 3-9.
Hinz, N.H., Faulds, J.E., Siler, D.L., Tobin, B., Blake, K., Tiedeman, A., Sabin, A., Blankenship, D., Kennedy, M., Rhodes, G., Nordquist, J., Hickman, S., Glen, J., Williams, C., Robertson-Tait, A., and Calvin, W., 2016, Stratigraphic and structural framework of the proposed Fallon FORGE site, Nevada: 41st Workshop on Geothermal Reservoir Engineering, Stanford University, Stanford, CA, Feb. 22-24, 12 p.
John, D. A., 1995a, Tilted middle Tertiary ash-flow calderas and subjacent granitic plutons, southern Stillwater Range, Nevada: Cross sections of an Oligocene igneous center: Geological Society of America Bulletin, v. 107, p. 180–200.
John, D.A., 1995b, Geologic map of the Pirouette Mountain quadrangle, Churchill County, Nevada: Nevada Bureau of Mines and Geology Field Studies Map 9, 1:24,000 scale, 1 sheet.
John, D.A., and Silberling, N.J., 1994, Geologic map of the La Plata Canyon quadrangle, Churchill County, Nevada: USGS Map GQ-1710, 1:24,000 scale, 1 sheet, 18 p.
Jolie, E., Faulds, J.E., and Moeck, I., 2012, The Development of a 3D structural-geological model as part of the geothermal exploration strategy - A case study from the Brady’s geothermal system, Nevada, USA, in Proceedings, Thirty-Seventh Workshop on Geothermal Reservoir Engineering, Stanford University: p. 421–425.
Jolie, E., Moeck, I., and Faulds, J. E., 2015, Quantitative structural–geological exploration of fault-controlled geothermal systems—A case study from the Basin-and-Range Province, Nevada (USA): Geothermics, v. 54, p. 54–67, doi:10.1016/j.geothermics.2014.10.003.
Jones, C.G. and Moore, J.N., 2013, Petrographic and X-ray Diffraction Study of 4 Wells from Naval Air Station Fallon, Churchill County, Nevada: Report for the Navy Geothermal Program Office, Contract Number N62473_13_M_1403.
Katzenstein, A.M., and Bjornstad, S.C., 1987, Geothermal reservoir evaluation at Naval Air Station, Fallon, Nevada: Naval Weapons Center Technical Report NWC TP 6808, China Lake, 53 p.

Fallon, NV, Conceptual Geologic Model | 138
Kreemer, C., Blewitt, G., and Hammond, W.C., 2009, Geodetic contemporary deformation in the northern Walker Lane: 2, velocity and tensor strain rate analysis, In Oldow, J.S., and Cashman, P.H., eds., Late Cenozoic structure and evolution of the Great Basin – Sierra Nevada Transition: Geological Society of America Special Paper 447, p. 17-31.
Kreemer, C., Hammond, W.C., Blewitt, G., Holland, A.A., and Bennett, R.A., 2012, A geodetic strain rate model for the Pacific-North American plate boundary, western USA: NBMG Map 178, scale 1:1.500,000, 1 sheet.
Kreemer, C., Blewitt, G., and Klein, E.C., 2014, A geodetic plate motion and global strain rate model: Geochemistry, Geophysics, Geosystems, v. 15, p. 3849-3889, doi:10.1002/2014GC005407.
Kucks, R.P., Hill, P.L., and Ponce, D.A., 2006, Nevada magnetic and gravity maps and data—A website for the distribution of data: U.S. Geological Survey Data Series 234. [http://pubs.usgs.gov/ds/2006/234].
Lutz, S.J., and Hulen, J.B., 2002, Geologic setting and alteration mineralogy of the Nickel Mine and Bolivia region, Jurassic Humboldt mafic complex and Boyer Ranch Formation, northern Stillwater Range, Nevada: Geologic Society of Nevada Special Publication 35, Spring 2002 Field Trip Guidebook, p. 117-127.
Lutz, S., Hickman, S., Davatzes, N., Zemach, E., Drakos P., and Robertson-Tait, A., 2010, Rock mechanical testing and petrologic analysis in support of well stimulation activities at the Desert Peak Geothermal Field, Nevada, Proc. 35th Stanford Geothermal Workshop, SGP-TR-188,11 p.
Maurer, D.K., and Welch, A.H., 2001, Hydrogeology and geochemistry of the Fallon basalt and adjacent aquifers, and potential sources of basalt recharge, in Churchill County, Nevada: USGS Water-Resources Investigations Report 01-4130, 2 sheets, 72 p.
McKee, E.H., and Burke, D. B., 1972, Fission-track age bearing on the Permian-Triassic boundary and time of the Sonoma Orogeny in north-central Nevada: Geological Society of America Bulletin, v. 83, no. 7, p. 1949-1952.
McLachlan, H., and Benoit, W.R., and Faulds, J.E., 2011, Structural framework of the Soda Lake geothermal area, Churchill County, Nevada: Geothermal Resources Council Transactions, v. 35, p. 925-930.
Moeck, I., Hinz, N., Faulds, J. E., Bell, J.W., Kell-hills, A., and Louie, J., 2010, 3D geological mapping as a new method in geothermal exploration: A case study from central Nevada: Geothermal Resources Council Transactions, v. 34, p. 807–812.
Moeck, I., Kwiatek, G., and Zimmerman, G., 2009, Slip tendency analysis, fault reactivation potential and induced seismicity in a deep geothermal reservoir: Journal of Structural Geology, v. 31, p. 1174–1182, doi:10.1016/j.jsg.2009.06.012.
Morris, A., Ferrill, D.A., and Henderson, D.B., 1996, Slip-tendency analysis and fault reactivation: Geology, v. 24, p. 275–278.
Morrison, R.B., 1964, Lake Lahontan: Geology of Southern Carson Desert, Nevada, U. S. Geological Survey, Professional Paper 401, Plates 3 & 5.
Oldow, J.S., 1984, Evolution of a late Mesozoic back-arc fold and thrust belt, northwestern Great Basin, U.S.A: Tectonophysics, v. 102, no. 1-4, p. 245-274.
Page, B.M., 1965, Preliminary geologic map of part of the Stillwater Range, Churchill County, Nevada: Nevada Bureau of Mines and Geology Map 28, 1 sheet, 1:125,000 scale.
Peska, P. and Zoback, M.D., 1995), Compressive and tensile failure of inclined well bores and determination of in situ stress and rock strength: Journal of Geophysical Research, v. 100, p. 27,911-12,811.
Reyes, A.G., 1990, Petrology of Philippine geothermal systems and the application of alteration mineralogy to their assessment: Journal of Volcanology and Geothermal Research, v. 43, p. 279-309.

Fallon, NV, Conceptual Geologic Model | 139
Robertson-Tait, A., Lutz, S.J., Sheridan, J., and Morris, C.L., 2004, Selection of an interval for massive hydraulic stimulation in well DP 23-1, Desert Peak East EGS project, Nevada, Proceedings, 29th Workshop on Geothermal Reservoir Engineering, Stanford University, Stanford CA, SGP-TR-175.
Ross, H., Benoit, D., Desormier, B., 1996, Geophysical characterization of the Carson Lake, Nevada geothermal resource: Geothermal Resources Council Transactions, v. 20, no. 9-10, 393-400 p.
Rutledge, J.T., Phillips, W.S., and Mayerhofer, M.J., 2004, Faulting induced by forced fluid injection and fluid flow forced by faulting: An interpretation of hydraulic-fracture microseismicity, Carthage Cotton Valley gas field, Texas: Bulletin of the Seismological Society of America, v. 94, p. 1817-1830.
Satterfield, J.I., 2002, Geology map of the southern Sand Springs Range: Nevada Bureau of Mines and Geology Map 133, 16 pages, 1 sheet, scale 1:24,000.
Siler, D. L., and Faulds, J. E., 2013, Three-dimensional geothermal fairway mapping : Examples from the western Great Basin, USA: Geothermal Resources Council Transactions, v. 37, p. 327–332.
Siler, D.L., Faulds, J.E., Mayhew, B., and Mcnamara, D.D., 2016a, Geothermics analysis of the favorability for geothermal fluid flow in 3D: Astor Pass geothermal prospect, Great Basin, northwestern Nevada, USA: Geothermics, v. 60, p. 1–12, doi:10.1016/j.geothermics.2015.11.002.
Siler, D. L., Hinz, N.H., Faulds, J. E. and Queen, J., 2016b, 3D analysis of geothermal fluid flow favorability: Brady's, Nevada, USA. in Proceedings, Forty-First Workshop on Geothermal Reservoir Engineering, Stanford University: 10 p.
Sippel, J., Scheck-Wenderoth, M., Reicherter, K., and Mazur, S., 2009, Paleostress states at the south-western margin of the Central European Basin System — Application of fault-slip analysis to unravel a polyphase deformation pattern: Tectonophysics, no. 470, p. 129-146.
Slemmons, D.B., Jines, A.E., and Gimlett, J.I., 1965, Catalog of Nevada earthquakes, 1852-1900: Bulletin
of the Seismological Society of America, v. 55, p. 537-583.
Speed, R.C., 1974, Evaporite-carbonate rocks of the Jurassic Lovelock Formation, West Humboldt Range,
Nevada: Geologic Society of America Bulletin, v. 85, no. 1, p. 105-118.
Speed, R.C., and Jones, R.A., 1969, Synorogenic quartz sandstone in the Jurassic mobile belt of western Nevada: Boyer Ranch Formation: Geological Society of America Bulletin, v. 80, p. 2551-2584.
Stewart, J.H., 1988, Tectonics of the Walker Lane belt, western Great Basin: Mesozoic and Cenozoic deformation in a zone of shear, in Ernst, W. G., ed., The Geotectonic development of California: Prentice Hall, Englewood Cliffs, New Jersey, p. 683-713.
Stewart, J.H., and Carlson, J.E., 1978, Geologic Map of Nevada: United States Geological Survey MF-930, 1:500,000 scale, 1 sheet.
Stockli, D.F., Surpless, B.E., Dumitru, T.A., and Farley, K.A., 2002, Thermochronological constraints on the timing and magnitude of Miocene and Pliocene extension in the central Wassuk Range, western Nevada: Tectonics, v. 21, 4, 10.1029/2001TC001295.
Trexler D.T., Koeing, B.A., Flynn, T., Bruce, J.L., and Ghusn, Jr., G., 1981, Low-to-moderate temperature geothermal resource assessment for Nevada: Area specific studies: U.S. Department of Energy Report, 224p.
UNR: Nevada Bureau of Mines, Nevada Mining Analytical Laboratory, Desert Research Institute, 1962, Geological, geophysical, and hydrological investigations of the Sand Springs Range, Fairview Valley, and Fourmile Flat, Churchill County, Nevada: Report for Shoal Event, Project Shade, Vela Uniform Program, Atomic Energy Commission, 2 sheets, 136 p.
U.S. Geological Survey, 1972, Aeromagnetic map of parts of the Lovelock, Reno, and Millett 1 degree by two degrees quadrangles, Nevada: U.S. Geological Survey Open-File Report 72-386.
U.S. Geological Survey, 2006, United States Geological Survey Quaternary Fault and Fold Database of the United States: http://earthquake.usgs.gov/hazards/qfaults/, retrieved 2013.

Fallon, NV, Conceptual Geologic Model | 140
Vikre, P.G., 1981, Silver mineralization in the Rochester district, Pershing County, Nevada: Economic Geology, v. 76, no. 3, p. 580-609.
Wannamaker, P. E., V. Maris, J. Sainsbury, and J. Iovenitti, 2013, Intersecting fault trends and crustal-scale fluid pathways below the Dixie Valley geothermal area, Nevada, inferred from 3D magnetotelluric surveying: Proceedings of the 38th Workshop on Geothermal Reservoir Engineering, Stanford, CA, SGP-TR-198, 9 p.
Willden, R., and Speed, R.C., 1974, Geologic Map of Churchill County, Nevada: Nevada Bureau of Mines and Geology Bulletin 83, 5 sheets, 103 p.
Wyld, S.J, 2002, Structural evolution of a Mesozoic backarc fold-and-thrust belt in the U.S. Cordillera: new evidence from northern Nevada: Geological Society of America Bulletin, v. 114, no. 11, p. 1452-1468.
Yilmaz, O., 2001, Seismic Data Analysis: Society of Exploration Geophysicists, Tulsa, Oklahoma, 2024 p. Zoback, M.L., Zoback, M.D., Adams, J., Assumpcão, M., Bell, S., Bergman, E.A., Blümling, P., Brereton,
N.R., Denham, D., Ding, J., Fuchs, K., Gay, N., Gregersen, S., Gupta, H.K., Gvishiani, A., Jacov, K., Klein, R., Knoll, P., Magee, M., Mercier, J.L., Müller, B.C., Paquin, C., Rajendran, K., Stephansson, O., Suarez, G., Suter, M., Udias, A., Xu, Z. H. and Zhizhin, M.., 1989, Global patterns of tectonic stress: Nature, v. 341, p. 291-298.

1-B
APPENDIX B. UPDATE ON CHARACTERIZATION DATA UPLOADED TO THE GDR DATA ARCHIVE

UPDATE ON CHARACTERIZATION
DATA UPLOADED TO THE GDR
DATA ARCHIVE
Fallon, NV

Fallon, NV, Update on Characterization Data Uploaded to the GDR Data Archive | 1
UPDATE ON CHARACTERIZATION DATA UPLOADED TO THE GDR
DATA ARCHIVE
Fallon, Nevada
All data used in characterization of the Fallon FORGE site and construction of the Fallon 3D geologic model has been uploaded to the Geothermal Data Repository (GDR). This includes downhole lithologic data interpreted from core, cuttings, and mud logs; downhole image log and geophysical data; digital elevation data; geologic map data; petrographic data; geologic cross-sections, gravity and magnetic data; magnetotelluric data; down hole temperature data; shallow temperature data; well testing data; seismic reflection data; and seismicity data. The Fallon 3D geologic model has also been uploaded to the GDR. The data uploaded to the GDR for the Fallon, NV, site is captured in Table 1, below.

Fallon, NV, Stakeholder Engagement Status Update | 2
Table 1. Data uploaded to the GDR for the Fallon, NV, site
Data Description File Name Date
Uploaded
x,y,z downhole temperature data for wells in and around the Fallon FORGE site FallonFORGEWellTemps.txt 4/21/2016
3D model range, FORGE site outline FallonFORGEGISPolygons.zip 4/21/2016
3D geologic model of the Fallon FORGE site FallonFORGE3DGeologicModel.txt 4/21/2016
x,y,z text file of the downhole lithologic interpretations in the wells in and around the Fallon FORGE site FallonFORGEWellLithologies.txt 4/21/2016
Temperature log from well 17-16 17-16_TEMP.pdf 3/31/2016
Mud log from well 13-36 13-36_mudlog.tif 3/31/2016
Mud log from well 35A-11 35A-11_mudlog.tif 3/31/2016
FORGE area GIS polygons FORGE boundary layers.lpk 3/31/2016
Mud log from well 86-15 86-15_mudlog.tif 3/31/2016
Temperature log from 35A-11 35A-11_temp.tif 3/31/2016
Temperature log from 34-33 34-33_temp.tif 3/31/2016
Mud log from well 78-36 78-36_mudlog.tif 3/31/2016
Digital elevation model Nevada DEM 3/31/2016
Geologic map of Nevada Geologic Map of Nevada 3/31/2016
Geologic Map of the Bunejug Mountains Quadrangle Churchill County Nevada
Geologic Map of the Bunejug Mountains Quadrangle Churchill County Nevada 3/31/2016
Geologic Map of the Lahontan Mountains Quadrangel Churchill County Nevada
Geologic Map of the Lahontan Mountains Quadrangel Churchill County Nevada 3/31/2016
Geologic Map of Grimes Point Quadrangle Churchill County Nevada
Geologic Map of Grimes Point Quadrangle Churchill County Nevada 3/31/2016
Hydrogeolgoy at Fallon Maurer and Welch 2001 3/31/2016
Major Carson Sink roads NDOT major roadways 3/31/2016
GIS data Fallon_FORGE_GDR.mpk 3/31/2016
Flow test from well FOH-3 FOH-3 Flow Test.xls 3/31/2016
EQ hypocenters USGS Query_EQs.csv 3/31/2016
Temperature pressure log from well 61-36 61-36_WellTempPressLog.xlsx 3/31/2016
Survey of well 61-36 61_36Survey_TGHBHT.xlsx 3/31/2016
2 meter temperature probe data 2mTemperatureProbe.zip 3/31/2016
Pressure log from well13-36 13-36_BHP.zip 3/31/2016
Temperature log from 13-36 13-36_TEMP.zip 3/31/2016
Well survey from well 13-36 13-36_XMAC.zip 3/31/2016
Survey of well 13-36 13-36_SURVEY.zip 3/31/2016
Mud log from well 47A-11 47A-11_MUDLOG.zip 3/31/2016
Mud log from well 51A-20 51A-20_MUDLOG.zip 3/31/2016
Mud log from well 56A-14 56A-14_MUDLOG.zip 3/31/2016
Mud log from well 58A-9 58A-9_MUDLOG.zip 3/31/2016

Fallon, NV, Stakeholder Engagement Status Update | 3
Data Description File Name Date
Uploaded
Mud log from well 14-1 14-1_MUDLOG.zip 3/31/2016
Temperature log from well 78-36 78-36_TEMP.zip 3/31/2016
Mud log from well 17-16 17-16_MUDLOG.zip 3/31/2016
Mud log from well 61-36 61-36_MUDLOG.zip 3/31/2016
Mud log from well 62-15 62-15_MUDLOG.zip 3/31/2016
Well test from well 82-36 82-36 well test.zip 3/31/2016
Temperature pressure log from well 84-31 84-31_PT.zip 3/31/2016
Temperature pressure log from well 82-36 82-36 PT logs.zip 3/31/2016
Temperature log from well 8431 84-31_TEMP.zip 3/31/2016
Mud log from well 86-25 86-25_MUDLOG.zip 3/31/2016
Gamma log from well 86A-15 86A-15_SEMBLANCE_GAMMA.zip 3/31/2016
Mud log from well 84-31 84-31_MUDLOG.zip 3/31/2016
Sonic log from well 17-16 17-16_SONICWAVE.zip 3/31/2016
Mud log from well 86A-15 86A-15_MUDLOG.zip 3/31/2016
Fallon area well collars FORGE area wells.zip 3/31/2016
Heat flow data HeatFlow.zip 3/31/2016
Temperature log from well FOH-3 FOH-3_TEMP.zip 3/31/2016
Siesmic reflection profiles NavySeismicLines.zip 3/31/2016
Radiogenic heat data Radiogenic_Heat_Generation.zip 3/31/2016
Temperature gradient data Temperature_Gradient_Measurements.zip 3/31/2016
Magnetotelluric data MT.zip 3/31/2016
Mud log from well 34-33 34-33_MUDLOG.zip 3/31/2016
Mud log from well 88-24 88-24_MUDLOG.zip 3/31/2016
Mud log from well FOH-3 FOH3_MUDLOG.zip 3/31/2016
Mud log from well 82-36 82-36_MUDLOG.zip 3/31/2016

1-C
APPENDIX C. ENVIRONMENTAL INFORMATION SYNOPSIS

ENVIRONMENTAL INFORMATION SYNOPSIS
Fallon, NV

Fallon, NV, Environmental Information Synopsis | 1
ENVIRONMENTAL INFORMATION SYNOPSIS
NAS Fallon
INTRODUCTION
The proposed Naval Air Station (NAS) Fallon FORGE project area is approximately 1,115 acres
(387 Ormat leased or owned, 728 NASF) within and adjacent to the NAS Fallon (NASF) and
Ormat lease areas. The total acreage for monitoring is 9,856 acres (3,842 Ormat leased or owned
plus 6,014 NASF, exclusive of the main FORGE site and areas of No Surface Occupancy).
Ormat has three BLM leases (NVN-079104, NVN-079105, NVN-079106) that have been
unitized under the Bunejug Unit Agreement and two parcels of purchased private land.
Two NEPA documents serve as the primary foundation for permitting and additional
environmental and cultural work required at the Fallon FORGE site. The Salt Wells EIS (OEPC
Control Number FES 11-12) and the NAS Fallon Programmatic EIS.
The Salt Wells EIS (OEPC Control Number FES 11-12) was completed in 2011 (along with a
previous 2008 Environmental Assessment) to support geothermal development work at the Salt
Wells Known Geothermal Resources Area (KGRA) and focused on private and leased grounds
in the eastern Carson sink. It provides NEPA analysis for exploration and development of a
geothermal well field, power plant and transmission line on private and leased properties. All of
the land outside of NAS Fallon fence line included in the Fallon FORGE site was covered under
this EIS. The Navy was a cooperating agent on this 2011 EIS but not a signatory.
The NAS Fallon Programmatic EIS served a similar purpose and includes all developable lands
inside the NAS Fallon fence line. In March, 1991 NAS Fallon (NASF) completed the
Programmatic EIS (PEIS) for Geothermal Energy Development, NASF. The purpose of the
PEIS was to support geothermal exploration and proposed development activities at NAS Fallon.
In 2005, a 50-yr development contract (N62473-06-C-3021) was awarded by the Navy to Ormat
Nevada Inc. to develop and sell power from a geothermal plant to be constructed on NAS Fallon.
The NAS PEIS was the supporting environmental document allowing this agreement. This
contract was mutually dissolved in 2012 because Ormat determined through deep drilling that
the postulated hydrothermal resource (370-400 degree F) in basement rocks beneath NAS Fallon
did not exist.
The following outlines environmental issues and protection measures designed to address these
concerns on the Fallon FORGE site as well as the likely path required to obtain any remaining
permits required to perform FORGE activities.
ENVIRONMENTAL ISSUES AND PROTECTION
Appendix E of the Final Environmental Impact Statement, Salt Wells Energy Projects, (OEPC
Control Number FES 11-12) dated July 2011, outlines the environmental protection measures
and best management practices (BMP) that govern Fallon FORGE activities on leased and
private land. In addition to the requirements and conditions stated in the project permits,

Fallon, NV, Environmental Information Synopsis | 2
geothermal lease stipulations, and conditions of approval, the project proponents are committed
to implementing the best management practices as appropriate for each of the proposed actions.
The Fallon FORGE team would inform all personnel, as well as well drilling, testing, and supply
contractors, of the team’s policy regarding protection and undue degradation of the environment.
These measures are intended to prevent all unacceptable impacts from occurring as a result of
these operations, as is required under the special stipulations of the Federal geothermal leases.
FIRE PREVENTION
The well sites and access roads would be cleared of all vegetation, and the areas would be
maintained during drilling operations. The potential well sites are located in very sparsely
vegetated areas. All construction and drilling equipment would be equipped with exhaust spark
arresters. Fire extinguishers would be available on the drill pad sites and around the drilling rig.
Water that is used for construction, dust control, or drilling would be available for firefighting.
Personnel would be allowed to smoke only in designated areas. Any special permits required for
burning of slash or trash, other fires, welding, etc., would be obtained before these operations are
conducted.
PREVENTION OF SOIL EROSION
No soil erosion problems are anticipated from this project because the topography is gentle and
cut and fill for construction of the well sites and access roads have been minimized. On-site
storm water would be collected in the sump. Off-site storm water would be intercepted in
ditches and channeled to energy dissipaters as necessary to minimize erosion. BLM and State of
Nevada best management practices for storm water would be followed, as applicable.
SURFACE AND GROUND WATER QUALITY PROTECTION
The locations of the drill pads and access roads will be selected to minimize the potential for
surface water pollution during construction, drilling, and testing. New access roads would not
cross any riparian areas and only existing roadways would be used to cross through riparian
areas.
Only non-toxic, non-hazardous drilling mud and drilling mud additives would be utilized. Waste
drilling mud, drill cuttings and any runoff from the well pad would be discharged into the lined
containment basin to prevent water quality degradation. The well bores would be cased with
steel casing to prevent inter-zonal migration of the fluids, protect ground water, and reduce the
possibility of uncontrolled well flow (“blowouts”). See also waste disposal measures. The team
would comply with any requirements prescribed by the Nevada Bureau of Water Quality
Planning (BWQD).
AIR QUALITY PROTECTION
Fugitive dust generated during construction and travel over access roads and drill pads would be
minimized by watering the roads and pads during construction and during extended road use.
Vehicle speeds would also be limited on unpaved roads. The team may use burning as a method
to control vegetation and dispose of materials that are cleared as part of the drill pad
construction. The team would obtain all necessary burning permits during required months and
would contact the Fall/Churchill Fire Department and the BLM prior to any burning.

Fallon, NV, Environmental Information Synopsis | 3
The team would comply with any requirements prescribed by the Nevada Bureau of Air
Pollution Control (BAPC) concerning emissions of air pollutants from the drilling rig engines,
burning, and non-condensable gases from the geothermal fluid during flow tests.
NOISE PREVENTION
To abate noise pollution, mufflers would be used on all drilling rig engines. Construction and
drilling noise would be minimized through operational practices, which to avoid or minimize
practices that typically generate high noise levels or distinctive noise impacts. The closest
sensitive receptor is a private residence located approximately two miles from the closest drilling
location.
PROTECTION OF PUBLIC HEALTH AND SAFETY
There is a possibility of encountering hazardous non-condensable gases while drilling and
testing. The three main gases associated with geothermal resources in the area are steam,
hydrogen sulfide (H2S), and carbon dioxide (CO2). Noxious or dangerous amounts of gases
have not been associated with other geothermal wells drilled in the area; however, a contingency
plan has been prepared to protect against exposure to noxious gasses such as H2S. Detection
systems would be installed at the wellhead to protect against exposure.
Public health and safety would be protected through safety training and instructions to work
crews and contractors and compliance with State of Nevada and Federal Occupational Safety and
Health Administration regulations in addition to the emergency contingency plans prepared by
the team.
PROTECTION OF FISH, WILDLIFE, AND PLANT RESOURCES
Direct impacts to wildlife habitat and botanical resources would be minimized by clearing only
those small areas required for the construction of the drill pads and development and
improvement of necessary access roads. Biological surveys conducted of the area indicate that
presence of endangered, threatened or sensitive plant or animal species within the areas of
construction or operations is unlikely. Prior to construction, a new biological survey may be
conducted to characterize the existing plant and animal species on site, and define mitigation
measures (if necessary) to avoid impacts of wildlife, special status species, and habitat.
Project-related vehicles (whether driven by employees, contractors, or suppliers) traveling on
unpaved roads in the project area would be limited to a speed of 35 miles per hour to reduce the
potential for vehicle collisions with wildlife.
The well site would be reclaimed to promote the reestablishment of native plant and wildlife
habitat following abandonment of the wells. The team would work cooperatively with the BLM
to prevent the introduction and establishment of noxious weeds as a result of this project. This
may include ensuring that equipment and vehicles used in the project are washed or inspected to
prevent the introduction of noxious weeds; that any hay or straw bales used for erosions control
would be weed-free; and that weed prevention and treatment measures would be specified for
reclamation.
PROTECTION OF CULTURAL RESOURCES
Previous cultural resource surveys of the area indicate significant cultural resources may be
discovered in the area. All areas proposed for disturbance, including well sites and proposed

Fallon, NV, Environmental Information Synopsis | 4
access roads, would be surveyed by an archeologist acceptable to the BOR, Navy, and BLM.
Any areas containing significant cultural resources would be avoided. If avoidance is not
possible, the eligibility of the resources would be determined and an appropriate data recovery
plan would be implemented in a manner acceptable to the BLM and Navy. The team,
contractors, and suppliers would be informed about the sensitivity of the area and reminded that
all cultural resources are protected and if uncovered shall be left in place and reported to the site
representative.
WASTE DISPOSAL
A lined containment basin/sump would be located on each drilling pad and all drilling fluids not
contained in the well bore or mud mixing tanks would be contained in the containment basin.
After drilling operations are completed, the liquids from the containment basin either would be
allowed to evaporate, pumped back down the well, or disposed of in accordance with the
requirements of the Nevada Bureau of Water Quality Planning (BWQP). The remaining solid
contents, typically consisting of non-toxic drilling mud and cuttings, would be tested as required
by the BWQP. If non-toxic and as authorized by the BWQP, these materials would be spread
and dried on the well site, then buried in the on-site containment basin in conformance with the
applicable requirements of the BWQP and BLM. If burial on site is not authorized, the solids
would be removed and either used as construction material on private lands or disposed of in a
facility authorized by the BWQP to receive and dispose of these materials. After the materials
buried in the containment basin have been compacted and stabilized, the containment basin area
would be reclaimed. Solid waste materials generated during the drilling (bags, containers, etc.)
would be accumulated on site, collected by a licensed waste hauler, and deposited at a facility
authorized to received and dispose of these materials.
MONITORING
The team would conduct regular visual inspections of the drill pad and access roads to detect and
correct any operational problems. The drilling fluids (air, mud, water, and/or foam) and drilling
cuttings would be monitored by visual inspection and chemical analysis by drilling personnel,
contract geologists, and the contract mud engineer to detect any problems which may occur
down hole.
PERMITTING PATH
Environmental analyses have been done by the BLM and Navy. The Exploration EA completed
in 2008 and Utilization EIS completed July 2011 (OEPC Control Number FES 11-12) provide
NEPA analysis for exploration and development of a geothermal well field, power plant and
transmission line on private and BLM properties. The Navy’s PEIS for Geothermal Energy
Development at NAS Fallon provides the same level of analysis on NAS Fallon property. The
Fallon FORGE team believes that these documents are sufficient to support the commencement
of operations at the Fallon FORGE site. While the Navy will need to complete an internal
evaluation of all of these documents before this work will commence on the Navy owned land,
the Navy acknowledges that data generated during the EIS processes as well as other activities
on base are sufficient for them to complete NEPA requirements on Navy land in support of
FORGE. The Navy is committed to working with BLM to complete all NEPA related work on
NAS Fallon property before the close of Phase 2A.

Fallon, NV, Environmental Information Synopsis | 5
As evidence that a site development pathway exists, numerous wells have been previously
permitted within and immediately surrounding the proposed Fallon FORGE site. A summary of
permitted wells is provided below:
Drilled and not commercial:
Ormat leases: Two wells drilled: 84-31 and 18-5. These wells were drilled and completed
under approved existing permits.
NAS: Five exploration wells were drilled by the Navy GPO and one by Ormat for the
Navy GPO: 82-36 (drilled by Ormat), FOH-3D, 61-36, 88-24, 86-25, and 82-19. The
Navy GPO has been doing work at the Naval Air Station Fallon since the early 1990’s,
but recent exploration ramped back up in 2012. This included the acquisition of
geophysical surveys, the deepening of an existing exploration hole, drilling out the mud
in another existing hole, the drilling of 9 shallow temperature gradient holes and 5
intermediate to deep exploration holes. This work was performed under a Category
Exclusion Agreement and the Ormat/NASF EIS. However, future activities for the
FORGE project would require a new NEPA agreement with the NASF installation which
would take at most 4 months. The NASF installation itself will need to provide approval,
which could take at most 6 months, concurrent with the NEPA approval.
The Navy properties that make up the Fallon FORGE site are primarily fee Simple lands, where
the Navy owns all surface and subsurface rights. The project lands controlled by Ormat held
under BLM leases for Geothermal Resources in Unit Areas N79104, N79105, N79106) with
total size of 7426 acres. All three leases were unitized on May 14, 2009. The Ormat leases
expire on 8/30/2016. In accordance with the lease agreements, all three leases can be extended
for an additional 5 years without any work being performed on the leased land. Or as long as
there is activity/work (like FORGE) being performed on a lease and payments are current, the
leases are extended indefinitely. Evidence of activity is currently being gathered to process the
extension.
Permits required and approximate times to bring the Fallon FORGE site to full operation are
shown in Table 1, below. For exploration and drilling activities on Navy land, NAS Fallon may
Table 1. Permitting Timetable.
Necessary Permitting Time Period to Acquire
FAA Permit 45 days
NDEP UIC Permit 4 months
NDOM drilling permit 2 weeks
Drilling Permit 1 Month
DNA 1 – 2 Months
Dig Permit 1 month
CATEX 1 month
Access Request Form from Navy
2 weeks
Utility Locate 2 weeks
ECATTS Training 1 day
Oil Spill Manifest 1 day

Fallon, NV, Environmental Information Synopsis | 6
issue a Categorical Exclusion (CATEX). Drilling activities can begin with the approval of
geothermal drilling permit. Because the site disturbances were analyzed in the EIS, new drilling
sites may need to be permitted with additional field surveys and a Determination of NEPA
Adequacy (DNA) may be required. An FAA permit is needed because of the proximity of the
site to the air field at NASF. The Nevada Division of Minerals (NDOM) grant permits for
drilling and requires sundry notices for well work. The Nevada Division of Environmental
Protection (NDEP) grants permits for and oversees underground injection. The Navy and BLM
would also require safety and digging permits along with an oil spill manifest. The Navy also
requires use of the Environmental Compliance Assessment, Training, and Tracking System
(ECATTS) and requires access requests for non-military personnel. Activities can be pursued
concurrently.

1-D
APPENDIX D. UPDATED SITE CHARACTERIZATION DATA INVENTORY

UPDATED
SITE CHARACTERIZATION DATA
INVENTORY
Fallon, NV

Fallon, NV, Update on Characterization Data Uploaded to the GDR Data Archive | 1
UPDATED SITE CHARACTERIZATION DATA INVENTORY
Fallon, Nevada
Site characterization at Fallon, NV, and construction of the Fallon 3D geologic model synthesized all available surface and subsurface data. These data include downhole lithologic data interpreted from core, cuttings, and mud logs; downhole image log and geophysical data; digital elevation data; geologic map data; petrographic data; geologic cross-sections, gravity, and magnetic data; magnetotelluric data; downhole temperature data; shallow temperature data; well testing data; seismic reflection data; and seismicity data. Data used in construction of the 3D geologic model for the Fallon site is represented in Table 1, below.

Fallon, NV, Stakeholder Engagement Status Update | 2
Table 1. Data used in construction of the 3D geologic model for the Fallon site.
Data Description File Name Date
Uploaded
x,y,z downhole temperature data for wells in and around the Fallon FORGE site FallonFORGEWellTemps.txt 4/21/2016
3D model range, FORGE site outline FallonFORGEGISPolygons.zip 4/21/2016
x,y,z text file of the downhole lithologic interpretations in the wells in and around the Fallon FORGE site FallonFORGEWellLithologies.txt 4/21/2016
Temperature log from well 17-16 17-16_TEMP.pdf 3/31/2016
Mud log from well 13-36 13-36_mudlog.tif 3/31/2016
Mud log from well 35A-11 35A-11_mudlog.tif 3/31/2016
FORGE area GIS polygons FORGE boundary layers.lpk 3/31/2016
Mud log from well 86-15 86-15_mudlog.tif 3/31/2016
Temperature log from 35A-11 35A-11_temp.tif 3/31/2016
Temperature log from 34-33 34-33_temp.tif 3/31/2016
Mud log from well 78-36 78-36_mudlog.tif 3/31/2016
Digital elevation model Nevada DEM 3/31/2016
Geologic map of Nevada Geologic Map of Nevada 3/31/2016
Geologic Map of the Bunejug Mountains Quadrangle Churchill County Nevada
Geologic Map of the Bunejug Mountains Quadrangle Churchill County Nevada 3/31/2016
Geologic Map of the Lahontan Mountains Quadrangel Churchill County Nevada
Geologic Map of the Lahontan Mountains Quadrangel Churchill County Nevada 3/31/2016
Geologic Map of Grimes Point Quadrangle Churchill County Nevada
Geologic Map of Grimes Point Quadrangle Churchill County Nevada 3/31/2016
Hydrogeolgoy at Fallon Maurer and Welch 2001 3/31/2016
Major Carson Sink roads NDOT major roadways 3/31/2016
GIS data Fallon_FORGE_GDR.mpk 3/31/2016
Flow test from well FOH-3 FOH-3 Flow Test.xls 3/31/2016
EQ hypocenters USGS Query_EQs.csv 3/31/2016
Temperature pressure log from well 61-36 61-36_WellTempPressLog.xlsx 3/31/2016
Survey of well 61-36 61_36Survey_TGHBHT.xlsx 3/31/2016
2 meter temperature probe data 2mTemperatureProbe.zip 3/31/2016
Pressure log from well13-36 13-36_BHP.zip 3/31/2016
Temperature log from 13-36 13-36_TEMP.zip 3/31/2016
Well survey from well 13-36 13-36_XMAC.zip 3/31/2016

Fallon, NV, Stakeholder Engagement Status Update | 3
Data Description File Name Date
Uploaded
Survey of well 13-36 13-36_SURVEY.zip 3/31/2016
Mud log from well 47A-11 47A-11_MUDLOG.zip 3/31/2016
Mud log from well 51A-20 51A-20_MUDLOG.zip 3/31/2016
Mud log from well 56A-14 56A-14_MUDLOG.zip 3/31/2016
Mud log from well 58A-9 58A-9_MUDLOG.zip 3/31/2016
Mud log from well 14-1 14-1_MUDLOG.zip 3/31/2016
Temperature log from well 78-36 78-36_TEMP.zip 3/31/2016
Mud log from well 17-16 17-16_MUDLOG.zip 3/31/2016
Mud log from well 61-36 61-36_MUDLOG.zip 3/31/2016
Mud log from well 62-15 62-15_MUDLOG.zip 3/31/2016
Well test from well 82-36 82-36 well test.zip 3/31/2016
Temperature pressure log from well 84-31 84-31_PT.zip 3/31/2016
Temperature pressure log from well 82-36 82-36 PT logs.zip 3/31/2016
Temperature log from well 8431 84-31_TEMP.zip 3/31/2016
Mud log from well 86-25 86-25_MUDLOG.zip 3/31/2016
Gamma log from well 86A-15 86A-15_SEMBLANCE_GAMMA.zip 3/31/2016
Mud log from well 84-31 84-31_MUDLOG.zip 3/31/2016
Sonic log from well 17-16 17-16_SONICWAVE.zip 3/31/2016
Mud log from well 86A-15 86A-15_MUDLOG.zip 3/31/2016
Fallon area well collars FORGE area wells.zip 3/31/2016
Heat flow data HeatFlow.zip 3/31/2016
Temperature log from well FOH-3 FOH-3_TEMP.zip 3/31/2016
Siesmic reflection profiles NavySeismicLines.zip 3/31/2016
Radiogenic heat data Radiogenic_Heat_Generation.zip 3/31/2016
Temperature gradient data Temperature_Gradient_Measurements.zip 3/31/2016
Magnetotelluric data MT.zip 3/31/2016
Mud log from well 34-33 34-33_MUDLOG.zip 3/31/2016
Mud log from well 88-24 88-24_MUDLOG.zip 3/31/2016
Mud log from well FOH-3 FOH3_MUDLOG.zip 3/31/2016
Mud log from well 82-36 82-36_MUDLOG.zip 3/31/2016

1-E
APPENDIX E. UPDATED PERMITTING INVENTORY

UPDATED PERMITTING INVENTORY
Fallon, NV

Fallon, NV, Updated Permitting Inventory | 1
UPDATED PERMITTING INVENTORY
Fallon, NV
The original Permitting Inventory was initially submitted under our response to the Funding
Opportunity Announcement (DE-FOA-0000890). All new data or updates to existing data
generated during Phase 1 that support the Environmental Information Synopsis and the ability to
meet NEPA and other permitting/regulatory compliance requirements by the end of Phase 2B
area are reflected in this update.
No new permits have been issued for the proposed Fallon FORGE site during Phase 1 activities.
Multiple discussions between all lease holders involved have occurred to ensure that all parties
understand the commitment to the project and the potential for utilization of the lands for future
phases of FORGE. These meetings are documented in the community outreach section of the
Topical Report. All permits, as agreed upon by the parties involved, will be issued by the Navy
for work in Phase 2B.
Below is the Permitting Inventory modified after the initial FOA submission. This inventory is
subject to revisions throughout this project and will be updated as necessary.
SURFACE OWNERSHIP
Ownership:
BLM: Ormat leased land, 3 leases (MVN-079104, MVN-079105, MVN-079106), two
parcels of purchased private
DOD: Fallon Naval Air Station
Total acreage of proposed site (see Appendix A, site map):
Main FORGE site = 1115 acres (387 Ormat leased or owned, 728 NAS)
Total acreage available for monitoring = 9856 acres (3842 Ormat leased or owned plus
6014 NAS, exclusive of Main FORGE site and areas of No Surface Occupancy.
Within the Ormat leases, the area of No Surface Occupancy is part of the National Historic
Preservation Act and access, if needed, would require additional approval from BLM and the
impacted parties. Within the NAS areas of No Surface Occupancy are defined by the Naval Air
Strip and Fly Zones and are non-negotiable.
Total acreage components:
Contiguous sections: all land positions are contiguous
Parcels that can be combined (please describe): All three Ormat leases have been
unitized (see Bunejug Unit Agreement, Appendix E)

Fallon, NV, Updated Permitting Inventory | 2
ENVIRONMENTAL AND CULTURAL CONDITIONS
Existing environmental activities:
Environmental Impact Statement complete (see Ormat/Navy EIS and the NASF
Category Exclusion Agreement)
Nearby population center density: Fallon, NV 8,390 people
Distance: 12 km
Nearby wildlife habitats (endangered species / habitat): Desert ecology, riparian, seasonal
wetlands, migratory bird flyways (~5-8 km)
Nearby scenic vistas: Grimes Point (~5 km)
Nearby Areas of Critical Environmental Concern or Wilderness Areas: Stillwater National Wild
Life Refuge (~8 km)
Nearby wetlands or scenic waterways: Stillwater National Wild Life Refuge (~8 km)
Nearby Native American Tribes: Paiute-Shoshone at Fallon Indian Reservation (~15 km) and
Walker River Indian Reservation (~40 km)
Potential for landslides, or excessive subsidence as a result of induced seismic activity: none
Existence of historic structures or identified cultural resources in the immediate vicinity of the
proposed project area: Grimes Point National Recreation Trail (~5 km)
A review of any potential issues associated with the National Historic Preservation Act (NHPA):
Within the northeast sector of the Ormat leased land there is an area designated “No
Surface Occupancy.” This area falls under the NHPA. If there becomes a need for
surface occupancy for FORGE related activity, the No Surface Occupancy contingency
may be revised if the BLM, with Native American consultation, and the FORGE operator
both agree on access and access restrictions related to the particular need.
An indication of whether public opposition is likely (i.e., letters of support from local
municipalities or County, negative or positive press surrounding existing development at the
proposed site): Given the prior geothermal activities on the Ormat leased land and the NASF,
there is no indication of potential public opposition. Prior to initiating activities at the FORGE
site an extensive public outreach campaign will be conducted.
PERMITTING STATUS
Approved well permits:
Drilled and not commercial
Ormat leases: Two wells drilled: 84-31 and 18-5. These wells were drilled and completed under
approved existing permits.
Fallon, NV, Updated Permitting Inventory | 3
NAS: Five exploration wells were drilled by the Navy GPO and one by Ormat for the Navy GPO:
82-36 (drilled by Ormat), FOH-3D, 61-36, 88-24, 86-25, and 82-19. The Navy GPO has been
doing work at the Naval Air Station Fallon since the early 1990’s, but recent exploration ramped
back up in 2012. This included the acquisition of geophysical surveys, the deepening of an
existing exploration hole, drilling out the mud in another existing hole, the drilling of 9 shallow
temperature gradient holes and 5 intermediate to deep exploration holes. This work was
performed under a Category Exclusion Agreement and the Ormat/NASF EIS. However, future
activities for the FORGE project would require a new NEPA agreement with the NASF
installation which would take at most 4 months. The NASF installation itself will need to provide
approval, which could take at most 6 months, concurrent with the NEPA approval. Other permits
acquired to perform these geothermal exploration techniques:
Necessary Permitting Time Period to Acquire
FAA Permit 45 days NDEP UIC Permit 4 months NDOM drilling permit 2 weeks
Drilling Permit 1 Month
DNA 1 – 2 Months
Dig Permit 1 month CATEX 1 month
Access Request Form from
Navy 2 weeks
Utility Locate 2 weeks ECATTS Training 1 day Oil Spill Manifest 1 day
MINERAL RIGHTS
Mineral rights ownership:
Federal
LEASE STATUS
The Navy properties that make up the Fallon FORGE site are primarily Fee Simple lands, where
the Navy owns all surface and subsurface rights. The project lands controlled by Ormat held
under BLM leases for Geothermal Resources in Unit Areas N79104, N79105, N79106) with
total size of 7426 acres. All three leases were unitized on May 14, 2009. The Ormat leases
expire on 8/30/2016. In accordance with the lease agreements, all three leases can be extended
for an additional 5 years without any work being performed on the leased land. Or as long as
there is activity/work (e.g., FORGE) being performed on a lease and payments are current, the
leases are extended indefinitely. Evidence of activity is currently being gathered to process the
extension.

Fallon, NV, Updated Permitting Inventory | 4
WATER AVAILABILITY
Water availability on site: Geothermal water for re-injection/stimulation is available from Well
84-31, located due east from the Main FORGE site within Ormat lease MVN-079104. Flow tests
indicate a potential capacity of ~600 gpm. If re-injection continues or is expected to continue
beyond 30 days, a UIC (Underground Injection Control) permit will be requested. However, any
well used for stimulation/injection at the FORGE site will be required to have a UIC permit.
Additional water rights would be purchased from an existing water canal right owner, as needed.
The canal flows through the Ormat leased land.
Water availability at 1.5 km (Well 84-31) distance or possibly one of the Navy wells to the north
(e.g., 88-24).
Status of existing infrastructure to transport water: Pipeline will have to be
constructed to provide water from 84-31. Pipeline would be contained within the
FORGE site.
Potential barriers to development of transport infrastructure: None.
Water rights (select those that apply and describe):
Included/secured with land/lease deal: In Nevada, geothermal water from 84-31 can
be used for re-injection without water rights.
Can be purchased easily: Non-potable water for daily operations at the site will be
purchased from one of several local commercial suppliers that Ormat has used and
delivered by truck to the site and stored in surface tanks. Potable water will be
purchased from Culligan or a similar supplier.
Other local water demands for agricultural or other purpose: Area is used for grazing and
agriculture.
STATE AND LOCAL REGULATIONS
Solid waste disposal standards: Trash must be brought to a dump, recyclable material must be
properly recycled (metal scraps, aluminum).
Noise standards: See (Appendix C).
Air quality standards: See (Appendix C).
Drinking water and aquatic life protection: See attached (Appendix C).
TRANSMISSION ACCESSIBILITY
Proximity to transmission and distribution infrastructure: The project location is within close
proximity to multiple potential interconnection points and existing transmission infrastructure (~8
km away). This infrastructure is available for additional interconnection and transmission through
the utility’s (NV Energy) standard processes.

Fallon, NV, Updated Permitting Inventory | 5
YEAR-ROUND ACCESSIBILITY
Year round access (weather): All access roads are accessible and drivable all year round.

1-F
APPENDIX F. DATA DISSEMINATION AND INTELLECTUAL PROPERTY PLAN


Fallon, NV, Data Dissemination and Intellectual Property Plan | 1
DATA DISSEMINATION AND INTELLECTUAL PROPERTY PLAN
Fallon, NV
DATA DISSEMINATION APPROACH AND NGDS NODE DEVELOPMENT
OVERVIEW
A data system/Node that is compatible with the NGDS will be developed in Phase 2 of the
Fallon, NV, FORGE project. The Node will be a public, web-accessible interface to the NGDS
that allows for structured uploading of Fallon FORGE project data. It will include appropriate
options for establishment of a remote web server, a Node, and appropriate interfaces and
processes for connection to the NGDS through the central aggregator. FORGE Node site
maintenance and operations will be the responsibility of the Fallon FORGE Site Management
Team (SMT) which will employ expertise within our institutions for node development and
contracted expertise, if required. Data generated during the course of the project, either by the
Fallon FORGE Team, competitively selected R&D projects, or others associated with the Fallon
FORGE site will be submitted to the FORGE Node. All projects will be required to sign a letter
of commitment to upload all data acquired in conjunction with the Fallon FORGE site. Data
submitted to the Geothermal Data Repository before the FORGE Node is operational will be
ported to the FORGE Node. The data dissemination plan is described below.
DATA DISSEMINATION PLAN
A high priority goal of our Fallon FORGE project team is to ensure that all data acquired in
conjunction with the site be made available to the public in as close to real time as possible. A
second high priority goal is to ensure that posted data is of high quality. The guidelines for data
dissemination and quality control will depend on the type of data. We have identified four types
of data that will be acquired in association with the Fallon FORGE site:
1. Data that supports metadata:
All levels of Fallon FORGE data products will have appropriate metadata available to
enable users to make full use of the data or data products. Some metadata will be
included with the observational data by the data loggers. Other kinds of metadata will
include data quality measurements made by the FORGE team, data analysis parameters
and such base parameters as the latitude, longitude and elevation of FORGE
instrumentation.
2. Data acquired by the SMT for site characterization, monitoring, and R&D
3. Data acquired in conjunction with DOE FOA funded R&D projects and data acquired by
International Partners that provide their own R&D funding
4. Data acquired under previously agreed upon Intellectual Property protections

Fallon, NV, Data Dissemination and Intellectual Property Plan | 2
All acquired data, independent of type, will be uploaded or linked to the FORGE node in near
real-time, as governed by processing constraints. An example of data that will not be stored on the
FORGE node is microseismic monitoring data—these data will be uploaded in real time to an LBNL
server dedicated to induced seismicity. The FORGE node will provide a link to these data sets.
Other continuous, large volume data sets may be handled in a similar manner. To protect the
scientific integrity of the project PIs, the near real-time data uploaded to the FORGE node will
have an identifying “tag” indicating that the data has not been vetted for quality control. Quality
control of the data will be the responsibility of the generator. Following the upload of near real
time data, the project PIs will have a four- month window in which to vet their data and, if
necessary, upload revisions to the FORGE node. Data revised during the four-month vetting
period will be identified by a “tag” indicating that the data has undergone quality control review
and is considered to be of high quality and reliable. Data not revised during the four-month
period will also be considered to be of high quality and reliable, but will be tagged to indicate
that there were no revisions to the originally submitted data. There will be two exceptions. First,
all data acquired by the SMT (Type 1 and 2) will be continuously vetted and updated on the
FORGE node. The goal is to ensure that outside PIs or potential PIs have the most up to date
information regarding the characteristics and monitoring of the FORGE site to facilitate their
research and/or to help develop a research project in response to an R&D solicitation. The
second exception involves data identified as protected by an Intellectual Property (IP) agreement
(Type 4). Any agreements establishing IP protected data will be made in collaboration with the
project leads generating the data and with the SMT, STAT, and DOE. Access to data uploaded
to the FORGE node that is IP protected will remain the exclusive right of the generator for a
period of five years during which time it will be password protected.
To conduct research at the Fallon FORGE site or in conjunction with the Fallon FORGE project,
project leads will agree to and sign a letter of commitment to abide by the data dissemination and
quality control plan defined above. In the case of a FOA call for R&D issued by DOE,
acceptance of responses will be contingent upon the inclusion of the signed letter of commitment
in the FOA response. For non-DOE funded projects, such as collaborations with international
partners or private sector stakeholders, prior to approval of such projects by the SMT, STAT and
DOE, the signed letter of commitment must be provided by the project leads.
NGDS NODE DEVELOPMENT
DATA NODE HARDWARE
A NGDS compliant FORGE node will be deployed on the Amazon Web Services (AWS) cloud.
AWS is the leading cloud provider, offering a secure, reliable, and scalable computing
environment. There are many computing services provided by AWS; for data node development
the Elastic Compute Cloud (EC2) will provide all the computing resources necessary. An EC2
instance with 4 CPUs, 32 GB or RAM, and 6 TB of storage will be used for the initial
deployment.
DATA NODE SOFTWARE
The software package “Node-in-a-Box” (NIAB) available through the NDGS will be used to
implement the FORGE data node software services. NIAB was developed under the NGDS

Fallon, NV, Data Dissemination and Intellectual Property Plan | 3
Architecture, Design, and Testing Project to allow for the easy deployment of a NGDS compliant
data node. NIAB is based on open source standards and extends a storage management product
called CKAN. NIAB provides the entire software infrastructure for hosting a NGDS compliant
node which includes the ability to upload structured and unstructured data sets through a web
interface, publish metadata information about the data sets to the central aggregator node,
manage data sets and metadata over time, and host web services to expose highly structured data
sets (Tier 3). NIAB is a stable platform and has been successfully deployed by number of
government institutions. While a custom NGDS solution could be implemented it would be
expensive and one would lose many of the benefits of using an open source solution.
Functionality that is desired but not currently available in NIAB can be added by anyone and
those added features will be made available to everyone.
DATA SUBMISSION
Metadata describing the data sets is a critical step in making data available to the greater
scientific community. The NGDS aggregator node will harvest the metadata records stored on
our data node and add those records to the NGDS Catalog. Every data set (resource) uploaded to
the data node will have associated metadata that describes the contents of the data set. The
metadata will conform to the NGDS standards and all required fields will be populated.
Data sets uploaded to the data node (NIAB) will fall into one of three categories:
Tier 1 – Data that is unstructured (text, images, etc.).
Tier 2 – Data that has some structure by does not conform to NGDS content model.
Tier 3 – Data that is highly structured and can be validated against NGDS content model
schemas.
When data is uploaded through the web interface it will be marked at the appropriate category
level. Tier 3 data is structured as Excel spreadsheets and must conform to one of the NGDS
content model definitions. Excel templates for Tier 3 data can be found at
http://schemas.usgin.org/models/. Before uploading Tier 3 data to the node it will be validated at
http://schemas.usgin.org/validate/cm. Once the appropriately structured data is successfully
validated it can be uploaded to the data node as Tier 3 data. After it uploads, Tier 3 data can be
published as an Open Geospatial Consortium (OGC) web service. We will encourage funded
principal investigators to upload to the FORGE node data sets (resources) that conform to Tier 3
standards and which will then be made available as OGC web services (WFS or WMS).
IMPROVEMENT TO NIAB
While the NIAB provides all the capability to be a NGDS compliant data node it does lack some
features. Specific to this plan will be the ability to limit the access to a data set for a given period
of time (moratorium) and flags for data vetting (QA) by PIs which are not currently available.
Since NIAB and CKAN is open source it will be possible to modify code to add these or other
features that may become necessary. The Scrum methodology will be used to manage the
software project effort. Scrum enforces iterative and incremental development and promotes
daily face-to-face communication between all team members. At the end of each iteration,
typically 2-4 weeks, the current state of the software being developed is presented in a demo to
all stakeholders. This promotes continuous feedback from the customers/stakeholders to ensure

Fallon, NV, Data Dissemination and Intellectual Property Plan | 4
a quality software system is delivered at the end of the development effort. All developed
software will have design documents, be fully commented, reviewed by peers, and unit tested.
INTELLECTUAL PROPERTY (IP) MANAGEMENT
As a Federally Funded Research and Development Center, Sandia National Laboratories has
protocols in place to address IP issues and has rights to technical data. Prior to any agreement
with a funded contractor, any issues related to IP and data rights will be negotiated and plans will
be developed as part of the contractual agreement. The template for the IP and data plan
agreement between the Sandia Corporation and a company is provided in the following
Attachment.

Fallon, NV, Data Dissemination and Intellectual Property Plan | 5
ATTACHMENT
INTELLECTUAL PROPERTY AND TECHNICAL DATA MANAGEMENT PLAN
BETWEEN
SANDIA CORPORATION
and
COMPANY
This Intellectual Property Management Plan (the “IP Management Plan”) is effective as of the
date of the last signature (the “Effective Date”) by Sandia Corporation (“Sandia”), manager and
operator of Sandia National Laboratories (“SNL”) for the United States Department of Energy
(“DOE”) under contract DE-AC04-94AL85000 (the “Prime Contract”), a Delaware corporation
whose principal place of business is located in Albuquerque, New Mexico, and
_____________________ (“_______”) located at ________________________________
(individually, “Party” and collectively, “Parties”). Terms in this IP Management Plan that are
capitalized have the meanings set forth in Exhibit A of this IP Management Plan.
I. Background
1. This IP Management Plan is established to govern the management and disposition of
INTELLECTUAL PROPERTY directly resulting from joint research and/or development
between Sandia and _____________ directed to ______________________ (the
“Joint Work”).
2. The IP Management Plan objectives include:
a. Promoting the patenting, licensing, and rapid commercialization of SUBJECT
INVENTIONS when the public good is best served by controlling the activities of
those commercializing the SUBJECT INVENTIONS and/or by providing economic
rewards necessary to encourage commercial partners to make the investment
required to move an early stage technology to the market, and
b.Promoting the rapid dissemination of breakthrough scientific discoveries and
technological innovations for the public good.
3. All actions by Sandia documented in this IP Management Plan are subject to
available funding from DOE to Sandia.
4. This IP Management Plan shall not be used to obligate or commit funds or as the
basis for the transfer of funds. This IP Management Plan does not commit any Party
to take any actions; the actions of each Party are independent of the actions of the

Fallon, NV, Data Dissemination and Intellectual Property Plan | 6
other Party. In no event shall either Party be required to perform work outside the
scope of the Joint Work.
5. Each Party will bear all costs, risks and liabilities incurred by it arising out of efforts
under this IP Management Plan, and neither Party shall have any right to any
reimbursement, payment or compensation of any kind from the other hereunder.
II. Title to SUBJECT INVENTIONS and Other PROJECT INTELLECTUAL PROPERTY
1. Inventorship or authorship of PROJECT INTELLECTUAL PROPERTY and PROJECT
TECHNICAL DATA will be determined in accordance with applicable U.S. patent,
trademark and copyright law and any corresponding state laws.
2. Each Party shall retain title to their BACKGROUND TECHNICAL DATA and
BACKGROUND INTELLECTUAL PROPERTY used during the Joint Work. Each Party’s
BACKGROUND TECHNICAL DATA and BACKGROUND INTELLECTUAL PROPERTY shall
be identified as such and shall contain such proprietary markings pursuant to any
separate non-disclosure agreement(s) governing such disclosures between the Parties.
3. The U.S. Government will not normally require delivery of confidential or trade
secret-type BACKGROUND TECHNICAL DATA developed solely at private expense
prior to issuance of an award, except as necessary to monitor technical progress and
evaluate the potential of proposed technologies to reach specific technical and cost
metrics.
4. The U.S. Government retains unlimited rights in PROJECT TECHNICAL DATA
produced under Government financial assistance awards, including the right to
distribute to the public. One exception to the foregoing is that invention disclosures
may be protected from public disclosure for a reasonable time in order to allow for
filing a patent application.
5. Each Party shall have the right to use the other Party’s PROJECT TECHNICAL DATA,
and PROJECT INTELLECTUAL PROPERTY along with the related BACKGROUND
TECHNICAL DATA and BACKGROUND INTELLECTUAL PROPERTY identified in Exhibit
B for the sole purpose of carrying out the Joint Work, but may not disclose the other
Party’s PROJECT TECHNICAL DATA, PROJECT INTELLECTUAL PROPERTY,
BACKGROUND INTELLECTUAL PROPERTY and BACKGROUND TECHNICAL DATA to
any person or third party except with written permission of the other Party and under
suitable confidentiality obligations pursuant to a separately executed non-disclosure
agreement. Each Party shall establish and implement specific measures and protocol
to protect such information and data from disclosure. Exhibit B will be amended to

Fallon, NV, Data Dissemination and Intellectual Property Plan | 7
include additional BACKGROUND TECHNICAL DATA and BACKGROUND
INTELLECTUAL PROPERTY that the Participants mutually agree is relevant to
accomplish the Joint Work.
6. Each Party shall solely own SUBJECT INVENTIONS and other PROJECT INTELLECTUAL
PROPERTY developed solely by its employees and agents and shall obtain patent
protection for SUBJECT INVENTIONS at its sole discretion.
7. SUBJECT INVENTIONS and PROJECT INTELLECTUAL PROPERTY and PROJECT
TECHNICAL DATA jointly developed by the Parties shall be jointly owned by the
Parties. Any jointly developed SUBJECT INVENTIONS and/or PROJECT TECHNICAL
DATA may be protected by one or more patent applications filed by either Party. The
Party filing the patent application directed to jointly developed SUBJECT INVENTIONS
and/or PROJECT TECHNICAL DATA shall notify the other Party in a timely manner.
8. Unless agreed to otherwise, the Party filing a patent application on a SUBJECT
INVENTION and/or PROJECT TECHNICAL DATA, whether solely or jointly owned, shall
pay all preparation and filing expenses, prosecution fees, issuance fees, post issuance
fees, patent maintenance fees, annuities, interference expenses, and attorneys’ fees for
that patent application and any resulting patent(s). The Parties will use all reasonable
efforts to cooperate with each other with respect to the preparing, filing and
prosecuting any such patent applications.
9. Upon at least two weeks’ notice to the other Party, any Party will be free to submit for
publication the results of PROJECT INTELLECTUAL PROPERTY and PROJECT
TECHNICAL DATA that the Party solely owns, provided due consideration is given to
protection of patentable subject matter.
III. Licensing of SUBJECT INVENTIONS and PROJECT INTELLECTUAL PROPERTY
1. The Parties may enter into one or more separate agreements to facilitate the filing of
patent applications and/or licensing of the jointly developed SUBJECT INVENTIONS
and PROJECT INTELLECTUAL PROPERTY and PROJECT TECHNICAL DATA. Any such
license that a Party may grant shall be subject to a reservation of certain rights to the
Federal Government, which include Government use rights, march-in rights and U.S.
Competitiveness.
2. Any license pursuant to Section III.1 that a Party may grant will reserve the option to
permit private or public educational institutions to use the jointly developed SUBJECT
INVENTIONS and PROJECT INTELLECTUAL PROPERTY on a royalty-free basis for

Fallon, NV, Data Dissemination and Intellectual Property Plan | 8
research, development and/or education, but not for commercial purposes, subject to
confidentiality requirements. Sandia shall also retain the right to non-exclusively
license the SUBJECT INVENTIONS and PROJECT INTELLECTUAL PROPERTY and
PROJECT TECHNICAL DATA that it solely and jointly owns as background intellectual
property to cooperative research and development agreement (“CRADA”)
participants and work for others agreement (“WFO”) sponsors.
IV. Warranties and Representations
1. Nothing in this IP Management Plan shall be construed as:
a. a warranty or representation by either Party as to the validity or scope of any right
included in the BACKGROUND TECHNICAL DATA and BACKGROUND
INTELLECTUAL PROPERTY;
b. an obligation to furnish any information beyond that listed in the BACKGROUND
TECHNICAL DATA and BACKGROUND INTELLECTUAL PROPERTY; or
c. creating in either Party any right, title or interest in or to the inventions, patents,
technical data, computer software or software documentation solely owned by the
other Party.
2. Disclaimer. ALL INFORMATION, TESTS AND RESULTS BY EITHER
PARTY ARE PROVIDED “AS IS”, AND NEITHER PARTY MAKES ANY
REPRESENTATIONS, WARRANTIES OR GUARANTEES OF ANY KIND,
EXPRESS OR IMPLIED, REGARDING ANY SERVICES, INFORMATION,
TESTS OR RESULTS, INCLUDING WITHOUT LIMITATION ANY
WARRANTIES OF TITLE, MERCHANTABILITY, FITNESS FOR A
PARTICULAR PURPOSE, RESULT, USE, OR NON-INFRINGEMENT
THEREOF.
3. Limitation of Liability. In no event shall either Party be liable to the other for any
punitive, exemplary, special, incidental, consequential or other indirect damages
(including, but not limited to, lost profits, lost revenues and lost business
opportunities) arising out of or relating to this IP Management Plan, regardless of the
legal theory under which such damages are sought, and even if the Parties have been
advised of the possibility of such damages or loss.
V. Term/Termination
1. This IP Management Plan shall commence on the Effective Date and continue until
completion of the Joint Work, unless terminated earlier in accordance with this IP
Management Plan.

Fallon, NV, Data Dissemination and Intellectual Property Plan | 9
2. Either Party may terminate this IP Management Plan for any reason upon at least
sixty (60) days written notice (“Notice of Termination”) to the other Party. Should
the IP Management Plan be terminated prior to completion of the Joint Work, the
Parties may continue to use the other Party’s PROJECT TECHNICAL DATA, and
PROJECT INTELLECTUAL PROPERTY along with the BACKGROUND TECHNICAL DATA
and BACKGROUND INTELLECTUAL PROPERTY listed in Exhibit B solely to the extent
needed to complete the Joint Work.
3. Sections IV, VI, VII and VIII and obligations regarding confidentiality shall survive
the termination or expiration of the IP Management Plan.
VI. United States Government Interests
1. It is understood that the United States Government (through any of its agencies or
otherwise) has funded research, Contract No. DE-AC04-94AL85000 - United States
DOE’s National Nuclear Security Administration, during the course of or under
which any of the PROJECT INTELLECTUAL PROPERTY was conceived or made. The
United States Government is entitled, as a right, to a non-exclusive, non-transferable,
irrevocable, paid-up license to practice or have practiced the PROJECT INTELLECTUAL
PROPERTY for governmental purposes. The Parties also agree and understand that the
United States Government retains “march-in” rights, in accordance with the
procedures set forth in 37 CFR 401.6 and any supplemental regulations promulgated
by the DOE.
VII. Dispute Resolution
1. Any dispute between the Parties relating to the management of Project Intellectual
Property, as provided for in this IP Management Plan, or to the interpretation of this
IP Management Plan, shall be referred to the Parties’ respective officers, as
designated below. Through the designated officers, the Parties agree to first attempt
informal resolution of disputes, within a reasonable period of time and in a fair and
equitable manner, taking into consideration the objectives of the Joint Work and any
laws, statutes, rules, regulations or guidelines to which the involved Parties are
subject.

Fallon, NV, Data Dissemination and Intellectual Property Plan | 10
The designated officers and their contact information are as follows:
For Sandia:
Name:
Address:
Telephone:
Email:
For _______________:
Name:
Address:
Telephone:
Email:
2. If the designated officers are unable to resolve the issues presented before them, and
if the dispute cannot be settled through negotiation, the Parties agree first to try in
good faith to settle the dispute by mediation administered by the American
Arbitration Association under its Commercial Mediation Procedures before resorting
to arbitration, litigation, or some other dispute resolution. If within 30 days after
service of a written demand for mediation, the mediation does not result in settlement
of the dispute, then any unresolved issues shall be settled by arbitration administered
by the American Arbitration Association in accordance with its Commercial
Arbitration Rules, and judgment on the award rendered by the arbitrator(s) may be
entered in any court having jurisdiction thereof.
VIII. Miscellaneous
1. Except as provided herein, any commitment of funds, intellectual property rights,
disclosure of proprietary information, or other resources needed to carry out the
objectives set forth herein shall be made under separate agreements.
2. It is understood that any work done or actions taken by Sandia must be in accordance
with the terms and conditions of the Prime Contract between Sandia and the DOE for
the operation of SNL; and must be in accordance with any successor contracts for the
operation of SNL. In the case of any conflict between this IP Management Plan and
the Prime Contract for the operation of Sandia, the Prime Contract shall take
precedence.
3. This IP Management Plan shall be construed in accordance with the laws of the State
of Delaware.

Fallon, NV, Data Dissemination and Intellectual Property Plan | 11
4. The Parties hereto are independent contractors and not joint venturers or partners.
5. The Parties acknowledge that they are subject to and agree to abide by the United
States laws and regulations (including the Export Administration Act of 1979 and
Arms Export Control Act) controlling the export of technical data, computer
software, laboratory prototypes, biological material, and other commodities. The
transfer of such items may require a license from the cognizant agency of the U.S.
Government or written assurances that it shall not export such items to certain foreign
countries and/or foreign persons without prior approval of such agency. Neither
Party represents that a license is or is not required or that, if required, it shall be
issued.
6. This IP Management Plan incorporates by reference Exhibits A and B [below] and
embodies the entire understanding between the Parties with reference to the subject
matter hereof, and no statements or agreements by or between the Parties, whether
orally or in writing, except as provided for elsewhere in Section VI, made prior to or
at the signing hereof, shall vary or modify the written terms of this IP Management
Plan. Neither Party shall claim any amendment, modification, or release from any
provisions of this IP Management Plan by mutual agreement, acknowledgment, or
otherwise, unless such mutual agreement is in writing, signed by the Parties, and
specifically states that it is an amendment to this IP Management Plan.
7. Neither Party shall use the name of the other Party or the name of any employee
thereof in any sales promotion, advertising, or any other form of publicity without the
prior written approval of the other Party.
IN WITNESS THEREOF, the parties hereto have executed or approved this IP Management
Plan on the dates below their signatures.
COMPANY NAME SANDIA CORPORATION
By: By:
Date: Date:
Name: Name:
Title: Title: Senior Manager, Industry
Partnerships

Fallon, NV, Data Dissemination and Intellectual Property Plan | 12
EXHIBIT A
Definitions:
1. “BACKGROUND INTELLECTUAL PROPERTY” means the INTELLECTUAL PROPERTY identified
by the Parties that was in existence prior to or is first produced outside of the Joint Work and
is necessary for the performance of the Joint Work. BACKGROUND INTELLECTUAL
PROPERTY may also include trade secrets of the Parties that were in existence prior to or are
first produced by the Parties outside of work under this IP Management Plan to the extent
that such trade secrets do not otherwise constitute or become SUBJECT INVENTIONS as
defined herein.
2. “BACKGROUND TECHNICAL DATA” means information, in hard copy or in electronic form,
including, without limitation, documents, drawings, models, designs, data memoranda, tapes,
records, software and databases developed before or independent of performance under the
Award that is necessary for the performance of the Joint Work.
3. “INTELLECTUAL PROPERTY” means technical information, inventions, developments,
discoveries, know-how, methods, techniques, formulae, algorithms, data, processes and other
proprietary ideas (whether or not patentable or copyrightable). INTELLECTUAL PROPERTY
also includes patent applications, patents, copyrights, trademarks, mask works, and any other
legally protectable information, including computer software.
4. “INVENTION” means any discovery or a new composition, device, method, system, software,
process or design developed from study and experimentation that is or may be patentable or
otherwise protectable under Title 35 of the United States Code, or any novel variety of plant
that is or may be protected under the Plant Variety Protection Act (7 U.S.C. 2321 et seq.).
5. “PROJECT INTELLECTUAL PROPERTY” means and includes all INTELLECTUAL PROPERTY first
conceived, discovered, developed, reduced to practice and/or generated during the
performance of the Joint Work.
6. “PROJECT TECHNICAL DATA” means information (in hard copy or in electronic form)
including, without limitation: documents, drawings, models, designs, data, memoranda, taps,
records, software and databases developed during the performance of the Joint Work.
7. “SUBJECT INVENTION” means any INVENTION of a Party that is conceived or first actually
reduced to practice in the performance of the Joint Work.

Fallon, NV, Data Dissemination and Intellectual Property Plan | 13
EXHIBIT B
Sandia’s BACKGROUND TECHNICAL DATA and BACKGROUND INTELLECTUAL PROPERTY
Invention Disclosure (SD #________; Company #________)
Title: “_____________________________________”
Inventors: __________________________________
Company’s BACKGROUND TECHNICAL DATA and BACKGROUND INTELLECTUAL PROPERTY
Invention Disclosure (SD #________; Company #________)
Title: “_____________________________________”
Inventors: __________________________________

1-G
APPENDIX G. COMMUNICATIONS AND OUTREACH PLAN

COMMUNICATIONS AND OUTREACH
PLAN
Fallon, NV

Fallon, NV, Communications and Outreach Plan | 1
COMMUNICATIONS AND OUTREACH PLAN
Fallon, Nevada
This document is a comprehensive and innovative plan for communications, education, and
outreach to support efforts by the Naval Air Station (NAS) Fallon FORGE project team to
maintain sound operations and increase geothermal science and technology literacy.
INTRODUCTION
The NAS Fallon FORGE project team maintains a fundamental commitment to strategic
communications, outreach, and education related to enhanced geothermal systems (EGS) and the
FORGE project. Led by Sandia National Laboratories, the team has experience managing large
science-based field operations that require substantial communications with stakeholders and
partners. We recognize the value of internal and external communications to maintain sound
operations. Our strategic outreach efforts, begun in Phase I, will continue into Phases 2 and 3
with a range of activities designed to keep stakeholders informed. We are also committed to a
robust education initiative that reaches students in grades K-12 with energy curricula based in
science, technology, engineering, and math (STEM) best practices and creates research and
development opportunities for undergraduate, graduate, and post-doctoral students. The Fallon
FORGE team takes seriously its role in reducing global reliance on fossil fuels and its
responsibility for communicating the benefits of research that stimulates the commercial
development of EGS systems.
COMMUNICATIONS GOALS AND OBJECTIVES
Together with our public and private sector partners, implement a coordinated proactive
outreach strategy, consistent with DOE/EERE approved branding, to support the
selection and operation of the Fallon, NV, site for Phases 2 and 3.
Provide communications support for technical teams and future activities.
Identify and publicize best practices and success stories that will contribute to the
development of a collaborative national geothermal strategy.
Communicate the relevance of EGS to a wider community and educate those who may
benefit from its value.
Communicate the benefits of sharing EGS data and collaborating to share and
disseminate EGS and FORGE information, including the results from the Fallon FORGE
project.
PROGRAM BACKGROUND
FORGE, Frontier Observatory for Research in Geothermal Energy, is a U.S. Department of
Energy Office of Energy Efficiency and Renewable Energy’s (EERE) Geothermal Technologies
Office program directed at establishing a dedicated site where the subsurface science and
engineering community can develop, test and improve technologies in an ideal EGS
environment. Essentially, FORGE seeks to implement an underground “rock laboratory” that

Fallon, NV, Communications and Outreach Plan | 2
will be the target of experimentation that advances EGS technology, vastly increasing the
potential for geothermal power production nationwide.
Today, the United States produces about 3.5 gigawatts (GW) of geothermal electricity, which is
less than 0.5% of the country’s energy needs. According to the U.S. Geological Survey (USGS),
the successful development of EGS techniques would open the door to more than 500GW of
geothermal electricity production in the United States. The multi-year FORGE program
addresses this potential, and is divided into three phases (see Figure 1). During Phase 1, the site
selection process, five locations were selected for continued planning and conceptual geologic
modeling. Further down select will occur in Phase 2 in preparation for full site characterization
at the selected location. Full implementation of FORGE occurs during Phase 3.
Figure 1. The three phases of FORGE: site selection, characterization, and implementation
ABOUT THE PROPOSED FALLON FORGE SITE
Today, Nevada generates 600 megawatts (MW) of geothermal power. The USGS estimates
Nevada’s geothermal heat resource potential at more than 100,000 MW.
The proposed Fallon FORGE site at the Naval Air Station Fallon (NASF) is one of only five
sites selected by DOE for preliminary Phase 1 work. After a competitive further down-select
process between Phases 1 and 2, DOE will choose one site (Phase 2c) for the remaining five
years of focused Phase 3 FORGE research and development work.

Fallon, NV, Communications and Outreach Plan | 3
Based on a survey of dozens of areas in the western United States, the Fallon FORGE site was
chosen because it has a target zone in crystalline basement rock at depths between 5,000 and
7,500 feet that has temperatures greater than 350°F and low permeability. These characteristics
have been determined by DOE to be ideal for implementing the FORGE underground laboratory,
where EGS techniques will be developed and tested.
The Fallon FORGE site lies within and adjacent to the Naval Air Station Fallon (NASF) and
includes land that has been leased by Ormat Nevada Inc. for geothermal development. More
than 45 wells have been drilled for geothermal exploration in the Fallon area. However, no
commercially productive geothermal resource has been found; the wells have attractive
temperatures, but permeability is low. The Fallon FORGE site includes a 1.7 square mile area
where 4 deep exploration wells have already been drilled; this is the area where FORGE drilling
and testing activities will occur. An additional 15.4 square miles will be used for
instrumentation and monitoring of FORGE activities.
Site characterization, drilling, stimulation, testing, and the results of various subsurface
experiments from the Fallon FORGE site will be made available to all interested communities
through public data access, news releases, published articles, meetings, and other appropriate
venues.
CRITICAL PROJECT MILESTONES
Project deliverables: April 27, 2016
Phase 2 application: May 23, 2016
Oral presentation to DOE: June 2016
SITUATIONAL ANALYSIS
The following location-specific topics will be addressed in NAS Fallon communications with
target audiences. The team’s approach to these topics demonstrates a keen awareness of the
Fallon community and acknowledges the importance of public perception related to geothermal
energy development.
1. Water use: Identify the source(s) of water for the project, estimate how much water will
be needed, and predict the impacts, if any, of water consumption on the community and
environment.
2. Induced micro-seismicity (man-made micro-earthquakes): Define how micro-
earthquakes might be induced by injection and production. Address how seismicity is
currently monitored and reported in nearby geothermal fields and within the Fallon
FORGE area and what type of monitoring will be necessitated by the EGS work.
Address the potential impacts of induced micro-seismicity and anticipated mitigations.
3. Culture and environment: Identify potential impacts to the environment and known
cultural sites in the Fallon FORGE project area and anticipated mitigations.
4. NASF mission: Identify any potential impacts to NASF mission and anticipated
mitigations.

Fallon, NV, Communications and Outreach Plan | 4
5. Community relations: Identify the local communities likely to be interested in the
project and establish a plan to meet their needs for accurate and timely information about
the FORGE project.
6. Education: In collaboration with NASF, identify educational outreach opportunities for
engaging K-12 students and educators. Identify and collaborate with universities.
Identify possible internship opportunities through the national laboratories, university
partners, and geothermal industry partners.
TARGET AUDIENCES
Based on the situational analysis and the team’s knowledge of the interested parties, we have
identified both a primary and secondary audience to which we will target Fallon FORGE
communications. These include, broadly, the following:
Primary audience
Partners in the Fallon FORGE project (NAS Fallon and others)
Tribal, State, and local governments and government agencies
Local communities
Congressional delegations
State legislators
Federal agencies (DOE, DoD, USGS, BLM, Navy)
U.S. Department of Energy Geothermal Technologies Office (GTO) program managers
Local water agencies
Energy research and development (R&D) community, including graduate students
Geothermal developers
Public- and private-sector geothermal research community
Secondary audience
Public interest and watchdog groups
Utility companies and transmission system operators
Nevada Public Utilities Commission
Local media outlets
Interested citizens

Fallon, NV, Communications and Outreach Plan | 5
KEY MESSAGES
In response to the situational analysis, and recognizing our diverse audience, we propose a set of
five key messages and supporting points to address basic concerns and present information about
the Fallon FORGE project. The messaging addresses potential economic and environmental
impacts and the value of EGS to the local community. The key messages will frame consistent
talking points for stakeholder outreach and will be the basis for evolving targeted
communications as the project moves from Phase 1 into Phases 2 and 3.
1. Sustainable EGS is a valuable addition to the energy supply of the United States and the global community, and FORGE-enabled research is critical to the widespread implementation of EGS.
In spite of its resource potential, the technological impediments to widespread
development of EGS have limited its role in the U.S. energy mix.
The Fallon FORGE project will allow for fundamental research and development of new
technologies for EGS reservoir creation, characterization, and utilization.
EGS offers huge potential for power production (USGS mean estimate: 518 GW) with no
CO2 emissions and could replace traditional energy sources (coal, gas, and oil
generation).
EGS research contributes to energy security by enabling long-term reliable energy
sources with potential for intrastate deployment.
Technologies developed via FORGE could significantly expand the geothermal industry
in the United States.
EGS can unlock the benefits of geothermal energy as the ultimate renewable source: it is
dispatchable, reliable, stable, commercial, and offers the highest level of security for our
energy production.
EGS could provide employment alternatives to traditional energy sector jobs.
2. FORGE will help maintain Nevada’s position as an international leader in renewable energy.
Implementation of technologies developed in the Fallon FORGE may help Nevada
achieve its goal of 25% renewable energy by 2025. The USGS estimate of EGS potential
in Nevada is more than 100,000 MW.
The Fallon FORGE project supports the state’s reputation as an innovator and opens the
door for partnerships with high-tech and other industries in Nevada.
EGS R&D may demonstrate the technological feasibility of a clean energy source that
can be widely deployed.
Geothermal power is baseload and flexible, valuable qualities for Nevada’s future
generation resources.

Fallon, NV, Communications and Outreach Plan | 6
3. A world-class EGS research project located at NAS Fallon would be valuable to the local community.
Increase the community’s visibility
Provide income for local businesses
Lead to possible workforce development opportunities
Broaden K-12 students’ knowledge of renewable energy technologies through outreach
and field trips
Offer media training opportunities
Provide educational opportunities and beneficial experience through student internships
4. The U.S. Navy is a strong supporter of FORGE and a leading innovator for national energy security.
EGS could be an important source of resilient energy for military bases.
Feasibility demonstration at NAS Fallon could pave the way for widespread
implementation of EGS at other DoD facilities.
Continued collaboration between DoD and DOE will improve energy security.
Fallon FORGE project activity will facilitate DoD’s mandate to reduce fossil fuel use.
Use of EGS will expand DoD’s geothermal resource base.
A multi-lab and industry project associated with a DoD facility creates partnership
opportunities between other government agencies, local industries, and academia.
5. The NAS Fallon site is an excellent proposed location for the FORGE project.
Wells are already available, bedrock conditions (crystalline rock) are conducive to
relatively easy drilling, and there is abundant local drilling experience.
Subsurface conditions (geology, temperature) are well known.
A multi-station seismic monitoring array has been operating for years, with an extensive
seismic catalog that has been substantially refined through research by USGS and other
organizations.
High temperatures found at shallow depths reduce drilling costs.
The project has developed a preliminary water use plan to minimize impact on nearby
water users.
Fundamental environmental work has been performed on both the BLM withdrawn land
as well as the existing BLM leases.

Fallon, NV, Communications and Outreach Plan | 7
COMMUNICATION TACTICS AND OUTREACH METHODS
The following table outlines the outreach methods (meetings, emails, reports, newsletters,
teleconferences, websites, social media, internships, classroom engagements, etc.), a description
of the intended audience, conveyed information and material contents, and the frequency of the
activities.
Table 1. Fallon FORGE project communications by method and audience
Communication Method Audience Description Frequency Responsibility
Face-to-face, Skype, and teleconference meetings with key partners and stakeholder groups
Local officials, congressional staff, research community, etc.
Quarterly or as needed
Tech team
Project web sites with additional resources (video, webinar links, PDF documents)
All targets Ongoing Tech team
Email and GovDelivery bulletins/newsletters DOE, stakeholders, GTO news subscribers (12,000)
Quarterly or as needed
SNL/LBNL Comms, coordinate w/GTO
Publications that support outreach: Fact sheets, infographics, FAQs, etc.
All targets Available as needed
SNL/LBNL Comms
Social Media (Twitter, Facebook, Periscope) via Lab accounts and stakeholders
All targets Ongoing SNL/DOE Comms
Standard briefing packet: PowerPoint presentation template
Primary target Available as needed
SNL/LBNL Comms
Site Tours All targets Monthly or as requested
Tech team
Science education opportunities, curriculum, collaborations with educators to increase geothermal science and technical literacy
K-12 students, teachers, parents
Ongoing Tech Team, Comms
Professional meetings, targeted conferences/ workshops
All targets As opportunities arise
SNL/LBNL Comms
Industry publications, news releases, blog posts
Research community; e.g., readers of Geothermal Energy Association Weekly and Think Geo Energy Blog
Ongoing SNL/LBNL Comms
Student internship opportunity (publicize through DOE/EERE Tribal Energy Program)
Undergraduate and graduate students; post-docs; research community; Tribal entities
Annually SNL/LBNL Comms
Government and industry events, such as Geothermal Energy Association Showcase
Research community/ Congressional staff
Annually Coordinate w/GTO
Public meetings with updates about workforce development possibilities
Local community As opportunities arise
Tech Team
Partnering with professional communicators within the Labs and with educational specialists on planning, logistics, technical and legal documentation, etc.
All targets Ongoing SNL/LBNL Comms

Fallon, NV, Communications and Outreach Plan | 8
FREQUENTLY ASKED QUESTIONS (FAQS)
Based on the key messages, the Fallon FORGE project team has developed a set of FAQs
designed to address questions and concerns related to the Fallon site as a location for geothermal
research. A subset of the FAQs will be posted on the web site, and the complete set, included
below, is also available as a stand-alone document for distribution.
Table 2. Frequently Asked Questions for the Fallon FORGE project
What is FORGE? FORGE stands for Frontier Observatory for Research in Geothermal Energy. FORGE is a
U.S. Department of Energy (DOE) Office of Energy Efficiency and Renewable Energy
(EERE) Geothermal Technologies Office (GTO) program to investigate potential locations
for a national enhanced geothermal systems (EGS) field laboratory. The FORGE program
is divided into three phases. During Phase 1, five locations were chosen for continued
planning and development of a conceptual geologic model. Fallon is one of the five
sites. A down select will occur in Phase 2 in preparation for full site characterization of a
single FORGE site that will include required environmental reviews. Full implementation,
during Phase 3, will include testing and evaluation of innovative EGS technologies.
What are
Enhanced
Geothermal
Systems (EGS)?
Conventional geothermal systems are located in areas where high subsurface heat,
permeable rock, and underground fluid all naturally coexist. These three conditions
interact to create a natural underground heat exchanger that transfers heat from the
rock to the moving fluids, allowing recovery of the earth’s energy (by drilling wells and
producing hot water, steam, or both) to generate electricity. Nearly all geothermal
power produced worldwide is supplied by conventional geothermal reservoirs.
By contrast, EGS are hot, but with low permeability and a low fluid content. Once an
EGS heat source is located—typically in deep, hard rock—researchers drill deep wells
and hydraulically stimulate the underground rock to increase permeability, thus creating
a geothermal reservoir. Water injected into one or more wells passes through the zone
of enhanced permeability, picking up heat along the way, and is extracted in a
production well. After reaching the surface, the hot water and/or steam is used to
produce power in the same way as in conventional geothermal systems.
The practice of manipulating pre-existing fractures in the subsurface to enhance
permeability, key to EGS, is a subject of active research in the U.S. and other countries.
Who are the key
players?
With funding from the U.S. Department of Energy’s Geothermal Technologies Office
(GTO), the Fallon FORGE project has a team of geothermal experts led by Sandia
National Laboratories. The U.S. Navy, led by the Navy Geothermal Program Office, and
Ormat Nevada Inc. are key partners in the project because they own or lease the land
dedicated to the FORGE project and bring extensive geothermal experience to the team.
Both the Navy and Ormat have drilled wells in the area that demonstrate very favorable
conditions (temperature, depth, low-permeability rock) for advancing EGS technology.
The project team also includes representatives from Lawrence Berkeley National
Laboratory; University of Nevada–Reno; U.S. Geological Survey (Menlo Park, California);
GeothermEx/Schlumberger; and Itasca Consulting Group, Inc.

Fallon, NV, Communications and Outreach Plan | 9
Which
organization(s)
are funding this
project?
Funding for FORGE is provided by the U.S. Department of Energy’s Geothermal
Technologies Office.
What additional
costs, if any, will
fall outside
project funding?
The initial phase of the FORGE project is funded entirely by the U.S. Department of
Energy. Future phases will involve cost sharing. FORGE recipients and sub-recipients
who are domestic institutions of higher education, national laboratories, federal entities,
or domestic non-profit organizations are exempt from cost sharing.
What is the
relationship
between the
U.S. Navy and
the project?
Operations will take place on lands under the control of the U.S. Navy and Ormat Nevada
Inc. The Fallon FORGE team will guide the activities with the consent and participation
of the U.S. Navy, Ormat Nevada Inc., and the Bureau of Land Management (BLM).
What is the role
of the BLM?
BLM is responsible for permitting most geothermal activities on Federal lands, including
land owned by the U.S. Navy. However, the Navy will issue any permits required on
Fallon FORGE grounds not within BLM leases.
Is National
Environmental
Policy Act (NEPA)
compliance
required?
Yes, NEPA is required on all Department of Defense (DoD) installations. The 2011 Salt
Wells Environmental Impact Statement (EIS) that was completed for the FORGE area will
serve as the governing document for future geothermal activities on the NAS Fallon
FORGE property. Any additional NEPA requirements associated with FORGE can be
derived from the Salt Wells EIS.
Is drilling
anticipated as
part of the
project? If so,
where and how
deep?
In Phase 1, the project focuses on developing a conceptual geologic model and planning
the activities to occur in later phases. During Phase 2, detailed plans will be developed
for EGS experiments that will be conducted at the site. Permits for those activities will
be acquired, if needed. In Phases 2C and 3, it is anticipated that multiple deep wells will
be drilled at the site to depths ranging from 1,500 m to 2,000 m. Additional shallow
wells will be drilled for monitoring subsurface activities. The project will leverage data
from existing wells drilled within and near NAS Fallon by Ormat Nevada Inc. and the U.S.
Navy.
What types of
activities are
expected to occur
in Phase 3 of the
FORGE project?
Plans for EGS experiments and activities are still under development. Anticipated
activities include, but are not limited to, the following:
drilling new wells and characterizing the rock fabric and mineralogical composition in detail
conducting injection tests
conducting stimulations of existing and new wells and circulation tests between wells
using innovative well completion techniques that allow for manipulation of fractures in multiple zones within a single well
performing tracer testing using reactive and non-reactive tracers

Fallon, NV, Communications and Outreach Plan | 10
All work undertaken at the site is aimed at understanding how to manipulate the
fracture system in a way that enhances permeability while allowing sufficient fluid
residence time for heat exchange as the injected water travels through the system to the
production well, thus tapping the vast heat reserves in the area. All activities will be
closely monitored using a variety of sophisticated techniques, contributing to a thorough
understanding of initiating and controlling underground processes.
Are there similar
EGS experimental
sites elsewhere?
The Fallon FORGE site is 1 of 5 DOE-funded Phase 1 projects. Ultimately, DOE plans to
fund only a single FORGE project. The other Phase 1 FORGE projects are in Nevada,
Idaho, Utah, and Oregon. In addition to these projects, EGS is the subject of research
and development by various governments, including the United States and the European
Union. Dedicated EGS experimental sites have been implemented in the United States
(Fenton Hill, New Mexico), the UK (Rosemanowes, Cornwall), and the European Union
(Soultz-Sous Forêts, France). In addition, EGS experimentation has been undertaken at
several operating geothermal project sites in Nevada (Desert Peak, Bradys), Idaho (Raft
River) and California (Coso, The Geysers).
Where does the
name “Fallon”
come from? And
where exactly is
it?
Fallon, Nevada, a community of approximately 8,400 people about 62 miles east of
Reno, is the county seat of Churchill County. The city of Fallon lies approximately 7 miles
northwest of the proposed FORGE site. Fallon is home to the Naval Air Station (NAS), a
training station that has been the home of the U.S. Naval Strike and Air Warfare Center
including the TOPGUN training program since 1996. The city of Fallon, NAS Fallon, and
the nearby Reno metropolitan area each provide critical infrastructure and facilities that
will be useful for the FORGE project.
What makes the
proposed NAS
Fallon site a good
location for
FORGE?
NAS Fallon has all the required characteristics of a world-class EGS site, in terms of
depth, temperature, and low permeability. Previous drilling in the area, both on NAS
Fallon land and adjacent BLM land leased to Ormat Nevada Inc., has contributed
significantly to researchers’ knowledge of the subsurface. None of the wells drilled to
date have encountered good permeability in crystalline rock. All of the deeper wells
encountered high temperatures in the FORGE required range that are also
representative of temperature vs. depth conditions in much of the Great Basin. The site
has a willing landowner (the U.S. Navy) with a significant interest in developing new
sources of resilient power and a neighboring lease holder (Ormat Nevada Inc.) seeking to
realize value from its investment. The site has an existing seismic monitoring network
and a massive amount of hot granitic and metamorphic rock at a reasonably shallow
depth, which lowers overall costs of drilling and drilling-related activities. Further,
relatively high tectonic strain rates and investigated stress states in the area will
facilitate hydraulic fracturing of the rock. The site is accessible year-round, and the
Fallon FORGE team is closely coordinating with the U.S. Navy to ensure that the
important mission of Fallon NAS proceeds without interference from FORGE research
and development activities.
How much water
will this project
use?
Enhanced geothermal systems need water to operate effectively. The water
requirements for FORGE will be on the order of a few million gallons per stimulation, and
it is anticipated that up to 3 to 6 wells may be stimulated.

Fallon, NV, Communications and Outreach Plan | 11
Where will you
get the water you
need for this
project?
The primary source of water for stimulations and other activities will be the geothermal
fluid produced from Well 84-31, one of the wells already drilled by Ormat Nevada Inc.
This water is from a zone unrelated to shallower reservoirs used for drinking and
agriculture in the region.
Will injection of
fluids affect
seismic activity in
the area?
Fluid injection at the FORGE site will cause micro-earthquakes (also referred to as micro-
seismicity). Micro-seismicity is related to minor movements along small fractures
affected by injection and production activities. Although most micro-seismicity
associated with geothermal reservoirs is not felt at the surface, subsurface seismic
activity will be carefully monitored by a micro-seismic monitoring network. An Induced
Seismicity Mitigation Plan has been developed for the project, detailing mitigation and
communication strategies.
Will injection of
fluids increase the
risk of a
significant
earthquake?
Micro-seismicity associated with fluid removal and injection has been observed and
monitored for decades around several Nevada geothermal fields near Fallon. No
injection in or near these fields has been linked to significant earthquakes. Micro-
seismic data helps researchers understand subsurface processes and optimize resource
use, but micro-seismicity will not increase the risk of a potentially damaging earthquake
in Churchill County. As a result of detailed characterization of the subsurface, the FORGE
project is designed to avoid faults with the potential to produce damaging earthquakes.
How will the
project protect
local interests
during each
Phase?
Unimpeded by the FORGE project, local tribes will continue to access sacred sites,
namely the Grimes Point archeological site and Fallon Paiute-Shoshone Reservation and
Colony that lie approximately 6 miles to the north and northeast of the Fallon FORGE
site. The research project will attract some increased economic activity in the area,
particularly in the drilling and hospitality sectors. After completion of the FORGE project,
EGS development could have a positive impact on the area in two ways: (1) by
demonstrating a new source of clean power that can be replicated in other
communities; and (2) by providing the U.S. Navy with resilient power, ensuring that it
can continue its important mission at NAS Fallon.
How will you
protect cultural
sites in and
around the FORGE
project areas?
Because the FORGE team will use existing access roads and will build minimal
infrastructure (a few well pads, wells, and pipelines) in a well-surveyed area, cultural
sites will be respected. Any new developments will be planned in such a way as to
create no adverse effects or disturbance.
What happens to
the site at the end
of the 5-year
research project?
The infrastructure to be developed for the FORGE project is minimal, consisting of a few
well pads, wells, and pipelines, and may continue to be used for experiments,
geothermal production, or injection after the FORGE project is finished. If there is no use
for this infrastructure at the completion of the project, reclamation will be performed as
needed.
CONCLUSION
The Fallon FORGE project team is committed to supporting communications, education, and
outreach efforts to maintain sound operations and increase geothermal science and technology
literacy for the duration of the FORGE project.

1-H
APPENDIX H. STAKEHOLDER ENGAGEMENT STATUS UPDATE

STAKEHOLDER ENGAGEMENT
STATUS UPDATE
Fallon, NV

Fallon, NV, Stakeholder Engagement Status Update | 1
STAKEHOLDER ENGAGEMENT STATUS UPDATE
Fallon, NV
The Stakeholder Engagement Status Update complements the Fallon, NV, Communications and
Outreach Plan by detailing the FORGE Phase 1 activities undertaken by the Fallon team to
develop stakeholder relationships. The following three tables detail Media Relations
Engagement, One-on-One Engagement, and Meetings and Conferences, and are current as of
May 10, 2016. The Fallon team lead(s) and team participant(s) engaged with media outlets, met
individually with stakeholders, and attended meetings and conferences to improve
communications, educate stakeholders, form agreements, navigate legal requirements, and
ensure dissemination of accurate information about the FORGE project. The content of each
table is organized chronologically, starting with the most recent event.

Fallon, NV, Stakeholder Engagement Status Update | 2
Media relations activities, detailed in Table 1, included a radio interview, a published magazine article and blog posts, and a television appearance.
All events were intended primarily to educate stakeholders.
Table 1. Media Relations Engagement Status Update
Team Lead(s), Affiliation
Team Participant(s), Affiliation
Date Media Activity Location DetailsWeb link or title of published article or press release
Category of Status Update
James Faulds, University of Nevada–Reno (UNR)
Mar. 4, 2016
Gave interview for a press release or other published article.
Reno, NV David Stipech, General Manager of KUNR, public broadcasting radio station in Reno, Nevada. Radio interview with Dr. Kevin Carman, Provost, University of Nevada, Reno.
Title: “University research key to realizing Nevada's geothermal potential.”
http://kunr.org/post/university-research-key-realizing-nevadas-geothermal-potential#stream/0
Title: “University research key to realizing Nevada's geothermal potential.” KUNR, NPR, March 7, 2016.
Educating stakeholders
James Faulds, UNR
Wendy Calvin, UNR
Nov. 1, 2015
Gave interview for a press release or other published article. Briefed media relations, submitted content (images, text, data). Other: magazine article.
Reno, NV John Seelmeyer reporter, Fall 2015 issue of Nevada Silver and Blue Magazine, University of Nevada, Reno.
http://www.unr.edu/silverandblue/archive/2015/fall/NSB_Fall_2015_WEB.pdf
Title: “Forging Geothermal Resources through Research,” Nevada Silver & Blue, Fall 2015. Page 25.
Educating stakeholders
James Faulds, UNR
Aug. 21, 2015
Gave interview for a press release or other published article. Other: TV interview.
Reno, NV Shelby Sheehan, Reporter, News 4, KRNV TV station; a 2-minute TV interview discussing FORGE project and potential impacts on renewable energy.
N/A Educating stakeholders
James Faulds, UNR
Wendy Calvin, UNR
Aug. 5, 2015
Gave interview for a press release or other published article.
Reno, NV John Seelmeyer, Nevada Today, University of Nevada, Reno.
Article in Nevada Today describing the FORGE project at Fallon.
http://www.unr.edu/nevada-today/news/2015/forging-new-geothermal-resources-through-research
Title: “Forging New Geothermal Resources through Research.” Nevada Today, August 5, 2015.
Educating stakeholders

Fallon, NV, Stakeholder Engagement Status Update | 3
The Fallon team’s one-on-one stakeholder engagement, detailed in Table 2, focused primarily on meetings with congressional members and included
an opportunity to develop international partnerships.
Table 2. One-on-One Engagement Status Update
Team Lead(s), Affiliation
Team Participant(s), Affiliation
Date Who we met Audience Location Summary of Description Notable Mentions Category of Status Update
Doug Blankenship, Sandia National Laboratories (SNL)
Mack Kennedy, Lawrence Berkeley National Laboratory (LBNL) Erik Ridley, SNL Jenn Tang, LBNL
Apr. 19, 2016
Anne Clement, Legislative Assistant, Senator Barbara Boxer
Federal, state, and local governments and agencies
Washington, DC Provided an introduction and overview of the DOE FORGE effort. Provided overview and infographics of the Fallon, NV, site proposed by the Sandia-led team. Responded to questions, concerns, etc., regarding FORGE and the Fallon site.
Very supportive of FORGE and our team.
Other: Educating congressional leaders
Doug Blankenship, SNL
Mack Kennedy, LBNL Eric Ridley, SNL Jenn Tang, LBNL
Apr. 19, 2016
Rachel Carr, Legislative Fellow, Senator Dianne Feinstein
Federal, state, and local governments and agencies
Washington, DC Introduction and overview of the DOE FORGE effort. Presented introduction, overview and infographics describing the Fallon site proposed by the Sandia-led team. Answered questions and concerns regarding the Fallon site and FORGE.
The Senator is very interested in geothermal energy and supports the FORGE effort, particularly the site proposed by our team.
Other: Educating congressional leaders
Doug Blankenship, SNL
Mack Kennedy, LBNL Erik Ridley, SNL Jenn Tang, LBNL
Apr. 19, 2016
Tim Itnyre, Legislative Director, Congressman Paul Cook (R-CA)
Federal, state, and local governments and agencies
Washington, DC Introduction and overview of the DOE FORGE effort. Presented introduction, overview and infographics describing the Fallon site proposed by the Sandia team. Answered questions and concerns regarding the Fallon site and FORGE. Congressman Cook's district also includes several military institutions.
The Congressman is very supportive of the site. Expressed some concerns regarding water use. The concerns arise from expansion plans of geothermal production.
Other: Educating congressional leaders
Doug Blankenship, SNL
Mack Kennedy, LBNL Erik Ridley, SNL Jenn Tang, LBNL
Apr. 19, 2016
Jason Riederer, Legislative Director; Kyle Thomas, Legislative Assistant; Congressman Mark Amodei (R-NV)
Federal, state, and local governments and agencies
Washington, DC Introduction and overview of the DOE FORGE effort. Presented introduction, overview and infographics describing the Fallon site, with an emphasis on NAS Fallon, proposed by the Sandia-led team. Answered questions and concerns regarding the proposed sites and the FORGE effort. The congressman's district includes NAS Fallon.
Congressman Amodei is a strong proponent of geothermal energy, the DOE FORGE effort, and the proposed Fallon site.
Other: Educating congressional leaders

Fallon, NV, Stakeholder Engagement Status Update | 4
Team Lead(s), Affiliation
Team Participant(s), Affiliation
Date Who we met Audience Location Summary of Description Notable Mentions Category of Status Update
Doug Blankenship, SNL
Mack Kennedy, LBNL Erik Ridley, SNL Jenn Tang, LBNL
Apr. 19, 2016
Ryan Mulvenon, Senior Advisor, Senator Harry Reid
Federal, state, and local governments and agencies
Washington, DC Introduction and overview of the DOE FORGE effort. Presented introduction, overview and infographics describing the Fallon site proposed by the Sandia-led team. Answered questions and concerns regarding the proposed sites and the FORGE effort, with an emphasis on the Fallon site and progress to date on Phase 1 work.
Senator Reid is very interested in FORGE, particularly the Fallon site.
Other: Educating congressional leaders
Ann Robertson-Tait, GeothermEx/ Schlumberger
Kent Burton, Lobbyist, Geothermal Energy Association
Mar. 17, 2016
PA Ryan Mulvenon, Office of Senator Harry Reid (D-NV)
Federal, state, and local governments and agencies
Washington, DC We had met the previous day at a Congressional Briefing on geothermal set up by the Geothermal Energy Association (GEA) and the Environmental and Energy Study Institute (EESI). Mr. Mulvenon specifically asked about the FORGE projects while we waited for the briefing, and asserted that Fallon was the best of the five. Because Susan Petty from the Newberry FORGE team and Doug Glaspey from the INL FORGE team were present, I stated my agreement that Fallon was best, but acknowledged the representatives from two competing projects. We agreed to talk in his office the following day. After discussing the Investment Tax Credit issue, I presented the Fallon site’s main attributes in detail, responding to Mr. Mulvenon’s expression of great interest. I provided the 2-page project summary, and noted that although Fallon, NV, is clearly a superior site from the technical perspective, the ultimate site selection was certain to involve political issues.
Mr. Mulvenon reiterated Sen. Reid’s support for the Fallon site. Because he and Sen. Reid were instrumental in setting up the February 2015 meeting between Navy Command in Washington, DC, SW Regional Command, and NAS Fallon Command, which led to a clear understanding of the NAS Fallon mission and constraints on FORGE activities relative to that mission, I thanked him for those efforts.
Approaches and lessons learned in forming agreements, educating stakeholders

Fallon, NV, Stakeholder Engagement Status Update | 5
Team Lead(s), Affiliation
Team Participant(s), Affiliation
Date Who we met Audience Location Summary of Description Notable Mentions Category of Status Update
Ann Robertson-Tait, GeothermEx
Kent Burton, Lobbyist, Geothermal Energy Association
Mar. 17, 2016
Senator Dean Heller (R-NV); Jeremy Harrell, Energy Legislative Assistance
Federal, state, and local governments and agencies
Washington, DC Sen. Heller is a strong geothermal energy supporter and spoke at the GEA Geothermal Showcase directly after our meeting. After discussing the Investment Tax Credit issue, the discussion turned to FORGE and the Fallon site.
I presented the main attributes of Fallon, provided the 2-page project summary to Sen. Heller and Mr. Harrell, and noted that although Fallon is clearly a superior site from the technical perspective, the decision on which site would be chosen was certain to involve political issues. Sen. Heller thanked me for bringing this to his attention.
Approaches and lessons learned in forming agreements, educating stakeholders
Ann Robertson-Tait, GeothermEx
Kent Burton, Lobbyist, Geothermal Energy Association
Mar. 16, 2016
Rep. Mark Amodei (R-NV) District 2
Federal, state, and local governments and agencies
Washington, DC Met with Rep. Amodei who immediately expressed his gratitude to be talking to geothermal people about a subject he is genuinely interested in. Presented our 2-page summary of the Fallon FORGE site, and presented a verbal summary of why Fallon is a compelling and attractive site for FORGE. Talking points included: specifics about site characteristics (including access to data); the national importance of and steps toward diversifying energy supply, and leading the world in geothermal energy development; and hosting a world-class research project (that will be able to use existing technology adapted from oil and gas development), water resources, and job creation.
Rep. Amodei is a strong supporter of the project and appreciates why Fallon is a worthy choice for a world-class research project.
Approaches and lessons learned in forming agreements, educating stakeholders
James Faulds, University of Nevada–Reno
Mar. 16, 2016
Ryan Mulvenon on staff of Senator Harry Reid (NV)
Federal, state, and local governments and agencies
Washington, DC Presented update on the Fallon site and the FORGE effort. Reviewed DOE criteria and site suitability. The Fallon site was discussed in great detail.
Educating stakeholders

Fallon, NV, Stakeholder Engagement Status Update | 6
Team Lead(s), Affiliation
Team Participant(s), Affiliation
Date Who we met Audience Location Summary of Description Notable Mentions Category of Status Update
Mack Kennedy, LBNL
Pat Dobson, LBNL Feb. 29, 2016
Hiroshi Asanuma, Geothermal Team Leader, Fukushima Renewable Energy Research Institute (FREA), National Institute of Advanced Industrial Science and Technology (AIST), Japan
Public research institutions, international partners
Berkeley, CA Presented an update on the status of the DOE FORGE site selection process and an overview of the Fallon site. Asanuma presented an overview of FREA/AIST's plan for EGS research and their commitment to partnering with DOE. Specifics of the meeting regarding research interests, financials, etc., were marked confidential.
Other: Develop international partnerships

Fallon, NV, Stakeholder Engagement Status Update | 7
During Phase 1, Fallon team members presented two published papers at several key scientific conferences, spoke with an education center about
forming partnerships to establish programs for outreach and education, and supported STEM education, as summarized in Table 3, below.
Additional engagement with key stakeholders included: providing project status and overviews; answering questions; organizing on-site visits; and
meeting with the general public, industry partners, and governmental and military agencies.
Table 3. Meetings and Conferences Engagement Status Update
Team Lead(s), Affiliation
Team Participant(s), Affiliation
Date(s) Name of Meeting or Conference
Audience Location
Title of Presentation, Discussion, etc.
Summary of Presentation, Discussions, etc.
Notable mentions Category of Status Update
Jim Faulds, University of Nevada–Reno (UNR)
John Akerley, Ormat; Andy Tiedeman, Navy Geothermal Program Office (GPO)
Apr. 18, 2016
Update on Fallon FORGE project for Governor's Energy Office for state of Nevada
Federal, state, and local governments and agencies
Carson City, NV
Update on the Fallon FORGE project
Informal presentation using handouts and posters describing the status of the project to three staff members of the Governor's Energy office. After a brief presentation, took questions on the project ranging how geothermal systems work to the potential economic impacts of FORGE on the community.
Educating stakeholders
Mack Kennedy, Lawrence Berkeley National Laboratory (LBNL)
Drew Siler, LBNL Apr. 14, 2016
Meeting with Lawrence Hall of Science to discuss educational outreach collaboration for FORGE
Federal, state, and local governments and agencies, students and educators
Berkeley, CA N/A Presentation of FORGE concept, Fallon site, and discussion of Lawrence Hall of Science's expertise and interest in collaboration.
Lawrence Hall of Science attendees: Craig Strang, Associate Director of the Lawrence Hall of Science, Director of Leadership in Science Teaching; Catherine Halverson, Co-Director of MARE, Director of Communicating Ocean Science, Director of Promoting Climate Literacy; Emily Weiss, Director of PRACTISE; Jedda Foreman, Project Manager, BEETLES Project
Other: Potential educational outreach meeting

Fallon, NV, Stakeholder Engagement Status Update | 8
Team Lead(s), Affiliation
Team Participant(s), Affiliation
Date(s) Name of Meeting or Conference
Audience Location
Title of Presentation, Discussion, etc.
Summary of Presentation, Discussions, etc.
Notable mentions Category of Status Update
Jim Faulds, UNR
John Akerley, Greg Rhodes, Ormat Nevada Inc.; Andy Tiedeman, Navy GPO
Apr. 12, 2016
Meeting with Bureau of Land Management (Lorenzo Trimble) to provide update on FORGE project
Federal, state, and local governments and agencies
Ormat offices in Reno, NV
Update of Fallon FORGE project
Presented update of Fallon site and FORGE, including results of Phase 1 and possible activities in a potential Phase 2. This led to discussion of land status and permitting time frames and procedures.
BLM expressed their willingness for continued cooperation on the project and suggested that we provide another update in 3-4 months.
Lessons learned in forming agreements, educating stakeholders, and navigating legal requirements
Ann Robertson-Tait, GeothermEx
Mar. 17, 2016
Geothermal Energy Association US and International Geothermal Showcase
Government agencies (domestic and international), geothermal developers, students
Washington, DC
Creating New Geothermal Opportunity in High Temperature, Low Permeability Rock Formations: Making a Case for EGS
Geographic limitations of conventional hydrothermal resources, EGS overview (part of the continuum of geothermal resources, estimates of worldwide power generation potential), summary of active EGS projects in the US, how the SNL/LBNL team decided to choose Fallon as a candidate FORGE site, importance of resilient energy for US DoD
Educating stakeholders
Nick Hinz, UNR James Faulds, Brett Tobin, and Wendy Calvin, UNR; Drew Siler and Mack Kennedy, LBNL; Kelly Blake, Andy Tiedemen, and Andy Sabin, Navy GPO; Doug Blankenship, SNL; Greg Rhodes and Josh Nordquist, Ormat Nevada Inc.; Steve Hickman, Jonathan Glen, and Colin Williams, USGS; Ann Robertson-Tait, GeothermEx
Feb. 22-24, 2016
41st Workshop on Geothermal Reservoir Engineering (Stanford Geothermal Workshop)
Private research institution, public research institutions, Federal, state, and local governments and agencies, students and educators
Stanford University, Stanford, CA
Stratigraphic and structural framework of the proposed Fallon FORGE site
Described stratigraphic and structural characteristics of the Fallon site, including well, temperature, geophysical data, etc. Discussed how site fits all parameters of FORGE, as defined by DOE.
Hinz et al. (2016) Stratigraphic and structural framework of the proposed Fallon FORGE site, Proceedings, 41st Workshop on Geothermal Reservoir Engineering. Stanford University, SGP-TR-209. 12 p.
Presented a paper. Educating stakeholders

Fallon, NV, Stakeholder Engagement Status Update | 9
Team Lead(s), Affiliation
Team Participant(s), Affiliation
Date(s) Name of Meeting or Conference
Audience Location
Title of Presentation, Discussion, etc.
Summary of Presentation, Discussions, etc.
Notable mentions Category of Status Update
James Faulds, UNR Feb. 2, 2016
Monthly meeting of the Truckee Meadows Parks Foundation
General public
Reno, NV Living on the Edge in Western Nevada: Our Rapidly Evolving Geologic Setting
Presented overview of Nevada's geologic setting as part of the Pacific-North American plate boundary and how this setting endows the region in natural resources, such as geothermal energy. Briefly discussed conventional and EGS geothermal systems, including FORGE activities at the Fallon site.
Over 250 people in attendance. Talk was very well received with many questions from the public on geothermal energy.
Educating stakeholders
James Faulds, UNR Jan. 7, 2016
Monthly meeting of the Nevada Petroleum and Geothermal Society
Broad range of geoscientists from industry, academia, and state-federal agencies
Reno, NV Geologic setting of the proposed Fallon FORGE site, Nevada: Suitability for geothermal (EGS) research & development
Provided an overview of FORGE and described the geologic setting and overall suitability of the Fallon site. Approximately 60 people were in attendance.
Educating stakeholders
Maryann Villavert, LBNL
Mack Kennedy and Ernie Majer, LBNL
Dec. 14-18, 2015
American Geophysical Union Fall Meeting 2015, December 14-18
Private research institution, public research institutions, international partners, students and educators
San Francisco, CA
Earth and Environmental Sciences Area, Exhibitor Booth
LBNL EESA presented several research topics and activities in the form of Meet-a-Scientist, informal presentations, videos, handouts, and social media twitter chats. Prospective postdocs, students, faculty, industry personnel visited the booth to learn more about LBNL, EESA, and research opportunities. FORGE Q & A included opportunities for future internships, postdoc appointments, and collaborations with faculty and industry.
Interested individuals were curious about when FORGE would start.
Educating stakeholders

Fallon, NV, Stakeholder Engagement Status Update | 10
Team Lead(s), Affiliation
Team Participant(s), Affiliation
Date(s) Name of Meeting or Conference
Audience Location
Title of Presentation, Discussion, etc.
Summary of Presentation, Discussions, etc.
Notable mentions Category of Status Update
James Faulds, UNR Doug Blankenship, SNL; Nicholas Hinz and Wendy Calvin, UNR; Andrew Sabin, Navy GPO; Josh Nordquist and Peter Drakos, Ormat Nevada Inc.; Mack Kennedy and Drew Siler, LBNL; Ann Robertson-Tait, GeothermEx; Stephen Hickman, Jonathan Glen, Colin Williams, USGS
Sep. 20-23, 2015
39th Geothermal Resources Council Annual Meeting and Geothermal Energy Association Expo
Private research institution, public research institutions, Federal, state, and local governments and agencies, students and educators
Reno, NV Geologic Setting of the Proposed Fallon FORGE Site, Nevada: Suitability for EGS Research and Development
Presented overview of the stratigraphic and structural framework of the Fallon site, describing how the site meets DOE qualifications for FORGE.
Faulds et al. (2015) Geologic Setting of the Proposed Fallon Forge Site, Nevada: Suitability for EGS Research and Development. GRC Transactions, Vol. 39, 293-301.
Presented a paper. Educating stakeholders
James Faulds, UNR Sep. 15, 2015
Congressional briefing on geothermal energy: Energy-Water-Land Connections Briefing Series
Federal, state, and local governments and agencies
Washington, DC
Geothermal Systems: Geologic Origins of a Vast Energy Resource
Described the origins and locations of geothermal energy, conventional geothermal systems, and EGS, as well as challenges and opportunities for the geothermal industry. Described the FORGE effort in general and the Fallon site as an example. Served as panelist answering questions about geothermal energy.
Educating stakeholders
Douglas Blankenship, SNL
Josh Nordquist, Ormat Nevada Inc.
Aug. 25, 2015
Clean Energy Project - Nevada's Innovation System: Accelerating Clean Energy Economic Development
Other: Stakeholders interested in Nevada energy issues
Las Vegas, NV
Panel discussion
This event was held by the State of Nevada and the U.S. Department of Energy in association with the Clean Energy Project event in Las Vegas, NV. Requested by the State of Nevada to be part of a roundtable discussion about new opportunities. Other panel members were DOE personnel, including Trak Shah, Matt Nelson, Mark McCall and Jetta Wong. While the program was focused on Nevada, held discussions about the broader FORGE effort as well as the Fallon site.
Educating stakeholders

Fallon, NV, Stakeholder Engagement Status Update | 11
Team Lead(s), Affiliation
Team Participant(s), Affiliation
Date(s) Name of Meeting or Conference
Audience Location
Title of Presentation, Discussion, etc.
Summary of Presentation, Discussions, etc.
Notable mentions Category of Status Update
Douglas Blankenship, SNL
Jun. 12, 2015
U.S. Senate & House Renewable Energy and Energy Efficiency Caucus FORGE Briefing
Other: Congressional staffers and others
Washington, DC
The DOE Frontier Observatory for Research in Geothermal Energy: Candidate Sites at Fallon, NV and Coso, CA
Presentation included an overview of the Fallon site and FORGE project. Congressional Caucus presentation.
Educating stakeholders
Andy Sabin, Navy GPO
Doug Blankenship, SNL; Mack Kennedy, LBNL; Jim Faulds, UNR; Ann Robertson-Tait, GeothermEx; A. Tiedeman, Navy GPO; M. Lazaro, Navy GPO
Mar. 12, 2015
Internal Fallon discussion
Other: Navy military leadership, internal meeting
Naval Air Station Fallon, Fallon, NV
Discussed efficacy of FORGE and Fallon mission—it was agreed at this meeting that FORGE should move ahead.
In attendance with the Fallon team were Sen. Harry Reid's office, Navy's CNIN, and NAVFAC leadership
Educating stakeholders

1-I
APPENDIX I. SAMPLE AND CORE CURATION PLAN

SAMPLE AND CORE CURATION
PLAN
Fallon, NV

Fallon, NV, Sample and Core Curation Plan | 1
SAMPLE AND CORE CURATION PLAN
Fallon, NV
PURPOSE
The Sample and Core Curation Plan establishes procedures and guidelines for the preservation of
core, cuttings, and fluid samples obtained during Fallon, NV, FORGE activities, and distribution
of sample data and physical samples to investigators requiring access to these materials.
SITE SAMPLE ACQUISITION AND HANDLING
Drilled holes supporting the Fallon FORGE effort will involve sample acquisition of one form or
another. The general plans for the acquisition and handling of core, cutting and fluids are
provided below. FORGE is a significant endeavor and the process for acquiring and handling
physical samples will require integration with the sampling systems, activity-specific ES&H
requirements, and the requirements of potential principal investigators engaged in sample
acquisition. Thus the plan is general in nature and recognizes that detailed procedures for sample
acquisition and handling will be needed as site activities evolve. Dedicated on-site space will be
established for the handling, and preliminary examination of the collected samples. We expect
to be able to create a digital on-line archive of image data similar to the SAFOD core viewer
(http://coreviewer.earthscope.org/) or the Australian National Virtual Core Library
(http://nvcl.csiro.au/).
DRILL CUTTINGS
During rotary drilling operations, cuttings will be collected, described, and logged on a 24-hour
basis. The primary responsibility for this activity lies with the contracted mud logging company,
but the Fallon FORGE site geologist(s) will supervise the work. Cuttings collection intervals
may vary depending on the depth of the hole, penetration rate, lithological contacts, and the
requirements of specific principal investigators, but generally will be collected at a maximum of
10 ft. intervals unless otherwise authorized by the Fallon FORGE project management. At each
collection interval, cuttings will be collected off the shale shaker onto a collection board or
trough to ensure a representative sample is obtained. Following sample collection, the collection
board or tough will be cleaned to gather cuttings representing the next interval. The samples will
be gently washed, screened, dried and bagged with markings indicating the well name, depth,
and time of collection. Because it takes a measurable or calculable amount of time for the
collected sample to move from the bottom of the hole to the surface, the recorded depth shall
reflect this lag time.
Cuttings will be examined in near real-time. Field microscopes will be equipped to allow digital
photographs of the examined cuttings. A field log describing lithology, mineral assemblages and
crystallinity, texture, alteration, fracture, vein, or fault locations, will be maintained during the
course of drilling and the findings will be posted daily to the FORGE node on the NDGS. Once
examined, the cuttings will be preserved and logged into a permanently retained sample log.
Samples will be stored temporarily on site until immediate access is no longer required. At that

FFallon, NV, Sample and Core Curation Plan | 2
time the samples will be moved to temporary storage at a near-site warehouse location for the
duration of the Fallon FORGE effort. Following the completion of project activities at Fallon
FORGE, the samples will be moved to the USGS Core Research Center (CRC) in Denver, CO,
or to the Nevada Bureau of Mines and Geology (NBMG) Great Basin Science Sample and
Records Library (GBSSRL) in Reno, NV, for preservation and permanent storage.
DRILLED CORE
The drilling, testing, and examination of core, whether from sidewall samples, spot coring
operations, or from continuous wireline coring will be an integral part of the Fallon FORGE
development effort.
Depending on the drilling conditions and PI-specific sampling requirements, the core will be
obtained using either triple-tube or double-tube systems. For triple-tube systems the core is
retained within a thin walled aluminum or polymeric inner-tube assembly that encases the core
following removal from the coring assembly. Double-tube systems allow the core to enter a
free- floating inner barrel assembly but do not encase the core in a removable liner. In collecting
core samples, a trained site geologist will work alongside the rig crew during the core extraction
process to ensure the core is handled appropriately. For triple tube systems the core and liner (or
core for double tube systems) should be laid out in a single tray on the catwalk or similar
structure and wiped down. The entire length of the liner or core will be marked in the standard
red-black parallel line method where the red line is to the right of the black line when looking up
the hole.
Any core not in a liner it should be carefully aligned and cleaned to allow the application of the
red-black markings before moving the core from the catwalk. For core contained in liners, the
liner/core will need to be cut in 3-foot lengths to fit in standard core boxes; likewise, it may be
necessary to cut the core on the catwalk to fit in standard 3-foot core boxes. The core will then
be transported to an on-site logging trailer for final cleaning with water and inspection. If the
core is contained in a liner, the core must be pushed out of the liner or the liner split to allow
access to the core. When the liner-housed core is laid out in the trailer, the core should be
carefully aligned and marked with the red-black line code if the liner were removed. Integer
depths will be marked along the core and a detailed field log of the core will be completed for
the subject section of core.
We expect to use a multi-sensor core logger (e.g. Geotek MSCL-S) to document properties such
as P-wave velocity, gamma density, magnetic susceptibility, electrical resistivity, color imaging,
X-ray fluorescence, and natural gamma spectrometry. This is similar to what the International
Continental Scientific Drilling Program (ICDP) makes available to their user community.
Additionally, new high resolution core infrared spectroscopy may be acquired to document
mineralogy and alteration. The core will then be wrapped in cling-type plastic wrap and placed
in appropriately marked core boxes. Core descriptions and associated photographs will be
uploaded to the dedicated FORGE node and be available through the National Geothermal Data
System (NGDS). Core will temporarily be stored on site until immediate access is no longer
required. Samples will then be moved to temporary storage at near-site warehouse space for the
duration of the FORGE project effort. Following the completion of Fallon FORGE project
activities, the samples will be moved to the USGS CRC or to the NBMG GBSSRL for
preservation and permanent storage.

Fallon, NV, Sample and Core Curation Plan | 3
Limited sidewall core samples may be obtained to support specific PI-related activities but will
not likely be a large part of the drilling operations at the Fallon FORGE site, given the planned
direct coring operations. However, in the event sidewall cores are taken, the core will be
received from the service company by a Fallon FORGE site geologist. The core will be
identified and preserved in a manner consistent with that used to preserve drilled core samples.
FLUID SAMPLES
Fluid samples used for testing during Fallon FORGE development and operation may be
obtained through drill-stem testing through targeted sections of the drilled wells, downhole fluid
sampling efforts, during flow/circulation testing, or other methods. As part of the site
characterization, monitoring, and R&D conducted by the SMT, each fluid sample will be
collected in quadrature. For each sample, one component will be analyzed as soon as possible
after collection at an on-site laboratory managed by the SMT for pH, total alkalinity, dissolved
silica, and so on. A second component will be sent to a commercial laboratory for major and
minor cation and anion analyses, and non-condensable gas analyses. A third component will be
sent to a reputable laboratory for stable isotopes analysis (e.g., δ18
O and δ2H). A fourth
component will be archived for any further analyses that may be required and/or requested. The
resulting data for all components of each fluid sample will be uploaded to the NGDS through the
FORGE node. As with the core, the fourth component of each fluid sample will be stored on-site
initially and later at a nearby warehouse facility for the duration of the project and then
discarded, in accordance with EH&S protocols. Because non-condensable gas samples are
difficult to preserve, only liquid samples will be archived. Fluid sampling, handling (e.g.
filtering, acidification), and preservation will follow conventional procedures developed for
geothermal systems.
If additional samples are requested for DOE-funded R&D projects, collaboration with
international partners and private sector researchers (for example, for geochemical tracer studies
during stimulation and flow testing), the SMT will provide logistical support for fluid sampling.
Sample collection, handling and preservation will be the responsibility of the project leads. The
SMT managed on-site laboratory will be made available, if requested by the project leads. All
data acquired by these projects will be uploaded to the NGDS through the FORGE node
following the Data Dissemination protocols.
SAMPLE DISSEMINATION
Data collected during the course of the Fallon FORGE effort will be openly available to
scientific and engineering community. As described in the data dissemination plan, well data
will be available in as close to real-time as practicable. These site derived data will be posted
and will also include the raw notes and log sheets from the site geoscientists for the subject
samples. The distribution of data through an open data system, as described in the data
dissemination plan, is organizationally less complex than the process of distributing physical
samples to the scientific and engineering community. Following the lead of the NSF sponsored
SAFOD (San Andreas Fault Observatory at Depth) program, protocols will be put in place for
physical sample distribution associated with the DOE FORGE program.
During the Fallon FORGE project, all samples will remain the property of DOE and will be
stored short-term at the Fallon FORGE site and longer-term (through the course of the project) at

Fallon, NV, Sample and Core Curation Plan | 4
warehouse space near the FORGE facility. After the cessation of site activities, the core will be
archived and preserved at the USGS CRC or the NBMG GBSSRL. The distribution processes of
Fallon FORGE samples to the science and engineering community is described below:
SAMPLE DISTRIBUTION DURING FORGE OPERATIONS
A Fallon FORGE Sample Committee (FSC) will be nominated by the FORGE Site Management
Team (SMT) in conjunction with the Science and Technology Analysis Team (STAT) and
approved by the DOE Geothermal Technologies Office. The members of the FSC will not
otherwise be involved in R&D projects being funded through the FORGE initiative. Samples
will be made to any qualified investigator, but researchers being funded through the R&D
portion of FORGE will be given priority. Requests for samples will be provided to the FORGE
Data Manager, who is a separate member of the SMT/STAT teams; the data manager will
forward the requests to the FSC for regularly scheduled reviews. The review cycle for proposals
will be determined by DOE program needs, occurring regularly enough to accommodate DOE
research requirements.
The FORGE project will provide a request form to be submitted by all researchers requesting
samples. Requests will contain a description of the requested samples and the proposed studies
for which the samples are required. Requesters will provide a description of the procedures and
objective of the study, the names and affiliations of collaborators, the name of the funding
agency, and the agency’s point of contact. In the proposal, the requester will attest that data
derived from the supplied samples will be uploaded to the FORGE node on the NGDS. The
application will specify when the samples will be returned to the USGS CRC unless
circumstances, as described in the proposal, merit the complete destruction of the sample (in
which case a sample split or slab will be retained).
Because the FSC’s primary charge is to maximize the return from the available FORGE samples,
the FSC will recommend to DOE how the samples should be used and who should receive which
samples. Once DOE approval is obtained, the Fallon FORGE Data Manager will distribute the
samples to the subject investigators. This process is applicable for all core, cuttings, and fluid
samples. A digital on-line image archive will be established to assist investigators in selecting
core or cutting sections for analysis.
SAMPLE DISTRIBUTION AFTER FORGE OPERATIONS
Following the cessation of FORGE site operations, all dry samples will be shipped to the USGS
CRC or the NBMG GBSSRL. The CRC/GBSSRL will accept these samples either as donated
material or DOE-owned material. DOE can retain the option to maintain control of the samples
and distribution to researchers, but after the project has ended, there will be recurring costs to
maintain the functions of the FSC and associated support from the USGS CRC/GBSSRL. If
DOE opts to retain ownership, the process for obtaining and distributing samples is the same as
that during Fallon FORGE operations. Once the CRC/GBSSRL assumes ownership (which can
occur at any time after the receipt of samples), there are no further costs to DOE. The USGS
CRC, a national repository for core and cuttings, will preserve and maintain the samples in
perpetuity and allow all interested researches access. Once its ownership begins, CRC will
control sample distribution following its own protocol. CRC and GBSSRL allow access to all
interested parties and allow samples to be obtained for testing. Given its preservation mission,

Fallon, NV, Sample and Core Curation Plan | 5
however, CRC does not allow for whole sections of core to be removed; they do allow (and
provide the service) for sub-cores, slabs, and cutting splits.
Fluid samples will not be stored after the cessation of Fallon FORGE activities unless DOE
chooses to maintain a facility to provide the climate controlled environment needed to store such
samples.

1-J
APPENDIX J. PRELIMINARY INDUCED SEISMICITY MITIGATION PLAN

PRELIMINARY INDUCED SEISMICITY
MITIGATION PLAN
Fallon, NV

Fallon, NV, Preliminary Induced Seismicity Mitigation Plan | i
CONTENTS
1 Introduction ......................................................................................................................................... 1
1.1 Purpose and Scope ........................................................................................................... 1
1.2 Fallon Site Overview ........................................................................................................ 1
2 Preliminary Screening Evaluation (Protocol Step 1) ....................................................................... 3
2.1 Historical Natural Seismicity in the Fallon Area ............................................................. 3
2.2 Faulting in the Fallon FORGE Area ................................................................................ 6
2.3 State of Stress ................................................................................................................... 7
2.4 Assessment of the Magnitude of Potential Induced Micro-Seismicity ............................ 9
2.5 Review of Laws and Regulations ................................................................................... 10
2.5.1 Geothermal Steam Act of 1970 and Regulations Promulgated Thereunder ........... 10
2.5.2 Safe Water Drinking Act UIC Program .................................................................. 10
2.5.3 State Law Regulating Geothermal Operations ....................................................... 11
2.5.4 State Tort Law......................................................................................................... 11
3 Communication and Outreach Plan (Protocol Step 2) .................................................................. 11
3.1 Identification of Emergency Response Providers and Stakeholders .............................. 12
3.2 Daily Communications Plan .......................................................................................... 12
3.3 Fallon FORGE Phase 2 Outreach Plan .......................................................................... 12
4 Criteria for Ground Vibration and Noise (Protocol Step 3) ......................................................... 13
4.1 Introduction .................................................................................................................... 13
4.2 Preliminary Analysis of the Impacts of Micro-Seismicity at the Fallon FORGE Project
13
4.3 Further Work in Phase 2................................................................................................. 14
5 Establish a Micro-Seismic Monitoring Network (Protocol Step 4) .............................................. 14
5.1 Progress and Future Plans for the NAS Fallon Seismic Array ...................................... 14
5.2 Example: Brady’s Hot Springs Seismic Monitoring Array ........................................... 15
Fallon, NV, Preliminary Induced Seismicity Mitigation Plan | ii
6 Quantify Hazard From Natural and Induced Seismic Events (Protocol Step 5) ........................ 16
6.1 Lessons Learned From Similar EGS Projects in Nevada ............................................... 16
6.2 Phase 2 Hazard Assessment Plans at the Fallon FORGE Project .................................. 21
7 Characterization of the Risk From Induced Seismic Events (Protocol Step 6) ........................... 21
7.1 Probability of Affecting Nearby Communities .............................................................. 21
7.2 Possible Effects at NAS Fallon ...................................................................................... 22
8 Risk Mitigation (Protocol Step 7) .................................................................................................... 22
9 Conclusion ......................................................................................................................................... 23
10 References .......................................................................................................................................... 24

Fallon, NV, Preliminary Induced Seismicity Mitigation Plan | 1
PRELIMINARY INDUCED SEISMICITY MITIGATION PLAN
Fallon, NV
1 INTRODUCTION
1.1 PURPOSE AND SCOPE
There are two main purposes of monitoring and analyzing seismicity in Enhanced Geothermal
Systems (EGS) projects: (1) assessing the hazard and risk associated with induced seismicity;
and (2) using and applying seismic data to understand the dynamic response of the subsurface at
the FORGE site. As described in this preliminary Induced Seismicity Mitigation Plan (ISMP),
the overall approach at the NAS Fallon FORGE site is to provide sufficient analyses and
monitoring to serve both purposes. This preliminary ISMP—which will be updated in Phase 2 of
FORGE—presents our approach to assessing the risk and hazard associated with induced
seismicity that may occur in response to EGS activities at Fallon, and how seismic monitoring
provides data for EGS reservoir assessment.
As stated in the FORGE Funding Opportunity Announcement (FOA), the Fallon FORGE project
will follow the guidelines created by the U.S. Department of Energy (DOE), including:
1. The enhanced version of the Protocol for Induced Seismicity Associated with Geothermal
Systems (Majer et al., 2012), hereinafter, the Protocol.
2. The latest version of the Best Practices for Induced Seismicity (Majer et al., 2014),
hereinafter, the Best Practices.
Both of these documents build upon an earlier document that laid out an initial strategy for
evaluating, monitoring and managing induced seismicity (Majer et al., 2008).
The seven steps in the Protocol are:
Step 1: Perform preliminary screening evaluation
Step 2: Implement an outreach and communication program
Step 3: Identify criteria for ground vibration and noise
Step 4: Establish seismic monitoring
Step 5: Quantify the hazard from natural and induced seismic events
Step 6: Characterize the risk from induced seismic events
Step 7: Develop risk-based mitigation plans
The plan presented herein is a description of the approach we will use to address each step in the
Induced Seismicity Protocol. In Phase 2 of the FORGE project, a more detailed protocol will be
developed based on additional site characterization and development of detailed plans for R&D
activities to be conducted at the site.
1.2 FALLON SITE OVERVIEW
As shown in Figure 1, the Fallon FORGE EGS project will be carried out on land controlled by
Ormat Nevada Inc. (Ormat) and the U.S. Navy at the Fallon Naval Air Station (NAS Fallon).
Together with several other participants and stakeholders, Sandia National Laboratory is leading

Fallon, NV, Preliminary Induced Seismicity Mitigation Plan | 2
the Fallon FORGE EGS project. Currently in Phase 1—a stage of initial site characterization,
planning and outreach—the Fallon FORGE EGS project will be one of 5 projects to be evaluated
for advancement to Phase 2.
Figure 1. Map of NAS Fallon showing existing wells and the Fallon FORGE site (bright green area)
The Fallon FORGE project area is located in western Nevada, approximately 12 km southeast of
the Fallon city center, in the southeastern portion of a large inter-montane basin known as the
Carson Sink (Figure 2). Several conventional hydrothermal geothermal projects are operating in
and around the Carson Sink, including Desert Peak, Brady’s Hot Springs, Stillwater, Soda Lake
and Salt Wells. These geothermal fields lie within the Humboldt structural zone, a region of
high heat flow that is characterized by ENE- to NNE-striking fault zones that bound or pass
through mountain ranges and valleys. The major fault system closest to the Fallon FORGE
project area is the Rainbow Mountain Fault Zone, located approximately 13 km east of NAS
Fallon and 20-40 km SW of the Dixie Valley/Fairview Peak fault system, which is located on the
eastern side of the Stillwater Range (see Figure 2).

Fallon, NV, Preliminary Induced Seismicity Mitigation Plan | 3
Figure 2. Geothermal fields within the Carson Sink and approximate location of NAS Fallon, the Rainbow Mountain Fault Zone (2), and the Dixie Valley/Fairview Peak fault system.
The following sections of this preliminary ISMP discuss the progress made to date on the various
steps of the Protocol and the plans for completing the ISMP in Phase 2 of FORGE.
2 PRELIMINARY SCREENING EVALUATION (PROTOCOL STEP 1)
2.1 HISTORICAL NATURAL SEISMICITY IN THE FALLON AREA
As shown in Figure 3, below, historical natural seismicity in the region around the proposed
FORGE area is relatively low; regional seismicity from the Advanced National Seismic System
(ANSS) database since 1916 appears to be primarily associated with the Rainbow Mountain
Fault Zone, which is the closest major fault system to the Fallon FORGE area. The Richter
magnitude (ML) range of the seismic events that have occurred in the area range from 0.0 to 6.8.
Larger events are associated mostly with the Rainbow Mountain Fault Zone (east of the NAS
Fallon seismic array) and the faults that bound the Stillwater Range (further to the east).

Fallon, NV, Preliminary Induced Seismicity Mitigation Plan | 4
Figure 3. Earthquakes from 1916 to the present (green dots) around the Fallon FORGE site. Data are taken from the ANSS catalogue, which includes data collected by the Nevada Seismological Laboratory at UNR.
NAS Fallon is located near the red triangles (locations of the NAS Fallon seismic monitoring stations.
The U.S. Navy Geothermal Program Office (GPO) installed a local seismic monitoring array at
Fallon (see Figure 4, below) in 2004, prior to the possible development of a geothermal resource
at the southeast corner of the main side of the base, and began monitoring background
seismicity. The network consists of ten 3-component, 4.5 Hz short-period downhole sensors
which cover roughly a 10 by 10 km area around the southeast corner of NAS Fallon (Figure 4).
All sensors are installed in dedicated wells that are about 200 feet (60 m) deep. Each station uses
a Nanometrics Triden/Janus system to record and then transmit data to a central site where they
are then forwarded to ports of RM-4 Bridge multiplexers. The RM-4 converts serial data into
UDP IP packets and places them on an acquisition computer, which runs NaqsServer network
data acquisition software. Data were recorded periodically by the network from 2004 to 2008, in
2011, and then from 2014 through the present.

Fallon, NV, Preliminary Induced Seismicity Mitigation Plan | 5
Figure 4. Locations of the seismic monitoring stations (yellow circles) installed by the GPO at NAS Fallon, in and around the proposed FORGE site (bright green area).
Although the goal was to record seismic activity in the southeast part of NAS Fallon, most or all
of the recorded events are located well beyond the outline of the array. The far field locations
result in lower accuracy compared to event locations within and/or closer to the array.
The lack of permeability within the deep resource (as demonstrated in several deep wells drilled
in and near NAS Fallon) precluded conventional geothermal development at NAS Fallon; this
led to its selection as a candidate FORGE site. In 2015, it was determined that the sensor
threshold was set too high to record micro-seismic events; therefore, the threshold was lowered
to the appropriate level to detect smaller events typically associated with geothermal production
and injection. This work was undertaken using internal GPO funds. Subsequently, 134 events
were recorded through the middle of January 2016. Once again, nearly all of these were regional
events; as shown in Figure 5 below, only three events were identified as occurring in the area in
and immediately around NAS Fallon. In combination with the ANSS data presented above, the

Fallon, NV, Preliminary Induced Seismicity Mitigation Plan | 6
data from the NAS Fallon network indicate that the FORGE area is characterized by a low level
of natural seismicity activity.
Figure 5. Seismicity recorded between July 2015 and January 2016 by GPO’s local seismic array installed at NAS Fallon.
The NAS Fallon seismic array will be improved for the FORGE project. Dedicated wells will be
drilled for seismic monitoring, 3-component sensors will be installed, and a refined velocity
model will be developed. These improvements will enable robust real-time monitoring during
operations, and improved event location accuracy.
2.2 FAULTING IN THE FALLON FORGE AREA
The Fallon FORGE team has investigated known faulting in the area. Figure 6 is a 3-D
rendering of the faults that have been mapped or interpreted in the subsurface within a 100 km2
area centered on the FORGE site, as derived mainly from pre-existing seismic reflection data.
Detailed geologic mapping in the area shows that these are pre-late Pleistocene age faults, and
the available earthquake data discussed above demonstrate a lack of seismicity within and
directly adjacent to the Fallon FORGE site. Overall, faulting is sparse within the FORGE site,
providing considerable volumes of un-faulted rock in which new EGS wells will be placed.

Fallon, NV, Preliminary Induced Seismicity Mitigation Plan | 7
Figure 6. 3-D fault model of the region around the Fallon FORGE area (outlined on the model surface in red). Shallow and deep wells in the area are shown in bright green. The dark green unit in the subsurface is the
basement rock that will be targeted for FORGE activities.
In Phase 2, the Fallon FORGE team will continue to investigate geologic structure to optimize
well locations with respect to major faults.
2.3 STATE OF STRESS
As described in the geologic model, there has been a great amount of work to determine the
principal stress orientations at NAS Fallon by evaluating the kinematics of natural faults, and
from analysis of image logs from the 88-24, FOH-3D, 61-36 and 86-25 wells. To help
understand the extensional setting and the state of stress throughout the Basin and Range
province, principal stress orientations have also been acquired through focal mechanisms, in-situ
stress measurements, alignments of volcanic structures, and geodetic measurements of strain
(references to this work are included in the geologic model report). Within the potential EGS
system at Fallon, a complete understanding of stress state, the structural setting, and the
heterogeneity of the principal stresses is being used to understand how the reservoir rock will
respond to stimulation, with particular focus on the dilation, slip, and propagation of fractures.
Data from wellbore image logs in the four wells noted above have been analyzed for drilling-
induced tensile fractures, borehole breakouts and petal centerline fractures to evaluate the stress
orientation. The results are shown in Figure 7 below.
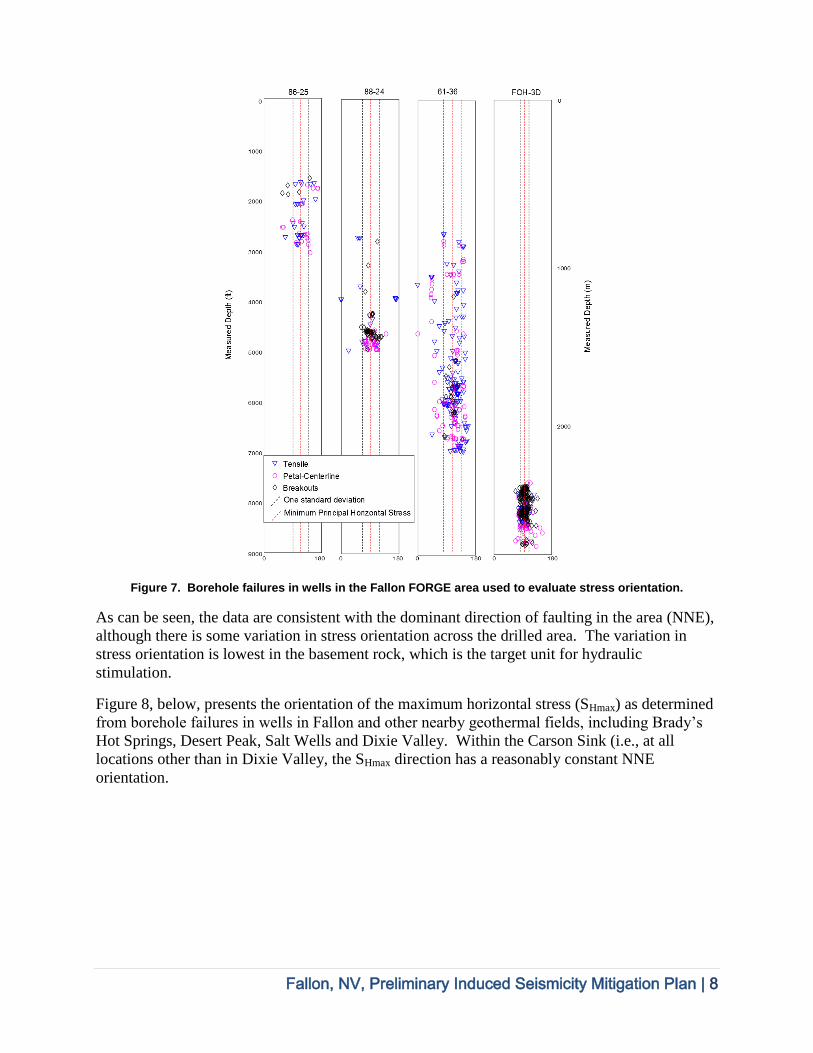
Fallon, NV, Preliminary Induced Seismicity Mitigation Plan | 8
Figure 7. Borehole failures in wells in the Fallon FORGE area used to evaluate stress orientation.
As can be seen, the data are consistent with the dominant direction of faulting in the area (NNE),
although there is some variation in stress orientation across the drilled area. The variation in
stress orientation is lowest in the basement rock, which is the target unit for hydraulic
stimulation.
Figure 8, below, presents the orientation of the maximum horizontal stress (SHmax) as determined
from borehole failures in wells in Fallon and other nearby geothermal fields, including Brady’s
Hot Springs, Desert Peak, Salt Wells and Dixie Valley. Within the Carson Sink (i.e., at all
locations other than in Dixie Valley, the SHmax direction has a reasonably constant NNE
orientation.

Fallon, NV, Preliminary Induced Seismicity Mitigation Plan | 9
Figure 8. Stress orientations in the Fallon FORGE area (right) and at other nearby geothermal fields (left).
2.4 ASSESSMENT OF THE MAGNITUDE OF POTENTIAL INDUCED MICRO-SEISMICITY
The nearest population center is Fallon, a town of about 12,000 people, located about 12 km NW
of the project area. There are no other population centers within 45 km. On the basis of 1)
current data that has informed the geologic model of the site and 2) experience in current and
previous DOE EGS demonstration sites in Northern Nevada, Idaho and California, the
probability that induced seismicity resulting from activities at the Fallon FORGE site will impact
nearby communities is extremely low. A conservative estimate is that a Richter magnitude (ML)
3.0 event might be felt in Fallon, but would cause no significant damage to any known structure
or facility.
The size of an earthquake (or how much energy is released) depends on the amount of slip which
occurs on a fault, how much stress has accumulated on the fault before slipping, how quickly it
fails, and over how large an area failure occurs (Brune and Thatcher, 2002). Considering the
distance between the Fallon FORGE area and the city of Fallon, earthquakes generated within
the Fallon FORGE area that have the potential to cause damage in Fallon would need to have
Richter (ML) magnitudes greater than 4 or 5, and would require slip over relatively large lengths
of a fault (Majer et al., 2007).
In addition to the size of the fault, the strength of the rock determines how large an event may
potentially be. It has been shown that in almost all cases, large earthquakes (Richter magnitude 6
and above) start at depths of at least 5 to 10 km (Brune and Thatcher, 2002). It is only at depth
that sufficient energy can be stored to provide an adequate amount of force to move the large
volumes of rock required to create a large earthquake. Experience in other EGS projects shows
that induced seismicity is significantly shallower (at depths similar to the depths of the
stimulated wells) and events have low magnitudes.

Fallon, NV, Preliminary Induced Seismicity Mitigation Plan | 10
Based on the location and limited spatial extent of the Fallon FORGE area, together with the
well-defined, predominantly NNE-trending structures which bound the system, the probability of
induced seismic events to be propagated toward nearby communities is exceedingly low. The
trend of fractures that are the most likely to shear (causing induced micro-seismicity) is parallel
to the main faults in the area (i.e., this zone will propagate in the NNE-SSW direction). In Phase
2, geologic structures will be investigated in more detail to evaluate the likelihood of any hidden
and potentially hazardous faults, and the existing seismic monitoring system will be improved
and used to monitor all induced seismicity, with particular attention to any seismicity that
appears to be migrating toward Fallon.
2.5 REVIEW OF LAWS AND REGULATIONS
Our review revealed no federal, state, or local laws or regulations expressly addressing induced
micro-seismicity associated with geothermal activities. However, both federal and Nevada state
laws are relevant to induced micro-seismicity, as follows:
2.5.1 Geothermal Steam Act of 1970 and Regulations Promulgated Thereunder
The Geothermal Steam Act of 1970 (30 U.S.C. §§ 1001-1028) authorizes the Bureau of Land
Management (BLM), under authority delegated by the Secretary of the Interior, to promulgate
regulations that protect the public interest against activities undertaken by geothermal lessees on
Federal land (30 U.S.C. § 1023[c]). The BLM’s geothermal regulations broadly define drilling
operations to include downhole operations undertaken for the purpose of producing geothermal
fluids or injecting fluids into a reservoir (43 C.F.R. § 3260.10[a]). The regulations require that
all drilling operations comply with applicable law (43 C.F.R. § 3262.10[c]) and be conducted in
a manner that minimizes noise and prevents property damage (43 C.F.R. § 3262.11[a][4] & [5])
and that “protects public health, safety, and property” (43 C.F.R. § 3260.11[d].
In the unlikely event that induced micro-seismicity were to pose a threat to public health or
safety or to public or private property, BLM has broad authority to take corrective action. BLM
can immediately issue oral (43 C.F.R. § 3260.12[e]) or written orders (43 C.F.R. § 3265.12[a])
with respect to operations causing induced micro-seismicity. BLM may also enter onto the lease
and take corrective action at the lessee’s expense, draw on the lessee’s bond (see 43 C.F.R.
Subpart 3214), require modification or shutdown of the lessee’s operations, and take other
corrective action (43 C.F.R. § 3265.12; see 43 C.F.R. §§ 3213.17 & 3200.4).
2.5.2 Safe Water Drinking Act UIC Program
The Safe Drinking Water Act (42 U.S.C. §§ 300f-300j-26) authorizes the U.S. Environmental
Protection Agency to regulate underground injection of fluids under the act’s Underground
Injection Control (UIC) program. In the State of Nevada, the U.S. Environmental Protection
Agency has delegated primary enforcement authority under the UIC program to the Nevada
Division of Environmental Protection (NDEP) (NRS § 445A.425[1][c] & NAC § 445A.866).
Operators of injection wells must obtain a permit from NDEP (NAC §§ 445A.865-910). NDEP
may revoke or suspend the permit upon a determination that the permitted activity endangers
human health and can only be regulated to acceptable levels by such action (NAC §§ 445A.865
& .885[1]). In the unlikely event that induced micro-seismicity were to pose a threat to public
health or safety, NDEP could revoke the project’s injection well permit.

Fallon, NV, Preliminary Induced Seismicity Mitigation Plan | 11
2.5.3 State Law Regulating Geothermal Operations
To drill and operate a geothermal production or injection well, Nevada law requires a permit
granted by the Nevada Division of Minerals (NDOM, part of the Commission on Mineral
Resources) (NRS 534A.060[1]). NDOM may impose conditions on the permit as deemed
necessary to protect the public interest (NRS 534.070[4] & [5]), and NDOM may suspend or
revoke the permit under the inherent authority of its police power in order to protect the public
interest. In the unlikely event that induced micro-seismicity were to pose a threat to public
health or safety or public or private property, the Nevada Department of Environmental
Production (NDEP) could revoke the project’s geothermal well permit.
2.5.4 State Tort Law
Our research revealed no case law (in Nevada or in any other U.S. jurisdiction) addressing civil
liability associated with induced micro-seismicity. However, as noted in the only known
scholarly review of this area of law (Cysper and Davis, 1994), cases addressing damage caused
by human-induced vibrations of the earth are analogous and provide support for the application
of various tort theories of liability to damage caused by induced micro-seismicity. Applicable
tort theories include trespass, strict liability for abnormally dangerous activities, nuisance and
negligence. As such, these theories are generally applicable in the unlikely event that induced
micro-seismicity were to cause any property damage or personal injury.
Nevada courts have followed common law doctrine on each such theory without relevant
variation or elaboration. For example, see:
Ransdell v. Clark County, 192 P.3d 756, 760 (Nev. 2008) and Countrywide Home Loans,
Inc. v. Thitchener, 192 P.3d 243, 249-50 (Nev. 2008), which address claims of trespass to
land;
Valentine v. Pioneer Chlor Alkali Co., 864 P.2d 295, 297 (Nev. 1993), recognizing
liability for abnormally dangerous activities as provided in §§ 519 & 520 of the
Restatement (Second) of Torts (1977);
Edwards v. Emperor’s Garden Restaurant, 130 P.3d 1280 (Nev. 2006), addressing a
claim of private nuisance;
Layton v. Yankee Caithness Joint Venture, LP, 774 F.Supp. 576 (D. Nev. 1991),
dismissing on summary judgment nuisance claim against operator of geothermal power
plant for alleged injuries caused by normal plant operation); and
Butler ex rel. Biller v. Bayer, 168 P.3d 1055, 1065 (Nev. 2007), listing the elements of a
negligence claim).
The Fallon FORGE team will continue to review any legal cases related to induced seismicity
throughout the life of the FORGE project.
3 COMMUNICATION AND OUTREACH PLAN (PROTOCOL STEP 2)
In Phase 1 of the Fallon FORGE project, the team has identified people and organizations
(including community leaders and public safety officials) in the Fallon area that are interested in
the project, and has held preliminary discussions about the activities that are expected to take
place, including discussions about the possibility of induced seismicity. These meetings
provided a venue for gauging interest in the project and identifying concerns. The response from

Fallon, NV, Preliminary Induced Seismicity Mitigation Plan | 12
the city of Fallon and Churchill County has been positive and informing. This process will
continue as the project progresses.
We report below on specific aspects of our outreach related to induced micro-seismicity that are
planned for implementation in Phase 2; others will be developed as appropriate.
3.1 IDENTIFICATION OF EMERGENCY RESPONSE PROVIDERS AND STAKEHOLDERS
As part of the Phase 1 preparation work on the Fallon FORGE project, representatives of the site
operators (Ormat and the U.S. Navy) have identified the local entity with overall responsibility
for emergency response: Churchill County’s Local Emergency Planning Committee (LEPC), a
representative group of emergency responders, planners, business and industry representatives,
health care providers, elected officials, citizens and media that work together on community
safety issues. Among other members, the LEPC includes the County Sheriff’s Office and School
District, the City of Fallon, the local fire department, the Fallon Paiute Shoshone Tribe, the
Fallon Police Department, and NAS Fallon. The project will be presented to the LEPC in detail,
including the activities and associated seismic response, details of the micro-seismic monitoring
system, and the process for monitoring and mitigating any risks associated with induced micro-
seismicity. Using a procedure followed at two previous EGS projects in Churchill County, the
site operators will coordinate with LEPC periodically as the project proceeds, typically before
initiating stimulation and testing activities.
3.2 DAILY COMMUNICATIONS PLAN
DOE and geothermal operators have established a well-defined communication process that
addresses the needs of the local community and DOE. This process was implemented
successfully at two other EGS projects in Nevada: the Desert Peak and Brady’s Hot Springs
EGS projects, providing a guide for future EGS sites. Therefore, the following will be
undertaken to maintain daily communications from the Fallon FORGE site:
Implementing independent, duplicated micro-seismic monitoring and reporting systems
on-site and at Lawrence Berkeley National Laboratory (LBNL), allowing DOE to
monitor micro-seismic activity in real time.
Sharing the daily project reports with DOE every day. The report describes on-site
activities, process analysis, the micro-seismic event log, and the associated interpretation
by LBNL.
Providing weekly update reports from the project team to DOE and its Technical
Monitoring Team (TMT) covering the process results, analysis, and trends.
Operating a real-time induced micro-seismicity web site hosted at LBNL that is open to
the public, including a catalogue and map showing the locations of events.
These activities are designed to enable effective daily communication about the projects and any
associated induced seismicity.
3.3 FALLON FORGE PHASE 2 OUTREACH PLAN
Among others, the Fallon FORGE team is planning the following outreach activities related to
the project at large, providing opportunities to introduce and discuss induced seismicity:
A series of meetings with the community, stakeholders, regulators and public safety
officials (including the LEPC) to discuss technical and non-technical aspects of the
project in advance of activities being initiated;

Fallon, NV, Preliminary Induced Seismicity Mitigation Plan | 13
Educational outreach for K-12 students and teachers in Fallon;
Continuing the dialogue with the Churchill Economic Development Authority (CEDA)
and other interested community members about the FORGE project and its benefits to the
community;
Planning for visits to the FORGE site by community members and other interested
stakeholders before the start of operations and during periods of drilling, hydraulic
stimulations, and other technical activities (with proper consideration of associated safety
issues); and
Developing a program for issuing periodic project updates and holding project-related
events that celebrate EGS innovations and breakthroughs resulting from the Fallon
FORGE project.
In addition to dissemination of more general information about the Fallon FORGE project, these
will provide opportunities for discussions about induced micro-seismicity.
4 CRITERIA FOR GROUND VIBRATION AND NOISE (PROTOCOL STEP 3)
4.1 INTRODUCTION
The Protocol identifies the steps for identifying and evaluating existing standards and criteria to
understand the applicable existing regulations for ground-borne noise and vibration impact
assessment and mitigation that have been developed and may be applicable to the Fallon FORGE
project. These standards and criteria apply to damage to buildings, interference with human
activities (including industrial, commercial, research and medical activities) and wildlife habitat.
In Phase 2 of the Fallon FORGE project, existing criteria developed for other industries (i.e., not
specifically for EGS projects) will be evaluated to determine their applicability, considering the
proximity to EGS activities and the likely frequency (of occurrence) and magnitudes of induced
micro-seismic events.
4.2 PRELIMINARY ANALYSIS OF THE IMPACTS OF MICRO-SEISMICITY AT THE FALLON
FORGE PROJECT
The historical seismic data from past natural events indicate that Fallon site lies in an area of
relatively low seismicity. For induced micro-seismicity associated with FORGE activities, the
data indicate that local or Richter (ML) magnitudes will be mostly less than 1.0, with occasional
events with ML of 1.5 to 2.0. Microseismic data from other EGS sites show that the source area
(fracture area which fails) is relatively small and varies in diameter from 10 to 40m. Source
lengths in this size range will produce high-frequency vibrations that are unlikely to cause any
structural damage. At the European EGS project at Soultz-sous-Forêts in France, an induced
event with a Richter (ML) magnitude of 2.9 induced event had a frequency of around 80 Hz.
This is relatively high frequency and is unlikely to cause any structural damage.
A direct measurement of particle acceleration (or velocity) and the frequency associated with it
are more meaningful as there have been many observations and studies done to compare
structural damage to these parameters. These studies are more associated with mining and
subsidence; however, the correlations between with structural damage and particle
acceleration/frequency component are valid for induced seismicity as well (Majer et al., 2014).
One of the most widely used standards for such situations is the German standard DIN 4150-3
(DIN 4150-3:1999 “Structural Vibration – Part 3: Effects of Vibration on Structures”). For

Fallon, NV, Preliminary Induced Seismicity Mitigation Plan | 14
example, particle velocity of up to 5mm/s at 10-50 Hz or particle velocity up to 15mm/s at 50-
100Hz is unlikely to cause any structural damage, as noted in Majer et al. (2014). There are
ranges of such calculated values for industrial, residential and old buildings that need to be
preserved.
Noise is another factor that is considered at this stage of the project. Based on our initial analysis
of the likely depth and magnitudes of events, observations of noise around NAS Fallon and the
distance to the City of Fallon, it is unlikely that noise created by any induced micro-seismicity
will lead to any inconvenience to the local population.
4.3 FURTHER WORK IN PHASE 2
In Phase 2, the Fallon FORGE team will undertake additional work related to ground vibration
and noise, including:
With input from stakeholders, identifying any buildings or other structures that might be
particularly sensitive to vibration;
Selecting locations for ground motion sensors/accelerometers within NAS Fallon and the
City of Fallon;
Installing the motion sensors and establishing a base line for ground motions.
5 ESTABLISH A MICRO-SEISMIC MONITORING NETWORK (PROTOCOL
STEP 4)
5.1 PROGRESS AND FUTURE PLANS FOR THE NAS FALLON SEISMIC ARRAY
In EGS projects like FORGE, seismic monitoring enables characterization of background
seismicity, (i.e., by establishing a baseline) and helps to understand regional fault-related
deformation and ambient stress/strain around the target EGS area. This has been discussed
above in Step 1 (Preliminary Screening Evaluation).
Typically, regional networks are not adequate for providing a detailed understanding of
seismicity nor for monitoring induced micro-seismicity in an EGS project for two reasons:
1. Compared to events typically generated in EGS projects (that have Richter magnitudes of
less than 2, down to -1 or less), their sensitivity is tuned to larger events (Richter
magnitude 2 or higher).
2. The spacing between stations is relatively large (tens of km or more), the location
accuracy of events within a small EGS area is poor.
As noted above, a seismic monitoring array is already established at Fallon, and since 2015 (in
its more sensitive configuration) has detected many regional events in the area, but none within
the confines of the array. Nevertheless, it has detected events around the array, to distances far
greater than two times the radius of the FORGE target area, a distance recommended in the
Protocol.
In Phases 2 and 3, the NAS Fallon seismic array will be improved to enable it to be used
effectively in the FORGE project. In addition to the existing 10 stations in shallow boreholes
(depth of 200 ft/60 m), dedicated wells will be drilled for seismic monitoring, 3-component
sensors will be installed, and a refined velocity model will be developed. These improvements

Fallon, NV, Preliminary Induced Seismicity Mitigation Plan | 15
will provide more detail in the baseline data collected before site operations begin, and enable
robust real-time monitoring during operations and improved event location accuracy. Temporary
densification of the array during operations will be planned after determining the optimum
number and locations of additional surface or shallow borehole stations needed to ensure
location accuracy during stimulation and other operations at the site.
During EGS stimulations and other operational activities, the monitoring array will be used to
detect and map the progress of fracturing and the interconnection between fractures that enhance
permeability within the low-permeability basement rock beneath the Fallon FORGE site. High
quality data will be necessary to determine the success of stimulation activities, understand the
evolution of permeability within the EGS reservoir, and provide credible scientific evidence to
demonstrate that the project does not pose a threat to public safety.
It is well within the FORGE mission to have an array of seismic sensors that is capable of
locating events with Richter (ML) magnitudes as low as -1 (possibly -2) with an accuracy of 50
m at most, with a bandwidth of 0.1 Hz to 1 kHz. In addition, the array will be designed to
provide sufficient data coverage to produce accurate moment tensor and source mechanism
information. Considering that FORGE is the site of robust underground experiments designed to
understand the mechanics by which permeability can be increased to enable commercial
production rates from EGS wells, the Fallon FORGE site will have an array that is suitable for all
required purposes (accurate event locations, source mechanisms, accurate moment tensors, and
other purposes yet to be defined. In other words, the Fallon seismic array will be highly
instrumented and have a detailed velocity model that will improve our understanding of what is
happening at depth.
In its current configuration, the micro-seismic monitoring system at NAS Fallon is being used as
a first phase of monitoring the background seismicity down to Richter (ML) magnitude 0 with an
accuracy of a few hundred meters, thus meeting the initial requirements of seismic monitoring
during Phase2a.
5.2 EXAMPLE: BRADY’S HOT SPRINGS SEISMIC MONITORING ARRAY
Figure 9, below, shows the layout of a currently operating micro-seismic monitoring system
installed at the Brady’s Hot Springs geothermal field, which (like Fallon) is also located in
Churchill County, Nevada. This current system is a multi-station station array with five borehole
stations and three surface stations that is capable of detecting and locating in real time micro-
seismic events down to magnitude 0 or lower. The system is capable of collecting data that can
be used to locate events with a precision of 100 meters, derive source parameters of moment
tensors, fault plane solutions, stress drops associated with individual events, and fault rupture
dimensions. All of these capabilities are highly useful for EGS projects.
The system includes eight stations that are roughly centered around well 15-12 (the well that was
stimulated). Each station is capable of digitizing three channels of data at 24-bit resolution at
500 samples per second. The data from the digitizers is transmitted to a central site with spread
spectrum radios over an RS232 internet-compatible digital link at real-time data rates with time-
stamps, using GPS corrected data. The central acquisition site has real-time data acquisition and
detection software that selects individual events automatically and discriminates between micro-
seismic events and spurious events such as noises created by traffic (Brady’s is adjacent to a
major interstate highway), wind and other noise. (The Fallon array will be tuned to discriminate
actual events from noise created by aircraft operating out of NAS Fallon.) The data are

Fallon, NV, Preliminary Induced Seismicity Mitigation Plan | 16
transmitted automatically to LBNL, where all processing is carried out in real time. Each surface
station of the array has a 3-component 4.5 Hz geophone that is buried in the near surface (1 to 2
feet in depth) and oriented such that the horizontal components are oriented NS and EW.
Five of the stations have a buried 3- component 8 Hz borehole geophone in 300-foot-deep bore
holes (BP-3, -4, -5, -7 and -8). The borehole stations significantly improved sensitivity during
stimulation operations.
Figure 9. The micro-seismic monitoring array at Brady’s Hot Springs, the site of a stimulation of well 15-12.
The temporary augmented array (indicated by green triangles in Figure 9) collect continuous data
(24-bit, 500 samples per second) using 3-component 2 Hz geophones that were deployed before,
during, and after the EGS stimulation activities. These temporary surface stations were used to
determine a more complete (moment tensor) mechanisms of the micro earthquakes, and for
studying long-period noise. Data from the surface stations also improved the spatial uniformity
of hypocenter-location resolving power throughout the EGS project area. Data were recovered
during site visits, by exchanging digital storage cards that have the capacity to record for at least
3 months.
6 QUANTIFY HAZARD FROM NATURAL AND INDUCED SEISMIC EVENTS
(PROTOCOL STEP 5)
6.1 LESSONS LEARNED FROM SIMILAR EGS PROJECTS IN NEVADA
Although the historical seismicity at the Fallon FORGE site and the prospect of creating
potentially damaging micro-seismic events are both very low, the hazards associated with ground
shaking due to induced and natural seismicity need to be investigated. The first step is to use
empirical data from relevant case histories. In the case of Fallon, the nearby Desert Peak and

Fallon, NV, Preliminary Induced Seismicity Mitigation Plan | 17
Brady’s Hot Springs EGS projects provide useful information. Experiences at these two projects
provide an indication of how the Fallon site may respond to injection activities.
Figure 10 below shows the seismicity at the Desert Peak EGS project during a monitoring period
of more than 5 years. The micro-seismic activity (2000 events) has been a function of injection
at the EGS well and the other injection wells. There was a peak of seismicity (2011- 2013)
during the main EGS activity in the target well 27-15; the largest event during the entire
monitoring period was magnitude 1.7.
Figure 10. Micro-seismicity and the seismic monitoring array at the Desert Peak EGS project.
Figure 11, below, presents similar data for the Brady’s Hot Springs EGS project. A first
examination of the seismicity reveals a correlation to particular sharp changes in
injection/production activities (these data are not included in Figure 10), which is not unusual for
geothermal fields. As shown in the lower left figure below, no seismicity has been associated
with stimulation of EGS well (15-12); it has all been associated with the main
production/injection activities north of the EGS site. The largest event has had a magnitude of
2.0. No damage was caused by this small event, and no concern by the local population was
reported.
A comparison of seismicity with net volume injection shows only one small peak in early 2012
that correlates with seismicity. The events comprising this peak were part of a series of events
that propagated northward out of the geothermal field, suggesting a natural (rather than induced)
origin. The magnitudes of induced seismic events at Brady’s are very small; other than the one
event mentioned above, all are less than 2 and most are in the range of 0 to 1. This shows that
very little seismicity is generated relative to the amount of water injected. Supporting this
conclusion is the alignment of induced seismicity with the NNE-SSW trend of faults.

Fallon, NV, Preliminary Induced Seismicity Mitigation Plan | 18
Figure 11. Micro-seismicity and the seismic monitoring array at the Brady’s Hot Springs EGS project. Note the lack of seismicity around the stimulated well (15-12).
Additional data from a combined chemical and high-pressure stimulation in Desert Peak EGS
well 27-15 (between 6 February and 29 April 2011) are relevant when considering the design of
the micro-seismic monitoring array at the Fallon FORGE project. During the period from 2-19
April 2011, a total of 42 events were located inside the monitoring volume at Desert Peak, as
shown in Figure 12, the surface area of which defines the target area shown in Figure 13 and
Figure 14. These results demonstrate that if seismic data are to be collected from relatively small
injections like that into well 27-15, the detection threshold magnitude should be at least -1, and
preferably as low as -2. This would require 300- to 500-foot-deep (~90-150 m) boreholes
specifically drilled for downhole seismic monitoring in an optimal pattern around the injection
well. Deeper wells with geophone arrays would further improve the ability to locate small
events.

Fallon, NV, Preliminary Induced Seismicity Mitigation Plan | 19
Figure 12. Seismic events recorded from 2 April to 13 May 2011 during a high-pressure stimulation of Desert Peak well 27-15.
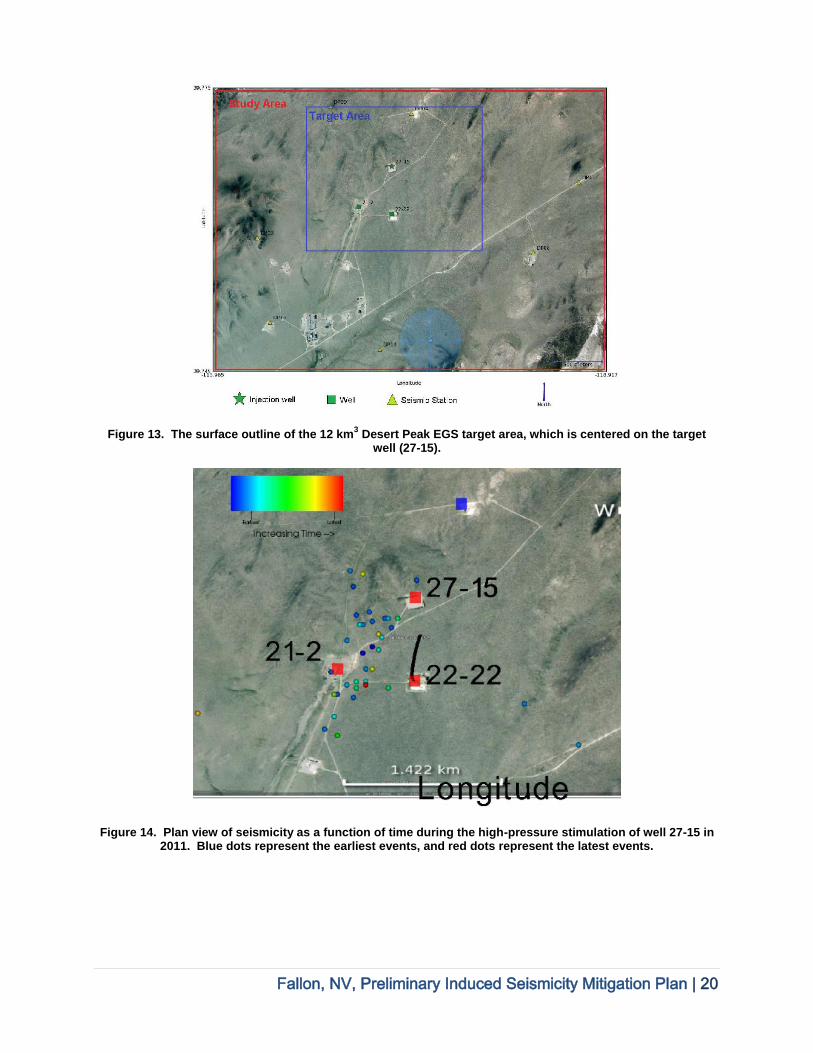
Fallon, NV, Preliminary Induced Seismicity Mitigation Plan | 20
Figure 13. The surface outline of the 12 km3 Desert Peak EGS target area, which is centered on the target
well (27-15).
Figure 14. Plan view of seismicity as a function of time during the high-pressure stimulation of well 27-15 in 2011. Blue dots represent the earliest events, and red dots represent the latest events.

Fallon, NV, Preliminary Induced Seismicity Mitigation Plan | 21
6.2 PHASE 2 HAZARD ASSESSMENT PLANS AT THE FALLON FORGE PROJECT
Probabilistic or deterministic seismic hazard analysis (PSHA and DSHA, respectively) are two
methods commonly used to assess ground motions associated with seismicity. The former
(PSHA) is more commonly used since it provides the probability that a specified level of ground
motion (i.e., one that could lead to damage) would be exceeded. The Protocol recommends
performing a PSHA for a magnitude 4 event to consider the potential for damage, and a lower
magnitude to consider “nuisance” (people being disturbed by induced micro-seismicity) and/or
interference with highly sensitive activities. The hazard is expressed in terms of Peak Ground
Acceleration (PGA), acceleration response spectra, and Peak Ground Velocity (PGV) or Peak
Particle Velocity (PPV). However, because both the magnitude and duration of induced seismic
events are low, there is a low probability of structural damage to buildings.
The overall process of the PSHA is to undertake it first for natural seismicity, and then
superimpose the induced seismicity to evaluate the incremental addition to the pre-existing,
natural hazard. Background seismicity in this area has been discussed in Step 1 above. Active
faults are located and within the Carson Sink; for example, the Rainbow Mountain Fault Zone
and the faults surrounding the Stillwater Range, which have had relatively large events in the last
century. These events and others in the area provide useful information for a PSHA, including
source fault orientation, event magnitudes and recurrence rates. It is noted that no known active
faults pass through the proposed Fallon FORGE area.
In comparison to large, natural tectonic earthquakes, the hazard associated with induced
seismicity is very low. Nevertheless, micro-seismicity is anticipated. Therefore, the Fallon
FORGE team has developed a detailed geologic model, including faults in the project area, and
analyzed the ambient stress field around the Fallon site (see section 1 of this preliminary ISMP).
Based on planned injection and pore pressure increase scenarios, and by analogy with similar
EGS projects (see above), the maximum magnitude of an induced event and the likely rates will
be estimated. From this, the maximum ground motions will be calculated.
7 CHARACTERIZATION OF THE RISK FROM INDUCED SEISMIC EVENTS
(PROTOCOL STEP 6)
7.1 PROBABILITY OF AFFECTING NEARBY COMMUNITIES
The project target area is defined as the effective area in which micro-seismic events are
expected to occur. The Fallon FORGE target area will be defined taking the following in
consideration:
Geological and geophysical survey data
Stress field orientation (particularly the direction of the maximum horizontal stress,
SHmax) as determined from recent fault trends and analyses of wellbore failures
Previous records of the effective distribution of induced micro-seismic events in similar
EGS projects (a radius of 500 m around the stimulated well is reasonable)
The 3D geologic model, including mapped fracture and 3D reservoir analysis
Preliminary interpretation of ground deformation (e.g., from ground leveling surveys,
high-resolution GPS data or InSAR interferometry)
All known historical seismicity
Known faults dimensions within the target FORGE volume

Fallon, NV, Preliminary Induced Seismicity Mitigation Plan | 22
Volume, rate and pressure of injections
The observations and assessment presented above suggest that the likelihood of generating large
seismic events in the specific region around the proposed Fallon FORGE site is very low. For
example:
There are no recorded natural earthquakes greater than 2.7 in the area, indicating that
residual strain energy within this environment is relatively low.
The volumes to be injected during the proposed stimulations are unlikely to
accommodate large amounts of strain, and thus are unlikely to generate large induced
seismic events.
The superficial material in this area is loose volcanic sand, which is likely to absorb the
majority of the energy from either natural or induced events.
Additionally, it is noted that the nearest populated residential area is at least 12 km away from
the FORGE site. Therefore, events generated during stimulation activities are unlikely to be
noticed by residents some 12 km distant from the injection site.
The analysis described above indicates that it may not be necessary for this site to implement all
aspects of the protocol. However, it will be reasonable and prudent to install strong motion
seismometers in Fallon (the nearest population center to the project area) to record ground
velocity and frequency. As noted above, the placement of these instruments will be determined
in cooperation with local stakeholders to ensure they are placed in area of particular importance,
demonstrating to the residents that all due care has been taken to protect their property and that
accepted criteria for structural damage will be used.
7.2 POSSIBLE EFFECTS AT NAS FALLON
The nearest operating facility NAS Fallon, where the most critical facilities are the runways.
The observations and anticipated magnitude of seismic events indicates in this area suggests that
it is unlikely to have any adverse effect on the runways or facilities. Based on typical
construction methods of major runways, it is estimated that the critical event would have to be a
magnitude 4 or larger to be of concern.
8 RISK MITIGATION (PROTOCOL STEP 7)
The first six steps of the induced seismicity protocol suggest various activities to address the
impact of induced seismicity. If the induced seismicity exceeds the design maximum from the
injection parameters (yet to be determined) or if major deviations from assumed geologic and
stress conditions are encountered during the operation of the FORGE, then it may be necessary
to perform additional actions.
Two broad areas of measures could be used to mitigate any adverse or unwanted effects of
induced seismicity (Majer et al., 2014):
Direct mitigation refers to those actions engineered either to reduce the seismicity
directly or relieve the effects of the seismicity. Examples of this approach include
modification of the injection or production rates, and a calibrated control system that has
been dubbed the “traffic light” system. This is a system for real-time monitoring and
management of the induced seismic vibrations, which relies on continuous measurements

Fallon, NV, Preliminary Induced Seismicity Mitigation Plan | 23
of the ground motion (usually PGV) as a function of injection rates and time. The traffic
light system may be appropriate for many FORGE operations in that it provides a clear
set of procedures to be followed in the event that specific seismicity thresholds are
reached (Majer et al., 2007). The traffic light system and the thresholds that would
trigger certain activities by the operator should be defined and explained in advance of
any operations.
Indirect mitigation refers to those actions that are not engineered, but involve such
issues as public/regulatory acceptance or operator liability. The level and amount of any
indirect mitigation will be specific to different activities conducted at the Fallon FORGE
site. Seismic monitoring, information sharing, community support, and direct
compensation to affected parties are among the types of indirect mitigation that will be
considered. Early support from the developer to the community can improve the ability
to respond effectively to a potentially impacted community in the event of problematic
induced seismicity. This may come in the form of that may be tailored to the specific
needs of the community.
In most instances at Fallon, from our present knowledge of seismicity hazard, community and
Navy assets, little or no mitigation may be required to gain public acceptance. However, if there
is any indication that induced micro-seismicity may affect critical facilities (such as facilities on
the Navy base) or if structures are experiencing unacceptable ground motion, mitigation
measures would be required. At Fallon it is anticipated that by properly carrying out the
preceding six steps, mitigation will not be required in the majority of instances. However, in
Phase 2, the Fallon FORGE team will develop a full set of options that can be implemented if
and when needed.
9 CONCLUSION
In summary, the information gathered to date indicates a very low risk of any significant impact
related to induced seismicity that would occur during operations at the Fallon FORGE site.
Historical seismicity records for the past 100 years have shown that there has been no seismicity
of magnitude 1 or greater within at least a 10 km radius of the proposed Fallon FORGE site.
Expected micro-seismicity from EGS stimulations and other operations is also expected to be at
a level well below that leading to potential damage or other risk at NAS Fallon and in the City of
Fallon. Our examination of induced micro-seismicity at nearby EGS projects is consistent with
the preliminary predictions of magnitudes for induced seismicity at Fallon. Should a higher level
of induced seismicity occur, pre-determined mitigation measures can be implemented, based on
accurate, real-time monitoring of seismicity during site operations. This is a critical element in
making FORGE a success.
A world-class EGS observatory must have a world-class seismic monitoring system to fully
understand subsurface mechanisms associated with the manipulation and control of fractures.
Therefore, building on the existing GPO seismic monitoring installation, the Fallon FORGE
team will design and implement a seismic array with the sensitivity to detect and accurately
locate events with magnitudes less than -1.0 (ideally down to -2.0) and have a spatial coverage
that is optimal for deriving accurate moment tensor solutions from the recorded micro-seismic
data.

Fallon, NV, Preliminary Induced Seismicity Mitigation Plan | 24
10 REFERENCES
Baria, R., Hearn, K.C. and Batchelor, A.S., 1985. Induced seismicity during the hydraulic
stimulation of the potential Hot Dry Rock geothermal reservoir. Paper submitted to the
Fourth Conference on Acoustic Emission/Microseismic Activity in Geology Structures
and Materials, Pennsylvania State University, 22-24 October, 1985, 26 pp.
Baria, R. (ed.), 1990. Hot Dry Rock Geothermal Energy. Proceedings of Camborne School of
Mines. International HDR Conference, June 1989. Robertson Scientific Publications,
London.
Baria, R., Baumgärtner, J., Rummel, F., Pine, R.J., and Sato, Y., 1999. HDR/HWR reservoirs:
concepts, understanding and creation. Geothermics 28, no. 4/5, pp. 533-552, ISSN 0-
375-6505.
Brune, J., and W. Thatcher, 2002. International Handbook of Earthquake and Engineering
Seismology, V81A. International Association of Seismology and Physics of Earth's
Interior, Committee on Education, pp 569–588.
Cypser, D.A. and S.D. Davis, 1998. Induced seismicity and the potential for liability under U.S.
law. Tectonophysics, 289(1), pp. 239–255.
Majer, E., Baria, R., Stark, M., Oates, S., Bommer, J., Smith, B., and Asanuma, H., 2007.
Induced seismicity associated with Enhanced Geothermal Systems. Geothermics, v. 36,
pp. 185-222.
Majer, E., Baria, R. and Stark, M., 2008. Protocol for induced seismicity associated with
Enhanced Geothermal Systems. Report produced in Task D Annex I (9 April 2008),
International Energy Agency-Geothermal Implementing Agreement. (incorporating
comments by C. Bromley, W. Cumming, A. Jelacic and L. Rybach). http://www.iea-
gia.org/publications.asp
Majer, E., Nelson, J., Robertson-Tait, A., Savy, J., and Wong I., 2012. Protocol for Addressing
Induced Seismicity Associated with Enhanced Geothermal Systems (EGS). DOE/EE
Publication 0662.
https://www.eere.energy.gov/geothermal/pdfs/geothermal_seismicity_protocol_012012. pdf
Majer, E., Nelson, J., Robertson-Tait, A., Savy, J., and Wong, I., 2014. Best Practices for
Addressing Induced Seismicity Associated with Enhanced Geothermal Systems (EGS).
Lawrence Berkeley National Laboratory Publication 6532E.
http://escholarship.org/uc/item/3446g9cf

1-K
APPENDIX K. ENVIRONMENTAL SAFETY AND HEALTH PLAN


Fallon, NV, Environmental Safety and Health Plan | i
CONTENTS 1 Introduction ............................................................................................................................. 1
2 Participating Organizations ..................................................................................................... 2
3 Ownership ............................................................................................................................... 3
4 Overarching Criteria ............................................................................................................... 3
4.1 Safe-by-Design Intent ...................................................................................................... 3
4.2 Understand Technical Basis ............................................................................................. 3
4.3 Identify and Control Energy Sources ............................................................................... 3
4.4 Define Unacceptable Consequences ................................................................................ 4
4.5 Risk Assessment Approach .............................................................................................. 4
4.6 Positive Verification ......................................................................................................... 5
5 Define Scope ........................................................................................................................... 5
5.1 Identify Work Planner ...................................................................................................... 5
5.2 Establish a Work-Planning Team ..................................................................................... 5
5.3 Role of the Work Planner ................................................................................................. 5
5.4 Decision to Accept, Reject, or Continue Work ................................................................ 6
6 Analyze Hazards ..................................................................................................................... 6
6.1 Detailed Identification of Hazards ................................................................................... 6
6.2 Identify Safety Themes, Standards, and Codes ................................................................ 6
6.3 Perform Formal Hazard Analysis ..................................................................................... 6
7 Control Hazards ...................................................................................................................... 7
7.1 Eliminate Hazards and Single-Point Failures................................................................... 7
7.2 Apply Engineered and Administrative Controls .............................................................. 7
7.3 Approval of Safety Case .................................................................................................. 8
8 Prepare and Perform Work ..................................................................................................... 8
8.1 Complete Technical Work Document .............................................................................. 8
8.2 Perform Job Safety Analysis ............................................................................................ 8
8.3 Confirm Team Training and Qualification....................................................................... 9
8.4 Conduct Readiness Reviews or Assessments................................................................... 9
8.5 Decision to Authorize Work ............................................................................................ 9

Fallon, NV, Environmental Safety and Health Plan | ii
8.6 Perform Work ................................................................................................................... 9
9 Feedback and Improvement .................................................................................................... 9
Attachment A: Emergency Response Plan ................................................................................... 10
1 PROJECT ORGANIZATION AND RESPONSIBILITIES ................................................ 10
2 EMERGENCY RESPONSE TELEPHONE NUMBERS .................................................... 11
3 STATEMENT OF PURPOSE .............................................................................................. 11
4 SCOPE .................................................................................................................................. 12
5 RESPONSIBILITIES ........................................................................................................... 12
6 PLAN LOCATION ............................................................................................................... 12
7 PRIORITIES ......................................................................................................................... 13
8 STATEMENT OF SAFETY AND HEALTH POLICY ...................................................... 13
9 FALLON FORGE EM 385-1-1 SAFETY PLAN GUIDELINES ........................................ 13
10 TRAINING ........................................................................................................................... 13
11 PROTECTION OF THE ENVIRONMENT ........................................................................ 14
12 EMERGENCY RESPONSE PROCEDURES ...................................................................... 15
12.1 Organization ............................................................................................................... 15
12.2 Emergency Communications ...................................................................................... 15
13 ACCIDENTS AND INJURIES ............................................................................................ 16
13.1 First Response............................................................................................................. 16
13.2 MEDICAL EMERGENCY PROCEDURES ............................................................. 16
13.3 Medical Emergencies ................................................................................................. 16
13.4 Post Incident Procedures ............................................................................................ 17
14 BLOWOUTS AND WELL DAMAGE ................................................................................ 17
14.1 Initial Response .......................................................................................................... 17
14.2 Initiate Control and Containment Plans...................................................................... 17
15 EARTHQUAKES ................................................................................................................. 18
15.1 Earthquake Preparedness ............................................................................................ 18
15.1.1 Action - Onset of an Earthquake ............................................................................. 18
15.1.2 Action - Once the Earthquake Stops ....................................................................... 18
15.1.3 Action – After All Team Members/Contractors Are Accounted For ..................... 18

Fallon, NV, Environmental Safety and Health Plan | iii
15.1.4 Action – If Evacuation is Ordered .......................................................................... 18
16 EXPLOSIONS ...................................................................................................................... 19
16.1 Action - After the Explosion ...................................................................................... 19
16.2 Action - After All Team Members/Contractors Are Accounted For.......................... 19
17 FIRES .................................................................................................................................... 19
17.1 Action – Onset of Fire ................................................................................................ 19
17.2 Action - After the Onset of Fire .................................................................................. 20
17.3 Action - After All Employees/Contractors Are Accounted For ................................. 20
18 HYDROGEN SULFIDE HAZARDS ................................................................................... 20
19 LIGHTNING......................................................................................................................... 20
19.1 Action-At Onset of a Lightning Storm ....................................................................... 20
20 SPILLS AND DISCHARGES .............................................................................................. 21
21 POST INCIDENT PROCEDURE ........................................................................................ 21
21.1 Bodily Injuries Such as Breaks and Sprains ............................................................... 21
22 TRAINING ........................................................................................................................... 23
22.1 Requirements .............................................................................................................. 23
23 INSPECTION AND OBSERVATION OF THIS PLAN ..................................................... 23
24 DANGEROUS VIOLATION OF SAFETY POLICY OR PROCEDURE .......................... 24
Attachment B ................................................................................................................................ 25

Fallon, NV, Environmental Safety and Health Plan | 1
ENVIRONMENTAL SAFETY AND HEALTH (ES&H) PLAN
Fallon, NV
1 Introduction
Frontier Observatory for Research in Geothermal Energy (FORGE) is a dedicated site to enable
scientists and engineers to develop, test, and accelerate breakthroughs in enhanced geothermal
system (EGS) technologies and techniques. Fallon FORGE is a DOE operation with the
associated prime contractor being Sandia National Laboratories (SNL). The Department of
Energy (DOE) requires that all work performed by the Department and its contractors follow a
broad set of requirements for Integrated Safety Management (ISM). The DOE ISM directive is
the foundation for Sandia National Laboratories’ Integrated Safety Management Systems (ISMS)
and its approach to Environmental, Safety, and Health (ES&H); therefore, the Sandia ISMS is
the basis for the FORGE ES&H Plan. Per DOE requirements, this ES&H plan and any revisions
of this plan cover all Fallon team members and contractors working on this project. This plan
and its attachments are subject to revisions throughout the project and will be updated as
necessary. Revisions will include any new environmental safety and health requirements, new
contact personnel, new training requirements, and new contractors.
The core functions of the Sandia ISMS, as applied to Fallon FORGE operations, provide the
structure to mitigate risks and hazards to the public, the worker, and the environment, effectively
integrating safety into all facets of work planning and execution. As illustrated in Figure 1, these
functions include the following five elements:
Define Work Scope: Translate the required activity into work, set expectation, identify
and prioritize tasks, and allocate resources.
Analyze Hazards: Identify, analyze, categorize, and communicate hazards and
associated impacts associated with the work.
Control Hazards: Identify controls to prevent or mitigate hazards and environmental
impacts.
Perform Work: Confirm readiness and then perform work safely and in an
environmentally responsible manner.
Feedback and Improve: Gather feedback information on the adequacy of controls,
identify and implement opportunities for improving the definition and planning of work,
and conduct line and independent oversight.

Fallon, NV, Environmental Safety and Health Plan | 2
Figure 1. Integrated Safety Management System Core Functions associated with FORGE
These five core functions are not unique to the operations of FORGE but form the basis of any
comprehensive effort to reduce project risk to personnel, the public, or the environment. As
such, this plan is not a substitute for plans or requirements originating from other entities (e.g.,
Department of the Navy, R&D participants, vendors, FORGE Team Members, etc.). This ES&H
plan, with its attachments, provides structure for participating organizations and describes how
work will be carried out at Fallon FORGE.
Relative to site specific issues, Appendix A (Emergency Response Plan) provides detailed
information regarding the requirements set forth by DOE regarding identification of contact
personnel responsible for on-site safety, as well as provides for procedures and protocols for
hazards communication, emergency evacuation and response, and any ES&H training
requirements. As specific operational procedures are developed (e.g., earthwork, drilling,
hoisting &rigging, elevated work ...) they will be developed within the guidelines of US Army Corps of Engineers EM-385-1-1; Safety and Health Requirements Manual http://www.usace.army.mil/SafetyandOccupationalHealth/EM38511,2008BeingRevised.aspx .
2 Participating Organizations
All project participants engaged in on-site FORGE activities, either through competitively
funded R&D, directly contracted work, or vendor services will be required to have an approved
safety plan in place to perform specific work outlined in Phase 2. Those plans will be reviewed
by the FORGE project manager or his/her delegate. Such plans will need to contain the
fundamental elements associated with the broader FORGE ES&H plan, and will need to comply
with the Navy installation ES&H requirements outlined in Attachment A.

Fallon, NV, Environmental Safety and Health Plan | 3
3 Ownership
The Fallon FORGE project manager is responsible for ensuring that the criteria in this document
are implemented.
4 Overarching Criteria
4.1 Safe-by-Design Intent
Safety is an attribute of a system of interconnected elements—people, procedures, facilities,
equipment, and the hazards inherent in them and that to which they are applied. If one element of
the system changes, the system is changed and must be reexamined in the new context. All
elements must remain seamlessly tied together from the design phase through the execution
phase. As different organizations are integral to the system, particular attention must be paid to
early involvement and reliable communication across the organizational interfaces during project
execution. Poor communication of safety-related information across organizational interfaces is a
frequent contributor to accidents.
Human performance is an integral part of the system and is often overlooked in planning because
of trust and respect in each other’s competence. However, human performance is a common
source of error. Accident pathways resulting from human error must be identified upfront and
removed or blocked by design intent. Further, robustness should be built into the design of the
system to compensate for uncertainties in human performance.
Safety is most effectively and efficiently achieved by designing it into the system at the
conceptual or initial planning stages. However, it should not be reflexively assumed that
designing safety features into an existing system will be difficult, time-consuming, or expensive.
Effort expended toward this aim should be proportional (graded) to the severity of potential
accident consequences.
4.2 Understand Technical Basis
It is vital to understand how a system design works to accomplish its performance objectives.
From a safety perspective, it is vital to understand how the system design can fail and cause an
accident. Formal hazard analysis appropriate to the technical complexity of the activity will
inform decision-making on the number and type of controls necessary to reduce the probability
of occurrence. While this analysis can be relatively straightforward for a new hazardous activity,
it can be problematic for older facilities and operations. The technical basis of an existing
hazardous activity must be reconstructed sufficiently to assure continued safe operations. The
effort will be prioritized according to the severity of potential accident consequences.
4.3 Identify and Control Energy Sources
Stored energy in all of its forms and guises must be identified and controlled with appropriate
engineered and administrative controls designed to prevent or mitigate the consequences of
accidental release. Kinetic, potential, electrical, electro-mechanical, thermal, pressure, and
chemical energy sources all can be released directly, or released in another form of energy, as the
result of an accident. In most cases, the concern will be stored energy in the system, but lack of
energy could also pose a problem if continuously energized controls are necessary to assure safe
operations.

Fallon, NV, Environmental Safety and Health Plan | 4
The requirement to identify and control energy sources applies not only to complex technical
activities, but it also can be applied to the simplest examples of work. For example, it may be
stored energy in a steel band that compresses waste material for size reduction; a chemical
reaction that starts a fire; or rupture of a pressure vessel that punctures a tank containing a toxin.
In short, it will usually require some form of unplanned energy release to disturb a harmless
equilibrium.
4.4 Define Unacceptable Consequences
All personnel must focus on what they do not want to happen as a result of work activities.
Unacceptable consequences should be identified in the context of the activity being performed.
In addition to the harmful effects of accidents on people and the environment, other
consequences, such as temporary or permanent loss of capability, impact on site operations, or
serious damage to the reputation of FORGE, must be consciously considered and defined up
front. The effects of exposure to known health hazards must also be considered in the definition
of unacceptable consequences.
4.5 Risk Assessment Approach
Standard practice in risk assessment requires one to judge the probability that a particular
accident consequence will occur. While probability assessment is the basis of routine risk
decisions, this practice is problematic for early decision-making on appropriate controls for
hazardous work. If an estimate of low probability of occurrence dominates early decision-
making, human nature and external pressures tend to minimize the use of an otherwise sensible
set of controls based on the severity of accident consequences.
Many factors contribute to this thought pattern, such as:
Often, there are little or no failure data to make a meaningful estimate of a specific
accident probability; therefore, if the accident scenario has not occurred yet or it is not in
a person’s experience base, the probability must be low.
Even when success and failure data enable a statistically valid estimate, the uncertainty
bounds or confidence limits on the estimate tend to be overlooked.
Skill of the worker or skill of craft, combined with judgments about complexity of the
work, can contribute to low probability presumptions and lack of attention to the severity
of accident consequences.
A presumption of low probability can enable the belief that the accident is more likely to
occur near the last trial than during the equally probable first trial, so “not on my watch.”
Project success, cost, and schedule pressures can influence the presumption of low
probability; the need for controls may add to these pressures.
The foregoing is not an argument for dismissing consideration of the probability of accident
scenarios in risk assessment, but rather a serious caution to avoid the natural pitfalls that can lead
to premature dismissal of the need for appropriate controls. Credible accident scenarios should
be based on credible failure-mode analyses and the professional judgment of subject matter
experts.

Fallon, NV, Environmental Safety and Health Plan | 5
A second risk-assessment caution is to avoid jumping directly to mitigating accident
consequences without first giving due consideration to controls that would prevent the accident
from happening. Prevention is the first line of defense. Mitigation is the second line of defense.
4.6 Positive Verification
Because safety is a system attribute, the elements should be kept connected not only during the
design phase, but also verifiably connected during the execution phase. Accidents frequently
occur as a result of poor communication during the execution phase, especially across
organizational interfaces. A team of people is often relied upon to assure a safe operation.
Positive verification means that team members must each affirm to the person in charge (PIC)
that their part of the system is in the state intended for safe operation. Otherwise, it should be
assumed by the person in charge that it is not safe to proceed. Positive verification is not a one-
time activity, but a concept that should be applied across the system or activity as appropriate
and performed in an iterative manner.
5 Define Scope
The purpose of defining the scope of work is to help ensure that safety concerns are adequately
considered early in the decision-making process to accept, reject, or continue work. While it is
recognized that more detailed analysis in subsequent steps might change these initial
determinations, appropriate discipline and formality is needed when making this decision.
5.1 Identify Work Planner
For work activities, a “work planner” is responsible for ensuring that all elements of this plan
have been addressed, including the evaluation factors in Sections 4.3 and 4.4 and documentation
of the evaluation in support of a FORGE management decision to accept, reject, or continue the
work. The FORGE project manager must assign and or identify a work planner. The FORGE
project manager is responsible for the quality of the work-planning effort regardless of who
performs the work planner role.
5.2 Establish a Work-Planning Team
The FORGE project manager or delegate shall establish, or assist the work planner in
establishing, an interdisciplinary team consisting of subject matter experts necessary to
competently address all elements in this plan. The initial task of the work planner and team is to
support a FORGE management decision on the scope of work.
5.3 Role of the Work Planner
The work planner, supported by an appropriate interdisciplinary team, shall address the
following factors in support of a line-management decision on scope:
Identify the hazards associated with the activity.
Determine the highest potential unmitigated-accident-consequence.
Determine if the work is within the operating envelope for the FORGE site.
Identify and complete documentation that may be necessary to perform the work.
Ensure and document that site, and equipment are in the condition to perform the work.
Confirm and document current status of personnel qualifications to perform the work.

Fallon, NV, Environmental Safety and Health Plan | 6
Ensure that cost and schedule allotted for work have taken into account all activities
associated with that work.
5.4 Decision to Accept, Reject, or Continue Work
The work planner shall document the evaluation of the key factors and shall submit the
evaluation to the FORGE project management having approval authority.
6 Analyze Hazards
6.1 Detailed Identification of Hazards
While the major hazards are identified in the Define Scope core function, the hazards may be
characterized somewhat generically or enveloped to see if they fit into facility safety and
environmental envelope. Once the decision is made to proceed with the work, the specifics of the
hazards need to be more clearly defined to support the development of a conceptual system
design or reexamination of an existing design.
6.2 Identify Safety Themes, Standards, and Codes
Once all the hazards have been identified in sufficient detail, a “safety theme” shall be developed
if there is a set of dominant hazards—for example, high pressure or electrical hazards. A safety
theme is an overarching technical strategy aimed at stimulating upfront critical thinking on the
prevention or mitigation of accident consequences. Multiple safety themes may be necessary
based on the diversity of hazards present. This does not have to be a very formal exercise. In
fact, informality with the right set of subject matter experts can be helpful in quickly setting the
best approach. Consider bringing in subject matter experts from outside the organization to
brainstorm the approach for the higher-consequence accidents.
Awareness of all standards and codes that apply to working with the particular hazards should be
part of the critical thinking that goes into the development of the safety theme(s). However, use
of standards and codes alone will not automatically make work safe. If multiple hazards are
present, there can be conflicts in applying standards and codes that can adversely affect the
safety of the activity.
6.3 Perform Formal Hazard Analysis
A failure-mode or hazard analysis shall be performed on the new or existing system design using
recognized technical standards appropriate to the task. If needed, two references that describe
graded approaches to failure-mode analysis are: 1) ANSI/ASSE Standard Z590.3, Prevention
through Design: Guidelines for Addressing Occupational Risks in Design and Redesign
Processes, and 2) the Center for Chemical Process Safety Guidelines for Hazard Evaluation
Procedures. At a minimum, the analysis methodology selected must be capable of identifying the
single-point failure modes in the system that can result in accidents having unacceptable
consequences. The term “single-point failure mode” means that it only takes that one failure for
the accident to happen, not multiple failures. Human failure can be the single-point failure and
should never be automatically dismissed due to the perceived competence of the team members.

Fallon, NV, Environmental Safety and Health Plan | 7
7 Control Hazards
While the criteria for the Analyze and Control Hazards core functions are described in a linear
fashion, in reality, the system-design process is likely to be iterative. The number of iterations
needed is likely to be a reflection of the complexity of the operation and the severity of potential
accident consequences.
7.1 Eliminate Hazards and Single-Point Failures
The first priority is to eliminate a hazard rather than attempt to control it. When this is not
feasible, the next priority is to eliminate single-point failures that can cause unacceptable
consequences. Remove as many single-point failures as reasonable and practical. The remaining
single-point failures that can cause unacceptable consequences dictate a natural priority for the
development of engineered and administrative controls. Selection of personal protective
equipment (PPE) is the last line of defense.
7.2 Apply Engineered and Administrative Controls
Engineered and administrative controls are described in broad context as follows:
Engineered controls are physical or engineered features that provide active or passive protection
to prevent or mitigate accident consequences. Traditionally, these were hardware controls;
however, software controls also play an important role in assuring safety and their role needs to
be carefully considered and evaluated.
Administrative controls are processes and procedures utilized to control any exposure and assure
appropriate safety discipline is used to conduct hazardous work. Based on potential accident
consequences, a graded approach shall be used in regard to operating procedures, critical steps in
procedures, team training and qualification, hazard analysis, readiness reviews, and so on.
It is important to focus on the desired performance characteristics of engineered controls and
their use in the system design. Robust and reliable engineered controls should be placed in series
to block accident pathways leading to unacceptable consequences. If the reliable performance of
one control is independent of another control, then the probability of both failing and realizing
the accident consequence will be greatly reduced.
Engineered Control Characteristics
Reliable The calculated or data-based reliability of the engineered control should not have
a failure rate greater than one in a thousand.
Robust The engineered control should have a significant design margin relative to its
failure point…the goal is factor of two or more.
Independent The engineered control has no common mode of failure.

Fallon, NV, Environmental Safety and Health Plan | 8
7.3 Approval of Safety Case
The safety case is a narrative explanation of how the Overarching Criteria outlined in in this
document are addressed. The safety case does not have to meet a standard of rigorous proof, nor
does it have to be long. However, the critical thinking and reasoning in regard to managing the
safety risk must be clear and include the planning for off-normal events. In addition, evidence of
technical “due diligence” should be apparent to others technically knowledgeable and reasonably
familiar with the hazardous activities involved. Supporting documentation can and should be
used to support the narrative addressing the criteria in this document.
In the end, it will always come down to a judgment as to whether the controls actually
implemented are commensurate with the safety risk.
8 Prepare and Perform Work
The scope of work includes the preparation and troubleshooting phases of the activity. Accidents
frequently occur during these phases but they are often overlooked during the planning phase.
8.1 Complete Technical Work Document
A technical work document (TWD) is a formally approved document that identifies activity-level
work hazards along with their associated work-control measures and communicates them to the
team—generally a “how to” document. TWDs clearly specify the work to be accomplished,
expected outcome, and critical steps necessary for successful and safe completion of the activity.
A critical step is a procedural step, series of steps or action that, if performed improperly, will
significantly affect the safety of an activity. Preapproved TWDs associated with controlling
specific hazards common to FORGE activities can be used if appropriate to the scope of the
hazardous activity. Development of unique TWDs will usually begin in earlier phases when the
system design is mature enough to make it worthwhile; however, TWDs shall be made final and
placed under formal change control before the hazards are first introduced, even if the system is
in set-up, shakedown, or troubleshooting mode.
Example Content of TWDs:
Establish work scope boundaries or limits
Identify hazards—highlight critical steps/controls
Identify who is authorized to perform critical steps
Provide sufficient step-by-step details
Plan for anomalies and off-normal events
Identify special requirements
8.2 Perform Job Safety Analysis
A job safety analysis (JSA) or equivalent should be performed in association with the
development of TWDs and before the work is performed.

Fallon, NV, Environmental Safety and Health Plan | 9
8.3 Confirm Team Training and Qualification
While the identification of key positions associated with performing safety-critical steps would
naturally occur earlier in the development of the system design, it is necessary to confirm and
document that the personnel who will actually be performing these tasks have completed the
necessary training before authorizing the work to begin. In some cases, there may be a formal
qualification requirement that needs to be met.
8.4 Conduct Readiness Reviews or Assessments
Formal readiness reviews or assessments shall be performed. If there are pre-start corrective
actions from the readiness reviews or assessments, these actions must be completed.
8.5 Decision to Authorize Work
Before work begins, FORGE management shall formally authorize the work and shall describe
any limiting conditions placed on that authorization. FORGE management should ensure that the
required PPE is provided and that personnel access is controlled when the hazards are present.
8.6 Perform Work
After appropriate authorization has been received, the FORGE management is responsible for
controlling the day-to-day work. This responsibility may be formally delegated to a PIC who is
properly trained or qualified to perform the function. FORGE management or the delegated PIC
shall do the following:
Conduct a pre-job briefing prior to initial start-up of the work and repeat at appropriate
intervals depending on the nature and frequency of the work.
Use a “positive verification” approach to ensure that all elements of the interconnected
system are as intended for performing the work.
Define a periodic monitoring scheme using positive verification techniques
Prepare for and manage emergencies
Manage accountability for operational modes of facilities
Implement conduct of operations
9 Feedback and Improvement
A feedback and improvement process must be applied to all work performed in order to achieve
the following:
Identify and correct processes or deviations that lead to unsafe or undesired work
outcomes
Evaluate and mitigate risks associated with work processes
Provide FORGE management and team members with information to improve the quality
and safety of subsequent similar work

Fallon, NV, Environmental Safety and Health Plan | 10
Attachment A: Emergency Response Plan
1 PROJECT ORGANIZATION AND RESPONSIBILITIES
The personnel and organizations assigned to FORGE.
FORGE Personnel/Responsible personnel
Doug Blankenship/Project Manager
Office: 505-284-1230
Cell: 505-554-0956
Email: [email protected]
Andrew Tiedeman/Work Planner
Office: 775-426-3605
Email: [email protected]
John Akerley/Ormat POC
Office:
Email: [email protected]
Michael Lazaro/alternate Work Planner
Office: 760-939-0146
Email: [email protected]
Kelly Blake/alternate Work Planner
Office: 760-939-4056
Email: [email protected]

Fallon, NV, Environmental Safety and Health Plan | 11
2 EMERGENCY RESPONSE TELEPHONE NUMBERS
A list of Emergency Response Phone Numbers shall be posted in the following locations:
All Work Planners Offices
NAS Fallon Security
Fallon FORGE office, trailers, etc.
Navy Geothermal Program Office
Work Planner will be the initial point of contact for all emergencies.
Contact Phone Number
Medical, Fire, Rescue
Any time
911
NAS Fallon
Any time
Police: 775-426-2803 Fire: 775-426-3411 Geothermal Program Office: Andy Tiedeman, o. 775-426-3605, c. 360-990-4881
Churchill County’s Sheriff’s Department
Any time
775-423-3116 or 911
Hospitals Banner Churchill Community Hospital: 775-423-3151
Saint Mary’s Regional Medical Center: 775-770-3000
Renown Regional Medical Center: 775-982-4100
Fallon FORGE Team members
Project Manager, Doug Blankenship, c. 505-554-0956
Work Planner (ES&H), Andy Tiedeman, o. 775-426-3605, c. 360-990-4881
Navy Alternate POC, Michael Lazaro, o. 760-939-0146, c. 805-651-9256
Navy Alternate POC, Dave Meade, o. 760-939-4057, c. 760-382-7705
Navy Alternate POC, Andrew Sabin, 760-939-4061, c. 719-373-3531
Navy Alternate POC, Kelly Blake, o. 760-939-4056, c. 845-781-6685
3 STATEMENT OF PURPOSE
The Emergency Response Plan covers procedures to be implemented in the event of an
emergency at the Fallon FORGE Project site.

Fallon, NV, Environmental Safety and Health Plan | 12
4 SCOPE
This procedure applies to all Fallon team members, contractors, and visitors.
5 RESPONSIBILITIES
The Work Planner will be the initial point of contact for all emergencies.
Site Management shall be responsible for;
The implementation and enforcement of this Plan at the Fallon project site;
Monitoring compliance with this plan by Fallon FORGE team members, and contractors
working at the Fallon FORGE Project;
Being involved in every emergency;
Determining if or when it is necessary to involve outside specialist, such as the Fire Department
or other emergency personnel;
Designating personnel to be trained and certified in First Aid and CPR and ensuring such
training is provided as required by the certifying agency;
Ensuring all employees who may respond to an emergency will be involved in one drill or
exercise per year.
Ensuring all personnel are informed of the requirements of this Plan and comply with its
requirements; and Maintaining all documents and records as required by this Plan for inspection
by:
Fallon FORGE personnel;
Navy personnel;
Regulatory and governmental agency representatives.
The Fallon FORGE team, contractors, and visitors shall be responsible for:
Following all directives and procedures associated with this plan.
6 PLAN LOCATION
Emergency Response Plans are located in the following locations:
On site - TBD
Location for Outside Emergency Responders

Fallon, NV, Environmental Safety and Health Plan | 13
7 PRIORITIES
People ALWAYS come first! Always protect employees first, regardless of the situation.
Priority number 1- Protecting our employees
Priority number 2- Protecting the environment
Priority number 4- Maintaining applicable compliances
Priority number 3- Protecting Operations
8 STATEMENT OF SAFETY AND HEALTH POLICY NAS Fallon FORGE project members shall institute and administer a comprehensive and
continuous Environmental Safety and Health Plan during all FORGE related activities. Fallon
FORGE members hold environmental safety and health as a first priority and are committed to
providing a safe and healthful workplace for all involved. The health and safety of an individual
employee, contractor, or third party takes precedence over all other concerns. In support of this
commitment to environmental safety and health, NAS Fallon FORGE will provide measures to
control workplace hazards on the site of the project through communications, periodic
inspections, incident investigation, mitigation, compliance audits and personnel training. It is
NAS Fallon FORGE’s intent that all activities will follow the Safety and Health Requirements
Manual EM-385-1-1; 15 JUL 14, and that the Manual serve as the guideline for the plan and its
implementation. Furthermore, health and safety shall be interwoven into every phase of the
project. All personnel shall observe the policies and procedures of each program. Each
supervisor shall be held responsible for the safety performance of everyone involved under their
supervision. Moreover, management shall assume ultimate responsibility for the implementation
of this environmental safety and health plan for each activity of the project. The goal is to
achieve a zero accident record, remain a good steward to the environment and provide an overall
healthy work environment.
9 FALLON FORGE EM 385-1-1 SAFETY PLAN GUIDELINES For all FORGE related activities, a safety plan following the US Army Corps of Engineers EM-
385-1-1; 15 JUL 14 Safety and Health Requirements Manual must be submitted and approved by the local or regional Safety Manager prior to any site specific activity moving forward. (See Appendix A attached). Following this requirement identifies and analyzes safety risks for existing and potential hazards or unsafe conditions associated with FORGE activities. In addition, the approved plan shall be available on each work site.
10 TRAINING
All NAS Fallon FORGE members, construction superintendents/foremen, environmental
managers, on-site project leads and quality control personnel must complete ECATTS training
prior to any work being performed on all Navy land positions.
(<https://environmentaltraining.ecatts.com/)

Fallon, NV, Environmental Safety and Health Plan | 14
Additionally, depending on the activity (i.e. drilling, crane operation, OSHA),
personnel/operators must be certified as applicable with state, county and regional requirements.
All training and certifications must be up to date and provided upon request.
11 PROTECTION OF THE ENVIRONMENT
All Fallon FORGE and contractor personnel will be informed of the Fallon FORGE policy
regarding undue degradation of the environment. These measures are intended to prevent all
unacceptable impacts from occurring as a result of operations.
A. Fire Prevention
The sites and access roads will be cleared of all vegetation when necessary depending on
activity. The cleared areas will be maintained during any applicable operations. Fire
extinguishers will be available on the site. Water that is available for use during some activities
will also be available for firefighting.
Personnel will be allowed to smoke only in designated areas. Any special permits required for
fires, welding, and etc., will be obtained.
B. Prevention of Soil Erosion
Minimal soil erosion problems are anticipated from this project. In addition, runoff will be
channeled to energy dissipaters to minimize erosion when applicable.
C. Surface and Ground Water Quality Protection
The location of the operations/activities has yet to be selected, but future efforts to minimize the
potential for surface water pollution from runoff during operations, drilling, measuring or other
related activities.
Surface water and ground water pollution from drilling and testing will be prevented by steel
casing cemented to below these zones.
Only non-toxic, non-hazardous drilling mud constituents will be utilized during drilling
operations. Waste drilling mud, drill cuttings, and any runoff from the well site will be
discharged into the containment basin to prevent ground water quality degradation.
Any potential well will be cased and cemented to prevent interzonal migrations of fluids and
reduce the possibility of blowouts. Based on the water levels observed at existing wells, no over-
pressured or gas-rich zones are expected to be encountered.
D. Air Quality Protection
Fugitive dust generation during operations and use of access roads and well site will be
minimized by watering as necessary.
E. Prevention of Noise
To abate noise pollution, mufflers will be utilized on engine-driven equipment when necessary.

Fallon, NV, Environmental Safety and Health Plan | 15
F. Protection of Public Health and Safety
In addition to the emergency contingency plans (See Emergency Response Procedures), public
health and safety will be protected through instructions to work crews and contractors regarding
compliance with regulations.
G. Protection of Fish, Wildlife, and Botanical Resources
Direct impacts to wildlife habitat and botanical resources will be minimized. Fish habitats will be
protected through prevention of erosion.
H. Protection of Cultural Resources
Field survey for cultural resources will been performed and avoidance measures taken for all
potential field operations.
I. Waste Disposal
Solid waste materials (trash) will be deposited at an authorized dump by a disposal contractor.
Portable chemical sanitary facilities will be used by all personnel. These facilities will be
maintained by a local contractor.
J. Environmental Monitoring
A qualified cultural resource monitor may be on site for all operation activities. In addition,
regular routine visual inspections of the project area and access roads will be conducted by the
on-site operational personnel to quickly detect and correct any operational problems that could
lead to environmental problems. Environmental specialists will monitor and inspect the
operations, if necessary, during the course of the project.
12 EMERGENCY RESPONSE PROCEDURES
12.1 Organization
The procedures are organized and administered by the Fallon FORGE Team. The goal is to have
an appropriate number of rescuers on site at all times.
12.2 Emergency Communications
Call 911
If a transport is necessary, provide emergency response directions to project area.
1. The caller is to provide the 911 operator with all the necessary information, and
communicate that we will have an employee standing by at the entrance for escort
purposes.
2. The caller should remain in contact with the in-route ambulance crew until they have
arrived on scene.

Fallon, NV, Environmental Safety and Health Plan | 16
13 ACCIDENTS AND INJURIES
13.1 First Response
Whenever personnel are injured pre-determined contact shall be notified immediately.
All personnel should become familiar with the location of first aid kits and AED’s at the project.
13.2 MEDICAL EMERGENCY PROCEDURES
Survey the scene-Ensure the safety of the first responder;
Primary Survey-Survey the injured person(s) by checking the ABC’s-Airway, Breathing, and
Circulation. If not breathing start rescue breaths. If no pulse, start CPR, AED.
Secondary Survey – Take vital signs and do a head to toe exam.
Check for bleeding – If a person is bleeding, apply direct pressure and bandage. If the injury
continues to bleed, elevate the wound. If still bleeding apply pressure to the closest pressure
point to the wound.
Treat injuries
13.3 Medical Emergencies
1. Treat for Shock- When a person shows any signs of shock, maintain body temperature,
and monitor vitals. All employees showing signs of shock will be seen by a physician
prior to returning to work.
2. Transport – If the decision is made to transport the person, notify 911 for the ambulance.
Secure the patient on the gurney and administer oxygen.
3. Air Ambulance – In the event an air ambulance is needed:
a. First ensure that the injury or illness meets the criteria for an airlift.
i. Air ambulance is a very limited commodity that is only to be used when:
1. A life threatening condition exists; and
2. When the reduction in overall transport time is expected to have an
impact on the patient’s outcome.
3. If you cannot save a minimum of 15 minutes over an ambulance
trip time, it is not necessary to request an air ambulance.
b. Make the request when calling 9-911. Communicate to them where the landing
point is located. Always have the ground unit respond with the air unit in case the
air unit runs into problems.
c. Never approach the helicopter when it lands. The crew will come out to meet you.

Fallon, NV, Environmental Safety and Health Plan | 17
13.4 Post Incident Procedures
After every emergency response the team will hold an evaluation session to go over the events to
ensure that any problems that arise will be addressed and covered in the future. If the emergency
involves death or serious trauma that could cause the responder emotional trauma, a debriefing
or crisis management session will be held.
14 BLOWOUTS AND WELL DAMAGE
The appropriate professional in charge will take the following steps for any wellhead blowout.
These steps are only a recommendation. The exact response will depend on the severity of the
blowout condition.
14.1 Initial Response
1. Notify Project Manager;
2. Evacuate and provide care for any injured personnel;
3. Evaluate the extent of the damage and initiate the appropriate control measures with any
emergency response agency or Fallon FORGE management, if possible;
4. Secure and maintain control of the access road to eliminate unauthorized personnel;
5. Mobilize earth-moving equipment to channel the flow of fluids into a sump or other
containment area. Mobilize portable pumps to transfer fluids collected during the blowout
or damaged wellhead;
14.2 Initiate Control and Containment Plans
1. Kill the well consistent with safe operating practices prior to starting any repair work;
2. Take steps to expose the damaged portion of the well;
3. Repair the damaged area or replace the wells casing and or wellhead;
4. Inspect the surrounding areas for any erosion that occurred to the sump, pad, roads or
other areas in the well field.
5. If the well cannot be contained, the manager shall initiate a program to kill, plug and
abandon the well;
6. If there is a definite threat to human life, the manager will secure the area and make
arrangements for outside contractors to secure the well.
7. Written reports and cleanup efforts associated with the incident will be a joint effort
between Fallon team members and the Work Planner.

Fallon, NV, Environmental Safety and Health Plan | 18
15 EARTHQUAKES
15.1 Earthquake Preparedness
All team members shall be trained in the earthquake procedure and evacuation plan;
The escape routes shall be posted in all work sites; and
Safety meetings shall be held on earthquake preparedness.
15.1.1 ACTION - ONSET OF AN EARTHQUAKE
If inside a building, DROP to the floor, take COVER by getting under or next to a sturdy desk
or table, and HOLD ON to it until the shaking stops.
If outside, find an area clear of falling objects and DROP to the ground;
Remain where you are until all movement has stopped.
15.1.2 ACTION - ONCE THE EARTHQUAKE STOPS
Report to your designated check point;
Attend to any injured personnel, but Do Not Move them unless they are in an unsafe area;
Call 911 if emergency assistance is required.
Be aware that there may be aftershocks that may be large enough to do additional damage.
15.1.3 ACTION – AFTER ALL TEAM MEMBERS/CONTRACTORS ARE ACCOUNTED FOR
Management or a designee will evaluate the extent of the damage and make the decision of
whether or not to evacuate the facility.
Check water and electrical lines, buildings, pipelines, cooling towers, and tanks for damage.
Barricade downed power lines, if applicable.
If evacuation is necessary, the work planner will give directions for the escape route to be used.
The work planner will contact appropriate management and provide a status report.
15.1.4 ACTION – IF EVACUATION IS ORDERED
The project manager is responsible for making sure everyone is evacuated. He/she may designate
this job to other personnel.
If transportation is a problem, the project manager will notify additional resources for assistance.
If injures personnel require special transportation, the project manager will make the necessary
arrangements. All personnel will meet at the designated muster point upon evacuation of the
facility. All employees must check in in with the manager upon arrival.
If anyone is missing, the project manager is to be notified immediately so they can dispatch
rescue personnel.

Fallon, NV, Environmental Safety and Health Plan | 19
Once all personnel have been accounted for, the management will determine the personnel who
must stay and who can leave the area.
16 EXPLOSIONS
An explosion is a sudden release of energy. The released energy may have originated from an
exothermic chemical reaction or may have contained stored energy in the form of compressed
air, steam, or high pressure liquid. Damage may result in shock wave radiating from the
explosion or by flying debris.
16.1 Action - After the Explosion
Report to your designated check in station. If any personnel are missing, a search will be made to
determine his/her location and condition, when it is safe to do so;
Attend to any injuries, but Do Not Move injured persons unless they are in an unsafe area;
16.2 Action - After All Team Members/Contractors Are Accounted For
The Work Planner will evaluate the extent of the damage and make the decision to evacuate the
project.
The Work Planner will notify senior management of the incident and status of the project.
The Work Planner will station an employee at the projects entrance to direct incoming
emergency equipment to the incident site.
If evacuation is necessary the Work Planner will give direction for the evacuation route.
17 FIRES
17.1 Action – Onset of Fire
Any person who discovers smells or sees smoke and believes there is a fire will immediately take
the following actions:
1. Contact the Work Planner.
2. Verbally pass the word. Be sure to notify anyone in immediate area.
The onsite Work Planner will ensure the following actions take place:
1. Control vehicular traffic into, from and about the fire scene.
2. Keep spectators at a safe distance from the fire scene.
3. Establish a watch at the fire site to prevent unauthorized access pending completion of an
investigation.

Fallon, NV, Environmental Safety and Health Plan | 20
17.2 Action - After the Onset of Fire
Report to your designated check in station. If any personnel are missing, a search will be made to
determine his/her location and condition, when it is safe to do so;
Attend to any injuries, but Do Not Move injured persons unless they are in an unsafe area;
The control room will be used by the IC to receive calls/reports of injuries;
Call the Navy 2 control room to report the fire and for emergency assistance.
17.3 Action - After All Employees/Contractors Are Accounted For
The Work Planner will evaluate the extent of the damage and make the decision to evacuate the
project.
The Work Planner will notify senior management of the incident and status of the project.
The Work Planner will station an employee at the projects entrance to direct incoming
emergency equipment to the incident site.
If evacuation is necessary the Work Planner will give direction for the evacuation route.
18 HYDROGEN SULFIDE HAZARDS
The Coso Operating Company H2S Program is designed to address the risk of H2S exposure for
employees, contractors and visitors. The goal of the program is to deploy safety precautions on
an “as needed” basis recognizing that not all areas of the project represent the same degree of
H2S risk. The two key safety precautions are personal H2S monitors and fixed monitors.
In the event that an employee, contractor or visitor breathes in a large amount of H2S, and you
can safely access them, move the person to fresh air at once. If the atmosphere is not safe, do not
attempt to rescue by holding your breath. If they went down, so will you.
Notify the Navy 2 Control room Operator to dispatch the ER Team.
Primary Survey - Survey the injured person(s) by checking the ABC’s-Airway, Breathing, and
Circulation. If not breathing start rescue breaths. If no pulse, start CPR, AED.
Transport – If the decision is made to transport the person, call the Navy 2 CR Operator to
notify 911 for the ambulance.
The IC will station an employee at the projects entrance to direct incoming emergency
equipment to the incident site.
19 LIGHTNING
19.1 Action-At Onset of a Lightning Storm
If you are inside stay inside. Avoid contact with metallic objects. Stay clear of electric power
sources.

Fallon, NV, Environmental Safety and Health Plan | 21
If outside find shelter. Stay clear of all pipelines, tanks, wellheads and other equipment. Try to
get to a building or a vehicle.
Be prepared to extinguish small fires.
20 SPILLS AND DISCHARGES
Although the detailed procedures will vary depending of the location and severity of the spill, in
all situations the team member or Contractor who discovers the spill shall report it as described
below. All reported spills must have an “Accidental Spill/Discharge Notification Form” filled
out. The Contractor or his designee should fill out section 1 of the form. Section 2 will be filled
out by the Public Works(PW) Environmental Department or his/her designee.
Brine Spills – Brine, condensate or any geothermal fluid release of 300 gallons or more must be
reported to PW environmental immediately. If the release occurs after normal business hours,
contact the Work Planner at home (See phone list on page 4 of this Plan). Releases of less than
300 gallons must be reported by the next business day.
Hazardous Materials Spills - Hazardous materials releases of more than 5 gallons must be
reported immediately to Work Planner and PW Environmental. Releases of less than 5 gallons
must be reported to the EC the next business day during normal office hours.
Never attempt to clean up the released material unless you have received specific HAZWOPER
training. Isolate the area if it can be done safely with barrier tape or other barrier devices. Call
the PW Environmental for further instructions if problems develop during the isolation of the
area.
21 POST INCIDENT PROCEDURE
After every emergency response management will hold an evaluation session to go over events
to ensure that any problems that arise will be covered and addressed. If the emergency involves a
death or serious trauma that could cause the first responders emotional trauma, a debriefing and a
crisis management session will be held.
21.1 Bodily Injuries Such as Breaks and Sprains
1. All of these injuries are treated the same way. If the person is to be moved, it is necessary
to immobilize the injured area above and below the wound. If the injury is minor, apply
ice and elevate to allow swelling to subside. If a back injury occurs, the employee will be
seen by a physician before returning to work.
2. Burns
a. First aid for thermal burns is to cool with water and wrap in damp gauze. For a
chemical burn, continue to flush for 10-20 minutes.
b. Full thickness burns (Third degree) should be wrapped in dry sterile gauze.

Fallon, NV, Environmental Safety and Health Plan | 22
c. Depending on the percentage of the body burned and the severity of the burn,
treat for shock, monitor vital signs and transport.
d. If the burn is an electrical burn, the major concern is breathing and heartbeat.
Begin first aid for breathing and heart emergencies. All persons involved in
electrical related injuries will be seen by a physician before returning to work.
3. Insect Bites
a. Ask the person if they are allergic;
b. If they respond affirmatively, and they are allergic, assist them in administering
their medication, if available.
c. If an allergic reaction starts, transport immediately.
d. If the person is not allergic, if applicable, remove the stinger by scraping it off.
Lower the sting area below the heart.
e. Apply an ice pack wrapped in a protective barrier to prevent skin damage.
4. Eye Injuries
a. For small foreign bodies, encourage the person to blink, then flush impacted eye
with sterile eyewash solution.
b. For chemical injuries, flush with sterile eyewash solution for 10-20 minutes.
c. All employees with eye injuries will be seen by a physician before returning to
work.
5. Deceleration Injuries
a. Any time a person’s body comes to an abrupt stop or is accelerated by force, full
spinal immobilization is required. To achieve this one person will hold the head
in the inline stabilization position and maintain until the cervical collar is in
position and secured, the person is strapped to the backboard and the head
restraints are secured.
b. If the person is in full cardiac arrest, CPR is the priority.
c. Ensure the person is on their back on a hard surface. Do your best to minimize
movement of the spine.
d. Use the chin lift or jaw thrust method for opening the airway.
6. Vehicle Incidents
a. Vehicle incidents are to be approached with caution. Be sure the scene is safe. If
the vehicle is unstable, do what is needed to stabilize it first, before attempting a
rescue.

Fallon, NV, Environmental Safety and Health Plan | 23
b. Once you are able to reach the injured person, begin inline stabilization and
maintain it until total spinal immobilization has been achieved. Do a
secondary survey, start oxygen, and transport.
22 TRAINING
22.1 Requirements
Employees will receive training on this plan, the emergency response procedures, and their
responsibilities under this plan, upon commencing employment with the company, whenever the
plan is updated, or if the employee’s responsibilities or designated actions under this plan are
altered.
First responders will be re-certified every two years in basic First Aid/CPR/AED.
Each employee that may respond to an emergency will be involved in one drill or exercise per
year. Participation in an actual rescue or emergency counts towards the one drill per year
requirement.
Employees will receive HAZMAT training on the Awareness level. This will allow them to
identify that a hazardous material incident has occurred and how to report the incident.
With this HAZMAT training, they will be able to recognize what the hazard is, know how to
read the DOT Hazardous Materials handbook, how to read an SDS, learn when a rescue can be
attempted and when it is not feasible, the proper use of PPE, and who to call when an incident
occurs.
This training is not to be used for clean-up of hazardous spills.
23 INSPECTION AND OBSERVATION OF THIS PLAN
All Fallon FORGE team members and contractors with the training and capacity to identify
violations or unauthorized deviations to this Plan that put at risk the health and safety of people
shall report any such incident to facilitate immediate corrective action and/or investigation in
accordance with the following notification priority list:
Immediate supervisor of the person involved;
The Work Planner; and
Fallon FORGE Environment, Health and Safety Lead, and;
All Fallon FORGE team members determined to have committed an intentional violation of this
Plan, following an investigation, may be subject to disciplinary action up to and dismissal from
the team.

Fallon, NV, Environmental Safety and Health Plan | 24
24 DANGEROUS VIOLATION OF SAFETY POLICY OR PROCEDURE
It is expected that most team members and contractors of the Fallon FORGE site are very good
at following safety policies and procedures; however, an occasion may arise where an individual
commits a serious safety violation, or refuses to follow necessary safety procedures. There are
several situations where intervention would be required. Use the following process if this should
occur:
Is there a general, but not an immediate threat to the individual’s safety? If so, notify the
employee or contractor. If the employee does not respond to the warning notify the Work
Planner.
Is there an immediate and serious life threatening situation? Immediately intervene to stop the
unsafe act, if possible, and then notify the Supervisor/ Manager;
If others are at risk, warn them to evacuate the area, if necessary;
Notify the Work Planner of the threat and take immediate action if it is required.

Fallon, NV, Environmental Safety and Health Plan | 25
Attachment B
Emergency Evacuation Response Plan
Potential on-site emergencies are expected to be restricted to injuries to site personnel. On-site
conditions are expected to be within the limits of measures, which can be taken by on-site
personnel. During any on-site emergency, work activities will cease until the emergency is
brought under control.
Address locations to nearby medical centers are attached at the back of this plan (see
Attachments A, B, and C). The emergency contacts will be kept in each field vehicle. A list of
the emergency telephone numbers is included in this Plan. All personnel working on site will be
informed of these numbers and emergency routes, and will also be informed of evacuation
routes, meeting places, and evacuation warning signals in case of the need for an evacuation. All
field personnel will have cellular telephones.
Emergency Contact Phone Numbers
Name/Place Telephone Number
NAS Fallon – Andrew Tiedeman/GPO 775-426-3605
Emergency Response: Fire, Ambulance 911
Banner Churchill Community Hospital 775-423-3151
Saint Mary’s Regional Medical Center 775-770-3000
Renown Regional Medical Center 775-982-4100
Banner Churchill Community Hospital 801 E Williams Ave Fallon, NV 89406
Saint Mary’s Regional Medical Center 235 W 6th St Reno, NV 89503 Renown Regional Medical Center 1155 Mill St. Reno, NV 89502
Fallon, NV, Environmental Safety and Health Plan | 26
Banner Churchill Community Hospital 801 E Williams Ave Fallon, NV 8940

Fallon, NV, Environmental Safety and Health Plan | 27
Saint Mary’s Regional Medical Center 235 W 6th St Reno, NV 89503

Fallon, NV, Environmental Safety and Health Plan | 28
Renown Regional Medical Center 1155 Mill St. Reno, NV 89502

1-L
APPENDIX L. RESEARCH AND DEVELOPMENT IMPLEMENTATION PLAN


NAS Fallon FORGE Research and Development Implementation Plan | 1
INTRODUCTION
This Research and Development (R&D) Implementation Plan provides the technical vision of the
Fallon FORGE team and describes how that vision aligns with the goals of the U.S. Department
of Energy (DOE). The plan describes the approach for managing the Fallon, NV, project site
and the approach to managing the details associated with the selection and execution of
competitively funded R&D.
The plan details the Fallon FORGE Team’s commitment to manage and coordinate all logistical,
administrative, analytical, and technical support for the planning, solicitation, review, and
selection of technologies to be tested and evaluated at the FORGE site. The team will implement
formal procedures to ensure that technologies selected for testing and evaluation directly support
the objectives of DOE’s Geothermal Technologies Office (GTO). These procedures will ensure
a fair, logical, and competitive technology procurement process consistent with DOE and Federal
guidelines and regulations. (Such procurement regulations are currently followed by the Prime
Recipient, Sandia National Laboratories.) The R&D plan outlines recurring cycles for planning,
review, and selection of FORGE-related technologies for testing and evaluation. The proposed
management structure for the Fallon FORGE site will ensure close collaboration with the
proposed site management team and provide a process for establishing and maintaining technical
expert teams (e.g., STAT membership) to meet the project’s objectives and evolving technical
needs. This process of expert engagement will address management of conflicts of interest for
participating members.
TECHNICAL VISION FOR FORGE AND ALIGNMENT WITH DOE GOALS
EGS: FROM CONCEPT TO COMMERCIALIZATION
The vision for FORGE is a dedicated Enhanced Geothermal Systems (EGS) field laboratory and
a complementary R&D program that focuses on the science and technology necessary to bring
the EGS concept to fruition and ultimately lead to commercialization. The Fallon FORGE team
envisions that FORGE will result in a rigorous and reproducible methodology that will enable
development of on the order of 100+ GWe of cost-competitive EGS power, thus supporting the
U.S. efforts to reduce our dependency on fossil fuels and safeguard the nation’s military
readiness, through collaboration with the U.S. Navy. Successful development of EGS requires a
thorough and fundamental understanding of how to enhance and maintain subsurface
permeability via fluid injection, thermal rock-fluid interaction, chemical stimulation, or other
well-engineered stimulation processes that re-open pre-existing fractures and/or create new ones.
OVERCOMING TECHNICAL BARRIERS
However, many technical barriers to commercialization have been identified. We need a multi-
pronged approach to address these barriers, starting with a thorough understanding of techniques
to effectively stimulate fractures in different rock types. We also need to develop techniques
capable of imaging permeability enhancement and evolution from the reservoir scale to the

NAS Fallon FORGE Research and Development Implementation Plan | 2
resolution of individual fractures; effective zonal isolation for multistage stimulations;
directional drilling/stimulation technologies for non-vertical well configurations; and long-term
reservoir sustainability and management techniques.
It is our team’s goal to manage FORGE as a dedicated site where the eligible subsurface
scientific and engineering community to develop, test, and improve new technologies and
techniques in an ideal EGS environment that will address the barriers to commercialization. The
FORGE site will allow the geothermal and other subsurface communities to gain a fundamental
understanding of the key mechanisms controlling EGS success, in particular how to initiate and
sustain fracture networks in the spectrum of basement rock formations using different
stimulation technologies and techniques. This critical knowledge will be used to design and test
a methodology for developing large-scale, economically sustainable heat exchange systems,
thereby paving the way for a rigorous and reproducible approach that will reduce industry
development risk. Essential to this process is a comprehensive instrumentation and data
collection effort that will capture a higher-fidelity picture of EGS creation and evolution
processes than any prior demonstration in the world. Finally, a dedicated FORGE allows for the
highly integrated comparison of technologies and tools in a controlled and well-characterized
environment, as well as the rapid dissemination of technical data to the research community,
developers, and other interested parties.
DEDICATED FIELD LABORATORY
As a field laboratory for EGS research, additional site characterization to complement the Phase
1 efforts will be emphasized and conducted at the earliest opportunity (all in compliance with
applicable permits) to further the understanding of the subsurface at the Fallon site. While the
latter part of Phase 2 is designated for full site characterization, these activities will not
artificially stop at the commencement of full FORGE operations in Phase 3. Refinement of the
geological model will continue throughout the project as a result of continued site development
activities and FORGE supported R&D efforts. While FORGE will be well characterized before
full site implementation begins the geologic model will evolve throughout the project.
Previous EGS efforts have commonly been hampered because of limitations in site monitoring
data. Throughout the operation of FORGE, the site will be continuously monitored, employing
not only additions to the established seismic monitoring network but other relevant technologies
as well, such as borehole strain and tilt meters, microgravity, electromagnetic sensors, downhole
fluid pressure sensors and geochemical tracers. Particular emphasis will be made to ensure that
the volumetric coverage of the site is optimized to provide the microseismic and other data
needed to ensure a detailed understanding of the EGS stimulation efforts planned in Phase 3.
This will include continued integration of site characterization, refinement of the velocity model
of the site, as well as full areal and deep vertical coverage of the expected volume of stimulation.
Permanent monitoring holes that will be constructed during the development of the site will be
complemented with the construction of similar monitoring “holes of opportunity” to
accommodate additional FORGE stimulation monitoring and associated FORGE R&D efforts.
During the later portion of Phase 2 and throughout Phase 3 Multiple thermo-hydro-mechanical-
chemical modeling tools will be used in concert with field and laboratory data from site
characterization, downhole measurements/sampling and stimulation monitoring to make testable
predictions of reservoir performance and inform decisions related to additional stimulation

NAS Fallon FORGE Research and Development Implementation Plan | 3
operations and long-term flow testing. As with all Phase 3 activities, evolving requirements for
stimulation monitoring, modeling and additional stimulations will be carried out through a
combination of activities conducted by the broader Fallon FORGE Team and by scientists and
engineers selected through the competitive Phase 3 R&D solicitations.
LOOKING AHEAD TO PHASE 3
Full implementation of FORGE begins in Phase 3. Our team envisions at least two, and
probably more, full-sized wells for EGS stimulation. The geologic environment will determine
well placement and orientations. Wells for EGS stimulation will be drilled using advanced
directional drilling technologies to most effectively exploit pre-existing geologic structures and
the in-situ stress and rock hydrologic and geomechanical properties to create a pervasive,
interconnected fracture network optimal for efficient and sustained geothermal heat extraction
under low-pressure injection and production. Specific well designs will be developed as site
characterization activities advance and defendable modeling efforts are completed in the latter
part of Phase 2. These wells will be subjected to multiple stimulation technologies applied at
multiple positions along the wellbore, followed by flow, tracer and other testing to quantify
improvements in well connectivity and to evaluate the performance of the heat exchanger so
created.
In addition to the drilling needed to develop and monitor the planned EGS circulation system,
drilling to support defined monitoring needs and testing of innovative technologies (through the
competitive R&D process) will be needed and implemented during the course of the project.
The number of such wells and proximity to the primary EGS circulation test site will depend on
the evolving need to support community R&D. For example, drilling required for an innovative
monitoring technology will be performed in an area to accommodate the monitoring
requirements. Wells will be developed for testing of technologies that could cause normally
eschewed well damage or impact the primary circulation system or required monitoring if not
vetted first. To the extent possible, all drilling will be performed using advanced drilling
efficiency monitoring and advisory systems (such and monitoring and use of mechanical specific
energy guide the drilling process) to advance these principles in the geothermal community and
to reduce the cost of FORGE operations. Additionally, new and advanced drilling technologies
will be afforded a location to test such systems while also supporting the need to develop an
unprecedented level of subsurface access that FORGE requires.
ADDRESSING EGS PERFORMANCE
While EGS development efforts have implemented methods to stimulate multiple zones of an
existing wellbore (e.g., Cladouhos, et. al., 2015) critical technical and commercial limitations to
EGS development remain. As illustrated by Doe, et.al. (2014), the inherent heterogeneity and
fracture network complexity in natural systems concentrate flow in reduced portions of the
available fracture system and tend to degrade EGS performance. In general, these observations
have shown that it is vital to the success of EGS to have the capability to selectively and
independently stimulate, inject, and produce along the intended production and injection sections
of EGS wells. While R&D solicitations directed toward FORGE efforts to advance EGS
technology will be developed in concert with the Science and Technology Analysis Team
(STAT) and DOE, the Fallon FORGE Team envisions that efforts will be directed to address this
critical need for selectively controlling zones of injection and production along respective

NAS Fallon FORGE Research and Development Implementation Plan | 4
wellbores. Technology to isolate sections of wells and actively control flow from isolated zones
exist today for the oil and gas industry but similar technologies do not exist for geothermal
applications. Existing systems provided by service companies such as Schlumberger and
Halliburton are plagued by operating temperature limitations and wellbore and tubing diameters
that cannot be accommodated today. While it is envisioned that R&D solicitations will address
exploration, development, operation, and monitoring for EGS development, the ability to control
injection and production along EGS wells is believed to be critical and development and fielding
of this capability must be central to the FORGE vision.i
R&D PORTFOLIO
At least 50% of annual Phase 3 FORGE funding will be directed toward competitive R&D
solicitations, exclusive of funds dedicated to innovative drilling and flow testing. Competitive
solicitations will be issued annually, which will require a robust institutional procurement
system. This will result in a broad portfolio of R&D activities in support of FORGE, involving
multiple research organizations (e.g., government research labs, universities, and private
companies) within the broader national and international community. It is also expected that
FORGE will be an international centerpiece of the subsurface research community and will
complement the current SubTER initiative at DOE; thus, researchers not directly connected to
EGS efforts will also have the opportunity to engage in FORGE-related research that can
advance EGS. The operation of FORGE during Phase 3 will require thoughtful and purposeful
integration of all activities, both at the field site and in laboratories and research institutions
around the world involved in EGS research. Such coordination will require regular meetings of
FORGE participants, organized by the Fallon FORGE Team, to discuss recent results and
develop future plans and proposals for FORGE-related science and engineering.
MANAGING AND COORDINATING LOGISTICAL, ADMINISTRATIVE, ANALYTICAL
AND TECHNICAL SUPPORT
MANAGEMENT STRUCTURE
Successful management of FORGE (including the planning, solicitation, review, and selection of
technologies that will be tested at FORGE) will require a management structure that provides
clear lines of communication, authority, responsibility and continuity of interests and mission
between DOE, the Science and Technology Analysis Team (STAT) and the Site Management
Team (SMT). The SMT will be responsible for site operations and support for R&D activities
needed to facilitate and advance the goals of FORGE. The schematic diagram in Figure 1 shows
the proposed management structure for the Fallon FORGE project.

NAS Fallon FORGE Research and Development Implementation Plan | 5
Figure 1. Fallon FORGE project management team and structure. Arrows indicate communication/interaction paths.
The SMT, shown in Figure 1 within the large box outlined in black, will consist of two primary
interactive components: Project Management (pale pink boxes) and the Geoscience and
Geoengineering Teams (pale blue boxes). Project Management will be overseen by the Project
Manager (SNL), who in turn will preside over the Contract Administrator (SNL) and the Facility
Operator (SNL, GeothermEx, U.S. Navy). The Project Manager will work directly with the Site
Owners (U.S. Navy and Ormat Nevada, Inc.) on all issues relevant to site operations and
logistics. The Project Manager will also participate in the Science and Engineering Coordination
(SEC), a team co-led by LBNL and SNL.
The SEC will work directly with the Geoscience and Geoengineering Teams to identify, conduct
and report on site activities related to characterization, environmental impact, well design,
downhole measurements/sampling, stimulation design, flow testing and monitoring, and any
other issues as indicated by the small blue boxes (numbered 1-14, Figure 1). The Geoscience
and Geoengineering Teams will report directly to the SEC and Project Manager. Within our
project management structure we have placed the DOE/GTO, STAT, contractors needed for
FORGE operations and independent researchers working under the Phase 3 R&D solicitation
outside the SMT box. Recipients of competitive R&D solicitations will be contracted to the
Prime Recipient (SNL).

NAS Fallon FORGE Research and Development Implementation Plan | 6
The DOE/GTO has ultimate oversight of FORGE, utilizing advice and recommendations issued
by the STAT, the Project Manager and the SEC. We have placed STAT outside the box
(Figure 1) to ensure a degree of independence and autonomy with respect to the SMT. STAT
will have a direct line to the FORGE Project Management and the SEC, as well as DOE/GTO.
Contractors performing operational work at the FORGE site through contracts issued by the
Contract Administrator also reside outside of the SMT box, and will be used if expertise or
service is needed that does not reside inside the SMT. The roles, responsibilities,
communication lines and team members for each box are described in more detail below. The
organization and operation of STAT is described later in the plan.
MANAGEMENT TEAM
Project Manager
The project site will be managed by SNL. The manager will oversee contract administration,
oversee site operations (with GeothermEx) and coordinate all activities with the Site Owners.
Duties will include handling of site finances; deploying, managing and maintaining site facilities;
developing adequate training protocols for environmental health and safety regulations; and
permitting, issuing and administering R&D FOAs as prescribed by the STAT and DOE/GTO.
Furthermore, as the single point of contact with DOE, the project manager will ensure that the
site mission, as defined by the DOE GTO and SEC team, is carried out.
Contract Administration
The project site will be managed by SNL. The manager will oversee contract administration,
oversee site operations (with GeothermEx) and coordinate all activities with the Site Owners.
Duties will include handling of site finances; deploying, managing and maintaining site facilities;
developing adequate training protocols for environmental health and safety regulations; and
permitting, issuing and administering R&D FOAs as prescribed by the STAT and DOE/GTO.
Furthermore, as the single point of contact with DOE, the project manager will ensure that the
site mission, as defined by the DOE GTO and SEC team, is carried out.
Facility Operations
GeothermEx/Schlumberger, in collaboration with SNL, will be responsible for the operation of
the facility, which will be conducted in collaboration with the Site Owners (U.S. Navy and
Ormat Technologies). The operator will be responsible for all field logistics and coordinating
site operations.
Science and Engineering Coordination (SEC)
The SEC team will be co-led by LBNL and SNL. The roles of the SEC will be to (1) provide
clear lines of communication within the SMT and to and from the STAT and DOE; (2)
coordinate geosciences and geoengineering activities conducted at the site by SMT team
members and non-Team R&D projects; (3) provide recommendations and guidance to STAT and
DOE regarding R&D needs and potential FOA topics identified by the SMT as necessary to meet
FORGE objectives and (4) report directly to DOE on project status, problems and future
directions.

NAS Fallon FORGE Research and Development Implementation Plan | 7
Geoscience and Geoengineering Teams
These groups will have multiple leads aligned along core capabilities of their institutions. Their
role will be to identify, conduct and report on the necessary site activities related to reservoir
characterization, well design, etc. Examples of specific activities are given in Figure 1. It is
important to note that the Team responsibilities will depend on the project Phase. For instance,
the Teams will focus on site characterization during Phases 1 and 2, but upon entering Phase 3
all site characterization and other R&D activities will be evaluated through independent FOA
and proposal evaluation processes. The Geoscience and Geoengineering Team leads will report
directly to the SEC team. The Geoscience Team will have three leads: Lawrence Berkeley
National Laboratory (LBNL), U.S. Geological Survey (USGS) and the University of Nevada,
Reno and Nevada Bureau of Mines and Geology (UNR). The UNR Team will develop the 3D
model for the site in Phase 1 and continue to update the model as more data are acquired in
subsequent phases. Additional participants will include Sandia National Laboratories (SNL),
GeothermEx, Itasca, and international partners (presently we have a commitment of interest from
Japan, through ASTI). The Geoengineering Team will be led by GeothermEx and SNL with
additional participation from LBNL, USGS, UNR, Itasca, and participating international
partners. GeothermEx, playing a dual role as a Facility Operator, will provide assistance with
subsurface site characterization, field activities carried out by the Geoscience Team,
development of the reservoir conceptual model, the induced seismicity protocol, supporting
NEPA clearance, developing well stimulation plans in concert with the Geoengineering Team
and overseeing stimulation activities. As needed, the Geoscience/Geoengineering Teams will
engage outside collaborators to provide additional expertise.
ENSURING THAT TESTED AND EVALUATED TECHNOLOGIES SUPPORT GTO
OBJECTIVES
COMMUNICATION WITH SITE MANAGEMENT
Our Project Management Plan is structured to ensure that DOE has a direct path of
communication with site management (through the Project Manager), SEC, and STAT. Through
these lines of communication, DOE will be substantially involved in project decisions, including
participation in decisions related to the technical, programmatic, and/or financial aspects of the
project and operation of the FORGE site. As noted above, to ensure adequate integration of
DOE, the SEC team will report directly to DOE via regularly scheduled teleconferences, face-to-
face meetings and quarterly and annual reports. Furthermore, the FORGE site will include office
facilities for on-site DOE personnel.
COLLABORATIVE APPROACH
To adequately address critical project or programmatic issues, all FORGE management and
oversight activities will be conducted in collaboration with DOE, including recommendations of
alternate approaches or delaying work or shifting emphasis, if needed. DOE will review ongoing
technical performance to ensure that technical progress has been achieved within sub-phases
before work can proceed to subsequent phases. Principally with the Project Manager, DOE will
collaborate in the allocation of funds budgeted as work progresses and as funding needs may
change among the different projects undertaken. DOE will be kept appraised and participate in

NAS Fallon FORGE Research and Development Implementation Plan | 8
the reviews of contractor activities and reports related to project activities. As stated in the
“Conflict of Interest” section, DOE will review and provide final resolution of actual and
perceived conflicts of interest with the SMT, STAT and outside contractors. DOE will also
serve as a scientific and technical liaison between FORGE team and other program or industry
personnel and interests.
RECURRING CYCLES: PLANNING & REVIEW, TESTING & EVALUATION
Competitive R&D solicitations will be issued on an annual basis. To support the annual
solicitations, the development of the areas of interest, development of the solicitations, issuance
of the solicitations and review of the solicitation responses will be a continuous process
throughout the life cycle of the project. Assuming annual awards are made on a fiscal year basis,
the following timeline shown in Table 1 will be implemented.
Table 1. Timeline for annual R&D solicitations
During the course of the FOA funded R&D projects, project participants will be required to
provide quarterly project reports to the FORGE Project Management Team—the reports will be
provided to DOE and to the members of the STAT. In addition to the required quarterly reviews,
monthly teleconferences between the FORGE Project Manager or delegate and the awardee will
be established. DOE and selected members of the STAT will be invited to these calls.
Furthermore, all activities occurring within and conducted by the SMT will be reported on a
recurring monthly basis to the STAT and GTO. The SMT along with the SEC and Project
Management group (site owners, facility operations and contract administration) will hold
weekly meetings to provide status updates for internal (SMT) and external (outside R&D)
projects and identify potential logistical issues, site characterization/monitoring needs and data
dissemination. As noted, activities related to FOA-funded R&D projects will be reported
quarterly by the funded recipients to the SMT. The reports will be used to facilitate R&D
activities at FORGE, coordinate future operations, insure completion of R&D projects in a
Task Name Start Finish
Development of R&D Needs Nov. 1 Mar. 1
Write Solicitation Mar. 1 Apr. 1
Issue Solicitation Apr. 1 Apr. 1
Proposals Due June 1 June 1
Review Proposals June 1 Aug. 1
Notification of Award Aug. 1 Aug. 1
Negotiation of Award Aug. 1 Sept. 1
Funds Distributed Oct. 1 Oct. 1

NAS Fallon FORGE Research and Development Implementation Plan | 9
timely manner as defined by project milestones and the reports will be compiled in condensed
form for presentation to the STAT and the GTO. Using appropriate scientific/trade meeting
(e.g., GRC, Stanford Workshop, ARMA, AGU, etc.) as a forum, FORGE progress and status
reports will be presented to the general public on a regular basis (semi-annually at a minimum).
As outlined under Outreach and Communications, regular meetings with the local communities
and stakeholders describing FORGE operations, progress and plans will be conducted.
R&D IMPLEMENTATION INVOLVES CLOSE COLLABORATION WITH THE SMT
All R&D projects conducted at FORGE will have access to logistical support that can be
provided by the SMT (e.g., development and/or access to monitoring and testing wells),
including any necessary support from outside contractors. Data acquired by the SMT,
particularly data relevant to site characterization will be made available to all R&D projects in
near real time (see the Data Dissemination plan). It will be encouraged that potential responders
to FOA funded R&D projects work closely with the SMT during conceptual stages to facilitate
project design, including logistical support, site data, etc. R&D project scientists will have site
access, within the guidelines outlined by the U.S. Navy Command, and access to site facilities
needed for project support.
ESTABLISHING AND MAINTAINING STAT
The role of the Science and Technology Analysis Team is defined by the GTO and consists of a
group of best-in-class technical experts who will provide technical guidance needed to ensure
that GTO objectives are fully considered and incorporated into the execution of FORGE,
including associated Phase 3 R&D projects. The STAT will play a critical role in assessing
R&D needs in accordance with GTO roadmaps and goals, establishing technical baseline
information and performance specifications, guiding ongoing site characterization and
monitoring efforts, developing topics for Phase 3 FORGE R&D solicitations, and providing
guidance for review and selection of these R&D projects. Since it is likely that institutions
represented within the SMT and STAT will be involved in responding to R&D solicitations,
STAT will create an independent review panel consisting of external people and unconflicted
STAT members to assess and rate R&D proposals. To mitigate possible conflict of interest
issues, final R&D award decisions will be made by the GPO with the help of STAT
recommendations.
The STAT will also assess the progress and results of the work carried out by the SMT at
FORGE as well as independent scientific and engineering R&D implemented at FORGE under
the Phase 3 solicitations and provide input to the SEC team for the development of annual
Topical Reports. As noted above, we have placed STAT outside of the SMT box. By remaining
outside the box, and therefore maintaining a degree of independence from the SMT, STAT will
be afforded a better opportunity to evaluate operations, assess needs and recommend appropriate
R&D topics. The STAT will communicate directly with DOE/GTO and the SEC team. In turn,
the SEC team will gather and synthesize information and recommendations from the
Geosciences and Geoengineering Teams and Facility Operations that will be passed onto STAT
for further independent evaluation.

NAS Fallon FORGE Research and Development Implementation Plan | 10
In consultation with the GTO, ten members of STAT will be selected from the geosciences and
geoengineering community. Members will be drawn from the GTO, National Laboratories,
academia and the private sector and will, if appropriate, be paid a stipend for their services on the
committee. The Navy will also provide a Naval Facilities Engineering Command employee to
participate in STAT. A lead spokesperson will be selected, preferably a member of the GTO.
The STAT will be charged to develop an internal process for evaluating potential conflict of
interest cases that affect the STAT members associated with potential responses to R&D
solicitations. DOE will review and provide final resolution of actual and perceived conflicts of
interest with the STAT.
ADDRESSING CONFLICTS OF INTEREST AMONG SMT AND STAT
The R&D needs and associated solicitation topics will be developed by the STAT with guidance
and assistance from the SEC and DOE. Given that individuals and/or institutions that make up
the SMT, SEC and STAT may wish to propose R&D at the Fallon FORGE site during Phase 3, it
is required that potential real or perceived conflicts of interest are mitigated. In our structure, the
STAT is purposefully outside the SMT structure and as such acts independently of the SEC and
SMT. Since the role for STAT includes developing topics for recurring FORGE R&D
solicitations, providing guidance for review and selection of R&D projects, and developing out-
year R&D strategies, we are confident that the STAT—operating as an entity outside of the
SMT—can assist in the development of solicitations with autonomy; this is one aspect of our
mitigation strategy. The FORGE Project Manager will not propose R&D during the course of
the project to allow effective firewalling of his activities from his parent institution and to allow
unfettered assistance to the R&D procurement process.
Another aspect of our conflict of interest mitigation strategy involves the manner in which
independent Phase 3 R&D proposals will be evaluated. Proposal responses to this R&D
solicitation will be reviewed and ranked by an outside, independent Proposal Review Panel
convened by STAT and the DOE/GTO. This Proposal Evaluation Panel will review proposals
submitted in response to the Phase 3 R&D solicitations, which will be developed and issued by
the Prime Recipient. This Review Panel will be composed of people who are experts in fields
relevant to the Phase 3 solicitations, but who are not actively involved in FORGE R&D
activities. Furthermore, with respect to final selections of R&D proposals, it is envisioned (with
concurrence from DOE/GTO) that the Proposal Review Panel will only provide their
recommendations to DOE and that the source selection officer will reside within the DOE/GTO.
Within the SMT, potential conflicts of interest relative to pursuing R&D solicitations will be
evaluated on a case-by-case basis by the STAT. Since the STAT committee resides outside of
the SMT box and acts independently of SMT, the STAT committee, with DOE and SEC
participation will evaluate potential conflict of interest cases that affect the STAT members
associated with potential responses to R&D solicitations. There will be an emphasis to recruit
outside qualified STAT members who do not have or anticipate potential conflicts. However, if
STAT members are deemed conflicted they will recuse themselves from the development of
solicitation topics. DOE will review and provide final resolution of actual and perceived
conflicts of interest with the SMT, STAT, as well as outside contractors. DOE’s option to
appoint at least 30% of the STAT will offer an additional mitigating step. In addition, we

NAS Fallon FORGE Research and Development Implementation Plan | 11
propose that no more than 50% of the STAT be from organizations that make up the SMT. As
an additional mitigation, it is envisioned that those engaged in the issuance of the solicitation
from the SMT (primarily select individuals from the Prime Recipient) will be suitably firewalled
from the potential responders and will not be eligible to participate in responses to R&D
solicitations.
Cladouhos, T., Petty, S., Sawyer, M., Udderberg, M., Nordin, Y., Results from Newberry Volcano EGS
Demonstration , Proceedings, 40th
Workshop on Geothermal Reservoir Engineering, Stanford University, Stanford,
CA (2015).
Doe, T., McLaren, R., Dershowitz, W., Weston, R., Discrete Fracture Network Stimulations of Enhanced
Geothermal Systems, Proceedings, 39th
Workshop on Geothermal Reservoir Engineering, Stanford University,
Stanford, CA (2014).

Page intentionally blank

1
DISTRIBUTION
1
1
1
1
1
1
1
Itasca Consulting Group, Inc.
Attn: Dr. Will Pettitt
111 Third Avenue South, Suite 450
Minneapolis, MN 55401
Nevada Bureau of Mines and Geology
Attn: James Faulds
University of Nevada, Reno, MS178
Reno, NV 89557
Ormat Nevada Inc.
Attn: John Akerley
6225 Neil Road
Reno, NV 89511
U.S. Nave Geothermal Program Office
Attn: Andrew E. Sabin
429 E. Bowen Rd., Stop 4011
China Lake, CA, 93555
GeothermEx
Attn: Ann Robertson-Tait
3260 Blume Drive, Suite 220
Richmond, CA 94806
Lawrence Berkeley National
Laboratory Attn: B. Mack Kennedy
1 Cyclotron Rd.
Berkley, CA 94720
U.S. Geological Survey
Attn: Jonathan MG Glen
345 Middlefield Road, MS989
Menlo Park, CA 94025
1 MS1033 Douglas Blakenship 06916
1 MS0899 RIM-Reports Management 9532 (electronic copy)

Copyright © 2022 FDOKUMEN