
Syndrome d'infusion au propofol - Revue de la littérature scientifique
PHARMACODYNAMIC MODELINGOF PROPOFOL-INDUCED TIDALVOLUME DEPRESSION IN CHILDRENJin-Oh Hahn, PhD1, Sara Khosravi, MSc2,
Maryam Dosani, BSc3, Guy A. Dumont, PEng, PhD2
and J. Mark Ansermino, MBBCh, FRCPC3
Hahn J-O, Khosravi S, Dosani M, Dumont GA, Ansermino JM.
Pharmacodynamic modeling of propofol-induced tidal volume
depression in children.
J Clin Monit Comput 2011; 25:275–284
ABSTRACT. Objective. This investigation aimed to develop a
pediatric pharmacodynamic model of propofol-induced tidal
volume depression towards an ultimate goal of developing a
dosing schedule that would preserve spontaneous breathing
following a loading dose of propofol. Methods. Fifty two ASA
1 and 2 children aged 6–15 year presenting for gastrointestinal
endoscopy were enrolled. Subjects were administered a loading
dose of 4 mg/kg of propofol intravenously at a constant infusion
rate determined by a randomization schedule. Respiratory
parameters including tidal volume, respiratory rate, minute
volume, and end-tidal CO2 were recorded at 5 s intervals.
Using the predicted plasma concentration, based on the
Paedfusor pharmacokinetic model, propofol-induced tidal
volume depression was modeled by 3 different approaches
(2-stage, pooled, and mixed effects) and results were compared
using prediction residual, median percentage errors, median
absolute percentage errors, and root-mean-squared normalized
errors. The effects of age and body weight as covariates were
examined. Results. Respiratory rate and end-tidal CO2 did not
show clear dependence on the predicted plasma concentration.
The pharmacodynamic models for tidal volume derived
from different modeling approaches were highly consistent.
The 2-stage, pooled, and mixed effects approaches yielded
ke0 of 1.06, 1.24, and 0.72 min-1; c of 1.10, 0.83, and 0.93;
EC50 of 3.18, 3.44, and 3.00 mcg/ml. Including age and
body weight as covariates did not significantly improve the
predictive performance of the models. Conclusions. A
pediatric pharmacodynamic model of propofol-induced tidal
volume depression was developed. Models derived from 3
different approaches were shown to be consistent with each
other; however, the individual pharmacodynamic parameters
exhibited significant inter-individual variability without strong
dependence on age and body weight. This would suggest the
desirability of adapting the pharmacodynamic model to each
subject in real time.
KEY WORDS. pharmacodynamics, pediatrics, propofol, tidal
volume, respiratory depression, anesthesia.
INTRODUCTION
Propofol is commonly used for pediatric anesthesia andespecially for procedures that require deep sedation inchildren [1]. Its advantages include a titratable depth ofanesthesia, cardiovascular stability, rapid wake-up withreduced post-operative nausea and vomiting, altogetherenabling earlier return to the pre-anesthetic functionalstate [1].
From the 1Department of Mechanical Engineering, University ofAlberta, Edmonton, AB, Canada; 2Department of Electrical andComputer Engineering, University of British Columbia, Vancou-ver, BC, Canada; 3Department of Anesthesiology, Pharmacologyand Therapeutics, University of British Columbia, Vancouver, BC,Canada.
Received 9 September 2010. Accepted for publication 8 September2011.
Address correspondence to J.-O Hahn, Department of MechanicalEngineering, University of Alberta, Edmonton, AB, Canada.E-mail: [email protected]
Journal of Clinical Monitoring and Computing (2011) 25:275–284
DOI: 10.1007/s10877-011-9306-0 � Springer 2011

However, propofol causes a dose dependent depressionof ventilation. This may lead to hypoxemia requiringartificial ventilation [2], which, unless appropriatelymanaged, may result in gastric insufflation, pulmonaryaspiration and hypoxia, all of which can lead to devas-tating complications such as permanent brain injury ordeath. The clinically observed respiratory depression isdependent on both the propofol concentration in thebrain and its rate of rise [3]. A slower rise in the brainpropofol concentration will allow for compensatoryeffects, such as the rise in arterial carbon dioxide, to driveventilation. Spontaneous breathing can be maintainedwith a slow infusion of propofol as the peak in propofolconcentration at the brainstem is reduced, therebyallowing more time for compensation [3]. For this findingto be useful, an improved and more quantitative under-standing of the pharmacodynamics (PD) of propofol-induced respiratory depression is required.
Pediatric pharmacokinetic (PK) models for propofol[4, 5] have been used in commercial infusion devices andpediatric PD models have been described using EEGmeasures of anesthetic effect [6, 7]. Using ventilation as aPD endpoint would be a significant addition to theunderstanding of the observed clinical effects of propofol.The aim of this investigation was to develop a PD modelto describe the effect of propofol on tidal volumedepression in children.
METHODS
Experimental protocol
Data reported in a previously published clinical manu-script was utilized [3]. Following institutional approvaland written informed consent, 52 ASA 1 and 2 childrenmean (SD) age of 11 (2.4) years and weight of 43 (15) kgpresenting for upper or lower gastrointestinal endoscopywere enrolled.
For baseline measurement, a tightly fitting anestheticface mask was applied to the subject before the inductionof anesthesia. Respiratory monitoring (M-CAiOVXmodule, Datex-Ohmeda, Finland) was performed for aminimum of 3 min prior to the induction of anesthesiaduring tidal breathing using a fractional inspired oxygenconcentration (FiO2) of 0.21 at 6 l/min through theanesthetic circle system. Adequate mask seal was acceptedif the CO2 monitor generated a square waveform and adifference of <5% was observed between the measuredinspiratory and expiratory volumes. A loading dose of4 mg/kg of propofol 1% at a constant infusion rate using astandard infusion pump (Medex Protege� 3010 Medex-A
Furon, Healthcare Company, USA) was administered.Infusion rates ranged from 1,000 to 2,300 mcg/kg/min.The rate of infusion for each subject was determined by arandomization schedule which aimed to optimize the rateof administration to maintain spontaneous breathing [3].Once the loading dose of propofol had been delivered, theinfusion rate was maintained at 200 mcg/kg/min for atleast another 5 min. Fresh gas was maintained at 6 l/minthroughout the induction phase with the FiO2 increasedto 0.5. Respiratory parameters including tidal volume,respiratory rate, minute volume, and end-tidal CO2 wererecorded every 5 s.
Pharmacodynamic modeling
All the PD analysis and model predictions reported in thispaper were performed using MATLAB (MathWorks,USA) with its Optimization Toolbox [8] and StatisticsToolbox [9]. The plasma propofol concentration predic-tions were based on the Paedfusor PK model [5]. A PDmodel consisting of an effect compartment (characterizedby an equilibration constant ke0) and a dose–responserelationship described by the Hill equation (characterizedby a 50% effect propofol concentration EC50 and acooperativity constant c) was considered (Figure 1). EC50
is the propofol concentration that causes 50% depressionof tidal volume during spontaneous breathing. The modelwas identified using 3 different approaches (2-stage,pooled, and mixed effects modeling approaches) [4] andthe estimated parameters were compared with each other.2-stage approach
In the 2-stage approach, the PD model was first identifiedfor each individual subject. The optimal population PDparameters were then determined as the arithmetic meanof the individual values.
For each individual, the PD model was identified using anexhaustive search of ke0 combined with constrained least-squares estimation of c and EC50. To prevent non-physio-logic PD parameters, the model identification was limitedto the following parameter space: 1e-2 < ke0 < 2e0,1e-1 < c < 1e1, and 0.1 9 max(Cp) < EC50 < 0.9 9max(Cp), where max(Cp) is the maximum value of thepredicted plasma propofol concentration for an individual
Ip0
0
e
e
k
s+EC50
PKCp Ce
Ek
Fig. 1. PD model of propofol-induced tidal volume depression.
276 Journal of Clinical Monitoring and Computing

subject. For each given ke0, the effect site propofol concen-tration Ce was calculated. The relationship between Ce andthe tidal volume was assumed to be described by the Hillequation model:
E tð Þ ¼ E0 � E0
Cce
ECc50 þ Cc
e
; ð1Þ
where E(t) is the effect (tidal volume) and E0 is its baselinevalue before induction. The nonlinear Hill equationmodel (1) can be transformed into the following linear-in-parameter formulation:
logE0�E tð Þ
E tð Þ
� �¼ c log Ce tð Þ½ ��c log EC50½ �
¼ c c log EC50½ �½ �log Ce tð Þ½ ��1
� �¼ hT/ tð Þ;
ð2Þ
where h ¼ c c log EC50½ �½ �T and / tð Þ ¼ log Ce tð Þ½ �1½ �T.Using the measured E(t) and Ce(t) calculated for anassumed ke0, the optimal estimates of c and EC50 wereidentified as the least-squares solution of (2). If the esti-mates of c and EC50 were out of the pre-specified searchspace, the FMINCON routine in the MATLAB Opti-mization Toolbox [8] was used to refine the optimalestimates of c and EC50 with membership in the pre-specified search space. Given PD parameters associatedwith each candidate ke0 value, the set of the optimalindividual PD parameters was determined by minimizingthe mean squared residual of the tidal volume predictionover ke0. The sets of optimal PD parameters associatedwith each individual were averaged over the populationto derive the optimal population PD parameters.
Pooled approach
In the pooled approach, the data available from all thesubjects were lumped together to identify the optimalpopulation PD parameters in a single step.
As in the 2-stage approach, the model identificationwas limited to the following parameter space: 1e-2 <ke0 < 2.0e0. However, no additional constraint wasimposed on c and EC50. In contrast to the 2-stageapproach, the tidal volume measurements from all theindividuals were lumped together and used to deter-mine the optimal estimates of c and EC50 as the least-squares solution of (2) for each candidate ke0 value inthe parameter space. Given PD parameters associatedwith each candidate ke0 value, the set of optimalpopulation PD parameters was determined by mini-mizing the mean squared residual of the tidal volumeprediction over ke0.
Mixed effects modeling approach
In the mixed effects approach, each PD parameter is as-sumed to consist of fixed and random components. Thefixed component corresponds to the typical value (pop-ulation PD parameters), whereas the random componentrepresents inter-individual variability. Mixed effectsmodeling was used to characterize both fixed and randomeffects in the model.
The mixed effects model was identified using theNLMEFIT routine in the MATLAB Statistics Toolbox[9]. The typical values were assumed to be constant, andthe additive random effects model was considered:
ke0 ¼ �ke0 þ g1; c ¼ �cþ g2; EC50 ¼ EC50 þ g3; ð3Þ
where gi, i = 1, 2, 3 are random variables normallydistributed about zero. An additive model was used for theprediction residual. Full 3 9 3 as well as diagonal 3 9 3matrices were considered as the variance–covariancematrix of random effects [9]. The PD parameter valuesobtained from the 2-stage and pooled results were used asinitial conditions to derive the mixed effects model.
Performance evaluation
The predictive performance of the PD models obtainedfrom the 3 different modeling approaches was assessed interms of (1) prediction residuals, (2) median percentage(MDPE) and median absolute percentage errors (MDA-PE) [10], and (3) root-mean-squared normalized errors(RMSNE).1 All evaluations were performed based on thepopulation prediction (prediction of tidal volume basedon typical values but not individual values).
Covariates analysis
Covariates were examined by assuming EC50 and c as afunction of age and weight. The pooled approach wasused for this investigation. In the first analysis, a gen-eralized allometric EC50 model (in which EC50 is assumedas a multiplicative function of age (p1) and weight (p2))was considered:
EC50 ¼ apb1p
c2; ð4Þ
where a, b, and c are tunable parameters. Note that (4)reduces to the allometric relationship for age or bodyweight by setting c = 0 or b = 0, respectively. The linear-in-parameter formulation (2) can be rewritten as
1See ‘‘Appendix’’ for details of how these errors are defined.
Hahn et al.: Propofol-induced tidal volume depression 277
logE0 � E tð Þ
E tð Þ
� �¼ c log Ce tð Þ½ � � c log EC50½ �
¼ c log Ce tð Þ½ �� c log a½ � þ b log p1½ � þ c log p2½ �f g
¼ c c log a½ � cb cc½ �
log Ce tð Þ½ ��1
� log p1½ �� log p2½ �
26664
37775;
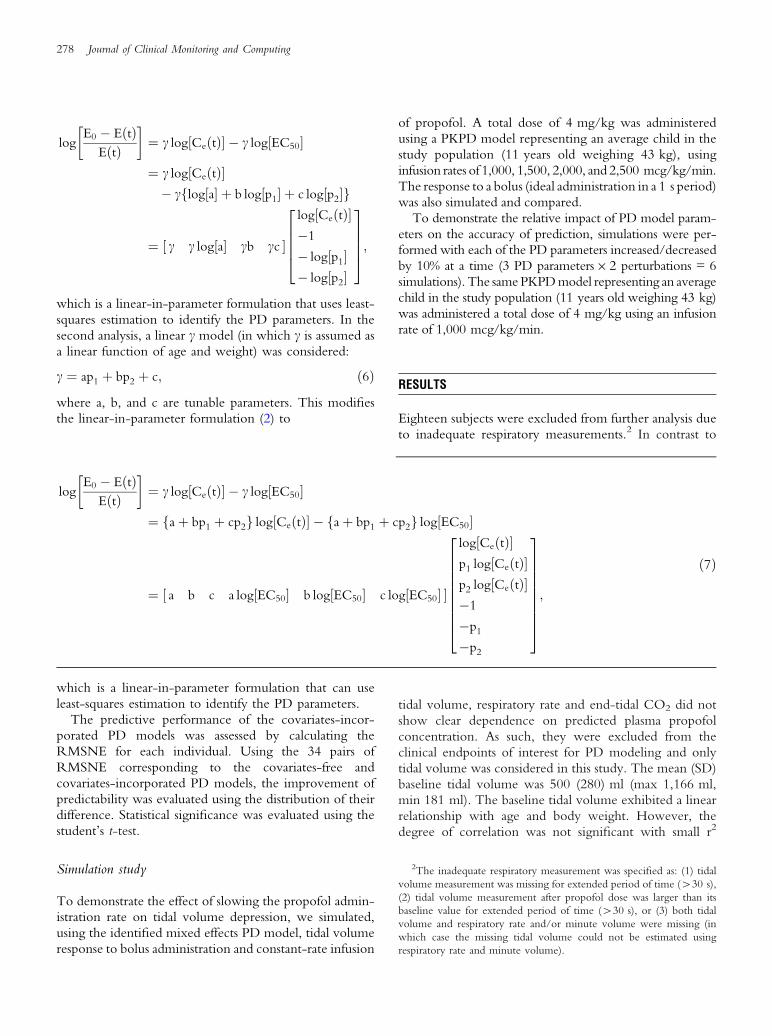
which is a linear-in-parameter formulation that uses least-squares estimation to identify the PD parameters. In thesecond analysis, a linear c model (in which c is assumed asa linear function of age and weight) was considered:
c ¼ ap1 þ bp2 þ c; ð6Þ
where a, b, and c are tunable parameters. This modifiesthe linear-in-parameter formulation (2) to
which is a linear-in-parameter formulation that can useleast-squares estimation to identify the PD parameters.
The predictive performance of the covariates-incor-porated PD models was assessed by calculating theRMSNE for each individual. Using the 34 pairs ofRMSNE corresponding to the covariates-free andcovariates-incorporated PD models, the improvement ofpredictability was evaluated using the distribution of theirdifference. Statistical significance was evaluated using thestudent’s t-test.
Simulation study
To demonstrate the effect of slowing the propofol admin-istration rate on tidal volume depression, we simulated,using the identified mixed effects PD model, tidal volumeresponse to bolus administration and constant-rate infusion
of propofol. A total dose of 4 mg/kg was administeredusing a PKPD model representing an average child in thestudy population (11 years old weighing 43 kg), usinginfusion rates of 1,000, 1,500, 2,000, and 2,500 mcg/kg/min.The response to a bolus (ideal administration in a 1 s period)was also simulated and compared.
To demonstrate the relative impact of PD model param-eters on the accuracy of prediction, simulations were per-formed with each of the PD parameters increased/decreasedby 10% at a time (3 PD parameters 9 2 perturbations = 6simulations). The same PKPD model representing an averagechild in the study population (11 years old weighing 43 kg)was administered a total dose of 4 mg/kg using an infusionrate of 1,000 mcg/kg/min.
RESULTS
Eighteen subjects were excluded from further analysis dueto inadequate respiratory measurements.2 In contrast to
tidal volume, respiratory rate and end-tidal CO2 did notshow clear dependence on predicted plasma propofolconcentration. As such, they were excluded from theclinical endpoints of interest for PD modeling and onlytidal volume was considered in this study. The mean (SD)baseline tidal volume was 500 (280) ml (max 1,166 ml,min 181 ml). The baseline tidal volume exhibited a linearrelationship with age and body weight. However, thedegree of correlation was not significant with small r2
logE0 � E tð Þ
E tð Þ
� �¼ c log Ce tð Þ½ � � c log EC50½ �
¼ aþ bp1 þ cp2f g log Ce tð Þ½ � � aþ bp1 þ cp2f g log EC50½ �
¼ a b c a log EC50½ � b log EC50½ � c log EC50½ �½ �
log Ce tð Þ½ �p1 log Ce tð Þ½ �p2 log Ce tð Þ½ ��1
�p1
�p2
2666666664
3777777775;
ð7Þ
2The inadequate respiratory measurement was specified as: (1) tidal
volume measurement was missing for extended period of time (>30 s),
(2) tidal volume measurement after propofol dose was larger than its
baseline value for extended period of time (>30 s), or (3) both tidal
volume and respiratory rate and/or minute volume were missing (in
which case the missing tidal volume could not be estimated using
respiratory rate and minute volume).
278 Journal of Clinical Monitoring and Computing
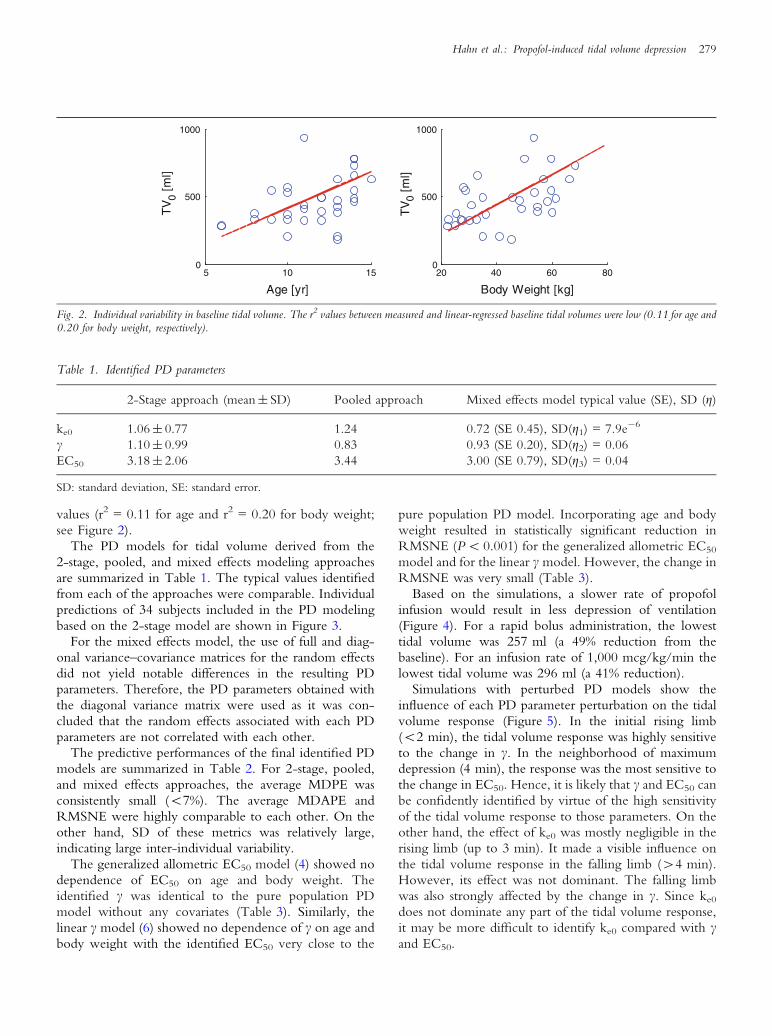
values (r2 = 0.11 for age and r2 = 0.20 for body weight;see Figure 2).
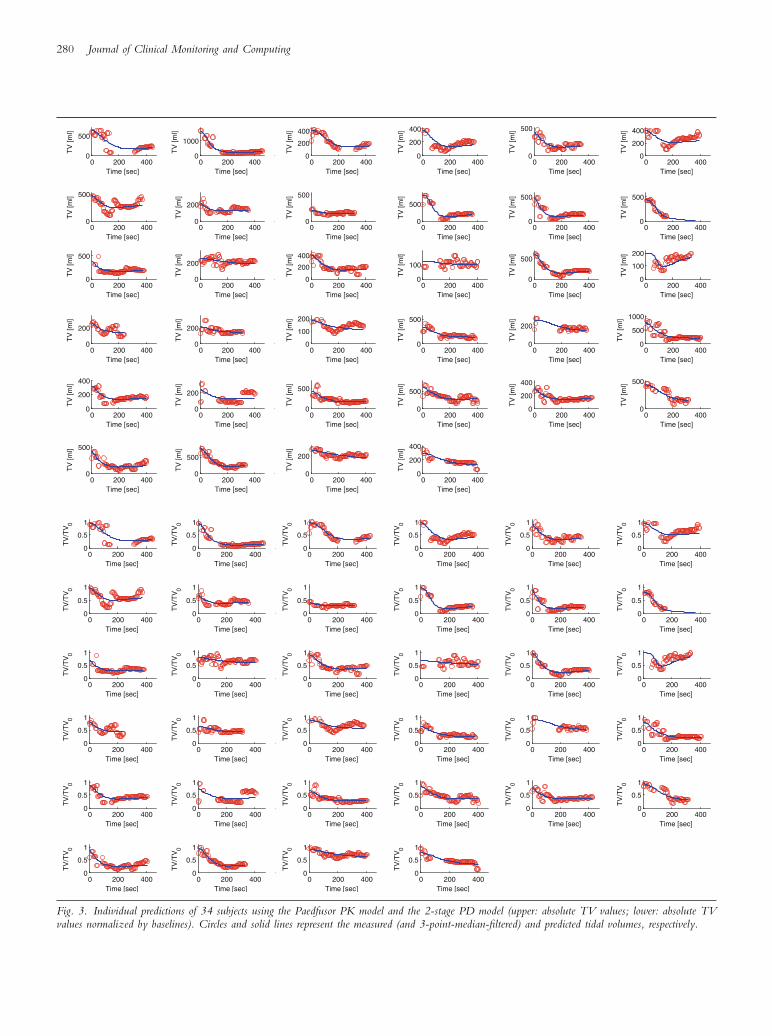
The PD models for tidal volume derived from the2-stage, pooled, and mixed effects modeling approachesare summarized in Table 1. The typical values identifiedfrom each of the approaches were comparable. Individualpredictions of 34 subjects included in the PD modelingbased on the 2-stage model are shown in Figure 3.
For the mixed effects model, the use of full and diag-onal variance–covariance matrices for the random effectsdid not yield notable differences in the resulting PDparameters. Therefore, the PD parameters obtained withthe diagonal variance matrix were used as it was con-cluded that the random effects associated with each PDparameters are not correlated with each other.
The predictive performances of the final identified PDmodels are summarized in Table 2. For 2-stage, pooled,and mixed effects approaches, the average MDPE wasconsistently small (<7%). The average MDAPE andRMSNE were highly comparable to each other. On theother hand, SD of these metrics was relatively large,indicating large inter-individual variability.
The generalized allometric EC50 model (4) showed nodependence of EC50 on age and body weight. Theidentified c was identical to the pure population PDmodel without any covariates (Table 3). Similarly, thelinear c model (6) showed no dependence of c on age andbody weight with the identified EC50 very close to the
pure population PD model. Incorporating age and bodyweight resulted in statistically significant reduction inRMSNE (P < 0.001) for the generalized allometric EC50
model and for the linear c model. However, the change inRMSNE was very small (Table 3).
Based on the simulations, a slower rate of propofolinfusion would result in less depression of ventilation(Figure 4). For a rapid bolus administration, the lowesttidal volume was 257 ml (a 49% reduction from thebaseline). For an infusion rate of 1,000 mcg/kg/min thelowest tidal volume was 296 ml (a 41% reduction).
Simulations with perturbed PD models show theinfluence of each PD parameter perturbation on the tidalvolume response (Figure 5). In the initial rising limb(<2 min), the tidal volume response was highly sensitiveto the change in c. In the neighborhood of maximumdepression (4 min), the response was the most sensitive tothe change in EC50. Hence, it is likely that c and EC50 canbe confidently identified by virtue of the high sensitivityof the tidal volume response to those parameters. On theother hand, the effect of ke0 was mostly negligible in therising limb (up to 3 min). It made a visible influence onthe tidal volume response in the falling limb (>4 min).However, its effect was not dominant. The falling limbwas also strongly affected by the change in c. Since ke0
does not dominate any part of the tidal volume response,it may be more difficult to identify ke0 compared with cand EC50.
5 10 150
500
1000
Age [yr]
TV
0 [m
l]
20 40 60 800
500
1000
Body Weight [kg]
TV
0 [m
l]
Fig. 2. Individual variability in baseline tidal volume. The r2 values between measured and linear-regressed baseline tidal volumes were low (0.11 for age and0.20 for body weight, respectively).
Table 1. Identified PD parameters
2-Stage approach (mean ± SD) Pooled approach Mixed effects model typical value (SE), SD (g)
ke0 1.06 ± 0.77 1.24 0.72 (SE 0.45), SD(g1) = 7.9e-6
c 1.10 ± 0.99 0.83 0.93 (SE 0.20), SD(g2) = 0.06
EC50 3.18 ± 2.06 3.44 3.00 (SE 0.79), SD(g3) = 0.04
SD: standard deviation, SE: standard error.
Hahn et al.: Propofol-induced tidal volume depression 279
0 200 4000
500
Time [sec]
TV
[ml]
0 200 4000
1000
Time [sec]T
V [m
l]
0 200 4000
200
400
Time [sec]
TV
[ml]
0 200 4000
200
400
Time [sec]
TV
[ml]
0 200 4000
500
Time [sec]
TV
[ml]
0 200 4000
200
400
Time [sec]
TV
[ml]
0 200 4000
500
Time [sec]
TV
[ml]
0 200 4000
200
Time [sec]
TV
[ml]
0 200 4000
500
Time [sec]
TV
[ml]
0 200 4000
500
Time [sec]
TV
[ml]
0 200 4000
500
Time [sec]
TV
[ml]
0 200 4000
500
Time [sec]
TV
[ml]
0 200 4000
500
Time [sec]
TV
[ml]
0 200 4000
200
Time [sec]
TV
[ml]
0 200 4000
200
400
Time [sec]T
V [m
l]0 200 400
0
100
Time [sec]
TV
[ml]
0 200 4000
500
Time [sec]
TV
[ml]
0 200 4000
100
200
Time [sec]
TV
[ml]
0 200 4000
200
Time [sec]
TV
[ml]
0 200 4000
200
Time [sec]
TV
[ml]
0 200 4000
100
200
Time [sec]
TV
[ml]
0 200 4000
500
Time [sec]
TV
[ml]
0 200 4000
200
Time [sec]
TV
[ml]
0 200 4000
500
1000
Time [sec]
TV
[ml]
0 200 4000
200
400
Time [sec]
TV
[ml]
0 200 4000
200
Time [sec]
TV
[ml]
0 200 4000
500
Time [sec]
TV
[ml]
0 200 4000
500
Time [sec]
TV
[ml]
0 200 4000
200
400
Time [sec]
TV
[ml]
0 200 4000
500
Time [sec]
TV
[ml]
0 200 4000
500
Time [sec]
TV
[ml]
0 200 4000
500
Time [sec]
TV
[ml]
0 200 4000
200
Time [sec]
TV
[ml]
0 200 4000
200
400
Time [sec]
TV
[ml]
0 200 4000
0.5
1
Time [sec]
TV
/TV
0
0 200 4000
0.5
1
Time [sec]
TV
/TV
0
0 200 4000
0.5
1
Time [sec]
TV
/TV
0
0 200 4000
0.5
1
Time [sec]
TV
/TV
0
0 200 4000
0.5
1
Time [sec]
TV
/TV
0
0 200 4000
0.5
1
Time [sec]
TV
/TV
00 200 400
0
0.5
1
Time [sec]
TV
/TV
0
0 200 4000
0.5
1
Time [sec]
TV
/TV
0
0 200 4000
0.5
1
Time [sec]
TV
/TV
0
0 200 4000
0.5
1
Time [sec]
TV
/TV
0
0 200 4000
0.5
1
Time [sec]
TV
/TV
0
0 200 4000
0.5
1
Time [sec]T
V/T
V0
0 200 4000
0.5
1
Time [sec]
TV
/TV
0
0 200 4000
0.5
1
Time [sec]
TV
/TV
0
0 200 4000
0.5
1
Time [sec]
TV
/TV
0
0 200 4000
0.5
1
Time [sec]
TV
/TV
0
0 200 4000
0.5
1
Time [sec]
TV
/TV
0
0 200 4000
0.5
1
Time [sec]
TV
/TV
0
0 200 4000
0.5
1
Time [sec]
TV
/TV
0
0 200 4000
0.5
1
Time [sec]
TV
/TV
0
0 200 4000
0.5
1
Time [sec]
TV
/TV
0
0 200 4000
0.5
1
Time [sec]
TV
/TV
0
0 200 4000
0.5
1
Time [sec]
TV
/TV
0
0 200 4000
0.5
1
Time [sec]
TV
/TV
0
0 200 4000
0.5
1
Time [sec]
TV
/TV
0
0 200 4000
0.5
1
Time [sec]
TV
/TV
0
0 200 4000
0.5
1
Time [sec]
TV
/TV
0
0 200 4000
0.5
1
Time [sec]
TV
/TV
0
0 200 4000
0.5
1
Time [sec]
TV
/TV
0
0 200 4000
0.5
1
Time [sec]
TV
/TV
0
0 200 4000
0.5
1
Time [sec]
TV
/TV
0
0 200 4000
0.5
1
Time [sec]
TV
/TV
0
0 200 4000
0.5
1
Time [sec]
TV
/TV
0
0 200 4000
0.5
1
Time [sec]
TV
/TV
0
Fig. 3. Individual predictions of 34 subjects using the Paedfusor PK model and the 2-stage PD model (upper: absolute TV values; lower: absolute TVvalues normalized by baselines). Circles and solid lines represent the measured (and 3-point-median-filtered) and predicted tidal volumes, respectively.
280 Journal of Clinical Monitoring and Computing

DISCUSSION
The parameters and PD models estimated using the threemodeling approaches (two stage, pooled and mixed effect)were highly consistent (see the typical values in Table 1).The ranges of individual PD parameters were wide(2-stage results in Table 1) suggesting a significantamount of inter-individual variability. For the mixed ef-fects model, the confidence intervals of the typicalvalues (±2 9 SE) were large for all PD parameters. The
covariates-incorporated models did not yield any signifi-cant improvement in terms of fit (Table 3); despite sta-tistical significance, the amount of improvement in termsof reduction in mean RMSNE was only 3.5% for thegeneralized allometric EC50 model and 7.0% for the linearc model, respectively. Simulations using the model werein keeping with the clinical observation of a reduceddegree of ventilatory depression with a slower rate of drugadministration (Figure 4).
Table 2. Predictive performance of the final identified PD models. MEAN and SD are mean and SD of prediction residual
2-Stage approach Pooled approach Mixed effects model
Mean 6.44 ± 68.9 [ml] 5.51 ± 76.4 [ml] 3.07 ± 73.2 [ml]
SD 79.2 ± 41.9 [ml] 80.8 ± 49.6 [ml] 80.5 ± 43.7 [ml]
MDPE 02 ± 35 [%] 07 ± 40 [%] 03 ± 37 [%]
MDAPE 31 ± 21 [%] 33 ± 27 [%] 32 ± 23 [%]
RMSNE 52 ± 28 [%] 57 ± 36 [%] 57 ± 34 [%]
Table 3. The effects of age and body weight as covariates
ke0 c EC50 RMSNE
Population PD Model 1.24 0.83 3.44 0.57 ± 0.36
Generalized Allometric EC50 Model 1.44 0.83 26.7p1-0.78p2
-0.03 0.55 ± 0.35
Linear c Model 1.27 3.0e-4p1 + 1.5e-2p2 + 0.13 3.42 0.53 ± 0.31
0 1 2 3 4 5 6 7 8250
300
350
400
450
500
TV
[ml]
0 1 2 3 4 5 6 7 80
1
2
3
Ce
[mcg
/ml]
Time [min]
Bolus
1000mcg/kg/min
1500mcg/kg/min2000mcg/kg/min
2500mcg/kg/min
Fig. 4. The effect of the propofol infusion rate on the tidal volume response,based on the population-based mixed effects model of the average child(11 years old, 43 kg). The end of the propofol infusion is at 4, 2.7, 2, and1.6 min for 1,000, 1,500, 2,000, and 2,500 mcg/kg/min, respectively.The effect site concentrations start to decrease shortly after the end of thepropofol administration due to the delay associated with ke0.
0 2 4 6 8 10 12280
300
320
340
360
380
400
420
440
460
480
500
Time [min]
TV
[ml]
Nominal
ke0 +/-10%
γ +/-10%EC50 +/-10%
Fig. 5. The effect of PD parameter perturbation on tidal volume depressionresponse. The population-based mixed effects model of the average child(11 years old, 43 kg) was used. The initial rising limb (<2 min) is highlysensitive to the change in c, and the neighborhood of maximum depression(4 min) is the most sensitive to the change in EC50. The effect of ke0 isnegligible in the rising limb (up to 3 min). It affects the falling limb(>4 min) but the effect is not dominant.
Hahn et al.: Propofol-induced tidal volume depression 281

Our previous study [3] revealed that the infusion rate ofpropofol was an important factor in the degree of respi-ratory depression observed in children. However, it wasnot considered as a covariate in developing our PD modelin this study, because the influence of the propofol infu-sion rate on the tidal volume response is implicitly cap-tured by the PK model, i.e. the infusion rate of propofoldetermines its concentration profile created by the PKmodel, which in turn affects the tidal volume response.Indeed, we could faithfully reproduce the dependence ofthe observed PD response on the propofol infusion rate byusing the PD model whose parameters do not depend onthe propofol infusion rate (Figure 4).
The confidence level of ke0 was lower (SE was 62.5%of typical value) than c (21.5%) or EC50 (26.3%). Thedegraded confidence in the estimate of ke0 is more likelyto be due to its lower identifiability caused by the constantinfusion of propofol, which results in slow changes inplasma and effect site propofol concentrations that cannotclearly emphasize the phase shift between them. Indeed,simulations performed with perturbed PD models(Figure 5) revealed that ke0 may be the most difficult toidentify using a constant infusion of propofol. In contrast,the dose–response relationship (i.e. c and EC50) could beidentified with a higher level of confidence than ke0, byvirtue of the slow, quasi-steady-state behavior of thepropofol concentration and the tidal volume in responseto the slow infusion of propofol.
The respiratory rate and end-tidal CO2 responses topropofol were highly variable without any notabledependence on the predicted plasma propofol concen-tration, which contrasts against the increase in end-tidalCO2 seen in an adult volunteer study [11]. However, itwas not a consistent finding; a recent study reported thatpropofol had no effect on the end-tidal CO2 in adults[12]. The relatively low dose of propofol (averagepredicted plasma concentration = 1 mcg/ml) used inOlofsen et al. [12] compared to Bouillon et al. [11] (peakplasma concentration was 6–12 mcg/ml) may explainthese contradicting results. On the other hand, theunpredictability of respiratory rate and end-tidal CO2
responses in our pediatric population is much more likelydue to the cortical influences of anxiety and pain(on injection of propofol), since the children who werepatients and not volunteers are more likely affected by themodulating effect of cortex on the respiratory drive due tostress and pain [3]. The tidal volume exhibited a consistentdecrease as the predicted propofol plasma concentrationincreased. The minute volume did not exhibit a strongcorrelation with predicted propofol plasma concentrationsdue to the unpredictability of respiratory rate.
The values of ke0 and EC50 derived in this study werecomparable to previously reported pediatric PD models
derived from the EEG monitors: ke0 = 0.60 min-1 andEC50 = 5.2 mcg/ml [7], and ke0 = 0.91 min-1 andEC50 = 3.65 mcg/ml [13], derived using the bispectralindex (BIS), as well as EC50 = 3.56 mcg/ml [6] derivedusing the auditory evoked potential (AEP). Compared toa previous adult PD study on minute volume depression[11], the value of ke0 in our PD model was larger than theadult value of 0.27 min-1, which is consistent with aprevious study that reported an inversely proportionalrelationship between ke0 and age [7]. However, ourpediatric value of EC50 was 2.4 times larger than its adultcounterpart of 1.33 mcg/ml, which may be due to thedifferent respiratory endpoints (tidal volume versus min-ute volume) studied.
Simulation results on the effect of propofol infusion rateon tidal volume depression suggest that, given theadministration of a fixed amount of propofol, the maximallevel of tidal volume depression can be reduced by slowerinfusion. This is mostly attributed to lower peak effect sitepropofol concentration associated with slower adminis-tration (Figure 4). This can be explained by linear inputdependence and exponential time dependence of the PKmodel. Since the PK model is a linear system, the plasmaand effect site propofol concentrations at a given time arelinearly proportional to the propofol infusion rate.For example, the Ce for the 2,000 mcg/kg/min infusionis twice that of the Ce for the 1,000 mcg/kg/min infu-sion (Figure 4), up to 2 min when the loading dose of4 mg/kg is completely administered at the infusion rate of2,000 mcg/kg/min. Due to the exponential time depen-dence of the PK model, the Ce for the 1,000 mcg/kg/mininfusion cannot attain its peak value at the one corre-sponding to the 2,000 mcg/kg/min infusion at 4 min(when the loading dose of 4 mg/kg is completelyadministered at the infusion rate of 1,000 mcg/kg/min),because the rate of increase of the Ce is smaller between2 min and 4 min than between 0 min and 2 min.Therefore, for a fixed loading dose, tidal volumedepression is attenuated by slower infusion rates becausepeak Ce is always smaller for slower infusion rates.
Previous PD modeling studies on respiratory depressionconcentrated on the effect of anesthetics and opioids onthe depression of minute ventilation [11, 12, 14]. Sinceminute ventilation is derived from both tidal volume andrespiratory rate, understanding drug effect on tidal volumeand respiratory rate will be useful in understanding the PDmechanism underlying the depression of minute ventila-tion. We observed that propofol mainly affected the tidalvolume rather than the respiratory rate in children. This isin contrast to the predominant effect of opioid analgesics(such as remifentanil) on the reduction of respiratory ratewith tidal volume depression only occurring at higherconcentrations. These findings may be supported by the
282 Journal of Clinical Monitoring and Computing
different effects of these drugs on the CO2 ventilatoryresponse curve [14].
Since our study was conducted under real-life clinicalconditions rather than strictly controlled laboratory con-ditions, our study has several limitations. The study wasperformed in closed-loop conditions (i.e. active chemo-reflex feedback may have affected tidal volume responsevia alteration in end-tidal CO2), and the tidal volumeresponse of the PD model includes the direct effect ofpropofol and the effect of propofol-induced end-tidalCO2 changes. In particular, the PD model implicitlyincludes the effect of propofol on CO2 production. Areduction in CO2 production yields a reduction in end-tidalCO2. Thus, propofol-induced reduction in CO2 produc-tion can result in perturbation of end-tidal CO2 that affectsthe tidal volume response. The study was performed inhyperoxic conditions (FiO2 = 0.5) to avoid the peripher-ally mediated effects of hypoxia. Validation of the PDmodel under normoxic conditions is required. The ade-quacy of mask seal was optimized during the clinical trial,but there was no direct measure of the leak. The tidal vol-ume may have been underestimated. The individual PDresponse was obtained using the propofol dose with a ran-domized infusion rate, which may have affected the con-sistency of the PD models obtained for different individuals.However, we predict that the adverse influence of usingrandomized infusion rates in obtaining PD responses isnegligible, by virtue of the similarity in the frequencycontents therein. This PD model should be cautiously ap-plied to the prediction of tidal volume depression inyounger children, since the age range of the study popula-tion was limited to older children.
The use of PD models of propofol and its effect onrespiratory depression will lead to improved dosingschedules and control algorithms. The control algorithmscould be used in open-loop systems (e.g. target controlledinfusions) or in closed-loop systems that continuouslymeasure drug effects using clinical endpoints. Advisorysystems that may or may not directly control drug infusionsbut are aware of the clinical context of drug administrationwill offer significant improvements over current manualcontrol of drug administration. The individual variability inPD behavior indicates that dosing schedules and controlalgorithms based on the PD model using the typical pop-ulation PD parameters reported in this study may havelimited performance. The ability to adapt the parameters inthe PD model to each individual in real time, even withsparse observations, will significantly improve the predic-tion performance in the individual patient [15]. Theimplementation of individualized dosing schedules andcontrol algorithms will reduce the risk of adverse events andpreserve spontaneous breathing.
This research was supported by the Natural Sciences and Engineering
Council of Canada and the Canadian Institute of Health Research
under their Collaborative Health Research Project program.
Conflict of interest: None.
APPENDIX
The metrics used to evaluate performance of the PDmodels are defined as follows. The prediction residual isthe difference between measured versus predicted endpoints:
rj tð Þ ¼ Ej tð Þ � Ej tð Þ; ð8Þ
where rj (t) is the residual of subject j at time t, and Ej (t)and Ej tð Þ denote measured and predicted end points,respectively. MDPE, MDAPE, and RMSNE are derivedfrom the percentage error:
ej tð Þ ¼ rj tð ÞEj tð Þ ; ð9Þ
where ej (t) denotes the percentage error of subject j attime t. MDPE, MDAPE, and RMSNE are defined by (9),(10) and (11), respectively:
MDPEj ¼ median ej tð Þ� �
; ð10Þ
MDAPEj ¼ median ej tð Þ�� ��� �
; ð11Þ
RMSNEj ¼ffiffiffiffiffiffiffiffiffiffiffiffiffiffiffiffiffiffiffiffiffiffiffi1
Nj
ej tð Þ�� ��2
2
s; ð12Þ
where MDPEj, MDAPEj and RMSNEj are MDPE,MDAPE and RMSNE of subject j, respectively, median isthe median value, Nj is the length of data associated withsubject j, and �k k2 is the Euclidian norm.
REFERENCES
1. McCormack J. Total intravenous anaesthesia in children.
Current Anaesthesia & Critical Care 2008; 19: 309–314.
2. Munoz HR, Leon PJ, Fuentes RS, Echevarrıa GC, Cortınez
LI. Prospective evaluation of the time to peak effect of propofol
to target the effect site in children. Acta Anaesthesiol Scand
2009; 53: 883–890.
Hahn et al.: Propofol-induced tidal volume depression 283
3. Dosani M, McCormack J, Reimer E, Brant R, Dumont GA,
Lim J, Ansermino JM. Slower administration of propofol
preserves adequate respiration in children. Pediatric Anesthesia
2010; 20: 1001–1008.
4. Kataria BK, Ved SA, Nicodemus HF, Hoy GR, Lea D, Dubois
MY, Mandema JW, Shafer SL. The pharmacokinetics of pro-
pofol in children using three different data analysis approaches.
Anesthesiology 1994; 80: 104–122.
5. Abosalom A, Kenny G. ‘‘Paedfusor’’ pharmacokinetic data set.
British Journal of Aneasthesia 2005; 95: 110 .
6. Cortınez LI, Munoz HR, Lopez R. Pharmacodynamics of
propofol in children and adults: comparison based on the
auditory evoked potentials index. Revista Espanola de Anes-
tesiologıa y Reanimacion 2006; 53: 289–296.
7. Jeleazcov C, Ihmsen H, Schmidt J, Ammon C, Schwilden H,
Schuttler J, Fechner J. Pharmacodynamic modeling of the bispectral
index response to propofol-based anesthesia during general surgery
in children. Br J Anaesth 2008; 100: 509–516.
8. MATLAB Optimization Toolbox User’s Guide. Natick:
MathWorks, 2010: 468–495.
9. MATLAB Statistics Toolbox User’s Guide. Natick: Math-
Works, 2010: 1588–1601.
10. Varvel JR, Donoho DL, Shafer SL. Measuring the predictive
performance of computer-controlled infusion pumps. J Phar-
macokinet Biopharm 1992; 20: 63–94.
11. Bouillon T, Bruhn J, Radu-Radulescu L, Andresen C, Cohane
C, Shafer SL. Mixed-effects modeling of the intrinsic ventila-
tory depressant potency of propofol in the non-steady-state.
Anesthesiology 2004; 100: 240–250.
12. Olofsen E, Boom M, Nieuwenhuijs D, Sarton E, Teppema L,
Aarts L, Dahan A. Modeling the non-steady state respiratory
effects of remifentanil in awake and propofol-sedated healthy
volunteers. Anesthesiology 2010; 112: 1382–1395.
13. Munoz HR, Cortınez LI, Ibacache ME, Leon PJ. Estimation of
the plasma effect site equilibration rate constant (ke0) of pro-
pofol in children using the time to peak effect: comparison
with adults. Anesthesiology 2004; 101: 1269–1274.
14. Nieuwenhuijs D, Olofsen E, Romberg R, Sarton E, Ward D,
Engbers F, Vuyk J, Mooren R, Teppema L, Dahan A.
Response surface modeling of remifentanil-propofol interac-
tion on cardiorespiratory control and bispectral index. Anes-
thesiology 2003; 98: 312–322.
15. Gilhuly TJ, Hutchings SR, Dumont GA, MacLeod BA.
Development and pilot testing of the neuromuscular blockade
advisory system. Comput Methods Programs Biomed 2008; 89:
179–188.
284 Journal of Clinical Monitoring and Computing
Copyright © 2022 FDOKUMEN