PEST MANAGEMENT PRACTICES OF COTTON GROWERS IN GUNTUR DISTRICT - AN EXPLORATIVE STUDY
37
PEST MANAGEMENT PRACTICES OF COTTON GROWERS IN GUNTUR DISTRICT - AN EXPLORATIVE STUDY M.Srinivasa Reddy PESTICIDES USE-THE LARGER DILEMMA Use of chemical pesticides and insecticides are the main component of pest and disease management practices. But heavy and unscientific dosages of chemical pesticides and application practices seriously affect the ecological and environmental balance. Pesticide usages also cause irreparable damage to human beings, either directly or indirectly. Seepage of heavy pesticide residues into water and soil makes the water polluted and soil diseased. Pollution makes the water un-potable, lowers fish production and contaminates the food. The effluents discharged by the pesticide manufacturing plants also get into the ‘food chain’. In Indian context, food commodities, for these reasons, right from wheat and rice to milk and milk-products are found to contain high levels of pesticide residues of DDT, BHC, Diledrin and Malathion. On an average an Indian’s body has the highest DDT levels in the world varying from 12.8 to 3.1 PPM. Further, WHO Centre for Economic and Social Studies, N.O. Campus, Begumpet, Hyderabad- 500016. I indeed thankful to prof. V. Reddappa Reddy for his valuable comments and suggestions.
Transcript of PEST MANAGEMENT PRACTICES OF COTTON GROWERS IN GUNTUR DISTRICT - AN EXPLORATIVE STUDY
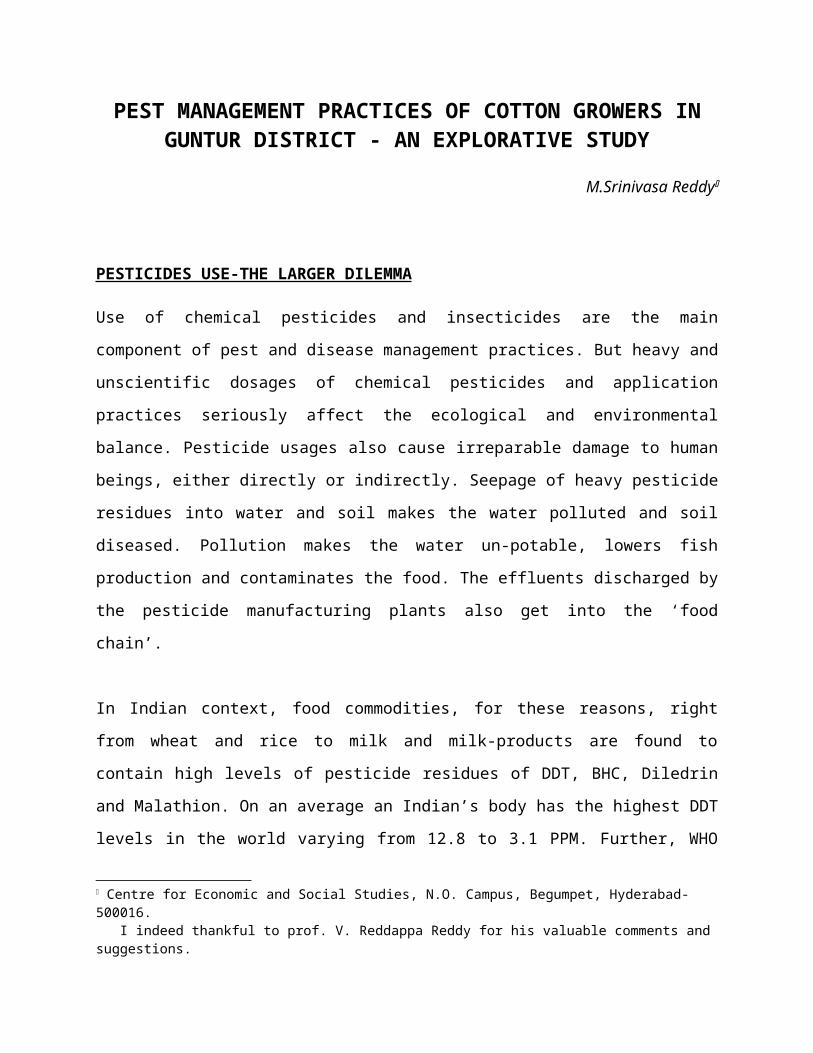
PEST MANAGEMENT PRACTICES OF COTTON GROWERS INGUNTUR DISTRICT - AN EXPLORATIVE STUDY
M.Srinivasa Reddy
PESTICIDES USE-THE LARGER DILEMMA
Use of chemical pesticides and insecticides are the main
component of pest and disease management practices. But heavy and
unscientific dosages of chemical pesticides and application
practices seriously affect the ecological and environmental
balance. Pesticide usages also cause irreparable damage to human
beings, either directly or indirectly. Seepage of heavy pesticide
residues into water and soil makes the water polluted and soil
diseased. Pollution makes the water un-potable, lowers fish
production and contaminates the food. The effluents discharged by
the pesticide manufacturing plants also get into the ‘food
chain’.
In Indian context, food commodities, for these reasons, right
from wheat and rice to milk and milk-products are found to
contain high levels of pesticide residues of DDT, BHC, Diledrin
and Malathion. On an average an Indian’s body has the highest DDT
levels in the world varying from 12.8 to 3.1 PPM. Further, WHO
Centre for Economic and Social Studies, N.O. Campus, Begumpet, Hyderabad-500016. I indeed thankful to prof. V. Reddappa Reddy for his valuable comments and suggestions.

has graded most of the pesticides used by Indian farmers as
hazardous (Ravi and Thimmaiah 1999:51). It was also established
that, usage of hazardous pesticides leads to asthma and skin
disorders, enlargement of liver, psychological problems and to
some extent, even degeneration of nerves, often resulting in
paralysis. It was further reported that pesticides poisoning is
causing large casualties (Parvinder 1997:50).
Apart from human dimension, the pesticides have also persisted
and accumulated in the environment and have harmed or
contaminated numerous animals or plants, not intended to be
targets (Charles 1976:44). Excessive use of chemical pesticides
is also resulting in resistance development, sudden resurgence of
target pests and induced outbreak of secondary pests. In fact,
the number of insect pests, resistant to insecticides, has shot
up from 12 in 1950 to more than 500 in 1990 (Ravi and Thimmaiah
1995:51). Worse still, the insect species turned resistant to the
pesticides. And, the same species need far more powerful
chemicals now to destroy them (Parvinder 1997:51). Pesticides
have not only killed the pests but also a host of natural
predators that normally keep the pests in check. Thus, by a
strange connivance, pesticides actually made it easier for the
pests to survive by destroying the opposition. Not only that,
pesticides use cannot be expected to give better harvest for
several years, and growing unwanted side effects may out- weigh
the positive results, as happened in Europe in early 70s (Ravi
2

and Thimmaiah 1995:51). If the problems of pest application are
such multi-faceted and destructive, does it rally worth
continuing the heavy pesticide application.
THE PROBLEM
Cotton is not only highly ‘pest attractive’ but also ‘pest
sensitive’. There fore, pest management has been an important
functional component of cotton farming. In fact, of the total
pesticides used farming, cotton alone accounts for 52-55 per cent
in Andhra Pradesh (Ravi and Thimmaiah 1995:50), indicating a
larger share of the total input cost. It was estimated that, the
plant protection alone accounts for 70 per cent of the total cost
of cotton cultivation (AICC 1989). Another estimate is that, the
cost of pesticides and labour charges in pesticide application to
about 40 per cent of total cost of cultivation (DAIC 1990: IV).
Which means, cotton cultivation has been capital intensive. Then,
Indian farmers being in usual debt trap, the capital requirements
of cotton cultivation are to be met with newer borrowings. But
cotton raising has become highly risky proposition, particularly,
owing to heavy pest problem. And, the pest menace has been
reported at regular intervals. One such instance plunges the
farmers family into an un-recoupable debt trap. And, the recent
multiple suicides of cotton farmers in south India reflect that.
To avoid such a devastation, economically available and ‘ less-
pesticide-intensive’ cultural methods are to be adopted. To
3

adopts such cultural practices, farmers must be well informed in
identifying different pests and diseases, understanding the
impact of each of one of them, knowledge of ‘Economic Threshold
Levels’ (ETLS) of different pests, cost benefit analysis of
pesticide application and application of right pesticide in right
dosage and at right time schedules. If farmers are not well
informed of these issues, that leads, normally, to either un-use
or under-use or over-use or mis-use of pesticides.
It is in this context, the present paper tries to assess the
knowledge of farmers in ‘less-pesticide-intensive’ methods. And,
whether are they adopting such methods. Adoption of ‘Integrated
Pest Management’ (IPM) on cotton was considered to be the ‘less –
pesticide-intensive’ method. The present paper tries to
understand, how far away the farmers are, in practice, from the
suggested ‘less –pesticide-intensive’ i.e. IPM methods.
INTEGRATED PEST MANAGEMENT EXPLAINED
Continuous pest problem on cotton crop between 1984 and 1988, has
broken the back-bone of agriculture of Gunter district. While
assessing the problem, Deputy Governor of Reserve Bank of India
and his team has enlisted six important reasons for the crisis in
the district. They are mono-cropping, excessive use of
nitrogenious fertilizers, indiscriminate use of synthetic
pyrethroids, use of sub-lethal doses and mixing of two or more
4

chemicals, improper coverage of spray fluid on the crop and use
of ineffective appliances. Based on this Report, Department of
Agriculture, Government of Andhra Pradesh has involved cotton
growers, scientists, extension staff and pesticide traders and
evolved an adaptable strategy. This strategy was allowed during
1988, 1989 and 1990 (DAIR 1990).
Subsequently, IPM practices were promoted, since 1990, to
minimize the usage of chemical pesticides, reduce the cost of
pesticide application, involving non-chemical component in pest
control and reduce the pollution levels. the IPM is a “pest
management system that in the context of the associated
environment and the population dynamics of the pest species,
utilizes all suitable techniques and methods in an compatible
manner as possible and maintains the pest population at levels
below those causing economic injury” (DPPQ&S:1). The IPM evolved
into a serious of activities. ‘Growing healthy crops, visiting
crops in fields regularly, under-standing biological control
agents and the agro-eco system and making farmers IPM experts’
are recognized as the main components of the programme (Peter E
1995:44).
OBJECTIVES
It is almost eight years since IPM was introduced. This time is
sufficient to understand different aspects of IPM by farmers.
More over, training centres are functioning to train the farmers.
5
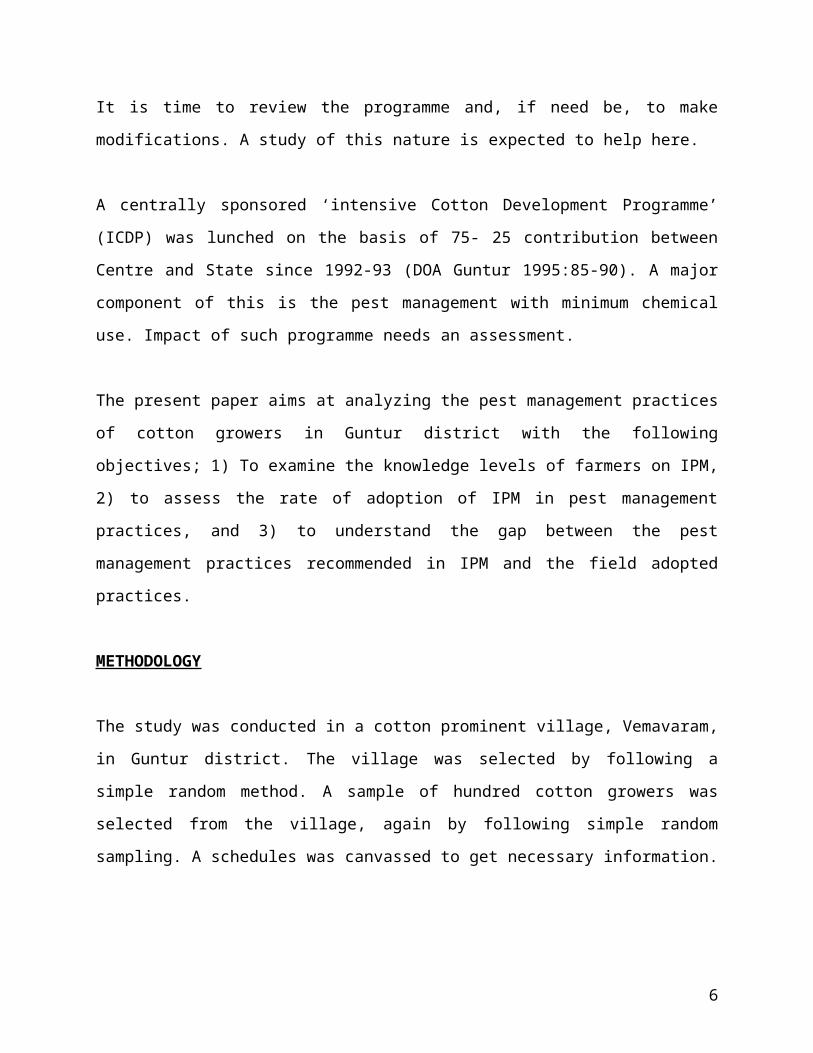
It is time to review the programme and, if need be, to make
modifications. A study of this nature is expected to help here.
A centrally sponsored ‘intensive Cotton Development Programme’
(ICDP) was lunched on the basis of 75- 25 contribution between
Centre and State since 1992-93 (DOA Guntur 1995:85-90). A major
component of this is the pest management with minimum chemical
use. Impact of such programme needs an assessment.
The present paper aims at analyzing the pest management practices
of cotton growers in Guntur district with the following
objectives; 1) To examine the knowledge levels of farmers on IPM,
2) to assess the rate of adoption of IPM in pest management
practices, and 3) to understand the gap between the pest
management practices recommended in IPM and the field adopted
practices.
METHODOLOGY
The study was conducted in a cotton prominent village, Vemavaram,
in Guntur district. The village was selected by following a
simple random method. A sample of hundred cotton growers was
selected from the village, again by following simple random
sampling. A schedules was canvassed to get necessary information.
6

The sample represents various castes and farm size categories.
Nearly 78 per cent of the sample respondents are literate. As
many as 72 per cent are owner cultivators and the rest tenants.
Twenty per cent are landless and 21 per cent have more than 10
acres of land. The tenants and small and marginal farmers are
mostly from Scheduled Castes and Tribes. The value of average
household and other assets owned by the respondent household was
Rs. 20,520. The average income per household was Rs. 15,615. The
land, household assets and income are distributed in fovour of
forward castes. The debts were more among forward caste
respondents as compared others.
The data and information was gathered on farming practices
staring from tilling of the land to harvesting of the crop. The
relevant areas covered are pest management methods adopted
through out the crop growth. To collect information, farmers are
mostly interviewed on the fileds using live specimens of pests
and insecticides. Farmers are also taken to the deceased plants.
In cases of need, both insects and affected plants are taken to
the farmers’ households for identification of insects and related
diseases.
The analysis was done by taking caste as an important factor. The
respondents are classified into four groups, namely, Forward
Caste, Backward Caste, Scheduled Castes and Scheduled Tribes.1
7

We have good number of reasons for conducting the analysis by
taken caste as a factor.
The IPM is knowledge intensive and skill oriented, as could be
seen from the various steps involved in it. Any issue which is
knowledge intensive and skill oriented can hardly be scale and
caste neutral. Further, it must be remembered that, caste and
class go together, more or less, in rural India. Caste and class
hierarchy determines, emphatically, the access to knowledge and
resources. This access allows few to use modern agro-technology
profitably.
When IPM is knowledge intensive, it demands fair level of
literacy. And, the level of literacy was better among the upper
castes as compared to Scheduled Castes and Scheduled Tribes. The
learning capacity at and advanced age was also more pronounced
among upper caste learners as compared to others. Which means,
the IPM programme particulars could be more easily conveyed to
upper caste farmers as compared to all other caste groups.
Apart from literacy, social awareness and functional education
are the important factors that decide the rate of adoption of
IPM. However, as is the case of literacy, social awareness is
also influenced by caste of the learners. It was observed that,
the forward caste learners achieved fair scores in social
awareness when compared to Scheduled Caste. Scheduled Tribes and
8

backward castes. The relationship between caste of the learners
and level of functionality also indicated that the forward caste
learners achieved fair scores, when compared to other caste
groups (Govindappa 1977).
While assessing the pest management practices, the chronological
order of crop growth are taken into account in the analysis, i.e.
from the stage of land preparation to crop harvesting. The IPM
practices suggested are taken as recommended practices. Any
deviation from these practices indicate the gap between the
optimum and adopted practices. The analysis was done under four
sections. Section-I deals with land preparation, seed treatment,
inter-cropping, crop rotation and contiguity of crop raising.
Section-II analysis the pest management practices to control
insects during the early stages of crop growth. Between early and
boll formation stages, eight different pests cause serious damage
to the cotton crop. Important aspects of these pest problems are
dealt in Section-III. Boll warms are the dangerous pests during
final stages of the crop growth. Major management practices in
their control are dealt in Section-IV.
SECTION – 1
LAND PREPARATION
Any serious attempt in pest management has to start from land
preparatory stage, and proposed land should be made pest free
before sowing. To achieve this, three important steps are
9

necessary. Firstly, any crop residues of the previous season left
on the field are to be removed. Cotton crop residues like stalk,
bolls, flowers and leaves of the previous season may contain
pests and diseases. Such residues in field help the completion of
life cycle of pests and insects and their multiplication. If the
crop residues of last year are completely removed and destroyed,
the pest impact can be reduced. Second aspect here is deep
ploughing of proposed land during summer. Normally, harvesting of
cotton crop ends during April every year. Deep ploughing of soils
immediately after the harvest has few significant advantages. It
exposes the pest residues of previous season, including
nematodes, to hot sun and also controls weed growth. Thirdly,
removal of pest friendly weeds is important. Uncontrolled weeds
during post-harvest period become the hosts fro pests and help
their survival. As a result, the next fresh crop raised in the
field attracts pests along with sprouting, since pest residues
are already living on the weeds. The control of weeds either by
deep ploughing or manual removal or by application of weedicides
during post-harvest season and pre-sowing days is necessary to
break the continuity of pest life in the lands. Table – 1 depicts
the practices adopted by sample households in land preparation.
Deep ploughing during summer was done only by 29 per cent of
the respondents. Adoption of this practice was more
pronounced among forward caste respondents as compared to
others.
10

A major problem in adopting deep ploughing, during summer,
seems to be owner ship of the land. About 75.0 per cent of
the Scheduled Caste, 80.0 per cent of backward caste
respondents are tenants. In the absence of legal agreement,
the tenancy ceases by the end of each crop season. Hence,
tenants evinced little interest in taking up tilling work
during summer. Further, by the time the tenancy agreement is
arrived for new crop, the sowing season (rainy season)was
already there. As a consequence deep ploughing was not done.
Removal of the crop residues was taken up by only 45.0 per
cent and it was more among forward castes as compared to
others. The forward castes complain of labour shortage for
residue removal. Tenants are not sure of tenancy for next
year , hence, they care a little for the removal of the
residues. Further, as already told, the unwritten tenancy
agreements are arrived only at the neck of the season and
the rush for immediate sowing comes in the way of removal of
the crop residues.
Pre-sowing weed removal was done, either through manual
removal or weedicides application, was done by only 25.0 per
cent of the respondents. All of them are from forward
castes. The important reasons reported for non-application
of weedicides by others were lack of awareness about the
usage of weedicides among poorer sections and financial
problems.
11
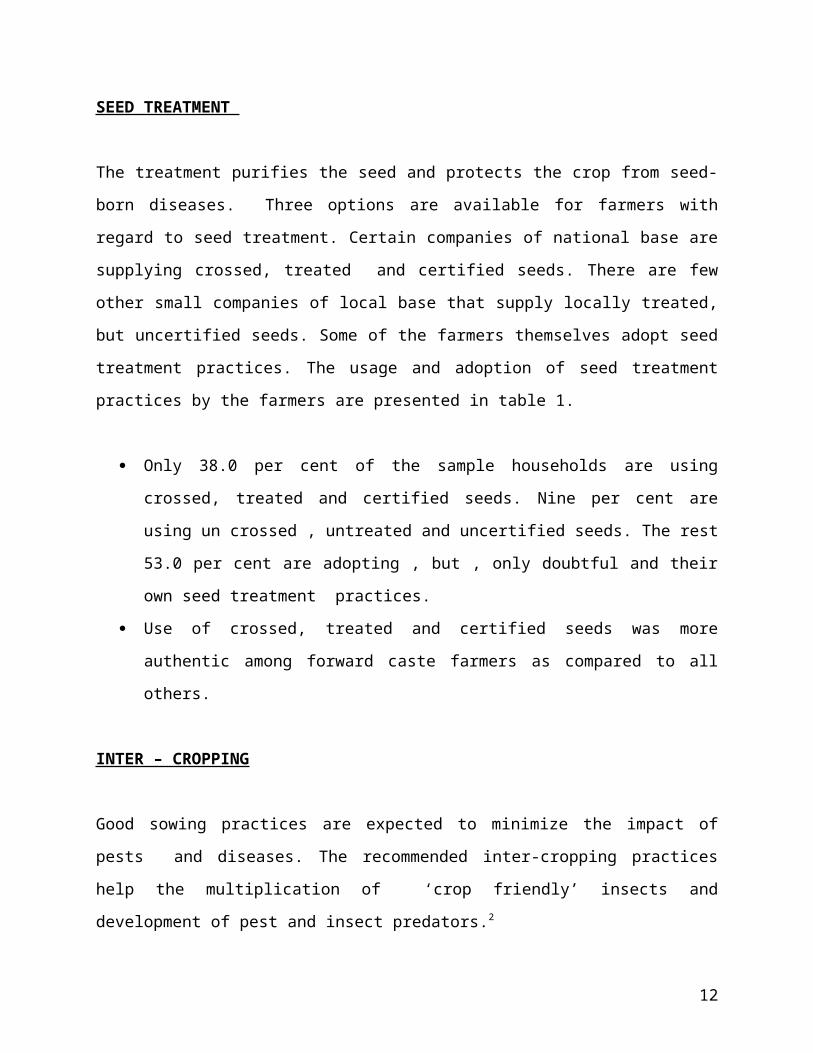
SEED TREATMENT
The treatment purifies the seed and protects the crop from seed-
born diseases. Three options are available for farmers with
regard to seed treatment. Certain companies of national base are
supplying crossed, treated and certified seeds. There are few
other small companies of local base that supply locally treated,
but uncertified seeds. Some of the farmers themselves adopt seed
treatment practices. The usage and adoption of seed treatment
practices by the farmers are presented in table 1.
Only 38.0 per cent of the sample households are using
crossed, treated and certified seeds. Nine per cent are
using un crossed , untreated and uncertified seeds. The rest
53.0 per cent are adopting , but , only doubtful and their
own seed treatment practices.
Use of crossed, treated and certified seeds was more
authentic among forward caste farmers as compared to all
others.
INTER – CROPPING
Good sowing practices are expected to minimize the impact of
pests and diseases. The recommended inter-cropping practices
help the multiplication of ‘crop friendly’ insects and
development of pest and insect predators.2
12

However, only 9.0 per cent of the sample farmers have
adopted pulses as an inter-crop along with cotton, and all
of them belong to forward castes.
Only red gram, one of the many pulses suggested, was adopted
as n inter – crop even by this small per cent age.
CROP ROTATION
Mono-cropping or intensive cultivation of cotton causes pest
outbreak easily. Intensive cropping and heavy fertilization
caused severe outbreak of white-fly on cotton during 1985
season, and this problem continued up to 1989 ( Rao 1992:10). A
more remunerative and ecologically suitable cropping system, that
help the balance of insect predators and parasites, was suggested
by their experts (AICC 1989:3). Instead of mono-cropping of
cotton, less preferred crops such as sesame, sorghum, soybean,
maize, groundnut and chilli are suggested as alternate crops
(CICR RS 1990:52). For crop rotation in irrigated tracts, rice,
wheat and jowar are recommended. For rain-fed areas groundnut
and jowar are suggested (cicr rs 1990 :35).
Farmers are enquired to state, since how long they are raising
only cotton, without any interruption, with an alternative crop,
between two crop seasons (TABLE 1)
13

Only 17.0 per cent have taken up cotton cultivation either
on new farms or on farms that had a minimum of ‘one crop
season gap’ (one year) in cotton growing.
About 67 per cent are raising cotton continuously on the
same fields for more than three crop seasons.
Scheduled Caste and tribe farmers are more prone to this
practice of same crop continuity
AVOIDANCE OF CINTIGUOUS COTTON FIELDS
Sowing of contiguous and large tracts of cotton helps the spread
of pest, insect and diseases on to every nook and corner of the
fields. The contiguity may be within own fields of a farmer
and/or neighbours ’ fields too. As such, it is being enquired
that, how many sample farmers have avoided the cotton raising on
contiguous fields (Table 1.)
More than three-fourths of the respondents have their
cotton crop surrounded by cotton itself.
Only 10.0 per cent of the household have no cotton crop
around their cotton fields.
SECTION – II
INSECTS DURING EARLLY STAGES OF THE CROP
14

The insect problem starts on cotton along with the spouting of
baby plant. Among 162 species of insects that are associated with
cotton, about 12 are of major importance, accounting for 50-60
per cent loss in production (CICR RS 1990 :39). However in Guntur
district, , jassids, aphids, thrips, white fly, red spider mite
and mealy bug are the six important insects.
Firstly, farmers must identify the insects, based on either the
features of insects or the features of affected plants. Later
suitable measure are to be adopted for their control. Mis-
identification, if any, leads to the application of unsuitable
insecticides causing to three important problems. (1) Existing
insects will not disappear and may continue to destroy the cop.
(2) Misuse or under use insecticides result in the development of
resisitance in insects, apart from destroying insect predactors,
environment and ecology. (3) The amount of money used on the
control of these insects also go waste. Hence, farmers were asked
to identify insects that cause damage to crops at early stage
(Table 2).
Jassids, aphids, thrips and whitefly are easily identified
by the farmers. There was only a very small number who could
not identify these four insects.
Red spider mire and mealy bugs are the two important insects
not identified by the farmers. In fact, 43.0 per cent are
mis-identified red spider mite and 56.0 mis-identified mealy
15
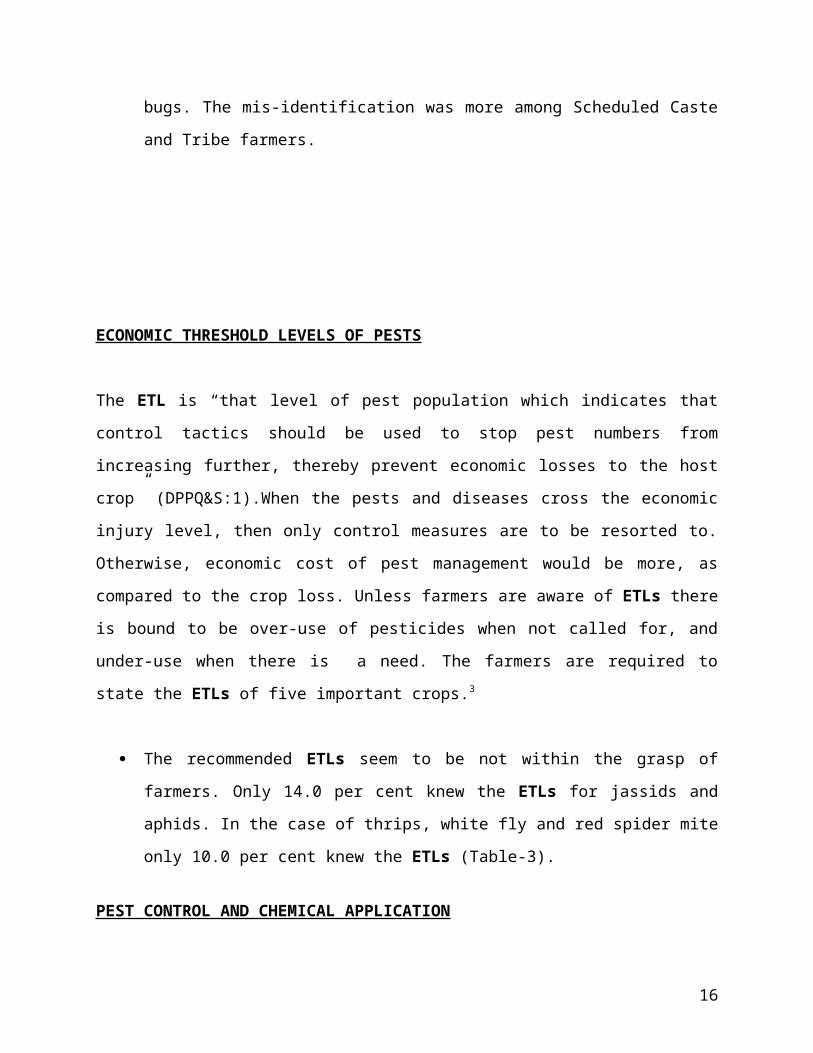
bugs. The mis-identification was more among Scheduled Caste
and Tribe farmers.
ECONOMIC THRESHOLD LEVELS OF PESTS
The ETL is “that level of pest population which indicates that
control tactics should be used to stop pest numbers from
increasing further, thereby prevent economic losses to the host
crop” (DPPQ&S:1).When the pests and diseases cross the economic
injury level, then only control measures are to be resorted to.
Otherwise, economic cost of pest management would be more, as
compared to the crop loss. Unless farmers are aware of ETLs there
is bound to be over-use of pesticides when not called for, and
under-use when there is a need. The farmers are required to
state the ETLs of five important crops.3
The recommended ETLs seem to be not within the grasp of
farmers. Only 14.0 per cent knew the ETLs for jassids and
aphids. In the case of thrips, white fly and red spider mite
only 10.0 per cent knew the ETLs (Table-3).
PEST CONTROL AND CHEMICAL APPLICATION
16
Suitable chemicals for different pests, timings of application,
their dosages and application practices are recommended by
different agencies.4 In the early stages of crop growth sucking
pests are the major problem. To control them, granule application
in the soils and spraying of chemicals on the crop are suggested
(Rao:32-33). Granule application is the best measure to control
all types of sucking pests at early stages. This will help in
following the ‘cradle to grave’ principle, and pests are killed
before they affect the crop. Knowledge and application are the
two important aspects in granule use. Farmers must have the
knowledge on ‘need for’ and ‘usefulness’ of granule application.
Farmers are enquired to state the need for granule application
their dosage levels, time schedule and actual practices of
granule application (table - 4).
Only 10.0 per cent know the purpose, dosages and time
schedule of the granule application. Even this poor per
centage is mostly represented from forward caste farmers.
Though only 10.0 per cent have the complete knowledge of
application, as many as 30.0 per cent have applied granules.
Less than half of this 30.0 per cent have applied the
granules in correct dosages and time schedule. The rest
have applied, but, neither in correct dosage nor in time
schedule.
Pests like jassids, aphids, thrips and white-fly can be
controlled by applying chemicals of recommended pesticides and
17

insecticides, methods, dosages and timings (Rao 1991: 32-33).
Farmers are enquired to state correct dosages of different
chemicals, time schedule and methods of application of chemicals
(Table - 5).
Only 32.0 per cent have clearly identified the right name
(popular name) of the suitable chemicals. Only 22.0 per
cent have the knowledge about right dosages and time
schedule.
Only 20.0 per cent have applied chemicals in right
dosages, timings and methods.
All other 80.0 per cent applied chemicals, but, some did
not apply the right dosages (48), few did not apply at
right time (20) and few others did not apply in the
method suggested (12). All this indicate the application
of chemicals, but mostly in under dosage, over dosage,
wrong timings, wrong methods and some times even wrong
chemicals.
SECTION – III
PEST PROBLEM DURING GROWING STAGES
Apart from the six insects, referred above, there are eight
more diseases that destroy the crop at a later age. They are
alternaria leaf spot, cercospora leaf spot, helmenthosporium leaf
spot, grey mildew, boll rot, wet weather blight (black arm) and
18

wilt (GCR 1991:39-41). Knowledge of the farmers on these pests
was studied and the results were presented in Table: 6.
More than 80.0 per cent have identified all eight
important diseases, except wilt.
About 50.0 per cent have correctly identified the
symptoms and correct control measures for each of the
seven pests. But in the case of wilt, the knowledge was
poor.
Caste continues to be an important factor in proper
identification of these diseases.
SECTION – IV
CONTROL OF BOLL WORMS
Boll worms create the real and critical pest problem. They
attack the crop, when it is nearer to the harvest. The loss due
to these pests would cost the farmer everything. Every thing in
this context includes, investment over one year on seeds, land
preparation, seeding, weeding, granule and its application,
pesticides and their application, water charges and returns for
the household labour and expected profits on one years’ crop.
The important boll worms on cotton are spotted boll worm,
heliothesis boll worm, spodeptera boll worm and pink boll worm.
19

Features of these boll worms and marks of their identification,
impact of the boll worms, chemicals for their control, dosages of
their control, and time schedules of chemical application are
provided by experts (Rao 1994:37 and GCR 1990:39-41). The
knowledge of farmers on different boll worms, their impact and
control measures adopted by farmers are presented in Table – 7.
All the respondents have identified the spotted boll
worm. As many as 74.0 per cent have correctly described
the impact of this worm. No less than 65.0 per cent has
correctly explained the control measures. All the
respondents have applied chemicals to control the worm.
Compared to the above encouraging picture, only 49.0 per
cent applied correct chemicals. The rest 51.0 per cent
applied, but only lost their money due to the misuse of
chemicals. Over dosage, mixing of more than one chemical
and use of synthetic pyrethroids, that are harmful to
crop growth, are the important problems.
Heliothis boll worm was also identified by all the
respondents. As many as 78.0 per cent have clearly
understood the impact of this worm and 62.0 per cent have
identified correct chemical control measures. In case of
this worm also, over dosage, mixing of more than one
chemical and usage of sythetic pyrethroids was reported.
All the sample identified the spodeptera boll worm, 78.0
per cent correctly explained impact and 67.0 per cent
20

correctly reported the control measures. Only 31.0 per
cent adopted recommended measures for its control. The
rest 69.0 per cent have adopted either overdose, mixing
of two or more chemicals and over usage of synthetic
pyrethroids. In fact, some of them have adopted even all
these three misuses together.
Identification of pink boll worm was done by 81.0 per
cent of the sample, impact was correctly reported by 64.0
per cent and 59.0 per cent knew the right measures of
chemical control. Only 52.0 per cent have adopted the
right control measures and 48.0 per cent have adopted
chemicals of false quantity, mixing and non-suitable
chemicals.
Sample farmers belonging to Scheduled Castes and Tribes
have some knowledge about the boll worms, but chemical
application practices adopted by them are very poor as
compared to others.
POLICY IMPLICATIONS
Based on the results of the study the following policy
implications may be arrived at: (1) Advantages of early tenancy
agreements be brought to the notice of both tenants and
landlords. (2)Alternative employment opportunities to
agricultural labourers are minimized during pre-sowing days, to
facilitate labour availability for crop residue and weed removal.
21
(3) Direct the IPM campaign more vigorously at Scheduled Castes
and Tribes, who matter most as tenants. (4) Economic Threshold
Levels should become part of the farmer’s education in IPM. (5)
Training of farmers on IPM should be field and live specimen
based, while explaining the pests and diseases rather than
training center based. (6) Instead of training farmers about all
the pests and diseases in one package at one time, seasonally in
training be followed at intervals on the need. For example,
training of farmers on deep ploughing summer and on granule
application immediately after the sowings completed.
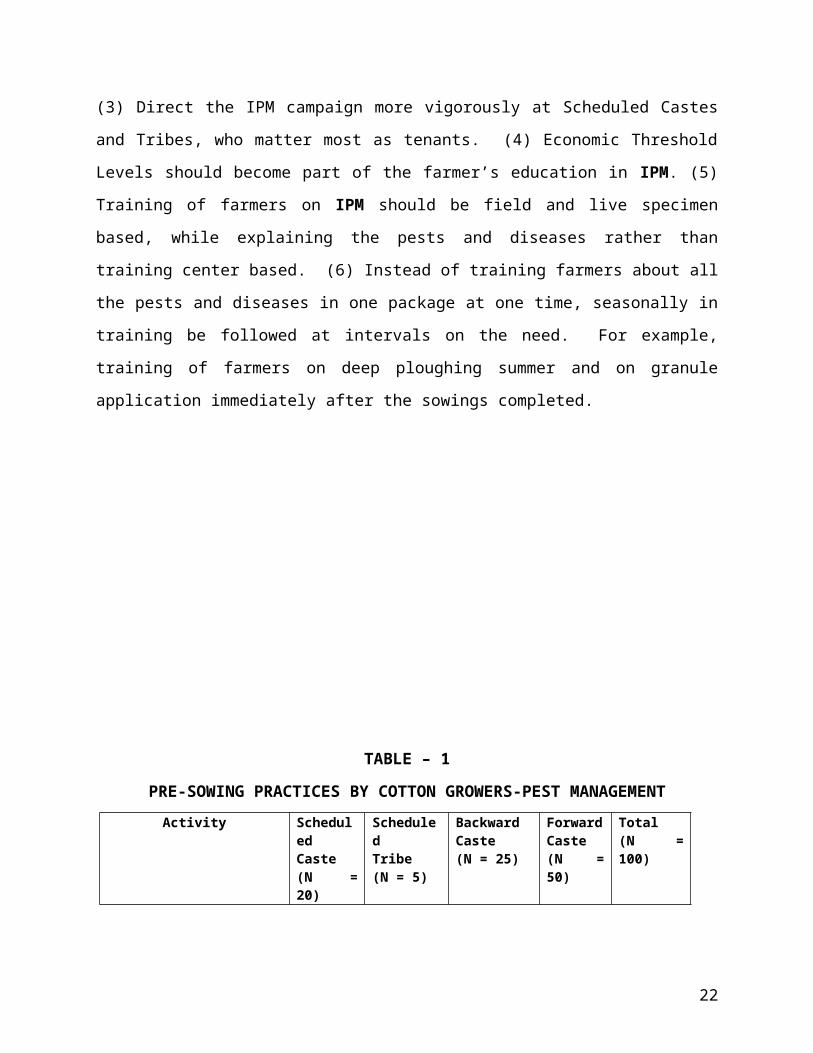
TABLE – 1
PRE-SOWING PRACTICES BY COTTON GROWERS-PEST MANAGEMENTActivity Schedul
edCaste(N =20)
ScheduledTribe(N = 5)
BackwardCaste(N = 25)
ForwardCaste(N =50)
Total(N =100)
22

LAND PREPARATIONRespondents adoptingdeep ploughing duringsummer
3(15.0)
1(20.0)
5(20.0)
20(40.0)
29
Respondents adoptingremoval of cropresidues
6(30.0)
1(20.0)
6(24.0)
32(64.0)
45
Respondents applyingweedicides/removingweeds
- - - 25(50.0)
25
SEED TREATMENTSowing crossed,treated and certifiedseeds
- 1 5 32 38
Sowing treated,uncertified andtruthful labeledseeds
5 2 15 6 28
Seed purchasedlocally, appliedcattle dung to removecoir on the seed andappliedBHC/pesticides
10 2 3 10 25
Seed purchasedlocally and appliedcattle dung to removecoir
5 - 2 2 9
CONTIGUITY OF COTTON FIELDS
All four sides only cotton 18 2 20 37 77
Two or three sides cotton 1 1 2 4 8One side cotton
1 1 1 2 5No cotton around the field - 1 2 7 10
MONO CROPPING
23

Since one season- 1 3 13 17
Since two seasons 2 - 2 12 16
Since 3-4 seasons 10 2 14 25 51Since 5 and above seasons 8 2 6 - 16
TABLE – 2
IDENTIFICATION OF PESTS BY THE SAMPLE FARMERSPest Identification Scheduled
Caste(N = 20)
ScheduledTribe(N = 5)
BackwardCaste
(N = 25)
ForwardCaste
(N = 50)Total
JASSIDS
Identified 17 4 23 50 94Not identified 3 1 2 - 6Mis-identified - - - - -
APHIDSIdentified 19 4 23 50 96Not identified 1 1 2 - 4Mis-identified - - - - -
THRIPSIdentified 17 4 21 50 92Not identified 3 1 4 - 8Mis-identified - - - - -
WHITE FLYIdentified 20 5 25 50 100Not identified - - - - -Mis-identified - - - - -
24

RED SPIDER MITEIdentified - - - 25 25Not identified 6 1 11 14 32Mis-identified 14 4 14 11 43
MEALY BUGIdentified - - 2 26 28Not identified 1 1 2 12 16Mis-identified 19 4 21 12 56
TABLE – 3
NUMBER OF THE RESPONDENTS CORRECTLY IDENTIFIED ETLs OF PESTS
Caste Jassids Aphid Thrips White Fly Red
Spider
MiteScheduledCaste(N = 20) 2 2 - - -
ScheduledTribe(N = 5) - - - - -
BackwardCaste(N = 25)
2 2 - - -
ForwardCaste(N = 50) 10 10 10 10 10
25

TOTAL(N = 100) 14 14 10 10 10
TABLE – 4KNOWLEDGE OF GRANULE APPLICATION AND METHODS OF APPLICATION TO CONTROL PESTS
Knowledge &
Application
ScheduledCaste
(N = 20)
ScheduledTribe(N = 5)
BackwardCaste
(N = 25)
ForwardCaste
(N = 50)Total
(N = 100)
KNOWLEDGE ON GRANULE USE
26

Respondents correctly knowing the need for granule application
- - 2 8 10
Respondents correctly knowing the dosages of granule application
- - 2 8 10
Respondents correctly knowing the time scheduleof granule application
- - 2 8 10
APPLICATION OF GRANULE
Respondents applied the correct quantity and in time schedule
- - 5 7 12
Respondents applied but did not follow the recommended quantity
1
-
1 2 4
Respondents applied but not followed the recommended time schedule
1 - 4 9 14
27

TABLE – 5
KNOWLEDGE AND APPLICATION OF CHEMICALS TO CONTROL INSECTS
Knowledge & Adoption
Scheduled
Caste(N = 20)
ScheduledTribe(N = 5)
Backward
Caste(N =25)
ForwardCaste
(N = 50)Total(N =100)
KNOWLEDGE DETAILS
Respondents correctly knowing the chemicals 3 1 7 21 32
Respondents correctly knowing the dosages 1 - 2 19 22
Respondents correctly knowing the time schedule - - 1 19 20
APPLICATION DETAILS
Respondents applied correct chemicals, dosageand timing
- - 1 19 20
Respondents applied correct chemicals and 11 3 16 18 48
28

dosage
Respondents applied but not in the time schedule suggested
2 1 6 11 20
TABLE – 6
IDENTIFICATION, SYMPTOMS AND CONTROL MEASURES OF VARIOUS DISEASES
Identification ScheduledCaste
(N = 20)
ScheduledTribe(N = 5)
BackwardCaste
(N = 25)
ForwardCaste(N =50)
Total(N =100)
ALTERNARIA LEAF SPOTCorrectly identified by name 15 3 20 45 83Symptoms correctlygiven
10 1 12 30 53
Control measures correctly suggested
10 1 12 30 53
CERCOSPORA LEAF SPOTCorrectly identified by name 15 3 20 45 83
29

Symptoms correctlygiven
10 1 12 30 53
Control measures correctly suggested
10 1 12 30 53
HELMENTHOSPORIUM LEAF SPOTCorrectly identified by name 15 3 20 45 83Symptoms correctlygiven
10 1 12 30 53
Control measures correctly suggested
10 1 12 30 53
GREW MILDOWCorrectly identified by name 13 3 20 48 84Symptoms correctlygiven
9 1 10 30 50
Control measures correctly suggested
7 1 7 25 40
BOLL ROTCorrectly identified by name 13 3 20 45 81Symptoms correctlygiven
9 1 12 30 52
Control measures correctly suggested
7 1 10 29 47
WET WEATHER BLIGHTCorrectly identified by name 13 3 22 45 85Symptoms correctlygiven
9 1 11 39 52
Control measures correctly suggested
7 1 10 29 47
WILTCorrectly identified by name 7 1 13 30 51Symptoms correctlygiven
- - 5 13 18
Control measures correctly suggested
- - - -
-
BACTERIAL BLIGHT
30

Correctly identified by name 17 4 24 43 88Symptoms correctlygiven
10 1 13 29 88
Control measures correctly suggested
7 1 10 22 40
TABLE - 7
IDENTIFICATION OF BOLL WORMS AND ADOPTION OF CONTROL MEASURES
Misuse of chemicals incontrol measures
Caste Identified by Name
Correctly
Impacton crop
correctlyexpressed
Controlmeasurescorrectlyexpressed
Controlmeasurescorrectlyexpressed
Controlmeasures
notcorrectlyadopted
Mixingtwo ormore
chemicals
Usage ofSyntheticPyrethroid
s
Over dosage of recommendedChemicals
SPOTTED BOLL WORMSchedul
edCaste
20 14 12 8 12 12 12 12
Scheduled
Tribe
5 2 1 1 4 3 3 4
Backward Caste
25 19 17 10 15 13 12 15
ForwardCaste
50 39 35 30 20 15 12 20
TOTAL 100 74 65 49 51 43 39 51
HELIOTHIS BOLL WORMSchedul
edCaste
20 15 12 8 12 11 10 10
Scheduled
Tribe
5 3 1 1 4 3 3 3
Backward Caste
25 20 17 12 13 14 19 13
ForwardCaste
50 40 32 27 23 17 40 15
TOTAL 100 78 62 48 52 45 72 41
SPODOPTERA BOLL WORM
31

Scheduled
Caste
20 15 11 8 12 10 11 10
Scheduled
Tribe
5 3 1 1 4 3 4 3
Backward Caste
25 20 16 12 13 14 15 12
ForwardCaste
50 40 39 30 20 16 17 15
TOTAL 100 78 67 51 49 43 47 40
PINK BOLL WORMSchedul
edCaste
15 11 10 8 12 11 8 12
Scheduled
Tribe
3 2 2 1 4 3 2 3
Backward Caste
20 14 12 11 14 14 16 12
ForwardCaste
43 37 35 32 18 17 30 17
TOTAL 81 64 59 52 48 45 56 44
NOTES:
1. This four way classification was followed based on thesegregation of society adopted by Government of AndhraPradesh in adopting its development and welfare measures.The scheduled caste and tribes are very poor by anyreckoning. Backward castes represent a section of theSociety who are poorer as compared to the forward castes,but are above scheduled castes and tribes. Forwardcastes represent a richer section as compared to theother three sections. These castes represent divergenteconomic levels and, as corollary, various investment andexpenditure capabilities. The investment capabilitiesindicates the expenditure on pesticides also. It is forthis reason only, this four way classification wasfollowed. Further, the existing social stratification
32

allows a lower level access to knowledge to scheduledcaste and tribes as compared to forward castes. Thisaccess allows the forward castes for more information onpest and diseases and the management practices. This isexpected to have considerable Impact on the pestmanagement practices of cotton growers.
2. The following reports, referred in this study, havesuggested various inter-crop methods: (1) Manual onIntegrated Pest Management on Cotton, (2) Technology forIncreasing Cotton Production in India, and (3) Cotton
3. ETLs for different diseases are presented in GunturCotton Report – 1990. District Agricultural InformationUnit, Department of Agriculture, Guntur District, p. 26(for jassids: 1 to 2 nymphs per leaf when two middleleaves per plant are observed, aphids: 15 to 20 per centplants infected, thrips: 1 to 2 nymphs adults per leaf,white fly: 5 to 10 flies per leaf when two top leaves andtwo middle leaves are observed and red spider mite: 10mites per square centimetre).
4. The important agencies that are working in these fieldsare: (1) The Central Pest Surveillance Centre, Nizamabad,(2) Andhra Pradesh Agricultural University, Hyderabad andits various affiliated colleges and research centers.(3) Indian Council of Agricultural Research, (4)Central Institute of Cotton Research, Coimbatore, and (5)All Indian Co-ordinated Cotton Improvement Project,Coimbatore.
REFERENCES
AICC (Agricultural Information & Communication Centre), Cotton,Andhra Pradesh Agricultural University, Rajendranagar, Hyderabad.
CICR (Central Institute for Cotton Research), Regional Station,Technology for Increasing Cotton Production in India, All India CoordinatedCotton Improvement Project, Coimbatore, Tamil Nadu, 1990.
33

Charles H Southwick, Ecology and the Quality of Our Environment, The JohnHopkins University, New York, 1976.
DOA (Department of Agriculture), Guidelines for Implementation ofC.G.S. Intensive Cotton Development Programme: During 1995-96 inGuntur District, Kharif Crop Production Plan 1995, Guntur District.
DPPQ&S : (Directorate of Plant Protection Quarantine andStorage), Manual on Integrated Pest Management in Cotton, Department ofAgriculture & Cooperation, Ministry of Agriculture, Government ofIndia.
District Agricultural Information Unit, The Guntur Cotton Report -1990, Department of Agriculture, Guntur District.
Govindappa K, Adult Education in Anantapur District : A Study on the Impact ofNational Literacy Mission (Ph.D Thesis submitted to S. K. University,Anantapur, 1994).
Parvinder Chawla, “Tackling Insects Pests”, Science Reporter, June 1997.
Peter E Kenmore etal, “Empowering Farmers: Experiences with Integrated PestManagement”, Agriculture and Rural Development, Vol. 2, No. 2/1995.
Ravi Kumar A and Thimmaiah A, “Pesticides: The Million Dollar Question”, Kurukshetra, May-June 1995.
- 0 - - 0 -
34

35

NOTES :
36

37