Effect of Frying Instructions for Food Handlers on Acrylamide Concentration in French Fries: An...
11
Effect of Frying Instructions for Food Handlers on Acrylamide Concentration in French Fries: An Explorative Study M. SANNY, 1,2 P. A. LUNING, 1 * S. JINAP, 2 E. J. BAKKER, 3 AND M. A. J. S. VAN BOEKEL 1 1 Product Design and Quality Management Group, Department of Agrotechnology and Food Sciences, Wageningen University, P.O. Box 8129, Bomenweg 2, NL-6700 EV Wageningen, The Netherlands; 2 Centre of Excellence for Food Safety Research, Faculty of Food Science and Technology, Universiti Putra Malaysia, 43400 Serdang, Selangor, Malaysia; and 3 Biometris, Applied Statistics, Department of Plant Sciences, Wageningen University, P.O. Box 100, 6708 PD Wageningen, The Netherlands MS 12-049: Received 27 January 2012/Accepted 10 August 2012 ABSTRACT The objective of this study was to obtain insight into the effect of frying instructions on food handlers’ control decisions in restaurants and to investigate the impact of control decisions on the variation and concentration of acrylamide in French fries. The concentrations of acrylamide and reducing sugars were analyzed, the frying temperature and time were measured, and thawing practices were observed. The results obtained before and after instructions were provided to the food handlers were compared for restaurants as a group and for each restaurant. Frying instructions supported food handlers’ decisions to start frying when the oil temperature reached 175uC; all handlers started frying at the correct temperature. However, the effect of the instructions on the food handlers’ decisions for frying time differed; most handlers increased the frying time beyond 240 s to achieve crispier French fries with a final color dictated by their preference. Providing instructions did not result in a significant difference in the mean concentration of acrylamide in French fries for the restaurants as a group. However, data analyzed for each restaurant revealed that when food handlers properly followed the instructions, the mean concentration of acrylamide was significantly lower (169 mg/ kg) than that before instructions were provided (1,517 mg/kg). When food handlers did not complying with the frying instructions, mean acrylamide concentrations were even higher than those before instructions were provided. Two different strategies were developed to overcome the noncompliant behavior of food handlers: establishing requirements for the features of commercial fryers and strict monitoring of compliance with instructions. Potato-based products, such as French fries, can contain high and variable concentrations of acrylamide, a compound that is probably carcinogenic for humans (7, 11, 20). Acrylamide concentrations in French fries as high as 3,500 mg/kg have been reported in the European Union acrylamide monitoring database (24). French fries are a predominant source of dietary exposure of acrylamide because they are widely consumed (10). The high acrylamide concentrations combined with high consumption could increase the dietary exposure for an individual by a factor of 5 over the average exposure of 2.8 mg/day (15). Control measures to reduce acrylamide exposure should therefore focus on food products that are both widely consumed and that contain high acrylamide concentrations, such as French fries (15). Various studies performed under controlled laboratory conditions have established the effect of lowering the concentration of reducing sugars on the reduction of acrylamide formation (10, 16). A study to validate the effectiveness of lowering sugar concentrations as a control measure in real food service establishments (FSEs) revealed that a lower mean concentration of acrylamide was obtained using par-fried potato strips with a low concentration of reducing sugars compared with commonly used potato strips (33). However, in addition to the concentration of reducing sugars, frying conditions (time and temperature) are major technological factors that influence acrylamide concentration, and food handlers’ variable and inadequate decisions concerning these conditions could also contribute to large variations in acrylamide concentrations (35). Sanny and coauthors (34) found that differences in frying equipment (digitally controlled fryers versus simple frying pans) and frying instructions (oral instructions versus no instructions at all) resulted in considerable differences in frying practices among food handlers in FSEs and to large variations and high acrylamide concentrations in French fries. Various authors have found that the actual frying practices among FSEs can differ considerably (1, 13, 25). For example, the setting of the frying temperature in fast- food establishments in New Zealand ranged from 175 to 190uC but the actual frying temperature ranged from 136 to 233uC (25). In another study, the frying temperatures in nearly 70% of restaurants and public catering facilities in Budapest were not controlled (13). Researchers have argued that food handlers’ variable and inadequate decisions could have a considerable impact on food quality, but the effects of these decisions have not been well studied (21–23). * Author for correspondence. Tel: z31 317 482087; Fax: z31 317 483669; E-mail: [email protected]. 462 Journal of Food Protection, Vol. 76, No. 3, 2013, Pages 462–472 doi:10.4315/0362-028X.JFP-12-049 Copyright G, International Association for Food Protection
Transcript of Effect of Frying Instructions for Food Handlers on Acrylamide Concentration in French Fries: An...

Effect of Frying Instructions for Food Handlers on AcrylamideConcentration in French Fries: An Explorative Study
M. SANNY,1,2 P. A. LUNING,1* S. JINAP,2 E. J. BAKKER,3 AND M. A. J. S. VAN BOEKEL1
1Product Design and Quality Management Group, Department of Agrotechnology and Food Sciences, Wageningen University, P.O. Box 8129, Bomenweg 2,
NL-6700 EV Wageningen, The Netherlands; 2Centre of Excellence for Food Safety Research, Faculty of Food Science and Technology, Universiti PutraMalaysia, 43400 Serdang, Selangor, Malaysia; and 3Biometris, Applied Statistics, Department of Plant Sciences, Wageningen University, P.O. Box 100,
6708 PD Wageningen, The Netherlands
MS 12-049: Received 27 January 2012/Accepted 10 August 2012
ABSTRACT
The objective of this study was to obtain insight into the effect of frying instructions on food handlers’ control decisions in
restaurants and to investigate the impact of control decisions on the variation and concentration of acrylamide in French fries. The
concentrations of acrylamide and reducing sugars were analyzed, the frying temperature and time were measured, and thawing
practices were observed. The results obtained before and after instructions were provided to the food handlers were compared for
restaurants as a group and for each restaurant. Frying instructions supported food handlers’ decisions to start frying when the oil
temperature reached 175uC; all handlers started frying at the correct temperature. However, the effect of the instructions on the
food handlers’ decisions for frying time differed; most handlers increased the frying time beyond 240 s to achieve crispier French
fries with a final color dictated by their preference. Providing instructions did not result in a significant difference in the mean
concentration of acrylamide in French fries for the restaurants as a group. However, data analyzed for each restaurant revealed
that when food handlers properly followed the instructions, the mean concentration of acrylamide was significantly lower (169 mg/
kg) than that before instructions were provided (1,517 mg/kg). When food handlers did not complying with the frying instructions,
mean acrylamide concentrations were even higher than those before instructions were provided. Two different strategies were
developed to overcome the noncompliant behavior of food handlers: establishing requirements for the features of commercial
fryers and strict monitoring of compliance with instructions.
Potato-based products, such as French fries, can contain
high and variable concentrations of acrylamide, a compound
that is probably carcinogenic for humans (7, 11, 20).Acrylamide concentrations in French fries as high as
3,500 mg/kg have been reported in the European Union
acrylamide monitoring database (24). French fries are a
predominant source of dietary exposure of acrylamide because
they are widely consumed (10). The high acrylamide
concentrations combined with high consumption could increase
the dietary exposure for an individual by a factor of 5 over the
average exposure of 2.8 mg/day (15). Control measures to
reduce acrylamide exposure should therefore focus on food
products that are both widely consumed and that contain high
acrylamide concentrations, such as French fries (15).Various studies performed under controlled laboratory
conditions have established the effect of lowering the
concentration of reducing sugars on the reduction of
acrylamide formation (10, 16). A study to validate the
effectiveness of lowering sugar concentrations as a control
measure in real food service establishments (FSEs) revealed
that a lower mean concentration of acrylamide was obtained
using par-fried potato strips with a low concentration of
reducing sugars compared with commonly used potato
strips (33). However, in addition to the concentration of
reducing sugars, frying conditions (time and temperature)
are major technological factors that influence acrylamide
concentration, and food handlers’ variable and inadequate
decisions concerning these conditions could also contribute
to large variations in acrylamide concentrations (35). Sanny
and coauthors (34) found that differences in frying
equipment (digitally controlled fryers versus simple frying
pans) and frying instructions (oral instructions versus no
instructions at all) resulted in considerable differences in
frying practices among food handlers in FSEs and to large
variations and high acrylamide concentrations in French
fries. Various authors have found that the actual frying
practices among FSEs can differ considerably (1, 13, 25).
For example, the setting of the frying temperature in fast-
food establishments in New Zealand ranged from 175 to
190uC but the actual frying temperature ranged from 136 to
233uC (25). In another study, the frying temperatures in
nearly 70% of restaurants and public catering facilities in
Budapest were not controlled (13). Researchers have argued
that food handlers’ variable and inadequate decisions could
have a considerable impact on food quality, but the effects
of these decisions have not been well studied (21–23).* Author for correspondence. Tel: z31 317 482087; Fax: z31 317
483669; E-mail: [email protected].
462
Journal of Food Protection, Vol. 76, No. 3, 2013, Pages 462–472doi:10.4315/0362-028X.JFP-12-049Copyright G, International Association for Food Protection

Control decisions are made to keep product properties
and processing conditions between certain acceptable
tolerances and, when necessary, to take corrective actions
(8, 22). Food handlers in an FSE do the actual frying, and
they make decisions daily to control product properties (e.g.,
sorting out fines or brown pieces of French fries) and
processing conditions (e.g., reducing frying time when
frying a smaller portion of frozen par-fried potato strips) (5,16). Likewise, managers can control food handlers’
behaviors by making decisions concerning noncompliance
(e.g., out-of-control actions) and administrative conditions
(e.g., providing procedures, instructions, decision-support
tools, and training). Administrative conditions are tailored to
direct and harmonize decision-making behavior (22). In
many cases, food handlers in restaurants use frying pans to
fry French fries. With a frying pan, handlers can decide only
when to start the frying (by visually inspecting the oil to
estimate its temperature) and when to end the frying (by
visually checking the color of the French fries). To our
knowledge, no data have been published on the quantitative
contribution of food handlers’ decisions during frying to the
concentration and variation of acrylamide. The objective of
this study was to obtain insight into the effect of frying
instructions on food handlers’ control decisions in restau-
rant-type FSEs and to investigate the impact of control
decisions on the concentration and variation of acrylamide
in French fries. Frying instructions that specified acceptable
frying practices were implemented to influence the food
handlers’ daily decisions concerning frying conditions, and
the extent of compliance with the frying instructions was
observed. Providing information about the required settings
and acceptable tolerances in the frying instructions can
support food handlers in adequately controlling the required
product properties and processing conditions. This control
may enable a more homogenous decision-making in out-of-
control situations to result in reduced variation in acrylam-
ide concentrations.
MATERIALS AND METHODS
Characteristics of restaurants. The study focused on
restaurants located within a 25-km radius of Serdang, Selangor,
Malaysia. This city is a typical urban area. Ten restaurants that
each had more than five workers were selected. The restaurants
types were family style, vegetarian, and cafe.
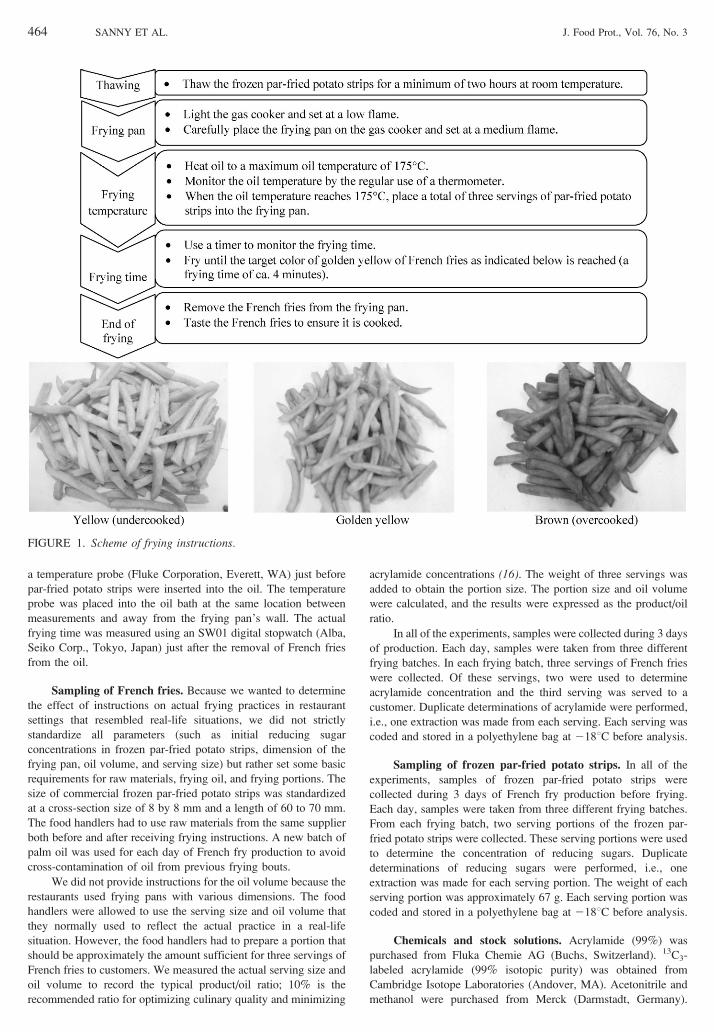
Development of instructions. The frying instructions were
developed using data from the literature and were designed to
include visual representation in the form of schematic diagrams
and pictures to make it easy for the food handlers to understand the
concepts and information. Thawing for a minimum of 2 h at room
temperature was stipulated in accordance with usual practice in
fast-food establishments (30). A frying temperature of 175uC was
selected because this temperature is recommended for restaurants
(5, 9, 14, 43). A frying time of 240 s (4 min) was selected because
the acrylamide concentration begins to increase exponentially after
4 min of frying at 180uC (32). A color card was included in the
frying instructions to illustrate the target color based on the advice
in the acrylamide ‘‘toolbox’’ of the Confederation of the Food and
Drink Industries of the European Union (5) to aim for a golden-
yellow color of French fries before ending the frying. We verified
the frying instructions in a preliminary experiment in the
laboratory, and the specified frying conditions resulted in the
target color of golden yellow after a frying time of 4 min at an
initial temperature of 175uC. In the preliminary experiment, which
was conducted using a frying pan, three servings of French fries
were added to 2 liters of oil. Each serving weighed approximately
67 g, i.e., the recommended serving size (38).
Implementation of instructions. The study comprised two
stages of experiments: before instructions and after instructions.
The first experiment was considered as a reference, in which a food
handler was asked to fry three servings of French fries in the usual
manner. In the second experiment, the written frying instructions
(Fig. 1) were explained to the food handlers in a training session.
The frying instructions specified the following: thaw the frozen
par-fried potato strips for a minimum of 2 h at room temperature;
heat oil to a maximum frying temperature of 175uC; place a total of
three servings of potato strips when the oil temperature reached
175uC; fry until the golden-yellow target color of the French fries
was reached, as indicated on the color card (corresponding to a
frying time of ca. 4 min).
In addition to the frying instructions, the food handler
received a digital thermometer and a digital stopwatch to measure
the frying temperature and time. The digital stopwatch produced a
beep to alert the food handler that the frying time of 4 min had
been reached. To increase awareness, the food handlers also
received an explanation about the formation of acrylamide and the
need to follow instructions to reduce exposure to acrylamide.
The training session started with a frying demonstration (first
frying) on how to fry the French fries according to the frying
instructions. Next, the food handler had to practice frying as
demonstrated (second frying) and to reproduce the method in the
third frying session. In the training session, the food handler was
instructed to start frying at 175uC (by regularly checking the
temperature with the digital thermometer). The food handler was also
instructed to stop frying after the target color of golden yellow had
been reached, as illustrated on the color card embedded in the frying
instructions. In addition, the food handler was asked if he understood
the frying instructions to verify that the correct frying procedure had
been learned. During the next three days of French-fry production,
the food handler was instructed to reproduce the frying following the
frying instructions. In each restaurant, the same food handler was
involved in both experiments, i.e., before and after instructions.
We considered the effect of the Hawthorne principle during
the 3 days of French fry production. The Hawthorne effect refers to
the tendency of food handlers to perform more responsibly when
they are participants in an experiment (39). During each day of
French fry production, we observed food handler behavior during
frying of three batches. We verified that the food handlers did not
modify their adherence to the frying instructions in response to
researchers’ presence during the 3 days of French fry production.
The food handlers acted normally when a researcher started to
observe them during frying of the first batch. These same food
handlers continued to act normally while the researcher continued
to observe them during frying of the second and third batches.
Ten restaurants participated in the experiment before in-
structions were given. However, only 7 of the 10 restaurants
participated in the experiment after instructions were given because
3 restaurants went out of business during the course of the study.
Measurements and observations. In all experiments, the
frying temperature and time were measured, and thawing practices
were observed and recorded. The actual (initial) frying temperature
was measured with a digital thermometer 51 series II coupled with
J. Food Prot., Vol. 76, No. 3 FRYING INSTRUCTIONS AS A CONTROL MEASURE IN RESTAURANTS 463
a temperature probe (Fluke Corporation, Everett, WA) just before
par-fried potato strips were inserted into the oil. The temperature
probe was placed into the oil bath at the same location between
measurements and away from the frying pan’s wall. The actual
frying time was measured using an SW01 digital stopwatch (Alba,
Seiko Corp., Tokyo, Japan) just after the removal of French fries
from the oil.
Sampling of French fries. Because we wanted to determine
the effect of instructions on actual frying practices in restaurant
settings that resembled real-life situations, we did not strictly
standardize all parameters (such as initial reducing sugar
concentrations in frozen par-fried potato strips, dimension of the
frying pan, oil volume, and serving size) but rather set some basic
requirements for raw materials, frying oil, and frying portions. The
size of commercial frozen par-fried potato strips was standardized
at a cross-section size of 8 by 8 mm and a length of 60 to 70 mm.
The food handlers had to use raw materials from the same supplier
both before and after receiving frying instructions. A new batch of
palm oil was used for each day of French fry production to avoid
cross-contamination of oil from previous frying bouts.
We did not provide instructions for the oil volume because the
restaurants used frying pans with various dimensions. The food
handlers were allowed to use the serving size and oil volume that
they normally used to reflect the actual practice in a real-life
situation. However, the food handlers had to prepare a portion that
should be approximately the amount sufficient for three servings of
French fries to customers. We measured the actual serving size and
oil volume to record the typical product/oil ratio; 10% is the
recommended ratio for optimizing culinary quality and minimizing
acrylamide concentrations (16). The weight of three servings was
added to obtain the portion size. The portion size and oil volume
were calculated, and the results were expressed as the product/oil
ratio.
In all of the experiments, samples were collected during 3 days
of production. Each day, samples were taken from three different
frying batches. In each frying batch, three servings of French fries
were collected. Of these servings, two were used to determine
acrylamide concentration and the third serving was served to a
customer. Duplicate determinations of acrylamide were performed,
i.e., one extraction was made from each serving. Each serving was
coded and stored in a polyethylene bag at 218uC before analysis.
Sampling of frozen par-fried potato strips. In all of the
experiments, samples of frozen par-fried potato strips were
collected during 3 days of French fry production before frying.
Each day, samples were taken from three different frying batches.
From each frying batch, two serving portions of the frozen par-
fried potato strips were collected. These serving portions were used
to determine the concentration of reducing sugars. Duplicate
determinations of reducing sugars were performed, i.e., one
extraction was made for each serving portion. The weight of each
serving portion was approximately 67 g. Each serving portion was
coded and stored in a polyethylene bag at 218uC before analysis.
Chemicals and stock solutions. Acrylamide (99%) was
purchased from Fluka Chemie AG (Buchs, Switzerland). 13C3-
labeled acrylamide (99% isotopic purity) was obtained from
Cambridge Isotope Laboratories (Andover, MA). Acetonitrile and
methanol were purchased from Merck (Darmstadt, Germany).
FIGURE 1. Scheme of frying instructions.
464 SANNY ET AL. J. Food Prot., Vol. 76, No. 3

Ultrapure water was used throughout the experiments (Purelab
Classic UV, Elga Labwater, Lane End, UK). Solid-phase extraction
cartridges (3 cc; Oasis Hydrophilic-Lipophilic Balance [HLB] and
Oasis Mixed-mode Cation-eXchange [MCX]) were supplied by
Waters Corp. (Milford, MA).
Stock solutions of acrylamide (0.2 mg/ml) and 13C3-labeled
acrylamide (4 mg/ml) were prepared by dissolution of the
compound in distilled water. Working standards were prepared
by dilution of the stock solution of acrylamide to concentrations of
0.5, 5, and 10 mg/ml with water. All stock solutions and working
standards were stored in a refrigerator at 4uC for a maximum of
3 months.
Method for the analysis of reducing sugars. The concen-
trations of reducing sugars were determined by high-performance
liquid chromatography (HPLC) as described previously (34). The
sample was ground in a blender (Braun Multiquik ZK3, Frankfurt,
Germany), a subsample (2 g) was weighed into a 50-ml centrifuge
tube, and 10 ml of acetonitrile-water (80:20, vol/vol) was added.
The suspension was then centrifuged at 1,643 RCF (| g) for
10 min, and the supernatant was passed through a 0.45-mm-pore-
size nylon syringe filter (Sartorius AG, Gottingen, Germany).
Aliquots (50 ml) of the filtrate were injected into a Waters HPLC
apparatus equipped with a refractive index detector and a
mBondapack NH2 column (3.9 by 300 mm; Waters Corp.). An
isocratic mode of elution was used with a mobile phase of
acetonitrile-water (80:20, vol/vol) at a flow rate of 0.8 ml/min.
Maltose was used as an internal standard. The calibration curves
were linear (r2 . 0.999). The detection limit for fructose and
glucose was 5 mg/kg. The recoveries for fructose ranged from 91.3
to 100.3%, and those for glucose ranged from 92.9 to 96.7%. The
intraday and interday precision was expressed as the relative
standard deviations: 4.6 and 6.7% (fructose) and 11.7 and 13.2%
(glucose), respectively.
Method for the analysis of acrylamide. Acrylamide was
determined by liquid chromatography tandem mass spectrometry
(LC-MS/MS) as previously described (33). The sample was ground
in a blender (Braun Multiquik ZK3), a subsample (2 g) was
weighed into a 50-ml centrifuge tube, and 10 ml of water that
contained 500 ng of 13C3-labeled acrylamide as the internal
standard (final concentration of 50 ng/ml) was added. The mixture
was shaken at medium speed (ca. 256 pulses per min) on a vertical
shaker (RS-1, Jeio Tech, Gyeonggi-do, Korea) for 10 min and then
centrifuged in a refrigerated centrifuge (3-18K, Sigma, Gillingham
Dorset, UK) at 10,956 RCF (| g) for 30 min. An approximately 2-
ml aliquot beneath the oil layer was collected with a syringe and
filtered through a 0.22-mm-pore-size nylon syringe filter (Sartorius
AG), and the filtrate was collected. Both the HLB and MCX
columns were conditioned with 2 ml of methanol and equilibrated
with 2 ml of water. The filtrate (1.0 ml) was loaded onto an HLB
cartridge, allowed to pass through the cartridge, and discarded. The
HLB cartridge was then washed with 1.0 ml of water, and this
eluate (eluate 1) was collected and allowed to pass through an
MCX cartridge. This eluate (eluate 2) was collected and transferred
to an amber vial for HPLC-MS/MS analysis.
Sample extracts and calibration standards were injected into
a Surveyor HPLC system equipped with a Hypercarb column
(2.1 mm by 50 mm by 5 mm; ThermoFisher Scientific, San
Jose, CA). The acrylamide was detected on a Thermo Scientific
TSQ Quantum Ultra triple quadrupole mass spectrometer,
which was operated in positive atmospheric pressure chemical
ionization mode. The standards contained acrylamide at
concentrations of 1, 5, 10, 25, 50, 100, 250, 500, and
1,000 ng/ml and isotopically labeled acrylamide at 50 ng/ml.
The injection volume was 10 ml.
The acrylamide was separated under isocratic conditions
using 100% water as the mobile phase at a flow rate of 0.15 ml/
min. The ion-transfer capillary temperature was maintained at
250uC, the vaporizer temperature was 375uC, and the discharge
current was 5 mA. The argon collision gas pressure was adjusted to
1.5 mTorr for the MS/MS. The collision energy was maintained at
9 eV for each monitored transition in selective reaction monitoring
mode. The monitored MS/MS transitions were m/z 72 . 55 for
acrylamide and 75 . 58 for 13C3-acrylamide. The scan time for
each monitored transition was maintained at 0.3 s, the scan width
was maintained at 0.010 m/z, and the Q1, Q3 resolution was
maintained at 0.7 m/z full width at half-mass.
The transitions m/z 72 . 55 for acrylamide and 75 . 58 for13C3-acrylamide were used for quantification, and m/z 72 . 55, 72
. 54, and 72 . 44 were used for confirmation of the peak identity.
A calibration graph was constructed by plotting the peak area of
acrylamide relative to that of the internal standard against the
corresponding ratios of analyte amounts. Acrylamide concentra-
tions in the sample extracts were calculated from the calibration
slopes and intercept values. The calibration curves were linear
(r2 . 0.999). The limit of detection was reached at 1 mg/kg, and
the recoveries were in the range of 100 to 108%. The intraday
and interday precision was expressed as the relative standard
deviations: 4.4 and 3.9%, respectively.
Statistical analysis. The original data for the acrylamide
concentration in each serving of the French fries samples were loge
transformed to construct histograms. The loge transformation was
performed to approximate a more normal distribution of the data
while retaining information about the degree of variation in the
distribution (6, 12, 18).
Three of the 10 restaurants did not participate in the
experiment after instructions were given because they had gone
out of business during the course of the study and were therefore
excluded from data analysis. For each restaurant, the mean of the
loge-transformed acrylamide concentration for the experiments
before and after instructions was calculated. Using this pair of
means, a paired-sample t test was performed to analyze differences
in the mean acrylamide concentration for the group of restaurants
before and after instructions. The obtained means of loge-
transformed acrylamide concentration were back-transformed to
an original scale of measurement and used as the geometric means
(2, 28). The coefficient of variation (CV) was calculated using the
formula 100(eSD 2 1), where SD is the standard deviation of
the loge-transformed acrylamide concentration (6, 18). The CV
compares the degree of variation for a group of restaurants before
and after instructions. The paired-sample t test also was used to
analyze differences in the frying temperature, the frying time, the
concentrations of reducing sugars, and the product/oil ratio for a
group of restaurants before and after instructions. The CV was
calculated as the standard deviation divided by the mean and
reported as a percentage.
An analysis of variance (ANOVA) with a mixed model was
used to analyze the pair of means of acrylamide concentration for
each restaurant before and after instructions. The experiment type
(before or after instructions) was included as a fixed effect, but the
establishment, sampling day, and frying batch were used as
random variables. The mixed model was selected because the
establishments, sampling days, and frying batches were not fixed
in advance, and their effects were therefore considered random. All
random variables were nested within the sampling level. A mixed
ANOVA model with the same variables was used to analyze the
J. Food Prot., Vol. 76, No. 3 FRYING INSTRUCTIONS AS A CONTROL MEASURE IN RESTAURANTS 465
pair of means of frying temperature and frying time for each
restaurant.
Bivariate correlations were used to investigate the strength
and direction of the relationship of acrylamide formation with
respect to a set of influencing factors (frying temperature, frying
time, concentration of reducing sugars, thawing time, and
product/oil ratio). The results were expressed as Pearson
correlations. Multiple linear regression analysis was used to
investigate the predictive ability of the set of influencing factors
and to assess the relative contribution of each influencing factor to
acrylamide formation. These influencing factors, considered to be
possible predictors for acrylamide formation, were included in the
model. Multiple regression analysis was checked for possible
violations from the model assumptions during analysis. In tests, a
P value of 0.05 or less was considered significant. Statistical
analyses were performed using SPSS version 16.0 (SPSS Inc.,
Chicago, IL).
RESULTS
The food handlers indicated that the frying instructions
were clear. When they did not comply with the frying
instructions (i.e., they extended the frying time beyond
240 s), they were asked to explain the reasons for their
behavior after they finished frying. The typical answers
were to obtain crispier French fries and to achieve a more
appropriate color according to their own preference.
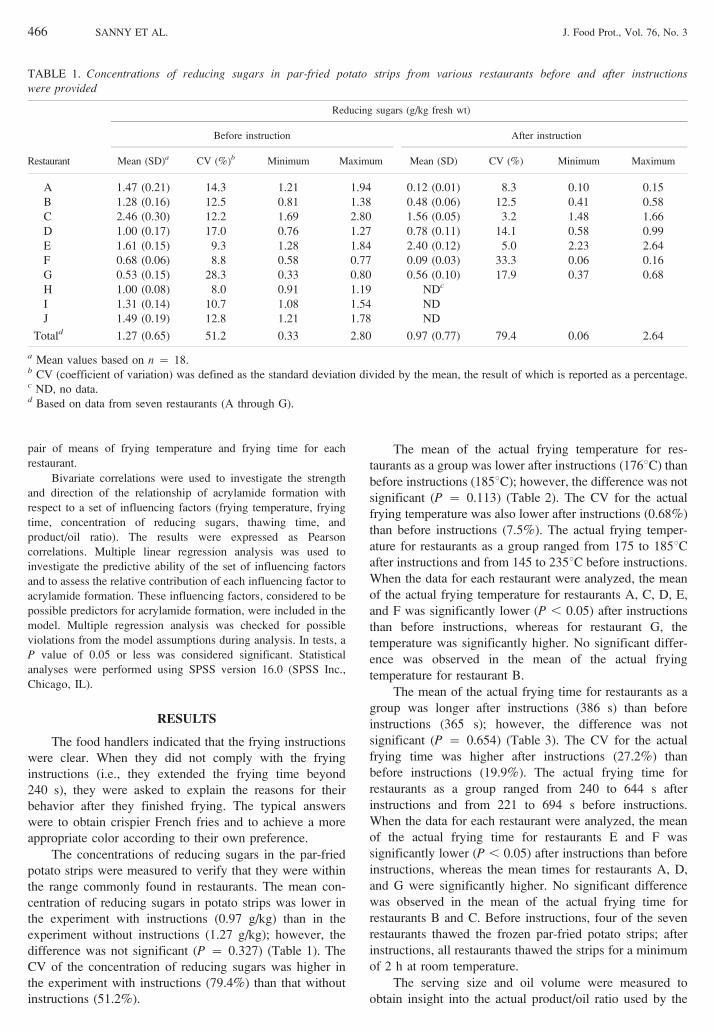
The concentrations of reducing sugars in the par-fried
potato strips were measured to verify that they were within
the range commonly found in restaurants. The mean con-
centration of reducing sugars in potato strips was lower in
the experiment with instructions (0.97 g/kg) than in the
experiment without instructions (1.27 g/kg); however, the
difference was not significant (P ~ 0.327) (Table 1). The
CV of the concentration of reducing sugars was higher in
the experiment with instructions (79.4%) than that without
instructions (51.2%).
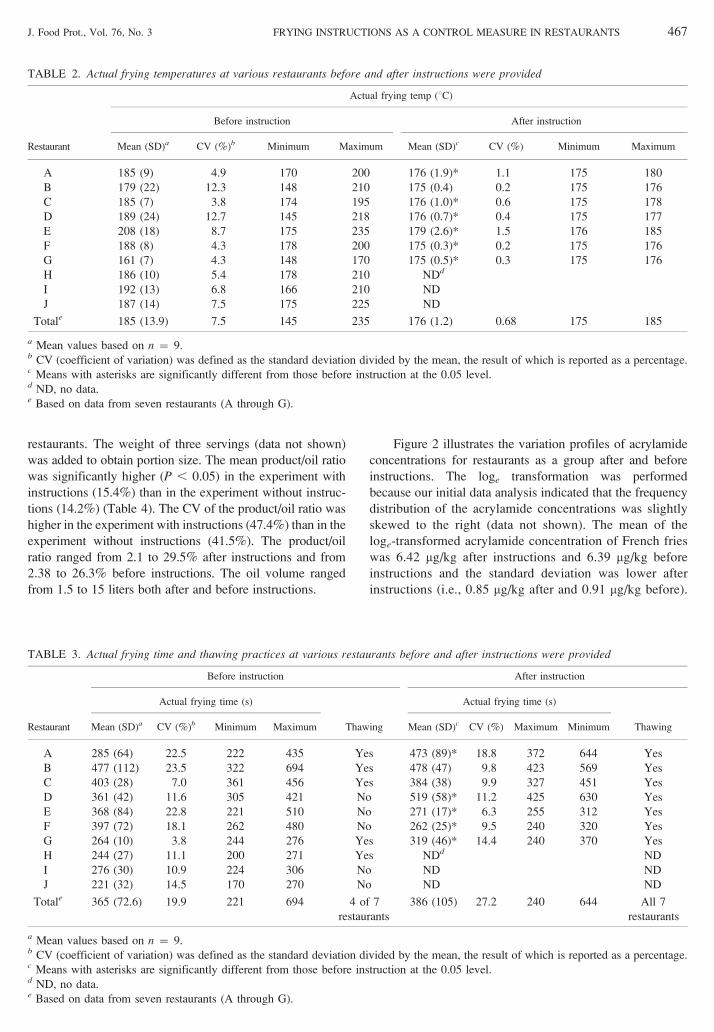
The mean of the actual frying temperature for res-
taurants as a group was lower after instructions (176uC) than
before instructions (185uC); however, the difference was not
significant (P ~ 0.113) (Table 2). The CV for the actual
frying temperature was also lower after instructions (0.68%)
than before instructions (7.5%). The actual frying temper-
ature for restaurants as a group ranged from 175 to 185uCafter instructions and from 145 to 235uC before instructions.
When the data for each restaurant were analyzed, the mean
of the actual frying temperature for restaurants A, C, D, E,
and F was significantly lower (P , 0.05) after instructions
than before instructions, whereas for restaurant G, the
temperature was significantly higher. No significant differ-
ence was observed in the mean of the actual frying
temperature for restaurant B.
The mean of the actual frying time for restaurants as a
group was longer after instructions (386 s) than before
instructions (365 s); however, the difference was not
significant (P ~ 0.654) (Table 3). The CV for the actual
frying time was higher after instructions (27.2%) than
before instructions (19.9%). The actual frying time for
restaurants as a group ranged from 240 to 644 s after
instructions and from 221 to 694 s before instructions.
When the data for each restaurant were analyzed, the mean
of the actual frying time for restaurants E and F was
significantly lower (P , 0.05) after instructions than before
instructions, whereas the mean times for restaurants A, D,
and G were significantly higher. No significant difference
was observed in the mean of the actual frying time for
restaurants B and C. Before instructions, four of the seven
restaurants thawed the frozen par-fried potato strips; after
instructions, all restaurants thawed the strips for a minimum
of 2 h at room temperature.
The serving size and oil volume were measured to
obtain insight into the actual product/oil ratio used by the
TABLE 1. Concentrations of reducing sugars in par-fried potato strips from various restaurants before and after instructionswere provided
Restaurant
Reducing sugars (g/kg fresh wt)
Before instruction After instruction
Mean (SD)a CV (%)b Minimum Maximum Mean (SD) CV (%) Minimum Maximum
A 1.47 (0.21) 14.3 1.21 1.94 0.12 (0.01) 8.3 0.10 0.15
B 1.28 (0.16) 12.5 0.81 1.38 0.48 (0.06) 12.5 0.41 0.58
C 2.46 (0.30) 12.2 1.69 2.80 1.56 (0.05) 3.2 1.48 1.66
D 1.00 (0.17) 17.0 0.76 1.27 0.78 (0.11) 14.1 0.58 0.99
E 1.61 (0.15) 9.3 1.28 1.84 2.40 (0.12) 5.0 2.23 2.64
F 0.68 (0.06) 8.8 0.58 0.77 0.09 (0.03) 33.3 0.06 0.16
G 0.53 (0.15) 28.3 0.33 0.80 0.56 (0.10) 17.9 0.37 0.68
H 1.00 (0.08) 8.0 0.91 1.19 NDc
I 1.31 (0.14) 10.7 1.08 1.54 ND
J 1.49 (0.19) 12.8 1.21 1.78 ND
Totald 1.27 (0.65) 51.2 0.33 2.80 0.97 (0.77) 79.4 0.06 2.64
a Mean values based on n ~ 18.b CV (coefficient of variation) was defined as the standard deviation divided by the mean, the result of which is reported as a percentage.c ND, no data.d Based on data from seven restaurants (A through G).
466 SANNY ET AL. J. Food Prot., Vol. 76, No. 3
restaurants. The weight of three servings (data not shown)
was added to obtain portion size. The mean product/oil ratio
was significantly higher (P , 0.05) in the experiment with
instructions (15.4%) than in the experiment without instruc-
tions (14.2%) (Table 4). The CV of the product/oil ratio was
higher in the experiment with instructions (47.4%) than in the
experiment without instructions (41.5%). The product/oil
ratio ranged from 2.1 to 29.5% after instructions and from
2.38 to 26.3% before instructions. The oil volume ranged
from 1.5 to 15 liters both after and before instructions.
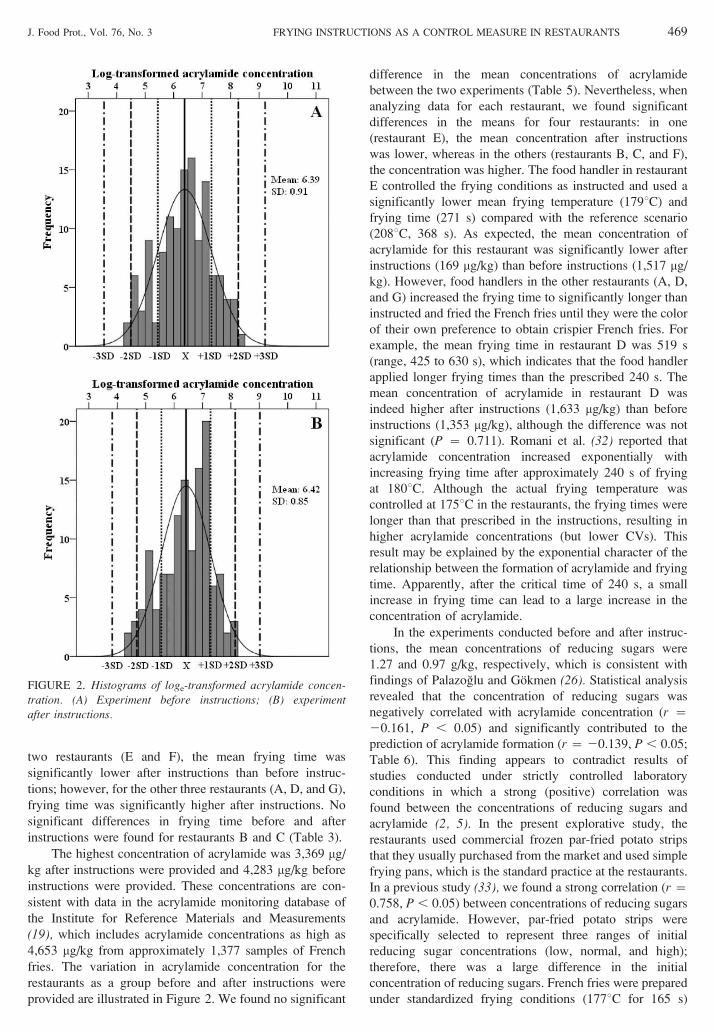
Figure 2 illustrates the variation profiles of acrylamide
concentrations for restaurants as a group after and before
instructions. The loge transformation was performed
because our initial data analysis indicated that the frequency
distribution of the acrylamide concentrations was slightly
skewed to the right (data not shown). The mean of the
loge-transformed acrylamide concentration of French fries
was 6.42 mg/kg after instructions and 6.39 mg/kg before
instructions and the standard deviation was lower after
instructions (i.e., 0.85 mg/kg after and 0.91 mg/kg before).
TABLE 2. Actual frying temperatures at various restaurants before and after instructions were provided
Restaurant
Actual frying temp (uC)
Before instruction After instruction
Mean (SD)a CV (%)b Minimum Maximum Mean (SD)c CV (%) Minimum Maximum
A 185 (9) 4.9 170 200 176 (1.9)* 1.1 175 180
B 179 (22) 12.3 148 210 175 (0.4) 0.2 175 176
C 185 (7) 3.8 174 195 176 (1.0)* 0.6 175 178
D 189 (24) 12.7 145 218 176 (0.7)* 0.4 175 177
E 208 (18) 8.7 175 235 179 (2.6)* 1.5 176 185
F 188 (8) 4.3 178 200 175 (0.3)* 0.2 175 176
G 161 (7) 4.3 148 170 175 (0.5)* 0.3 175 176
H 186 (10) 5.4 178 210 NDd
I 192 (13) 6.8 166 210 ND
J 187 (14) 7.5 175 225 ND
Totale 185 (13.9) 7.5 145 235 176 (1.2) 0.68 175 185
a Mean values based on n ~ 9.b CV (coefficient of variation) was defined as the standard deviation divided by the mean, the result of which is reported as a percentage.c Means with asterisks are significantly different from those before instruction at the 0.05 level.d ND, no data.e Based on data from seven restaurants (A through G).
TABLE 3. Actual frying time and thawing practices at various restaurants before and after instructions were provided
Restaurant
Before instruction After instruction
Actual frying time (s)
Thawing
Actual frying time (s)
ThawingMean (SD)a CV (%)b Minimum Maximum Mean (SD)c CV (%) Maximum Minimum
A 285 (64) 22.5 222 435 Yes 473 (89)* 18.8 372 644 Yes
B 477 (112) 23.5 322 694 Yes 478 (47) 9.8 423 569 Yes
C 403 (28) 7.0 361 456 Yes 384 (38) 9.9 327 451 Yes
D 361 (42) 11.6 305 421 No 519 (58)* 11.2 425 630 Yes
E 368 (84) 22.8 221 510 No 271 (17)* 6.3 255 312 Yes
F 397 (72) 18.1 262 480 No 262 (25)* 9.5 240 320 Yes
G 264 (10) 3.8 244 276 Yes 319 (46)* 14.4 240 370 Yes
H 244 (27) 11.1 200 271 Yes NDd ND
I 276 (30) 10.9 224 306 No ND ND
J 221 (32) 14.5 170 270 No ND ND
Totale 365 (72.6) 19.9 221 694 4 of 7
restaurants
386 (105) 27.2 240 644 All 7
restaurants
a Mean values based on n ~ 9.b CV (coefficient of variation) was defined as the standard deviation divided by the mean, the result of which is reported as a percentage.c Means with asterisks are significantly different from those before instruction at the 0.05 level.d ND, no data.e Based on data from seven restaurants (A through G).
J. Food Prot., Vol. 76, No. 3 FRYING INSTRUCTIONS AS A CONTROL MEASURE IN RESTAURANTS 467

No significant difference was found in the mean
concentration of acrylamide for restaurants as a group (P~ 0.93) (Table 5). The mean concentration of acrylamide
was higher after (614 mg/kg) than before (596 mg/kg)
instructions; however, the CV of the acrylamide concentration
was lower after instructions (134%) than before instructions
(148%). The acrylamide concentration ranged from 85 to
3,369 mg/kg after instructions and from 77 to 4,283 mg/kg
before instructions. When data for each restaurant were
analyzed, the mean concentration of acrylamide for restaurant
E was significantly lower (P , 0.05) after instructions
(169 mg/kg) than before instructions (1,517 mg/kg). The mean
concentrations of acrylamide after instructions for restaurants
B, C, and F were significantly higher (715, 961, and 239 mg/
kg, respectively) than before instructions (271, 506, and
134 mg/kg, respectively). For restaurants A, D, and G, no
significant difference in acrylamide concentration was found
before and after instructions.
A small but significant correlation was found between
the frying time and the acrylamide concentration (r ~
0.228, n ~ 360, P , 0.05) (Table 6). A small negative
correlation was found between the concentration of reducing
sugars and the acrylamide concentration (r ~ 20.161, n ~
360, P , 0.05), and a small but significant correlation was
found between thawing practice and acrylamide concentra-
tion (r ~ 0.142, n ~ 360, P , 0.05). Both frying
temperature (r ~ 0.013, n ~ 360, P ~ 0.816) and product/
oil ratio (r ~ 0.033, n ~ 360, P ~ 0.570) were not
significantly correlated with the acrylamide concentration.
The multiple linear regression model revealed that all
factors (except the product/oil ratio) significantly contribut-
ed to the prediction of acrylamide formation (r2 ~ 0.104,
n ~ 360, P , 0.05). The order of contributions, from
highest to lowest, are frying time (beta ~ 0.259), thawing
practice (beta ~ 0.179), frying temperature (beta ~ 0.173),
and reducing sugars (beta ~ 20.125).
DISCUSSION
To our knowledge, this study is one of the first to
quantify the effect of frying instructions on food handlers’
control decisions with respect to food quality. After
instructions were given, a lower mean frying temperature
(176uC) with a smaller CV (0.68%) was found compared
with before instructions were given (185uC, 7.5%),
although the differences in mean frying temperature and
time for the restaurants as a group before and after
instructions were not significant. A longer mean frying
time (386 s) with a larger CV (27.2%) was found after
instructions compared with before instructions (365 s,
19.9%). Bivariate correlations and multiple linear regression
analyses revealed that frying time was significantly (but
weakly) correlated with acrylamide concentration (r ~
0.228, P , 0.05) and contributed the most to the prediction
of acrylamide formation (beta ~ 0.221, P , 0.05). Frying
temperature was not significantly correlated with acrylamide
concentration (r ~ 0.013, P ~ 0.408); however, temper-
ature made a significant (but small) contribution to the
prediction of acrylamide formation (r ~ 0.153, P , 0.05;
Table 6). When we analyzed the data for each restaurant, we
found that the mean frying temperature in all restaurants
(except restaurant G) was significantly lower after instruc-
tions than before instructions (Table 2). Apparently, the
instructions and measuring equipment supported food
handlers’ decisions to start frying when the oil reached
175uC, but an inconsistent effect of the instructions on the
food handlers’ decisions to end frying was observed. For
TABLE 4. Actual product/oil ratio, portion size, and oil volume at various restaurants before and after instructions were provided
Restaurant
Before instruction After instruction
Oil volume
(liters)d
Product/oil ratio (%)
Mean (SD)
portion size (g)c
Product/oil ratio (%)
Mean (SD)
portion size (g)
Mean
(SD)aCV
(%)b Minimum Maximum
Mean
(SD)
CV
(%) Maximum Minimum
A 20.7 (3.1) 14.9 17.2 26.3 415 (62) 22.1 (0.9) 4.1 20.0 23.0 442 (20) 2
B 11.1 (0.8) 7.2 9.96 11.8 561 (68) 10.0 (1.2) 12.0 8.57 12.5 499 (58) 5
C 18.9 (1.4) 7.4 17.0 21.5 473 (36) 14.7 (0.9) 6.1 13.4 15.8 368 (22) 2.5
D 16.9 (1.8) 10.7 14.8 20.0 254 (27) 25.4 (2.5) 9.8 21.2 29.5 381 (37) 1.5
E 15.3 (1.4) 9.2 13.5 17.6 459 (43) 15.6 (1.5) 9.6 13.5 18 468 (45) 3
F 14.1 (2.8) 19.9 8.48 17.9 415 (64) 17.4 (2.4) 13.8 15.1 22.6 523 (73) 3
G 2.6 (0.2) 7.7 2.38 2.97 387 (28) 2.4 (0.2) 8.3 2.10 2.77 364 (34) 15
H 5.1 (0.4) 7.8 4.74 6.0 400 (38) NDe 8
I 13.6 (1.5) 11.0 10.9 15.8 271 (31) ND 2
J 7.6 (1.0) 13.2 5.78 9.04 303 (32) ND 4
Total f 14.2 (5.9) 41.5 2.38 26.3 423 (100) 15.4 (7.3)* 47.4 2.10 29.5 435 (74) 4.6
a Mean values based on n ~ 9.b CV (coefficient of variation) was defined as the standard deviation divided by the mean, the result of which is reported as a percentage.c The weight of three servings was added to obtain portion size.d Data for both before and after instruction.e ND, no data.f Based on data from seven restaurants (A through G). Asterisks indicates that means before and after instruction are significantly different
at the 0.05 level.
468 SANNY ET AL. J. Food Prot., Vol. 76, No. 3
two restaurants (E and F), the mean frying time was
significantly lower after instructions than before instruc-
tions; however, for the other three restaurants (A, D, and G),
frying time was significantly higher after instructions. No
significant differences in frying time before and after
instructions were found for restaurants B and C (Table 3).
The highest concentration of acrylamide was 3,369 mg/
kg after instructions were provided and 4,283 mg/kg before
instructions were provided. These concentrations are con-
sistent with data in the acrylamide monitoring database of
the Institute for Reference Materials and Measurements
(19), which includes acrylamide concentrations as high as
4,653 mg/kg from approximately 1,377 samples of French
fries. The variation in acrylamide concentration for the
restaurants as a group before and after instructions were
provided are illustrated in Figure 2. We found no significant
difference in the mean concentrations of acrylamide
between the two experiments (Table 5). Nevertheless, when
analyzing data for each restaurant, we found significant
differences in the means for four restaurants: in one
(restaurant E), the mean concentration after instructions
was lower, whereas in the others (restaurants B, C, and F),
the concentration was higher. The food handler in restaurant
E controlled the frying conditions as instructed and used a
significantly lower mean frying temperature (179uC) and
frying time (271 s) compared with the reference scenario
(208uC, 368 s). As expected, the mean concentration of
acrylamide for this restaurant was significantly lower after
instructions (169 mg/kg) than before instructions (1,517 mg/
kg). However, food handlers in the other restaurants (A, D,
and G) increased the frying time to significantly longer than
instructed and fried the French fries until they were the color
of their own preference to obtain crispier French fries. For
example, the mean frying time in restaurant D was 519 s
(range, 425 to 630 s), which indicates that the food handler
applied longer frying times than the prescribed 240 s. The
mean concentration of acrylamide in restaurant D was
indeed higher after instructions (1,633 mg/kg) than before
instructions (1,353 mg/kg), although the difference was not
significant (P ~ 0.711). Romani et al. (32) reported that
acrylamide concentration increased exponentially with
increasing frying time after approximately 240 s of frying
at 180uC. Although the actual frying temperature was
controlled at 175uC in the restaurants, the frying times were
longer than that prescribed in the instructions, resulting in
higher acrylamide concentrations (but lower CVs). This
result may be explained by the exponential character of the
relationship between the formation of acrylamide and frying
time. Apparently, after the critical time of 240 s, a small
increase in frying time can lead to a large increase in the
concentration of acrylamide.
In the experiments conducted before and after instruc-
tions, the mean concentrations of reducing sugars were
1.27 and 0.97 g/kg, respectively, which is consistent with
findings of Palazoglu and Gokmen (26). Statistical analysis
revealed that the concentration of reducing sugars was
negatively correlated with acrylamide concentration (r ~
20.161, P , 0.05) and significantly contributed to the
prediction of acrylamide formation (r ~ 20.139, P , 0.05;
Table 6). This finding appears to contradict results of
studies conducted under strictly controlled laboratory
conditions in which a strong (positive) correlation was
found between the concentrations of reducing sugars and
acrylamide (2, 5). In the present explorative study, the
restaurants used commercial frozen par-fried potato strips
that they usually purchased from the market and used simple
frying pans, which is the standard practice at the restaurants.
In a previous study (33), we found a strong correlation (r ~
0.758, P , 0.05) between concentrations of reducing sugars
and acrylamide. However, par-fried potato strips were
specifically selected to represent three ranges of initial
reducing sugar concentrations (low, normal, and high);
therefore, there was a large difference in the initial
concentration of reducing sugars. French fries were prepared
under standardized frying conditions (177uC for 165 s)
FIGURE 2. Histograms of loge-transformed acrylamide concen-tration. (A) Experiment before instructions; (B) experimentafter instructions.
J. Food Prot., Vol. 76, No. 3 FRYING INSTRUCTIONS AS A CONTROL MEASURE IN RESTAURANTS 469

using fryers equipped with a temperature controller and a
timer. We concluded that a decrease in the concentration
of reducing sugars can be an effective control measure;
however, other factors that affect the temperature-time
profile of frying oil need to be strictly controlled to further
reduce the variation in acrylamide production. The effect
of reducing sugars in the present study may have been
overruled by other factors, such as frying time and temperature,
in agreement with our previous observations (34). These
findings highlight the importance of validating the results of
controlled laboratory in actual food processing settings, as
previously emphasized by other authors (5, 40).The mean product/oil ratio was 15.4% for the
experiment after instructions and 14.2% for the experiment
before instructions, which indicates that restaurants did not
implement the 10% rule in daily practice. These results are
in agreement with those of our previous study (34), in which
we reported that chain fast-food restaurants, institutional
caterers, and other restaurants also did not implement the
10% rule. Statistical analysis revealed no significant
correlation between the product/oil ratio and the acrylamide
concentration (r ~ 0.033, P ~ 0.570). The product/oil ratio
also did not significantly contribute to the prediction of
acrylamide formation (beta ~ 20.084, P ~ 0.179;
Table 6). Grob et al. (16) recommended the 10% rule for
the product/oil ratio to achieve optimum culinary quality
combined with minimum acrylamide concentration. Other
authors have found that portion size affects the profile of
frying temperature over time and thus the formation of
acrylamide (9, 16). In the present study, frying temperature
was not significantly correlated with acrylamide concentra-
tion (r ~ 0.013, P ~ 0.408; Table 6). The dilution effect of
frying temperature may further weaken the effect of the
product/oil ratio on the formation of acrylamide.
The inconsistent compliance of food handlers with
instructions remains a challenge, although training was
TABLE 5. Acrylamide concentrations of French fries prepared at various restaurants before and after instructions were provided
Restaurant
Acrylamide (mg/kg fresh wt)
Before instruction After instruction
Mean (SD)a CV (%)b Medianc Minimum Maximum Mean (SD)d CV (%) Median Minimum Maximum
A 541 (0.28) 32.3 558 325 787 565 (0.22) 24.6 545 406 954
B 271 (0.38) 46.2 272 152 562 715 (0.40)* 49.2 636 364 1,346
C 506 (0.25) 28.4 513 290 749 961 (0.26)* 29.7 989 593 1,478
D 1,353 (0.69) 99.4 1,285 506 4,283 1,633 (0.53) 69.9 1,914 537 3,369
E 1,517 (0.51) 66.5 1,522 796 3,816 169 (0.49)* 63.2 160 85 372
F 134 (0.42) 52.2 132 77 329 239 (0.36)* 43.3 242 125 414
G 1,271 (0.20) 22.1 1,226 824 1,814 1,296 (0.21) 23.4 1,288 890 1,964
H 286 (0.14) 15.0 280 220 345 NDe
I 439 (0.37) 44.8 426 249 723 ND
J 181 (0.34) 40.5 187 90 311 ND
Total f 596 (0.91) 148 580 77 4,283 614 (0.85) 134 657 85 3,369
a Mean values based on n ~ 18. The mean of the loge-transformed acrylamide concentration in each restaurant was back-transformed to the
original scale using an antilogarithmic function and was expressed as a geometric mean. The standard deviation is for the loge-
transformed acrylamide concentration.b The exact CV (coefficient of variation) was calculated using the formula of 100(eSD 2 1), where SD is the standard deviation of the loge-
transformed acrylamide concentration.c The median of loge-transformed acrylamide concentration in each establishment was back-transformed to the original scale using an
antilogarithmic function and was expressed as a geometric median.d Means with asterisks are significantly different from those before instruction at the 0.05 level.e ND, no data.f Based on data from seven restaurants (A through G).
TABLE 6. Bivariate correlations and multiple linear regression analyses for the influencing factors
Influencing factor
Bivariate correlations analysis Multiple linear regression analysis
Pearson correlation coefficient (r) P Betaa P
Frying time 0.228 ,0.05 0.259 ,0.05
Frying temp 0.013 0.816 0.173 ,0.05
Reducing sugarsb 20.161 ,0.05 20.125 ,0.05
Thawing 0.142 ,0.05 0.179 ,0.05
Product/oil ratio 0.033 0.570 20.084 0.179
a Beta values are standardized coefficients.b Referring to fresh weight, n ~ 306.
470 SANNY ET AL. J. Food Prot., Vol. 76, No. 3

given to the food handlers on how to fry the French fries,
and they were made aware of the need to comply with the
instructions. Changing this behavior is difficult because the
food handlers tend to have a preference for a certain target
color, even though a color card was included in the frying
instructions to illustrate the golden-yellow target color of the
finished French fries. Food handlers appear to maintain their
normal habits and used their own target color. Our
observations are consistent with those of other authors,
who have suggested that food handlers in restaurants tend to
develop individual preparation techniques to meet their
preferred target color of French fries (17, 41). Food handlers
also may not yet have been comfortable with the frying
instructions, although they practiced frying in the training
session to create familiarity. Other authors have emphasized
the need to create familiarity because when new information
becomes available, it must first trigger attention and then
achieve comprehension; only then can it influence decision
making (3, 42).Two different strategies, i.e., emphasizing a managerial
approach and emphasizing a technological approach, may
overcome the problem of the noncompliant behavior of the
food handlers in the FSE. A tailored training program
should be developed to meet the specific training needs of
food handlers and thus have a greater effect on their
intention and actual behavior. In addition to the food
handlers, supervisors also must be trained with the frying
instructions to enable them to provide feedback and stop any
noncompliant behavior. Palmen et al. (27) emphasized that a
training program should include crucial steps such as
demonstration, practice, and feedback to be effective.
Although the training session in the present study started
with a demonstration and the food handler had an
opportunity to practice and refine the required behavior,
they did not receive active feedback when they did not stop
frying at 240 s. Various authors (27, 31, 37) have stated that
feedback from supervisors encourages safe food handling
practices among food handlers in real work situations and is
necessary to correct any noncompliant actions. Seaman and
Eves (37) found that food handlers’ perception of social
normative pressures (from on-going supervision) signifi-
cantly influenced their intention to perform food safety
actions. Future studies could investigate the effect of strict
monitoring of compliance with instructions on the concen-
tration of acrylamide in fried foods. This managerial
strategy is expected to have a strong influence on food
handlers’ control decisions concerning maintenance of
frying conditions between acceptable tolerances, which will
result in a significant reduction in the variation in
acrylamide concentration.
A technological approach would be to establish
requirements for the features of commercial fryers, e.g.,
they could be equipped with a temperature controller, a
timer, and an automatic lifting mechanism that removes
the basket from the oil after a set frying time. These
technological features support food handlers by taking over
control decisions, thus facilitating behavior change. Inade-
quate equipment (frying facility) is certainly one of the
barriers that would prevent food handlers from complying
with instructions (4, 29, 35, 36). Health authorities may
need to set rules for dedicated fryers to be used in
restaurants instead of frying pans to fry French fries, and
regular inspections may be needed to ensure that restaurants
comply with this requirement.
In the present study, frying instructions supported food
handlers’ decisions to start frying when oil reached 175uC;
however, the instructions had an inconsistent effect on the
food handlers’ decisions to end frying. The impact of frying
instructions on the mean and variation of the acrylamide
concentration in French fries was not consistent because of
the inconsistent compliance with the frying instructions with
which food handlers were trained. The majority of the food
handlers exceeded the prescribed frying time because they
fried the French fries until the color and crispiness were
consistent with their own preference. When instructions
were followed strictly, the acrylamide concentration was
significantly reduced. However, in cases of noncompliance,
the mean acrylamide concentrations were higher than those
before instructions were provided.
ACKNOWLEDGMENTS
We thank all the restaurants that were involved in sampling and data
collection. We also thank Hamezan bin Muhammad@Ahmad and Noor
Hezliza binti Muhamad Nodin (Research Laboratory of Division of
Postgraduate, Research & Innovation, Faculty of Food Science and
Technology, Universiti Putra Malaysia) for technical assistance with the
acrylamide analysis. Financial support from the International Foundation
for Science (project no. E/4710-1, ‘‘Assessing risk of acrylamide in French
fries production in Malaysian food service establishments from a techno-
managerial approach’’) also is gratefully acknowledged.
REFERENCES
1. Al-Kahtani, H. A. 1991. Survey of quality of used frying oils from
restaurants. J. Am. Oil Chem. Soc. 68:857–862.
2. Bland, J. M., and D. G. Altman. 1996. Statistics notes: transforma-
tions, means, and confidence intervals. Br. Med. J. 312:1079.
3. Breakwell, G. M. 2000. Risk communication: factors affecting
impact. Br. Med. Bull. 56:110–120.
4. Clayton, D. A., C. J. Griffith, P. Price, and A. C. Peters. 2002. Food
handlers’ beliefs and self-reported practices. Int. J. Environ. Health
Res. 12:25–39.
5. Confederation of the Food and Drink Industries of the European
Union. 2006. The CIAA acrylamide toolbox. Available at: http://
www.ciaa.be/documents/brochures/CIAA_Acrylamide_Toolbox_Oct2006.
pdf. Accessed 13 May 2008.
6. Dallal, G. E. 2009. Logarithms. Available at: http://www.jerrydallal.
com/LHSP/logs.htm. Accessed 21 November 2010.
7. DiNovi, M. 2006. The 2006 exposure assessment for acrylamide.
Available at: http://www.fda.gov/downloads/Food/FoodSafety/Food
ContaminantsAdulteration/ChemicalContaminants/Acrylamide/UCM
197239.pdf. Accessed 25 November 2007.
8. Evans, J. R., and W. M. Lindsay. 2004. The management and control
of quality. West Publishing Company, St. Paul, MN.
9. Fiselier, K., D. Bazzocco, F. Gama-Baumgartner, and K. Grob. 2006.
Influence of the frying temperature on acrylamide formation in
French fries. Eur. Food Res. Technol. 222:414–419.
10. Fiselier, K., and K. Grob. 2005. Legal limit for reducing sugars in
prefabricates targeting 50 mg/kg acrylamide in French fries. Eur.
Food Res. Technol. 220:451–458.
11. Friedman, M. 2003. Chemistry, biochemistry, and safety of
acrylamide. A review. J. Agric. Food Chem. 51:4504–4526.
12. Garner, R. 2010. The joy of stats: a short guide to introductory statistics
in the social sciences. Available at: http://books.google.com.my/
books?id~sl_mrrxEtjIC&pg~PA166&lpg~PA166&dq~ThezJoy
J. Food Prot., Vol. 76, No. 3 FRYING INSTRUCTIONS AS A CONTROL MEASURE IN RESTAURANTS 471
zofzStatszandzlogztransformation&source~bl&ots~SLSfB--r8C
&sig~b_LAkWkvqtSNetPe3p9uZF1a1bc&hl~en#v~onepage&q&
f~false. Accessed 21 November 2010.
13. Gere, A. 1985. A survey on operating conditions and quality of
commercial frying fats in Hungary. Z. Ernaehrungswiss. 24:120–132.
14. Gertz, C., and S. Klostermann. 2002. Analysis of acrylamide and
mechanisms of its formation in deep-fried products. Eur. J. Lipid Sci.Technol. 104:762–771.
15. Grob, K. 2007. Options for legal measures to reduce acrylamide
contents in the most relevant foods. Food Addit. Contam. 24:71–81.
16. Grob, K., M. Biedermann, S. Biedermann-Brem, A. Noti, D. Imhof,
T. Amrein, A. Pfefferle, and D. Bazzocco. 2003. French fries with
less than 100 mg/kg acrylamide. A collaboration between cooks and
analysts. Eur. Food Res. Technol. 217:185–194.
17. Haase, N. U. 2006. The formation of acrylamide in potato products, p. 41–
59. In K. Skog and J. Alexander (ed.), Acrylamide and other hazardous
compounds in heat-treated foods. Woodhead Publishing, Cambridge.
18. Hopkins, W. G. 2003. A new view of statistics. Available at: http://
www.sportsci.org/resource/stats/logtrans.html. Accessed 21 Novem-
ber 2010.
19. Institute for Reference Materials and Measurements. 2006. Acrylam-
ide monitoring database. Joint Research Centre, European Commis-
sion. Available at: http://irmm.jrc.ec.europa.eu/activities/acrylamide/
Pages/database.aspx. Accessed 11 July 2011.
20. International Agency for Research on Cancer. 1994. Some industrial
chemicals. IARC Monogr. Eval. Carcinog. Risk Chem. Hum. 60:435–453.
21. Luning, P. A., and W. J. Marcelis. 2006. A techno-managerial
approach in food quality management research. Trends Food Sci.
Technol. 17:378–385.
22. Luning, P. A., and W. J. Marcelis. 2007. A conceptual model of food
quality management functions based on a techno-managerial approach.
Trends Food Sci. Technol. 18:159–166.
23. Luning, P. A., and W. J. Marcelis. 2009. A food quality management
research methodology integrating technological and managerial
theories. Trends Food Sci. Technol. 20:35–44.
24. Mills, C., D. S. Mottram, and B. L. Wedzicha. 2009. Acrylamide, p.
21–50. In R. H. Stadler and D. R. Lineback (ed.), Process-induced
food toxicants: occurrence, formation, mitigation, and health risks.
John Wiley & Sons, Hoboken, NJ.
25. Morley-John, J., B. A. Swinburn, P. A. Metcalf, F. Raza, and H.
Wright. 2002. Fat content of chips, quality of frying fat and deep-
frying practices in New Zealand fast food outlets. Aust. N. Z. J. Public
Health 26:101–106.
26. Palazoglu, T. K., and V. Gokmen. 2008. Reduction of acrylamide
level in French fries by employing a temperature program during
frying. J. Agric. Food Chem. 56:6162–6166.
27. Palmen, A., R. Didden, and H. Korzilius. 2010. Effectiveness of
behavioral skills training on staff performance in a job training setting
for high-functioning adolescents with autism spectrum disorders. Res.
Autism Spectr. Disord. 4:731–740.
28. Petrie, A., and C. Sabin. 2009. Medical statistics at a glance.
Available at: http://books.google.com.my/books?id~upQ5tlFEc1sC
&pg~PA30&lpg~PA30&dq~coefficientzofzvariationzandz
transformedzdata&source~bl&ots~RM2e-0MIY0&sig~o7xU5RvY_
DZXOpkopoHXJG28QKU&hl~en#v~onepage&q&f~false. Ac-
cessed 21 November 2010.
29. Quaglia, G., J. Comendador, and E. Finotti. 1998. Optimization of
frying process in food safety. Grasas Aceites 49:275–281.
30. Rasmussen, G. O., J. W. Finkowski, R. F. Meyer, R. L. Keller, T. P.
Kempf, and R. N. Phillips. March 1993. Automated French fry
cooking apparatus. U.S. patent 5189944.
31. Rennie, D. M. 1994. Evaluation of food hygiene education. Br. Food
J. 96:20–25.
32. Romani, S., M. Bacchiocca, P. Rocculi, and M. D. Rosa. 2008. Effect
of frying time on acrylamide content and quality aspects of French
fries. Eur. Food Res. Technol. 226:555–560.
33. Sanny, M., S. Jinap, E. J. Bakker, M. A. J. S. van Boekel, and P. A.
Luning. 2012. Is lowering reducing sugars concentration in French
fries an effective measure to reduce acrylamide concentration in food
service establishments? Food Chem. 135:2012–2020.
34. Sanny, M., S. Jinap, E. J. Bakker, M. A. J. S. van Boekel, and P. A.
Luning. 2012. Possible causes of variation in acrylamide concentra-
tion in French fries prepared in food service establishments: an
observational study. Food Chem. 132:134–143.
35. Sanny, M., P. A. Luning, W. J. Marcelis, S. Jinap, and M. A. J. S. van
Boekel. 2010. Impact of control behaviour on unacceptable variation
in acrylamide in French fries. Trends Food Sci. Technol. 21:256–267.
36. Seaman, P., and A. Eves. 2006. The management of food safety—the
role of food hygiene training in the UK service sector. Int. J. Hosp.
Manag. 25:278–296.
37. Seaman, P., and A. Eves. 2008. Food hygiene training in small to
medium-sized care settings. Int. J. Environ. Health Res. 18:365–374.
38. Shahar, S. S., R. Ghazali, N. A. M. Yusoff, N. S. Safii, Z. A. Manaf,
and S. A. M. Noah. 2002. Atlas of food exchanges and portion sizes.
MDC Publishers Printers Sdn. Bhd., Kuala Lumpur.
39. Shuttleworth, M. 2009. Hawthorne effect. Available at: http://www.
experiment-resources.com/hawthorne-effect.html. Accessed 20 May
2012.
40. Stadler, R. H. 2005. Acrylamide formation in different foods and
potential strategies for reduction, p. 157–169. In M. Friedman and
D. S. Mottram (ed.), Chemistry and safety of acrylamide in food,
vol. 561. Springer, New York.
41. Vinci, R. M., F. Mestdagh, C. Van Poucke, B. Kerkaert, N. De Muer,
Q. Denon, C. Van Peteghem, and B. De Meulenaer. 2011. Imple-
mentation of acrylamide mitigation strategies on industrial production
of French fries: challenges and pitfalls. J. Agric. Food Chem. 59:898–
906.
42. Wilcock, A., M. Pun, J. Khanona, and M. Aung. 2004. Consumer
attitudes, knowledge and behaviour: a review of food safety issues.
Trends Food Sci. Technol. 15:56–66.
43. Williams, J. S. E. 2005. Influence of variety and processing
conditions on acrylamide levels in fried potato crisps. Food Chem.
90:875–881.
472 SANNY ET AL. J. Food Prot., Vol. 76, No. 3