Supermarkets, wholesalers, and tomato growers in Guatemala
72
SUPERMARKETS, WHOLESALERS AND TOMATO GROWERS IN GUATEMALA By Ricardo Hernández A THESIS Submitted to Michigan State University In partial fulfillment of the requirements For the degree of MASTERS OF SCIENCE Agricultural, Food and Resource Economics 2009
-
Upload
independent -
Category
Documents
-
view
1 -
download
0
Transcript of Supermarkets, wholesalers, and tomato growers in Guatemala
SUPERMARKETS, WHOLESALERS AND TOMATO GROWERS IN GUATEMALA
By
Ricardo Hernández
A THESIS
Submitted to Michigan State University
In partial fulfillment of the requirements For the degree of
MASTERS OF SCIENCE
Agricultural, Food and Resource Economics
2009

ABSTRACT
SUPERMARKETS, WHOLESALERS AND TOMATO GROWERS IN GUATEMALA1
By
Ricardo Hernández
This thesis shows the asset-related determinants and the impacts of the participation of
small farmers in supermarkets versus traditional market channels in Guatemala. The
research comprises: product value chain studies of tomatoes; cross-section farm
household surveys of 164 farmers. In a comparison between supermarket channels and
traditional channels, farmers selling to supermarkets tend to be in the upper end of the
‘small farmer’ category, have more capital, and are much more specialized in commercial
horticulture in general and in tomatoes in particular, than traditional farmers. While they
have higher yields, they also have higher input use, including agrochemicals. In fact, they
severely use pesticides and fungicides. Moreover, these greater input expenditures mean
that their profit rates are roughly similar to those of farmers in the traditional channel.
Supermarket-channel farmers prefer the more demanding wholesale-supermarket channel
because it offers a lower risk and lower transaction cost outlet for the variety of their
qualities and grades, all year. In turn, the supermarkets, who do not buy direct but rather
source from a few dedicated wholesalers, rely on this year-round supply, lower
transaction costs, and consistency.
1 This master’s thesis is based on Hernandez et al., (2007) “Supermarkets, Wholesalers and Tomato
Growers in Guatemala”

iii
This work is dedicated to Marcelo, Gretel, my family and friends.
iv
ACKNOWLEDGEMENTS
I am thankful to my major professor Thomas Reardon, for his support and
guidance. I also thank the help of Scott Swinton and Jeffrey Wooldridge, members of my
committee for their support and constructive comments, I am grateful for comments from
an anonymous reviewer, as well as useful comments on earlier versions by Chris Barrett,
Roy Black, Julio Berdegué and Robert Myers. This thesis is an outcome of a coordinated
research program with the participation of the following projects and donors whom I
thank for funding: (1) “Assistance for Trade Capacity Building in Relation to the
Application of Sanitary and Phytosanitary Measures” (RAISE-SPS), funded by USAID,
coordinated by DAI and implemented for this project by Michigan State University; (2)
“Regoverning Markets, Phase 1”, a project coordinated by the International Institute for
Environment and Development (IIED), the Royal Tropical Institute (KIT), and Rimisp-
Centro Latinoamericano para el Desarrollo Rural, and funded by the Department for
International Development (DFID) of the United Kingdom; (3) “Partnerships for Food
Industry Development – Fruits and Vegetables” (PFID-FFV), funded by USAID, and
implemented by Michigan State University; (4) The Agribusiness Development Project
of the Centro Internacional de Agricultura Tropical (CIAT); and (5) The “Central
America Beef Project”, of the International Livestock Institute (ILRI), funded by the
Common Fund for Commodities.
v
TABLE OF CONTENTS
LIST OF TABLES ............................................................................................................. vi
1. INTRODUCTION ...................................................................................................... 1
2. CONTEXT .................................................................................................................. 2
3. STRUCTURE OF TOMATO RETAIL SECTOR ..................................................... 5 3.1. Supermarkets ........................................................................................................ 5 3.2. Traditional retail sector ........................................................................................ 8
4. DATA DESCRIPTION AND DIFFERENCES BETWEEN GROUPS .................... 9 4.1. Data ...................................................................................................................... 9 4.2. Differences in structure and size ........................................................................ 10 4.3. Technological and yield differences. ................................................................. 12 4.4. Credit access and technical assistance. .............................................................. 13 4.5. Economic benefit analysis of the market adoption ............................................ 14
5. CONCEPTUAL AND EMPIRICAL APPROACH.................................................. 16 5.1. Conceptual model .............................................................................................. 16 5.2. Regression specifics ........................................................................................... 23
5.2.1. Market channel adoption determinants ........................................................... 23 5.2.2.1. Vector of exogenous prices: ......................................................................... 23 5.2.2.2. Farm physical assets: ................................................................................... 25 5.2.2.3. Nonfarm assets ............................................................................................. 27 5.2.2.4. Access to credit ............................................................................................ 27 5.2.3 Technology correlates of market adoption ...................................................... 27
5.3. Estimation method: switching regressions............................................................. 29
6. ECONOMETRIC RESULTS ................................................................................... 30 6.1. Determinants of market channel choice. ............................................................ 30 6.2. Production function estimates: comparison between groups. ............................ 32
7. CONCLUSIONS....................................................................................................... 34
8. APPENDICES .......................................................................................................... 45 8.1. Questionnaire ..................................................................................................... 45
9. BIBLIOGRAPHY ..................................................................................................... 65
vi
LIST OF TABLES
Table 1. Supermarket’s characteristics and its incidence in the tomato market in 2003 .. 36
Table 2. Landholdings of supermarket-channel versus traditional-channel farmers ........ 36
Table 3. Irrigation differences over groups ....................................................................... 37
Table 4. Output and yield differences over groups ........................................................... 37
Table 5. Credit and technical assistance over groups ....................................................... 38
Table 6. Net income differences over groups ................................................................... 39
Table 7. Qualitative evaluations of market channels by the grower groups. .................... 40
Table 8. Variables used in the channel adoption model ................................................... 41
Table 9. Determinants of tomato grower adoption of the supermarket channel ............... 42
Table 10. Production function estimation results ............................................................. 43
Table 11. Calculation of marginal value products at mean values in each group ............ 44
Table 12. Marginal value products vs. Factor costs .......................................................... 44
Table 13. Services provided by producer associations over groups. ................................ 44
1
1. INTRODUCTION
The share of supermarkets in food retail in Latin America rose from roughly 10-
20% in the early 1990s to 50-60% by the early 2000s, displacing small shops and open-
air markets (Reardon and Berdegué, 2002). The spread of supermarkets was driven by
rising incomes, urbanization, foreign direct investment (FDI), and retail procurement
systems modernization. The supermarket sector ‘take-off’ occurred around the mid/late
1990s in Central America, reaching 20-40%, depending on the country, of food retail by
the early/mid 2000s (Berdegué et al., 2005). Guatemala is in the middle/upper end of the
income distribution in the sub-region. The share of supermarkets in its food retail was a
mere 15% in 1994 and had reached 35% by 2003 (Orellana and Vasquez, 2004).
Retail transformation is expected to change market conditions facing farmers.
Generally, compared to traditional retailers, supermarkets have different and more
demanding product and transaction requirements. However, despite the increasing
importance of the rise of supermarkets, there has been little empirical research on the
determinants of farmers’ choices between supermarket and traditional market channels,
and the effects of those choices on net incomes and technologies.
This paper aims to contribute to addressing that gap in the literature. We focus on
tomato producers selling via wholesalers to the supermarket channel versus the
traditional retailer market channel in Guatemala. This subject has not been studied in
Guatemala. Tomatoes were chosen as the focus because they are grown by small and
small-medium producers only, and are thus of interest to the development debate. They
are also the main produce item in supermarket sales and in consumption in Guatemala.
The analysis is based on field interviews with supermarkets and wholesalers, and a farm

2
survey undertaken by the MSU-Regoverning Markets joint project. The fieldwork took
place in June-August 2004. The analysis focuses on (1) the determinants of market
channel choice, and (2) the associated changes in practices (in particular technologies)
and net incomes.
We proceed as follows. Section 2 presents context, section 3 describes the retail
structure of tomatoes, section 4 the general model and a description of the data, section 5
patterns in the data, section 6 econometric results, and section 7 concludes with
implications.
2. CONTEXT
Traditional food retailing in Guatemala, as traditionally everywhere in the world,
consists of small shops, wetmarkets and other public markets, and street vendors. Into
this setting came supermarkets, at first only as a tiny niche for upper income groups in
the capital city in the 1980s and early 1990s. However, between the mid 1990s and now,
supermarket sector growth ‘took off’ under the impetus in the mid/late 1990s of domestic
capital investments, and starting in 2001 of foreign joint ventures, first with the Dutch
global retailer Ahold, and then with Wal-mart. In 1995, supermarket sales were 128
million dollars, and by 2003, 650 million. In 1994, supermarket sales comprised 15% of
food retail; by 2002 the share was 36%. In 1994 there were 66 supermarkets - and 150 by
2004 (Orellana and Vasquez, 2004). Supermarkets have spread from the capital city to
secondary then tertiary cities and towns over the past decade, and from high to middle to
lower income segments, changing and adapting store formats and product offerings as
they go. The supermarket sector is quite concentrated by international standards: the
3
leading chain2 has roughly 70% of the supermarket sector. There is currently only one
other major retailer, the domestic chain Unisuper, with only 10% of the market.
The share of fresh fruits and vegetables in supermarket sales has grown from
roughly 1-2% in the mid/late 1990s to 10% in 2004. This rapid increase in produce
volumes marketed put a strain on the ’traditional‘ system used by the leading chain
before the late 1990s (and by small chains and independents today) of sourcing from the
traditional wholesale markets in spot market relations, delivering directly to each store.
The leading chain’s management felt that the traditional wholesale market system
presented high transaction costs and delivered only inconsistently on quality. This led to
modernization, starting circa 2000, of the leading chain’s procurement system; this was
followed by partial modernization of the secondary chain. The leading chain informant
told us that they undertook the modernization to reduce product and coordination costs
and increase quality and consistency.
Berdegué et al. (2005) note that this modernization involved shifts: (1) toward
centralization of procurement, having the product delivered to a large distribution center
and then distributed on to the stores, instead of direct from wholesale market to stores; (2)
toward the use of just a few specialized/dedicated wholesalers per product type, instead
of many small brokers with no continuing relationship with the retailer; (3) toward
procurement direct from producers for several product lines for which several large
suppliers can provide the needed volumes; (4) toward the use of private standards of
quality. These shifts describe the ‘moving average’ of the procurement system of the lead
2 The leading chain is La Fragua, a domestic chain in joint venture with Ahold in 2004 at the time of the
study, and since May 2006 subsumed in Wal-mart Central America.

4
chains – and as an average mass the fact that there has been great variation over product
categories.
One of the product categories for which several of the above procurement system
changes have occurred is tomatoes. To highlight those changes we start by describing the
‘traditional market channel’ for tomatoes and then pass to the characteristics of the
‘supermarket channel’ by which we mean that of the lead chains.
The traditional marketing channel of tomatoes is still as it has been for decades
(Fletcher et al., 1970): tomatoes are grown in several zones, are bought in the field from
the farmers by many small brokers, sold then to zone-level larger brokers, who sell on to
traditional wholesalers based in the wholesale markets, who then supply the traditional
retail sector.
The lead supermarket chains also still buy from the wholesale market, as in years
past, but the difference is that in the past several years they have shifted from buying
from many brokers and wholesalers to entering a relatively stable relationship with just a
few specialized wholesalers that are partly ‘dedicated’ to them. The specialized
wholesalers supply the commercial grade quality tomatoes that the retailers require,
sorting and selecting and boxing and delivering to the chain’s distribution center, as well
as supplying other grades to traditional retailers. The lead chain informant told us that
they shifted from the old to the new system in order to: (1) assure quality and consistency
of delivery of product year-round - which the dedicated wholesalers can do because they
5
have a large network of agents spread over several agroecological zones3; (2) have a
‘one-stop shop’ where they can source several types of produce at once, and thus reduce
the risk they will be, say, long on tomatoes but short on carrots; (3) deal with few
intermediaries, reducing coordination costs by dealing with five rather than fifty or a
hundred brokers.
Note that the above implies that the ‘supermarket market channel’ is actually,
from the point of view of the farmer choosing a market channel, an indirect channel in
which the farmer sells to a specialized wholesaler representing the modern market, which
includes the supermarket chains as clients. The choice of market channels is thus between
two very different types of intermediaries, one a field broker who sells on to the
traditional channel only, versus a wholesaler who sells on to the modern channel after
grading and sorting. These intermediaries thus embody the market channels and signal in
a general way the requirements of those channels.
3. STRUCTURE OF TOMATO RETAIL SECTOR
3.1. Supermarkets
Table 1 shows a summary of the distribution, size, population target and sales of
supermarket chains and independent supermarkets in Guatemala. The leading chain (La
3 Tomato production is scattered over zones, and large wholesalers buy over the zones to get year-round
availability rather than from suppliers with greenhouses producing year-round – simply because
greenhouse production of tomatoes is not profitable for domestic, commodity tomatoes.
6
Fragua) has different formats that cover different segments of the market, totalling 105
stores including: Hyper-markets (Hyper Paiz and Maxi-Bodegas), supermarkets
(Supertiendas Paiz and Despensa Familiar) and discount stores. The Hyper-markets such
as Hyper Paiz (6 stores) are big store formats about 4,500 ft2 with wide selection of
groceries and perishables, but also including clothing, furniture, appliances and others
(La Fragua 2004). This segment has been able to duplicate their number since 1998 and is
focused on urban areas of greater concentration, directing its sales to the medium-low to
high income population. “Supertiendas Paiz” (27 supermarkets) are located in urban
sectors across the country; its average size is approximately 3,000 ft2 and focuses on the
income population where the stores are located. In recent years, Supertiendas Paiz has
expanded its operations throughout suburban areas of the country by placing stores in
principal cities within the country. The “Despensa Familiar” (69 supermarkets) are stores
that operate at low costs with limited selection of products. They are located in urban
areas with high commercial traffic, as well as cantonal markets and bus stops (La Fragua,
2004) within the city’s capital as well as towns and cities within the country. The size of
each store is approximately 1,200 ft2. This is the store format that has experienced greater
growth on number of stores, since it has increased 19 stores within the chain in the past
five years, mainly in suburban zones in the interior of the country, focusing on the low
income section of the population.
La Fragua also operates Maxi Bodegas (two stores) which is a particular store
format since it merges the concept of a discount store (Despensa Familiar) with a
hypermarket (Hiper Paiz). The size of each store is approximately 4,000 ft2 and focuses
the low income population. La Fragua also have a wholesale membership format, ClubCo
7
which offers a wide variety of products in wholesale presentation. This is attractive to
retail companies, other wholesalers as major discounts are awarded through membership.
In 1990, La Fragua had a 90% share within the supermarket sector (they currently
have 67%). The decrease of its share is a result of the growth of PriceSmart, who has
captured 12% of the sector within 4 years and the increase in number of independent
supermarkets.
The second tier chain in the country is Unisuper which operates 27 stores under
the names of La Torre (12 supermarkets) and Econosuper (15 stores). La Torre attracts
consumers within the medium to high income population, while Econosuper focuses on
lower income consumers, (Orellana, 2004). The third chain is PriceSmart (3 stores) and is
also a membership format (such as ClubCo) but targets the population with medium to
high income.
The process of growth is also accompanied by mergers and acquisitions. The
growth of the supermarkets has been mainly experienced by the leading supermarket
chains through the opening and buying of supermarket stores and it has not been
produced through the increase of supermarket companies that operate in Guatemala. A
clear example would be the acquisition of “Despensas Don Juan” by La Fragua during
1998. Through this acquisition, La Fragua obtained control of 68 stores in Guatemala, 23
stores in El Salvador and 21 stores in Honduras. Another example is the creation of the
second tier supermarket chain in Guatemala, Unisuper with 27 stores after the merge of
the second (La Torre) and third (Econosuper) tier chains during 2001.

8
The process of rapid growth where “the big fish eats the small fish”, has resulted
in concentration of the supermarket sector, where the two most important supermarket
chains (La Fragua and Unisuper) have more than 78% of the sector’s sales. On the other
hand, the two companies with FDI operating in Guatemala, La Fragua (then Ahold, now
Walmart) and PriceSmart (USA), have 72% of the sector. This result mirrors the situation
in Nicaragua (Balsevich et al. 2005) where FDI is the main promoter of supermarket
expansion in the country.
3.2. Traditional retail sector
The traditional retail sector in Guatemala is composed mainly by corner stores
and open markets (cantonal markets). Traditional markets are still the main source of
food, nevertheless they have decrease their share in total food sales, due to the increase of
supermarket store units.
According to Orellana (2004) corner stores tend to be numerous, approximately
there are two corner stores per block in Guatemala city, and these stores have an average
size of three squared meters, and manage a small inventory of products. Its importance
on FFV sales relies on the number of corner stores rather than the sales and/or size of
these retailers. On average, each supermarket sells around 6 million dollars a year, while
a typical corner store sells approximately 6 thousand dollars a year, therefore a
supermarket represents 1,000 corner stores. Or, viewing it in another way, the 167
supermarkets in 2003 is equal to 180,000 corner stores. Obviously, their competitive
advantage rests on the proximity to their consumers.

9
Open markets are generally located in public buildings administered by city
governments, they are composed by merchants who operate independently and mainly
sell FFV everyday of the week, and in a few cases they are the very same producers who
work as merchants, normally merchants have to pay a monthly fee to the city government
to be able to sell their products in the open markets.
The rest of the thesis focuses on the farmer’s choice between those channels and
the implications of that choice for the farm household.
4. DATA DESCRIPTION AND DIFFERENCES BETWEEN GROUPS
4.1. Data
The data come from a grower survey undertaken by the MSU-Regoverning
Markets joint project, using a structured questionnaire that covered household
characteristics, farm production and costs, sales, participation in organizations, as well as
access to credit and technical assistance. The survey was undertaken in June-August
2004.
A two-stage stratified random sample was undertaken of tomato growers who
participate in the supermarket channel (as well as in the traditional channel, usually) and
growers who participate only in the traditional channel. The sampling from the two
populations was done in stages. (1) We identified the production areas where traditional
wholesalers and the dedicated wholesalers source tomatoes by asking wholesalers in what
zones tomatoes are sourced. All commercial production areas were considered, but some
with very small numbers of producers were left out of the sampling. Thus we focused on
the main production zones where the wholesalers source. (2) We undertook a random
10
sample of 164 tomato growers in those areas. We weighted the sampling of areas by the
number of tomato producers in the different zones, and randomly sampled in those zones.
We had prior information on the set of wholesalers selling to supermarkets, and by asking
to which wholesalers or local brokers the farmers sold, we could classify the farmers.
From the 164 farms sampled, 112 belong to the supermarket channel and 52 to the
traditional channel4.
4.2. Differences in structure and size
First, despite an expectation that supermarket-channel farms would be bigger - a
hypothesis that is heard commonly concerning whether one has to be a large farmer to
access modernized segments of urban markets - Table 2 shows that there is no significant
difference in overall farm size between the groups. The traditional-channel farm is on
average 7.8 ha, although that is two-thirds pasture land (non-arable land such as
hillsides), with only 2.5 ha of cultivable land, small indeed. The supermarket-channel
average farm is larger, 9.3 ha, but half is non-arable (just pasture) and only 4.6 ha of
arable land. Our data show that household size is about the same for the two groups (5
persons), so the farms under consideration are small farms in both channels - 0.5 to 1 ha
of cultivable land per capita. In that these are non-staple food farmers, and commercial
4 The subsample of supermarket growers is around twice the size of the subsample of traditional growers,
this had occurred because, when we designed the sample, we tried to divide the sample in three subsamples
corresponding to the following channels: leading supermarket, second tier supermarket, and traditional
channel growers. However, there is overlap between the growers that supply the second tier and the leading
supermarket.
11
rather than subsistence farmers, the above figures show that they are on average a bit
larger than the average farm in Guatemala(4.5 ha according to INE, 2004).
Moreover, the rental share (arable land) is notably high among the supermarket-
channel farmers – 40% of their arable land – versus only 20% for the traditional-channel
farmers. Both rates are higher than the national average on annual and perennial
farmlands (18.7%) (INE 2004), indicating that prime horticultural land is in high demand
in those zones. High rental rates also appear to indicate that it is relatively expensive to
buy land, and owners do not want to part with it.
Finally, Table 2 shows that supermarket-channel farmers are far more specialized
in tomato production (91% of their cropped land) than are the traditional-channel
farmers. Only 68% of the land of the latter is under tomatoes, but this is still a
surprisingly high share, showing the horticulture vocation of these zones. Moreover, the
supermarket-channel producers are much more specialized in horticultural crops in the
rest of their farm (outside tomatoes), as 50% of them grow other horticultural crops
compared with only 19% of traditional producers. Traditional-channel farmers tend to
depend more on production of basic grains than do supermarket-channel producers, since
77% of traditional-channel producers grow grain compared with 61% of supermarket
producers. The picture that emerges is that the average supermarket-channel farmer,
compared to the traditional-channel farmer, is slightly larger although still a small farmer,
but is much more horticulturally and commercially specialized, as well as engaged in the
land rental market.
12
4.3. Technological and yield differences.
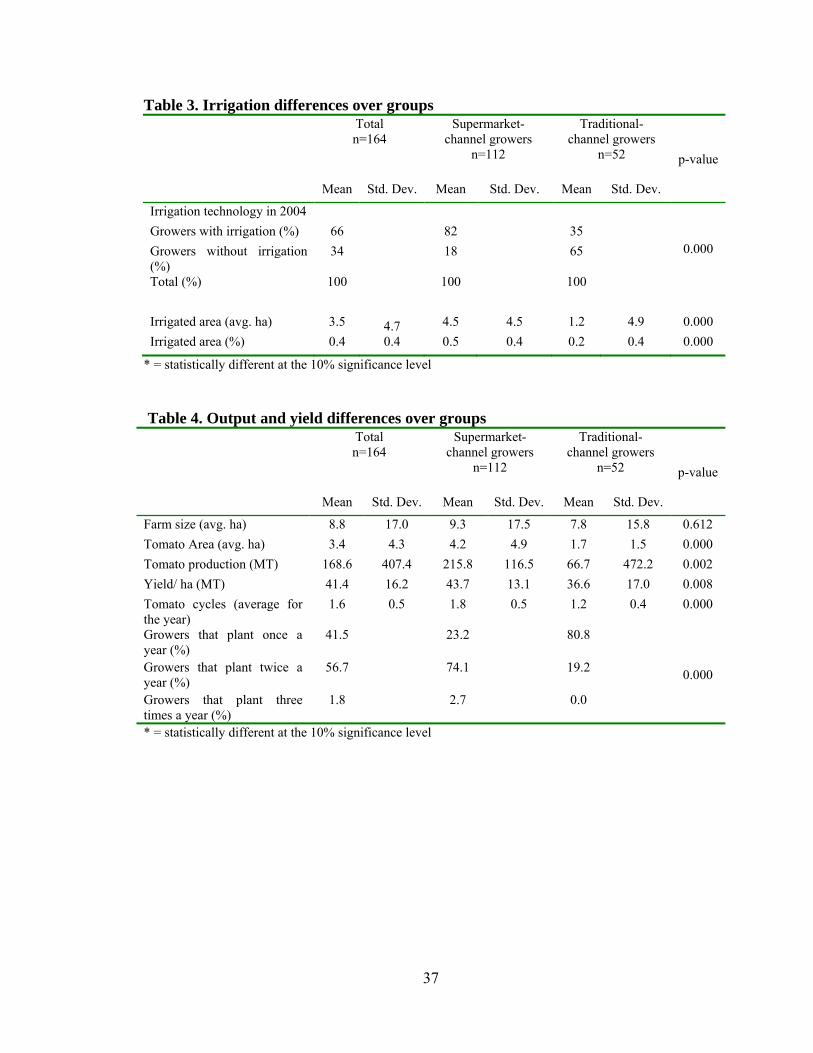
Tables 3 and 4 show differences over the groups with respect to technology,
output, and yields. First, the main difference in production technology is that
supermarket-channel farms are far more irrigated; 80% have irrigation, and the average
farm has 50% irrigation coverage. Compare that with the traditional-channel farms, of
which only 35% have irrigation, and the average farm has only 15% irrigation coverage.
Some supermarket channel producers had irrigation before entering the channel, and
some put it in after entering the channel. Our survey asked about the farm’s irrigated area
“five years ago, and now” and about when the farmer entered the supermarket channel.
We analyzed these data and found that: (1) farmers who were longstanding participants in
the supermarket channel (from 1999 or before) had on average 2.6 ha of irrigated area
when they started, and added 2 more ha from 1999 to 2003; (2) those who joined the
supermarket channel recently (1999-2003) had only 0.8. ha when they started but added
0.7 ha since, and (3) the traditional-channel producers, who had only 0.5 ha of irrigated
land when they started, added a mere 0.3 ha in the past five years. Through the use of t-
tests we could see that all differences are significant at the 10% level. Thus, the
supermarket-channel growers both had more irrigation to start and invested far more
quickly in it than the traditional-channel growers. This corroborates the statements we
heard from the dedicated wholesalers that they prefer farmers who have irrigation. More
irrigation has two important effects: (1) better quality and consistency of the product,
with a higher share of commercial grade product; (2) ability to multiple-crop over a year,
that is, to have multiple ‘production cycles’. 74% of supermarket-channel farmers sow
twice a year, while only 20% of the traditional channel do; the statistical correlation
13
between double cropping and having irrigation is strong and significant. Moreover,
supermarket-channel farmers have 20% better yields. That, combined with twice the farm
land dedicated to tomatoes, and nearly twice the cropping cycles, adds up to 300% more
tomato volume from an average supermarket-channel farm compared with an average
traditional-channel farm.
Volume, consistency over the year in output, and quality – all are attractive
characteristics from the perspective of dedicated wholesalers who need to deliver to
supermarket chains: (1) all year, an important attribute because supermarket procurement
officers complained to us about a sharp seasonal glut of tomatoes in the wholesale
markets and then shortages at other times; (2) good quality tomatoes; and (3) at
competitive cost, involving the need to get as much per farmer as possible to reduce
transaction costs. The mirror image of this calculation appears to be made by the farmers
who sell to the supermarket-channel: they want the greatest payoff at least transaction
cost and risk to provide a good return on their investment in irrigation and their input
outlays that in turn provide better yields.
4.4. Credit access and technical assistance.
Table 5 provides information on credit and technical assistance. First, 83% of
supermarket-channel, and 71% of traditional-channel farmers get input credit from the
input companies. Supermarket-channel farmers obtain twice the amount of credit per
farm, but that is merely consonant with the greater production volume, and in fact is less
than proportionate to it. Supermarkets do not provide input credit. They obviously do not
need to, given the availability of credit from input companies.
14
Second, 81% of supermarket-channel, and 62% of traditional-channel farmers get
technical assistance – and nearly all of this is from input companies, at no explicit charge.
The gap is explained by the great input use intensity and complexity employed by the
supermarket-channel producers and, hence, the greater need for advice from the vendors.
Note that input suppliers supplant public extension services – in fact there has never been
in these zones consistent availability of public extension for horticulture products; there
has only been the odd project here and there. For decades, input suppliers have played the
role of input vendor, creditor, and advisor. The advent of the supermarket market channel
has not altered that.
4.5. Economic benefit analysis of the market adoption
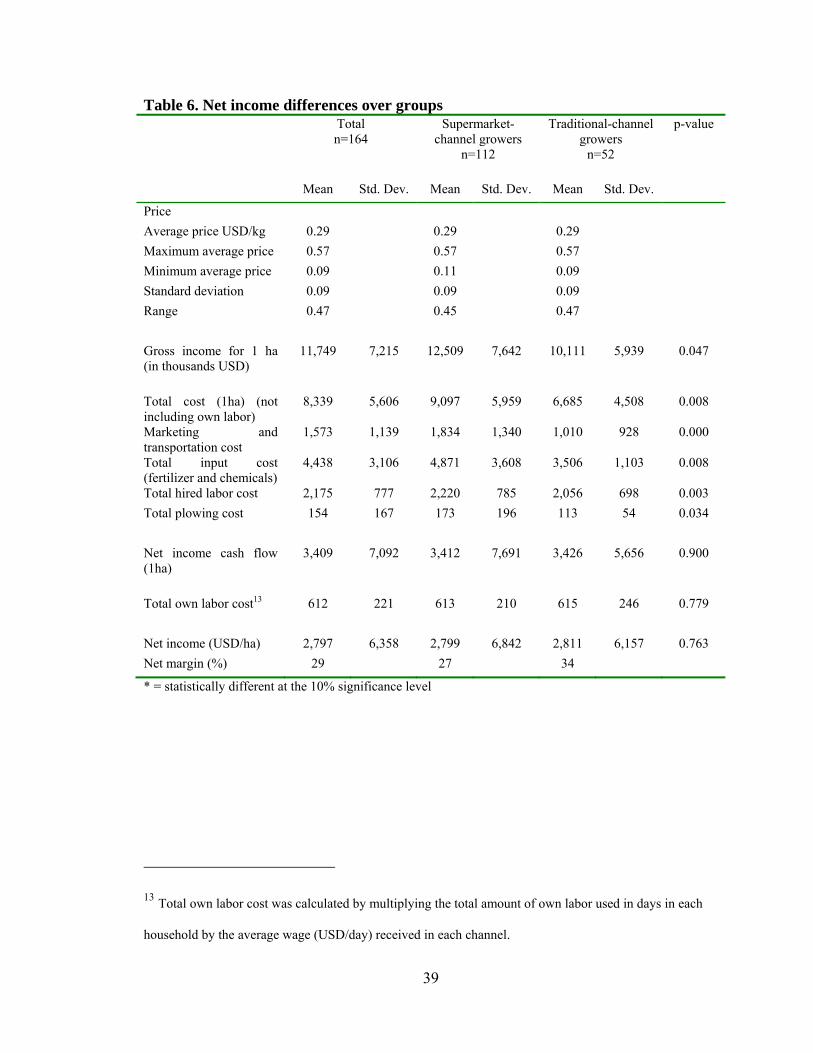
Table 6 shows overall costs and gross margins. Supermarket-channel farmers earn
24% more gross income per hectare. This is mainly due to yield differences, as the price
is the same between the channels. They achieve those higher yields with greater variable
input outlays and thus have 36% higher costs. They thus actually earn the same per
hectare than do the traditional-channel farmers.
The higher variable costs are in fact accompanied by allocative inefficiency. We
show below that the marginal value products of two key chemical inputs (pesticides and
fungicides) are well below their factor prices, implying allocative inefficiency (Lau and
Yotopoulos 1971). That means that the supermarket-channel farmers greatly overuse
chemicals. A popular explanation we heard in the field is that input companies are
advising the farmers to buy chemicals they do not need (at least in such doses), and the
farmers do not know the difference, as there is no other source of extension advice. An

15
alternative explanation found in the agribusiness literature is that farmers in channels
(such as that of the supermarkets) that demand consistent quality, overuse chemicals to
reduce the downside risk of being delisted5. The aversion to that risk may be magnified
because these are small farmers, dependent for their livelihoods nearly exclusively on
tomatoes, who are perhaps fearful of ‘getting it wrong’ and so overreact (in an economic
sense) to risk.
As the average net payoff between the two channels does not differ, why do the
larger, more capitalized, more specialized, more productive farmers bother to ‘go the
extra mile’ and sell to the dedicated wholesalers that serve the supermarket channel, and
not just to the traditional brokers? We asked the farmers why they chose the channel they
sell to, in a series of qualitative questions the answers to which are presented in Table 7.
The general implication of the responses is that dedicated wholesalers represent lower
risks (to sell year round and to get paid) and lower transaction costs compared with the
traditional wholesalers and rural brokers. This is not then a story about the supermarkets
per se, but about the types of wholesalers that are gravitating toward being the preferred
intermediaries for supermarkets, and the benefits, mainly in transaction costs and risk
reduction, that these larger wholesalers give farmers – as well, as we noted above, to their
clients the supermarkets.
We also carried out several focus group interviews with farmers who sell to the
dedicated wholesalers. They noted that selling to the large wholesalers who sell both the
first-grade to the supermarkets and the seconds to other markets, means that they have a
5 Channels with consistent quality often have buyers that work with a “list of preferred suppliers” then
being “ delisted” implies that a farmer no longer supply this market buyer.

16
‘one-stop shop’ for selling their produce, which reduces the risk of being left with a
certain grade but no ready buyer. But why do they prefer to sell to the wholesalers rather
than directly to the supermarkets, perhaps thereby getting a better price? They noted that
supermarkets pay with a delay of several weeks, while the wholesalers pay ‘cash on the
barrel’, and that the wholesalers sweeten the relationship by throwing in credit thus
resolving an idiosyncratic credit market access constraint faced by the farmers. This
amounts to tied product-credit markets of the type described in the ‘market linkages’
literature (Eswaran and Kotwal, 1985) and the recent literature on addressing of
idiosyncratic market failures by private sector actors such as processing firms buying
from farmers (Gow and Swinnen, 2001).
5. CONCEPTUAL AND EMPIRICAL APPROACH
5.1. Conceptual model
5.1.1 Market channel choice
Before presenting the modeling approach for this study, it is important to briefly
discuss how market participation is modeled in economic literature.
Most of the literature in smallholder market participation has model the decision
of smallholders’ participation in staple markets, specifically the decision between
autarchy and market participation (as net seller or net buyer). The underlying model is
based on a function of a set of incentives facing and capacities of the household (Feder et
al. 1985) similar to the usual input demand function derived from profit functions without
requiring the assumption of profit maximization (Sadoulet and de Janvry, 1995). There
have been two important contributions to the modeling approach of market participation;

17
the first considers the effect of market failures (driven by transaction costs) on market
participation and the second, focuses on the relation of market participation and
minimum asset thresholds.
Most of the farm household literature is based on the assumption of perfect
markets, although there have been some exceptions that have consider market failures
(Strauss, 1986; Lopez, 1989; Singh et al., 1986). But market participation under market
failures is attributed to the theoretical contributions of De Janvry et al (1991) and
Fafchamps (1992). These contributions have shown how transaction costs can drive the
upper and lower bound of the given factor (such as labor) price band creating market
failures6, and also it analyze how the derived shadow price can impact the household’s
decision to participate in the supply and demand of commodities and other factors for
which markets exist.
The second important contribution of the market participation literature is
founded on the recent work on poverty traps related to minimum asset thresholds. This is
based on the conceptual foundations derived by Carter and Barrett (2006) of an asset
based approach to poverty analysis. This approach allows the identification between
persistent structural poverty from stochastic poverty, by defining a dynamic asset
threshold that can separate households in a low-level equilibrium (poverty trap) from
households who can escape from poverty. As mentioned in the underlying model, assets
6 A market fails when the cost of a transaction through market exchange, creates greater disutility than the
utility gain of participating in the market, hence the household will not use the market for transaction (De
Janvry, 1991).
18
(household’s capacity) are linked to market participation since households without the
minimum productive assets are often excluded from market participation.
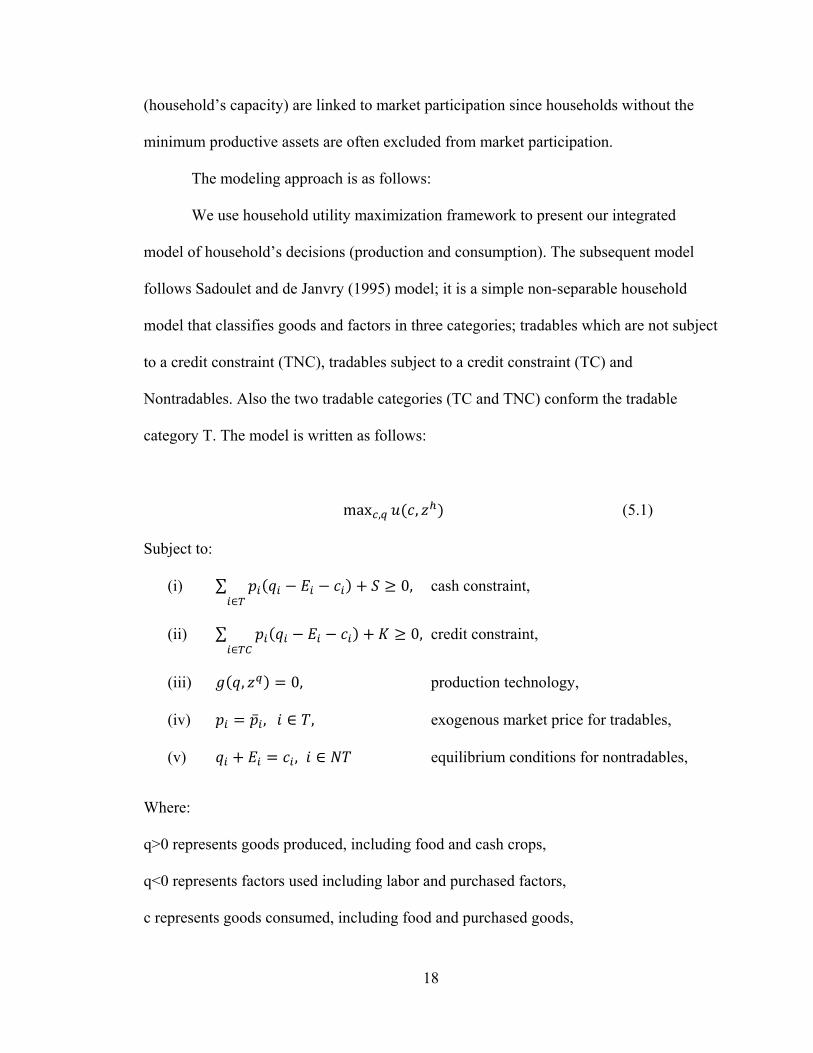
The modeling approach is as follows:
We use household utility maximization framework to present our integrated
model of household’s decisions (production and consumption). The subsequent model
follows Sadoulet and de Janvry (1995) model; it is a simple non-separable household
model that classifies goods and factors in three categories; tradables which are not subject
to a credit constraint (TNC), tradables subject to a credit constraint (TC) and
Nontradables. Also the two tradable categories (TC and TNC) conform the tradable
category T. The model is written as follows:
max , , (5.1)
Subject to:
(i) ∑ 0, cash constraint,
(ii) ∑ 0, credit constraint,
(iii) , 0, production technology,
(iv) , , exogenous market price for tradables,
(v) , equilibrium conditions for nontradables,
Where:
q>0 represents goods produced, including food and cash crops,
q<0 represents factors used including labor and purchased factors,
c represents goods consumed, including food and purchased goods,

19
E is the household initial endowment,
S is net transfers received, including remittances,
K is access to credit,
is the vector of exogenous effective market prices,
is the vector of endogenous prices,
zq is the vector of fixed production factors and farm characteristics (fixed capital, farm
size), and
zh is the vector of household characteristics.
From the maximization problem and constraints stated above we can then write
the following Lagrangian equation:
, ,
.
Sadoulet and de Janvry (1995) show that for the solution of the model, the three
types of goods can be treated symmetrically if the endogenous prices are defined as
follows:
, , (5.2)
1 , ,⁄ , (5.3)
,⁄ . (5.4)

20
The three equations above show how the decision prices differ depending on the
category of goods. For nontradables the decision prices are the shadow prices given by
the rate between the marginal utility of the endowment of a good (µi) and the marginal
utility of cash (λ). For tradables that are not subject to a credit constraint the decision
prices are the farm gate prices ( ), and for tradables that are subject to a credit constraint
the decision prices are given by the farm gate prices marked up by the marginal utility of
credit (λc).
Then, after the manipulation of the first order conditions, the production decisions
regarding all tradables and nontradables are represented by a system of supply and factor
demand functions in the decision prices :
, (5.5)
We model market-channel ‘adoption,’ drawing on the results on 5.5, since the
results on factor demand functions are the base to model technology adoption; this is
appropriate as the market channel choice is essentially a ‘post-harvest technology’
decision, as in Goetz (1992) and Holloway et al. (2005)
5.1.2. Production function and allocative efficiency analysis
The second part of the thesis, analyzes the technology correlates of channel
adoption by modeling the production functions of the two groups of producers: those who
sell to the supermarket-channel and those selling to the traditional channel. Then we
proceed by analyzing allocative efficiency in each channel, by comparing the marginal
value product (MVP) to the factor costs.
21
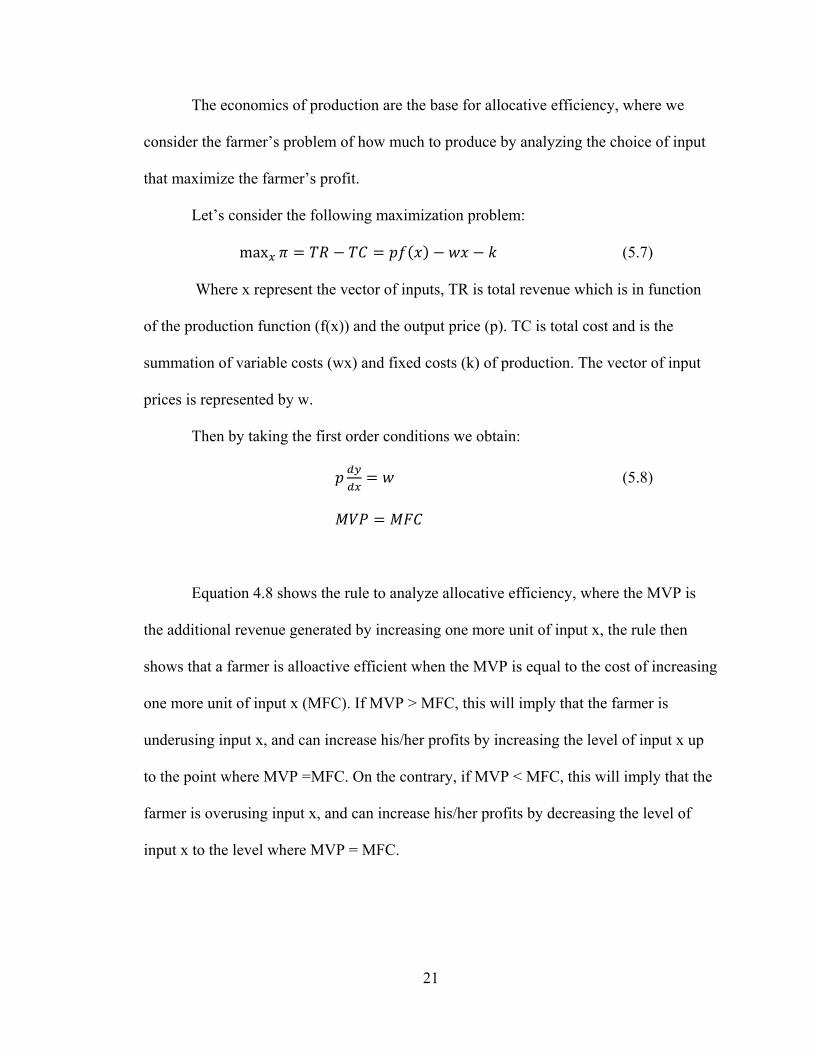
The economics of production are the base for allocative efficiency, where we
consider the farmer’s problem of how much to produce by analyzing the choice of input
that maximize the farmer’s profit.
Let’s consider the following maximization problem:
max (5.7)
Where x represent the vector of inputs, TR is total revenue which is in function
of the production function (f(x)) and the output price (p). TC is total cost and is the
summation of variable costs (wx) and fixed costs (k) of production. The vector of input
prices is represented by w.
Then by taking the first order conditions we obtain:
(5.8)
Equation 4.8 shows the rule to analyze allocative efficiency, where the MVP is
the additional revenue generated by increasing one more unit of input x, the rule then
shows that a farmer is alloactive efficient when the MVP is equal to the cost of increasing
one more unit of input x (MFC). If MVP > MFC, this will imply that the farmer is
underusing input x, and can increase his/her profits by increasing the level of input x up
to the point where MVP =MFC. On the contrary, if MVP < MFC, this will imply that the
farmer is overusing input x, and can increase his/her profits by decreasing the level of
input x to the level where MVP = MFC.

22
5.2 General implementation model
For estimation we consider a fully reduced form of the model (Lopez, 1984). Since the
decision prices are functions of the exogenous farm gate prices ( ), the household
characteristics associated with production ( ) and consumption decisions ( ),
exogenous transfers (S) and credit (K), then the equation 5.5 can be rewritten as follows:
, , , , (5.9)
Sadoulet and de Janvry (1995) shows that the fully reduced approach of the model allows
estimation of a subset of input demands and/or the supply function without having to deal
with the full system, and that the household characteristics ( ) are what makes this
solution different from the one obtained from a pure producer model.
An important caveat of this model, and in general on modeling adoption of modern
market channels (such as supermarkets) is that it assumes the adoption/selection process
is made on a static portfolio of observable producer characteristics and does not consider
imperfect and asymmetric information, which could be important for supermarket
procurement officers, in their search for suppliers with entrepreneurial skills. Our general
implementation model for the decision of allocation of labor in off farm employment is as
follows:
, , , ,
, , (5.10)
M is the choice of market channel, and following is demonstration of links between the
conceptual and the implementation model. First, input and output prices map out directly
from the vector of exogenous prices ( ) in our conceptual model. We can subdivide

23
exogenous input prices into the following categories: (1) price of non-labor farm inputs
(px); and (2) the agricultural wage (wa).
Exogenous output prices map directly from the conceptual model and is implemented as
the output price (pq)
Second, we can subdivide the household assets that affect production (zq) and
consumption (zh) decisions into the following asset categories: (1) human assets; (2) farm
assets; (3) nonfarm assets; and (4) community assets. In our empirical models we have
included variables for all asset categories as shown in the next section.
And third, exogenous transfers (S) and access to credit (K) map directly from the
conceptual framework.
5.2. Regression specifics
Following the conceptual and empirical models above, the regression specifics
shows the variables to be used in the estimation of each empirical model for each stage.
5.2.1. Market channel adoption determinants
In the first stage, we model the determinants of participation in the supermarket
market channel (compared to the traditional market channel) using the probit model. We
have as the dependant variable a binary variable that shows the farmers’ choice of market
channel (supermarkets =1, traditional markets= 0) and the regressors in market channel
equation are chosen by the above conceptual and general implementation models and are
as follows:
5.2.2.1. Vector of exogenous prices:

24
We did not include exogenous prices in our models since the price information
collected at the household level is endogenous. And the survey instrument did not collect
information at the village or community level. However, we proxy exogenous input
prices by including the distance from the farm to the paved highway, the exogenous input
prices should vary by the transaction costs that involve transporting the inputs from the
manufacturer/distributor to the farm, therefore distance measures are appropriate
Human capital assets:
This vector of assets is proxied by:
(1) Grower’s age: this variable has ambiguous expectations, on the one hand, we
would expect that as the farmer ages, he/she is more reluctant to change
his/her choice of market channel, therefore if the farmer has been selling to
the traditional market channel for a long period of time, he/she is reluctant to
make the necessary farm investments to begin a new market relation with
modern market agents. On the other hand, as the farmer ages he/she has more
experience thus, being able to adapt to more demanding market conditions.
(2) Years of education of the grower: There are competing hypotheses about the
expected effect of this variable. On the one hand, as education increases,
farmers can learn and adopt new choices of technologies that can open new
market opportunities such as the supermarket market channel. On the other
hand, more education allows farmers to engage in non-farm employment
opportunities competing for the available household labor and supplying
modern market channels can require more labor demanding activities than the
traditional sector. Empirical evidence in rural Mexico (Taylor and Yuñez-

25
Naude, 2000) have shown that as schooling levels increase, the returns from
schooling shift away from crop production, which supports our second
hypothesis.
(3) Family size (this variable could also fall in the category of vector of prices
since is a proxy for own labor price): we expect that more available household
labor will increase the probability of participating in presumably more labor
demanding market channels, for example for labor activities such as sorting,
grading and packing tomatoes for supermarkets compared to traditional
market channels that do not require those activities. This variable will be
captured as the number members of the farmer’s household.
(4) Lagged association level: this variable is defined as a binary variable that
captures whether the farmer belongs to a farmer´s association in 1999 prior to
accessing the supermarket market channel. We would expect that participation
in farmer´s associations can have a positive effect on supermarket channel
participation, as individual farmers can overcome asset thresholds that will
allow them to participate in a modern market channel. For example if the
farmer needs a packing shed to classify tomatoes according to supermarket
standards.
5.2.2.2. Farm physical assets:
In our empirical model we have included the following farm assets:
(1) Lagged total land owned (includes rented out and lent out): this is the total area in
hectares that the farmer owns for all uses, for all types of crops, pasture, fallow,
wooden etc. We avoid using total cropped area in our analysis (although it could

26
be more relevant) because it can be endogenous to the market channel, for
example supermarket procurement agents planning the amount of area that
farmers should plan each season. We expect that as land holdings increases (1)
farm households have higher wealth; (2) with higher wealth there is a reduction of
the degree of risk aversion of the farmer, (3) with less risk aversion, farmers are
more willing to adopt new market channel opportunities.
(2) Lagged number of livestock heads: this variable is defined as the total number of
livestock heads in 1999. We expect a positive effect of livestock holding in
participation in supermarket market channels, since livestock is a proxy for
liquidity and wealth, and the economic literature have shown that risk aversion
varies inversely with wealth (Newbery and Stiglitz, 1981), therefore farmers will
be more willing to adopt a presumable riskier market channel such as the
supermarket market channel.
(3) Lagged irrigation: This is variable is defined as a binary variable that captures
whether the household has (or doesn’t have) irrigation system in the farm in 1999
(as discussed before, this is prior to accessing the supermarket market channel for
the majority of the supermarket suppliers). This variable was calculated from the
information about total area under any type of irrigation (fallow, drip, sprinkler,
etc). we hypothesize that irrigation should favor participation in the supermarket
market channel, since it can allow farmers to have constant supply and quality of
tomatoes all year round, which are desirable characteristics by supermarket
procurement officers.
27
(4) Access to transportation means: This variable is defined as a binary variable and
captures whether the farm household is equipped with transportation means. We
would expect a positive effect on supermarket market channel participation, since
it allows farmers to deliver their FFV to the supermarket distribution centers, and
they do not have to rely on alternative transportation.
5.2.2.3. Nonfarm assets
We have included in our model the ratio of family labor working on rural non-
farm income generating activities. This variable has ambiguous expectations since on the
one hand rural non-farm employment can help relax the household’s credit constraint and
allow for self financing of farm assets and crop inputs (Reardon et al 2000) that will also
allow for participation in a presumably more demanding supermarket market channel. On
the other hand empirical evidence (Barrett 2007) have shown that as the share of rural
non-farm employment on total household income increases, farm households shift away
from agriculture and therefore from new market participation opportunities.
5.2.2.4. Access to credit
We proxy access to credit by including farm assets (land and non-land) and
livestock holdings, since these variables are often used as collaterals for credit and can
also proxy household’s wealth and therefore can be used to proxy access to credit.
5.2.3 Technology correlates of market adoption
To measure the technological differences among the producers who sell to
different channels, the production functions of the two groups were estimated and
compared, and those are estimated for one production year (with aggregation for the farm

28
over seasons if the producer cropped in more than one season). We use a log-log
production function:
∑ (5.11)
where
Y represents the total tomato production for the year of each producer (i =
1...164);
X is the vector of the k production factors, as follows:
X1= labor measured as wage (per task type) - weighted aggregate of days worked
in the various tasks - preparation of the tomato plots, sowing of tomato seeds, plant
transplants, weed control, fertilizer and chemical application, and harvesting during the
past agricultural year.
X2= total tomato planting area during the past agricultural year;
X3= total cost of the chemical solid fertilizers applied to the tomato plants
(calculated as the price-weighted sum over different types of fertilizers);
X4= total cost of chemical foliage fertilizers;
X5= total cost of herbicides;
X6= total cost of fungicides;
X7= total cost of insecticides; and
X8= land quality, proxied as the share of tomato land under irrigation.

29
We have included several explanatory variables as expenditures in variable inputs
because under cross sectional framework, this was a suitable way to aggregate different
categories of variable inputs7
5.3. Estimation method: switching regressions
As the production function is estimated separately for each of the two strata, there
is endogenous stratification. A usual way to address the selectivity bias and control for
the conditional probability of a farm being in a given group is to use the Heckman (1978,
1979) two-stage method. The procedure consists of the estimation of the production
function for each stratum of producers. To control for the conditional probability of a
farmer being in a particular (endogenous) stratum, the inverse Mills ratio (IMR) is
included as a regressor in the production function regression. The IMR is calculated (for
each farmer) from the market channel regression, the first stage. Hence,
∑ , (5.12)
where the IMR is
In the Heckman procedure, the variables in the second stage (production function)
belong to a bigger pool of variables that are used for estimation in the first stage
7 For example if a farmer can substitute 1 kg of DAP (expensive fertilizer) for 5 kg of Urea (cheap
fertilizer), the choice of fertilizer will be weighted by the price. Presumably more expensive and effective
fertilizers will have lower quantities per hectare, while less effective and cheaper fertilizers will have
higher doses per hectare. This is a strong empirical assumption, but is more acceptable than just
aggregating volumes, because then we will be assuming that both fertilizers are equally effective.

30
(adoption model), and these variables are not reported in the first stage results, since they
are used as controls.
Moreover, as the sampled strata weights do not match the true weights of those
strata in the population, it was necessary to introduce a weighting procedure (WESML)8
to correct for sampling bias (Wooldridge, 2002), after Manski and Lerman (1977). A
similar situation and application is found for example in Pitt and Khandker (1998).
6. ECONOMETRIC RESULTS
6.1. Determinants of market channel choice.
The explanatory variables are shown in Table 8. Lagged assets9 are used in the
channel choice regression to avoid the endogeneity problem that could occur with
current-period assets. Rivers and Vuong (1988) endogeneity tests on the lagged asset
8 We determined the population weights by cross checking information obtained from the
Guatemalan Agricultural Associations Federation, FASAGUA (Federación de Asociaciones Agrícolas de
Guatemala), concerning the number of tomato producers by production area. The information about
number of producers who supply to the supermarket channel by zone was obtained from the supermarket
wholesalers.
9 The survey collected information about the current level of assets as well as five years ago; the current
period represents the production cycle of 2003 and the lagged is the production cycle of 1999. Around 85%
of farmers supplying supermarkets began supplying supermarkets after 1999, therefore we are confident
that the information of lagged variables is exogenous to the market channel choice was made.
31
variables showed they are exogenous. Lagged variables are shown in the top half of the
table, and current period values are shown in the bottom half for comparison.
Regression results for channel choice are shown in Table 9. Five results are
significant. (1) Corroborating the descriptive analysis, the regression showed that
(lagged) irrigation is an important determinant of participation in the supermarket
channel. (2) (Lagged) participation in an association is significant – but the effect is
negative. Part of the reason is that these associations are not marketing organizations, and
therefore do not collect, sort, grade, and pack product for wholesalers; rather, the
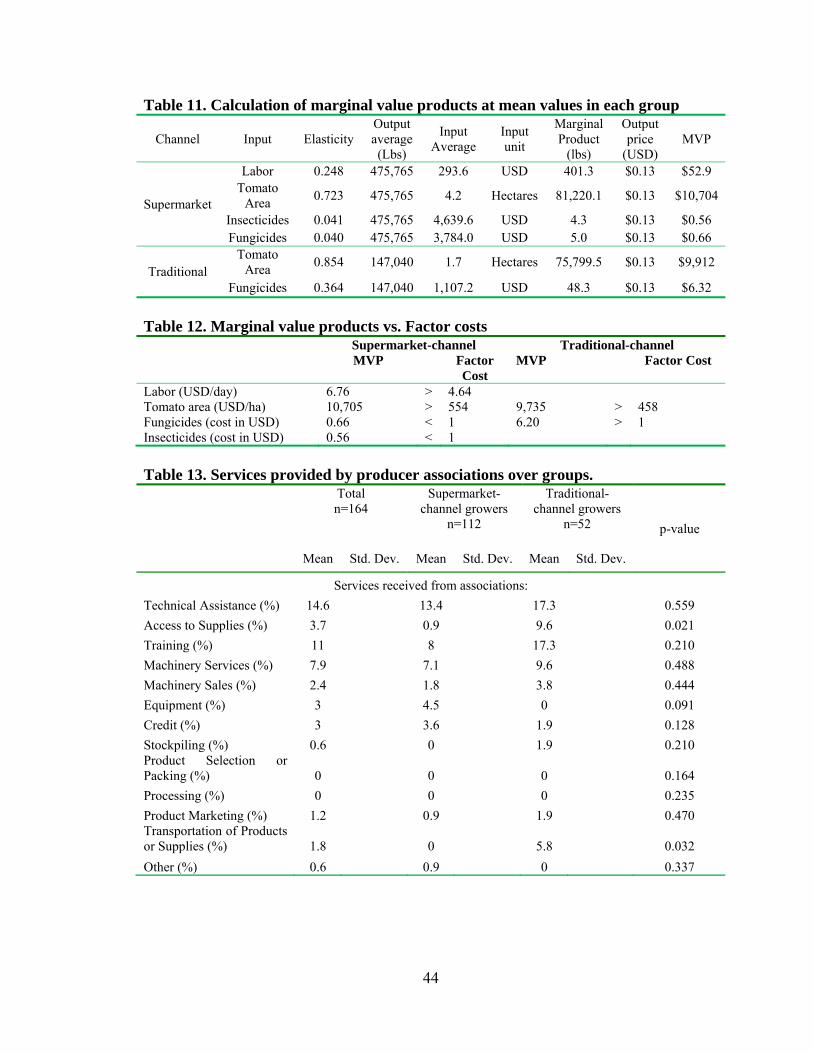
associations mainly provide some technical assistance and training, and to a very minor
extent, sale of fertilizers, rental of sprayers, and transport as seen on Table 13. Moreover,
our interviews with the dedicated wholesalers revealed that they prefer to hand-pick good
producers and bulk and select product themselves, rather than rely on the (from their
perspective, imperfect) services of the small farmers’ own groups. Note that we tested for
and found no evidence of the presence of multicollinearity between association and the
other explanatory variables. (3) There is a negative relationship between “distance from
paved highway” and participation in the supermarket channel – indicating that the
dedicated wholesalers and farmers in the modern channel are sensitive to transaction
costs, also possibly implying sensitive to transport damage to a delicate product. (4)
There is a negative relationship between nonfarm labor market participation and
supermarket-channel participation. This appears to indicate two alternative livelihood
strategies; this may relate to competition for labor and capital for the two types of
activities. (5) The farmer’s age is negatively correlated with supermarket-channel
participation. This result might imply that as the farmer ages he/she is more reluctant to
32
adopt a new market channel with different market requirements. This result is
comparable to other empirical results in the literature, such as in Carletto et al (1999)
where older farmers are reluctant to adopt production and export of a new nontraditional
product in the highlands of Guatemala.
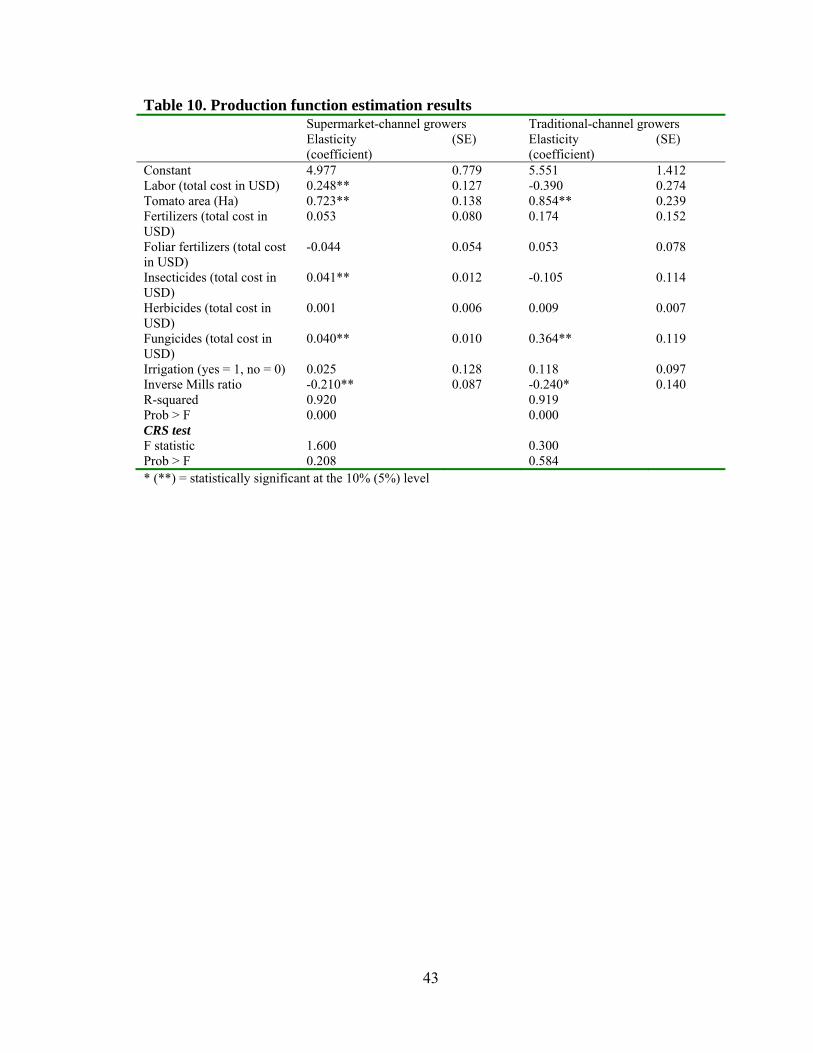
6.2. Production function estimates: comparison between groups.
The second stage is the production function, which is estimated for each
(endogenous) stratum, the supermarket-channel growers and the traditional-channel
growers. The two-step procedure is used in order to control for endogenous stratification,
simultaneously generating information about the determinants of channel choice in stage
one, and comparing the (market-channel) strata in terms of production technology in
stage two. The second stage results simply show the technology correlates of the market
channel choices; the procedure does not allow testing for causality. We perform two tests
to validate this procedure. (1) We examine the significance of the IMR in the second
equation, and finding it significant, we can say that there was selectivity bias and it was
controlled for by using the IMR. (2) We performed the Wu-Hausman test of the
endogeneity of the market channel on the production function and found it to be
exogenous.
We expect to find differences in the production technologies over the strata; given
the quality and consistency requirements of the dedicated wholesalers representing the
supermarkets we expect supermarket-channel growers to use a technology more intensive
in capital versus labor or land. We estimated the tomato function for each stratum,
controlling for the IMR, and using a log-log functional form (called a “Cobb-Douglas

33
type” function, a parsimonious form, without imposing the strict adding up conditions of
the coefficients imposed in the ‘true’ Cobb-Douglas10; Debertin, 1986). The production
function results are shown in Table 10. We compared the coefficients using a Wald test11,
and found evidence of structural differences.
On table 11 we use the significant coefficients and predicted values, plus the
annual average product price per channel, to derive the marginal value products (MVPs)
at the mean values, and we compare them to their factor costs12 in Table 12. (1) The
MVP of one ha of land under tomatoes is less than the factor price of one ha of land
(proxied by the rental price) for both strata: the MVP of land is above the rental price,
implying a land constraint. This makes sense in a situation of limited good-quality
horticultural land. (2) The MVP of labor is also higher than the wage – but only for the
supermarket-channel farmers. This implies a labor constraint for that group. This makes
sense as those farmers are in zones that are denser in rural towns (and thus alternative
employment) and there is a low landlessness rate in their zones. (3) As noted above, for
the supermarket-channel growers the MVPs of chemical pesticides and fungicides are
well below their factor prices, indicating that they are being over-used in an allocative
efficiency sense. The opposite is the case for the traditional channel, where fungicides are
underused; this might be because the traditional farmers are unaware of this underuse, or
10 We tested the null hypothesis that the production function results in each strata are consistent with
constant return to scale (CRS) and as seen on the F-statistics on the bottom of table 10, we fail to reject the
null hypothesis and therefore results are consistent with CRS as in the “ true” Cobb-Douglas function.
11 The Wald test is robust version of the Chow test, but without the assumption of homoskedasticity. 12 Variable inputs were included as expenditures, therefore the factor cost is an additional dollar of
expenditure in any given input.

34
they face a capital constraint. These results for capital use mirror those of Carter and
Wiebe (1990) who found capital constraints among the smaller farmers in wheat
production in Kenya employing the same methodology.
7. CONCLUSIONS
We have shown that tomato farmers selling to the supermarket channel tend to be
in the upper-end of the ‘small farmer’ category (whereas the traditional-channel growers
are in the lower-end), have more capital (in particular, irrigation, which allows them to
supply all year and attain greater productivity and consistency), and are much more
specialized in commercial horticulture in general and in tomatoes in particular, than
traditional farmers. While they have higher yields, they also have higher input use,
including use of chemicals, and these greater input expenditures (accompanied by more
credit and technical assistance from the chemical companies) mean that their profit rates
are roughly similar to those of farmers in the traditional channel. Supermarket-channel
farmers tell us that they prefer the more demanding wholesale-supermarket channel
because it offers a lower risk and lower transaction cost outlet for the variety of their
qualities and grades, all year. In turn, the supermarkets, who do not buy direct but rather
source from a few dedicated wholesalers, rely on this year-round supply, lower
transaction costs, and consistency.
While the share of supermarkets in the produce market in Guatemala is still
minor, these results suggest that the more capitalized tier of small farmers enjoy some
advantages with the new channel, but also some entry costs that the traditional farmers as
of yet do not face. As the supermarket channel grows, it is expected that more and more
farmers will need to capitalize in ways that will either make them competitive in the new
35
market, or in the traditional markets that will doubtless evolve to maintain
competitiveness themselves. Development programs over the medium to long run will
need to take into account the changing nature of farm-level investments thus implied.

36
Table 1. Supermarket’s characteristics and its incidence in the tomato market in 2003. Supermarket
chain Total salesa
(USD Millions)
Food salesb (USD
Millions)
FFV salesc (USD
Millions)
Tomato Volumed
(1000 lbs)
Number of stores
(19982003)
Income segment A= high,
B=Medium, C= low
La Fragua 742 631 74 7,128 82 105 ABC
Unisuper 128 115 13 1,850 21 27 ABC
PriceSmart 60 38 6.0 510 0 3 AB
Independents 177 159 18 2,105 18 30 BC
Total 1107 943 111 11,593 120 167
Source: (a) Orellana, Daniel; M+M Planet Retail press; and personal interviews; (b) Interviews with key agents: Food sales represents 85% of total supermarket sales; (c) FFV sales represents 10% of total sales; (d) 5/6 corresponds roma tomato and 1/6 is salad tomato. Also tomato sales represents 8% of total FFV sales.
Table 2. Landholdings of supermarket-channel versus traditional-channel farmers Total
n=164 Supermarket-
channel growers n=112
Traditional-channel growers
n=52 p-value
Mean Std. Dev. Mean Std. Dev. Mean Std. Dev.
Access to land (average in ha)
Own property (ha) 5.9 16.2 5.4 16.3 7.0 16.2 0.545
Obtained for usufruct (ha) 1.0 6.2 1.4 7.4 0.1 0.3 0.201
Rented-in (ha) 1.5 3.1 2.0 3.6 0.6 0.9 0.007
Sharecropped-in (ha) 0.6 1.3 0.7 1.5 0.3 0.9 0.097
Rented-out (ha) 0.1 0.7 0.1 0.8 0.1 0.4 0.561
Sharecropped-out (ha) 0.1 0.7 0.1 0.4 0.2 1.2 0.514
Total (ha) 8.8 17.0 9.3 17.5 7.8 15.8 0.612
Land use
Agriculture (ha) 3.9 3.9 4.6 4.4 2.5 1.9 0.002
Livestock (ha) 4.0 16.2 4.4 16.8 5.3 14.9 0.740
Other (ha) 0.3 1.0 0.4 1.2 0.0 0.5 0.887
Agriculture (%) 44 49 32
0.423 Livestock (%) 53 47 68
Other (%) 3 4 0
Property title
Yes (%) 60 58 65
0.601 No (%) 7 7 8
No response (%) 32 35 27
37
Table 3. Irrigation differences over groups Total
n=164 Supermarket-
channel growers n=112
Traditional-channel growers
n=52 p-value
Mean Std. Dev. Mean Std. Dev. Mean Std. Dev.
Irrigation technology in 2004
Growers with irrigation (%) 66 82 35 0.000 Growers without irrigation
(%) 34 18 65
Total (%) 100 100 100
Irrigated area (avg. ha) 3.5 4.7 4.5 4.5 1.2 4.9 0.000
Irrigated area (%) 0.4 0.4 0.5 0.4 0.2 0.4 0.000
* = statistically different at the 10% significance level Table 4. Output and yield differences over groups Total
n=164 Supermarket-
channel growers n=112
Traditional-channel growers
n=52 p-value
Mean Std. Dev. Mean Std. Dev. Mean Std. Dev.
Farm size (avg. ha) 8.8 17.0 9.3 17.5 7.8 15.8 0.612
Tomato Area (avg. ha) 3.4 4.3 4.2 4.9 1.7 1.5 0.000
Tomato production (MT) 168.6 407.4 215.8 116.5 66.7 472.2 0.002
Yield/ ha (MT) 41.4 16.2 43.7 13.1 36.6 17.0 0.008
Tomato cycles (average for the year)
1.6 0.5 1.8 0.5 1.2 0.4 0.000
Growers that plant once a year (%)
41.5 23.2 80.8
0.000 Growers that plant twice a year (%)
56.7 74.1 19.2
Growers that plant three times a year (%)
1.8 2.7 0.0
* = statistically different at the 10% significance level

38
Table 5. Credit and technical assistance over groups Total n=164 Supermarket-channel
growers n=112
Traditional-channel growers
n=52 p-value
Mean Std. Dev. Mean Std. Dev. Mean Std. Dev.
Credit access (%)
Yes (%) 79 83 71 0.556
No (%) 21 17 29
Total (%) 100 100 100
Credit received from all sources (US Dollars)
6,409 7,312 7,504 7,832 3,656 4,895 0.006
Credit source (%)
Banks are source of credit 31% 33% 27%
Input companies are source of credit
65% 71% 54%
Others are source of credit 9% 8% 10%
Access to technical assistance
Yes (%) 75 81 62 0.007
No (%) 25 19 39
Total (%) 100 100 100
39
Table 6. Net income differences over groups Total
n=164 Supermarket-
channel growers n=112
Traditional-channel growers
n=52
p-value
Mean Std. Dev. Mean Std. Dev. Mean Std. Dev.
Price
Average price USD/kg 0.29 0.29 0.29
Maximum average price 0.57 0.57 0.57
Minimum average price 0.09 0.11 0.09
Standard deviation 0.09 0.09 0.09
Range 0.47 0.45 0.47
Gross income for 1 ha (in thousands USD)
11,749 7,215 12,509 7,642 10,111 5,939 0.047
Total cost (1ha) (not including own labor)
8,339 5,606 9,097 5,959 6,685 4,508 0.008
Marketing and transportation cost
1,573 1,139 1,834 1,340 1,010 928 0.000
Total input cost (fertilizer and chemicals)
4,438 3,106 4,871 3,608 3,506 1,103 0.008
Total hired labor cost 2,175 777 2,220 785 2,056 698 0.003
Total plowing cost 154 167 173 196 113 54 0.034
Net income cash flow (1ha)
3,409 7,092 3,412 7,691 3,426 5,656 0.900
Total own labor cost13 612 221 613 210 615 246 0.779
Net income (USD/ha) 2,797 6,358 2,799 6,842 2,811 6,157 0.763
Net margin (%) 29 27 34
* = statistically different at the 10% significance level
13 Total own labor cost was calculated by multiplying the total amount of own labor used in days in each
household by the average wage (USD/day) received in each channel.

40
Table 7. Qualitative evaluations of market channels by the grower groups. Supermarket-
channel growers’ judgments of
channels
Traditional- channel growers’
judgments of channels
p-value
n=112 n=52
Ability to sell all-year to this
channel
Direct to supermarket 20% 23%
0.019
Broker at farmgate 13% 29%
Wholesaler (specific to the grower’s group/stratum)
65% 42%
No response 2% 6%
Ability to sell all
qualities/grades to this channel
Direct to supermarket 5% 4%
0.088
Broker at farmgate 7% 29%
Wholesaler (specific to grower’s group)
83% 63%
No response 4% 4%
Ability to sell at low
transaction cost and risk
to this channel
Direct to supermarket 6% 4%
0.037
Broker at farmgate 31% 52%
Wholesaler (specific to grower’s group)
57% 42%
No response 5% 2%
Ability to be paid quickly
by this channel
Direct to supermarket 7% 4%
0.013
Broker at farmgate 40% 56%
Wholesaler (specific to grower’s group)
52% 33%
No response 1% 8%
Note: Brokers at the farmgate are traditional wholesalers; wholesalers specific to the grower’s group or stratum are dedicated wholesalers for supermarket-channel growers and traditional wholesalers for traditional-channel growers.

41
Table 8. Variables used in the channel adoption model Variable Total (n=164) Supermarket- channel growers
(n=112) Traditional-channel growers (n=52) p-
value Mean Std.
Dev. Mean Std.
Dev. Min Max Mean Std.
Dev. Min Max
Grower’s age (years) 43.3 11.3 42.1 10.4 18 66 45.9 12.9 12 74 0.046
Grower’s education (years) 4.6 3.9 4.8 3.8 0 18 4.0 4.2 0 17 0.211
Family size 4.6 1.8 4.5 1.7 1 9 4.8 2.0 1 9 0.262
Equipped with transportation means (%) 26% 44% 30% 46% 0% 100% 17% 38% 0% 100% 0.078
Distance to paved highway (Kms) 3.8 14.1 3.5 10.1 0 105 4.3 20.3 0 147 0.724
Lagged (year 1999) land 8.4 15.5 9.0 16.1 0 106 7.1 14.2 0 85 0.463
Lagged association level (% of associated producers within the group)
18% 39% 15% 36% 0% 100% 25% 44% 0% 100% 0.065
Lagged irrigation (%) 55% 50% 69% 47% 0% 100% 25% 44% 0% 100% 0.000
Lagged livestock (head) 6.0 19.3 5.3 13.1 0 80 7.6 28.5 0 180 0.465
Non-farm rural income (share of family members)
3% 10% 3% 9% 0% 50% 5% 12% 0% 50% 0.210
For the purpose of comparison: the current levels of the lagged regressors:
Current (year 2004) land (farm size) 12.6 24.2 13.2 25.0 0 203 11.2 22.5 0 111 0.612
Current association level (% of associated producers within the group)
21% 41% 19% 39% 0% 100% 27% 45% 0% 100% 0.237
Current irrigation (%) 66% 47% 81% 39% 0% 100% 35% 48% 0% 100% 0.000
Current livestock (head of cattle) 7.9 26.5 6.3 15.8 0 100 11.3 41.1 0 280 0.267

42
Table 9. Determinants of tomato grower adoption of the supermarket channel Variables Coefficient (SE) Significance
Constant -1.730 3.175
Grower’s age (years) -0.020 0.012 *
Grower’s education (years) -0.039 0.038
Family size -0.027 0.062
Equipped with transportation means (yes = 1; no = 0) 0.308 0.342
Distance to paved highway (km) -0.016 0.007 **
Lagged association level (associated = 1; 0 otherwise) -0.709 0.337 **
Lagged irrigation (has irrigation = 1; no = 0) 1.286 0.282 **
Ln(Non rural farm income) Ratio -0.065 0.033 **
Lagged livestock (head) -0.007 -0.007
Lagged land (farm size) 0.006 0.033
Lagged land2 (farm size squared) -1.08e
-4 3.12 e
-4
Number of observations 164
Pseudo R2 0.328
Wald chi-squared (11) 64.44
* (**) = statistically significant at the 10% (5%) level
43
Table 10. Production function estimation results Supermarket-channel growers Traditional-channel growers Elasticity
(coefficient) (SE) Elasticity
(coefficient) (SE)
Constant 4.977 0.779 5.551 1.412 Labor (total cost in USD) 0.248** 0.127 -0.390 0.274 Tomato area (Ha) 0.723** 0.138 0.854** 0.239 Fertilizers (total cost in USD)
0.053 0.080 0.174 0.152
Foliar fertilizers (total cost in USD)
-0.044 0.054 0.053 0.078
Insecticides (total cost in USD)
0.041** 0.012 -0.105 0.114
Herbicides (total cost in USD)
0.001 0.006 0.009 0.007
Fungicides (total cost in USD)
0.040** 0.010 0.364** 0.119
Irrigation (yes = 1, no = 0) 0.025 0.128 0.118 0.097 Inverse Mills ratio -0.210** 0.087 -0.240* 0.140 R-squared 0.920 0.919 Prob > F 0.000 0.000 CRS test F statistic 1.600 0.300 Prob > F 0.208 0.584 * (**) = statistically significant at the 10% (5%) level
44
Table 11. Calculation of marginal value products at mean values in each group
Channel Input Elasticity Output average (Lbs)
Input Average
Input unit
Marginal Product
(lbs)
Output price
(USD) MVP
Supermarket
Labor 0.248 475,765 293.6 USD 401.3 $0.13 $52.9 Tomato
Area 0.723 475,765 4.2 Hectares 81,220.1 $0.13 $10,704
Insecticides 0.041 475,765 4,639.6 USD 4.3 $0.13 $0.56 Fungicides 0.040 475,765 3,784.0 USD 5.0 $0.13 $0.66
Traditional Tomato
Area 0.854 147,040 1.7 Hectares 75,799.5 $0.13 $9,912
Fungicides 0.364 147,040 1,107.2 USD 48.3 $0.13 $6.32
Table 12. Marginal value products vs. Factor costs Supermarket-channel Traditional-channel MVP Factor
CostMVP Factor Cost
Labor (USD/day) Tomato area (USD/ha) Fungicides (cost in USD) Insecticides (cost in USD)
6.76 10,705 0.66 0.56
> > < <
4.64 554 1 1
9,735 6.20
> >
458 1
Table 13. Services provided by producer associations over groups. Total
n=164 Supermarket-
channel growers n=112
Traditional-channel growers
n=52 p-value
Mean Std. Dev. Mean Std. Dev. Mean Std. Dev.
Services received from associations:
Technical Assistance (%) 14.6 13.4 17.3 0.559
Access to Supplies (%) 3.7 0.9 9.6 0.021
Training (%) 11 8 17.3 0.210
Machinery Services (%) 7.9 7.1 9.6 0.488
Machinery Sales (%) 2.4 1.8 3.8 0.444
Equipment (%) 3 4.5 0 0.091
Credit (%) 3 3.6 1.9 0.128
Stockpiling (%) 0.6 0 1.9 0.210 Product Selection or Packing (%) 0 0 0 0.164
Processing (%) 0 0 0 0.235
Product Marketing (%) 1.2 0.9 1.9 0.470 Transportation of Products or Supplies (%) 1.8 0 5.8 0.032
Other (%) 0.6 0.9 0 0.337

45
8. APPENDICES
8.1. Questionnaire
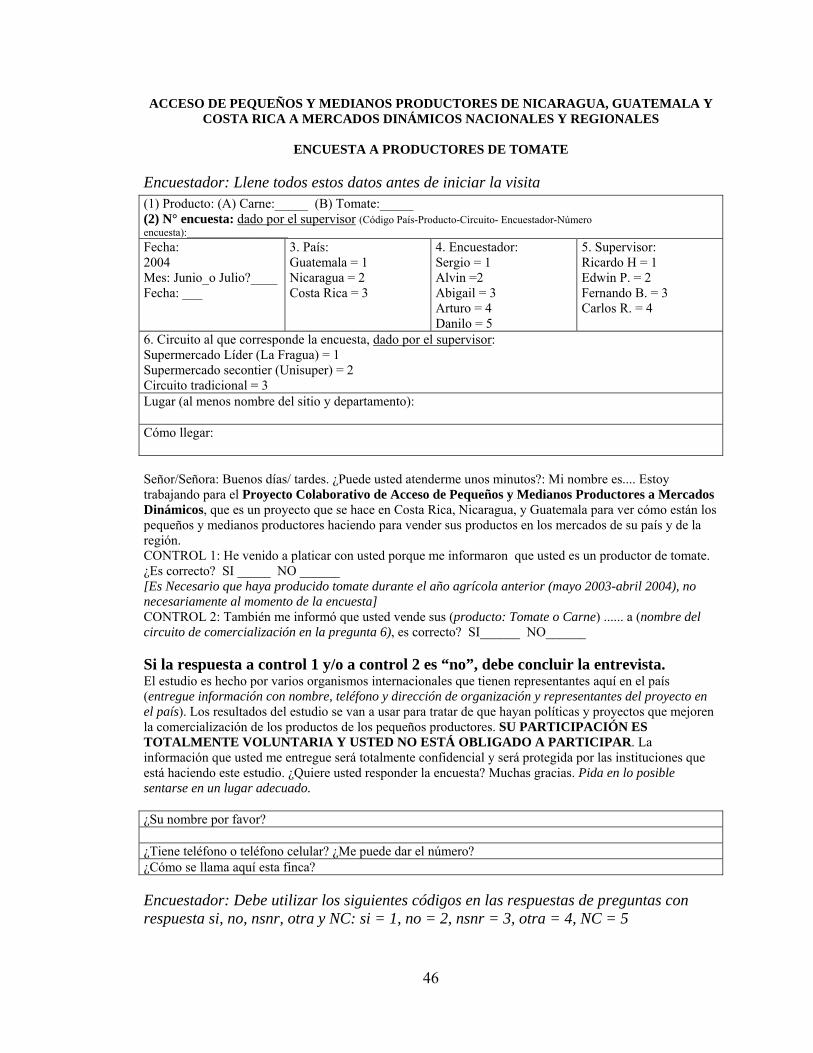
46
ACCESO DE PEQUEÑOS Y MEDIANOS PRODUCTORES DE NICARAGUA, GUATEMALA Y COSTA RICA A MERCADOS DINÁMICOS NACIONALES Y REGIONALES
ENCUESTA A PRODUCTORES DE TOMATE
Encuestador: Llene todos estos datos antes de iniciar la visita (1) Producto: (A) Carne:_____ (B) Tomate:_____ (2) N° encuesta: dado por el supervisor (Código País-Producto-Circuito- Encuestador-Número encuesta):___________________ Fecha: 2004 Mes: Junio_o Julio?____ Fecha: ___
3. País: Guatemala = 1 Nicaragua = 2 Costa Rica = 3
4. Encuestador: Sergio = 1 Alvin =2 Abigail = 3 Arturo = 4 Danilo = 5
5. Supervisor: Ricardo H = 1 Edwin P. = 2 Fernando B. = 3 Carlos R. = 4
6. Circuito al que corresponde la encuesta, dado por el supervisor: Supermercado Líder (La Fragua) = 1 Supermercado secontier (Unisuper) = 2 Circuito tradicional = 3 Lugar (al menos nombre del sitio y departamento): Cómo llegar: Señor/Señora: Buenos días/ tardes. ¿Puede usted atenderme unos minutos?: Mi nombre es.... Estoy trabajando para el Proyecto Colaborativo de Acceso de Pequeños y Medianos Productores a Mercados Dinámicos, que es un proyecto que se hace en Costa Rica, Nicaragua, y Guatemala para ver cómo están los pequeños y medianos productores haciendo para vender sus productos en los mercados de su país y de la región. CONTROL 1: He venido a platicar con usted porque me informaron que usted es un productor de tomate. ¿Es correcto? SI _____ NO ______ [Es Necesario que haya producido tomate durante el año agrícola anterior (mayo 2003-abril 2004), no necesariamente al momento de la encuesta] CONTROL 2: También me informó que usted vende sus (producto: Tomate o Carne) ...... a (nombre del circuito de comercialización en la pregunta 6), es correcto? SI______ NO______ Si la respuesta a control 1 y/o a control 2 es “no”, debe concluir la entrevista. El estudio es hecho por varios organismos internacionales que tienen representantes aquí en el país (entregue información con nombre, teléfono y dirección de organización y representantes del proyecto en el país). Los resultados del estudio se van a usar para tratar de que hayan políticas y proyectos que mejoren la comercialización de los productos de los pequeños productores. SU PARTICIPACIÓN ES TOTALMENTE VOLUNTARIA Y USTED NO ESTÁ OBLIGADO A PARTICIPAR. La información que usted me entregue será totalmente confidencial y será protegida por las instituciones que está haciendo este estudio. ¿Quiere usted responder la encuesta? Muchas gracias. Pida en lo posible sentarse en un lugar adecuado. ¿Su nombre por favor? ¿Tiene teléfono o teléfono celular? ¿Me puede dar el número? ¿Cómo se llama aquí esta finca? Encuestador: Debe utilizar los siguientes códigos en las respuestas de preguntas con respuesta si, no, nsnr, otra y NC: si = 1, no = 2, nsnr = 3, otra = 4, NC = 5

47
A. Experiencia en producción de tomates (7). ¿Desde qué año produce tomates? _________
nsnr________ (8) ¿Cuál es la actividad productiva principal de esta familia? Producción de tomate______ Otra____ nsnr____ (9).¿Es usted miembro o socio de una Cooperativa? sí______ no _____ nsnr_________ Nombres de las cooperativas: _________________________________________________ PREGUNTAR SOLO SI EN LA 9 respondió que sí (10) ¿La Cooperativa está activa? sí_____ no ______ NC ____ nsnr____ (11) Una Asociación? sí _____ no _____ NC ______ nsnr_______ Nombre de las asociaciones: __________________________________________________ PREGUNTAR SOLO SI EN LA 11 respondió que sí (12) ¿La Asociación está activa? sí_____ no ______ NC ______ nsnr _______ [Activa significa que si se reúne, si provee servicios o si la misma vende los productos de sus miembros] ¿Que servicios recibe de cualquiera de las organizaciones de productores, sea usted socio o no sea socio? (13) No corresponde _____ (14) asistencia técnica si___ no____ nsnr (15) acceso a insumos si___ no____ nsnr (16) capacitación si___ no____ nsnr (17) servicios de maquinaría si___ no____ nsnr (18) venta de maquinaria si___ no____ nsnr (19) equipos si___ no____ nsnr (20) crédito (sea en dinero o en insumos o cualquiera otra forma) si___ no____ nsnr 21i) acopio si___ no____ nsnr (22) selección o empacado de sus productos si___ no____ nsnr (23) procesamiento si___ no____ nsnr (24) mercadeo de sus productos si___ no____ nsnr (25) transporte de productos o de insumos si___ no____ nsnr (26) otros si___ no____ nsnr (detallar) _____________________________ ¿Y hace cinco años, usted pertenecía a más, menos o igual número de organizaciones o asociaciones? (27) nunca ha sido socio de ninguna organización o asociación_____ (28) más _____ (29) menos _____ (30) igual _____ (31) nsnr _____

48
B.Hogar Podría, por favor, contarme quiénes son las personas que conforman su hogar, con las que usted vive? [Preguntar por todos los miembros del hogar primero por fila y luego hacer las preguntas por cada miembro (por columna). Hogar se refiere a sus familiares directos del productor que residen en la vivienda] Nombre (A)
Sexo 1 = mujer 2= hombre
(B) tempedad
(C) Grado de escuela
(D) La semana pasada ¿trabajó fuera de la
finca?
(E) La semana pasada
¿trabajó dentro de la finca?
(32) Adultos 15-65 años
(32A) Productor (32B) (32C) (32D) (32E) (32F) (32F) (33) Niños 0-15 años (33A) (33B) (33C) (33D) (33E) (33F) (33G) (33H) (34) Mayores > 65 años
(34A) (34B) (34C) (34D) (34E) ¿De qué está hecha la casa donde usted vive: (35) material de construcción ______ (36) otros _____ (37) nsnr_____ ¿Tiene electricidad? (38) sí ____ (39) no____ (40) nsnr ____
¿Tiene agua entubada / agua potable en la casa? (41) sí____ (42) no ____ (43) nsnr____
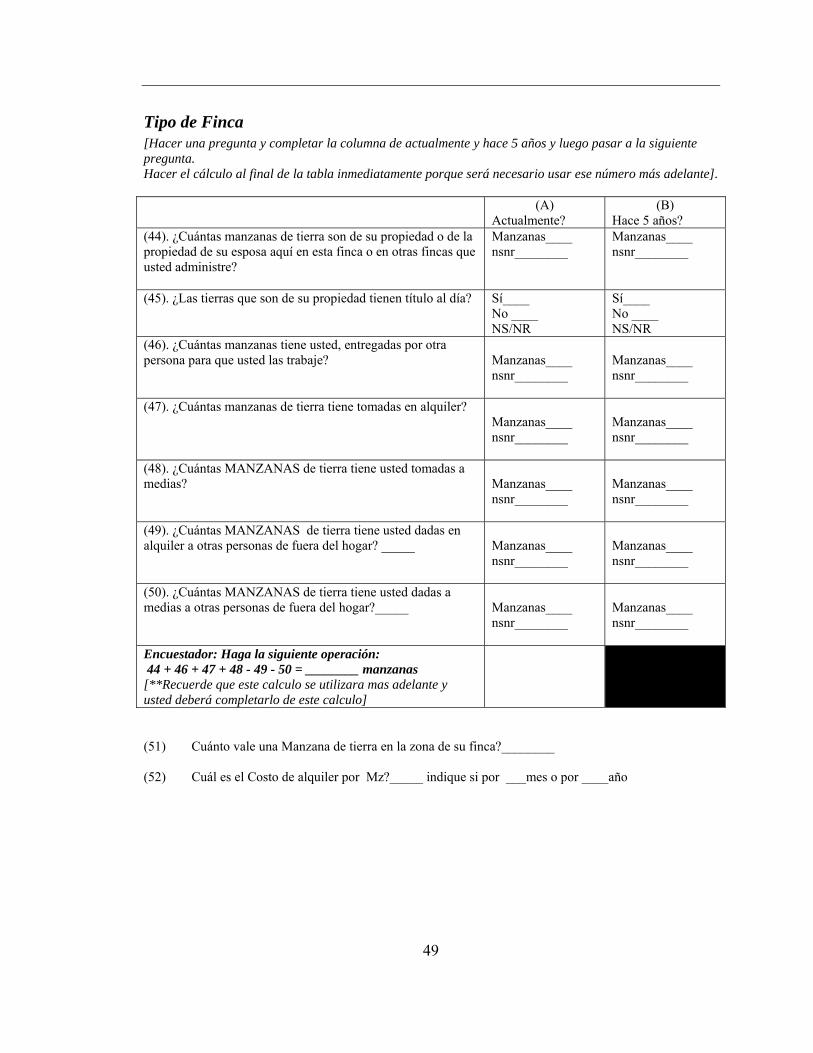
49
Tipo de Finca [Hacer una pregunta y completar la columna de actualmente y hace 5 años y luego pasar a la siguiente pregunta. Hacer el cálculo al final de la tabla inmediatamente porque será necesario usar ese número más adelante]. (A)
Actualmente? (B)
Hace 5 años? (44). ¿Cuántas manzanas de tierra son de su propiedad o de la propiedad de su esposa aquí en esta finca o en otras fincas que usted administre?
Manzanas____ nsnr________
Manzanas____ nsnr________
(45). ¿Las tierras que son de su propiedad tienen título al día?
Sí____ No ____ NS/NR
Sí____ No ____ NS/NR
(46). ¿Cuántas manzanas tiene usted, entregadas por otra persona para que usted las trabaje?
Manzanas____ nsnr________
Manzanas____ nsnr________
(47). ¿Cuántas manzanas de tierra tiene tomadas en alquiler?
Manzanas____ nsnr________
Manzanas____ nsnr________
(48). ¿Cuántas MANZANAS de tierra tiene usted tomadas a medias?
Manzanas____ nsnr________
Manzanas____ nsnr________
(49). ¿Cuántas MANZANAS de tierra tiene usted dadas en alquiler a otras personas de fuera del hogar? _____
Manzanas____ nsnr________
Manzanas____ nsnr________
(50). ¿Cuántas MANZANAS de tierra tiene usted dadas a medias a otras personas de fuera del hogar?_____
Manzanas____ nsnr________
Manzanas____ nsnr________
Encuestador: Haga la siguiente operación: 44 + 46 + 47 + 48 - 49 - 50 = ________ manzanas [**Recuerde que este calculo se utilizara mas adelante y usted deberá completarlo de este calculo]
(51) Cuánto vale una Manzana de tierra en la zona de su finca?________ (52) Cuál es el Costo de alquiler por Mz?_____ indique si por ___mes o por ____año

50
FINCA De aquí en adelante la encuesta se refiere a toda esta superficie resultante de la operación de la última fila del cuadro anterior (53). ¿Cuál es el área que usa para cultivos agrícolas (anuales y perennes) de este total de _______ manzanas que usted maneja?
______ manzanas _______nsnr
[el total de manzanas se refiere al calculo 44 + 46 + 47 + 48 - 49 - 50 = ________ manzanas realizado anteriormente] (54). ¿Cuántas manzanas de ese total se dedicaron a la ganadería (en pastos)? ______ manzanas ______ nsnr (55). ¿Cuántas temporadas/cosechas de tomate sembró usted el año agrícola pasado, es decir, entre mayo del 2003 a abril del 2004? ______ temporadas/cosechas de tomate ______ nsnr Para el año agrícola anterior (mayo 2003-abril 2004) [Hacer preguntas por fila por tipo de tomate].
Temporada/cosecha N° (A) Tomate Manzano?
(B) Tomate Cocina?
Mz nsnr Mz nsnr (56). ¿Y cuántas manzanas sembró el año agrícola anterior (mayo 2003-abril 2004) en temporada/cosecha número 1 de?
(57). en la temporada/cosecha número 2 de?
(58). en la temporada/cosecha número 3 de?
(59). en la temporada/cosecha número 4 de?
(60). en la temporada/cosecha número 5 de?
(61) en la temporada/cosecha número 6 de?
(62). ¿Y ahora en el año agrícola de mayo 1999 a abril 2000, cuántos temporadas/cosechas de tomate sembró usted? ______ temporadas/cosechas de tomate ______ nsnr Para el año agrícola entre mayo 1999 y abril 2000 [Hacer preguntas por fila por tipo de tomate].

51
Temporada/cosecha N° (A) Tomate Manzano?
(B) Tomate Cocina?
Mz nsnr Mz nsnr (63). ¿Y cuántas manzanas sembró el año agrícola anterior (mayo 1999-abril 2000) en temporada/cosecha número 1 de?
(64). temporada/cosecha número 2 de? (65). temporada/cosecha número 3 de? (66). temporada/cosecha número 4 de? (67). temporada/cosecha número 5 de? (68) .temporada/cosecha número 6 de? (69) ¿En todas las _____ MANZANAS que usted maneja, cuántas se pueden regar en un año normal? _________ manzanas nsnr_______ [Total las___manzanas se refiere al calculo 44 + 46 + 47 + 48 - 49 - 50 = ________ manzanas realizado anteriormente. El área que puede regar significa que área tiene actualmente riego] ¿Cuántas MANZANAS de tierra tiene con los diferentes sistemas de riego en el periodo 2003-2004? [Se refiere al ciclo agrícola pasado, es decir, entre mayo del 2003 a febrero del 2004 Primero pregunte que tipo de riego tiene (por fila) y luego complete la información por columna. Granos básicos se refiere a frijoles, maíz; OB: Otros vegetales son otras hortalizas y frutas] (A)
Tomate (B)
Otros vegetales (C)
Granos básicos (70) Surco o gravedad (71) Goteo (72) Aspersión ¿Cómo regaba en 1999? (A)
Tomate (B)
Otros vegetales (C)
Granos básicos (73) Surco o gravedad (74) Goteo (75) Aspersión ¿La fuente de agua de riego es? (76) no tiene agua de riego____ (76) río _____ (77) (A) pozo artesanal ____ (B) Cuantos_____ (78) (A) pozo mecánico ____ (B) Cuantos_____ (79) nsnr____
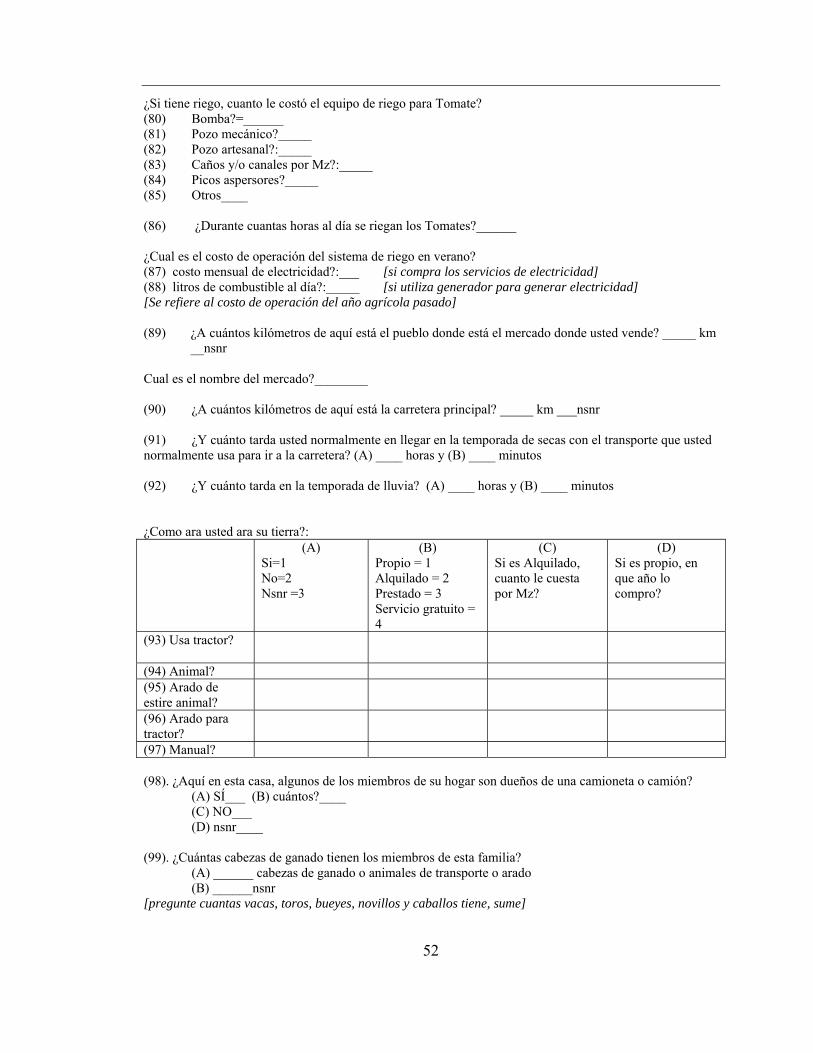
52
¿Si tiene riego, cuanto le costó el equipo de riego para Tomate? (80) Bomba?=______ (81) Pozo mecánico?_____ (82) Pozo artesanal?:_____ (83) Caños y/o canales por Mz?:_____ (84) Picos aspersores?_____ (85) Otros____ (86) ¿Durante cuantas horas al día se riegan los Tomates?______ ¿Cual es el costo de operación del sistema de riego en verano? (87) costo mensual de electricidad?:___ [si compra los servicios de electricidad] (88) litros de combustible al día?:_____ [si utiliza generador para generar electricidad] [Se refiere al costo de operación del año agrícola pasado] (89) ¿A cuántos kilómetros de aquí está el pueblo donde está el mercado donde usted vende? _____ km
__nsnr Cual es el nombre del mercado?________ (90) ¿A cuántos kilómetros de aquí está la carretera principal? _____ km ___nsnr (91) ¿Y cuánto tarda usted normalmente en llegar en la temporada de secas con el transporte que usted normalmente usa para ir a la carretera? (A) ____ horas y (B) ____ minutos (92) ¿Y cuánto tarda en la temporada de lluvia? (A) ____ horas y (B) ____ minutos ¿Como ara usted ara su tierra?:
(A) Si=1 No=2 Nsnr =3
(B) Propio = 1 Alquilado = 2 Prestado = 3 Servicio gratuito = 4
(C) Si es Alquilado, cuanto le cuesta por Mz?
(D) Si es propio, en que año lo compro?
(93) Usa tractor?
(94) Animal? (95) Arado de estire animal?
(96) Arado para tractor?
(97) Manual? (98). ¿Aquí en esta casa, algunos de los miembros de su hogar son dueños de una camioneta o camión? (A) SÍ___ (B) cuántos?____ (C) NO___ (D) nsnr____ (99). ¿Cuántas cabezas de ganado tienen los miembros de esta familia? (A) ______ cabezas de ganado o animales de transporte o arado (B) ______nsnr [pregunte cuantas vacas, toros, bueyes, novillos y caballos tiene, sume]
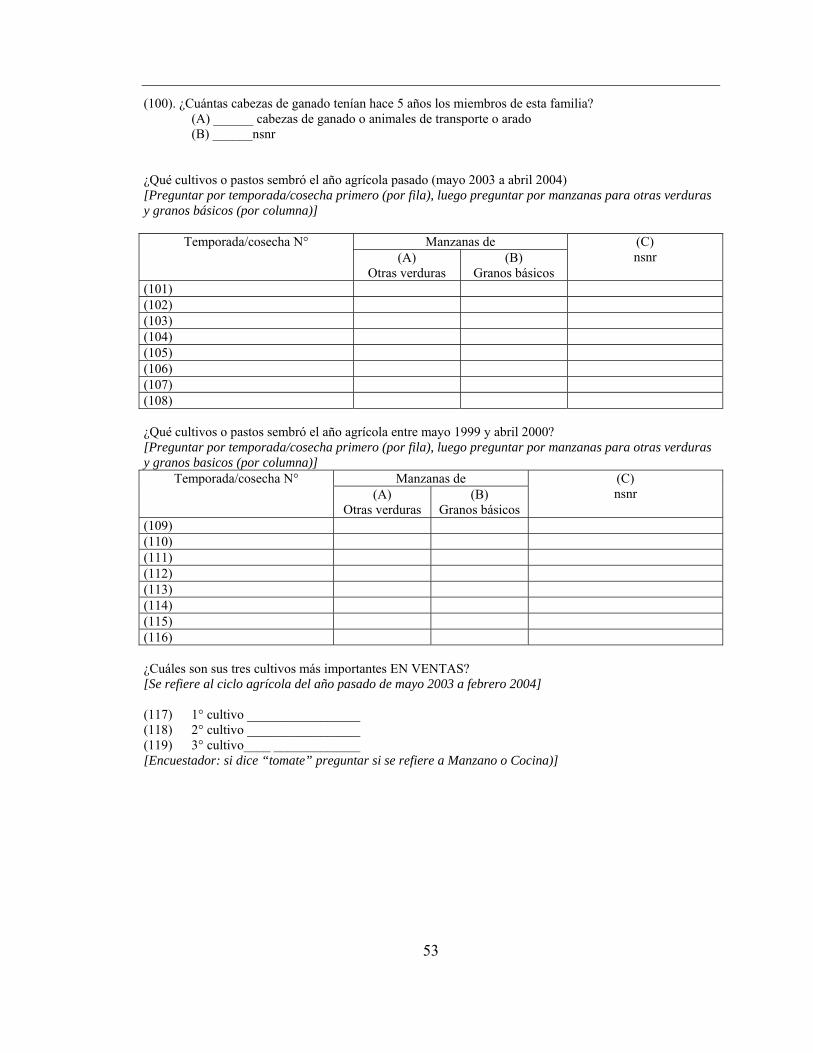
53
(100). ¿Cuántas cabezas de ganado tenían hace 5 años los miembros de esta familia? (A) ______ cabezas de ganado o animales de transporte o arado (B) ______nsnr ¿Qué cultivos o pastos sembró el año agrícola pasado (mayo 2003 a abril 2004) [Preguntar por temporada/cosecha primero (por fila), luego preguntar por manzanas para otras verduras y granos básicos (por columna)]
Temporada/cosecha N° Manzanas de (C) nsnr (A)
Otras verduras (B)
Granos básicos (101) (102) (103) (104) (105) (106) (107) (108) ¿Qué cultivos o pastos sembró el año agrícola entre mayo 1999 y abril 2000? [Preguntar por temporada/cosecha primero (por fila), luego preguntar por manzanas para otras verduras y granos basicos (por columna)]
Temporada/cosecha N° Manzanas de (C) nsnr (A)
Otras verduras (B)
Granos básicos (109) (110) (111) (112) (113) (114) (115) (116) ¿Cuáles son sus tres cultivos más importantes EN VENTAS? [Se refiere al ciclo agrícola del año pasado de mayo 2003 a febrero 2004] (117) 1° cultivo _________________ (118) 2° cultivo _________________ (119) 3° cultivo____ _____________ [Encuestador: si dice “tomate” preguntar si se refiere a Manzano o Cocina)]
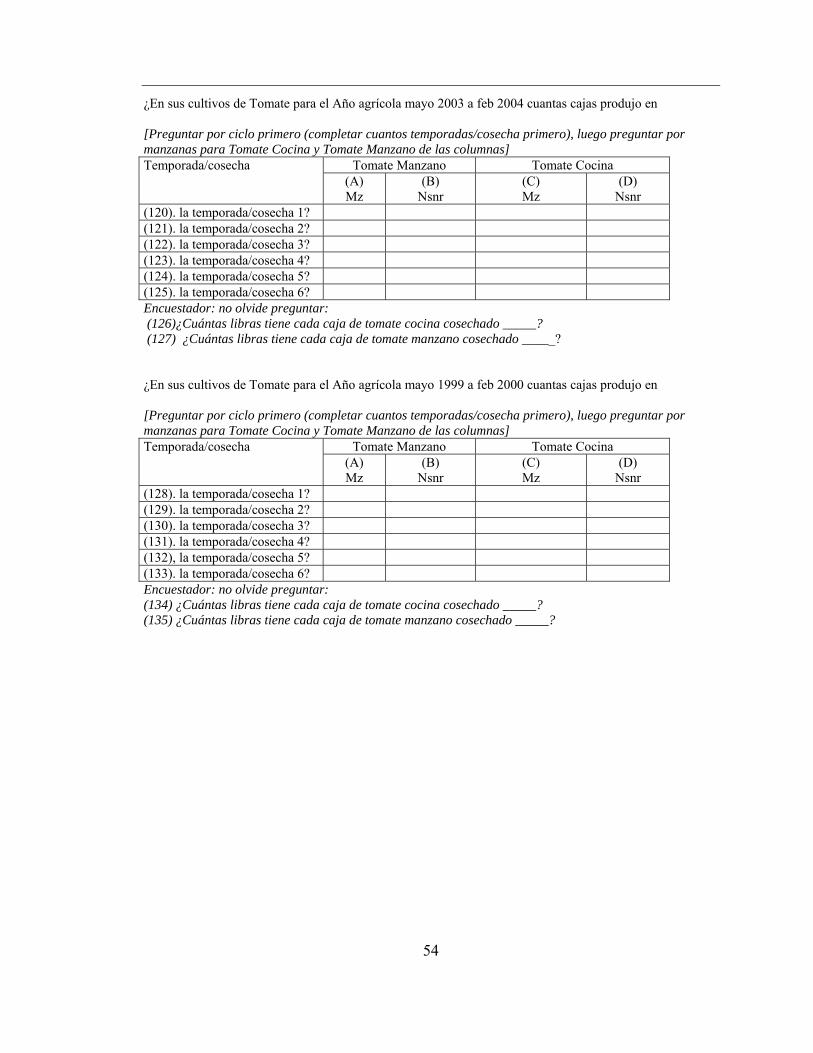
54
¿En sus cultivos de Tomate para el Año agrícola mayo 2003 a feb 2004 cuantas cajas produjo en [Preguntar por ciclo primero (completar cuantos temporadas/cosecha primero), luego preguntar por manzanas para Tomate Cocina y Tomate Manzano de las columnas] Temporada/cosecha Tomate Manzano Tomate Cocina
(A) Mz
(B) Nsnr
(C) Mz
(D) Nsnr
(120). la temporada/cosecha 1? (121). la temporada/cosecha 2? (122). la temporada/cosecha 3? (123). la temporada/cosecha 4? (124). la temporada/cosecha 5? (125). la temporada/cosecha 6? Encuestador: no olvide preguntar: (126)¿Cuántas libras tiene cada caja de tomate cocina cosechado _____? (127) ¿Cuántas libras tiene cada caja de tomate manzano cosechado _____? ¿En sus cultivos de Tomate para el Año agrícola mayo 1999 a feb 2000 cuantas cajas produjo en [Preguntar por ciclo primero (completar cuantos temporadas/cosecha primero), luego preguntar por manzanas para Tomate Cocina y Tomate Manzano de las columnas] Temporada/cosecha Tomate Manzano Tomate Cocina
(A) Mz
(B) Nsnr
(C) Mz
(D) Nsnr
(128). la temporada/cosecha 1? (129). la temporada/cosecha 2? (130). la temporada/cosecha 3? (131). la temporada/cosecha 4? (132), la temporada/cosecha 5? (133). la temporada/cosecha 6? Encuestador: no olvide preguntar: (134) ¿Cuántas libras tiene cada caja de tomate cocina cosechado _____? (135) ¿Cuántas libras tiene cada caja de tomate manzano cosechado _____?

55
Comercialización de tomate ¿A quién vende su tomate de cocina, sea que usted lo venda solo o con una organización o un grupo? [TOMATE cocina: Preguntar primero a que canales vende y marcar a cuales vende (por fila) y luego hacer las preguntas por columna] Cómo vende usted sus tomates Cocina?
MARCAR
(A) ¿Desde qué año le vende a este comprador?
TOMATE DE COCINA (B)
¿Usted tiene una relación más o menos formal con un comprador en este mercado o le vende al que mejor le paga? 1= formal (no es necesario un contrato) 2= mejor pago 3= otro 4= nsnr
(C) ¿Cuántas cajas de tomate de Cocina vendió en la TEMPORADA/COSECHA .... por este sistema de comercialización a este o estos compradores, durante el año agrícola pasado?
(D) Costo de Comerciización (Ver guia para este calculoa
(E) ¿Cuál es el precio PROMEDIO que le pagaron durante la TEMPORADA/COSECHA .... por cada caja de tomate de COCINA, durante el año agrícola pasado?
(C1) 1
(C2) 2
(C3) 3
(C4) 4
(C5)5 (C6)6 (E1) 1
(E2) 2
(E3) 3
(E4) 4
(E5) 5
(E6)6
Entrega directa a un supermercado
(136) en forma individual
(137)con una organización o grupo
A una empresa que compra para un supermercado
(138) en forma individual
(139) con una organización o grupo
A un intermediario aquí en la finca
(140) en forma individual
(141) con una organización o grupo
56
Lo transporta y lo vende a un intermediario en un mercado mayorista
(142) En forma individual
(143)Con una organización o grupo
Lo transporta al mercado y lo vende a usted mismo a los consumidores
(144) en forma individual
(145)Con una organización o grupo
Lo entrega directamente a un exportador
(146) en forma individual
(147)Con una organización o grupo
Lo vende a una agroindustria para procesar
(148) en forma individual
(148)Con una organización o grupo
(149) Otro
ENCUESTADOR: Asegurarse de preguntarle al productor y anotar aquí--> ¿ De cuántas LIBRAS es una caja de tomate de cocina? ________ Lb/caja

57
[ENCUESTADOR: Si mencionó que “vende a supermercados o a empresas que compran para supermercados”, entonces haga las preguntas 165 y 166. Si no, pase a la pregunta 167.] (165). ¿En qué año vendió por primera vez cualquier producto agrícola a .....? año _______ nsnr______ (166) ¿Cuántos días tarda en pagarle el .... ? ___________ (A) días ______ (B) nsnr (167) ¿Recibe usted asistencia técnica? Si_____ No_____ nsnr_____ [Si la respuesta es “NO” pase a las preguntas 178-188] ¿Quien le da a usted asistencia técnica en cualquiera de sus cultivos? [Haga la pregunta por cada ítem de la fila primero, luego complete las columnas] Fuente de asistencia técnica
(A) ¿Es individual o de grupo? 1= Individual 2= grupo
(B) Es gratuita o paga 1=si paga 2=no paga
(C) ¿Con qué frecuencia lo visita en su finca? 0 = esta fuente NO 1= semanalmente2 = 2-3 veces por mes 3= 1 vez por mes o menos 4=nsnc
(D) ¿También al tomate de cocina? 0 = no 1= si 2=nsnr 3=nc
(E) ¿También al tomate manzano? 0 = no 1= si 2=nsnr 3=nc
(168) Agrónomo o técnico del supermercado
(169) Agrónomo o técnico de una empresa formal que le compra sus productos para el supermercado
(170) Agrónomo o técnico de la asociación, cooperativa o grupo
(171) Agrónomo o técnico de una ONG o proyecto
(172) Agrónomo o técnico del gobierno
(173) Agrónomo o técnico de las casas comerciales
(174) Agroindustria (175) Los intermediarios
(176) Algún vecino (177) Otra persona u organización
58
¿Quien le da a usted crédito para cualquiera de sus cultivos o cualquier otro motivo? [Haga la pregunta por cada ítem de la fila primero, luego complete las columnas] Fuente de crédito (A)
¿Cantidad que le prestó en el año agrícola mayo 2003 a abril 2004, para capital de trabajo?
(B) ¿Cantidad que le prestó en el año agrícola mayo 2003 a abril 2004, para inversión?
(178) Banco (179) Supermercado (180) Empresa formal que le compra sus productos para el supermercado
(181) Asociación, cooperativa o grupo
(182) ONG o proyecto (183) Gobierno (184) Casas comerciales (185) Agrondustria (186) Intermediarios (Comprador)
(187) Vecinos o prestamistas (188) Otra persona u organización
(189) ¿Tiene usted invernadero?_____ (SI=1; NO=2) Si tiene usted invernadero, (190) Cuál es el área_____(mts2) (191) Qué área utiliza para el Tomate?_____(mts2) (192) Para qué tipo de Tomate______(Tomate Manzano = 1; Tomate De Cocina =2 ; Ambos =3) (193) Es Propio?____ (Si=1; No=2) (194) Desde qué año?_____ (195) Cuánto ha pagado en inversión?______ (196) Es Alquilado?____ (Si=1; No=2) (197) Desde qué año?_____ (198) Cuánto paga por mes?______gané (199) Nsnr____ Lleva ud. registros de producción? (200) si___ (201) no___ (202) nsnr___
59
Quisiera ahora hacerle unas preguntas sobre los insumos que usa en la producción de tomate de cocina [Si el costo esta desglosado por Mz llene la columna Cantidad por Mz. Si el costo esta desglosado por área total de tomate, llene la columna Cantidad por área total y (203i) especifique cuál es el área total a que se refiere el costo _____(mz)] [Se refiere a la última cosecha de verano]
Insumo (A) Unidad
(B) Precio por
Unidad
(C) Cantidad por
MZ
(D) Cantidad por
área total
Costo
(203) F E R T I L I Z A N T E S / F O R M U L A (203A) (203B) (203C) (203D) (203E) (203F)
(204) F O L I A R E S (204A) (204B) (204C) (204D) (204E) (204F) (204G)
(205) I N S E C T I C I D A S (205A) (205B) (205C) (205D) (205E) (205F) (205G) (205H)
(206) H E R B I C I D A S (206A) (206B) (206C) (206D) (206E) (206F) (206G)
(207) F U N G I C I D A S (207A) (207B) (207C) (207D) (207E)
(208) M A T E R I A L E S (208A) (208B) (208C)
(209) O T R O S (Semilla, etc.) (209A) (209B)
60
Quisiera ahora hacerle unas peguntas sobre los insumos que usa en la producción de tomate manzano en [Si el costo esta desglosado por Mz llene la columna Cantidad por Mz.; Si el costo esta desglosado por área total de tomate, llene la columna Cantidad por area total y (210i) especifique el cual es el área total a que se refiere el costo _____(mz)]. [Se refiere a la última cosecha de verano]
Insumo (A) Unidad
(B) Precio por
Unidad
(C) Cantidad por
MZ
(D) Cantidad por
área total
Costo
(210) F E R T I L I Z A N T E S / F O R M U L A (210A) (210B) (210C) (210D) (210E)
(211) F O L I A R E S (211A) (211B) (211C) (211D) (211E) (211F)
(212) I N S E C T I C I D A S (212A) (212B) (212C) (212D) (212E) (212F) (212G)
(213) H E R B I C I D A S (213A) (213B) (213C) (213D) (213E) (213F)
(214) F U N G I C I D A S (214A) (214B) (214C) (214D)
(215) M A T E R I A L E S (215A) (215B) (215C)
(216) O T R O S (Semilla, etc.) (216A) (216B)

61
¿Podría informarme sobre el trabajo en el cultivo del tomate de cocina en la última temporada/cosecha de tomate que haya cosechado por Mz? [Haga las pregunta de una actividad primero y luego llene las filas y columnas de esa actividad antes de pasar a la siguiente actividad]
(A) Jornales
Familiares o no pagados
(B) Jornales
Contratados
(C) Salario por jornal
con comida (Q)
(D) Salario por jornal
sin comida (Q)
(217) LIMPIA Y PREPARACIÓN DEL TERRENO (217A) Menores de 14 años (217B) Varones 15-65 años (217C) Mujeres 15-65 años (217D) Mayores de 65 años
(218) PREPARACION DEL SUELO PARA LA SIEMBRA (incluye aradura, rastreo, surqueo...)
(218A) Menores de 14 años (218B) Varones 15-65 años (218C) Mujeres 15-65 años (218D) Mayores de 65 años
(219) SIEMBRA O TRANSPLANTE
(219A) Menores de 14 años (219B) Varones 15-65 años (219C) Mujeres 15-65 años (219D) Mayores de 65 años
(220) FERTILIZACIONES (220A) Menores de 14 años (220B) Varones 15-65 años (220C) Mujeres 15-65 años (220D) Mayores de 65 años
(221) RIEGOS (221A) Menores de 14 años (221B) Varones 15-65 años (221C) Mujeres 15-65 años (221D) Mayores de 65 años
(222) FUMIGACIONES incluye fungicidas, insecticidas, foliares, herbicidas (222A) Menores de 14 años (222B) Varones 15-65 años (222C) Mujeres 15-65 años (222D) Mayores de 65 años
(223) DESHIERBES MANUALES O CON MAQUINARIA (223A) Menores de 14 años (223B) Varones 15-65 años (223C) Mujeres 15-65 años (223D) Mayores de 65 años
(224) TUTOREO AMARRE y PODAS (podas aplica en manzano) (224A) Menores de 14 años (224B) Varones 15-65 años (224C) Mujeres 15-65 años (224D) Mayores de 65 años
(225) COSECHA (225A) Menores de 14 años (225B) Varones 15-65 años (225C) Mujeres 15-65 años (225D) Mayores de 65 años
(226) CLASIFICACIÓN Y EMPAQUE (226A) Menores de 14 años (226B) Varones 15-65 años (226C) Mujeres 15-65 años (226D) Mayores de 65 años
(227) TRANSPORTE Y COMERCIALIZACIÓN (227A) Menores de 14 años (227B) Varones 15-65 años (227C) Mujeres 15-65 años (227D) Mayores de 65 años Encuestador: Si la cosecha se paga por caja, entonces calcule los jornales de la siguiente forma:

62
(228) ¿Cuánto paga por la cosecha de cada caja? ______ Córdobas/ Quetzales (229). ¿Cuántas cajas se cosecharon? ______ cajas resultado 1 Multiplique pregunta 1 x pregunta 2 = ________ pago por todas las cajas = (230) ¿Cuánto se paga por jornal normal? ______ por jornal normal resultado 2 Divida resultado 1 / pregunta 3 = número equivalente de jornales en la cosecha (231) ¿Qué porcentaje de mujeres/ niños/ varones participan en la cosecha? ____% resultado 3: multiplique el resultado 2 por el % e ingrese este dato en la tabla en la categoría que corresponda Encuestador: Si la clasificación se paga por caja calcule los jornales de la siguiente forma: (232) ¿Cuánto paga por la clasificación de cada caja? ______ Córdobas/ Quetzales (233) ¿Cuántas cajas se clasificaron? ______ cajas resultado 1 Multiplique pregunta 1 x pregunta 2 = ________ pago por todas las cajas = (234) ¿Cuánto se paga por jornal normal? ______ por jornal normal resultado 2 Divida resultado 1 / pregunta 3 = número equivalente de jornales en la clasificación (235) ¿Qué porcentaje de mujeres/ niños/ varones participan en la clasificación? ____% resultado 3: multiplique el resultado 2 por el % e ingrese este dato en la tabla en la categoría que corresponda (255) ¿Tiene certificación de calidad para sus tomates? sí______ no_____ nsnr_____ Si la respuesta es sí, pregunte cuáles certificaciones? Certificación (A)
(Si=1; No=2; Nsnr=3)
(B) Requerida o dada por: Supermercado = (1) Exportador = (2) Agroindustria = (3) ONG = (4) Cooperativa/Asociación= (5) Otros= (6)
(256) Sello PIPAA
(257) Sello País (258) Certificación Orgánica (259) Otro? Nombre de la certificación______________________
(260) Otro? Nombre de la certificación______________________
(261) Si responde “sí” en la pregunta (255), ¿Desde qué año tiene esta certificación de calidad?
año ______ nsnr ______
(262) ¿Descontando todos los costos que tiene para producir el tomate que usted vende, cuánto le quedo de ganancia en el año agrícola mayo 2003 a abril 2004? Ganancia___________ (Córdobas/Quetzales por año) Pérdida___________ (Córdobas/Quetzales por año) Ni pérdida ni ganancia _____ (263) (Preguntar sólo si el productor vende a supermercados o a empresa que compra para los supermercados). ¿Desde que su tomate se vende a supermercados usted económicamente anda ..?
Mejor _____ Peor ______ Igual ______
Nsnr _____
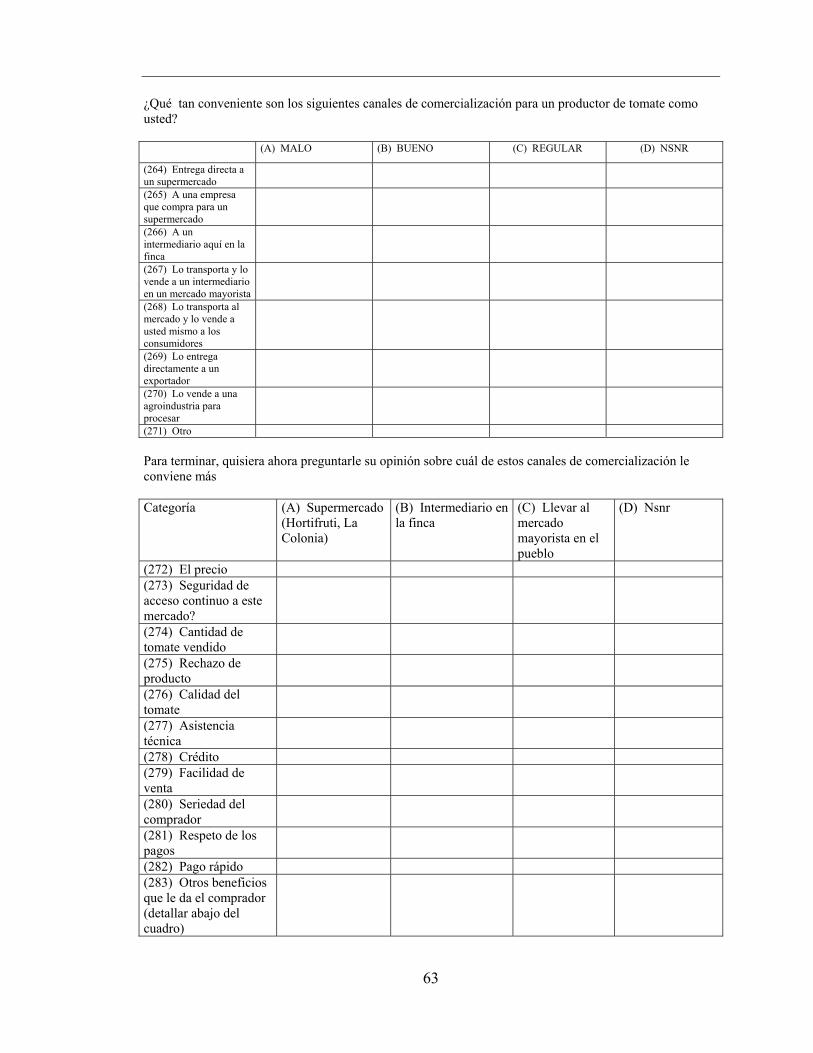
63
¿Qué tan conveniente son los siguientes canales de comercialización para un productor de tomate como usted? (A) MALO (B) BUENO (C) REGULAR (D) NSNR
(264) Entrega directa a un supermercado
(265) A una empresa que compra para un supermercado
(266) A un intermediario aquí en la finca
(267) Lo transporta y lo vende a un intermediario en un mercado mayorista
(268) Lo transporta al mercado y lo vende a usted mismo a los consumidores
(269) Lo entrega directamente a un exportador
(270) Lo vende a una agroindustria para procesar
(271) Otro
Para terminar, quisiera ahora preguntarle su opinión sobre cuál de estos canales de comercialización le conviene más Categoría (A) Supermercado
(Hortifruti, La Colonia)
(B) Intermediario en la finca
(C) Llevar al mercado mayorista en el pueblo
(D) Nsnr
(272) El precio (273) Seguridad de acceso continuo a este mercado?
(274) Cantidad de tomate vendido
(275) Rechazo de producto
(276) Calidad del tomate
(277) Asistencia técnica
(278) Crédito (279) Facilidad de venta
(280) Seriedad del comprador
(281) Respeto de los pagos
(282) Pago rápido (283) Otros beneficios que le da el comprador (detallar abajo del cuadro)

64
BIBLIOGRAPHY
65
9. BIBLIOGRAPHY
Barrett, C.B. 2007. Smallholder Market Participation: Concepts and Evidence from Eastern and Southern Africa. Paper presented at FAO workshop on Staple Food Trade and Market Policy Options for Promoting Development in Eastern and Southern Africa, Rome, March 1-2, 2007
Berdegué, J., Balsevich F., Flores L. Reardon, T., 2005. The rise of supermarkets in Central America: implications for private standards for quality and safety of fruits and vegetables. Food Policy, 30(3), 254-269.
Carletto, Calogero, A. de Janvry, and E. Sadoulet. 1999. “Sustainability in the Diffusion of Innovation: Smallholder Non-Traditional Agro-Exports in Guatemala”, Economic Development and Cultural Change, vol. 47, no. 2.
Carter, M.R., Wiebe. K.D., 1990. Access to capital and its impact on the agrarian structure and productivity in Kenya. Am. J. Agric. Econ. 72(5), 1146-1150.
Carter, M.R. and C.B. Barrett 2006. The Economics of Poverty Traps and Persistent Poverty: An Asset‐Based Approach. Journal of Development Studies 42(2):178‐199.
de Janvry, A., M. Fafchamps and E. Sadoulet (1991). Peasant Household Behavior with Missing Markets: Some Paradoxes Explained, Economic Journal 101: 1400‐1417
Debertin, D.L., 1986. Agricultural Production Economics. Macmillan Publishing Co. New York.
Eswaran, M., Kotwal, A., 1985. A theory of contractual structure in agriculture. Am. Econ. Rev. 75, 353-367.
Fafchamps, M. 1992. Cash Crop Production, Food Price Volatility, and Rural Market Integration in the Third World. American Journal of Agricultural Economics 74(1),90-99
Feder, G., Just, R., Zilberman, D., 1985. Adoption of agricultural innovations in developing countries: a survey. Econ. Dev. Cultural Change. 33(2), 255-298.
Fletcher, L., E. Graber, W. Merrill, Thorbecke, E., 1970. Guatemala’s Economic Development: The role of Agriculture. First ed. The Iowa State University Press.
Goetz, S.J. 1992. A selectivity model of household food marketing behavior in Sub-Saharan Africa. Am. J. Agric. Econ. 74, 444-52.
Gow, H.R., Swinnen, J.F.M., 2001. Private enforcement capital and contract enforcement in transition economies. Am. J. Agric. Econ., 83(3), 686-690.
Heckman, J., 1978. Dummy endogenous variables in a simultaneous equation system. Econometrica 46(4), 931-959.
Heckman, J. 1979. Sample selection bias as a specification error. Econometrica 47(1), 153-162.
Hernández R, Reardon T, Berdegué J. 2007. Supermarkets, wholesalers, and tomato growers in Guatemala. Agricultural Economics 36(3): 281-290

66
Holloway, G., Barrett, C.B., Ehui., S., 2005. The double-hurdle model in the presence of fixed costs. Journal of International Agricultural Trade and Development 1, 17-28.
Instituto Nacional de Estadistica (INE). 2004. IV Censo agropecuario, Tomo II Fincas Censales, accessed December 2005. available at: http://www.ine.gob.gt/content/censagrop.htm.
Lau, L.J.,Yotopoulos, P., 1971. A test for relative rfficiency and application to Indian agriculture. Am. Econ. Rev. 61(1), 94-109.
Lopez, R., 1984. Estimating labor supply and production decisions of self-employed farm producers. European Economic Review. 24, 61-82.
Manski, C., Lerman, S., 1977. The estimation of choice probabilities from choice based samples. Econometrica 45(8), 1977-1988.
Newbery, D., Stiglitz, J. 1981. Thre theory of commodity price stabilization. Oxford university press.
Orellana, D., Vasquez, E., 2004. Guatemala Retail Food Sector Annual 2004. USDA Foreign Agricultural Service. Global Agricultural Information Network Report # GT4018. Washington DC: USDA.
Pitt, M., Khandker, S., 1998. The impact of group-based credit programs on poor households in Bangladesh: does the gender of participants matter? J. Poli. Econ. 106(5), 958-996.
Reardon, T., Taylor, J.E., Stamoulis, K., Lanjouw, P. and Balisacan, A., 2000. Effects of nonfarm employment on rural income inequality in developing countries: an investment perspective. Journal of Agricultural Economics 51 2, pp. 266–288
Reardon, T. Berdegué. J.A., 2002. The rapid rise of supermarkets in Latin America: challenges and opportunities for development. Development Policy Review 20(4), 317-334.
Rivers, D., Vuong. Q., 1988. Limited information estimators and exogeneity tests for simultaneous probit models. Journal of Econometrics 39, 347-366.
Sadoulet, E., de Janvry, A., 1995. Quantitative Development Policy Analysis. Baltimore: The Johns Hopkins University Press.
Singh, I., Squire, L., Strauss, J., 1986. Agricultural Household Models : Extensions, Applications, and Policy. Johns Hopkins University Press. Baltimore.
Strauss, J. I986. 'The theory and comparative statics of agricultural household models: a general approach'. In Singh et al. (I986).
Taylor, J.E. and Yúnez-Naude, A., 2000. Selectivity and the returns to schooling in a diversified rural economy. American Journal of Agricultural Economics, pp. 287–297.
Wooldridge, J., 2002. Econometric Analysis of Cross Section and Panel Data. Second ed. Cambridge, MA: MIT Press.