The Concentric Square Field: A multivariate test arena for analysis of explorative strategies
14
Behavioural Brain Research 168 (2006) 100–113 Research report The Concentric Square Field: A multivariate test arena for analysis of explorative strategies Bengt J. Meyerson a,∗ , Hanna Augustsson b , Marita Berg a,c , Erika Roman c a Department of Neuroscience, Division of Pharmacology, Box 593,Uppsala University, SE-751 24 Uppsala, Sweden b Department of Animal Environment and Health, Section of Animal Welfare, Swedish University of Agricultural Sciences, Box 7038, SE-750 07 Uppsala, Sweden c Department of Pharmaceutical Biosciences, Division of Pharmacology, Box 591, Uppsala University, SE-751 24 Uppsala, Sweden Received 29 August 2005; received in revised form 21 October 2005; accepted 24 October 2005 Available online 13 December 2005 Abstract In this study, we describe the behavior of laboratory rats in a recently developed observation arena, the Concentric Square Field (CSF). The CSF contains a number of areas designed to provoke exploration and behaviors associated with risk assessment, risk taking and security seeking in an environment not previously experienced. The model includes sheltered, open and elevated areas, a hole board device, areas with different light conditions, and wall-enclosed corridors. The rationale behind the CSF is to meet the demand for multivariate test situations that are not predictive in the sense of previous definition of a specific purpose of measuring a certain mental state. We define multivariate as being a free choice of where to stay in areas of different qualities. In the present study, identification of risky as opposed to safe areas is based on the retrieval behavior in lactating females and hoarding of food pellets in food-deprived males. Furthermore, we describe the effects of pre-trial food deprivation, immobilization, social stress, strain differences (Sprague–Dawley, Wistar and Lister Hooded males), sex differences (Sprague–Dawley) and repeated testing. Besides the conventional statistics, a principal component analysis (PCA) helped to discriminate between the various categories tested. Our conclusion is that the multivariate and non-predictive test situation (CSF) and the use of PCA provide a good tool for ethoexperimental analysis. © 2005 Elsevier B.V. All rights reserved. Keywords: Experimental modeling; Multivariate technique; Ethoexperimental; Social stress; Strain differences; PCA 1. Introduction There is a continuous demand for modifications and inno- vations in test models with experimental animals in behavioral neuroscience. The requirement is relevant behavioral markers in order to gain an improved understanding of mental functions and dysfunctions [7,11,13,16,21,36,45,53,57,58]. There is a need for screening programs for genetically modified animals, for exam- ple, [15,23,55] and an increasing need to elucidate conditions relevant to animal welfare [14,41,43,56]. In the case of marker models, the protocol and the apparatus in which the behavior is observed often have a design that is intended to fulfill the pre- determined objective, i.e. to measure a particular mental state. For screening purposes to assess whether a certain stimulus has a selective influence or whether the response is influenced by a ∗ Corresponding author. Tel.: +46 705951028; fax: +46 18511540. E-mail address: [email protected] (B.J. Meyerson). more general change in perceptive, cognitive or locomotor func- tions, a battery of tests has long been used. Such a battery of tests enables measurement of a variety of dependent and independent variables [12,37–39] in order to obtain a number of converging measures. There has been a long tradition of using a method- ological approach based on ethological perspectives, and this is still being stressed [7,10,16,58]. This means that efforts should be taken to use native forms of behavior and stimuli that can be derived from the natural environment of the species studied. In the present paper, we will discuss a multivariate test model. By multivariate, in this context we mean that the sub- ject has a free choice of different environments contained in the same apparatus and session. Such environments could include open areas, sheltered space, enriched areas to explore, zones of different lightning conditions, both elevated and ground floor regions, etc. The multivariate design does not exclude any of the experimental objectives mentioned above, but provides the extra dimension of offering several alternative activities for the animal to choose between on a free basis. Experimental designs based 0166-4328/$ – see front matter © 2005 Elsevier B.V. All rights reserved. doi:10.1016/j.bbr.2005.10.020
-
Upload
independent -
Category
Documents
-
view
4 -
download
0
Transcript of The Concentric Square Field: A multivariate test arena for analysis of explorative strategies

Behavioural Brain Research 168 (2006) 100–113
Research report
The Concentric Square Field: A multivariate test arena foranalysis of explorative strategies
Bengt J. Meyersona,∗, Hanna Augustssonb, Marita Berga,c, Erika Romanc
a Department of Neuroscience, Division of Pharmacology, Box 593,Uppsala University, SE-751 24 Uppsala, Swedenb Department of Animal Environment and Health, Section of Animal Welfare, Swedish University of Agricultural Sciences,
Box 7038, SE-750 07 Uppsala, Swedenc Department of Pharmaceutical Biosciences, Division of Pharmacology, Box 591, Uppsala University, SE-751 24 Uppsala, Sweden
Received 29 August 2005; received in revised form 21 October 2005; accepted 24 October 2005Available online 13 December 2005
Abstract
In this study, we describe the behavior of laboratory rats in a recently developed observation arena, the Concentric Square Field (CSF). The CSFcontains a number of areas designed to provoke exploration and behaviors associated with risk assessment, risk taking and security seeking in ane ifferent lightc t predictivei e of where tos r in lactatf bilization,s sting. Besit onclusion ist©
K
1
vnodsprmodFa
unc-f testsndent
ngthod-this isldn bed.testub-
n thencludeones ofoor
of theextraimalbased
0d
nvironment not previously experienced. The model includes sheltered, open and elevated areas, a hole board device, areas with donditions, and wall-enclosed corridors. The rationale behind the CSF is to meet the demand for multivariate test situations that are non the sense of previous definition of a specific purpose of measuring a certain mental state. We define multivariate as being a free choictay in areas of different qualities. In the present study, identification of risky as opposed to safe areas is based on the retrieval behavioingemales and hoarding of food pellets in food-deprived males. Furthermore, we describe the effects of pre-trial food deprivation, immoocial stress, strain differences (Sprague–Dawley, Wistar and Lister Hooded males), sex differences (Sprague–Dawley) and repeated tedeshe conventional statistics, a principal component analysis (PCA) helped to discriminate between the various categories tested. Our chat the multivariate and non-predictive test situation (CSF) and the use of PCA provide a good tool for ethoexperimental analysis.
2005 Elsevier B.V. All rights reserved.
eywords: Experimental modeling; Multivariate technique; Ethoexperimental; Social stress; Strain differences; PCA
. Introduction
There is a continuous demand for modifications and inno-ations in test models with experimental animals in behavioraleuroscience. The requirement is relevant behavioral markers inrder to gain an improved understanding of mental functions andysfunctions[7,11,13,16,21,36,45,53,57,58]. There is a need forcreening programs for genetically modified animals, for exam-le, [15,23,55]and an increasing need to elucidate conditionselevant to animal welfare[14,41,43,56]. In the case of markerodels, the protocol and the apparatus in which the behavior isbserved often have a design that is intended to fulfill the pre-etermined objective, i.e. to measure a particular mental state.or screening purposes to assess whether a certain stimulus hasselective influence or whether the response is influenced by a
∗ Corresponding author. Tel.: +46 705951028; fax: +46 18511540.E-mail address: [email protected] (B.J. Meyerson).
more general change in perceptive, cognitive or locomotor ftions, a battery of tests has long been used. Such a battery oenables measurement of a variety of dependent and indepevariables[12,37–39]in order to obtain a number of convergimeasures. There has been a long tradition of using a meological approach based on ethological perspectives, andstill being stressed[7,10,16,58]. This means that efforts shoube taken to use native forms of behavior and stimuli that caderived from the natural environment of the species studie
In the present paper, we will discuss a multivariatemodel. By multivariate, in this context we mean that the sject has a free choice of different environments contained isame apparatus and session. Such environments could iopen areas, sheltered space, enriched areas to explore, zdifferent lightning conditions, both elevated and ground flregions, etc. The multivariate design does not exclude anyexperimental objectives mentioned above, but provides thedimension of offering several alternative activities for the anto choose between on a free basis. Experimental designs
166-4328/$ – see front matter © 2005 Elsevier B.V. All rights reserved.oi:10.1016/j.bbr.2005.10.020

B.J. Meyerson et al. / Behavioural Brain Research 168 (2006) 100–113 101
on this issue are reported[9,42,61]. This should bring the exper-imental setting closer to the natural milieu. As far as laboratoryconditions allow, the various items included in the physical set-ting should be of relevance to what the animal might meet inits natural habitat. Thus, in this paper we describe a behavioralmodel, the Concentric Square Field (CSF), which is referred toas multivariate in accordance with the definition given above.
The explorative strategies of the animal are the basis for thebehavioral repertoire in the CSF model. The design is based on“forced” exploration, i.e. the animal is released directly in thearena[6]. As opposed to voluntary or free exploration when theanimal voluntary enters a novel arena from a familiar home base,this procedure involves inescapable novelty, which may interactwith exploratory motivation and risk assessment behavior.
The explorative strategy is influenced by a risk/benefit assess-ment and subsequent risk acceptance versus risk avoidance[1,9,34,48,52,59]. The performance related to risk is a com-bination of learned and innate mechanisms and environmentalproperties. Explorative strategies and the capability of assess-ing risk should be deeply rooted and conserved in most species.Items that are likely to evoke behavior reflecting risk assessmenthave been incorporated into the design of the CSF.
One of the objectives of the present work is to evaluate theCSF as a multivariate model for experimental studies on explo-rative strategies in an environment that evokes risk performance.Risk performance means exposure to expected danger in order toa ededb ionso ncesT ed te easoa ent rt aineb entai milac ioras andm sesm andt entp itudea tor-e gicaa ethoe uss[
eent itiesr riosi aree d, ah acha
pt tr onale ieso ult
behavior in male rats after early maternal separation[48,49]. Theresearch reported here is a general validation of the CSF methodin order to provide a reference for the method regarding riskversus safety qualities at the different zones of the arena, andthe effects of pre-trial stress, repeated testing, differences basedon phenotype and sex.
2. Materials and methods
2.1. Animals, housing and general procedure
A total of 86 adult rats were used. Sprague–Dawley (SD) males and femalesand male Wistar (WI) rats were purchased from Scanbur (BK AB, Sollentuna,Sweden). Lister Hooded (LIHO) males were obtained from Harlan, London,UK. The numbers of animals used for the experiments (Exp.) were as follows:In Exp. 1, we used seven SD females with their pups and eight SD males. InExp. 2, a total of 38 animals were used. Thirty-two SD males were included inthe experiment and additionally six LIHO males used as resident animals in thesocial stress treatment. In Exp. 3, the eight SD males that did not receive anytreatment in Exp. 2 were repeatedly exposed to the CSF. In Exp. 4, a total of 25male rats (8 SD, 10 WI and 7 LIHO) were used. In Exp. 5, eight SD females wereused. At the time of the experiments, the body weights were: food-deprived SDmales (Exp. 2), 280± 7 g; WI males (Exp. 4), 320± 3 g; SD males and LIHO(Exp. 4) 360± 9 g; SD males (Exp. 3 and 4) 495± 12 g; SD naive females (Exp.5) 340± 5 g. The experiments were conducted during the season from Februaryto June.
The rats were housed in groups of four animals per cage (Techniplast,Makrolon IV, 59 cm× 38 cm× 20 cm) with aspen wood-chip bedding material(Beekay bedding; Scanbur BK AB, Sollentuna, Sweden). Cages were equippedw gm rature-c a1 ess tot stena,S nimalu d. Theh e and,a djacentl withd , aftert beingc essions abora-t nimale rdancew
2
db ntrals ).R cm)l ans oft 0 cmw 8 cm,p ableda A andB ng ad ofC oom,t ning( rancef thec tocelld dips
chieve a certain benefit. Such risk taking is likely to be precy gathering of information about the nature and dimensf the danger during exposure to risk-related circumstahe functionally connected behavioral sequences performxplore the risk are designated risk assessment. It seems rble to assume that the risk assessment and the subsequ
aking or avoidance are balanced by the expected benefit gy the risk performance. Besides the immediate environm
nformation, previous experience of the consequences of sionditions will contribute to the risk assessment. The behavtrategy will also be controlled by the individual’s emotionalotivational mental state. Unexpected events during risk asent/risk taking performance should result in a frustration,
he response to such a stressor is an interesting experimaradigm. It seems obvious that behavior of such magnnd complexity involves many perceptive, cognitive and moxecutive functions and requires a multivariate methodolopproach. The relevance of studying risk assessment inxperimental behavioral research has recently been disc1,8,13,34,48].
A guiding principle in the design of the CSF arena has bo give the animal a choice of locations with various qualegarding shelter, open areas, illumination, challenge of cuty, etc. Accordingly, the study animals had access to a darknclosed by walls and ceiling, a dimly illuminated open fielole board area which required a certain physical effort to rend an elevated zone which was illuminated.
The CSF method has already been applied in an attemelate the localization and extent of brain lesions to functiffects[19,50], in comparative studies of explorative strategf wild and laboratory mice[2,3]and to study effects on the ad
.on-iskdlrl
s-
al
l-
ed
-a
,
o
ith an aspen tunnel (Tapei Oy, width× height: 10 cm× 10 cm) and nestinaterials (paper tissue, Kleenex). The animals were housed in a tempe
ontrolled (22± 1◦C) and humidity-controlled (50± 10%) animal room on2-h reversed light regimen (lights on 21.00–09.00). Animals had free acc
ap water and, if not otherwise stated, food pellets (R36; Lactamin, Vadweden; also used for hoarding in Exp. 1). The animals were kept in the anit for 2–4 weeks and handled for another week before the testing starteandling procedure included daily transfer from the home cage to a tablfter 1–2 min, back to the home cage. The tests were conducted in an a
aboratory with conditions similar to those in the animal housing room, butimmed white light (50 lx). The testing started 3 h, and ended about 7 h
he start of the dark period. The rats were brought to the testing room byarefully taken from the home cage and transferred in a bucket. The test started immediately after the animal had been brought to the adjacent lory. After the testing, the animal was taken back in the same manner. All axperiments were performed under an approved ethical protocol in accoith the Swedish Animal Welfare Legislation.
.2. The Concentric Square Field
The apparatus (Fig. 1) consisted of a square field (72 cm× 72 cm) surroundey an outer wall (25 cm high) and subdivided by inner walls into one cequare arena (CENTRE, 40 cm× 40 cm) and peripheral corridors (width 15 cmecords also involved a circular zone (CENTRAL CIRCLE, diameter 16
ocated centrally in the CENTRE (defined and marked on the screen by mehe Ethovision system). From the CENTRE, openings (CORRIDOR A, 1ide opening, and CORRIDORs B and C, circular openings of diameterlaced 2.5 cm above floor) located in the middle of the surrounding walls enccess to the corridors. One of the corner areas between CORRIDORswas closed off by walls and covered with a PVC lid, thereby providi
ark corner room (DCR, 18 cm× 18 cm). A wall closed off the other endORRIDOR A. In the corner of CORRIDORs B and C was another corner r
he HURDLE (18 cm× 18 cm), to which the animal had access by an opediameter 8 cm) situated 10 cm (entrance from CORRIDOR B) or 8 cm (entrom CORRIDOR C) above the floor. The floor of the HURDLE (6 cm fromorridor floors) contained a hole board (two holes, 2.5 cm diameter) A phoevice (photocell 2) located under the floor allowed recording of head

102 B.J. Meyerson et al. / Behavioural Brain Research 168 (2006) 100–113
Fig. 1. The Concentric Square Field (CSF) arena.
into the holes. A stainless-steel wire mesh construction (15 mm between bars)that bridged over an illuminated opening in the floor (70 cm above the laboratoryfloor) was situated in CORRIDOR D (BRIDGE). The BRIDGE (40 cm× 15 cm)started and ended with a slope ascending at an angle of 45◦ from the arena floor(SLOPE, 15 cm× 15 cm), and was illuminated from below by two spotlights(40 W). The animals only had access to the BRIDGE from CORRIDOR C. Theentrance to the SLOPE was covered by a PVC lid 25 cm above the field floorlevel. Between the SLOPE and BRIDGE areas, there was another photocelldevice (photocell 1). This arrangement provided measurements of the activityon the border of the entrance to the BRIDGE. The floor and walls of the CSFwere made of black PVC (4 mm thick), except for the outer wall of the BRIDGE,which was made of transparent Plexiglas. The approximate light conditions (lx)were as follows: DCR: <1, CENTRE: 30, CORRIDORS: 10–15, BRIDGE:125–190.
When the test started, the animal was lifted from the bucket and placed in theCENTRE close to and facing the wall without an opening (Fig. 1). Recording wasthen started immediately and lasted for 20 min, except when otherwise stated.Between each test, the floor and lower section (about 2/3) of the walls werewiped off with cellulose tissue moistened with dilute ethanol (10%).
2.3. Dependent variables in the CSF
The latency (LAT, s) of first visiting a zone, frequency (FRQ) of visits, dura-tion (DUR, s) of staying in a certain zone, the velocity (cm/s) and distance (cm)within a certain zone were all registered. The various zones were designatedas follows (Fig. 1): CORRIDORs A–C, CENTRE, BRIDGE, HURDLE, DCR,SLOPE and CENTRAL CIRCLE. Measurements of head dips into the holesof the HURDLE, as well as the activity at the SLOPE/BRIDGE border, wereobtained from the two photocell devices. In addition, some measures were con-structed by combining certain variables. All 12 zones together were denoteda OTALA ureo natedC
ssmea sitiono APw Er till inC . Weh IDGEa gatinga e war
2
ed otape( werb
right Soldis, Uppsala, Sweden), the recordings from the two photocell devices(Aros Quality group, Elteknik AB, Uppsala, Sweden) and the processing by theEthovision system (Version 2:3; Noldus Inc., Wageningen, The Netherlands).The Ethovision system was used for recording of velocity, distance and timeresolution. However, due to technical difficulties, the Ethovision system wasnot used for scoring of the LIHO rats (the bodies of the animals were blackand white with no regular pattern); thus, data on velocity and distance were notobtained for the LIHO rats. Ethovision was set at gray scaling with a samplerate of 5 s−1. The DCR and SLOPE were defined as “hidden zones”, i.e. zonesin which the animal was out of sight, and had an entering and leaving thresholdof 5.5 and 1.5 s, respectively. By dividing the total 20-min trial time into four5-min periods, comparisons of time-related performance were obtained.
2.5. Experimental procedure
2.5.1. Establishment of areas associated with risk and safety(Experiment 1)
In designing the CSF apparatus, the assumption – based on a rather exten-sive documentation[25,28,31,35,40]– was that the animal would consider theelevated and illuminated BRIDGE to be an area of risk whereas the DCRhad qualities of safety[22]. In order to establish experimental support forthis assumption, two experiments were conducted. In the first experiment, theretrieval of pups[51] in lactating female SD rats was investigated. The secondexperiment explored the hoarding of food pellets[27,33,60]in food-deprivedmale SD rats.
Seven SD females with 10–13 pups were tested 6–8 days after delivery. Thefemale to be tested was removed from the home cage to the transport bucket.Still in their home cage, the pups were then brought to the adjacent laboratoryand placed on cellulose cotton at the end of the BRIDGE, opposite the entranceslope. The female was placed in the CSF facing the wall without openings. In thee lacede alesw ed off e testl
2ern and
t rats.T isf s( sp sted.
2 iono ior tot
2 ressu eden).T
s TOT ARENA and the sum of visits to these zones was designated TCTIVITY; TOT ARENA and TOTAL ACTIVITY served as a general measf activity. The sum of frequencies of entry to CORRIDORs A–C was desigORRIDOR ENTRIES.
Stretched attend posture (SAP) is a behavior associated with risk assend characterized by the animal elongating the body while retaining the pof the hind legs[6,16,18,20,24]. However, the rats did not perform the Se have seen mice perform in the CSF[1–3]. At the entrance of the SLOP
ats took a posture with the forelegs on the slope while the hind legs sORRIDOR C2, and after some investigating returned to CORRIDOR Cave denoted this as attend activity. In the border area of the SLOPE/BRsimilar behavior was recorded. The animal remained intensely investi
nd later returned from the border area to the SLOPE. This performancecorded by a photocell device (see Section2.4andFig. 1).
.4. Recording
The 12 zones of the observation arena (Fig. 1) constituted the basis for thependent variables, i.e. the animal’s performance. The behavior was videPanasonic BP550 camera, AG-TL 300E VHS recorder). The analysesased on direct observation using the software SCORE (Par Nystrom, Copy-
nt
s
de
xperiment investigating hoarding of food pellets, five food pellets were pither at the end of the BRIDGE (Exp. A) or in the DCR (Exp. B). Five SD mere used for Exp. A and three males for Exp. B. The males were depriv
ood for 48 h before testing. The animal was started on the BRIDGE and thasted for 2 h.
.5.2. Effects of pre-trial treatments (Experiment 2)This experiment was designed to assess the general behavioral patt
he effect of pre-trial treatment on CSF behavioral profiles in naive male SDhe performance of untreated (no treatment, NoT) rats (n = 8) served as a bas
or the assessment of the effects of food deprivation (FD,n = 8), restraint stresRS,n = 8) and social dominance encounter (social stress, SS,n = 8). The stresrocedures were not conducted in the same room where the rats were te
.5.2.1. Food deprivation. For the evaluation of the effects of food deprivatn the behavior in the CSF, the rats were deprived of food for 48 h pr
esting.
.5.2.2. Restraint stress. We also tested the effect of 60 min restraint stsing adjustable transparent plastic tubes (AgnTho’s AB, Stockholm, Swhe size of each tube was adjusted in order to induce immobilization.
B.J. Meyerson et al. / Behavioural Brain Research 168 (2006) 100–113 103
2.5.2.3. Social stress. For the evaluation of social stress on the performance inthe CSF, one SD male was placed in the home cage of three adult LIHO males(residents) for 20 min. Observations were done continuously. Each of the tworesident groups was used four times, with at least 48 h between test occasions.After a number of contacts (range 6–8), the LIHO rats started to threaten theSD male (boxing posture, mounting, sideways threats). After one or two markedattacks from one of the resident males, the SD male adopted a submissive position(lying on its back), and after about 5 min, was chased into one corner of the cagewhere it remained for the remaining part of the 20-min social encounter.
All tests started directly after the respective treatments. The animal wasplaced in the CENTRE zone close to the wall without an opening.
2.5.3. Effects of repeated testing (Experiment 3)The following experiment was designed to explore if the animals acquired a
memory after one trial experience that lasted for a long time. For this purpose,the untreated SD males used in Exp. 2 were exposed to a repeated trial that tookplace 40–45 days after the first trial.
2.5.4. Strain comparisons (Experiment 4)Rats of different strains, or even of the same strain but from different sources,
show differences in behavioral responses[28,29,54]. In this study, we includedmale WI (n = 10), LIHO (n = 7) and SD (n = 8) rats. The rats had no previousexperience of the CSF arena before the testing started.
2.5.5. Female SD rats (Experiment 5)In the last experiment, the behavior of female (n = 8) SD rats in the CSF is
described. Possible sex differences were evaluated by comparison with Exp. 4(SD males). The two experiments were run at different time points. The compar-ison was, however, justified by the similarity in results from Exp. 4 (SD males)and Exp. 2 (the NoT group) indicating that conditions that might influence thep ct andt to ada malew hasei s) ane
2
2
I metrt t hoct ere thK yt ominl onm an rac e CSD n0 or thes
2treat-
m groupw tmenc isting d thap whichv utedt pat-tI xp. 2( s) anE logy,S at
http://www.umetrics.com) was used for the PCA analyses. For further infor-mation about principles and applications concerning PCA/multivariate dataanalysis, see the website and also refs.[26,62].
In what follows, we will discuss three principles in the PCA: the scoreand loading plots, and the possibility to reveal outliers (DModX). The scoreplot offers a survey of the relationships among cases, in this study the behav-ioral profile of individual animals. Individuals that share characteristics in theirresponses to the independent variable come close together in the score plot. If thepositioning of a cluster of cases from one group in a quadrant is different fromanother category and at a distance from the origin, this indicates that the behav-ioral profile of the groups is different. Thus, this information can be used, forexample, to identify strain differences, effects of treatments, or sex differencesin the general behavioral profile.
The loading plot is a means of interpreting the patterns seen in the scoreplot. The two plots are complementary, meaning that a direction in one plotcorresponds to the same direction in the other one. Again, variables contributingsimilar information are grouped together. Here, the variables are the scores ofvisits to the various areas of the CSF. It should be noted that variables that arenegatively correlated appear on diametrically opposite sides of the plot quad-rants.
The Distance to the Model in the X data (DModX) indicates how well anobservation fits the PCA model. In order to fit the PCA model, the DModXvalue should be below 0.05. Observations exceeding this critical distance inDModX do not fit the model well, and appear as outliers in the model. Forfurther information, we refer the reader to ref.[26].
The advantage of this PCA (SIMCA-P) method is that it can both handlemany variables and few observations and also a data matrix with few variablesand many observations. It is aprojection method based on how the variousmeasures foreach individual, not group, form a multi-dimensional space fromwhich the observations of the individuals could be projected onto a plane of twodimensions, which enables data overview and interpretation. The method meanst ationt use.T thatv ces inn
3
3(
upsb xplo-r avingl GE).S oth-e (cal-c 5 s( pupsd , thef ayedi t puph d outw n theD me,b theB
lletsi wn).F alesc ught
erformance in the CSF were kept sufficiently constant over time. This fahe ethical requirement to keep the number of animals low made us notnother simultaneously run group of males. Directly after the test, the feere checked for estrous cyclicity by vaginal smear examination. The p
dentified were diestrus (leucocytes), proestrus (nucleated epithelial cellstrus (cornified epithelial cells).
.6. Statistics
.6.1. Parametric and non-parametric statisticsFirstly, the data were tested for normality by use of the Shapiro–WilksW-test.
f theW-test was significant, non-parametric methods were used. The paraests used were Analysis of Variance (ANOVA) followed by the Tukey posest for significance between groups. The non-parametric tests used wruskal–Wallis one-way analysis of variance followed by Mann–WhitneU-
est. The Fisher exact probability test was used for data measured at a nevel. For related samples, the parametrict-test or the non-parametric Wilcox
atched pairs signed rank test was used. The non-parametric Spearmorrelation was used to explore the correlation between parameters in thifferences were considered to be statistically significant atp-values less tha.05. The Statistica 7.0 software (StatSoft Inc., Tulsa, OK) was used ftatistical analyses.
.6.2. The principal component analysis (PCA)Besides a traditional calculation of significant differences between
ents, our ambition was to understand the characteristic features of thehen subjected to the various treatments. In other words, did the trealassify the groups in such a way that a behavior strategy could be duished (i.e. pattern recognition)? In addition, we also wanted a methorovides information about the relationships between the variables, i.e.ariables contributed similar information, and also which variables contribo the information about pattern. With this in view, we chose to use aern recognition-based approach, the principal component analysis[26,62].n the current study, a PCA analysis was performed on data from Euntreated rats versus socially stressed rats), Exp. 4 (strain comparisonxp. 5 (sex differences). The Soft Independent Modeling of Class AnaIMCA-P+ Version 10.02 software (Umetrics, Umea, Sweden; see website
dssd
ic
e
al
nkF.
st
-t
d
o estimate how the individual locates in this two-dimensional plane in relo origin of coordinates. The ratio subjects/variable is not limiting for thehis PCA method also includes “scaling” and “mean-centering” to facilitateariables are given the same weight which eliminates inter alias differenumerical ranges.
. Results
.1. Establishment of areas associated with risk and safetyExperiment 1)
The first part of this experiment involved the retrieval of py lactating females (data not shown). After some general eation lasting about a minute, the females showed signs of hocated the pups (reared against the wall facing the BRIDome females immediately entered the BRIDGE, whereasrs continued to visit other areas of the CSF. The latencyulated from the beginning of the trial) of first retrieval was 8median value; range 55–345 s). All the females carried theirectly to the DCR area. When all pups had been collected
emales returned to the BRIDGE once or twice and then stn the DCR. The session was ended 5 min after the lasad been retrieved. An analogous experiment was carrieith another two females, but now the pups were placed iCR instead. The initial explorative activity was about the saut no retrieval occurred. The difference in retrieving fromRIDGE versus DCR was statistically significant (p = 0.048).In the second part of this experiment, hoarding of food pe
n food-deprived male SD rats was investigated (data not shoirstly, five food pellets were placed on the bridge. Three married all pellets to the DCR, while the two other males bro
104 B.J. Meyerson et al. / Behavioural Brain Research 168 (2006) 100–113
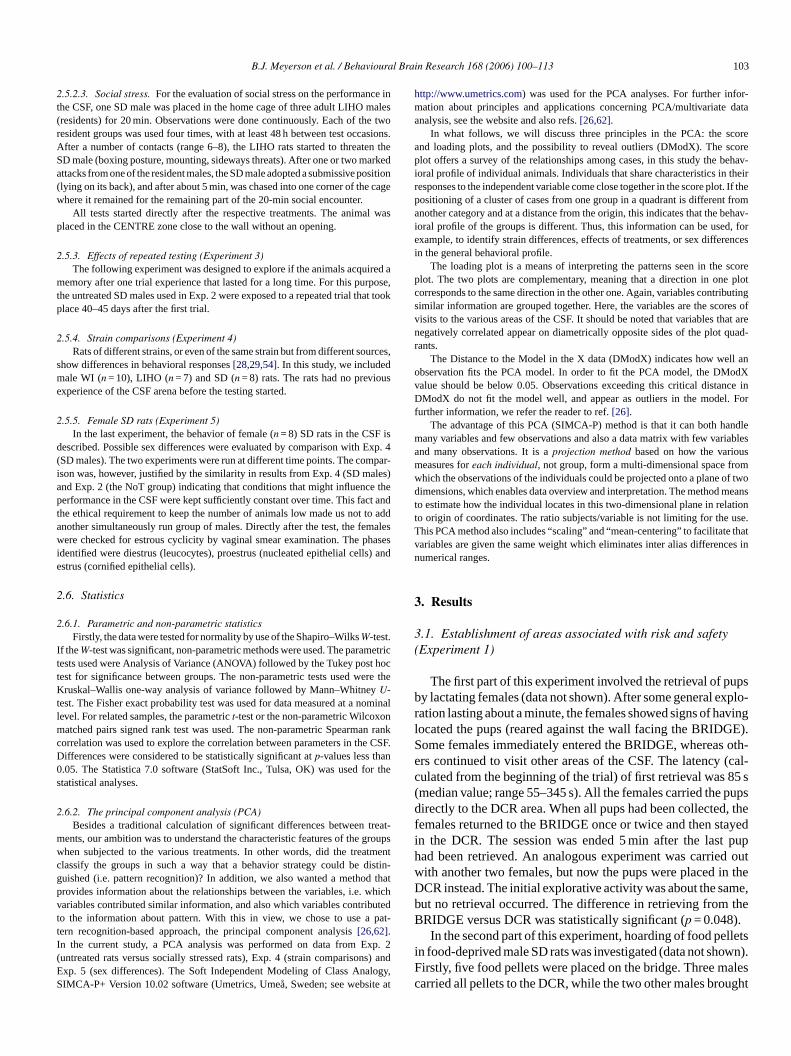
Fig. 2. The distribution of visits to the various zones of the CSF in (a) male SDand (b) female SD rats.
only three pellets to the DCR. Secondly, the food pellets wereplaced in the DCR instead. No animal moved the pellets fromthe DCR. In both situations (when the pellets were placed on theBRIDGE and when they were placed in the DCR) the animalsconsumed some of the pellets in the DCR, but no consumption offood pellets took place on the BRIDGE. The differences in foodpellets hoarding from the BRIDGE versus DCR was statisticallysignificant (p = 0.02).
Throughout the present investigation, we noticed that whenthe test was finished and the animal was to be captured, it raninto the DCR, if located elsewhere in the CSF, indicating that theDCR possessed qualities of safety compared to the other zones.
In summary: Taken together, these results are the reason forconsidering the BRIDGE to be an area that the animals associ-ated with risk. Relative to the BRIDGE, the DCR was an areathe animals associated with safety.
3.2. The normal pattern and effects of pre-trial treatments(Experiment 2)
3.2.1. The behavior in untreated male SD ratsThe distribution of duration of visits in the CSF during a
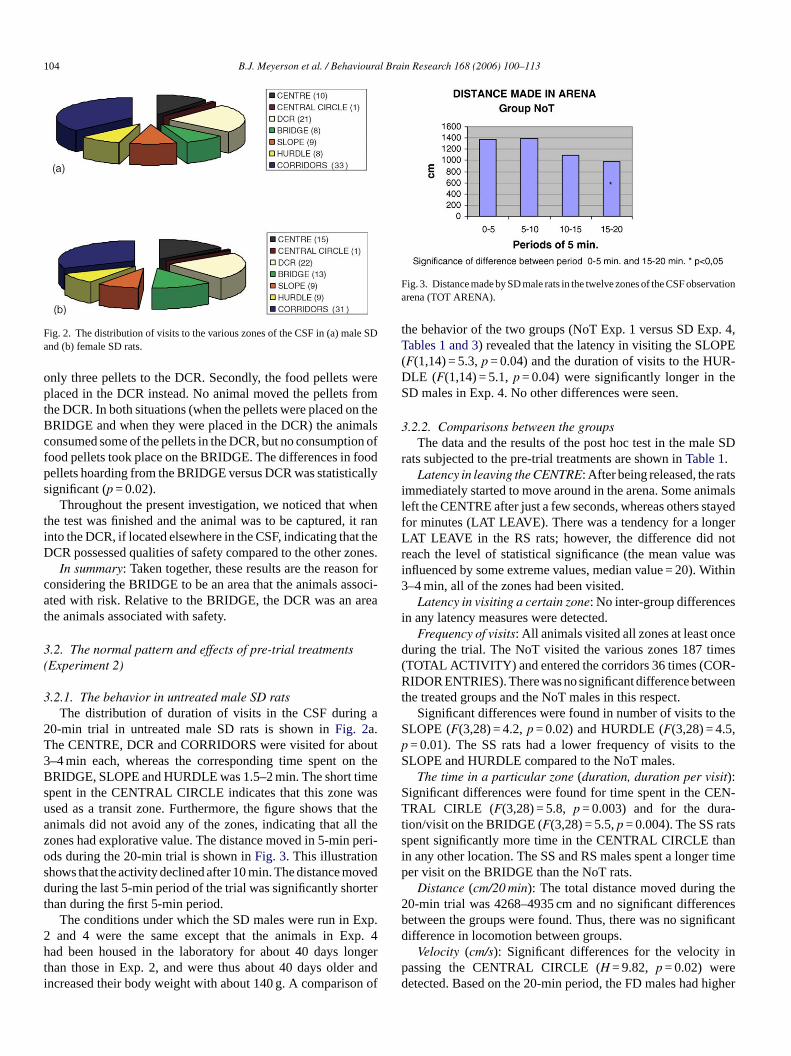
20-min trial in untreated male SD rats is shown inFig. 2a.The CENTRE, DCR and CORRIDORS were visited for about3–4 min each, whereas the corresponding time spent on thB imes wasu at tha l thez perios ovedd rtert
xp.2 p. 4h nget r ani n of
Fig. 3. Distance made by SD male rats in the twelve zones of the CSF observationarena (TOT ARENA).
the behavior of the two groups (NoT Exp. 1 versus SD Exp. 4,Tables 1 and 3) revealed that the latency in visiting the SLOPE(F(1,14) = 5.3,p = 0.04) and the duration of visits to the HUR-DLE (F(1,14) = 5.1,p = 0.04) were significantly longer in theSD males in Exp. 4. No other differences were seen.
3.2.2. Comparisons between the groupsThe data and the results of the post hoc test in the male SD
rats subjected to the pre-trial treatments are shown inTable 1.Latency in leaving the CENTRE: After being released, the rats
immediately started to move around in the arena. Some animalsleft the CENTRE after just a few seconds, whereas others stayedfor minutes (LAT LEAVE). There was a tendency for a longerLAT LEAVE in the RS rats; however, the difference did notreach the level of statistical significance (the mean value wasinfluenced by some extreme values, median value = 20). Within3–4 min, all of the zones had been visited.
Latency in visiting a certain zone: No inter-group differencesin any latency measures were detected.
Frequency of visits: All animals visited all zones at least onceduring the trial. The NoT visited the various zones 187 times(TOTAL ACTIVITY) and entered the corridors 36 times (COR-RIDOR ENTRIES). There was no significant difference betweenthe treated groups and the NoT males in this respect.
Significant differences were found in number of visits to theS ,p theS
S EN-T -t tss ani r timep
he2 cesb ficantd
inpd igher
RIDGE, SLOPE and HURDLE was 1.5–2 min. The short tpent in the CENTRAL CIRCLE indicates that this zonesed as a transit zone. Furthermore, the figure shows thnimals did not avoid any of the zones, indicating that alones had explorative value. The distance moved in 5-minds during the 20-min trial is shown inFig. 3. This illustrationhows that the activity declined after 10 min. The distance muring the last 5-min period of the trial was significantly sho
han during the first 5-min period.The conditions under which the SD males were run in Eand 4 were the same except that the animals in Ex
ad been housed in the laboratory for about 40 days lohan those in Exp. 2, and were thus about 40 days oldencreased their body weight with about 140 g. A compariso
e
e
-
rd
LOPE (F(3,28) = 4.2,p = 0.02) and HURDLE (F(3,28) = 4.5= 0.01). The SS rats had a lower frequency of visits toLOPE and HURDLE compared to the NoT males.
The time in a particular zone (duration, duration per visit):ignificant differences were found for time spent in the CRAL CIRLE (F(3,28) = 5.8, p = 0.003) and for the dura
ion/visit on the BRIDGE (F(3,28) = 5.5,p = 0.004). The SS rapent significantly more time in the CENTRAL CIRCLE thn any other location. The SS and RS males spent a longeer visit on the BRIDGE than the NoT rats.
Distance (cm/20 min): The total distance moved during t0-min trial was 4268–4935 cm and no significant differenetween the groups were found. Thus, there was no signiifference in locomotion between groups.
Velocity (cm/s): Significant differences for the velocityassing the CENTRAL CIRCLE (H = 9.82, p = 0.02) wereetected. Based on the 20-min period, the FD males had h

B.J. Meyerson et al. / Behavioural Brain Research 168 (2006) 100–113 105
Table 1Results from the CSF: effects of various pre-trial treatments and repeated testing
Parameters Experiment 2 Experiment 3
No treatment, CONTROLS Food deprived Restraint stressed Socially stressed Repeated testing
LAT LEAVE 7 ± 1 13 ± 3 67 ± 35 14± 2 5 ± 0.5LAT CENTRAL CIRCLE 215± 61 179± 53 177± 63 270± 54 71± 28*
LAT DCR 111 ± 45 66± 33 147± 63 124± 30 82± 22LAT BRIDGE 192 ± 81 187± 26 285± 66 340± 82 209± 78LAT SLOPE 89± 33 117± 34 207± 72 170± 45 177± 75LAT HURDLE 146 ± 50 176± 29 168± 44 228± 36 147± 73TOTAL ACTIVITY 187 ± 19 163± 10 178± 15 168± 12 142± 21*
CORRIDOR ENTRIES 36± 4 29 ± 2 36 ± 3 30 ± 2 29 ± 6FRQ CENTRE 33± 4 30 ± 3 41 ± 5 37 ± 3 35 ± 5.7FRQ CENTRAL CIRCLE 9± 2 8 ± 1 15 ± 3 13 ± 2 13 ± 2FRQ DCR 13± 2 10 ± 1 8 ± 1 11 ± 1 7 ± 1**
FRQ BRIDGE 5± 1 5 ± 0.6 4± 0.4 3± 0.5 3± 0.5*
FRQ SLOPE 12± 1 10 ± 1 10 ± 1 7 ± 0.9** 6 ± 1***
FRQHURDLE 6± 1 5 ± 0.6 6± 0.7 4± 0.5* ,# 3 ± 0.9**
DUR CENTRE 222± 26 177± 18 260± 34§ 219 ± 20 171± 25DUR CENTRAL CIRCLE 9± 2 7 ± 1 9 ± 2 18 ± 3* ,#,§§ 13 ± 3DUR DCR 248± 48 272± 23 144± 26 216± 43 283± 110DUR BRIDGE 89± 18 100± 13 126± 10 106± 19 115± 38DUR SLOPE 110± 21 98± 12 103± 15 88± 12 100± 27DUR HURDLE 96± 8 94 ± 22 113± 8 72 ± 16 67± 18DUR CORRIDORS 385± 19 364± 16 367± 18 405± 39 310± 52AA CORRIDOR C/SLOPE 7± 1 6 ± 1 7 ± 1 8 ± 1 7 ± 1PHOTOCELL 1, AA 42± 2 34 ± 3 54 ± 35 41± 3 43 ± 8PHOTOCELL 2 12± 7 9 ± 2 14 ± 5 8 ± 10 5 ± 2DUR/VISIT DCR 24± 19 30± 10 17± 15 20± 12 42± 15DUR/VISIT BRIDGE 19± 8 23 ± 5 31 ± 2* 34 ± 4** 45 ± 14
DISTANCE TOT ARENA (cm)0–20a 4935± 339 4268± 225 4673± 321 4935± 339 3638± 420*
0–5a 1072± 178 1263± 82 1097± 157 1188± 94 1239± 18115–20a 679 ± 162 964± 42 1039± 75 875± 107 553± 106*
VELOCITY CENTRAL CIRCLE (cm/s)0–20a 19 ± 7 25 ± 9 16 ± 6 13 ± 5 27 ± 110–5a 28 ± 6 21 ± 3 14 ± 2 19 ± 6 24 ± 315–20a 18 ± 5 30 ± 3 22 ± 4 14 ± 4 31 ± 11
FRQ CENTRAL CIRCLE0–5a 2 ± 1 2 ± 1 3 ± 1 1 ± 0.5 4± 115–20a 4 ± 1 2 ± 0.3 4± 1 3 ± 1 2 ± 1
Data are presented as mean± S.E. Latency and duration are given in s. AA = attend activity (see Section2).a Time period (min).* p < 0.05 compared to no treatment.# p < 0.05 compared to restraint stressed.§ p < 0.05 compared to food deprived.
** p < 0.01 compared to no treatment.§§ p < 0.01 compared to food deprived.
*** p < 0.001 compared to no treatment.
velocity than the RS and SS rats, but did not differ from the NoTanimals. No significant differences were detected during the firstand last 5-min intervals of the trial.
Attend activity: No significant differences were seen.PCA analysis: A PCA analysis was performed for the SS and
NoT rats (Fig. 4). The score plot (Fig. 4a) demonstrates that theSS rats clearly differ from the NoT males. The SS are distributedin or closer to the upper-left quadrant than the NoT rats, whichare mainly found in the two lower quadrants.
The corresponding loading plot is shown inFig. 4b. Theduration in the CENTRAL CIRCLE (DCTRCI), latency in leav-
ing the CENTRE (LLEAVE), latency in entering the HURDLE(LHURDLE), and the length of time per visit on the BRIDGE(D/FBRIDGE) contributed to distinguishing the SS males fromthe NoT animals. The number of visits to the HURDLE (FHRD),SLOPE (FSLOPE) and BRIDGE (FBRG) were less in the NoTgroup, which also contributed to the differentiation of the groups.As shown inTable 1, the average response for these variableswas less in the NoT group than in the SS group.
Correlation: The Spearman rank correlation coefficients andp-values for the NoT and SS groups are shown inTable 2.The number of visits to the HURDLE, BRIDGE and the

106 B.J. Meyerson et al. / Behavioural Brain Research 168 (2006) 100–113
Fig. 4. PCA charts showing (a) score plot and (b) loading plot for male Sprague–Dawley rats socially stressed (SS) vs. not treated (NoT).
DCR by the NoT males are all related, except for the rela-tion HURDLE–BRIDGE. In contrast, none of these associationswere significant in the SS group. The associations betweenthe duration measurements were not significant, except forBRIDGE/CTRCI in the SS group. The latency in visiting theBRIDGE and CTRCI was associated with the HURDLE in theNoT group; however, no corresponding correlation was foundin the SS group.
TOTAL ACTIVITY and number of visits to the SLOPE cor-related to the photocell I records (the attend activity at the borderSLOPE/BRIDGE) (−0.75, p = 0.03; 0.88,p = 0.004, respec-
tively). A significant correlation was also found between attendactivity at the border of CORRIDOR C/SLOPE and TOTALACTIVITY (0.84, p = 0.01), number of visits to CENTRALCIRCLE (0.89,p = 0.003) and the DCR (0.78,p = 0.02).
In summary: The total distance moved was constant duringthe first 10 min, and then declined by about 30% during the fol-lowing 10 min (Fig. 3), indicating less activity over time, whichwas probably due to habituation to the test arena. The generalactivity (DISTANCE TOT ARENA, TOTAL ACTIVITY) wasnot altered by the treatments. Most of the time (about 70%) wasspent in the DCR, the CORRIDORS and the CENTRE zones
Table 2Correlation between CSF parameters in not treated and socially stressed male SD rats
Not treated Socially stressed
HURDLE BRIDGE DCR TOTACT HURDLE BRIDGE DCR TOTACT
FRQHURDLE 0.86** 0.31BRIDGE 0.66 0.72* 0.06 0.46DCR 0.78* 0.71* 0.92*** 0.64 0.21 0.87**
CTRCI 0.82* 0.73* 0.84** 0.97*** 0.02 −0.22 0.44 0.56
DURHURDLE 0.64BRIDGE 0.47 0.69 −0.04DCR −0.48 −0.59 0.64 −0.04
L
DS
*
CTRCI 0.41 −0.49
ATHURDLEBRIDGE 0.97***
DCR 0.57 0.07CTRCI 0.71* 0.67 0.24
ata are presented as Spearman rank correlation coefficient.ignificances:* p < 0.05.
** p < 0.001.** p < 0.001.
0.02 −0.83** 0.04
0.14−0.02 0.42−0.14 0.09 0.4

B.J. Meyerson et al. / Behavioural Brain Research 168 (2006) 100–113 107
(Fig. 2a). No differences between the four treatment categorieswere found in these parameters. The explorative motive (visitsto HURDLE, SLOPE) was reduced by social stress. In contrast,the SS rats spent longer time in the CENTRAL CIRCLE and alonger time per visit on the BRIDGE, i.e. stayed longer in anopen area than the NoT males.
3.3. Effects of repeated testing (Experiment 3)
The results of a repeated trial, 40–45 days after the firsttrial in the NoT SD males, are given inTable 1. The mostobvious differences were in the latency in visiting the CEN-
TRAL CIRCLE and in the number of visits to almost all zones.In trial 2, the activity was significantly lower than in trial 1.This was also seen in the total distance moved, mainly dueto a decline in activity during the last 5 min of the secondtrial.
3.4. Strain differences (Experiment 4)
The data are given inTable 3.Latency in leaving the CENTRE: All groups of animals left
the CENTRE within 30 s (LAT LEAVE). No inter-strain differ-ences were seen.
Table 3Results from the Concentric Square Field: strain and sex differences
Parameters Males Females
SD WI LIHO SD
LAT LEAVE 10 ± 3 24 ± 11 11± 2 5 ± 1*
LAT CENTRAL CIRCLE 169± 68 425± 77** ,# 182 ± 59 126± 47LAT DCR 58 ± 25 232± 70 129± 56 40± 16LAT BRIDGE 343 ± 111 318± 93 282± 95 274± 70LAT SLOPE 253± 68 245± 81 250± 94 278± 46LAT HURDLE 184 ± 77 287± 80 78± 26 67± 20TOTAL ACTIVITY 171 ± 20 127± 14## 220 ± 16 157± 7CORRIDOR ENTRIES 33± 4 20 ± 3* ,### 47 ± 3* 13 ± 1**
F * ,###
FFFFFDDDDDAPPDD
D
V
F
D
*
#
RQ CENTRE 37± 4RQ CENTRAL CIRCLE 11± 2RQ DCR 11± 1RQ BRIDGE 4± 1RQ SLOPE 9± 1RQHURDLE 6± 1UR CENTRAL CIRCLE 8± 1UR DCR 277± 84UR BRIDGE 111± 26UR SLOPE 150± 30UR HURDLE 76± 6A CORRIDOR C/SLOPE 8± 2HOTOCELL 1, AA 47± 8HOTOCELL 2 8± 2
UR/VISIT DCR 36± 18UR/VISIT BRIDGE 28± 4ISTANCE TOT ARENA (cm)0–20b 4585± 3350–5b 1236± 20315–20b 835 ± 157
ELOCITY CENTRAL CIRCLE (cm/s)0–20b 25 ± 30–5b 22 ± 415–20b 29 ± 6
RQ CENTRAL CIRCLE0–5b 5 ± 115–20b 2 ± 0.4
ata are presented as mean± S.E. Latency and duration presented as s. AA = ata Only four animals visited the zone.b Time period (min).* p < 0.05 compared to SD.# p < 0.05 compared to LIHO.
** p < 0.01 compared to SD.## p < 0.01 compared to LIHO.** p < 0.001 compared to SD.## p < 0.001 compared to LIHO.
22 ± 3 44 ± 7 35 ± 1.47 ± 2 12 ± 3 11 ± 1.4
10 ± 1 14 ± 2 9 ± 0.33 ± 0.6 5± 1 4 ± 0.76 ± 2 10 ± 1 8 ± 1.44 ± 1 7 ± 1 6 ± 0.57 ± 2 8 ± 2 13 ± 5
334± 70# 151 ± 28* 255 ± 2977± 19 111± 17 143± 0.789± 18 97± 13 104± 2088 ± 14 114± 22 100± 9*
5 ± 1 7 ± 1 13 ± 237 ± 9 43 ± 6 31 ± 79 ± 1 6 ± 2 8 ± 2
### **
45± 19 10 ± 1 29 ± 332 ± 6 24 ± 4 38 ± 42900± 238*** 4257± 153719± 74* 1310± 110683± 114 922± 99
14 ± 3* 17 ± 2.7*
13 ± 3a 15 ± 2.6*
14 ± 3* 18 ± 2.6
1 ± 0.5** 7 ± 1.23± 0.7 5± 1
tend activity (see Section2).
108 B.J. Meyerson et al. / Behavioural Brain Research 168 (2006) 100–113
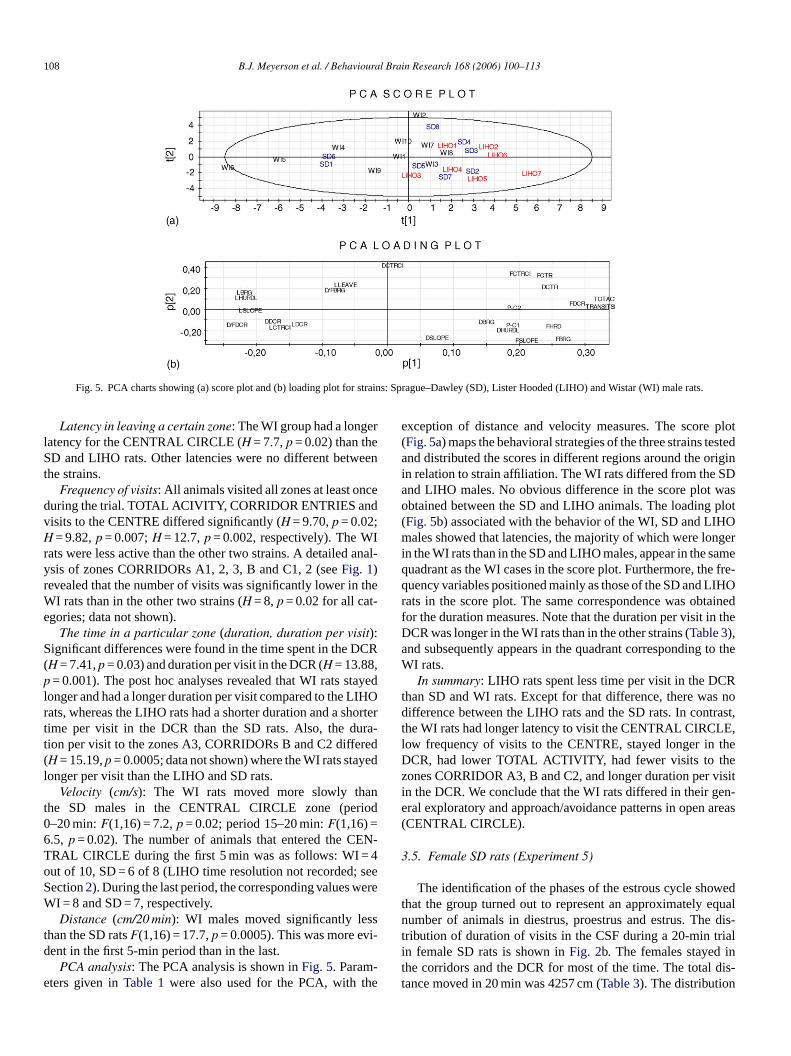
Fig. 5. PCA charts showing (a) score plot and (b) loading plot for strains: Sprague–Dawley (SD), Lister Hooded (LIHO) and Wistar (WI) male rats.
Latency in leaving a certain zone: The WI group had a longerlatency for the CENTRAL CIRCLE (H = 7.7,p = 0.02) than theSD and LIHO rats. Other latencies were no different betweenthe strains.
Frequency of visits: All animals visited all zones at least onceduring the trial. TOTAL ACIVITY, CORRIDOR ENTRIES andvisits to the CENTRE differed significantly (H = 9.70,p = 0.02;H = 9.82,p = 0.007;H = 12.7,p = 0.002, respectively). The WIrats were less active than the other two strains. A detailed anal-ysis of zones CORRIDORs A1, 2, 3, B and C1, 2 (seeFig. 1)revealed that the number of visits was significantly lower in theWI rats than in the other two strains (H = 8, p = 0.02 for all cat-egories; data not shown).
The time in a particular zone (duration, duration per visit):Significant differences were found in the time spent in the DCR(H = 7.41,p = 0.03) and duration per visit in the DCR (H = 13.88,p = 0.001). The post hoc analyses revealed that WI rats stayedlonger and had a longer duration per visit compared to the LIHOrats, whereas the LIHO rats had a shorter duration and a shortertime per visit in the DCR than the SD rats. Also, the dura-tion per visit to the zones A3, CORRIDORs B and C2 differed(H = 15.19,p = 0.0005; data not shown) where the WI rats stayedlonger per visit than the LIHO and SD rats.
Velocity (cm/s): The WI rats moved more slowly thanthe SD males in the CENTRAL CIRCLE zone (period0–20 min:F(1,16) = 7.2,p = 0.02; period 15–20 min:F(1,16) =6 EN-T 4o seeS ereW
sst i-d
-e he
exception of distance and velocity measures. The score plot(Fig. 5a) maps the behavioral strategies of the three strains testedand distributed the scores in different regions around the originin relation to strain affiliation. The WI rats differed from the SDand LIHO males. No obvious difference in the score plot wasobtained between the SD and LIHO animals. The loading plot(Fig. 5b) associated with the behavior of the WI, SD and LIHOmales showed that latencies, the majority of which were longerin the WI rats than in the SD and LIHO males, appear in the samequadrant as the WI cases in the score plot. Furthermore, the fre-quency variables positioned mainly as those of the SD and LIHOrats in the score plot. The same correspondence was obtainedfor the duration measures. Note that the duration per visit in theDCR was longer in the WI rats than in the other strains (Table 3),and subsequently appears in the quadrant corresponding to theWI rats.
In summary: LIHO rats spent less time per visit in the DCRthan SD and WI rats. Except for that difference, there was nodifference between the LIHO rats and the SD rats. In contrast,the WI rats had longer latency to visit the CENTRAL CIRCLE,low frequency of visits to the CENTRE, stayed longer in theDCR, had lower TOTAL ACTIVITY, had fewer visits to thezones CORRIDOR A3, B and C2, and longer duration per visitin the DCR. We conclude that the WI rats differed in their gen-eral exploratory and approach/avoidance patterns in open areas(CENTRAL CIRCLE).
3
wedt equaln dis-t iali int dis-t
.5, p = 0.02). The number of animals that entered the CRAL CIRCLE during the first 5 min was as follows: WI =ut of 10, SD = 6 of 8 (LIHO time resolution not recorded;ection2). During the last period, the corresponding values wI = 8 and SD = 7, respectively.Distance (cm/20 min): WI males moved significantly le
han the SD ratsF(1,16) = 17.7,p = 0.0005). This was more event in the first 5-min period than in the last.
PCA analysis: The PCA analysis is shown inFig. 5. Paramters given inTable 1were also used for the PCA, with t
.5. Female SD rats (Experiment 5)
The identification of the phases of the estrous cycle shohat the group turned out to represent an approximatelyumber of animals in diestrus, proestrus and estrus. The
ribution of duration of visits in the CSF during a 20-min trn female SD rats is shown inFig. 2b. The females stayedhe corridors and the DCR for most of the time. The totalance moved in 20 min was 4257 cm (Table 3). The distribution

B.J. Meyerson et al. / Behavioural Brain Research 168 (2006) 100–113 109
Fig. 6. PCA charts showing (a) score plot and (b) loading plot for female (HO) and male (HA) Sprague–Dawley rats.
of time in the various zones, as well as the distance covered,showed striking similarities to that of the males. The femalesmoved somewhat more slowly when passing the CENTRALCIRCLE than the males (U = 11,p < 0.03) and had fewer COR-RIDOR ENTRIES (U = 5.5,p < 0.005) than the SD males. Therewas no difference in the time spent in the CORRIDORS, andconsequently the duration per visit was longer in the females(U = 4.0, p < 0.003). The latency to leave the CENTRE wasshorter (U = 12.0,p < 0.04) in the female rats, and they stayedlonger in the HURDLE (F(1,4) = 5.8,p = 0.03) than the SDmales.
PCA analysis: The score plot (Fig. 6a) describes how thefemale and male SD rats relate regarding their performance.The scores of both the females and males were distributed overall quadrants. Females were, however, distributed closer to theorigin than males, which were more scattered. Moreover, theloading plot inFig. 6b showed a distribution over all four quad-rants for the behaviors that influenced the score plot.
4. Discussion
Natural selection and sexual selection form the basis ofdiversity between species, including behavioral strategies. How-ever, there may also be some conformity regarding the partic-ular central nervous mechanisms that are essential for survival.A cons rs. Ao ividu ts toe voida ht ba emt essi ehint
viorI tal
paradigms in order to understand how intrinsic mechanismsand environmental factors are integrated into the establish-ment of a mental state. This problem is even greater whenit comes to animal modeling of emotional states experiencedby humans. In his classical textbook, Hinde[30] suggests thatbehavioral analysis should be initiated by a description of thebehavioral repertoire, i.e. its ethogram, which could then befollowed by classification of behaviors into their functionalcontext. After that, an evaluation could possibly be done con-cerning mental conditions, such as fear, anxiety, panic disposi-tion, motivational states, specific cognitive abilities, etc. Thisstrategy is still well-founded. In what follows, we will con-centrate on the various ethograms that emerged on the basis oftreatments and phenotypes (strain, sex) using the CSF. Geneticstrain differences and handling conditions contribute to vari-ance [17,47]. The present evaluation of the CSF method isbased on whether or not the design and protocol will permita separation of the behavioral profile for animals exposed tocertain pre-experimental stimuli or that have different geneticbackgrounds.
4.1. The CSF method and the multivariate andethoexperimental concepts
The CSF method is not coupled to the ambition of measuringa previously specified mental state or function. In that sense,t aseda wast nabler turalc Suche , andtT . Thea . Thea of thea beenc
ssuming that this is true, such mechanisms should beerved and consequently universal over the species bordevert expression of such processes would be how the indal behaves in meeting with a new environment, its efforxplore, assessment of risk and subsequent risk taking or ance. From observing the explorative strategies, we migble to proceed to analyze mental characteristics, such as
ional reactivity, susceptibility to fear and panic, impulsivenn decision taking, and so on. This has been the rationale bhe establishment of the CSF construct.
It is one thing to observe, record and describe behat is exceedingly more difficult to find relevant experimen
-n
-
-eo-
d
.
he method is qualified to create opportunities for an unbinalysis. The starting point for the design of the apparatus
hat the various qualities of the areas in the CSF should eecording of the animal’s exploration strategy. Under naonditions, the rat makes excursions from a home base.xcursions are characterized by becoming further afieldhe outward trips are slow while returns are more rapid[4,5].he CSF was not designed with a specific home/start boxnimal was transferred to – and placed in – an open arenanimal then had to find a safe area and the characteristicsnimal staying in that space, relative to other areas, haveonsidered to be an important parameter.

110 B.J. Meyerson et al. / Behavioural Brain Research 168 (2006) 100–113
The criterion of multivariate methodology is met by the freechoice to visit areas with different qualities. Certain require-ments influenced the design of the CSF. The experimental envi-ronment should contain: (i) areas of shelter and also open areas,(ii) different lighting conditions, (iii) enrichments for explo-ration and intense investigation and (iv) elevated and ground-floor regions. The free choice of where the animal wanted tospend time was also important, and no instrumental or restrain-ing measures were taken.
4.2. The risk versus safety qualities of the different CSFareas (Experiment 1)
It seemed well-founded that lactating females would retrievethe pups from a risky area to an area they considered as beingsafer[51]. We predicted that the most evident contrast in thisrespect would be between the BRIDGE and the DCR areas.It is well known that rodents tend to avoid open, elevatedareas—as often seen in tests, such as the elevated plus-maze test[21,23,29,30,34,38]. That the BRIDGE was considered riskyand the DCR was considered a secure area was well confirmedby the retrieval behavior of the females. By analogy, the results ofthe hoarding of food pellets in food-deprived males gave furthersupport to the BRIDGE being a risk area and the DCR providingshelter. We did not analyze the relationship between other areas.The reaction to the CENTRAL CIRCLE, i.e. comparatively longl imestC iskyW traio haveb
4
EN-T mosc nifi-c ringt ersa in.F s oft osto RE.T ivityT nd,i eloi
4
asea andd Thise n 5-m trial1
during the 15–20-min period). The CENTRAL CIRCLE wasvisited significantly earlier in the second trial, indicating thatexperience of the CSF shortened the approach to the centre ofthe open area.
Did the factor of age (+40 days) and the gain in body weightduring this time contribute to the significant effects achievedby repeating the trial (Exp. 2 versus Exp. 3)? That is not likelyconsidering that the SD males in Exp. 4 also were about 40days older and heavier than the SD males in Exp. 2 and did notdiffer in the measures that distinguished data in the repeated trialexperiment (Exp. 2 versus Exp. 3).
4.5. The effects of food deprivation, restraint and socialstress
A 48-h period of food deprivation did not result in anydetectable effects on behavior in the CSF. It was expected thatan appetite-related motivation would be manifest as increasedactivity, exploration and possibly altered risk taking behavior. Inspite of a 23% reduction in body weight, the 48 h without accessto food may not have been efficient in inducing an increasedmotivation to seek food. The fact that the SD male rats have atendency to become rather well-nourished on the standard lab-oratory diet may have contributed to this result.
The physical restraint caused only an increased duration pervisit on the BRIDGE. The RS animals shared this behavior pat-t ucedt penti perv LEi ively.A IR-C areas.T tivitya spenti ani terede atione een int ments iations el-f thant ndern re bea tube.
4were
d . Thel or-r lsoi rast,t lated,i gicalp in-b dence
atency, short duration and a velocity (cm/s) about three that of the adjacent area (CENTRE 5± 0.4; CENTRAL CIR-LE 19± 7) indicated that this zone was also regarded as re cannot at present generalize these observations to s
ther than the SD strain of rat; however, similar resultseen obtained in mice[2,3].
.3. General behavioral profile in NoT male SD rats
After being transferred to the CSF, the animals left the CRE rather directly and moved around in the arena alontinuously during the trial. However, they moved a sigantly longer distance during the first 5-min period than duhe last 5-min period. The duration of the trial (20 min) covn initial period of activity, with a decline after about 10 mrom the distribution of the time spent in the various zone
he CSF (Fig. 2), it appears that all areas were visited and mf the time was spent in the CORRIDORs, DCR and CENThese environments apparently provoked explorative acthe CENTRAL CIRCLE was visited after about 3–4 min a
n the untreated condition, this zone was just passed (see Vty).
.4. Repeated testing (Experiment 3)
Repeated exposure to the CSF caused a general decrectivity in terms of frequency of visits to the various zonesistance moved in the arena compared to the first trial.ffect was noted 40–45 days after the first trial. The split iin periods revealed that the difference in locomotion fromwas more evident at the end of the session (Table 1, distance
.ns
t
.
c-
in
ern with the SS males. A 20-min period of social stress redhe visits to the SLOPE and HURDLE, increased the time sn the CENTRAL CIRCLE zone, and increased the durationisit on the BRIDGE. The visits to the SLOPE and HURDndicate risk assessment and exploratory activity, respects we discussed above, the BRIDGE and the CENTRAL CLE are experienced as being risky compared to the otherhis indicated that the SS males showed less explorative acnd risk assessment and by the significant increase in time
n the CENTRAL CIRCLE and per visit on the BRIDGE,ncrease in risk taking. Taken together, this indicates an alxplorative strategy and risk taking approach. The correlvident between the scores of visits to the various zones she NoT group was not obtained in the SS group. The treateems to have completely deranged the very clear assoceen in the NoT males. It is worth noting in terms of animal ware that 60 min of restraint caused less detectable effectshe 20 min of social stress. With regard to how rats live uatural conditions, a social unavoidable stress may therefomore serious stress factor than a restraint in a cylindrical
.5.1. Relationship between parameters (zones)As expected, the numbers of visits to various zones
riven by a common factor, presumably the urge to exploreatency in visiting the BRIDGE had a very strong positive celation with the latency in visiting the HURDLE, which andicates the importance of explorative motivation. In conthe time spent in the various zones appears not to be corre.e. to have a reciprocal relationship. From a methodolooint of view, this indicates that there were sufficient timeetween bouts of visits to essential zones to permit indepen

B.J. Meyerson et al. / Behavioural Brain Research 168 (2006) 100–113 111
between the frequency and duration measures. In the SS group,there was, with one exception, a lack of correlation between thevarious measures. The exception was a significant negative asso-ciation between the duration of visits on the BRIDGE relativeto the stay in the CENTRAL CIRCLE. Among the comparisonsmade, the highest Spearman rs (0.82) was obtained for HUR-DLE/CTRCI in the NoT group, which corresponds to the lowestrs (0.02) in the SS group. It seems as though the pre-trial socialstress disrupts the normal (i.e. untreated condition) pattern ofexplorative and risk taking strategies.
The measures of attend activity seems more likely to mir-ror an exploratory activity than risk assessment. The scores atthe entrance of the SLOPE correlated significantly to TOTALACTIVITY, the number of transits through the CENTRAL CIR-CLE and visits to the DCR. We do not have a good explanationto the fact that the number of visits to the SLOPE correlated neg-atively to the attend activity performed at the SLOPE/BRIDGEborder. The low frequency of attending the SLOPE/BRIDGEborder combined with frequent visiting of the SLOPE mightindicate an emotional reaction rather than risk assessment.
4.6. Strain differences (Experiment 4)
There is a great variance in behavioral responses betweenrats of different strains and sources[28,29,54]. The variationhas multiple causal links to genotype and environmental fac-t bilityo raitsa weet . ThW trast ed br entt ancm tions alogW ntet andL tay ia LIHm ctiver timei
4
cesb nov-e ebb dif-f rofilo ale( ev totaln renaw , the
females stayed longer in the HURDLE and had a longer durationper visit in the CORRIDORS. The behavioral profile revealedby the PCA analysis did not reveal a sex difference, but indi-cated a different pattern of distribution of the individual scores.The female scores were distributed closer to the origin than themale scores. The individual score is the collection of the variousbehaviors in the CSF, indicating individual profile. The overviewof the data provided by the PCA suggests that the distributionof such profiles in females were less than in males. Only naiveSD females without any pre-trial treatment were studied. Vagi-nal smears indicating phase of estrus were taken, but the effectof endocrine condition was not studied in detail. The data pre-sented here are just to indicate that in the SD females, the basicbehavioral pattern in the CSF is comparable to that seen in themale rats.
4.8. The CSF test for investigation of risk assessment andrisk taking
As mentioned in Section1, measures of risk assessmentbehavior are appropriate in exploring basic mechanisms of fear-motivated behavior[1,8,13,34,48]. Here, we make a distinctionbetween risk assessment and risk taking. In the current study, theBRIDGE was shown to be a zone with risk qualities and the mea-sures associated with this area thus indicate risk taking. Morefrequent visits might suggest more risk taking, but could also ber lly ifd of thet ason-a ssed( risk-a peatedt ithint ent ofr LEw r thei te thef plieda tives ateda o bep
an theB andD ond-i he WIm hant its ont forec fors idancew GEa andt d thati per-f arlier,e a to
ors. The aim of the present study was to explore the possif using the CSF method for differences in behavioral tmong different strains. Differences were more evident bet
he SD and WI males than between the SD and LIHO malesI rats moved a shorter distance than the SD rats. In con
o the differences in the distance measurements achievepeated trials (see above), the strain effect was most evidhis respect in the first 5-min period of the session. The distoved during the first 5 min apparently measured the rela
hip between the explorative urge and cautiousness. By anI males spent more time in the DCR and the latency to e
he CENTRAL CIRCLE was much longer than in the SD (IHO) males. The WI males seemed to be more eager to ssafe area and took longer to approach open areas. Theales were more similar to the SD males, but were more a
egarding number of CORRIDOR ENTRIES and spent lessn the sheltered DCR.
.7. The behavior in female SD rats (Experiment 5)
The documentation on specific behavioral differenetween female and male rats in exploration, activity level,lty seeking, etc. is rather sparse, see ref.[44]. Females haveen reported to be more active in tests of anxiety[32,46]. Theehavior in the CSF situation did not indicate a sex-linked
erence in this respect. In most respects, the exploratory pf the SD females was very similar to that seen in the SD mTable 3; Figs. 2 and 6). The distribution of time spent in tharious zones of the CSF, the activity pattern in terms ofumber of visits to zones and the distance moved in the aere no different to that seen in the SD males. However
nety
ine-y,r
nO
es
,
elated to a general increase in exploratory activity, especiaurations are short. The duration per visit, as a measure
ime the animal exposes itself to the expected risk, is a reble measure of risk taking. Interestingly the pre-trial streSS, RS) animals showed an increased time per visit in thessociated zone. There was such a tendency also after a re
rial in the NoT males; however, there was a high variance whe group. In spite of the increased risk taking, the assessmisk in terms of visits to the SLOPE and exploring the HURDas reduced in the SS. We do not have an explanation fo
ncreased risk taking after the two stressors, but can just staact that the pre-trial stress, especially the social stress, immental condition that drives the animal to alter its explora
trategy and approach to risk. Possibly the BRIDGE, elevnd with a transparent wall facing the laboratory, might alserceived as a rewarding possibility of escape.
The sheltered DCR was experienced as a safer area thRIDGE. It seems as if the duration per visit to the BRIDGECR were mutually independent, as there was no corresp
ng change in the DCR measure in the stressed animals. Tale rats stayed significantly longer per visit in the DCR t
he SD rats, but no differences were detected as to the vishe BRIDGE. Furthermore, WI rats had a longer latency berossing the CENTRAL CIRCLE, indicating a preferenceheltered areas and avoidance of open areas. This avoas not reflected in the performance relative to the BRIDrea. When comparing the performance of the SD males
he WI males, the risk taking and risk assessment indicatencreased risk taking did not necessarily mean a deviantormance also as to the sheltered zone. As mentioned excursions of long or short duration from a sheltered are

112 B.J. Meyerson et al. / Behavioural Brain Research 168 (2006) 100–113
more risky ones are characteristic of the behavior of the rat inits natural habitat[4,5].
4.9. Conclusions
The main objective of this paper has been to evaluate a multi-variate model for experimental studies on explorative strategiesin an environment that evokes risk performance. The animalsclearly visited all the different areas in the CSF. The pup-retrieval and food-hoarding observations showed that risk versussafety qualities were associated with specific zones in the CSFapparatus. Quantitative and qualitative differences in the vari-ous elements of the behavior profile were obtained by pre-trialsocial stress, strain differences were detected and the animalacquired experience from the novel situation which influencedits behavior in a repeated encounter, indicating a consolidationof memory. Apart from the conventional statistics, the PCA anal-ysis helped to discriminate between the various independentvariables tested. We can also state that the CSF method has beenused to advantage for studies of the differences in behavior ofwild and laboratory mice[2,3], studies of the effects of maternalseparation in rats[48,49] and in functional evaluation of braininjuries[19,50]. In some studies[2,3,48,49], the CSF has beenmore effective for discovering differences between groups thanthe elevated plus maze and open field techniques. A battery oft teds arrieo riated
A
elp-f s ato d ths dicaC
R
labo-lfare
sess-two
comd two
Ltd.;
r ofsity
Ger-and
8–49biol
[8] Blanchard DC, Griebel G, Blanchard RJ. Mouse defensive behaviors:pharmacological and behavioral assays for anxiety and panic. NeurosciBiobehav Rev 2001;25:205–18.
[9] Blanchard RJ, Blanchard DC. Antipredator defensive behaviors in avisible burrow system. J Comp Psychol 1989;103:70–82.
[10] Blanchard RJ, Blanchard DC. Bringing natural behaviors into the labo-ratory: a tribute to Paul MacLean. Physiol Behav 2003;79:515–24.
[11] Blanchard RJ, Flannelly KJ, Blanchard DC. Defensive behavior of lab-oratory and wild Rattus norvegicus. J Comp Psychol 1986;100:101–7.
[12] Blanchard RJ, Hebert MA, Ferrari P, Palanza P, Figueira R, BlanchardDC, et al. Defensive behaviors in wild and laboratory (Swiss) mice: themouse defense test battery. Physiol Behav 1998;65:201–9.
[13] Blanchard RJ, McKittrick CR, Blanchard DC. Animal models of socialstress: effects on behavior and brain neurochemical systems. PhysiolBehav 2001;73:261–71.
[14] Brain PF. Understanding the behaviors of feral species may facilitatedesign of optimal living conditions for common laboratory rodents.Anim Technol 1992;43:99–105.
[15] Brown RE, Stanford L, Schellinck HM. Developing standardized behav-ioral tests for knockout and inbred mice. ILAR J 2005;3:11–20.
[16] Calatayud F, Belzung C, Aubert A. Ethological validation and the assess-ment of anxiety-like behaviours: methodological comparison of classicalanalyses and structural approaches. Behav Process 2004;67:195–206.
[17] Chesler EJ, Wilson SG, Lariviere WR, Rodriguez-Zas SL, MogilJS. Influences of laboratory environment on behavior. Nat Neurosci2002;5:1101–2.
[18] Choleris E, Thomas AW, Kavaliers M, Prato FS. A detailed ethologicalanalysis of the mouse open field test: effects of diazepam, chlordiazepox-ide and an extremely low frequency pulsed magnetic field. NeurosciBiobehav Rev 2001;25:235–60.
[19] Clausen F, Meyerson BJ, Hillered L. A novel tool for analysing func-uro-
[ hlor-plus-
[ ehav-
[ viorchem
[ g of
[ ratehav
[ the33–6.
[ and
[ nal
[ tress5.
[ corearisoned rat
[ tive
[ tedehav
[ ysiol
[ s. J
ests often means that one and the same animal is subjeceveral tests with the risk of that the experience of one test cver to another one. This drawback is avoided in a multivaesign, such as the CSF.
cknowledgements
Thanks are extended to Professor Ingrid Nylander for hul comments on the manuscript and for laboratory facilitieur disposal. Grants from the Facias Foundation supportetudy. We thank the shop at the Uppsala University Biomeentre for skilful construction of the CSF.
eferences
[1] Augustsson H. Ethoexperimental studies of behaviour in wild andratory mice. Risk assessment, emotional reactivity and animal weActa Univ Agric Sueciae, Vet 2004;174:7–62, http://epsilon.slu.se.
[2] Augustsson H, Dahlborn K, Meyerson BJ. Exploration and risk asment in female wild house mice (Mus musculus musculus) andlaboratory strains. Physiol Behav 2005;84:265–77.
[3] Augustsson H, Meyerson BJ. Exploration and risk assessment: aparative study of male house mice (Mus musculus musculus) anlaboratory strains. Physiol Behav 2004;81:685–98.
[4] Barnett SA. The rat: a study in behavior. London: Camelot Press1963.
[5] Barnett SA. Ecology. In: Whishaw IQ, Kolb B, editors. The behaviothe laboratory rat. A handbook with tests. New York: Oxford UniverPress, Inc.; 2005. p. 15–24.
[6] Belzung C. Measuring rodent exploratory behavior. In: Crustin WE,lai RT, editors. Handbook of molecular-genetic techniques for brainbehavior research. Amsterdam: Elsevier Science B.V.; 1999. p. 73
[7] Blanchard DC, Blanchard RJ. Ethoexperimental approaches to theogy of emotion. Annu Rev Psychol 1988;39:43–68.
tos
isl
.
-
.-
tional outcome in rodents. San Diego, CA, USA: Society for Nescience; 2001.
20] Cole JC, Rodgers RJ. An ethological analysis of the effects of cdiazepoxide and bretazenil (Ro 16-6028) in the murine elevatedmaze. Behav Pharmacol 1993;4:573–80.
21] Conn PM. Methods in neurosceinces: paradigms for the study of bior. San Diego: Academic Press Inc.; 1993.
22] Crawley J, Goodwin FK. Preliminary report of a simple animal behamodel for the anxiolytic effects of benzodiazepines. Pharmacol BioBehav 1980;13:167–70.
23] Crawley JN. What’s wrong with my mouse? Behavioral phenotypintransgenic and knockout mice. New York: Wiley-Liss; 2000.
24] Cruz AP, Frei F, Graeff FG. Ethopharmacological analysis ofbehavior on the elevated plus-maze. Pharmacol Biochem B1994;49:171–6.
25] Dawson GR, Tricklebank MD. Use of the elevated plus maze insearch for novel anxiolytic agents. Trends Pharmacol Sci 1995;16:
26] Eriksson L, Johansson E, Kettaneh-Wold N, Wold S. Multi-megavariate data analysis. Principles and applications. Umea: UmetricsAcademy; 2001.
27] Fantino M, Cabanac M. Body weight regulation with a proportiohoarding response in the rat. Physiol Behav 1980;24:939–42.
28] File SE, Vellucci SV. Behavioural and biochemical measures of sin hooded rats from different sources. Physiol Behav 1979;22:31–
29] Gentsch C, Lichtsteiner M, Feer H. Locomotor activity, defecation sand corticosterone levels during an openfield exposure: a compamong individually and group-housed rats, and genetically selectlines. Physiol Behav 1981;27:183–6.
30] Hinde RA. Animal behavior. A synthesis of ethology and comparapsychology. New York: McGraw-Hill Book Company; 1970.
31] Hogg S. A review of the validity and variability of the elevaplus-maze as an animal model of anxiety. Pharmacol Biochem B1996;54:21–30.
32] Johnston AL, File SE. Sex differences in animal tests of anxiety. PhBehav 1991;49:245–50.
33] Licklider LC, Licklider JCR. Observation of hoarding habits of ratComp Phys Psych 1950;43:129–34.

B.J. Meyerson et al. / Behavioural Brain Research 168 (2006) 100–113 113
[34] Lima SL, Dill LM. Behavioral decisions made under the risk of preda-tion: a review and prospectus. Can J Zool 1990;68:619–40.
[35] Lister RG. Ethologically-based animal models of anxiety disorders. Phar-macol Ther 1990;46:321–40.
[36] Metz GA, Kolb B, Whishaw IQ. Neuropsychological tests. In: WhishawIQ, Kolb B, editors. The behavior of the laboratory rat. A handbook withtests. New York: Oxford University Press, Inc.; 2005. p. 475–98.
[37] Meyerson BJ, Lindstrom LH. Sexual motivation in the female rat. Amethodological study applied to the investigation of the effect of estra-diol benzoate. Acta Physiol Scand Suppl 1973;389:1–80.
[38] Miller NE. Effects of drugs on motivation: the value of using a varietyof measures. Ann N Y Acad Sci 1956;65:318–33.
[39] Miller NE. Objective techniques for studying motivational effects ofdrugs on animals. Psychotropic Drugs 1957;1:81–102.
[40] Montgomery KC. The relation between fear induced by novel stimula-tion and exploratory behavior. J Comp Physiol Psychol 1955;48:254–60.
[41] Newberry RC. Environmental enrichment: increasing the biological rel-evance of captive environments. Appl Anim Behav Sci 1995;44:229–43.
[42] Ohl F, Sillaber I, Binder E, Keck ME, Holsboer F. Differential anal-ysis of behavior and diazepam-induced alterations in C57BL/6N andBALB/c mice using the modified hole board test. J Psychiatry Res2001;35:147–54.
[43] Olsson IA, Dahlborn K. Improving housing conditions for labo-ratory mice: a review of “environmental enrichment”. Lab Anim2002;36:243–70.
[44] Palanza P. Animal models of anxiety and depression: how are femalesdifferent? Neurosci Biobehav Rev 2001;25:219–33.
[45] Paul ES, Harding EJ, Mendl M. Measuring emotional processes inanimals: the utility of a cognitive approach. Neurosci Biobehav Rev2005;29:469–91.
[ monurosc
[ fear-7–11
[ l forlun-
. Act
Universitatis Upsaliensis Comprehensive Summaries of Uppsala Disser-tations from the Faculty of Pharmacy 2004;313:1–81,http://publications.uu.se/theses/.
[49] Roman E, Gustafsson L, Nyberg F, Meyerson BJ, Nylander I. Effects ofmaternal separation on exploratory behavior and restraint stress-inducedcorticosteroid secretion during adulthood in male Wistar rats. ProgramNo. 507.13. New Orleans, LA: Society for Neuroscience; 2003.
[50] Roos MW, Ericsson A, Berg M, Sperber GO, Sjoquist M, Meyerson BJ.Functional evaluation of cerebral microembolization in the rat. Brain Res2003;961:15–21.
[51] Rosenblatt JS. Maternal behavior of the laboratory rat. In: RheingoldHL, editor. Maternal behavior in mammals. New York: Wiley; 1963.
[52] Roy V, Chapillon P. Further evidences that risk assessment and objectexploration behaviours are useful to evaluate emotional reactivity inrodents. Behav Brain Res 2004;154:439–48.
[53] Sahgal A. Behavioral neuroscience: a practical approach. Oxford: OxfordUniversity Press, Inc.; 1993.
[54] Schmidek M, Schmidek WR. Differences in individual rat preferencefor light levels. Braz J Med Biol Res 1988;21:663–5.
[55] SHIRPA,http://www.mgu.har.mrc.ac.uk/facilities/mutagenesis/mutabase/.[56] Spruijt BM, van den Bos R, Pijlman FT. A concept of welfare based
on reward evaluating mechanisms in the brain anticipatory behaviouras an indicator for the state of reward systems. Appl Anim Behav Sci2001;72:145–71.
[57] Szechtman H, Eilam D. Psychiatric models. In: Whishaw IQ, Kolb B,editors. The behavior of the laboratory rat. A handbook with tests. NewYork: Oxford University Press, Inc.; 2005. p. 462–74.
[58] Tecott LH, Nestler EJ. Neurobehavioral assessment in the informationage. Nat Neurosci 2004;7:462–6.
[59] Urquhart J, Heilmann K. Risk watch: the odds of life. Facts on filepublications. New York: R.R. Donnelley & Sons Co.; 1984.
[ ty of
[ Pre-nsive.
[ lski. Dor-
46] Ray J, Hansen S. Temperament in the rat: sex differences and horinfluences on harm avoidance and novelty seeking. Behav Ne2004;118:488–97.
47] Rex A, Sondern U, Voigt JP, Franck S, Fink H. Strain differences inmotivated behavior of rats. Pharmacol Biochem Behav 1996;54:10
48] Roman E. Maternal separation in rats. An experimental modelong-term effects of early life experiences on neurochemistry, votary ethanol intake and exploration and risk assessment behavior
ali
.
a
60] Vander Wall SB. Food hoarding in animals. Chicago: The UniversiChicago Press; 1990.
61] Winocur G, Moscovitch M, Fogel S, Rosenbaum RS, Sekeres M.served spatial memory after hippocampal lesions: effects of exteexperience in a complex environment. Nat Neurosci 2005;8:273–5
62] Wold S, et al. Multivariate data analysis in chemistry. In: KowaBR, editor. Chemometrics, mathematics and statistics in chemistrydrecht: D. Reidel Publishing Company; 1984.