Peru Poverty Assessment and Social Policies and Programs ...
153
Report No. 11191.PE Peru Poverty Assessment and Social Policies and Programs for the Poor May 5, 1993 HumanResources Division Country Department I Latin America andthe Caribbean Region FOR OFFICIAL USE ONLY MICROFICHE COPY i Report No.:11191-PE Type: (SEC) Title: POVERTY ISSUES AND SOCIAL SECT} Author: JONES, T Ext. :35309 Room:I7181 Dept. :LAIHR 4~~~~~~~~~~~~~~~~~~~~~~~~~~~~~~~~~~~~~~~~~~~~~~~~~~~~~( P~~~~~~~~~~~~~~~~~~~~ U q. This 40 . ,.has. r.stricted dis.tton afdmay be used.by recip, --- s d y ?c -f Iiek soff .taf duis vt- co, nte,of -oth ewise W'~~~ W * WodBn oi~ati, . W ;~' , , . .. __; .x..- , -- .e~ Public Disclosure Authorized Public Disclosure Authorized Public Disclosure Authorized Public Disclosure Authorized Public Disclosure Authorized Public Disclosure Authorized Public Disclosure Authorized Public Disclosure Authorized
-
Upload
khangminh22 -
Category
Documents
-
view
1 -
download
0
Transcript of Peru Poverty Assessment and Social Policies and Programs ...

Report No. 11191.PE
PeruPoverty Assessment and Social Policiesand Programs for the PoorMay 5, 1993
Human Resources DivisionCountry Department ILatin America and the Caribbean Region
FOR OFFICIAL USE ONLY
MICROFICHE COPY
i Report No.: 11191-PE Type: (SEC)Title: POVERTY ISSUES AND SOCIAL SECT}Author: JONES, TExt. :35309 Room:I7181 Dept. :LAIHR
4~~~~~~~~~~~~~~~~~~~~~~~~~~~~~~~~~~~~~~~~~~~~~~~~~~~~~(
P~~~~~~~~~~~~~~~~~~~~
U q. This 40 . ,.has. r.stricted dis.tton afdmay be used.by recip, --- sd y ?c -f Iiek soff .taf duis vt- co, nte,of -oth ewiseW'~~~ W * WodBn oi~ati, .
W ;~' , , . .. __; .x..- , -- .e~
Pub
lic D
iscl
osur
e A
utho
rized
Pub
lic D
iscl
osur
e A
utho
rized
Pub
lic D
iscl
osur
e A
utho
rized
Pub
lic D
iscl
osur
e A
utho
rized
Pub
lic D
iscl
osur
e A
utho
rized
Pub
lic D
iscl
osur
e A
utho
rized
Pub
lic D
iscl
osur
e A
utho
rized
Pub
lic D
iscl
osur
e A
utho
rized
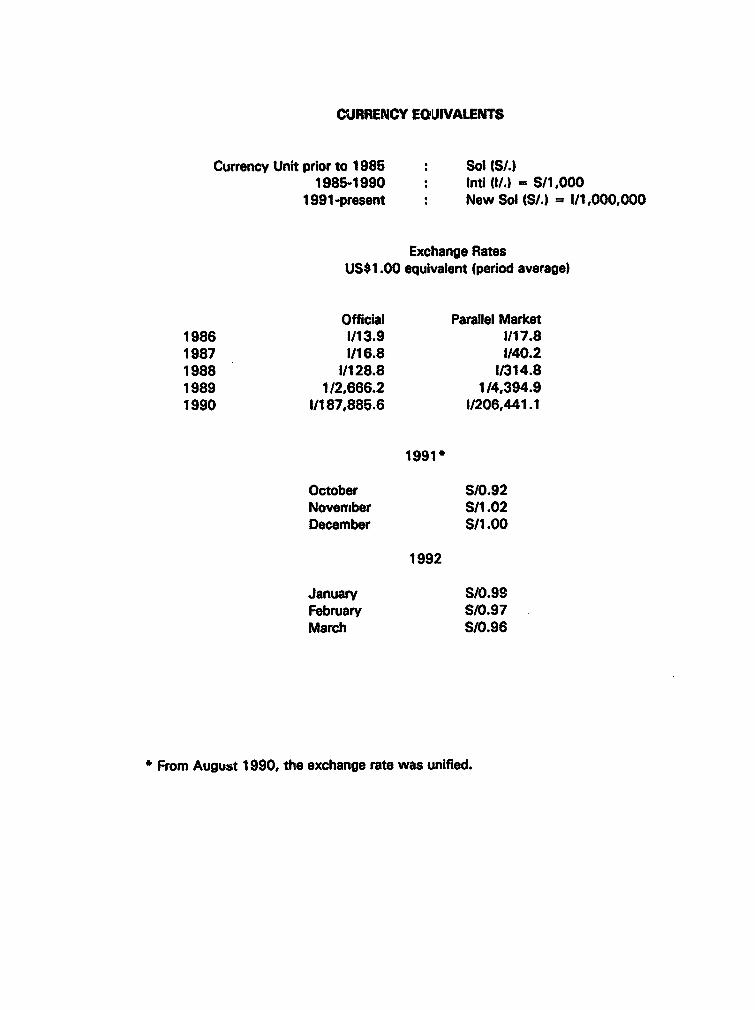
CURRENCY EQUIVALENTS
Currency Unit prior to 1985 Sol SIS.)1985-1990 Inti (/.) = S/1,000
1991-present New So (S/. = 1/1,000,000
Exchange RatesUS*1.00 equivalent (period average)
Official Parallel Market1986 1113.9 1/17.81987 1/16.8 1/40.21988 1/128.8 1/314.81989 1/2,666.2 114,394.91990 1/187,885.6 1/206,441.1
1991
October S/0.92November S/1.02December S/1.00
1992
January S/0.99February S10.97March S/0.96
From August 1990, the exchange rate was unified.

FOR OFMCIAL UE ONLY
ABSTR4CT
1. The objecdve of this report is to identify the components of a povrtyalleviation strategy for Peru, with a focus on socia services. The report analyzesPeru's previous economic performac and the main eements of the reform program
which could affect the poor. It also analyzes the characteristics of poverty in Peru.It examines the curret stats of the socia sewices most critcal for the poor,identifying key issues and examining the utilization of services. Ibe repoit makes
recommendations on priority programs. Fmally, it looks at issues in theimplementation of a poverty alleviation strategy, and it examines the Government'sprogress thus far in defining its strategy.
2. Peru's potenti was frUste during the decades of heavy Governmentintervention In economic acdvity. One of the legacies of poor economicpefmae is the persisnc of high poverty levels. In August 1990, a newadminis on announced the first measu in a strong stabilization aa adjusatentprogrm. The initation of major economic reforms provides a unique opportuityfor Peru to consider a program to alleviate poverty. These economic reforms are
laying the groundwork for broad4baed economic growth, a reduced role for the
state and greater opportunities for the poor. A targeted povety alleviation programincluding social services can proect the most vulnerable groups and assist others to
take advatage of new opporites.
3. Low spending and poor outcomes characterz Peru's social sectors. Infnt
an mater mortality rates arm among the highest in Latin America. Chfldmalnutiton peists at 1971 levels. The 1991 cholera epidemic demonstaed in a
dmatic way the prcaiousess of sanitaton conditions. In education, Peruperforms well in tms of primary and secondary school enrollment, yet reptiion
rat are high and educational quality is low. With sharp declines in Governmentexpendiure over the past five years, public resources for socal services havebecome scarcer. While protected from the extreme reductions experienced in other
sectors, social spdiw is lower than in neigboing ries.
4. Health and education sector issues infuence directy the quality of life for
the poor. In health, the benefs of Peru's extensive network of primary care
facilities are not realized because of a scarcity of equipment, poor distution of
pesnnel and a low proportion of total resoces devoted to primary care. Quality
and utilization are low. In nutrition, widespread child malntrition has not been
reduced significantly trough food assiace. Numerous agencies wortc on nurition
but in the absence of an oveal fiamework, adequate norms or surveillance. In
education, prepimary schooling quality is poor. Multigrade schoois in rural areas
iack supplies and well-trained teachers. Illiteracy persists at a relatively high rate,
with little progress in eradicating it among nrual women.
This document his a restricted distribution and may be used by recipients only in the performance
of their oflicial dutis. Its contents may o otherwis be disclsed without World Bank authotietion.

5. Who are the poor in Peru and how do they use social services? Ts reportconstructs a poverty pro9fie drawing upon a 1991 Living Standards Survey. Half ofall households surveyed are poor and one fiflh are extremely poor. The poor sendtheir children to school later and a larger proportion either never attend school ordrop out very early. Fewer of the poor attend pre-pimary schools. The poor areless likely to receive vaccinations, seek media care or have access to publicsewerage systems. They are more likely to use primary health cenrs and posts.
6. This report recommends that education programs for the poor improveconditions in rural multigrade schools, provide textbooks and teaching materials andtrain teachers. More emphasis needs to be placed on preschool education. Non-Spanish speaking women should be trained In functional skills including literacy.Health programs for the poor should concentrate on providing mothers and childrenwith adeuate primary health care services. Supplies of basic equipment, mateialsand medicines need to be ensured for primary care services. Prevention andtreatment of cholera and improvement of hospital emergency services are other highpriorities. Well-designed social compensation programs can complement improvedsocil services. Employment programs can reduce poverty by providing income and,creating and rehabilitating infrastructure. Food assistance can protect the nuritionalstatus of vulnerable groups.
7. Implementation of a poverty alleviation strategy needs to build in approprlite'targeting and institutional arrangements. In Peru, geography is the single bestindicator for reaching the extremely poor. By direcdng resources to thb rum sierra,one in every two extremely poor households can be reached. The magnitude andseriousness of poverty in Peru call for exploring a vaiety of insdtitonalarrangements. Among those worth considering is the social investment fund model.Peru established FONCODES, its National Fund for Social Compesation andDevelopment in August 1991, and by mid-1992, this organizat bega to showencouraging signs of its potential. NMOs should also be called upon to participateactively. They can mobilize and utilize substant levels of resources to reachunderserved populations effectively.
8. Ihe Government recendy prepared a poverty alleviation strategy which isgenerally consistent with the findings and recommendations of this report. TheGovernment strategy recognizes that poverty alleviation demands essentily aneconomic strategy. It aims to improve the living conditions of the extremely poorthrough programs in food assistance, health, education and employment generation.Financing for this strategy must come from government and donor resources. Toattract sufficient donor resources, the Government must demonstrate its owncommitment. In 1990, total government spending on health and education reachedonly 2.2 percent of GDP. As its revenues increase, it is recommended that theGovernment increase the resources it allocates to health and education. Thechallenge and test of the Government's resolve in redre log poverty will be the extentto which current and future policies and programs follow its poverty lleviation..

Contents
vii
latroduetle ix
Summand Cya (English and Spanish) xi
aopWt 1: From Emosic ad Soa Crus to Rm 1
cotrodm1onEconomi Stanion Economic Cdisis 3Soca Crids S
The Econoic lteform Program 9Initia Response of the Economy and Expected Benes 12ConclusIon 12
Chapter 2: Pow"erty b NeI13Trnds in Povety 1970-1990 13Povefty rfle 14Smmary 24Imicaions for Poverty Aleviaon Stratey 25
ahapter 3: Soca Srvks 2727
Status of Services 27ham 28
Wealth mad Nourh 30Health Condo 30
Status of Sevces 31Issues ~~~~~~~~~~~~31

NutritIon 32
Child Nutritional Status 32
Micronutrients 33
Nutritional Services 34
Issues 34
Conlusfions 36
Chapter 4: Towards a Poverty AlleviatIon StrateW 37
IJtroductlon 37
Socia Services 37
Education 37
Health 39
Nutrition 41
Socal Compensaion Programs 42
Food Assistance 44
Current Status Magnitude, Agencies and Progrms 44
Major Issues in Food Assistance 47
Major Recoramendations 47
Program Speclftc Issues and ReendaIons 49
Concluion 49
ChapterS: ImplementIng a Poverty AlleviatIon Strate 51
Itoduction 51
Targeting 51
Institutional Arrangements 52
Security Constraints 55
Poverty Alleviation Program of Govemment 55
Concluion 56
ibliogaphy 59
Tables
Table 1.1 Performance Indicators of the Economy 3
Table 1.2 Indicators of Economic Crisis 4
Table 1.3 Compl ative Social Indicators in Selected Countries 5
Table 1.4 Struchre of Central Government Spending, 1970-1990 6
Table 1.5 Social Setor Spending, 1970-1990 8
Table 1.6 Coefficients of Vulnerability, 1985-1990 9
Table 1.7 Government Spending on Education and Health 9
Table 2.1 Latin America: Poverty Estimates Around 1970, 1980 and 1986 14
Table 2.2 Distribution of Total Expenditure by Decile: All Sample Areas 15
Table 2.3 1991 Poverty Headcount 16
Table 2.4 Regional Distribution of Population by Poverty Groups 17
Table 2.5 Household Size and Per Capita Consumption by Poverty Group 17
Table 2.6 Sex of Household Head Among the Poor 18
Table 2.7 Distnrbution of the Poor by Langage of Interview 18
Table 2.8 Distnrbution of the Poor by Employer of Head of Household 19
Table 2.9 Food Expenditures by Poverty Group 20
Table 2.10 Food Consumption of Poor Households by Type of Acquisition 20
in Rural Sierraiv

Table 2.11 Non-Food Expenditure Pattem by Poverty Group 21
Table 2.12 Public Services for the Poor 22
Table 2.13 Education Level of Household Head 23
Table 2.14 Agricultura Land Owwnship in the Rura Sierra 23
Table 2.15 Crops Grown in the Rua Sia 24
Table 3.1 Wage and Budget Indies 28
Table 3.2 Indicators of Intemal Eficiency of Primary Education 29
Table 3.3 Infant Mortality Rate by Region 1989 30
Table 3.4 Coverage of the Maternal-Child Prom 1989 31
Table 3.5 Intensity of Contacts in the Maternal-Child Progam 1989 31
Table 3.6 Nurses per Doctor 32
Table 3.7 Disea Trends 33
Table 3.8 Changes in Household Foodshare by Regionard Expenditure Levels 34
Table 3.9 Food Consumption ss Percentage of TotalConsumption for Lima Households 34
Table 4.1 School Attendance by Age Group and Poverty Level 38
Table 4.2 Kinderaten Attendance by Poverty Group 38
Table 43 Percentage of Children Receiving All Required Vaccinaons 39
Table 4.4 Percentage of Ill Who seek Medical Attention 39
Table 4.5 Drug Purchases by Poverty Level 41Table 4.6 Unemployed by Poverty Groups 43
Table 4.7 Major Food Assistce Programs, 1991 45
Anexes
Annex A Social Security and the Provision of Health ServicesThe Private Provision of Social Semvices
Annex B Recent Research on Povety in PeruAnnex C Calculation of Poverty Lines
Table 1: Poverty Lines for reme Poor and Poor by RegionTable 2. Poverty Lnes Relative to Expenditure Distibution and Mlean by Region
Table 3: Basic Food Basket for Lima and the Coast of the National Institute for Food
and Nutrtion (INAN)Table 4: Basic Food Basket for the Sierra
Annex D living Standards Measurement Survey, 1991 (Selected Tables)
SlatsicalAppendix
v

PREFACE
This report is based on the ndings of missions which visited Peru in June andSeptember 1991. The missions consisted of The-esa P. Jones (Chief of mission),Eduardo Atalab, Karen Cavanaugh, Ernesto Cuadra, Magaret Grosh, Bruce Herrickand Richard Moore. 'Me section on non-govermenal organizations draws upon abackmund paper by Tbn de Witt based on findings of an April 1991 mission led byChristopher Hennin. 'he section on the poverty profile draws on a backgroundpaper written by Gustavo Yamada and a recent Living Standards MeasurementSurvey conducted and processed by the firm Cuanto. The vnissions would have beenunable to prepare the report without the assmance provided by staff of the Ministryof Economy and Finance, the Ministy of Health, the Ministry of Education, theCetr Reserve Bank, the National Planning Institute, FONCODES and otheragencies in Peru. Tbis report benefitted from the Government's review of an earlierversion, which was discussed with representatives of the Ministries of EReazh,Education, Economy and Finance, and the Central Reserve Bank in October 1992.Tlese discussions confirmed the Government's agreement with the report's ov. -allconclusions and recommendations. Tbis version has been revised to take intoaccount the Government's recent formulation of its poverty alleviaton strategy. Therport also benefitted from an exceptionally helpful group of peer reviewers withinthe World Bank, comprised of Paul Glewwe, Margaret Crosh, Phil Musgrove, LarryWolff and Helen Saxenian

Acronyms and Abbreviatons
M^CA 6 Id _RwalCanA EO_na FOdASbd fLC
APRCL Fomodn4oafUpta4Apcaofin PA
DAIZOD DeaurofodslaAgdcukaydeIahfaeshuc- Ag ancRliun and ReotumftslmdeaZomDepbniu Developwens in DmudAm=as
DESCO Centro doe ad6ol y_Picido1Duszolo Cunx forth Stuidy and Ptomtio ofDevem
wsPM Famb de Bme Social 3o" Emwv7 social Fund (Bo"ivia)
PONCODES Famdo NaionadeC_sp yDeamyDnOo NaiuSoci andDe"dePmmkd
INAN T Natond Nac AlonaldioyNut Ntlnsftu onFeEJigandNutMotb
MCIN maternal adMddtldeakh
MOE bsodeBdwaci h fEducaam
NGO __
OPASA Obia F yAuthciaSocial AvstDvyelqpmwandRaiAgecy
vil
PRONAA nNAIwddAyo_ NaPoodAs_P
PAD Prmg dOAiseDn ef DheIaD4xePa
PAHO Pan Am4hb H _ zo
PANFAR p oy Nukle Iea IcFamiNa Fading ProgmfbrH4ghRisk FamlsenAltoRao
PAT-PAMg cotoWoS G sPUmySchool 0ildm and TB}
PLSS Fem Livivg Stadars Survy
PRW;MA PmacosenhftadcSalud,aM y PwjeclnsImunionaSgs
PRODA PtoVm dde Darrolo Ingal lJtbo cm Food Aad I ontad Urban
MON"d Natonl Food Support Progrn
PRONABCE Progam Naconal de Contrl del docby Naionl C3okw and danicismCkdisnoRadmibos aaaSPtmg
PRONOEE qdm No Esh de Bdlca ni NlEProgrmm
SISVAN S_ste deVIlmolA y N Iuiol Food and Nutitim Surveilace Syslem
alDE Uided DepSnaldeSad I k 'I nit
WFP Wodd Food Program
V]il

Introduction
1. In August 1990, in the midst of plummet- advantage of oppaortnes, not only the few ableiug output and hypnla on, a new adiniz't- to gamer ecomic rents. Second, the new admin-tion in Peru announced te first measures in a istaion has decided to reduce the role of the Gov-strog stabilization and adjustment program. The ement in economic activity. As the state pullsmain tenets of the pgam are tight fiscal and back from many eoomic activities, it will freemoneary policy, libalzation of makets and a resources to improve the prwision of public ser-reductin of the previous pervsive role of the vices such as education and health Govemments
overnment in the economy. Mhe objectives are to traditionally have an important role in providingrestore croeconomic stability on order to pro- these services to the disadvantaged. Third, themote sustainabe, broad-based growth, thereby re- pmotion of growth would beneit the poor, but itversing Peru's legacyof economic stagnation and will take sone time for the ecomy to respond todeterioation.That legacy is reflected in many eco- the new incertive structe. Also, although sorenomic and social indicato, but pehaps most im- reforms are likely to help the poor, others may ladportaty, in the prsistee of a higb incidence of to tempory losses for some. In addition, certainpoverty In cerai regions and ethnic ps, and a groups in the country - those lacking sufficientdecras in welfare to below the poverty line for educato and those with poor health, for examplemay who had not previously been poor. -may not be able to take advantage of emloyment
opportu-ni without special assisUce. Ihe needs2. The initiation and, thus far, impressve of thesegroups should be addressed.implementaion and broadeing of the reformspwvide a unique opportuniy for the Govement 3. The purpose of this report is to identify theand the agencies providing financial support to components of a poverty alleviadon strategy forPeru to consider the needs of the poor. It is a Pe, focusing on social sevices. Of course, a pro-unque opportunity for three reaso. Fira, inttt- gram to reduce poverty would encompass othernational expedence shows that the first prong of an aspects as well such as rural developmen and in-effective stategy to reduce national pet Is the fsuctiemprovemens. However, those areaspromotion of broad-based growth, partculaly are not the focus of this document The report be-economic expansion dhat encourages the use of la- gins with a brief analysis of Per's previous eco-bor. For many years the requisie polcies and nomic performance and the main elements of theincentive strucue for growth have been absent reform program, especially those aspects whichin Peru. That appears to be changing and qukidy. could have the biggest impact on the poor. TheIf this program is succesfl in achieving its second chapter analyzes the chaact cs ofgoals, alare groupf people will be able to take povery m Peru. mhe third chapter exmines the
ix

curt statu of thsocial sCevi most critidl cpter looks atpissues sh as thefor the poc. J te fourth chapter tohe i ldc- t oleof socia ivestment funds and non-govern-floin die dXoion ~of socia vis plus lfor- me Sal ios. a o nes X p
mlon on thOe use of ths servces by the poor, are made by the Oovermet In defi a povet al-used as the basis fow recammeng the priority leviaton stategy and in iX dfying proets toprograms which need to be supportd by both the spport tiht satg.Govenment an exti asistnce. Th fia
'

Summary and Conclusions
1. One of the legacies of poor economic per- groups and assisting others to take advantage offormance in Peru is the peistence of high poverty neww oppouties is calfed for and is the focs of thislevels in some regions and ethnc groups and the repotdecline in living andards of others. Tho initiationof major economic reforms provides a unique op- 2. The promising potential of Peru was fes-porunity for both the Government and those pro- trated durng three decades of heavy Governmentv tag financial support to Peru to consider a pro intevention in economic activity which rested ingmm to alleviate poverty for several reasons. Fist, a legal structure and policy environment inimicalinternational experience shows that a meaningful to growth. The overexpansion of the state led to aand sustained reduction of poverty is impossible waste of resources and economic stagnation. Be-without broad-based economic growth. Up until cause of the lack of growth and rigid, closed mar-now the macroeconomic stability, administrative kets, few groups in the country had access to theframework and incentive structure conducive to means to improve their livelihoods. Public policiesgrowth were absent in Peru. That is changing and diorted most of the markets in the economy.quicldy. Second, one reason for the poor growth Trde policy relied on an import-substitution stat-was the over-exteion of the slate in economic ac- ey with very high tariffs and many non-tariff bar-tivity. A key element of the reforms is the reduc- rers. Declining tax recipts contibuted to the de-tion of the role of the state. As the public sector terioration of fiscal performance and reduced themoves out of mm where it adversely affected out- resources available for operating, maitaining andcomes - labor and financial markets and produc- investing ine al public seices. Even policiestion - it will free resources for areas where it can and progrms established to benefit workers andand should make a positive contribution, namely famners, such as labor stability laws and agrarianthe provision of public services such as education refonn, proved to be detrimental to those groupsand health. Third, in the medium and long-run the and to the economy. Real wages fell afer 1970 andimplementation of the reforms should reduce pov- employment in the fomal sector hrank. Agricul-erty by providing more opportunity for the poor to tore grew at only half the rate of population provid-use their assets, such as labor and land. However, ins little opportunity for an improvement in rurlin the short-run some measures may lead to tempo- incomes.rary difficulties. It will also take time for theeconomy to respond to liberalization and some 3. President Garcia's explanation of cbronicgroups are not able to participate fully. A targeted inflation and low growth was that Pem was in apoverty alleviation progm, including social ser- "debt trap":servicing the external debt would ac-vices, and aimed at protecting the most vulnerable celetaft' devaluation and inflation, erode domestic
xi

savings, and curtail investment. Consequently, his Government's ability to provide basic services inadministration (1985-90) put a ceiling on foreign the long-run. Growth in urban employment anddebt service of 10 percent of the value of exports, wages is a major determinant of the pace of pov-and later stopped payments altogether. It instituted erty reduction both through its direct influence onwidespread foreign exchange controls and in- the exng wban poor and through the opportuni-creased protection. The Government also raised ties it creates for migration from rural areas.the minimum wage, expanded credit and subsidies, Greater neutrality in the trade regime can support adecreased the value added tax rate and lowered more labor-intensive pattern of industrial expan-public sector prices. This strategy led to a high fis- sion in import-competing as well as exporting sec-cal deficit, financed by money creation. After 1987 tors. The Government has moved quickly andthe market lost confidence, inflation rebounded boldly to liberalize the trade regime. However,and economic output and real wages declined trade reform is most effective if factors of produc-sharply. Economic mism ment reached a cli- tion are free to respond to market forces. In themax in 1989-90 and was reflected in hyperinfation. case of Peru, state policies since the 1960's have
severely restricted factor movements. In order to4. The poor economic record is one factor promote more opportunities for urban employ-behind the poor health conditions in Peru. Among ment, a key area for reform is labor market deregu-countries in the region, Peru ranks near the bottom lation. Policies to promote rual development alsoon health indicators. The 1991 cholera epidemic are an important component of the poverty allevia-demonstrated in a dramatic way the precariousness tion strategy.of sanitary conditions nationwide. In education,however, it ranks near the top on the ratio of stu- 6. Growth is important, but is not the soledents enrolled in primary and secondary schools component of the poverty alleviation strategy. Pro-although high repetition rates and low quality are grams are needed to ensure that the poor can takeissues. The public resources available for social advantage of job opportunities and to protect someservices have become scarcer with the sharp de- vulnerable groups that are not able to participatedine in overall Government expenditures during fully in the economy. In order to design these pro-the last five years The decline is explained by sev- grams information on the poor is needed. The pov-cral factors including the severe recession and the erty profile of Peru constructed in this report isnear vanishing of the country's tax system. The based on datafroma Uving Standards Survey car-social sectors were protected from the more ex- ded out during October/November 1991. Twotreme reductions experienced in other parts of the poverty lines are calculated. Households are classi-Government. Nevertheless, because of the decline fled as extremely poor if their total expendituresin tot resource availabilit, Peru generally spends are less than the cost of a basic food basket.less than its neighbors in ese ar Households are classified as poor if their total ex-
penditures are less than the cost of a basic food5. In August 1990, the Fujimori administra- basket plus an estimate of non-food expenditures.tion launched an orthodox and sweeping stabiliza- About half of the population surveyed fal belowtion and structul reform program. During the the higher of the two poverty lines and a fifth failfir stage, the Government took dramatic steps to- below the lower cutoff.wards stabilizing the economy and rebuilding tieswith the international financial community. A sec- 7. Where do the poor live? Among the fourond stage of policy reform began in March 1991 regions sampled (lima, urban coast, and urban andand was based on a series of broadxsed stctural mral sierra), the incidence of poverty is highest inmeasures. These reforms aimed at promoting com- the rual sierra. Two-thirds of the households therepetitiveness and deregulating economic activity. are poor and 47 percent are extremely poor. OnlySeveral reforms are crucial for poverty reduction. 10 percent of the households in Lima are ex-Peru's ability to reverse the sharp decline in tax tremely poor, compared to about 20 percent inrevenues lies at the heart of the restoration of fiscal both the urban coast and sierra regions. In each ofbalance. It is also vital in order to guaratee the these three regions the share of poor households is
xli

about half. The rural sierra is estimated to contain 12. Among land-owning houeholds, thethe largest number of extremely poor (1.6 mfllion poor have roughly 50 percent less land than thepeople). Because of its size Lima contains the non-poor. About a third of poor households ownhighest number of poor (2.5 million people). irrigated land, compared to about half for the non-
poor. Poorer households in the rural sierra tend to8. The typical poor person lives in a larger have more workers engaged in agnculture than ishousehold than the non-poor, on averge contain- the case for better-off households. The most im-ing 1.5 more individuals. Each worker in a poor portant crops produced in the rural sierra by thehousehold supports four family members. For the poor are potatoes, barley and wheat The cropsnon-poor the number falls to three. Per capita food which are produced mainly by the poor are whiteexpenditures in an extremely poor household are maize, barley, potato, oca and olluco.only 40 percent what it is in other households andthe similar ao for total expenditures is 30 pecet 13. The poverty profile provides broad guid-
ance on a poverty alleviation strategy for Peru.9. Only in Lima are female-headed house- Jiaty, targeted programs should focus on the ex-holds found disproportionately among the poor. trem poor which represented a fifth of the popula-Indigenous populations are dad in Peru. tion surveyed. Second, prograns to alleviate pov-Taken together, households headed by Quechua erty among the extremely poor should target theand Aymara speakers account for 40 percent of the rural sierra and the indigenous population. Im-extremely poor and about a quarter of the poor. In provements in access to public services, particu-Lima, migrants are slightly more likely than non- lady for ducation, are needed to reduce extrememigrants to be founJ among the poor. The poor are poverty. These households are at greater risk forfound largely among two occupational groupings, poor health because they lack dean water and sam-the self-employed and private sector workes tation facilities. Third, working in agriculture is
positively associated with poverty. There may be10. The food commodities accounting for the potential for agricultural policies to reduce pov-largest share of expenditures among the poor are erty, such as reforms related to land titling, the re-rice, bread, sugar, tubers and meat. The most im- habilitation or construction of small-scale irriga-portant products which are consumed from own tion works, and measures to increase the produc-production are tubers, followed by meat and veg- tivity of the crops most important to the poor.etables. The most impont non-food expenditures Other poverty reduction meaes are unrelated toare detergents, public transporation, soap and agriculture. For example, these households wouldclothing. Although the poor stand to benefit from benefit from opportunities for non-farm work.any price decreases in these commodites and ser- Fourth, the poor (as opposed to the extremelyvices rewting from deregulation and trade liberal- poor) have relatively good access to public ser-ization, there is no product or service for which a vices. These households are poor because they aresubsidy would be well targeted toward the poor. either in low-paying, low-productivity jobs in the
private or informal sector or unemployed. They11. Slightly over half of extremely poor need more productive jobs to raise their expendi-households have access to a public water systoem, tures above the poverty level and they are rela-compared to 80 percent for the total sample. The tively well-equipped to take advantage of employ-extremely poor who have access to a public water men opportunities. The execution of the economicsystem have been more affected by cutbacks in reform program and liberalization of the laborsupply than others. Fewer than 30 percent of the market are what is most important to reduceextr.'nely poor have public sewerage semrice, poverty for this group. PfMh, the poor would ben-compared to slightly over 60 percent for the total efit from declines in the price of wheat, rice andsample. Education levels are strongly related to sugar. They would also gain from the eliminationpoverty. Heads of households with less than com- of the ban on second-hand clothing imports andplete secondary schooling are more likely to be lower prices for detergent and soap. Finally, thefound among the poor. Government should reconsider its surcharge
zili

scheme on agricultmal products. With the excep- the intensity and quality of services is inadequate.tion of dairy products, the scheme either hurts the The composition of professional skills is not opti-por (sugar, nce, wheat products) or benefits bet- mal, mainly because the ratio of nurses/doctor andter-off farmers (yellow maze and sorghum) nurses/population is too low. There is also worri-
some evidence of low utilization of primary health14. Socal services can play an impotant dual care services. This low utilization is likely to berole in alleviating poverty. First, improvements in due largely to the lack of effective supply. Part ofhealth, nutrition, and education diecty address the the explanation may be user perceptions of limitedworst consequences of being poor. Second, there is value because of poorly traied staff and lack ofample evidence that investing in human capital, equipment, supplies, etc. in health facilities.especially in education, attacks some of the mostimportant causes of poverty. The progmms which 17. In nutrition, Peru suffers from relativelyhave the greatest impact on the poor are primary higb rates of malnourished children and low-birtheducation and basic health care. weight babies. Food security generally has de-
clined for the poorest. The significant increases in15. In education, there has been an imptes- the incidence of acute diarrheal disease and acutesive expansion in priy enrollments in Peru. respiratory illnesses also suggests greawe precari-However this was coupled with a decline in expen- ousness in living conditions, decreased effective-ditureslstudent and an exodus of trained teachers ness of preventive health measues and the incmeas-from the system. Interal efficiency is low. Repeti- ingly vulnerable nutritional status of the popula-tion rates are high, particularly in the early grades. tion. Micronutrient deficiencies are common inStudents spend an average of 13 years in each some areas of the country. A national survey ingrade so that by grade 6 almost three-quarters are 1986/87 esfimated that goiter is endemic in 88 per-overage. On average, for each graduate the system cent of communities in the sierra and selva. Small-spends resources equivalent to 8.4 years of school- scale studies indicate that anemia is a public heathig, 40 percent more than what would be necessary care problem among pregnant and lactatingin the absence of repetition and prematre leaving. women and children. Ihe response to malnutritionOne problem is the poor quality of pre-primary has excessively relied on food assistance and giveneducation. In addition, there are wide disparities in insufficient attention to complementary healtheducational attainment and efficiency within the measres, micronutrient supplemenion, and thecountry. The lack of supplies and poor teaching promotion of better health and nurition practices,practices are a patcular problem in multigrade including breast-feeding, and child growth and de-schools in rural areas. Aother concern is the per- velopment monitoring. The Child Growth and De-sistence of a relatively high rate of illiteracy as velopment Program of the Ministy of Health haslittle progress has been made in eradicating it in comprehensive and well-founded objectives, butrur areas and among women. As a consequence, not the budget or activities to achieve them. Otherthe number of illiterates increased by 1.5 percent problems are poor coordination among thebetween 1980 and 1986. plethora of agencies active in nutrition, a lack of an
overall framework for nutrition interventions, the16. In health, in spite of an expansion in pri- absence of norms and guidelines and weak nutri-mary care infrstrue, Peru has some of the tion surveillance.worst indicators on the continent, particularly inrural areas. The infant and maternal mortality rates 18. How do the poor make use of social ser-are among the highest in Latin America, particu- vices in Peru? Poverty influences school atten-laMy for the poor. Many health problems could be dance in two ways. First children of poor familiesimproved with more concered efforts in primary begin attending school at a later age than childrenhealth care. The full benefits of the network of pri- of non-poor families; second, a larger proportionmary care facilities are not being realized because of children of poorest families never attend schoolof a scarcity of equipment, poor distribution of or drop out very early. One of the factors behindpersonnel and a low portion of expenditures spent the relatively high repetition rates for childrenon the progm. There are gaps in coverage and from poorer households is lower attendance at
xlv

kindergarten. Altendance rates for female students to purchase drugs, particularly in the sierra. Theare lower than for male students among the ex- lack of access to a public sewerage system istremely poor and among all households in the rual dearly related to problems of diarrhea among chil-sierra dren. While only 17 percent of households lack
sewerage facilities, they account for 35 percent of19. In a program to alleviate poverty the first child diarrea casesmpriority for education is to increase the interal ef-ficiency of schools in poor areas. Impwving condi- 21. Programs for the poor should concentratetions in rural multigrade schools would particu- on providing mothers and youW chidren with ad-larly benefit the poor. Second, a progam to pro- equate primay health care. It is important to im-vide textbooks and teaching materials and to train prove the supply of basic equipment, materials andteachers can improve the quality of teaching in medicines necessary for carrying out these activi-other types of schools in poor areas, increase stu- ties, particllarly in poor areas. Cbolera preventiondent time dedicated to school work and provide and treatment is a second priority and the thd pri-them with more relevant learning experiences. ority would be to strengthen hospital emergencyThird, more emphasis needs to be placed on pre- service.school education. Steps need to be taken to im-prove the preparation of children for school in the 22. Even with improved social services, in thePRONOEI and Government-run kindergartens and short-run some groups may remain vulnerable be-to promote greater awareness of the value of kin- cause they are already living on the edge - for ex-dergarten among the poor. One way to atract ample, households lacking employed workers orpoorer students would be to offer school feeding whose heads can only find low-productivity jobsprograms at this level in some localities. Fourth a in household services or agriculture. For theseprogram to teach non-Spaish speaking women people well-designed social compensation pro-functional skills including literacy should be part grams could complement the two main elements inof poverty alleviation effors Progams to reduce the poverty alleviation strategy - promotion ofilliteracy in this group must consider that they are broad-based growth and improved and more equi-widely dispersed and thus hard to reach and that tably distributed social services.their free time is minimal. Experience from othercountries suggests using NGOs. Tey have the ca- 23. Employment progams can reduce povertypacity to reach deprived areas and to incorporate by providing employment (and thus inwme) toliteracy programs into ongoing activities, thereby those in need and can generate additional benefitsreducing costs. through the rebabilitation and creation of infra-
stutre. Since poor people are wflling to work for20. In health, the coverage of vaccinations a relatively low wage these programs can be cost-among children is low, particulary among the effective. The impact of an employment programpoor and in the rural sierra. In general, about half on poverty will be greater if unemployed-headedof all ill people seek medical care. Among the ex- households are found to agreater extent among thetremely poor, this drops to about one in three. The poor than among other groups and if the projectgap between the poor and the nonpoor is paticu- improves infrarctu or facilities used by thelaMy large in the sierm Where are the poor likely poor. In Peru, about two-tbirds of the householdsto go for care when they are i and whom are they headed by uwmployed are poor and 30 percent arelikely to consult? The poor are more likely than the extremely poor. However, households headed bynon-poor to use health centers and poss, as well as an unemployed person represent a small number ofpharmacies. Nevertheless, the highest proporkion the poor, generally 3-4 percent In the urban coastof the poor (30 percent) use hospitals. The poor are and sierra the proportion of the extremely poor ismore likely to consult paramedics, pharmacists somewhat higher - 6-8 percent. It is important thatand traditional healers than the rest of the popula- these programs be cost-effective. The persons em-tion. But across all expenditure levels the main ployed by a temporary employment programsource of medical consultations are health profes- should be poor. This can most easily be accom-sionals. Extremely poor households are less likely plished if the wage rate is set sufficiently low that
xv

that persons with higher paying (and higher pro- derstanding of the nutrient gaps of participants.ductivity) alternatives are not tempted to leave Food assistance coverage among patients withthem. The wage rate ensures that an automatic chronic diseases, especially tuberculosis, is inad-self-selection will occur. The average wage rate equate and needs to be increased. The coverage ofrecommended for any emergency employment the school feeding program should be concentratedprogam in Peru is the legal minimum rate. An- on a smaller number of children and assistanceother design feature that would promote cost-ef- should be increased to levels which will have afectiveness would be the locally demand-driven positive impact on absenteeism and desertion.selection and administation of projects.
26. Two issues which arise in the implements-24. Poor households spend an average of two- tion of the poverty alleviation strategy are target-thirds of their expenditures on food, and those in ing and institutional arangements. Targeting seeksthe rural sierra spend three-fourths on food. Thus to distribute transfers or other benefits only toprotecting the food security of the poor is a useful those identified as the beneficiary group in the in-way of protecting living standards. Food assistance terest of efficiency. The administrative mechanismcan also protect the nutritional status of vulnerable must not cost so much to operate that it effectivelygroups such as pregnant and lactating women, absorbs the savings from excluding the non-needy.young children and the sick and the elderly. Food In Peru, geography is the indicator with the greatstassistance is a significant resource for the social value as a targeting mechanism. By directing re-sectors. In 1991 donor food assistance resources sources to the rral siea, one in every two extremelytotaled at least $150 million. Food assistance poor households in the country can be reached.programs provided over 226,000 metric tons offood to at least 9 million beneficiaries. Food assis- 27. Some characteristics closely associatedtance to the urban poor is widespread and substan- with poverty suggest the types of assistance whichtial in Lima. Transfers in cash and goods (includ- would mainly benefit the poor. Nearly all house-ing food assistance) from non-profit organizations holds which draw their water from wells are poor.represent on average one fourth of total expendi- Other housing characteristics closely associatedtures in extremely poor households and almost ten with poverty include the use of latrines and the ab-percent of expenditures for poor households in sence of household lighting or sanitation facilities.Lima. However, in other areas these transfersaount for a negligible percentage of household 28. Peru seems to be an appropriate environ-expenditures of the poor. The fact that food ment for a social investment fund. Experience withassistance does not reach the rural poor suggests social funds in other countries indicates that effec-that other mechanisms should be explored, such as tiveness depends primarily on the capacity to se-food coupons. Food assistance appears to be lect the right projects, which in turn depends on therelatively well targeted to the poor in Iima; among quality of staff and their independence from politi-the non-poor only 6.5 percent benefit, compared to cal pressures. In August 1991 the Peruvian Gov-three-quarters of the extremely poor households ernment established a social investment fund, theand nearly 40 percent of the poor. Outside Lima, National Fund for Social Compensation andhowever, more than 40 percent of food assistance Development (FONCODES). Progress in makingbeneficiaries are from the non-poor. FONCODES operational was slow and initially the25. The most nutritionally vulnerable groups confusion overwhether the agency was going tobeaare pregnant and lactating women and pre-school "demand-driven" or a "top-downe operation ad-aged children, particularly those under the age of veisely affected the quality of some projects. How-2. The coverage of direct food assistance to moth- ever, in mid-1992 performance began to improve.ers and children appears adequate, but the low lev-els of assistance provided to most beneficiaries and 29. The Regional Compensation Fund whichthe absence of complementary nutrition promotion is operated within the Peruvian budget has the po-and health care activities makes it unlikely that tential to contnbute to a poverty alleviation strat-they have a significant impact on nutritional status. egy. However, currently no attempt is made to di-Also, beneficiary rations are not based on an un- rect more resources to poorer areas. A change in
xvi

the allocation fomala would only be feasible and 33. There are two sources of financing for themeaning with higher tax revenues and fic poverty alleviation stategy, govemnment and do-stabilization. nos In order to attract sufficient donor resources
the Government must demonstate clearly its owt30. The magnitude and seriousness of the commitment to poverty alleviation. In 1990 it ispovety in Peru call for the active participation of estimated that total govemment spending onhealthall esources, including Non-Governmetl Orga- and education reached only 2.2 percent of GDP innizations (NGOs) They have several strengths. Peru. As tax reform and the measures to strengthenThey can mobilize and utilize substantial levels of tax administration improve revenue generation, itresoures They are also able to reach undererved is rcommended that the Government endeavor topopulations effectively. NMOs are a strong con- increase the resources allocated to health and edu-stituency for the promotion of poverty alleviation cation. Spending on education and health of aboutgoals and progm here are many NGQs in Peru 4 percent of GDP is the average for Latin Americacoveing diffient fields and eas of the counry. and about the level that was spent in Peru during
the first half of the 1970s.31. NGOs also bave some weaknesses. Theyare often vulnerable to donor influence and have 34. The Government of Peru has taken an im-difficulty formulating policy proposas. Collabora- portant step to reduce poverty. Over the medium totion with the Govemment is constrained by real long-run what is needed to alleviate the high levelsand perceived barries The dispersion of Govern- of poverty is broad-based growth That is the ob-ment responsibilities over a broad range of state jective of the stabilization and adjustment pro-gencies makes NGO eny difficult. Also NGOs grm. However, this is not enough to alleviate
differ as to their mangement and adnistrative poverty, particulary in the short-rtn Measures arecapacities. Some Government agencies view needed to protect vulnerable groups and to ensureNOOs as competitos instead of potenial execut- that the poor are able to take advantage of theing agencies. Mistrst hinders collaboration. The greater opportunities in the reformed economy. InGiovernment should establish clear and efficient order to address these latter needs, this report hasmechamn for NO cMollaoatio mng NGO examined the profile of the poor in Peru and rec-consorta provide one mechanism which should be ommended priority policies and progms targetedexplored for fostering greater coordination, dia- to them. The Oovernment has made a start in thislogue and joint plannin with the Government. area. Its poverty alleviation strategy sets clear and
aoprit priorities and goals for poverty reduc-32. The Government ecently prepared a pov- tion efforts within a fiamework of a continuationerty alleviation strategy. The purpose of the docu- of economic policies that would maintain macro-ment is to set the pricrities fora poveny alleviation ecnomic stability and promote gowth. The chal-program in Per. It is generally consistent with the lenge and test of the Govemment's resolve will befidngs and recoendatons of the analysis con- to what extent cutrent and future policies and pro-tamed in this repot The stratea reogizes that grams are governed by that strategy. The recentthe allevation of poverty in Peru demands essen- improvement in PONCODES is an encouragingtially an economic strategy. The objective is to sign. But in order to ensure that the poor reap theimprove the living conditions of the extremely benefits of adjustment, the Government shouldpoor tbrougb spm in the areas of food assis- strengthen the social services most critical forlance, health, education and employment genera- them and provide more effective safety nets for thetion precs most vulnerable.
xvii

PERM. Socia Seito Cmuponeas fer Poverty Aflwlatloa Sb*at
Low attendane rates for poor Offer school leeding programsi in Sdw eoeFuftn Prf*achildren, partculary in the rura these areasSieram Maaingade Sdwoo Project
Highl epetiton rate, pdatiulary for Inceas the Internal efficiency of MiVJ*lrd $dwdo Projea*fth poo and in rural aesschools in poor areas, in particular by
Improving conditions In rural Textook PM*jctmutgaeschools. Provision of
textbooks; training mafteras, andteacher training geared to the
reqirmetsof muligrad. schoolsand for other schools in poor
-waa urban and rural areas&
Improve quality and attendance, in &Strengateig IWPre nWypre.scoo program. Improve Educati Series Pr*jctpreparation of chidren for school inthe PRONOIT and Govefnment-r
persistent r higllitry rate among Support a program to teach them LMteCa Projecnon-Spanish speaking woume basic functional skills, ielying on
N100s.
Qualit of car for vulneable grops - Provide pre-natal anti-Otetnusmothrs and hiuldren - Is low, imunizton and hron uplements,prticully in terms of the mber of monitor weiSgt gain and provide foodcontacts supplement, if needed, and trie
personne for high-risk deliveries.Train birth attendants for low-riskdeliveries.
Inrease the covaeage and ftequeny Chid Growth andof community- based growt Developmet Program "R)moitrig,partiuary amonchiodren under two.
l dest. in Italcs refr to projerpvUafle proposed by the Gownwwu.mhoge in iardrwd pim refer to dng Gatea pGeiwprogra cL.
xiI

PEU: Socl Sector Copoeut for Poverty Aleviion StaiqSmnmay Table
Jasuesddh Gormalogrm
Declining and low coverage of Effors should be made to increase Child Growth andvaccinations for chdken under one the vaccinaion coverag for children Development Proram (MOE)
under one hruwgh heaflt faciitie
Low coverage of family plann Stroengthn family planning educaip as and incrs access to contraceptive.
Low utlaton of prma health cme Rehabilitate deterioraed faoilites ma &R8*0*89 PbMWY Cnmservices by the poor, partularly In improve the supply of basie Bsc He and MNuAmthe siera equipment and drugs in hoalth
facilides.
Poor ditrbution of professionl Examine management and incentive Hma Resoreresources. There are not enough healfth isaus for staff. Upgade staff housg Devkpn fAre profssionals in the least-developed for pnmary health care facilides. EJlru, Po"regions nor ough wkg inprimary health care. There are not Promote greater us of local Basic HMMt and NMwoenough nurses rsoues troupg the provision of
tainig for nonprofesionals forexample.
Since poor households have lower Promote low-co systems for water Lad, and Edaadon inaccoss to public water and sewerage supply and sanitation. Where no Sankadosystems, their childrean are more likely sanitation facilites exist, latrnesto suffer from diarwhea should be built.
Cholera is a serious health problem Strengthen education campaips, Lats and Educaon inthat affts parily the poor ensure availability of supplies to treat Sadn
wj acueases, and rehabilitate watersystems and intl latines.
in some areas, a substantial proporton Strengthen hospital emergencyof the poor use hospital services services in poor areas
Absence of norms and sndards for Tne Government should develop andnutrition interventons monitor compliance with sandards in
three key areas: O unit costs forintervention; (i) food assistanceprogramming practices; and (i)information collection and impactevauation.
No agency of the Government is The Government shoult assign thisresponible for mobiliing resources fucion to the Ministry of Health.
*Il in itaics refer to proct pres proposed by dw Govenmeanthose in sndwd ptn refer to exisfnS Govwnmew prrmr.
xx~.

PERU: Soda Sector Componet for Povet Afevim Stratey-y Tab
I ssues Reconumendatim Govenment Prorm'
Lack of a sysem for nutrition Small sentiDe populatonsuveilance on a naional level represontave of importnt taget
groups should be monitored.
Absence of a framework for nutriton Government should implementinteention leads to duplicafion of nutrition plafunctions, a lack of attention toacheving major improvements innutrit status alid less than optimalresource use
Pattern of growth tring amoong EC campaign should be developed to Child Growth andchilden during weaing period promote ppropriate waning Development Program (MO)D
prctios.
Goiter is endemic in a8 pereut Of Goverment should conider National Pogram to Controlcommunides in the sierra and selva. subsidizing the incerase in production Goiter and Endemic CretinimAnemia is also a public health problem costs of iodized salt aad involve small (PRONABCE)as is vitamin A deficiency produetion facilities which market salt
from natura sources.
Iron supplementation for pregnantwomen; semi-anal vitamin Adistribution for children.
Food As e
Food assistance does not reach The Governument should examine Vaso de Lecheimportant target groups among the alterna mchasms to reacb thesepoor, particularly households in the groups such as food coupons andrural sierra where food security has introduce pilot program. The Vaso dedeclined. Also, the largest proportion Leche program should strengthen theof beneficiaries of the Vaso de Leche quality of management and control.program are school-aged children.Nearly 20 percent of its beneficiaries Food asdssnce to mothers and PANFARare not poor. children should be expanded.
Some commodities in food assistance The least expensive sources ifprograms are not the least expensive nutrients acceptable to benefi.;ariessources of nutrients, for example, milk should be selected as commodities.in the Vaso de Leche program Also staple foods used in assistanc
programs should be fortified withiron.
r r*ae. in ltalics refer to project profiles proposed by the Gowrment.hose in standard print refer to wxisng Gowernmnt programs.
xzci

PERU: Soca Sector Componeb for Povr AblviaUon Strate-UMM Table
Jmes GovermenProam
Impact of food assstance on Beoficiary raions should be basednuridonal status is likely to be on an undersanding of the nutrientnegligibl, gaps of participants.
Food asistance needs to be PANFARacompanied by complementayhealh and nutrition ducationmeasures, Including breast-feedingand child growth and dovelopmentmonitouing.
La Escola Defiende La Vida does not Program should rt chidren in La BEcuela Defiende La Vidareach poores and most vulonerable and grades 1.4 and those in pow areas,has mi nutriional impact instead of concetratg in I3ma.
Prgram should onsmr otnuity ifeeding.
Employmnt Program
How to ensure that program reaches Program should be designed to FONCODESpoor while meeting poverty alleviation encourage self-selection by the poor.objctdves with minimum While less than the tinimum wageadministrative coat would improv targeting, it has some
disadvanaWs. Povrty alleviadonobjectives may not be met and theparticipation of pdvate contractorswould be discouraged. For thosreasons, the minimum wage shouldbe offered. Codsderation should alsobe given to geographica targeting.
Adminstration of employment Demand-driven and promotion of the FONCODESprograms use of private conactors.
* Males in Italcs rfr to project profies proposed by die GovermwnThose n sard prpnt rer to edsLng Goewnentprogranm.
xxii

Resumen y conclusones
1. Uno de los legados del pobre dosempftio econdmico del Perd es lapersistencia de eledos niveles de pobreza en alguras regiones y grupos tnicos, yla dismlnucidn de los niveles de vida de otros. For varias razones, la inlroduccidnde importantes reformas ocondmicas ofre una oportunidad niuca tanto al Goblernocomo a quienes proporcionan apoyo financieto al Perd pars consider un programade allvio de la pobreza. Primero, la experiencia internacondl muestra quo esimposible lograr una reduccl6n significativa y duradera de la pobreza sin uncrecimiento econ6mico de base amplia. Hasta ahora en el Perd no exstfan laestabilidad macroecon6mica, el marco administrativo l la estcra de incenosque conducen al crecimiento. Esta situacion esta cambiando, y con rapidez.Segundo, una de las razones del escaso crecimiento registrado era la participacionexcesiva del Estado en la actividad econdmica. Un elemento dave de las rformases la reduccidn del papel del Estado. A medida que el sector pdblico se redre de lossoctres en que su intervencidn afectaba negativamento los resultados -trabajo,mercados flncieros y produccion-, liberara recursos para otras eras en quepuede y debe hacer un aporte positivo, a saber, la prestacidn de serviclos pdiblcostales como educacion y salud. Tercero, en el mediano y largo plazo, la aplicacidde las reformas deberfa reducir la pobreza al ofrecer mas oporxnidades a los pobrespara utilizar so activos, como la mano de obra y las tierras. Sin embargo, en elcorto plazo es posible quo algunas de las medidas que se apliquen ocasionendificultades transitorlas. Tambien le tomara tiempo a la economfa responder a laliber;izaci6n de los mercados, y algunos grupos no estan en condiciones doparticipar plenamente. Se requiere aplicar un programa de alivio de la pobreza -tema central del presento informe- dirigido a grupos especfficos, con incluslon deservicios sociales, destinado a proteger a los grupos mis vulnerables y brindarasistencia a otros, a fin de que puedan aprovechar las nuevas oportunidades que sepresenten y este es el tema central de este informe.
2. Las posibilidades prometedoras quo tenfa el Perl se vieron fnstadasdurante treinta afilos de fuerte intervencion estatal en la actividad economica, que setradujo en la institucion de una estructura jurfdics y un entorno en materia depolfticas que eran incompatibles con el crecimiento. El crecimiento excesivo delEstado condujo a un despilfarro de recursos y al estancamiento econ6mico. Debidoa la fWta de crecimiento y a la existencia de mercados rfgidos y corrados, muy pocosgrupos del pafts tendan acceso a los elementos necesarios para mejorar sus medios devida. Las polfticas pdblicas distorsionaron casi todos los mercados de la economfa.La polftica comercial se fundamentaba en una estrategia de sustitucion deimportaciones, con elevados aranceles y muchas barrens no arancelarias. Ladisminucidn de la recaudaci6n de impuestos contribuyd al deterioro del desempehofiscal y redujo la disponibilidad de recursos para el funcionamiento y mantenimientode los servicios pdblicos esenciales, y la inversion en los mismos. Incluso laspolfticas y programas que se establecieron para beneficiar a los trabajadores yagricultores, como las leyes de estabilidad laboral y la reforma agraria, resultaron

pejudiclales para esos grupos y para la economia. Los salarlos reales cayerondespuds de 1970 y disminuy6 el empleo en el sector fonnal. El sector agrfcolacreci6 tan sdlo a la mitad de la tasa de auirento de la poblacidn, brindando muypocas oportunidades ara que mejoraran los ingresos de la poblacidn rural.
3. La explicacin que dio el Presidente Garcfa de la situacion deInflaci6n crdnica y lento crecimiento era quo el Perd se encontraba atapado en lawtrapa de la deudae: el servicio de la deuda extrna acelerarfa It devaluacidn y Iainflaci6n, acabarta con el ahorro interno y reducirfa la Inversi6n. En consecencla,su Goblerno (1985-90) establecid un tope para el servicio de la deuda externa,ijindolo on el 10% del valor de las exportaciones, y mis adelante suspendid
totalmente los pagos, Impuso amplios -controles cambiarios y aumento elproteccionismo. Asimismo, el Gobierno aumento el salario mflimo, el credito y lassubvenciones, redujo la tam del impuesto al valor agregado y dispuso una rebaja delos precios del sector piblico. Esta estrategia provoco un elevado deficit fiscal, quose financi con la creacion de dinero. A partir de 1987 el mercado perdioconflanza, se produjo un rebrote inflacionario y el producto de la economfa y lossalarios reales disminuyeron drusticamente. La desacertada gestion econdmicaalcanz6 el punto culminante en el perbodo 1989-90 y se reflejd en la biperinflacion.
4. wos pobres resultados de la economfa son un factor que explica lasmalas condiciones de salud existentes en el PenS. Entre todos los palses de Iaregion, el Perd ocupa casi el lltimo lugar en los indicadores de salud. En 1991 laepidemia do c6lera demostro en forma dramatica las precarias condiciones sanitariasimperantes en todo el pafs. Sin embargo, en materia de educacidn, esti cerca delprimer lugar en lo que respecta a la proporcion de alumnos matricutados en escuelasprtmaria y secundaria, pero el elevado porcentaje de repitentes y la mala calidad dela ensefla representan un problema. La disponibitidad de recursos pdblicos paraprestar srvicios socWales va en disminucion debido a la brusca reduccidn del gastopdbico global en los iUtimos cinco aflos. La declinaci6n se explica por variosfactores, entre los que figura la grave recesi6n y la desaparicion casi por completodel sistema impositivo del pats. Se protegi6 a los sectores sociales de lasreducciones mais extremas que experimentaron otras esferas pdblicas. Sin embargo,debido a la disminucion de la disponibilidad total de recursos, el Perd suele gastarmenos quo sus pakses vecinos en estos sectores.
5. En agosto do 1990, el Gobierno de Fujimori puso en marcha unprograma de estabilizaci6n y reforma estructural de tipo ortodoxo do granenvergadura. En la etapa inicial, el Gobierno adopt6 dristicas medidas desdnadas aestabilizar la economfa y restablecer los lazos con la comunidad financierainternacional. La segunda etapa de la reforma de polfticas comdz6 en marzo de1991 y se baso en la adopcidn de una serie de medidas estructurales de base amplia.El proposito de tales reformas era promover la competitividad y desreglamentar laactividad econ6mica. Para reducir la pobreza se requieren varias reformasfudamentales. La capacidad del Perd para invertir ia brusca cabda de lasrecaudaciones impositivas es el punto central para recuperar el equilibrio fiscal.Tambidn resulta vital a fin de garantizar la capacidad del Gobierno paraproporcionar servicios bisicos en el largo plazo. El aumento del empleo y lossalarios en las zonas urbanas es un factor importante que determinarIl 01 ritmo quetendra la reduccidn de la pobreza, tanbo por su influencia directa en la actal

poblacidn urbana pobre como por las oportunidades que crme pan la mlgracidndesd. las zonas rurales. La mayor neutralidad del sistema de comerco puederespaldar un nwdelo de expansion industrial con un uso m4s intensivo de mano deobra en los sectores que compiten con las Importaciones, comno tambien en e1 de lasexportaciones. El Goblerno ha avanzado con rapidez y arrojo para liberaliw elsistema de comercio. Sin embargo, la reforma de este sector resuta mis eflcaz silos factores de produccidn tienen libertad para responder a las fuerzas del mercado.En el caso del Perd, las polifticas estatales existentes desde el decenio de 1960 hanrestringido fuertmemnte el movimiento de los factores. Para poder ofrecor misoportunidades de empleo urbano, una reforma dave es la desreglamentacdn delmercado de trabajo. Las poifticas de fomento del desarrollo rural tamblenconstltuyen un elemento importante de la estrategia para aliviar la pobreza.
6. El crecimiento es un com onente importante de esta estrategia, perono el 1nico. Es preciso aplicar progranu que permitan asegurar que los pobrespuedan aprovechar las oportunidades de arabajo que se presenten y proteger aalgunos grupos vulnerables que no estAn en condiciones de participar plenamente enla economfa. Para poder disefar estos tipos de programas se requiere informaci6nsobre los pobres. El perfil de pobreza del Perd quo se elabora en el present.informe se basa en datos recogidos en una encuesta sobre.niveles de vida realizadaen los meses de octubre y noviembre de 1991. Se calculan dos Ifneas de pobreza.Las unidades familiares se clasifican como extremadamente pobres si sus gastostotales son inferiores al costo de una canasta b$sica de alimentos. Se clasificancomo pobres si sus gastos totales son inferiores al costo de una canasta basica dealimentos, mis una estimaci6n de los gastos por concepto de artfculos noalimentarios. Aproximadanente la mitad de la poblacidn estudiada cae bajo la lIfneasuperior de ambas Ifneas de pobreza, y la quinta parte cae bajo e0 Ifnite inferior.
7. 4Pdnde viven los pobres? Al comparar las cuatro regiones delmuestreo (LJima, litoral urbano, y sierra urbana y rural), la incidencia de pobreza esmayor en la sierra rural. En esa zona, dos torcios de las unidades familiares sonpobres y el 47% del total son extremadamente pobres. Tan sdlo el 10% de lasunidades familiares de Lima son extremadamente pobres, en comparaci6n conalrededor del 20% en el litoral urbano y en las regiones de la sierra. En cada unade estas tres regiones, el porcentaje de unidades familiares pobres alcanza aaproximadamente el 50%. Se estima que la sierra rural alberga la mayor cantidadde personas extremadamente pobres (1,6 millones). Por su tamalho, en Lima vive elmayor ntlmero de pobres (2,5 millones).
8. Por lo general, una persona pobre vive en una unidad familiar masextensa que una persona no pobre, que en promedio incluye a uno y medioindividuos m4s. Cada trabajador perteneciente a un hogar pobre sustenta a cuatromiembros de la familia. En el caso de los no pobres, esta cifra baja a tres. Elconsumo de alimentos per ctpita en una unidad familiar extremadamente pobrerepresenta s6lo el 40%, en comparaci6n con el de otros hogares, y la mismarelacion en lo que respecta al consumo total alcanza al 30%.
9. Entre la poblaci6n pobre, s6lo en Lima se registra una desproporciondeuriidades familiares encabezadas por una mujer. Las poblaciones indfgenas en elPerd estAn desfavorecidas. Consideradas en conjunto, las unidades familiares

zeabezadas por hablantes de quochua y almar representan el 40% de la poblaci6nextremadamente pobre y alrededor del 25% do la poblacidn pobre. En Lima, esalgo mis probable encontrar inmigrantes quo no inmigrantes entre los pobres. Estosso encuentran mayoritariamente en dos agrupaclones ocupacionales: los trabajadoresindependientes y los trabajadores del sector privado.
10. Los aimentos bsioos quo representan la mayor proporclon de losgastos do la poblacion pobre son 0l aoz, el pan, el az Icar, los tubEculos y lacame. Los alimentos mas importantes que so obtienen mediante produccidn propiason los tuberculos, seguidos de la came y las hortalizas. Los gastos misimportantes por concepto de productos no alimentarios corresponden a detergentes,transporte pdbilco, jab6n y vestuario. A pesar do que los pobres serin losboneficiarios ds cualquier rebaja do los preclos de estos productos bisicos comoresultado de las medidas de desreglamentacion y liberalizacion del comercio, no haynhngdn producto ni servicio que pueda subvencionarse con objeto do beneficiar enverdad a los pobres.
11. Poco mis de la mitad de las unidades familiares extremadamentepobres tienen acceso a una red p6blica do abastecimiento de agua, en comparacidncon el 80% de la muestra completa. La poblacion madamente pobre quo tiensacceso a una red piblica se ha visto mis afectada por las reducciones del sumnistroquo otros grupos. Menos del 30% de los extremadamente pobres cuentan conservicio pdbllco de alcantarfllado, en comparacion con poco mis del 60% de lamuestra completa. Los niveles do educacion estin estrechamonte vinculados a lapobreza. Es mis probable encontrar jefes de hogar que no han completado laenseflanza secundaria entre los pobres.
12. En lo que respecta a las unidades familiares quo poseen tierras, lospobres tienen aproxhnadatente 50% menos superficie quo los no pobres. Cerca doun tercio de los hogares pobres poseen tisrra do regadfo, en comparaci6n conalrededor de la mitad de los no pobres. En el caso do las unidades familiares mispobres do la s3erra rral, todos o al menos la mitad do los trabajadores estanocupados en actividades agrfcolas, en tanto quo en el do los hogares quo gozan domejor situaci6n, una mayor proporci6n de los trabajadores realizan otras labores enforma independiente. Los principales cultivos quo producen los pobres de la sierrarural son la papa, la cebada y el trigo. Los pobres producen principalmente ma£zblanco, cebada, papas, oca y olluco.
13. El perfll de pobreza ofrece una orientacion general para laformulacidn de una estrategia de alivio de la pobreza en el Perd. Primero, losprogramas focalizados en grupos especfficos deben centrarse en los extremadamentepobres, que representan la quinta parte de la poblaci6n estudiada. Segundo, losprogramas para aliviar la pobreza entre la poblacion extremadamente pobre debendirigirse a la sierra rural y a la poblaci6n indfgena. Pars reducir la extrema pobrezaes preciso mejorar el acceso a los servicios pdblicos, en particular la educaci6n.Estas unidades familiares estin mis expuestas a presentar un estado precarno desalud porque carecen de agua potable e instlaciones de saneamiento. Tercero, eltrabajo agrfcola se asocia positivamente a la pobreza. Es posible que la adopci6n deciertas polfticas agrfoolas permita reducir la pobreza, como lIs reformas relativas a

los tftulos de propiedad de tierras, la rehabilitacidn o construccidn de obras do riegoen pequefia escala y medidas para aumentar Is productividad de los cultivos msimportantes para los pobres. Otts medidas desdnadas a reducir ls pobreza no sorelacionan con la agricultura. Por ejemplo, esas unidades famuliarms so beneficiaran.de oportunidades de trabajo no agrfcola. Cuart, los pobres (a difercia do losextremadamente pobres) tienen un acceso reladvamente bueno a los serviclospiblicos. Son hogaes pobres ya sea porque sus integrantes tienen trabzjos malremunerados o poco productivos en el sector privado o el sector Informal, o porqueesthn desempleados. Requieren trabaos mEs productivos para elevar sus gastos porencima del nivel de pobreza y estin relativamente blen preparados parn sprovecharlas oportunidades de empleo quo se presenten. La ejecucidn del programa dereforma econdmica y liberalizacidn del mercado de trabajo es el elemento mAsimportante para reducir la pobreza en este grupo. Quinto, los pobres sebeneficiarfan si disminuyeso el precio del trigo, el arroz y el az4car. Asimismo, severfan favorecidos si se eliminara la prohibicion de importar ropa de segtnda manoy se rebajaran los preclos de los detergentes y el jabda. Per Iltmo, el Gobler=odebe reconsiderar el sistema do sobretasas que se aplica a los productos agrfcolas.Con la excepcidn de los productos licteos, el sistema ya sea perjudica a los pobres(azdcar, arroz y productos derivados del trigo) o beneficia a los agricultores quogozan de mejor situacidn (malz amarllo y sorgo).
14. Los servicios sociales pueden desempeflar una importante doblefuncidn en el alivio de la pobreza. Primero, las mejoras en las esferas de la salud,nutci6n y educacion abordan directamente las peores consecuencias de ser pobre.Segundo, existen abundantes pruebas de que la inversi6n en capital humano,especiaWmente en educacion, permite atacar una de las causa is Importn de lapobreza. Los programas que tienen mayores repercusiones sobre los pobres son losde educaci6n primaria y atencido bsica de la salud.
15. En materia educacional, la matrtcula on la ensefaiaza primarla haumeontado en forma impresionante en el Perd. Sin embargo, esto incremento estuvo
acompafiado con una disminuci6n de los gastos por alumno y un exodo deprofesores titulados del sistema. La eficiencia intna es baja. Los porcentajes derepitentes son altos, particularmente en los primeros grados. Los alumnos pasan, enpromedio, 1,3 afios en cada curso, por lo que en sexto grado casi tres cuartas partesdo los estudiantes estEn por sobre la edad debida. En promedio, por cada alumnoque egresa, el sistema gasta recursos equivalentes a 8,4 afios de escolaridad, esdecir, 40% mis que lo que serfa necesario si no hubiese repitetes ni desercidnescolar prematra. Un problema es la mala calidad de la educacion preescolar.Ademnis, existen marcadas discrepancias en cuanto a los logros educacionales y laeficiencia a traves del pafs. La falta de materiales y las malas tdncas pedagdgicasconstltuyen un problema particular en las escuelas de enseftanza smultnea de variosgrados en las zonas rurales. Otro aspecto que preocupa es la persistencia do unatasa rlativamente alta de anaifabtismo, ya quo so ha progresado poco en SUsrradicacitn on las zonas rurales y entre las mujerm. Como consecuencia, elndmero de analfabetos aumento en 1,5% entre 1980 y 1986.
16. En la esfera de la salud, a pesar de la expansion de la infraestructurapara la atencidn primaria, el Perd registra algunos de los peores indicadores delcontinente, particularmente en las zonas rurales. Las tasas de mortalidad materna yde nifios menores de un aflo se cuentan entre las mas altas de America Latina, enespecial en la poblacidn pobre. Podrtan resolverse muchos problemas de salud si seconcentraran mayores esfuerzos en la atencidn primaria. No se materializan todoslos beneflcios del sistema de establecimientos de atencidn primaria debido a laInsuficiencia de equipo, la mala distribucion del personal y la escasa proporci6n derecumsos que se destinan a los programas. En general, la cobertura no es adecuada,tampoco la intensidad y calidad de los servicios. Lc composicidn de especialidadesno es la optima, principalmente porque la relacion enfermneras/m6dico yenfermeras/poblacion es demasiado baja. Asimismo, existen datos inquietantesrelativos a la escasa utilizacion de los servicios de atenci6n primaria de salud. Esprobable que tal situacion se deba en gran medida a la falta de una oferta efectiva.En parte, la explicacidn puede estar en que los usuarios le atribuyen un valorlimitado a tales servicios debido a personal no bien preparado a la falta de equipo,suministros y otros en los establecimientos de salud.
17. En lo que respecta a la nutricion, el Perd registra tasas relativamentealtas de malnutrici6n infantil e insuficiencia ponderal del recien nacido. En general,la seguridad alimeonaria para los mis pobres ha disminuido. El importante aumentode la incidencia de enfermedades diarreicas agudas e infecciones respiratorias agudastambien revela un mayor deterioro de las condiciones de vida, menor eficacia do lasmedidas de salud preventiva y un estado nutricional de la poblaci6n cada vez masvulnerable. En algunas zonas del pafs se observa una deficiencia de micronutrientes.Segdn una encuesta nacional realizada en el perfodo 1986187, se estima que el bocioes una endemia en el 88% de las comunidades de la sierra y la selva. Estudios enpequefia escala indican que la anemia constituye un problema de salud pdblica en lasmujeres embarazadas y en perfodo de lactancia, y en los niflos. La respuesta a lanalnutrici6n se ha basado en medida excesiva en la asistencia alimentria,
prestdndose poca atenci6n a la adopci6n de medidas sanitarias complementarias, lasuplementaci6n de micronutrientes y la promoci6n de mejores prkticas sanitarias ynutricionales, incluida la lactancia materna y la vigilancia del crecimiento ydesarrollo infantil. Los objetivos del Programa de crecimiento y desarrollo in&ndldel Ministerio de Salud son amplios y bien findamentados, no asf el presupuesto nilas actividades para lograrlos. Tambidn existen problemas de mala coordinaci6nentre los numerosos organismos que actian en el campo de la nutricidn, falta de unmarco global para las intervenciones en esta materia, ausencia de normas ydirectrices y deficiencia de la vigilancia nutricional.
18. LC6mo usan los pobres los servicios sociales en el Perd? La pobrezaincide en la asistencia escolar en dos formas. Primoro, los nifios de las familiaspobres comienzan a asistir a la escuela a una edad mis tardfa quo los de las familiasno pobres; segundo, una mayor proporci6n de niflos de las famulias mfis pobresmuca asiste a la escuela o abandona los estudios po. Uno de losfactores que influye en los porcentajes relativamente altos de repitentes provonientesde las unidades familiares mas pobres es la baja asistencia a las guarderfas infantiles.Las tasas de asistencia de las niflas son mAs bajas que las de los niflos en lapoblaci6n extremadamente pobre y en todas las unidades familiares de la sierrarural.

19. En un programa para alivlar la pobreza, la primera prioridad enmateria de educaci6n es aumentar la eficiencia intema de las escuelas de las zonaspobres. El mejoramiento de las condiciones en las escuelas rurales do enseffanzsimultdnea de varios grados beneficiarfa de manera especW a los pobres. Ensegundo lugar, mediante un programa de entrega de libros de texto y materialesdidicticos y de formacifn de profesores es posible mejorar la calidad de laensefianza en otros tipos de escuelas en las zonas rurales, aumentar el tiempo quo losalumnos dedican a tareas escolares y ofrecerles experienclas de aprendizaje mispertinentes. En tercer tdrmino, es preciso hacer mis biucpid en la educaci6npreescolar. Deben tomarse medidas para mejorar la preparacidn de los niflos para laescuela en las guardertas infatiles estatales y del Programa No Escolarzado doEducacion Inicial (PRONOEI) y fomentar una mayor conciencia entre los pobres dela importancia de la educaci6n preescolar. Un ostrategia para atraer a alumnos mnspobres serfa ofrecer programas de alimentacidn en eate nivel en alganas localidades.En cuarto lugar, como parte do los esfuerzos por aliviar la pobreza se deberfa contarcon un programa para impartir lnstruccidn funclonal a las mujeres que no hablanespaflol, con inclusi6n de la slfabetlzacidn. Los programas dirigidos a reducir elanafabetismo en este grupo deben considerar que estas personas estin muy dispersasy quo, en consecuencia, resulta diffcil llegar a ellas, y tambien que su tiempo librees mfnimo. La experiencia recogida en otros passes sugiere recurrir a las ONG.Estas organizaciones tienen la capacidad para Ilegar a zonas marginaas e incorporarprogramas de alfabetizaci6n en sus actividades pemanentes, lo quo permite reducirlos costos.
20. En materia de salud, la cobertura de vacunacin para los nifios esreducida, particularmente entre los pobres y en la sierra rural. En general,aIrededor de la mitad de las personas que se encuentran enformas solicitan atencidmEdica. Entre los extremadamente pobres, esta cifra disminuye a alrededor de unade cada tres. La brecha entre los pobres y los no pobres es especimente grande enla sierra. ,A ddnde suelen recurrir los pobres cuando se enferman y a quien suelenconsultar? En comparrcidn con los no pobres, existen mis probabiidades de quolos pobres recurran a los centros y postas de salud, al igual que a las fmacias. Sinembargo, la proporcidn mis alta de los pobres (30%) recurre a los hospitales. Esmis probable que los pobres consulten a personal paramedico, rmactcos ycuranderos tradicionales que el resto de la poblacidn. Pero a lo largo de todos losniveles de gasto, la fuente principal de consultas medicas son los profesionales de lasalud. Hay menos probabilidades de que las personas pertenecientes a unidadesfamiliares extremadamente pobres adquieran medicamentos, particularmente en lasierra. La falta de acceso a un sistema pdblico de alcantariliado estL aamenterelacionada con los problemas de diarrea en los niflos. Si bien s6lo el 17% de lasunidades famfliares carecen de alcantarillado, reprentan el 35% de los casos dediarrea infantil.
21. Los programas dirigidob a los pobres deberfan concentrarse enproporcionar a las madres y a los niflos pequeflos una atenci6n primaria de saludadecuada. Es importante mejorar el suministro del equipo bisico, materiales ymedicamentos necesarios para llevar a cabo estas actividades, particularmente en laszonas pobres. La segunda prioridad es la prevencidn del colers y su tratamiento, yla tercera, el fortalecimiento de los servicios de urgencia de los hospitales.

22. Incluso si so mejoraran los servicios sociales, en el corto plazo esposible que algunos grupos sigan siendo vulnerables debido a que ya viven encondiciones extremas -por ejemplo, las unidades famillars en las que no hayttabajadores empleados, o las encabozadas por personas que solo pueden encontrartrabajos poco productivos en el servicio domestico o la agricultura. Para estaspersonas, la existencia de programas de compensacion sociales blen concebidospodrfa complementar los dos elementos principales de la estrategia para el alivio dela pobreza -promocidn de un crecimiento de base amplia y mejoramiento ydistribucidn mgs equitativa de los servicios sociales.
23. Los programas de empleo pueden reducir la pobreza al proporcionartrabajo (y, por lo tanto, ingresos) a los necesitados, y generar beneficios adicionalesa traves del mantenimiento y creacidn de infraestructura. Estos programas puedenser eficientes y de costo mfnimo porque las personas estan dispuestas a trabajar porun salario relativamente bajo. Su efecto en la pobreza sera mayor si las unidadesfbmiliares cuyos jefes de hogar se encuentran desempleados pertenecen en mayormedida a grupos de poblacidn pobre quo a otros grupos, y si con el proyecto semejora la in aestuctura o las instalaciones que utilizan los pobres. En el Perd,alrededor do dos torcios de los jefes de hogar que se encuentran sin empleo sonpobres, y el 30% son extremadamento pobres. Sin embargo, las unidades familiaresencabezadas por una persona desempleada representan una pequefla proporcidn deios pobres, por lo general entre el 3% y el 4%. En el litoral urbano y en la sierra,la proporcion de poblacidn extremadamente pobre es algo superior -entre el 6% y el8%. Es importante que estos programas sean eficientes en funci6n de los costos.Las personas empleadas en el marco de un programa de empleo temporal deben serpobres. Esto se puede lograr mas facilmente si la escala de salarios se fija en unvalor suflcientemente bajo para quo las personas que tienen alternativas de mejorsalario (y mayor productividad) no se sientan tentadas a dejarlas. La escaa desalarios asegura una autoseleccidn automatica. La escala promedio que serecomienda para un programa de empleo de emergencia en el Perd es el sueldom&imo legal. Otra cactftica de diseffo de un programa de este tipo queoimentarfa la eficiencia en funcion de los costos serfs la seleccion y administrad6n
de los proyectos impulsadas por la demanda local.
24. Las unidades familiares pobres gastan, en promedio, dos tercios desus ingresos en alimentaci6n, y las de la sierra rural, tres cuartas partes por eseconcepto. En consecuencia, la proteccion de la seguridad alimentaria de los pobreses una forma ii de proteger los niveles de vida. La asistencia alimentaria tambienpuede proteger el estado nutricional de ciertos grupos vulnerables, como las mujeresembarazadas y en perfodo de lactancia, los nifios pequeflos y los enfermos yancianos. La asistencia alimentaria constituye un recrso importante para lossectores sociales. En 1991 la asistencia alimentaria de los donantes alcanz6 por lomenos a US$150 millones. A traves de programas de este tipo se proporcionaronmas de 226.000 toneladas metricas de alimentos a por lo menos 9 millones debeneflciarios. La asistencia alimentaria para los pobres de las zonas urbanas esamplia e importante en Lima. Las transferencias en efectivo y bienes (incluida laasistencia alimentaria) provenientes de organizaciones sin flnes de lucro representanla cuarta parte de los gastos totales en todas las unidades famiiares epobres, y casi el 10% de los gastos en todos los hogares pobres de Lima. Sinembargo, en otras zonas estas transferencias representan un porcentaje insignificante

de los gastos de las unidades fanilares de los pobres. El hecho que la asistenchaalimentaria no llegue a los pobres rurales indica quo deberfan explorarse otrosmecanismos, como la distribuci6a de cupones para alimentos. La asistenciaalimentaria parece ostar relativamonte bien focalizada en los pobres de Lima; entrelos no pobres, s6lo so benoicia el 6,5%. en comparacifn con et 75% de lasunidades familare a pobres y casi el 40% de los pobres. En otaszonas, sin embargo, mis del 40% de los beneficaros no son pobres.
25. Los grupos mis vwlnerables desdo el punto de vista nutriclonatl sonlas mujeres embaazadas y en pertodo de lactancia, y los nifios en edad preescolar,paticularmente los menores de dos aflos. La cobertura de los programas deasistencia alimentaia directa para las madres y los niflos parece ser adecuada en laszonas urbanas, pero debido a los bajos niveles de asistencia quo so brinda a lamayorfa de los beneficiarios y a la fadta do actividades complementarias depromocion iutriclonal y cuidado de la salud, es improbable que tales programastengan un efecto significativo en el estado nutricional de la poblacidn. Ademis, lasraciones para los beneficiarios no so basan en un conocimiento de los deficit denutientes obsarvados on los participantes. La cobertura de los programas deasistencia alimentaria entre los pacientes con enfermedades crdnicas, especialmentotuberculosis, es insuficiente y so precisa aumentada. La cobertura del programa deainerntcin escolar deborfa concentrarse en un grupo mis poquefio de nifios ydeberfa incrementarse la asistencia a niveles que tengan un efecto positivo en elausentismo y la desorck$n.
26. Dos cesdones que surgen en la aplicaci6n de la estrategia para elalivio de la pobreza son la focallzacln y los arreglos institucionales. Lafocalizaci6n procura dsitbuir las transferoncias u otros beneficios solamento aquienes han sido ideAtcados como el grupo beneficiario en interis de la eficiencia.Los costos do opevaift del sistoma administrativo no deben ser tan elevados, demanera que no absobno el ahorro quo representa la exclusidn de los no necesitdos.En el Peri, el factor georico es el indicador de mayor valor como mecanismopan el enfoque selectivo, Al dirigir rocursos a la sierra rural, se puede llegar a unade cada dos unidades famuliares extrmadamente pobres del pafs.
27. Algunas caracstleas s erchamento relacionadas con la pobrezaindican los tipos de sseadcia que beneflciarfan principalmente a sj- pobres. Casitodas las unidades fmliares que consumen agua de pozo son pobres. Entre otrascancterticas en materia de vivienda estrechamente relacionadas con la pobrezafiguran el uso de letrinas y la ausencia de electricidad o instalaciones d saneamieonen los hogares.
28. El Perd parece set un entorno apropiado parm el establecimiento deun fondo de inversidn social. La experiencia en materia de fondos sociales en otrospafss indica quo su eficacia depende principalmente do le capacidad pan seleccionarlos proyectos adecudos, lo cual depende a su vez de la calidad del personal y soindependencia de las presiones polfticas. En agosto de 1991 el Gobierno pernoestablecid un fondo de lnversidn social, el Fondo Nacional de Co cin yDesarrollo (FONCODES). Los avances para poner en marcha el FONCODES hansido lentos y, al principio, la confzsifn reinante sobre la forma en quo operarfa(*impulsado por la demanda' o 'de arria abajo") af%ct adversamente la calidad de

algunos proyectos. Sin embargo, su desempeflo comenzo a mejorar a mediados de1992.
29. El Fondo de Compensacidn Regional -quo opera en el marco delpresupuesto del Perd- tiene la posibilidad de contribuir a la formulacils de unaestrategia para aliviar la pobreza. Sin embargo, actualmente no se estu baciendoningdn esfuerzo por dirigir mas recursos hacia las zonas mas pobres. Solo oafactible y significativo un cambio en la formula utilizada para la asignacion deolosrecursos si aumentaran las recaudaciones impositivas y existiera una mayorestabilizaci6n fiscal.
30. La magnitud y gravedad de la pobreza en el Perd exige laparticipacido actfva de todos los recursos, incluidas las ONG. Estas organizacionestienen varias ventajas. Estifn en condiciones de movilizar y utlizar elevados nivalesde recursos, y ademas pueden Ilegar eflcazmente a las poblaciones marginadas. LasONG constituyen una instancia importante para la promocidn de las metas yprogramas do alivio de la pobreza. En el Perd existen numerosas ONG, que cubrendiferontes campos y zonas del pafs.
31. Las ONG tambien tienen algunos puntos debiles. Suelen setvulnerables a la influencia de los donantes y tienen dificultades para formularpropuestas en materia de polfticas. La colaboracion con el Gobierno se ve limitadapor algunos obstculos reales y otros que se perciben. La dispersio& de lasresponsabilidades del Gobierno en una amplia gama de organismos estatales dificultala entrada de las ONG. Asimismo, existen diferencias relativas a la gestion y lascapacidades admihistratlvas de las distintas ONG. Algunos organismos estatales lasven como competidores en vez de posibles organismos de ejecuci6n. Ladesconfianza obstaculiza la colaboracidn. El Gobierno deber(a establecermecanismos claros y eficientes para la colaboracidn con las ONG. La recienteformaci6n de consorcios de ONG constituye un mecanismo que deberia explorarse afin de alentar una mejor coordinaci6n, dialogo y planificaci6n conjunta con elGobierno.
32. Recientemente el Gobierno elaboro una estrategia para el alivio de lapobreza cuya finalidad era fijar las prioridades de un programa de alivio de lapobreza en el Perd. En general, concuerda con las conclusiones y recomendacionesdel anS1isis que se efectia en este informe y reconoce que para lograr dicho alivio,se requiere esencialmente una estrategia econ6mica con el objetivo de mejorar lascondiciones en que viven los grupos exremadamente pobres mediante progrms deayuda alimentaria, salud, educaci6n y generacidn de empleo.
33. Existen dos fuentes de financiamiento para estas medidas tendientes aaliviar la pobreza: el Estado y los donantes. A fin de atraer suficientes recursosprovenientes de los donantes, el Gobierno debe demostrar claramente su propiocompromiso con el alivio de la pobreza. Se estima quo en 1990 el gasto pidblicototal en salud y educacion en el Perd alcanzd tan solo al 2,2% del producto internobruo (PIB). A medida que la reforma tributaria y las medidas que se adopten panfortalecer la administracion tributaria mejoren la generacion de ingresos, serecomienda que el Gobierno haga esfuerzos por incrementar los recursos que seasignen a los sectores de salud y educacidn. El gasto en educacion y salud de
altedodr dd 4% de PIB ocrresponde a& promedio do AmEica LAdt y aspoxmel nivel que so gast6 en el Perd en la primea mdtd ded deeao de197,0. , -
34. El Gobierno del PFrd ha dado un paso hmpo_ pra reducir bpoboa ae d pus. A mediano y largo plaz so roequl us crecido do baempoi pia alivW los devados uveles de pobrea. Es as d objotv det program.do stabizada y eusto. Sin embago, esto no es suf,lonto_ a cOrOfplazo., Es prso adwopw medidas pam proteger a los gi vulnl y arquo los pobm pueda aprovecar las mayom p s quo so presoan ean aocomfa refouada A fin de abordar ess ditinm nec s, and pel st.
infoms so ha eumlmado. d perlil de los pobres del Pord y o ha recomendabalunas polfca prHoria y programas dirigidos a elios. El Gobeo ya ha dadoupaso bilW m ta e ate. La estrategia par d alivio do pobrm a own may priados clam y apropiadas en el marco do a ap lia do poliaecoicas quo mantengan la estabilidad macroonimica y promuv dar mkoi . El desafo -y a prueba- respecto del grado de deds del Goblenosad b m_da an quo las polftlcas y programas Mos so rijan pot em st.ategLLes roset. avances en FONCODES son alentadores. Peo para asuWar quo losobres oa torecibon los beneficios del aj, d Goble. ha do Italecer los
servidos sodaes mIS fdamenales para ellos y proporcdor eWd do proteoddm;is ecaces pa los gupos mis vulnerables del pals.

PUU: Couponentes del sector sodal pas una strategade allio do Il pobroa
CuAdNo mrnes
Ed~wd6
Bajas ta de asistoncia Ofiecer programas de Proyeto de mdormletoescolar de los nifiOs allimentaci6n eolar an di la alinueacd escolar
pobres, on particular en la es zonassierra, rura Proyecto sobre esceas de
enheflaa sbnuld a dewio gaduos
Alto porcentaje de Aumentar la eflciencia Proyecto sobre escuas de
repitne, en particular de interna de las escuelas de enhela sbnulrdea de
los alumnos pobm y en las zonas ruraes, en wveos gradoslas zonas rures paricular mediante di
mejorarmiento de las Proyecto de entrega decondiciones an las escuelas libros de exorurales de e_nsenzasimultAnea de variosgrados. Entrega de librosde texto y materiesdidacicos, y formacodn deprofosoro orientada a lasnecesldades de est. tipo deescuelas y otras ubicadasen zonas ubas y ursiesmaginales pobres
Mejorar la calidad y la Proyecto de mejorwmuemoasistncia escolar en el de los senicos deprograma preescolar. educacidn preescolrMejorar la preparacidnpara la escuela de los nifios'ue asisten a las guarderfasinfantiles estales y delPRONOEI
Persitncia de una alta Respaldar un programs en Proyecto de aWabtadci6n
tasa de analfabetsmo entre que se les imparta y capatacIdn laborallas mujeres que no hablan instuccidn funcionalespaflol bisica, apoygndose en las
ONG

Satbd
Maa caldad do b atmici PWporcionar inmnizacdaa lts grupos vulnoables - antltiet ca prenatal ymadim y nis-, suplemento de bierto,especlm on tdmlnos vlgHlar el aumento de peso,dd uemro de contatos y proporcionar suplementos
atimentlclos, si esneces_rio, ast comopersonal calificado paraatender los partos de altoriesgo. Caaitar apauerm para los partos debajo ricsgo
Aumentar la cobertura y Program de caudemo yfrecuoecna de la vigilancia desawolo aUMdc crecimleato an la bae (Mnr de Suod)
paicularmento de losnibos menores do dos alos
Escasa cobertwa de So deben hacmr esfueros Poam de acroimo yvacenac6n doe los nifuos pama aumntr la cobertuma da imonm do dos aft, y de vacunacidn de los nifbs (Mini_b d Salud)diminucida do ats menores de un abo en los
establecimientos de satud
Eca cobenura do los Foralecer la instruccidn enpgams do pbaflcacldn materia de planificacionde la fmilia familiar y aumentar el
acceso a mtodosanticonceptivos
Escasa utflizacidn de los Rehabilitar las instalaciones Proyct de moservicios do atenkn deterloradas y mejorar el de la a pww pilmaua eprimaria de la salud por los =ministro de equipo mm de ecm poabrapobres, partcuarntu an bEsico y medicamentos eanla siena los establecimientos de
salud

Mala distrlbucidn do los Examinar las cuestiones Proyecto derecursos profesionales. No relativas a la gestidn e pe*fccIoniveato de losso cuenta con suficientes incentivos para el personal. recursos hwnaos en zonasprofesiorales de la salud en Mejorar las condiciones de de exma pobrezalas rgiones menos alojamiento del personal dedesarlladas y son los establecimientos deinsuflclentes los que atencidn prinaria de latrabaJan on servicios de saludatencift ptimaria de lasaud. No hay suficiente Promover un mayor uso depersonal de enfermerfa los recursos locales
mediante la capacitacidn depersonas no profesionales,por ejemplo
Dado que las unidades Promover la construccion Proyecto de revncin delfamiliares pobres tienen de redes de abastecimiento C6lera y otasmenos acceso a redes de agua y saneamiento de eqfermedades taWpdblicas de agua y bajo costo. En los lugares por el aguaalcantarillado, sus nifios donde no existanestin mis expuestos a instalaciones desufrir diarrea saneamierto, deberfan
construirse letrinas
El cd6era es un grave, Reforzar las campahas Proyecto de prevencidn deproble de salud quo educativas, asegurar la cdera y otrasafecta principalmente a los disponibilidad de efemedes srnpobres suministros para el por el agua
ratamiento de casosagudos, y rehabilitar lasredes de agua e instalarletrinas
En algunas zonas, una Reforzar los servicios de Proyecto sobre servcios deproporcidn importante de urgencia de los hospitales urgencla en zonas delos pobres utiliza los de las zonas pobres exrmna pobrezaservicios hospitalarios
Nutrli6n
Ausencia de normas y El Gobierno deberfa crearpautas relativas a las normas relativas a tresinbervenciones en materia esferas fundamentales yde nutrici6n vigilar su cumplimiento:
i) costo unitario de lasintervenciones; ii) practicasde programacidn de laasistencia alimentaria, yiii) recopilacidn deinformacidn y evaluaci6nde las repercusiones

Ningln organismo del El Gobierno debedaGobior tiene la oncomendar esa fimcidn alresponsabiidad do Ministerio do Saludmovlizar recursos
Carencia de un sistew de Deberfa vigilarse a unavigilancia nutricional a pequefla poblacidnnivel nacional centinela do reprentates
de importadtes gNpOS debeneficiarios
La inexistencia de un El Gobleo deberfamarco para las implomentar el plan dointervenciones en materia nutricidnnuricional conduce a laduplicaci6n de funciones,al descuido en lograrinportantes mejoras en elestado nutricional de lapoblacidn y a unautiflizacidn menos quedptma de los recursos
Curva de crecimiento Se deberfa iniciar una Programa de crecimiento yinadecuada de los niilos campafia de informaci6n, desarrollo infantilduranto el perfodo de educacion y comunicacin (Ministerio de Salud)destete destinada a fomentar el uso
de tEcuicas de desteteapropiadas
El bocio es una endemia en El Gobierno deberfa Programa Nacional deel 88% de las comunidades subvencionar el aumento Control del Bocio yde la sierra y la selva. La de los costos de produccion Cretinismo Endemicosanemia tambiEn representa de la sal yodada y (PRONABCE)un problema de salud comprometer pequeflaspdblica, al igual que la plantas de produccion quoavitaminosis A comercialicen sal
proveniento de fuentesnaturales
Suplemento de hierro paralas embarazadas;distribucidn semestral devitamina A tiara los nifios

Asistuidaaimentarla
Los programs de El Goblerno deberfa Vaso do Laboasistencla allimentaia no esudiar mecnismosRlegan a Importantes grupos alternatlvos pas legar ade beneficiaros pobres, en esos grupos, Como laparticular unidades distrlbucldn de cuponesfamiliares en la sierma rur para alimemos, o Introduclrdonde la seguidad un programa piloto.alimentadia ba disminuido. Debrfa mejorarso laAsimisrno, la mayor calidad de laproporci6n do beneficialos adm cion y deldel programa Vaso de control del programs VasoLeche son nifios en edad de Lecheescolar. Casi el 20% desus benefclcarlos no son Se deberfa ampliar lapobres asistencia alimentaria a las
madres y los ufios Programa do AlimenacknAlgunos productos bEsicos y Nutricifn a la Familia dode los programas de Alto Riesgo (PANFAR)asistencia alimentaria no Como productos basicos soson las fuentes de deberfan seleccionar lasnutrientes mL econdmicas; fuentes de nutriene mEspor ejemplo, la lecbe en el economicas que seanprograms Vaso de Lsche aceptables para los
beneficiarlos. Asimismose deberfan fortificar conhierro los alimentosbasicos utilizados en losprogramas de asistencia
Es probable que los efectos Las raciones para losde la asistencia alimentaria beneficiaiios debedanen el estado nutricional de basarse en un conomieotolos beneficiarios sean de los deflcit de nutrientosinsignificantes que se observan en los
participantes
La asistencia alimentariadebe ir acompaflda demedidas educathvas PANFARcomplementarias onmateria de salud ynutricidn, incluida lalactancia maten y lavigilancia del crecimiewo ydesarrollo de los niflos

La Escuela Dofendo La El programa deberda ostam La Bascula Defindo LaVia no llega a la ditigido a nifios de 14 Vidapoblacid mds pobre y grado bAo y a los do lasvUlnerbleS, y au efecto n oZas pobres, on Yez domaterla nutricional as concent0a on Lima.minlmo Deberfa asegurar la
continuldad de laalimhntacidn
Programa de emploo
Cdmo asegurar quo el El programa deberla FONCODESprograma llegue a los ftrmularse de manera quopobres, al tiempo quo logro foment. la autoseleccionlos objetivos de alivio de la por los pobres. Si bienpobreza con un mfnimo de con una cantidad inferior alcostos administrativos salario mfnimo se
mejorara 01 ofroquesectivoe e11o tendrfaalgunas desveotajas. Esposible que no so logrenlos objetivos en materia dealivio de la pobroza, y sedesalnarf la partlcipacionde coutratists privados.Por estas razones, sedeberfa ofrocer ol salariomfnimo. TambiEn sedeborfa considerar unaseleccion geogrica de losbeneflciarios
Adniinistrac6n de los Utilizacion de conratistas FONCODESprogramas de empleo privados impulsada por la
demanda, y promocion dedicho uso
* Los tlos que aparecen en bastala se refieren a peSifes de proyectosgubernamenales. Los tAdos en mpresidn normal corresponden a progrnmas enmarcha del Goblerno.

1
From Economic and Social Crisis to Reform
Introductdoi its divetsified and hatd-working labor force, abroad endowment of natural resources and dy-
1.1 Poverty is a long-standing problem in namic export performance.' This potential, how-Peru. During the last twenty years a higher inci- ever, was frustrated during three decades of heavydence of poverty has persisted there relative to Government intervention in economic activitymost of its neighbors in the region. The reasons for which resulted in a legal stmcture and policy envi-Peru's lack of success in reducing poverty are ronment inimical to growth. The overexpansion ofmany. But without doubt the dominant on4 is the the state through a growing number of public en-
dismal perfotmance of the economy over an ex- terprises anu administrative and regulatory bodiestended period. However, in August 1990, the ad- led to a waste of resources. Because of the lack ofministration of President Fujinori initiated a major sufficient growth and rigid, closed markets, fewstabilization and adjustment program. To date its groups had access to the means to improve theirimplementation and the broadening of economic livelihood. For the vast majority, economic oppor-reforms have been impressive. The starting point tunities were few and living conditions either stag-of a strategy to alleviate poverty in Peru is the ex- nated or deteriorated.ecution of these economic reforms since interna-tional experience shows that the first prong of ef- 1.3 Public policies seriously distorted most offective and sustainable poverty reduction for any the markets in the economy. Trade policy relied oncountry is the promotion of broad-based growth, import-substitution with very high tariffs andparticularly development which provides opportu- many non-tariff barriers, depriving the country ofnities for the poor to use their labor. This chapter the benefits of concentrating on its comparativebriefly discusses some of the main factors behind advantage. Although progress was made in thethe poor economic performance of Pem and its re- early 1980's in liberalizing trade, the reform leftflection in social conditions. It then highlights the many tariff exemptions in place. Moreover, it was
main elements of the reform program, focusing on not sustained. Expansionary fiscal and monetarythose aspects which would be expected to contrib- policies, combined with a deteriorating terms ofute most to poverty reduction.
1. This and the following section draw on Peru - Economic and
Economic Stagation Sector Reform to Sustain Stabilization and Lay the Foundationfor Development. Green Cover Report (No. 10361-PE, February1992), and the President's Reports for the Trade Policy Reform
1.2 In the 1960s, Peru was one of the most (No. P-5666-PE, January 1992) and the Structural Adjustment
prnising economies in Latin America because of (No. P-5714-PE. March 1992) Loans.
1

tade, and an appreciating real exchange rate led to basic wages. They included social security andlatge curent account deficits Financing the defi- other payments (21 percent), vacations (10 per-cits through external borrowing becme increas- cent), bonuses (20 percent), profit sharing (4 per-ingly difficult. Instead of adjusting to these shocks cent), and payment to trust funds for years of ser-by letting the exchange rate depreciate, the Gov- vice and "labor stability" (17 percent). These ben-erment chose to impose trade controls Reversal efits significantly increased labor costs and de-of the earlier libealization began in 1982 and, by terred employment without improving workers'1984, tariffs were inceased and many imports incomes. Real wages fell after 1970 and an in-once more required licenses. creasing share of the labor force became unem-
ployed or joined the informal sector. Over the1.4 The tax code became complex and full of three years since 1987 the minimum wage hasloopholes and tax administration was ineffective fallen to 44 percent of its 1987 value and the aver-and evasion high. Extensive tax incentives also re- age salary and wage to roughy 30 percent of theirduced revenues. These factors caused the tax sys- value at the same time. A longer comparisontem to lose its buoyancy. Over the period 1976-89 shows an even greater decline. The minimumno revenue from any tax increased pai-passu with wage in 1990 was little more than one-fifth of itsincome. As a result, tax revenues dropped from 16 value, measured in real terms, in 1970; the averagepercent of GDP in 1980 to 14 percent in 1985 and salary was less than one-fifth of its 1975 value;to 9 percent in 1988. In other countries at a similar while the average wage had fallen to less tan one-stae of development (i.e., per capita income quarter of its 1975 amount. These declines arearound $1,200), the average ratio of tax revenues measured in the formal sector. At the same time,to GDP is 17 percent. Declning tax receipts con- the formal labor market which complies with thetnibuted to the deterioration of fiscal performance labor regulations shrank drastically. It is estimatedand reduced the resources available for operating, that only 778,000 workers, or about 10 percent ofmaintaining, and investg in essential public ser- the labor supply, are wholly protected by the lawsvices such as health and education. (1990). The limited formal sector employment re-
flects the higher cost of labor, which not only has1.5 Even policies and programs established to encouraged the substitution of capital for labor, butimprove conditions for workers and farmers has reduced the competitiveness of formal sectorproved to be detimental to those groups and to the firms and prompted their shift into the informaleconomy. Job swurity in the formal sector was sector. Between 1961 and 1988 the share of the la-constitutionally protected, and strictly enforced. bor force working in the informal sector rose fromWorkers became entitled to labor stability subse- 15 percent to 22 percent, while the share workung inquent to a probationary period of only three the prnvate sector fell from 36 percent to 25 percetmonths. A worker who was laid off could seek le-gal redress and, if successful, could choose either 1.6 In the case of farmers, the land reform into be reinstated or to receive severance pay. Judge- the early 1970s severely restricted the marketabil-ments were rarely made in favor of employers be- ity of land, including its use as collateral, and madecause the definition of "just cause' for laying off a land tenure more uncertain when collective plotsworker was ambiguous and difficult to prove and were parceled out. In addition, the import-substitu-the clim subject to verification by the Ministry of tion trade policy contributed to the persistent dete-Labor. The Labor Tribunal Courts created further rioration of the agricultural terms of trade as a re-problems because they were autonomous entities, sult of high trade barriers for industrial products,separate from the Peruvian court system, and un- chronic overvaluation of the currency and dis-der the strong influence of the Labor Ministry. criminatory tariff exemptions and multiple ex-Firms also needed "Ne authorization of the Labor change rates. Also, agricultural services were inef-Minisry to suspend, dismiss, or lay-off workers or fective and several large scale public agriculturaleven to redace working days or production shifts. investments were unproductive. The GovernmentFringe benefits, either legally required or custom- altempted to offset these disadvantages throughary in the formal sector, added about 70 percent to maive subsidies provided through the grain trad-
2

TABLE 1.1 PERU: PERFORMANCE INDICATORS OF TIE ECONOMY
REALR8AL GDP WVEStMENT AGRICULTURE INFIATION REAL WAGEGROWTH PRODUCTIVrYf GDP GROWTH RATE OROWTIH
1968-1977 39 0.175 1.6 16.6 0.6
1978-1982 2.6 0.097 1.6 64.9 .03
1983-1990 -2.0 .0.001 0.7 1397.8 .6.1
1. Ratio of GDP growth and investment to GDP. Units of real GDP incroase per additional unit of real investment. A
decreaing trend measm a lower productivity, that is a less efficient use, of capital.
Source: Peru - Economic and Sector Reforms to Sustain Stabilia*tion and Lay the Foundation for Development, Green
Cover Report, (No. 10301-PE, Februy 1992).
ing companies and the Banco Agrario. However, prises play an important role in the economy and
administrative inefficiency and operating costs their poor performance is a major cause of thewere high and medium and large-scale fatmers in country's disappointing economic and financial
the better off coastal areas received the bulk of the recod.subsidies. These policies failed to promote agdcul-tural growth. From 1970 to 1990 agriculture grew 1.8 Mainly as a result of these bad policiesat only half the rate of population providing little and the overexpansion of the state, the perfor-
opporunity for an improvement in rural incomes. mance of the Peruvian economy after the 1960's
In particular, production has stagnated for the pfn- was poor. The growth of output slowed so that by
cipal crops grown in the sierra - potatoes, wheat the late 1970's and into the 1980's it was well be-and white corn. The policies also contributed to a low the rate of increase of the population. Invest-worsening of poverty. Better off frners were the ment productivity dropped steadily and inflation-ones who received the subsidy. The poorest farm- ary pressures mounted (Fable 1.1).ers, however, paid a net tax because they sufferedthe consequences of the worsening of the agricul- Eoonomnk Crisistural terms of trade, but did not have access tocredit, water and pricing subsidies. 2 1.9 President Garcia's explanation of chronic
inflation and low growth was that Peru was in a
1.7 Domestic regulatory policies provided "debt trap": servicing the external debt would ac-special privileges to incumbents. The proliferation celerate devaluation and inflation, erode domesticof public institutions over the last two decades was savings, and curtail investment. Consequently, hisaccompanied by a sustained increase in public em- admiisraton (1985-90) put a ceiling on foreignployment. In Pem today the public sector employs debt service of 10 percent of the value of exports,
around 1.3 million people, dmost half of the non- and later stopped payments altogether. It institutedagricultural formal labor force. The number of widespread foreign exchange controls on the cur-
public enterprises rose from 30 in 1968 to over 180 rent and capital accounts, with multiple exchangein the late 1970s, and today is 133. These enter- rates which were frequently changed. Protec-
tion was also strengthened. By late 1987 foreign
2. Foradiscssoanofthepgiumactrofagiutand exchange allocations were being used to controlan analysi of reent msfae er u - Agiultm Polcies for aU imports. A host of non-tariff barriers - importEcnmiccincyq, (No. 10605-PBS),Setmber1992. monopolies, minimum-domestic-content rules,
3

and bans on second-hand imports, for instance - management and finances led to a decline in pro-supplemented the official negative lists. Tariffs re- duction. Relations with the international financialmained high and a variety of prefetrential schemes institutions and bilateral and commercial lenders- allowing half of imports to enter duty-fiee - were suspended because of the accumulation ofbenefitted selected sectss and firms. To offset the large arrear Ihe government had to reduce publicheavy protection offered to import-substituting ac- investment to historically low levels. Inflation con-tivities, non-traditional exports continued to enjoy tnued out of corol, further eroding tax revenues.heavy subsidies. The impact of these ptotectivepolicies was to close the Peruvian economy: by 1.11 Economic mismanagement reached a cli-1990 exports and imports were eight and seven max in 1989-90. In attempting to control inflation,percent of GDP. These policies also generated a the Garcia Administration fell into the trap of re-distorted set of incentives to the tradable-goods- current sporadic adjustments to administeredproducing sector. Effective protection rates to prices and wages followed by short-lived pncemanufacturing averaged around 80 percent by freezes and other ineffective measures, while fiscalearly 1990 and were quite variable. The complexi- and monetary imbalances kept escalating. Theties of import protection and export promotion led country's fiscal base almost vanished and mostto enormous discrimiaton and use of discretion, public sector prices and tariffs approached zero innot only between sectors but also between firms real terms. The fiscal imbalance, including Centralwithin sectors. Bank foreign exchange and financial losses, sur-
pased 10 percent of GDP in 1987 and 1988 in1.10 The Government also increased the mini- spit'e of a steady decline in Goverwment expendi-mum wage, expanded credit and subsidies, de- tures after 1985. By late July 1990 prices were in-creased the value added tax rate and lowered pub- ceasing at an annual rate close to 36,000 percent.lic sector prices. This strategy led to a high and in- Hyperinflation brought about a collapse of finan-creasing fiscal deficit, financed by money ceation. cial intermediation as shown by a fivefold increaseWhile the initial results were excellent, the in the velocity of circulation of money between"boom" proved to be uinable. After 1987 the 1987 and 1990. Crable 1.2)market lost confidence, inflation rebounded andeconomic output decined shaiply. In key sectors, 1.12 The distorted and continually changing in-such as petroleum and mining, the breakdown of centive system - with as many as 11 exchange
TABLE L2. PERU: INDICATORS OF CONOMIC CRIS
1987 1988 1989 1990
Gmwth of GP (%) 10 -7 -12 -4
inflation (%) (end of peiod) 114 1722 2775 7650
Publicsectordeficat'(%OFGDP) 11 13 8 7
oevelocf*ryofmoney2 8 16 24 42
1. Includes non-financial public setor and Central Bank sses2. xcludes dollardeominations depoit
Soure: Peru -Economic and Sco Reforms to Susta Stabilization and lay theFoundation for Deveopment, Green Cover Report (No. 10361-PE, Februy 1992).
4

TABILE 13. COMlARATVE SOCIAL INDICATORS IN SELECWED COUNTRIES
Infant Under 5 Fertiloy Primy Seconday
Pet Ca%ts Mortaity Mofality Life Rate School School
GNP RaFt Rate Expancy (Births Per Enrollment Enrollment
Coutry (US$ 1989) (Per 1,000) (Per 1,000) (Years) Women) % %
Argetina 2,160 30 36 71 2.8 110 74
Bolivia 620 106 165 54 5.9 91 37
Chile 1,770 19 27 72 2.6 102 74
Colombia 1,190 39 50 69 2.9 114 56
Dominican Republic 790 62 80 67 3.6 113 47
Ecuador 1,020 61 85 66 4.1 117 56
E Salvador 1,070 56 90 63 4.7 79 29
Guatemala 910 56 97 63 5.5 77 21
Honduras 900 66 103 64 5.3 106 32
Mexico 1,990 45 S1 69 3.4 118 53
Source: 'Social indicaors in Latin Amerca and the Caribbean: A Compilation of Satstis from 1970 to the Present"by Gemp Psanopoolos mand Bill Wood, a view from LATHR, No. 23 and Wod Bank Development Report, 1991.Data ae for 1989 or, if not available most recent year (pre-1989)
fates. widespread price contrls, 15 import tariff gional and ethnic discrimination. Progress in im-levels ranging up to 160 perce - together with the proving health indicators has been slow. In therecessionay efects of hyperinflation itself - led to case of infant mortality - one of the prime indica-an unprecedented decline in production. By July tors of a nation's health - the improvementsi990 real GDP had plunged 25 percent since 1987. achieved by Peru were one of the lowest in the re-Investment, both public and private, was ex- gion even though it started from a less favorabletremely depressed. The country's inrastructure ps T 1991 cholera epidemc demonstratedhad detenorated severely because of iappToptiate in a dramatic way the precariousness of health andimvestment and iadequate matenance. Dispos- sanitary conditions nationwide. Since its appear-able intrnational reserves had been exhausted. In ance in February 1991 through June 1991, 223,00addition, violence and tenWrism were escalating. cases were reported, one of the most serious epi-
demics of this century. in education, Peru ranksSocal Cris near the top measured in terms of primary and sec-
ondary enrollment ratios. However, a gross pti-1.13 SOCIAL INDICATORS. A compatisn may enrollment ratio well in excess of 100 (a situ-of social indicato among countries in the region ation that has peristed for some time) is indicativeshows that Peru ranks near the lowest in most ar- of relatively high repetition rates (see Chapter 3 foreas related to health (Table 1.3). However, poor further discussion).economic performAne does not explain all the dif-ference because in many cases Peru falls beloweven countries whose per capila GDP is lower. Forexape,the infant mortality rate is higher than 3.'oet Vqand Inquality in Lti ADeic and theCrbbaemimple, d infant mrWity Me i higba dw During the 1970's and 1960s: An Overview of thewould be expected given its level of per capita in- Evidence', Dominique van de Wae, pa 7, a View from
come? Other facts include long-standing re- tATh No. 22.
5

TABLE 14 PERU: STRUCTURE OF CENTRAL GOVERNMt SPENDING, 1970.1990(% OFTOTAL SPENDING)
1970 1975 1980 1985 1990
Crent 62.6 61.9 49.8 43.0 493
(ExcilIt. ) of which:
Wages 28.7 24.9 17.5 16W6 13.9
Goodsandservices 5.3 4.6 2.6 38 49
Defense 1S.8 19.3 17.5 14.9 12.5
Capital 20.5 21.3 192 115 83
Debt paymen(Amort. & Int.) 17.0 16.8 31.0 45.5 424
Total 100.0 100.0 100.0 100.0 100.0
Memorandum ltemsGovt spending(% of GDP)
ExcI. socal secity 17.1 19.7 22.9 235 144
I socil seuiy 18.7 21.6 25.0 25.1 n.a.
Index of real Govt eding(1987_100)
ExcL oascuri 57.0 87.0 1170 112.0 41.0
IncL social secuity 56.0 86.0 114.0 107.0 as
Souce: Govermme of Pem staff estimates
1.14 SOCIAL EXPENDITURES. The public were 65 percent lower than the 1980 level and 30
resources avaiable for socia srvices in Penu have percent below the 1970 level.
bem scacer with the sharp decline in overallGovernment expenditues duirig the last five 1.15 Changes in the structure of expenditures
years. The declne is explaid by several fictors give sorx indication of the competng demands on
including the severe rwession and the nea vanish- shrnking resources Wages accounted for nearly
ingof the country'staxsystem-in 1989tax rev- 30 percent of spending at the begining of the
enues totaled only 4 percent of GDP. Central gov- 1970's, but had fallen to about 20 percent by the
eomient spending was equivalent to 20 pecent of end of the decade. In 1990 wages accounted for
GDP during the 1970's, rose slightly during the only 14 percent of total expenditures. The share al-
first half of the next decade, but by 1989-90 its located for goods and services remained stable at
share had dropped to less tan 15 peent of GDP, 4-5 percent of total spending except for the late
low in mparion withother Latin American and 1970's and early 1980's when it dropped to about
middle-income developing countries. By 1990, 3 percent. However, the share going for capital ex-
central govemment expenditures in eal terms penditu fell from about 20 percet during mostof the 1970's to about 15 percent in the 1980's andto only 8 percent in 1990. At different points of
4. A-bdesciponofthpovioofscasvicesbytb time defense and/or debt service represented largepivate act is induM in Anua . shares of total spending the former durng the
6

mid-197l 's and early 1980's and the latter in the capita spending on education has fluctuated con-mid-1980's and again in 1990 (Table 1.4). siderably, but in general increased from an average
of $26 in the 1970's (with particularly high expen-1.16 How did central government expenditures ditures during the middle of the decade) to $34 be-on the social sectors fare? The data indicate that tween 1980.86 before falling to $25 in 1989-1990.the social sectors were somewhat protected from C(able 1.5)the most severe expenditure reductions. Neverthe-less, because of the decline in overall resource 1.17 Real central government spending in Peruavailability, Peru spends less than its neighbors in fell consistently between 1984 and 1990. In orderthese areas. In the case of healkh, its share of cen- to see how vulnerable the social sectors were totral government expenditures has remained fairly budget austerity a coefficient of vulnerability wasstable at 4-5 percent since 1970, equivalent to calculated. (Table 1.6) This is a simple ratio of theabout 1 percent of GDP.- On a per capita basis, percentage changes in sectoral expenditure tospending by the central government on health in- those in total expenditures or the elasticity ofcreased from about $5 at the beginning of the sectoral expenditures with respect to the govern-1970's to $13 in the early part of the 1980's. Al- Ment expenditures calculated only for observationsthough there have been some fluctuations, in gen- in which government expenditures are falling.6 Ineral there has been a declining trend since 1986 the case of health, the coefficient was 0.5, indicat-with per capita expenditures standing at $8 by ing that on average health expenditures decreased1990. The WHO estimated in 1981 that spending by about half as much as total expenditures. Theof US$10 per capita could achieve prmary health annual data show that while in 1985-86 health ex-care for all, showing how constrained government penditures continued to expand in real terms, inhealth expenditures are in Peru. The Government's 1987-88 they were subject to slighty less or pro-emphasis on education appears to have lessened portional spending reductions, and by 1989 theysomewhat. In the first half of the 1970's expendi- were experiencing cuts that were about 20 percenttures on education accounted for between 17-19 greater than the average for total central govern-percent of total central government spending. ment expenditures. In 1990 health expendituresHowever, this dropped to about 13 percent during were reduced three times as much as were totalthe last half of the decade and the 1980's. Mea- expenditures. The treatment of education has fluc-sured as a share of GDP the figures tell a similar tuated, although the coefficient of -0.4 indicatesstory. In the first half of the 1970's education ex- that on average spending expanded in real terms inpenditures were equivalent to 3.5 percent of GDP. spite of the decline in overall central governmentThis share dropped to 2.5-3 percent thereafter. Per spending. However, this is due to a sharp increase
in expenditures in 1986, while in both 1985 and1987 education suffered larger than proportional
s. Healhexpendituresdonotincludesoecurty.A.nanalysis reductions in spending levels. In 1988-89 educa-of the social secudty system in Peru is outside the scope of tis tion suffered spending cuts which were lower thanpaper. Howevm, analysis of social secuity SY s i Lati the average. In 1990, education expenditures wereAmerica indices that generally the poor are excluded fom the subje to larger than propotional (th timesStn, althou dependg on the incidence of the tx wM subject toelarg tha portional (thrs time
finance socalsmcity, the poor may bar some of tem Dta higher) spending cuts. For the social sectors as afor Petu show that social scuity covage in poor prin is whole, the coefficient (.0.2) shows that spendingnegigible. (see -Social Secouity m Latin A :erc Issues and increased in real terms, in contrast to the rest of theOptionsfortheWorldlBank"byMcoevy,WoildflnDiscussonPapr, No. 110.) nfe W one pyMv by tbe skcmty govermment. While this is primarily a result ofsystm in Per are also concenuated at the terdaay lve o spending decisions made in 1986, for two of thehospitals. Of course, even if the poor are excluded fom sos remaining four years (including 1985 and 1988)security, they may be affectd by cha_ in it. For example, _I the reductions suffered by social services wereworker lose social security benefits becaw they woak in theinfon economy or are laid off from their jobs, tbey and theirfamilies wiU have to tur to the hat sevies provied by tbeMinisuy of Health. This could reduce the resoure available for 6. For methodology see Hicks and Kubick (1983), "Cuttingprograms for the poor. The role of the social security system in Government Bipendire in UDCS.' Finance andhealtbcnPasanditsfislsSladbsai ariadinA eA. Develpment 21:37-39, 1984.
7

TAIBLE LS. PERUt SOCIAL SECTOR SPENDING, 1970.1990
1970 1971 1972 1973 1974 1975 1976 1977 1978 1979
Slweotoal o peaal (S)HMealh 5.5 49 S.1 43 4.5 4.7 S.4 4.0 4.5 48Edlio. t18.8 1 18.0 185 18 182 175 16.8 13.7 11.6 123Total 243 22.9 23. 22.9 22.7 222 22.2 17.7 6.1 17.1
Hualth 52 53 6.2 6.4 7.7 10.1 10. 7.9 6. 89Educados 17.7 19.8 225 27 31.4 37. 34.1 27.1 17.7 22.7Totd 22.9 25.1 28.6 343 392 47.7 44.9 34.9 24.5 31.6
Shwe of GDP(%)HMal 0.9 09 1.0 0.9 09 1.1 09 1.0 1.0
1d_cMlo 3.2 33 35 3., 3.4 34 4 3.0 2.6 25lbTow 42 42 4.5 4. 6 4.4 45 3.9 3 35
I960 1981 1982 1983 1984 1965 1966 1987 96 19 1990
Sham of t tota uealg (%)Heddt 4.7- 5.1 4.4 43 43 44 4.7 48 4.9 4.4 32Wmmtioa 133 14.9 13.7 12.1 11.9 11i 16.4 126 13. 130 9.7To.al 18.0 20.0 18.1 164 16.2 16.2 21.1 17.4 17.9 17.4 12.9
HUa 12.7 15. 12.4 107 14 7.9 10.2 95 10.0 8.6 831d_ctIo 35.7 44.9 389 30 287 213 35. 25.9 26. 25.2 2.0Total 484 60. 513 40.7 39.1 293 4S.7 35.7 369 33.7 33.3
SHARBOPGDP(%) 22.9 21.6 21.0 24.6 246 235 213 182 M5 132 14.4Health 1.1 1.1 0.9 1.1 1.1 1.0 1.0 0.9 0.8 0 05Bdaca 3.0 3.2 2.9 3.0 29 2. 35 23 2.0 1.7 1.4Toald 4.1 43 33 4.0 4. 43 4S 32 2. 23 1.9
Smwoe: GM at of Pan d otaff .admtea

TABLE 1. PERU: COEFlCIE S OF VULNERABILITY,1985-190
1985 1986 1987 1988 1989 1990 AVERAGE
Health -13 -1.6 0.9 1.0 12 3.1 O.S
Education 1.7 -12.8 3.6 0.9 1.0 2.9 0.4
Total social sector 0.9 -9.8 3.0 0.9 1.1 3.0 42
Source: Staff estimates.
TABLE 17. GOVERNMENT SPENDING ON EDUCATION AND HEALTH(% OF GDP)
EDUCATION HEALTH TOTAL
1975 -79 1980- 85 1989* 1975-79 1980- 85 1989* 1975-79 1980-85 1989*
Arentina 2.8 3.1 1.9 0.5 0.4 0.6 3.3 3.5 2.5Bolivia 3.8 3.2 3.1 0.4 0.7 Una 4.2 39 Dna
Chile 3.7 5.0 3.6 22 2.9 a 5S.9 7.9 naColombia 2.2 2.7 2.7 0.8 0.8 n.a 3.0 3.5 1.8Dominin Republic 2.1 2.1 1.5 0.6 IA 1.0 2.7 3.5 2.5Ecuador 3.7 4.3 2.8 0.9 1.9 0.9 4.6 6.2 3.7El Salvador 3.4 3.7 n.a 1.3 1A na 4.7 5.1 naGuatemala 1.7 1i nua 0.8 1.1 1.0 2.5 2.9 nLaHonduras 3.6 4.0 4.9 1.0 1.6 2.2 4.6 5.6 7.1
Mexico ~ 1.0 3.5 2.1 0.6 0.3 0.3 5.0 3.8 2.4
Average (Unweighted) 3.1 3.3 2.7 0.9 1.2 1.0 4.0 4.5 3.7
* 1989r amost recentdata available post-1985.Sour: Govemment of Peru and "Government Expendi on Social Sectors in latin America and the CaribbeanStisial Trends', by Hongyu Yang, A view from IATMR. No. 13
slightly less than the cutbacks in total spending, lhe Economic Reform Prormindicating that thes secors were protected.
1.19 In August 1990, the Fujimori Govemment1.18 Comparing Peru with other countries in launched a sweeping stabilization and structutalthe region shows that in education, central govern- reform program.7 During the first stage, the gov-ment spending as a share of GDP was about aver- emnment took dramatc steps towards stabilizingage between 1975 and 1980, but dropped belowthe average thereafter, slightly during the first half 7. Thais section diaws on the Presdens Reports for te Tradeof the 1980's, but significantly by the end of the Pohcy Reform Loan (No. P5666-PE, January 19) and thedecade. The same is true for health (rable 1.7). sa Ao.
9

the economy and rebuilding ties with the intema- fiscal balance. It is also vital in order to guaranteetional fincial commumnity. The main components the Government's ability to provide basic socialof the program aimed at eliminating the chief services in the long-run. The Government hassource of hyperinflation - the monetary financing implemented a new tax system based on five typesof the fiscal deficit. A tight domestic credit policy of taxes on: income of individuals and corpora-was maintained. The govemment placed strict con- tions, wealth of firms and individuals, value-trols over public sector wages and salaries, in- added, selective consumption, and imports. Ex-creased fuel prices by about 30-fold and tariffs for emptions have been reduced and rates lowered. Al-electricity, water and telephone services by about though the average import tariff rate has been low-ten-fold. Price controls were significantly reduced ered, other actions have been taken which are ex-Several tax exemptions were eliminated and some pected to result in an increase in net trade taxes.emergency taxes introduced. Strict cash controls For example, many preferential regimes, as well aswere placed on central government finances. One export subsidies, have been eliminated. Theof the first measures of the new Government was agency which administers taxes is being reorga-to liberalize the foreign exchange market and abol- nized and it has been given funds to purchaseisb foreign exchange controls. The exchange rate equipment.was unified and a managed float was introduced.
1.23 The growth in urban employment and1.20 A second stage of reform began in March wages is a major determinant of the pace of pov-1991 and was based on a series of broad-based erty reduction through both its direct influence onstructural measures. These reforms aimed at pro- the existing urban poor and through the opportuni-moting competitiveness and deregulating eco- ties it creates for migration from rural areas. Thenomic activity The tax regime was simplified and growth of urban employment is especially impor-administration is being strengthened. The trade re- tant in order to alleviate poverty in middle-incomegime was liberalized. The ngid labor stability laws countries such as Peru. Also, Peru's resource en-were amended to afford provisions for layoffs. dowments and climatic conditions are relativelyLand property rights were broadened and strength- unfavorable for agriculture. Despite the heteroge-ened. The Government also has taken action to re- neity of ecological zones and a variety of crops,duce the size of the public sector and has continued only 5.9 percent of the territory of the country canto adjust public sector prices, while strictly con- be counted as arable land. The per capita availabil-trolling public sector wages. ity of cultivable land (0.14 hectares) is even lower
than that of Asia and one-third the averge for1.21 Because the successful implementation of South America.this economic reform program would lay the basefor sustained and open growth, it is the heart of the 1.24 The demand for urban labor dependspoverty alleviation strategy for Peru. Most of the partly on government policy toward the marketspoor in developing countries depend on income for goods and capital as well as on policy towardfrom labor - from wages, from work on their land, the labor market itself. Often industial protectionor from other self-employment. The countries that reduces both the level and growth of labor and thehave succeeded in reducing poverty over the long formal sector. As a rule, the greater the degree ofterm have encouraged urban employment and rual protection, the greater the capital intensity of pro-development, thereby increasing the returns to duction. Greater neutrality in the trade regime canwage labor and small farm production. The follow- support a more labor-intensive pattern of industialing section highlights the major components of the expansion in import-competing as well as export-Peruvian adjustment program, focusing on those ing sectors. The Government has moved quicklyaspects which could make the largest contribution and boldly to free the trade regime. By Septemberto poverty reduction. 1990, the number of import tariffs had been re-
duced to 3 - 15 percent for basic foodstuffs, medi-1.22 Peru's ability to reverse the sharp decline cine, some interm- -hate and capital goods, andin tax revenues is central for the restoration of some foods, 25 percent for other producer goods,
10

and 50 percent for other conumer goods. By then bargaining negotiation would improve labor-man-vitually all the preferential regimes also had been agement relations, to the ultimate benefit of all
eliminated. In December 1990, the Govemment parties. The Fujimori Administration has recog-
amnounced a timetable to cut tariffs every six nized the importance of reducing labor market ri-
months to arrive at a flat 15 percent tariff by Janu- gidities which would be likely to hinder the pro-ary 1995. In March 1991 the Govemment reduced cess of structural adjustment. Thus the Govern-
the 50 and 25 percen rates to 25 and 15 percent. A ment has begun to take some actions in this area. It
variable-surcharge scheme designed to lead to a has extended the possible probationary period after
landed price no higher than the previous five-year which labor stability regulations are in force. Theaverage c.i.f. price plus a 15 percent tarff covers guidelines on the use of temporary employment
some agricultural products (dried milk, wheat and also have been broadened, as well as the number ofwheat products, corn and sorghum, rice, and reasons that would justify dismissals. The Govern-sugar). The Government also has taken strong ac- ment has improved occupational mobility in the
tion to reduce non-tariff import barriers. By Sep- labor market by further increasing the tenn for la-
tember 1990, aU import prohibitions, historically bor contracts, eliminating the legal constraints to
the major import barier, had been suspended. Lo- part-time employment and extending the proba-cal content regulations have been eliminated for tionary period to one year.assembly industries and several state monopolieshave been abolished. The Goverment has begun 1.27 In most countries incomes are generallyto allow some second-hand imports including ve- lower in rual areas and thus rural development
hicle and machinery imports. Clothing, shoes and plays an important role in poverty alleviation. Peru
laundry items are still banned. Many quality con- is no exception. Policies to promote growth in ru-
trols on imports also have been eliminated. ral areas will be an important component of thepoverty alleviation strategy. The new administra-
1.25 In general, based on the experience of tion has taken several measures in this area. The
other countries, trade reform can be expected to newly established unified exchange rate eliminated
lead Peru to a more efficient use of its resources the bias against agricultural exports and imports of
through specialization in productive areas where foodstuffs no longer receive exchange rate subsi-
its comparative advantage is greatest and through dies. The trade reform also eliminated the wide-
the competitive pressures that freely available im- spread system of exemptions that discriminatedports will exert on domestic producers. Labor against agriculture. Most significant have been thewould tend to be reallocated within broad sectors liberalization and deregulation of all domestic and
and overall employment opportunities would ben- foreign trade of agricultural products. The nationalefit from an expected acceleration in output, first rice marketing company is being abolished and the
in agriculture and later in manufacturing. How- national input marketing company restructured.ever, trade reform is most effective if factors of Banco Agrario credit subsidies were elimin-
production are free to respond to market forces. In ated. Land and property rights were strengthened,the case of Peru, state policies since the 1960s making land transferable and allowing it to be usedhave severely restricted factor movements. In or- as collateral. The Government also has begun
der to promote more opportuities for urban em- a long-term plan ensuring land-titling and registra-
ployment and thus contribute to the alleviation of tion.poverty, a key area for fmuther reform is labor mar-ket regulation. 1.28 Faced with poor performing state enter-
prises, the Government has decided to reduce the
1.26 Changing the current laws to permit role of the public sector in the economy through
longer labor contracts (not subject to labor stabil- the sale of public companies to the private sector.
ity), longer probationary periods, and judicial re- The size of the central Government is also being
forms would improve employment prospects. Less cut In the first four months of 1991, 50,000 civil
detailed regulations and a less paternalistic ap- servants resigned under a program offering incen-proach tc govemment intervention in collective tives for voluntary withdrawal.
11

1nta Respowse of the Economy and Expected ConclusionDenefits
1.31 The major reason for the persistence of a1.29 It is too early to judge the success of the high incidence of poverty in Peru is the dismal per-reforms which have been implemented and the formance of the economy. The legal and adminis-progam continues to be subject to high risks, par- trative structure discouraged growth. The economyticularly because of the residual impact of the pre- became closed and not enough productive jobsvious hyperinflation and the difficulties it creates were created. The pubic sector became overex-for current monetary and exchange rate manage- tended and wasted resources. The poor economicment. Nevertheless, there are some encouraging record is reflected in generally poor social condi-signs. Inflation has moderated significantly to just tions, although school enrollments continued toover 4 percent monthly between September 1991 expand in spite of the difficulties. An attempt toand May 1992 as compared to 60 percent during implement an unorthodox economic program in1990. After tree consecutive years of decline, the the mid-1980's compounded these problems andeconomy grew by nearly three percent in 1991. caused output to plummet and inflation to surge.Although the process of adjustment resulted in a The Goverunent was forced to reduce spending torecession beginning the last quarter of 1991 and extremely low levels, although social servicescontinuing during the first half of 1992, the were protected somewhat Nevertheless, the over-economy began to recover during the second half all scarcity of resources means that Peru spendsof that year. In September 1991, Peru successfuly very little on health and education. In 1990 a newtescheduled part of its obligations to the Paris administration embarked on an ambitious stabili-aub. It awarded the Government exceptional zation and adjustment program. If this program isteatment in the form of unprecedented cashflow successfully implemented it should lay the base forrelief between October 1, 1991 and December 31, economic growth which would broaden the oppor-1992 (the consolidation period). tunities for people to improve their living stan-
dards. The achievement of broad-based growth is1.30 Stabilization is necessary for the success the first prong of a poverty alleviation strategy forof the structural reforms and to lay the- base for Peru. Lacking that, no meaningful reduction ingrowth. The revamping of fiscal administration poverty can be sustained. However, the poor al-and fiscal reforms should increase revenues. That ready have suffered from the economic stagnationand the Government's actions to reduce the state's and recent crisis. They were least able to protectrole in the economy should permit more resources themselves from high inflation and likely to haveto be devoted to basic services such as health and suffered most from reductions in key public ser-education. The trade reform should mobilize re- vices. They have not been able to benefit from pro-sources toward Peru's competitive advantage and tected market positions. Their incomes were al-lead to an outward-oriented, and thus sustainable, ready low and thus the recent sharp economic de-growth. Labor market reforms will improve the cline has affected the access of some households toflow of labor inputs among sectors so that the even an adequate diet. In order to protect the mosteconomy can adapt to changes in relative prices vulnerable groups in the country the poverty alle-caused by trade and fiscal reforms and will pro- viation strategy must also address the particularmote a broader distibution of employment oppor- needs of poor households in Peru.tnities.
12

2
Poverd Proftk
2.1 The extent of poverty in Pr wsend s level wene classified as poor.1 Tne data pre-during the stagnation of the economy and recent setd in Table 21 shows that during the decade ofcrisis. Applying two nutrition-baed povery lines the 1970s the share of households classified asto a household suvey covering 75 pecent of the poor or extemely poor declined in Pe, althoughpopulation, results in about half of the populon the country's record lagged that of other countriesfailing below the poverty line and a fiflh being in Latin America. In addition, while the extent ofconsidered extemely poor. In order to desg pro- rural poverty diminished during this period (in linegams and policies to improve the lving condi- with overall trends for Latin America) the extenttons of the poor some basic informion is needed. of urban poverty rose substantially (in contrast toWe need to know about their occupations, con- overall trends for Latin America). Between 1980sumption patterns, economic activities and acoess and 1986 these gains in reducing poverty wereto public services and assets. In order to provide completly wiped out and the trend of a poorer per-answers to these questions a povery profle for fomnce in uba relaive to rur areas continued.Peru is constructed.
2.3 Two studies have examined the change inTrends in Poverty 1970-199 the incidence of poverty between 1985/86 and
1990 for IlJma2 The estiMatS are not comparable2.2 The United Nations Economic Commis- with those shown in Table 2.1 because of the usesion for Latin America anlyzed the extent and of different methodologies, including a differenttrend of poverty between 1970 and 1986 in several poverty line, and the narrower coverage. Bothcountries, including Per They estima0td a pov- studes used data from two Living Standards Mea-erty line based on the cost of a country-specific surement Surveys, one which was camed out infood basket which met interationally-set require- 1985/86 and the other in 1990. Special mentionments for energy and protein. Households whose needs to be made of the exceptional circumstancesexpenditures fell below this level were classified under which the 1990 survey was done. It was un-as extremly poor. This amount then was scaled up derlaken at the height of hyperinflation in Peru.by a factor to take into account non-food expendi-tures. Households whose expenditures fell below
2. -Povety and bequalty Duwig Unorthodox Adjuslment 'heCue of Peru, 19&5-1990" by Paul Glewwe and Gillete Hall,
1. Fbr addidl information on the methdol nd sources UvlngStadard Measreent Study Woking Paper, No. 86 andused for this analysis see CBPAL 1990. A*ay Eceam& Faeliar, 19851990, Instituto Cuanto.
13

TALE 2.1. LATIN AMERICA: POVERtY ESTIMATES AROUND 1970, 190 AND 1986(%OF HOUSEHOLDS BELOW THE POVWTY IN
URBAN RURAL TOTAL
1970 1980 1986 1970 1980 1986 1E70 1980 1986
Latn Aca b 26 25 30 62 54 53 40 35 37
LatinAmerica 10 9 11 34 28 30 19 1S 17
(for Peru data above):Poverty line: d
(1988 Prices)Natl Currency 123,985 140,892 140,892 83,530 94,920 94,920US$ 552 627 627 372 422 422
Exptm poverty line: Id(1988 Prices)
Nlat' curncy 61,987 70,440 70,440 47,731 54,240 54,2A0USS 276 313 313 231 241 241
Per capita GNP (1980 prices) US$ 1,062 1,081 1,023
a. Poverty line based on cost of food basket needed to meet energy and protein requirements and an estimate fornon-food expenditures.
b. In addition to Peru, includes Argentina, Brazil, Colombia, Costa Rica, Mexico, Urguay and Veneuela.c. Extreme poverty line based on cost of food basket needed to meet energy and protein requirements.d. Percapita.
Source: CEPAL(1990).
Duing the oiO1t week suvey penod the increase PortY ProfIlein price level ranged between 1-5 percent per day.Derving a series of values in constant prces for 2.4 PERU LIVING STANDARDS SURVEYexpenditures over the survey period alone is not (PLSS). The poverty profile for Peru is based ononly very difficult, but the results are unavoidably information from a Living Standards Survey car-subject to more than the usual margin of error. Ad- ried out during October/November 19913. It cov-justing the data to make comparisons between ered households in four regions, Lima, Urban1985/86 and 1990 is even more problematic. Nev- Coast, and the Rural and Urban Sierra, which ac-ertheless, although the precise magnitude of the count for about three-quarters of the popula-change and the poverty incidence rates are subject tion. The areas selected within the sierra regionto a large margin of error, the direction of change were subject to security considerations. The surveyis unambiguous. The studies estimate that povertyrose by between 3-4 times between 1985/86 and 3. mis analysis has benefited from an examination of several
1990 and the inaease in extreme poverty was even studies on povet (and related topics) which were based on thehigher. Thes findings confirm what would be ex- information from the 1985/86 Peru Living Standards Survey.Several World Bank studies appeared as Living Standardspected in light of the trends in maconomic in- MeasurementStudy Working Papers. An annotated bibilographydicators, wages, etc. discussed in Chapter 1. of some of the work done in Peru appears in Annex B.
14
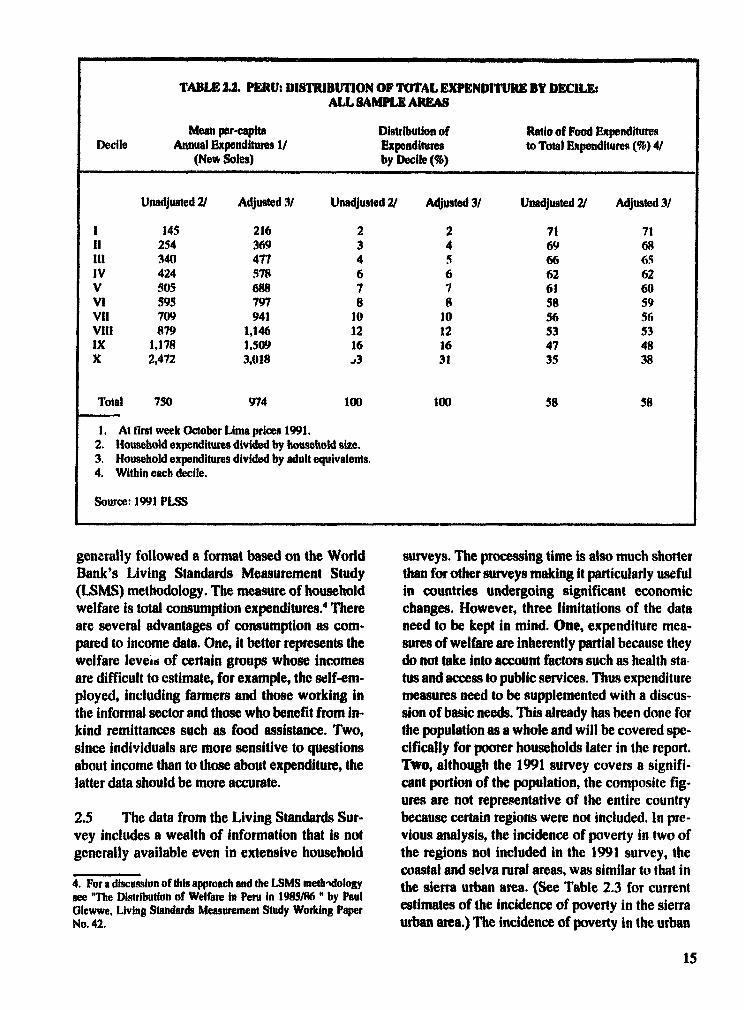
TABLE 2.2. PERU: DISUUlRIIION OF TOTAL EXPENDITURE BY DECILEsALL SAMPLEAREAS
Mean preapita Disttibution of Ratio of Food ExpendituwesDecile Annual Expenditumes 1/ Expenditures to Total Expenditures (%) 4/
(New Soles) by Decile (%)
Unadjusted 21 Adjusted 3/ Unadjusted 2/ Adjusted 3/ Unadjusted 2/ Adjusted 3/
1 145 216 2 2 71 7111 254 369 3 4 69 68III 340 477 4 5 66 65IV 424 578 6 6 62 62V 505 688 7 7 61 60VI 595 797 8 8 58 59VI 709 941 10 10 56 56Vill 879 1,146 12 12 53 53IX 1,178 1.509 16 16 47 48X 2,472 3,018 .3 31 35 38
Total 750 974 100 100 S8 S8
1. At first week October tAna prices 1991.2. Household expenditures divided by household size.3. Household expenditures divided by adult equivalents.4. Within each decile.
Source: 1991 PLSS
genetally followed a format based on the World auveys. The processing time is also much shorterBank's Living Standards Measurement Study than for other surveys making it particularly useful(LSMS) methodology. The measure of household in countries undergoing significant economicwelfare is total consumption expenditures.4 There changes. However, three limitations of the dataare several advantages of consumption as com- need to be kept in mind. One, expenditure mea-pared to income data. One, it better reptesents the sures of welfare are inherently partial because theywelfare leveio of cettain groups whose incomes do not take into account factors such as health sta-are difficult to estimate, for example, the self-em- tus and access to public services. Thus expenditureployed, including farmers and those working in measures need to be supplemented with a discus-the informal sector and those who benefit from in.- sion of basic needs. This already has been done forkind remittances such as food assistance. Two, the population as a whole and will be covered spe-since individuals are more sensitive to questions cifically for poorer households later in the report.about income than to those about expenditure, the Two, although the 1991 survey covers a signifi-latter data should be more accurate. cant portion of the population, the composite fig-
ures are not representative of the entire country2.5 The data from the Living Standards Sur- because certain regions were not included. In pre-vey includes a wealth of infornation that is not vious analysis, the incidence of poverty in two ofgenerally available even in extensive household the regions not included in the 1991 survey, the
coastal and selva rural areas, was similar to that in4. For a discussion of this approach and the LSMS methidology the sierra urban area. (See Table 2.3 for currentse 'The Distributiot of Welfare in Peru in 1985/86 " by Paul estimates of the incidence of poverty in the sierrOlewwe, tving Stadards Measurement Study Wofking Paper urbanarea the incidence of poverty in the uraNo. 42. urban area.) The incidence of poverty in the utban
15

27 POVERTY MEASURES. Two povertyTAsL 23. lines have been calculated. Both are based on the
PERu 1991 POVERTY HEADCOUNT capacity of a household to consume a basic food
No. basket. Households are classified as extremelypoor if their total expenditures are less than the
Upper Povery Line (poor) 8,601 cost of a basic food basket. Households are classi-Lower povert LinM (extmly poor) 3.476 fied as poor if their total expenditures are less than
Populatio Covered by Survey 16,024 the cost of a basic food basket plus an estimate of(TTAL POPULATON OF PERU) (zooo) non-food expenditures. In classifying households
as extremely poor or poor, regional differences in1. Headnount covers only sampled regions the cost of living and in the composition of the
food basket have been taken into account.6 Ac-Source: 1991 PLSS cording to these definitions, out of the 16 million
people in Peru covered by the sample, about 3.5million people or about a fifth fall below the ex-selva, the other region excluded from the surve;', trme poverty line and an additiona 5.1 million
was very low, and it accounts for a very small fall between the extreme poverty line and theshare of the total population. The areas of the rual higher poverty line. Adding the two groups,sierra excluded from the survey because of secu- roughly half of the sample population falls belowrity problems are some of the poorest areas of the higher poverty line Sable 2.3).Peru. Thus, the figures probably understate the ex-tent and depth of poverty in the rmal sierra. Tbrem 2.8 REGIONAL DISTIMBUTION. Where doin the context of a country in which many fear for the poor live? Among the four regions in thetheir personal security, it was very difficult to sample, the incidence of poverty is highest by farimplement the survey for high-income households. in the rual sierra (Table 2.4) Two-thirds of theThe information on the upper deciles of expendi- households living there are poor and 47 percent oftures is subject to more than the usual errors and the total fall into the extremely poor category.may be significantly underestimated. Only 10 percent of the households in Lima are
classified as extremely poor, compared to about 202.6 Before looding at poverty, Table 2.2 pre- percent in both the urban coast and sierra regions.semts the disecfehtron of total expenditure by In each of these three regions the share of poorpopulation decile, where decile I contis the households is about half. The rural sierra is esti-ponrest 10 percent and decile X the wealthiest 10 mated to contain the largest number of extremelypercent ao the populatiio.The daaareprovidedb o poor (1.6 million). Because of its size Lima con-both an adjusted (consumption divided by adult tains the highest number of poor (3.2 million).equivalents)S and an unadjusted (consumption di-vided by number of household members) basis. 2.9 Table 2.5 provides information on house-The data show that households in the top decile hold size and per capita consumption for the ex-account for a third of total expenditures carped tremely poor, the poor and the rest of the popula-to two percent, four percent and five percent, re- tion. The typical poor person lives in a largerspectively, for the bottom three deciles. For the top household than the non-poor, on average larger bydecile household, food represents 40 percent of to 1.5 individuals. There is little difference betweental expenditure whereas for the lowest three deciles the poor and non-poor household on the number ofthe share is about 70 percent. wage eamers, but because of the larger household
each worker in a poor household supports 4 family
6. Ihe e-treme povaq yine (adjusted, per capita) ranges from5. The methodology used is the same as Glewwe (1988). Adlts 430 new soks/year in the urban siera to 500 new soles/year inover the age of 18 are given a weigt of one, whie children aged Uima. Thepoertyne(adjusted,percapita)rangesfrom 700new13-17, 7-12 and 0.6 are given weights of 0.5, 03 and 0.2, sols/year in the ra siera to 980 new soles/year in Lima. Seerespectively. Annex B for more details on the caklulation.
16

Emembers wherea for the non-poor the numberPERU: REGIONAL DfSTRIBUTION F fills to about 3. On average, the value of per capitaPOPU:ATION BY DIOVERTIY GROU food consumption in an exlremely poor household
is only 30 pecent (on an adjusted basis) what it isRegion AU Non-Poor Poor in a non-poor household. n the case of total con-
40 44 37 sunption,the fracdon is20percenof the level forlima non-poor households In poor households the cor-
19 18 19 respondingf for food and to lconsmptionUrba Coast are about 45 percent and 30 percent, respectively,
20 23 18 of the non-poor level.UrbnSierra_
Rural Sierra 2114 7210 As shown in Table 2.6, femade headed100 100 100 housholds make up a smaller share of the ex-
Total ____ A tremely poor and the poor compared to their sharein the total popiuation. However, the mean per
Region ADn Et mly Pow Ote capita annual expenditures (unadjusted) of a fe-male-headed household are only 15 percentgreater than for a male-headed household. Fe-
40 19 46 male-headed households are found to a greaterLima 19 9 uextent in Lima, accounting for a fifth of house-Urban CA holds in the capital city. Contrary to the pattem in
20 17 21 other areas of the country, here female-headedUrban Sierra m households are found disproportionately among
21 45 14 the extremely poor, accounting for 26 percent ofRural Sierra WFNINWNER M the total.
100 100 160Totall
2.11 Data on language and expenditure levelsSource: 1991 PLSS indicate the disadvantaged position of the Indig-
enous popution in Peru. Slightly over 60 per-cent of Quechua speakers are poor and a third ofthem are extremely poor. In the case of Aymaraspeakers, 86 percent are poor and 70 percent of
TABLE 2.5. PERU: HOUSEHOLD SIZE AND PER CAPITACONSUMPTION BY POVERTY GROUP
ExtremelyPoor Poor Non-Poor All
Household Size 6.0 5.8 4.3 5.0Adjusted Household Size 3.9 4.0 3.4 3.7No. of Wage Eamers per Houehold' 1.4 1.6 1.6 1.6
Food Consumption ($/annum) 132.1 205.9 509.5 369.3Adjusted Food Consumpton ($/annum) 221.1 324.2 735.7 488.8
TotalConsumption ($/anum) 192.4 329.2 1,111.2 750.0Adjusted Total Consumption ($/annum) 327.4 528.8 1,642.3 937.7
1. Includes only paid workersNotes: (Limg prices October 1991), new soles
Source: 1991 PLS
17

TABE- . TABLE27.PERU: SEX OF HOUSEHOLD HEAD PERU: DISTRIBUTION OF THE POOR BY
AMONG THE POOR LANGUAG1: OF INTERVIEW
sex remely Poor Poor All Edmic Poor (of which: Non-.roup Extemdy Poor Total
Male 88 8S 83 Poor)
Female 12 1S 17Spai 42 (13) 58 100
Source: 1991PLSS Quechua 62 (34) 38 100___ __ ___ _ Aymaa 86 (70) 14 100
Souc: 1991 PLSS
them are extremely poor. Taken together thesehouseholds account for 40 percent of the ex-tremely poor and about a quarter of the poor, com- food by the poor. The commodities accounting for
pared to their share in the sample population of the largest share of expenditures are rice, bread,
slightly under a fifth. sugar, tubers and meat. Consumption from ownproduction is substantial only among the poor in
2.12 The age of the head of household does not the rural sierra (among the regions sampled)
appear to be strongly correlated with poverty. (Fable 2.10). For both the poor and the extremely
Based on the total sample, those aged 26-45 are poor, slightly over half of the value of food con-
somewhat overrepresented among the poor. Older sumption is accounted for by own production on
heads of households are consistently average in the rural Sierra The products for which
unrderrepresented among the poor. In Lina, mi- own production accounts for the largest share of
grants are only slightly more likely than non-mi- consumption are chicken (90 percent) and dairy
grants to be found among the extremely poor and products, tubers, meat, vegetables and eggs (70-80
the poor. About 44 percent of the residents of the percent). There are only marginal differences in
capital are migrants. the pattern among the extremely poor. For theseproducts, the poor would be insulated from
2.13 EMPLOYER. The poor are found largely changes in market prices. It should be pointed out
among the self-employed. The unemployed have that the sample survey does not include the areas in
the highest incidence of poverty followed by the Peru where rice and sugar are produced. The
self-employed and private workers. Reflecting the coastal rural and the selva regions account for most
extent of the Peruvian economic crisis, about half of this production. However, previous studies have
of all households headed by a self-employed or shown that these farmen are generally better-off
private worker are poor. The self-employed are than sierra farmers because they are more com-
better off than private workers in the sierra The mercialized and these products generally have
opposite is true in Lima and the urban coast. In been protected by the Government. Based on the
spite of the sharp decline in public sector wages, survey data, the poor would stand to benefit from
the incidence of poverty is lower among these declines in the price of wheat, rice and sugar as a
workers. Thus the poor would not be dispropor- result of a decrease in effective protection for these
tionately hurt by reductions in public sector em- crops.ployment. Public sector workers are better off inLima than in the other regions sampled. Although 2.15 Although the Government has eliminated in-
it would be expected that the recent hyperinflation put subsidies and guaranteed prices for agricultural
would have had an adverse impact on retirees, the output, for some agricultural products a scheme of
poor are found to the least extent among this surcharges is applied. As of June 5, 1992, the sur-
group. charges on wheat, flour and pasta ranged between30-38 percent; rice and sugar received a 13 and 16
2. 14 EXPENDITURE PATFERNS. Table 2.9 percent surcharge; and yellow corn and sorghum
lists the most important expenditures on purchased received a 17 percent surcharge. The equivalent
18

TABLE 24L PERU: Dbibulon of the Poor by Employer of Head of HOU.isbI|
Employer All Extemely Poor Other
Public
Private
Self-Employed
Unemployed
Non-Active7 1
Other
Total
Employer All Poor Non-Poor
J ~~~~~~~~~~~4 11 16Public
22 22 22Private
Self-Employed
Unemployed _ 1 _
Non-Active785
Olher _g*100 10010
Total__
Soce: 1991 PLSS
percentage surcharges on dairy products were 34 dairy products, the poor may benefit from thepercent for powdered milk and for anhydrous milk scheme. Purchased dairy products account for afat.7 What is the impact on the poor of this lower budget share for the poor relative to the non-scheme? For several products- sugar, wheat flour, poor and poor farming households consumepasta and rice - the policy would appear to hmt the largely their own production. The impact of thepoor. These items account for a higher budget surcharge on yeiow maize and sorghum is consid-share for poor households relative to non-poor ered in paragraph 2.21.households and even poor fiuming households arenet purchasers of these products In the case of 2.16 Table 2.11 lists the nine most important
non-food expenditures for the sample population.
7. For folr tament of the surge scheme see Peru- For the poor the most important expenditues areAgiult Poles for Enomic Effciency (No. 10605-PB, detergents, public transportaflon, soap, and cloth-September 1992)2 ing. in Lina, the poor spend more on public trans-
19
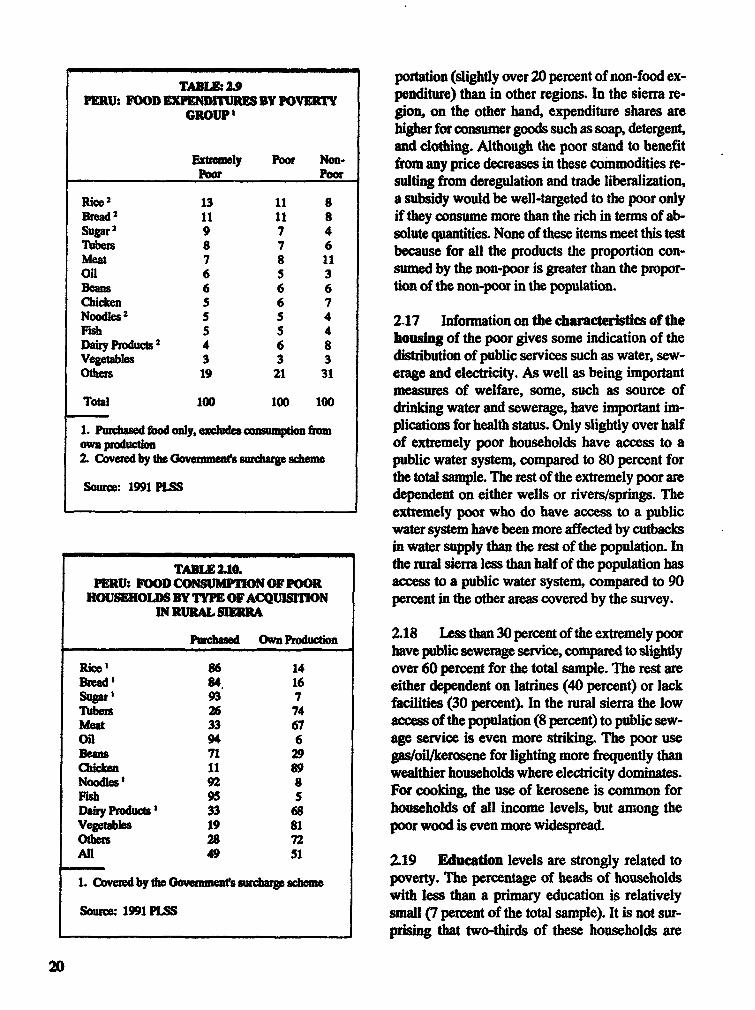
portation (slightly over 20 percent of non-food ex-
PRRU-. TO D LE r.o9m penditure) than in other regions. In the sierra re-GtoUP Vgion, on the other hand, expenditure shares are
higher for consumer goods such as soap, detergent,and clothing. Although the poor stand to benefit
Eicrmely Poor Non- from any price decreases in these commodities re-po"r Poor sulting from deregulation and trade liberalization,
Rice 2 13 11 8 a subsidy would be well-targeted to the poor onlyBread 2 11 11 8 if tbey consume more than the rich in terms of ab-Sugar2 9 7 4 solute quantities. None of these items meet this testTubers 8 7 6 because for all the products the proportion con-Meat 7 a I sumed by the non-poor is greater than the propor-Oil 6 5 3Beans 6 6 6 tion of the non-poor in the population.Chicken 5 6 7Noodles 2 2 .4 17 Information on the characteristics of theF dibSS 4s housing of the poor gives some indication of theDairyProucs 4 6 8Vegebles 3 3 3 distibution of public services such as water, sew-Others 19 21 31 erage and electricity. As well as being important
measures of welfare, some, such as source ofTotal 100 100 100 drinking water and sewerage, have important im-1. P_Shadu fod only, exudes _-omp plications for health status. Only slightly over halfown production of extremely poor households have access to a2. Covered by the erumWe surcarge sdcm public water systern, compared to 80 percent forSoul : 1991 P1.S the total sample. The rest of the extremely poor are
dependent on either wells or rivers/springs. Theextremely poor who do have access to a publicwater system have been more affected by cutbacksin water supply than the rest of the population. In
TAKLE2iQ the rural sierra less than half of the population hasPERU: FOOD CONSUMPTON OF POOR access to a public water system, compared to 90
HOUSEHOLDS DY TYE OFACQUISTON percent in the other areas covered by the survey.IN RURAL SIERRA
Purchased own Production 2.18 Less than 30 percent of the extremely poorhave public sewerage service, compared to slightly
Rice' 86 14 over 60 percent for the total sample. The rest areBreadw 84 16 either dependent on latrines (40 percent) or lack
Suar 93 7 facilities (30 percent). In the rural sierra the low
Meat 33 67 access of the population (8 percent) to public sew-oil 94 6 age service is even more striking. The poor useBMW 71 29 gas/oi/kerosene for lighting more frequently thanChico3 11 89 wealthier households where electricity dominates.
Noodba 92 S For cooking, the use of kerosene is common forDairy Products 33 68 households of all income levels, but among theVegetables 19 51 poor wood is even more widespread.Others 28 72All 49 51 2.19 Educadon levels are strongly related to
1. Covrd by the Govneasurdargemsceme poverty. The percentage of heads of householdswith less than a primary education is relatively
Sor: 1991 PLSS small (7 percent of the total sample). It is not sur-prising that two-thirds of these households are
20

TABE 2-1 PEWR% NO-FOOD EXPENDITURE PATTERN BY POVERTY GROUP
AU emely Poo Othe
10 14 10Public Tmnsportadon ------
7 8 7Clotbing (Adlt) _S_ _
6 11 7
Soup, Shampoo,oo¢ 6 1S S~~~~~~~~~~5
Detegnmts
FumininrHousehoM -upn3 3 3
Shoes3 03
Fuel and LubricaX
Clothing(Children) _52 38 ... 5
Ohes100 100 100
All
All Poor Non-Poor
to 179Publc Transportation
7 7 8Ckbdas(Adul) _
6 ~~~~~~~~6 7
6 9 5Soup, Shampoo, etc.l ___ | _
6 10 S
4 1..... t Iuehod EquipmentU IIIIUIIEUIU
3 -- ---- - 3 4-- --- ----Shoes II_
3 14Fuel ad Lubcat
3 4 2Clodt(Chiden 52 - 42 54
Others-------- 100 - ------------ 100 100
AB
Source: 1991 PLSS
21

TARLE 2.12 PERU: PUBUC SERVICES FOR THE POOR (% OF HOUSEHOLDS)
Extemely Poor Poor Total RwalSiens
Source of Drinking WaterPublic 55 70 80Well 26 14 8River/Sprig 14 9 7Water Truck 1 4 3Other 4 3 2
Hours of Public WaterSuppy in Housebold1-3 hours/day 21 18 1546 hours/day 1S 14 127-12 hours/day 17 21 2013 or more hours/day 47 47 52
SeweragePublic Service 28 49 63Well-Septic 4 5 4Latrie 40 23 16None 29 23 17
Source of UghtingElectricity 49 71 81
OiaslO/Kerosene 44 24 16Candle/None/Other 7 6 4
Cooking FuelElectricity 1 1 3Gas 4 14 28Kersene 39 51 45
Coal/None/Olher 7 4 2Wood 49 30 22
Sourc::1991 PLSS
classified as poor. In the ual siea, however, the the percentages of poor and non-poor householdsshare is double that for the total sample and the who own land. However, there is a significant dif-
proportion classified as poor is about the same. ference in the amount of land owned. The poorAbout two-thirds of extremely poor households have roughly 50 percent less land than the non-
are headed by someone with no more than a pn- poor. Irrigated land is more valuable than non-irri-mary education, compaed to about a third of non- gated land. About a third of poor households own
poor households. Those who have not completed irigated land, compared to about half for the non-
secondary education are more likely to be found poor. The poor household also owns on average
among the poor than those who have finished sec- less irrigated land than the non-poor. Also, poorerondary school. households in the rural sierra tend to have a
greater proportion of workers engaged in agricul-
2.20 The incomes eaned by the rral poor de- ture than is the case for better-.ff hoseholds.
pend in part on the land they own. Table 2.14 pro-vides data on land ownership among the poor in 2.21 The crops produced in the rual sierra bythe rural siem ere is virtly no difference in the largest share of poor farm households are pota-
22
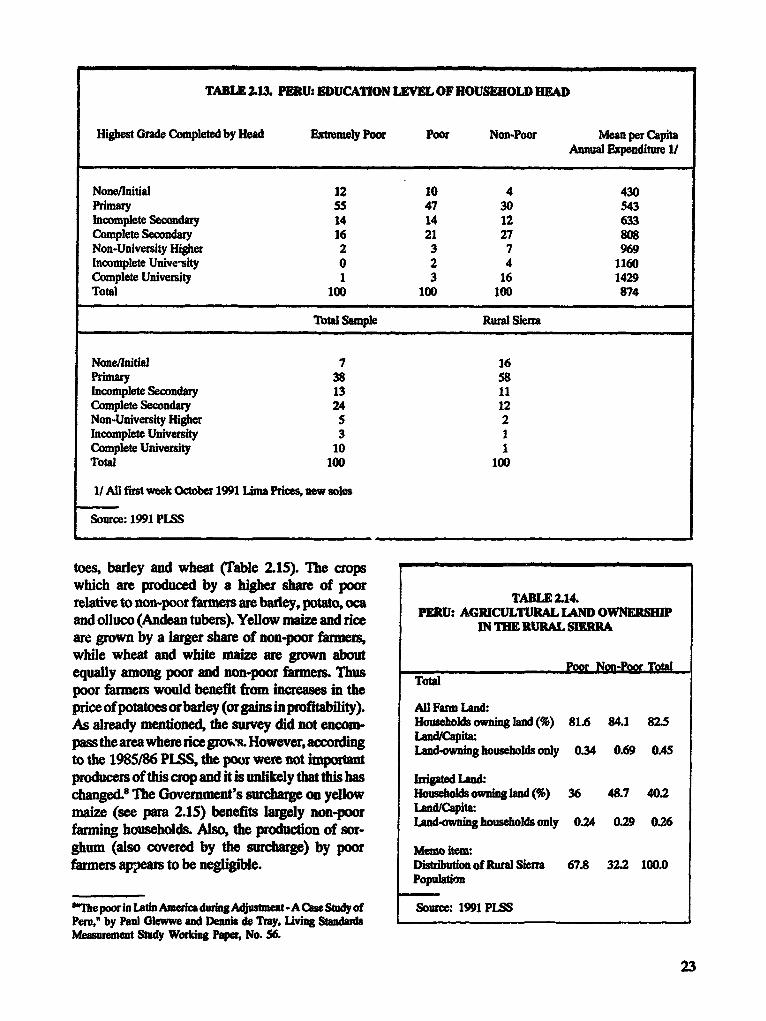
TABLE 2.13. PERU: EDUCATION LEVEL OF HOUSEHOLD HEAD
Highest Grade Completed by Head Bxtremely Poor Poor Non-Poor Mean per CapitaAnna Expenditure 1/
None/initial 12 10 4 430Primary 55 47 30 543Incomplete Seconda 14 14 12 633Complete Secondary 16 21 27 808Non-University Higher 2 3 7 969Incomplete Unive-sity 0 2 4 1160Complete University 1 3 16 1429Total 100 100 100 874
Total Sample Rural Siera
None/Initial 7 16Primary 38 58Incomplete Secondary 13 11Complete Secondary 24 12Non-University Higher 5 2Incomplete University 3 1Complete Univesity 10 1Total 100 100
1/ All first week October 1991 Lima Prices, new soles
Source: 1991 PISS
toes, barley and wheat (Table 2.15). The cropswhich are produced by a higher share of poorrelative to non-poor farmets ae barley, potato, oca PERU: AGRICUTURAL L OWNERand olluco (Andean tubers). Yelow maie and rice Pi THEIRURAL SIERRAare grown by a larger share of non-poor farmers,while wheat and white maize are grown about Poor Non-poor TOtequally among poor and non-poor farmers. Thus Totalpoor fumers would benefit from icaes in theprice of potatoes or badey (or gains in pfitability). All Fam LAnd:As already mentioned, the suivey did not encom- Households owning land (%) 81.6 84.1 82.5
pass the area where nce gros However, acoding dh s o sn0i.9 .
to the 1985/86 PLSS, the poor were not impor Ladwning household only 0.34 069 045producers of this crop and it is unlikely that this has Irrigaed Land:changed.8 The Govermment's surchge on yellow Householdsowning land (%) 36 48.7 40.2maize (see para 2.15) benefits largely non-poor Capita:farming households. Also, the production of sor- wghum (also covered by the surcharge) by poor mmo item:farmers appears to be negligi'ble. Distribution of Rurwal Siera 67.8 32.2 100.0
Popuation
s*ne poorin Lain Amaica duingAdjostment -A Case Study of Source: 1991 PLSSPeru,' by Paul Okwwe and Dens de Tray, lng StandardsMeasurement Study Woring Paper, No. S6.
23

thirds are poor.TABL 2.1S
PERU: CROPS GROWN IN * Because of its size Lima contains the high-RURAL SIER8 A est number of poor.
Crop Exreey Poor Poor Non-PoorCm Ex_____ y_Poof Pow No__ _ 7* The poorhouseholdhasslightly more mem-
bers than the non-poor household. As a
w Maize mresult, each worker in a poor household% who fam 13 14 22 supports more family members.kg/capita 32 47 221
* Poverty is widespread among the indig-White Maize enous population.% who fam 9 10 9kgcapita S4 73 42 Most of the poor are either self-employed
Wheat ' or work in the private sector. The incidence% who fam 50 5s 50 of poverty is highest among the self-kg/capita 27 29 203 employed and the unemployed.
Rice '% wbo fam 3 3 S * Themostimnportantfoodcommoditiescon-kg/capita 656 787 2956 sumed by the poor are rice, bread, sugar,
tubers and meat.Barley% whofarm 60 54 42 The most important non-food commodi-
kgtcapita 37 40 180 ties consumed by the poor are detergents,
Potato public htansportion, soap, and clothing.% who farn 69 69 63kg/capita 111 139 444 * Only slightly over half of extremely poor
Oca households have access to a public water% who farm 11 12 7 syskm. Less than 30 percent have publickg/capita 50 48 126 sewerage service.
% who farn 8 10 7 * About two-thirds of extremely poorkg/capia 47 40 141 households are headed by someone with
no more than a primary education. Those1. Covered by the Goves surchrge sdCe. 1 who have not completed secondary educa-the case of what and ice ven famg ouseholds w tion are more likely to be found among theneAtpsdmm Crabk 2-10) poor than those who have finished sec-
Soure: 1991 PLSS ondary school.
* Among landowning households in the ru-
Sumun ral siem, the poor have roughly 50 percent less land than the non-poor. They are
2.22 TMe preceding sections have descrbed the also less likely to own irrigated land and
characteristics of the poor. In summary, the most even if they do own irrigated land, on av-
important conclusions of the poverty profle for erage, they own less than a non-poor
Peru are: household.
The incidence of poverty is highest in the * Poor households in the rural sierra have
rumal sierra; nearly half of the households more workers engaged in agriculture than
living there are extremely poor and two- the non-poor.
24

ing the rehabilitation or construction ofThe most important crops produced in the small-scale irrigation works. Measures torural sierra by the poor are potatoes, bar. increase productivity of the crops mostley and wheat. The crops which are pro- important to the poor (barley, potato, ocaduced by a higher share of poor relative to and olluco) would also be beneficial.non-poor farmers are barley, potato, oca Other measures are unrelated to agricul-and olluco. tural policies. For example, given the
higlher dependency ratio of the rural poorInipilcatlons for Poverty AUeviation Strategy and the low productivity of agricultural
employment, these households would ben-2.23 The broad guidance provided by the pov- efit from opportunities for non-fann work.erty profile for the design and components of apoverty alleviation strategy for Peru is summarized * In relation to the poor (as opposed to thebelow. extremely poor), the poverty profile indi-
cates that most of these households haveThe extent of poverty in Peru is substan relatively good access to public services,tial. About half of the population surveyed including education. These householdsfall below the higher of the two poverty are poor because they are either inlines and a fifth below the lower cutoff. low-paying, low productivity jobs in theGiven resource constraints and the need private or informal sector or unemployed.for fiscal discipline targeted programs What is needed to raise their expendituresshould focus on the extremely poor. above the poverty level are more produc-
tive jobs. And they are relatively well-4 The incidence of extreme poverty in the equipped to take advantage of more em-
rural sierra and among the indigenous ployment opportunities. For this grouppopulation largely accounts for the inci- what are most important are the executiondence of extreme poverty at the national of the economic reform program and lib-level. Thus, progams to alleviate poverty eralization of the labor market.among the extremely poor should targetthe rural sierra and the indigenous popula- * Based on consumption (and production)tion. These groups suffer not only from patterns, the poor would benefit from de-low expenditure levels, but also from low cdines in the price of wheat, rice and sugaraccess to public services, such as educa- as a result of a decrease in effective pro-tion and water and sanitation. Improve- tection for these crops. Since clothing isments in access, particularly for education, an important non-food expenditure, theare needed to reduce poverty. These poor would gain from the elimination ofhouseholds are also at greater risk for poor the ban on second-hand clothing imports.health because they lack clean water and Given the importance of expenditures onsanitation facilities. detergent and soap, the poor also would
benefit from increased competition in the* The fact that working in agriculture is manufacturing or importing of these prod-
positively associated with poverty points ucts, leading to a decline in price.to the need to look for ways to raise in-comes of fam households. Some possible * The surcharge scheme should be recon-measures relate to agricultural policies. sidered by the Govemment because, withPoorer farm households have less land the possible exception of dairy products,than better off households and the land is the poor are not benefiting from it. Forless likely to be irrigated Reforms related some products (sugar, wheat flour, pastato land titling should improve access to and rice) the poor are adversely affectedland and there may be scope for promot- because even poor farming households
25

are not purchasers of the commodities and their living standards. Although less documented,because the items account for a larger good health status also has a role to play in en-budget share for them than for the non- abling people to improve their lot. The povertypoor. The surchage on sorghum and yel- profile has shown that the extremely poor in the
low maize benefits better-off fams be- rual sierra are at greater risk for health problemscause they produce these crops to a greater because of low access to public water and sewer-extent than the poor. age systems. Thus, improvements in social ser-
vices - education, health and nutrition - are critical
2.24 The poverty profile shows the importance for the poor.of education in enabling households to increase
26

3
Social Services
3.1 Social services can play a dual role in al- gaps in coverage, and the intensity and quality of
leviating poverty. First, improvements in health, services is inadequate. There is also worrisome
nutrition and education, direcy address the worst evidence of a decline in the demand for services.
consequences of being poor. Second, there is In nurtion, food security generally has declined
ample evidence that investing in human capital, for the poorest. Peru suffers from relatively high
especially in education, attacks some of the most rates of child malnutrition and low birth weight.
important causes of poverty. The programs which There are also micronutrient deficiencies in some
have the greatest impact on the poor are primary areas of the country. The response to malnutrition
education and health care. This section reviews has excessively relied on food assistance and given
the status of services in education, health and nu- insufficient attention to complementary health
trition, focusing on those activities most important measures, micronutrient supplementation, and the
for the poor, and highlights the major issues con- promotion of better health and nutrition practices,
fronting these progmms. including breast-feeding and chfld growth and de-velopment monitoring. There are also problems of
3.2 In education, there has been an impres- poor coordination among the agencies active in
sive expansion in primary enrollments. However, nutrition, a lack of an overall framework for nutri-
this has been coupled with a decline in expendi- tion interventions, an absence of norms and guide-
hures per student and an exodus of trained teachers lines and weak nutrition surveillance.
from the system. Repetition rates are high, par-ticularly in the early grades. In addition, there are Educationwide disparities in educational attainment and ef-ficiency within the country. Another concern is Status of Servicesthe persistence of a relatively high rate of Wit-eracy as little progress has been made in rual ar- 3.3 Peru expanded educational opportunities
eas and among women. In health, in spite of an substantially during the last two decades. The
expansion in primary care infrastructure, Peru has share of 6 to 14-year-olds attending school in-
some of the worst indicators on the continent, par- creased steadily from 78 percent in 1972 to 89 per-
ticularly in rural areas. Many of these conditions cent in 1991 according to Government figures. The
could be improved with more concerted efforts in high proportion (97 percent) of each age cohort
primary health care. Also, the full benefits of the who enroll in first grade on time (between ages 6
network of facilities are not being realized be- and 7) suggests that parents are committed to send-
cause of the scarcity of equipment and the poor ing their children to school. However, during this
distribution of personnel. In general, there are time the real level of expenditures on education
27

but the high repetition rate is an obstacle to univer-TABLE 3A. sal completion of primary school. It also creates
PERU: WAGE AND BUDGET INDICES incentives for early dropout and is responsible for
1980 198S 1989 1990 a large degree of age heterogeneity in each gradewhich makes teaching very difficult. Students
Teacbers Salares 100 66 24 - spend an average of 13 years in each grade so thatBudget Index 100 86 39 26 by grade 6 almost three-quarters are overage. On
Mm Wage 10 s 31 27 average, for each graduate the system spent re-c-uCollan 100 61 so 29 sources equivalent to 8.4 years of schooling, 40
White-Collar 100 80 60 31 percent more than what would be necessary in theabsence of repetition and premature leaving.
Source: Peru en Numeros, Cuanto S.A.
3.7 The high level of repetition in first gradeseen in Peru is common in Latin America. To ad-
generally declined. The decline in real expendi- dress this problem many countries have expandedtures on education, coupled with expanding enroll- the coverage of pre-schools. Peru has significantment, resulted in a shatp drop in per student experience with pre-school education. There is anspending after 1985, from $175/student to about extensive network of formal pre-schools and non-$80/student by 1989-90. formal pre-school centers with strong community
involvemen, (PRONOEI). About 70 percent of the3.4 The impact of fewer resources on the population of 4 to 5 years old is enrolled in pre-quantity of educational services was ameliorated school. The proportion of children served by non-by the even sharper drop in the real level of formal centers increased from 15 percent in 1980teacher salaries. Salary levels fell for most groups to 39 percent in 1989. However, evaluations ofin Peru during this time, but by 1989 the decline non-formal programs suggest that, while theyeperienced by teachers was greater than the drop work relatively well in the area of early childhoodin the minimum wage or in the average wages for stimulation, they do not do as well preparing chil-blue and white-collar workers. In response, many dren to enter primary school. These centers aretrained personnel left the teaching profession. As a mostly located in poor areas and are organizedresult, between 1982 and 1990 the proportion of more as day-care centers, staffed by volunteersuncertified teachers increased from 25 to 50 per- who have received litle training and lack the basiccent. teaching materials or facilities required to prepare
children for school.Issues
3.8 National averages mask sharp differences3.5 Access to prmaty education in Peru is al- in educational attainment and internal efficiencymost universal. The main education issues related between regions and between urban and rural ar-to poverty are: (a) the high level of internal inef- eas. Departments with the lowest educational at-fclcency, in part explained by the poor quamty of tainment (percentage of students completingteaching; and (b) the signficant disparies tn Grade 6) tend to have the highest proportions ofeducational attainment and Internal effiiency uncertified teachers and schools with no electric-within the country. Table 3.2 summarizes some ity, water or sewerage. Based on 1981-88 data, theindicators of internal efficiency in primary educa- highest percentage of students completing Grade 6tion. The impressive increase in enrollments has was the 85 percent recorded in Lima. The capitalnot been matched by improvements in educational also has one of the lowest percentages ofattainment uncertified teachers (47 percent). At the other ex-
treme, the lowest share of students (28 percent)3.6 A comparison of gross and net enrollment completed Grade 6 in Ayacucho which has one ofratios over time suggests that there are enough the highest proportions of uncertified teachers (65places to provide for all children 6 to 11 years old, percent). In Ayacucho it takes 15 years of school
28

TANA 3.2 PERU: INDICATORS OF INTERNAL EMCIENCY OF PRIMARY EDUCAlnON, 198
Evolut of GOss and Not Ewolment Ratio, 1960-1990
Eumflut RatIos 1960 1970 1980 1990
GrEssEollmnt Ratio 83% 105% 114% 118%Net Enrollment Rstio 77% 86% 87%
Grades
One Two Thino Four Fve Skn Total
RepetitionRates 32% 21% 20% 16% 16% 6% 20%
Over-Age Students by Grade
Oneyearormore 32% 47% 57% 64% 70% 72%Twoyeamsormome 10% 18% 26% 32% 38% 40%ThreyYosmor mom 4% 8% 11% 14% 18% 19%
Avenage#YearsperGrade 1.6 1.4 13 12 1.2 1.1 13
Summry Results
Percentage who Graduate 77%P _cetage of Entering Ohort who Grauate without Repatig 22%Percentage who Graduate without Repeaing 29%Student Years Per Gradat 8.4Average Number of Years in Pimary Eucaion 6.4Average Number of Grades Completed 4.9ibputOutput Ratio (Student Years per GraduaWYeas in Cycle) 1.4
Soures: UNESCO, Statistical Yearbook; Schiefelbein, E. and Helkkin, S. PeruAcoess, Repetitibo and Efficicy in Primy Education. OREALC, October 1991.
resources per graduate from Grade 6, 25 times teaching practices there do naot differ substantiallymore than what would be required in the absence from practices in regular schools. Since most ofof repetition and dropout. On the other hand, in these teachers have received very little trainingLima it takes 7 years to produce a graduate, only they tend to use the objectives, contents, method-17 percent more than if no repetition or dropout ologies and materials that have been developed forexisted. a setting of one teacher per gamde, without adapt-
ing them to the reality of multigrade teaching. As3.9 The lack of textbooks and teaching mate- a result, teaching is of poor quality and much ofrials is a serious constraint in multigrade schoos, the time spent by students is irrelevant. Most ofmost of which are located in rural areas. Few pri- these schools also lack furniture, have not been de-mary students have textbooks and schools have signed to meet the needs of multigrade teaching,little or no teaching materials to support teachers' have not been properly maintained and lack evenactivities. In the absence of textbooks, students at- basic sanitary facilities.tending multigrade classes are left idle or assignedirrelevant tasks while the teacher attends to stu- 3.10 The poor quality of primary education anddents in a different grade. Studies of conditions in signiicant intra-country disparities are reflected inrural areas and multigrade schools suggest that sudent perfomnce. While mo recent information
29

is not available, a 1981 study revealed that a largepercentage of students reaching Grade 6 had not TABLEM3.mastered basic skills in mathematics, social sci- MORTATY RATE Y GION
ences and natural sciences (See Statistical Appen- ( tOlvebhts)dix Table 1.13). Students living in the siea regionand other ural areas performed the worst and Range
those in Lima the best Since teaching conditions Avrage by Department
have deteriorated substanutially in Peru durig the1980s, both in terms of the amount of resources Amazona as
allocated to educaton and the number of certified ACroqpa 73
teachers, performance today is likely to be even Chavin 87lower. Gtau 94 72 96
Inca 123 88 126
3.11 A study of the academic performance of wae 101 62 131Maniategn 105 73 114
students attending secondary schools in Lima pre- MaoaIs 87 73 95
sents a similar picture. A large percentage of sec- S M-La Librtad 70 66 81
ondary students taking the test at the end of the Ucayali 85
cycle scored below a minimum standard in math- Lma-ca 57 55 58
ematics, nuae, social sciences, and natur sci- tOW 83 55 131
nces. In spite of the low levels of academic per-formance 25 percent of the relevant age group is 'The 1991/92 Demograpc and HealtnHrvey ress
enrolled in institutions of higher education. Gov- for Peru bndicate a national IMR of 64/1,000, with raes
emrnent spending on higher education represents forrions fm 30,0Lma)to 103/1,000 (Inca).
about a third of total expenditures on education Source: Mist&Y ofHeakh, INFJ
(1984 data), surpassed on the continent only byVenezuela. This indicates a need to re-examinebudget priorities, and to explore whether publicspending on higher education results primarily inincreased producdvity or postoned unemployment Health and Nutition
3.12 Another issue is the perstence of a rda- Health Conditionstively hih rate of iteracy. Between 1961 and1981 the illiteracy rate deceased by slightly more 3.13 Peru faces serious health problems, in
than half, from 40 to 18 percent. However, in 1986 terms of both mortalitY and morbidity. Infant and
illiterates still represented 13 percent of the popu- maternal mortality rates are among the highest in
lation. Census and household surveys show that il- Latin America. There are wide disparities in health
literacy is primarily concentrated in rurwal areas and conditions within the country. The risk of infant
affects disproportionately women, the Quechua death in the Inca, Wari or Mariategui regions is
speaking population and those living in the geo- twice that in Lima (Table 3.3). At the departmental
graphic area called "Trapecio Andino". More than or provincial levels, differences are even more
a third of the population living in rural areas was striking. A major share of morbidity results from
illiterate of which 70 percent were women. Ciov- causes which would be preventable through vacci-
emnment efforts to eradicate illiteracy have been nation or improvements in sanitation. In 1991, for
more effective among males and urban dwellers example, Peru faced the most serious outbreak of
than among women or rural dwellers. During the cholera in the Americas in this century. Typhoid
eighties progress to reduce illiteracy slowed con- fever and hepatitis are both endemic. In some ar-
siderably compared to the gains achieved during eas, leishmaniasis, yellow fever and dengue are
the 1970s. As a consequence, the number of illiter- important sources of morbidity. Added to already
ates increased by 1.5 percent between 1980 and serious morbidity patterns is evidence that some
1986. important diseases are on the rise. Tuberculosis
30

cases have increased 20 percent over the last 10years and malaria cases have doubled over the PERU: TABLE 35.
PERUTV4SMT OF CONTAC!Ssame petiod. N THE U 1 IRNAL-CHI) PROGRAM 1989
Status of Services NumberofGrOup Contacts per
3.14 The primary health care network has ex- hIdividualpanded over the last tel. yeats. The number ofhealth centers has increased by 60 prcent and the Pgnant Women 1.9
number of health posts has doubled. Curently JAmting Women 0.4
about 1,000 health centers and 3,000 health posts Family planning 1.7Under One Yea 1.6
exist nationwide (about 1.9/10,000 inhabitants) 14 Yeuars 1.6
potentially an acceptable number depending on the 5-14 Years 15
geographic dispersion of the population and the Vacinations < 4 Years 1.8
personnel and equipment available at eachsa- O among those raivin care fm
lishment- Ministry of Healhi
3.15 Table 3.4 shows the coverage of some ac- Source: Ministry of Health
tivities under the Ministry of Health's matenal
and child health program. The coverae of infantsunder age one is probably overstated becase par-ents must visit a health facility in order to receive a for all activities. For example, on average, lactating
birth certificate. Often the visit occurs when the mothers receiving care have only 0.4 health con-
child is a couple of days old and is not followed by tacts per year and pre-school and school-age
later visits. About 60 percent for prenatal attention groups show similarly low numbers of contacts.
is relatively high. However, coverage of otherequally important services is extremely low. For 3.16 The availability of pharmaceutical prod-
example, family planning progwams serve only 6 ucts is a critical factor in the provision of high
percent of women in the feraile age group, well be- quality health services, both to achieve effective
low regional norms. Examining the quality of care treatment and to create the confidence of benefi-
for vulnerable groups, Table 3.5 shows that it is ciaries and health workers. Pbarmaceutical supply
significantly below the target lvels of the Ministry to the public sector has suffered from: (a) a disor-_anized logistics system; (b) budget constraints;
TABLEX3 and (c) the failure to place high priority on drugPERU: COVERAGE OF THE provision. In 1984, about $145 million was spent
MATERNAL-CLW PRO.RAM 198 in Peru on medicine from private pharmacies, in-dicating that the commercial sector is an important
Total Percent Recewmg source. However, in the face of declining incomes
Population Population Minisy of Health and higher prices for imported medicines, manySubgroup ('000) % people are relying more on the public sector, exac-
Pregnat women 645 57 erbating the Ministry of Health's supply problems.
Lactaing women 630 13Family Plannng 1 4,950 6 IssuesLess than one year 630 86
1.4 years 2,221 2 3.17 While the distribution of primary health
care infrastructure is good, the poor distibuton1. Women of fertle age of professional resources is a major issue. There
are three dimensions to the problem. First, al-Somrce: Mhrisfrh of Health though the total number is adequate in some fields,
such as doctors, health professionals are ten times
31

T,,3 recent economic crisis has been the markedNURSESERDOCTOR physical detedoration of the buildiW and
shortages of equipment As a result the signifi-1975 1980 1985 1990 cant cons;tcton program for health centers has
not had the intended results. As of 1990 only thr-Peru 0.5 0.70 0.66 0.66 quarters of the centers which had been constucted
were functioning because of the lack of equipmentain Amedca 2.01' 1.95 200 -
a. 1974 3.19 One effect of the recent economic crisisa 1974 seems to be a very low utilization of primary
health care services as seen in a small sample ofSour: Minisy of Health and Orosb, Sodal health centers in Lima and Piura (a city in theapending Lan Ameica, World Bank Discussion costal region). In several centers, the average pro-
Paper No. 106. ductivity of the professional was 2 consultations/
hour, whereas an acceptable norm would be 41hour. Other examples of low production are the
more available in Lima than in the least developed few emergency patients seen on the evening shift,regions. In the sierra region, physician availability the small number of laboratory analyses done peris only about 1/34,000 people. Second, the compo- day and the low occupancy rate in maternity hospi-sition of skills is not optimal mainly because the tals. In the South LJima UDES, an analysis of ser-ratio of nurses/doctor and nurses/population is too vice production demonstrates a significant de-low. Throughout the country the availability of crease in most activities between 1988 and 1990.nurses is clearly insufficient. PAHO recommends The average number of consultations per hour fora ratio of between two to four nurses per doctor. If all personnel in health centers was 2.44 for doctorsthe ratio is lower, it implies that doctors, who cost and 2.04 for midwives, relatively low consideringmore to train and to pay, will have to perform tasks the high population density. The poor utilization offor which nurses are adequately skilled. 'The ratio health services is likely to be due in large part toof nurses to doctors in Peru is below one, substan- the lack of effective supply. Part of the explanationtially lower than the average for Latin America. may be user perceptions of limited value becauseThird, as already mentioned, the aspect of service of lack of equipment, supplies, etc. in health facili-most imPorant to the poor is primary health cm. ties and poorly trained staff.The resources from the Ministry of Health in thisarea are 1/16,000 for physicians and 1t20,000 for Nutitlonnurses, extremely low ratios. Health professionalswho work for the public sector have been ad- Child Nutri0onal Statusversely affected by the decline in real salaries inthe civil service. This has caused morale problems 3.20 Chronic child malnutrition is a serious andand work stoppages. A majority of Ministry of widespread problem. A nationwide survey carriedHealth workers were on stike for four months dur- out in 1984 found that six percent of children suf-ing 1991 in the midst of the cholera epidemic. fered from some degree of acute malnutritionNevertheless, the total supply of doctors and (wasting) and over 51 percent suffered from somenurses in Peru rose at an annual average rate of degree of chronic malnutrition (stunting). Bothnearly 5 percent between 1985-1990, exceeding acute and chronic malnutrition were concentratedthe rate of population growth. among children in the sierra regions. Over half of
sierra households had malnourished children, com-3.18 Although the number of primary health pared to 13 perc- r. of Lima households, 16 per-facilities appears adequate, one of the effects ofthe cent of selva haus,holds and 19 percent of other
coastal household. While overall, 6 percent of1. "SocialSpendinginLatinAmerica: TheStoryoftel980st"by children were severely stunted, 11 percent of chil-Marr rosh, Wodd Bank Discuon Paper No. 106. dren in the sierra were severely stunted. Only 1
32

percent of children were moderately or severely TAKE3.7.wasted. Child nutritional status had improved little PEU:sDsEA TRENDSbetween 1972 and 1984. The 1991/1992 Demo- (C pMe,Mpopuaien)graphic and Health Survey results suggest thatlittle has changed since 1984. This recent survey 1980 1989again found 50 percent of children under age fivesufrn_ g frm some degree of chronic maltiton. Tios 93 124
Acute Respity Iness 470 3,1463.21 A regional comparison of child nutritional Acute Disihe Dease 444 1,379status in Peru with Bolivia, Colombia, Ecuador Sand Northeast Brazil based on UNICEF data for Suveillanthe most recent years available in each country in-dicates that in 1984 Peru had the highest propor-tion of moderately-malnourished children (11 per- period.cent) and a relatively high share of severely mal-nourished (2 percent) based on weight for age cri- 3.24 Data suggest that food security has de-tera. The data also suggest that higher overall food clined for the poorest quintile of households inavailability is no guarantee of better nutrition Lima as compared to 1985/86. This is in spite ofamong children, since Peru's food availability is the fact that the shae which Lima residents spendbetter than countries with better child nutrition. on food decreased across all expenditure levels be-Other factors which influence child nutrition in- tween June/July 1990 and October 1991. The mostclude the lack of adequate household purchasing likely explanation is a decline in the "lative pricepower, inappropriate feeding beliefs and practices, of food (Table 3.9). For other parts of Peru, poorand child infection. households in the ural sierra continue to spend the
highest proportion on food, followed by the poor3.22 Patterns of growth faltering among Peru- in the urban coast and the urban sierra (Table 3.8).vian children dunng the weaning perod (between6 and 24 months) and later improvements suggest Micronutresthat child growth is jeopardized more by inappro-priate weaning practices than by lack of food. 3.25 A national smuvey in 1986/87 estimatedCompared to the U. S. National Center for Health that goiter is endemic in 88 percent of communi-Stafistics reference population, the growth of Peru- ties in the sierra and selva and that the averagevian children tends to slow by 6 months of age and prevalence among school children is 34 percent.to resume expected rates by 24 months of age. The problem is most common in areas where diets
have no natural source of iodine. Since 1940, Peru3.23 In light of the close link between malnutri- has had laws governing the production and distri-ton and infection, information on morbidity trends bution of iodized salt. In practice, however, onlyprovides additional insight into the nutrition situa- 60 percent of the population consumes iodizedtion. Surveillance data from the Ministry of salt. Reasons for this low coverage include higherHealth's Epidemiology Office highlight significant cost, irregular distribution from production pointsincreases in the incidence of acute diarrheal dis- along the coast to endemic zones and the largeease and acute respiratory illnesses. As Table 3.7 number of natural sources of non-iodized salt. Na-illustrates, from 1980 to 1989, the rate for acute tional programs have successfully overcome simi-respiratory illnesses increased six-fold and that of lar obstacles in Brazil and Bolivia by subsidizingacute diarrheal diseases doubled. This suggests the increase in production costs and by involvinggreater precariousness in living conditions, de- small production facilities which market salt fromcreased effectiveness of preventive health mea- these natural sources.sures and the increasingly vulnerable nutritionalstatus of the population. It is unclear to what extent 3.26 No comprehensive study has been under-increases also reflect better reporting in the later taken to determine the prevalence and concentra-
33
ka

TABLEM3.L TABLE 3.9PERU: CHANGES IN HOUSEOLD PERU: FOOD CONSUMiON AS
FOODSHARE PERCENTAGE OF TOTAL CONSUMPllONBY REGION AND ENDITlE LEVELS FOR Lur J ouSEHOLS
FROM 15686 TO 1991Quintilo 1985/86 Junewuy October
Poo0oC Poo" AU 1990 199110% 30%
1 53 64 59Urban 1985/86 65% 62% 49% 2 55 61 55
Coast 1991 69% 67% 55% 3 51 55 524 48 51 49
cdan 7% S% 6% 5 38 42 33
Urban 1985/86 64% 65% 48% Average 45 49 43
Sioera 1991 61% 63% 50% Source: Glewwe and Hall, 1991; Cuanto 1992
chae -3% -2% 2%
Rual 1985/86 72% 77% 72% Development Program is a nationwide promotionSiera 1991 76% 76% 68% program In addition the Ministry operates the Na-
tional Program to Control Goiter and Endemicdcue 3% -2% 4% Cretinism (PRONABCE). The Child Growth and
Source: Glwwe, 1987; to92 Development Program aims to promote integratedchild health, improve child survival and improvethe quality of life. Four of the program's eight ob-
tion of iron deficiency anenia. Small scale studies jectives relate to growth monitoring: (a) monitor-
among population subgroups indicate that anemia ing growth as a way to target children for nutri-
is a public health problem, particularly among tional supplementation; (b) promoting supplemen-
pregnant and lactating women and children. With tary feeding for at-risk mothers and children; (c)
increased economic hardship, rates of anemia are identifying and rehabilitating malnourished chil-
likely to have risen as people reduce consumption dren through community food distribution; and (d)
of animal and other iron-rich foods, relatively ex- conducting community outreach to stimulate de-
pensive sources of calories. mand for growth monitoring. The other four relateto improved prenatal nutrition, breastfeeding and
Nutritink Services approprate weaning; (a) improving birthweightthrough maternal care, including food, iron and io-
3.27 Programs to address malnutrition include dine supplementation; (b) encouraging joint rooms
food assistance, health programs and education in hospitals for mothers and newborns; (c) provid-
campaigns. Peru's extensive experience with food ing trining at health services on techniques for ex-
asance is covered in the next chapter. However, clusive, long-term breastfeeding; and (d) promot-
feeding programs are not the complete answer to ing appropriate weaning. While program objec-
improving nutritional status. Malnutrition is not tives are comprehensive, its budget and activities
only the result of a lack of food. Parasites, diseases are inadequate to achieve them. In 1991, the oper-
and other health problems are often to blame. To ating budget was under $300,000. The low funding
be effective, therefore, nutrition programs need to for the program contributes to a high concent,ation
be combined with health programs including ma- of activides in Lima. The program also centralizes
ternal and child health, immunization, sanitation, supervisory responsibility, making supervision of
dewomting, oral rehydration therapy and micronu- health center personnel an expensive undertaking
trient supplementation. Education in primary with limited involvement of the subregional level.
health and nutrition is also crucial where localpractices are inappropriate. Issues
3.28 The Minis of Health's Child Growth and 3.29 Nutrition in Peru is characterized by the
34
participation of a wide range of actors - the central sis for a nutrition surveillance system. The Minis-government, regional govemments, community try of Health and regional governments have beengroups, donor agencies, private firms and NGOs. collaborating with the NGO PRISMA to establishConsiderable gaps and duplications occur In regional surveillance systems. This work has be-the hnctions of these actors. Within the central gun in Arequipa, Lima and Iquitos. The Govern-government, the Ministry of Health is formally re- ment sought to promote greater interagency coor-sponsible for problem diagnosis. However, t does dination by organizing the SISVAN Network, anot always guide actions by other central gov. loose association of governmental and non-gov-ernment agencies. PRONAA operates on the ba- enmmental agencies active in nutrition. Within tightsis of its own problem identification as does the resource constraints, a nutrition surveillance sys-Ministry of Education (School Feeding: "La tem to monitor small sentinel populations repre-Escuela Defiende La Vida"). No clear mechanism sentative of important target groups would be ap-exists for prioritizing problems or for channelling propriate. Selected local health authorities couldgovernment efforts to resolve them. Multilateral periodically monitor nutrition status under theand bilateral donor agencies, non-governmental guidance of regional and Ministry of Health offi-agencies and community groups base their activi- cials. This would complement currently availableties on their own perceptions of Peru's nutrition data dawn largely from program beneficiaries forproblems. program monitoring and evaluation purposes.
3.30 The function of establshig norms and 3.33 Peru does not have a nutiton policy.standards largely nglcted. The Ministry of The absence of a framework has led to duplicationHealth only establishes standards for food quality of functions among state and private agencies, aand growth monitoring protocols. Multilateral and lack of atteaion to achieving major improvementsbilateral agencies establish their own standards in in nutritional status and less than optimal resourceother important areas. The Govenmment should de- use. Peru needs a national nutrition policy tovelop standards in three key areas: (a) unit costs achieve four major aims: (a) to establsh consensusfor interventions; (b) food assistance progmming on the priority ranking of problems and targetpractices; and (c) information collection and im- groups; (b) to identify key functions in nutritionpact evaluation. and establish institutional responsibilities; (c) to
set program standards for impact, information re-3.31 No agency of the central government Is quirements, unit costs and quality, and (d) toresponsible for mobilizing resources Instead, strengthen its dialogue with extemal agencies.donors base contnbutions largely on their own di- While a fundamental consensus exists that preg-agnoses, funding constaints, dialogue with gov- nant and lactating women and children under ageernment and non-governmental agencies, and spe- five are the most vulnerable group the nutritioncific proect proposas. Outside the central govem- policy will need to establish Peru's priority rank-ment, comm ty groups, NMOs and regional gov- ing among other important groups. How willernments mobilize resources based on specific choices be made between the maternal-chiid groupproposals. The central government could probably and school children? Will rral populations bemobilize greater resources for nutrition if it took a given preference ove urban ones? Will resourcesmore active role in its dialogue with donors. The be directed proportionally to all regions or willGovernment should assign this function to the critical regions receive the resources required forMinistry of Health and it should seek to mobilize significant advances before funds are channelled toresources on behalf of both govermental and non- other areas? A substantial proportion of nutrtiongovernmental agencies on the basis of priorities resources come from external donors and majorand implementation capabilities. progams are implemented by NGOs. Thus, it will
be important to seek donor and NGO feedback on3.32 Peru does not have a formal system for the policy as it is being developed. As part of itsnutrition swrveillnce on a nal leveL How- strucua adjustment program, Peru prepared a nu-ever, several ongoing initiatives could form thi ba- trition plan in 1991. This plan proposes reforms in
35
food assistance and a stronger role for the Ministry illiteracy. Health statlus is poor is Peru. Needed
of Health. Under the plan, donated food use would equipment is lacking and personnel is poorly dis-
be rationalized to achieve nutrition objectives, tnbuted. The intensity and quality of services are
with priority atteation to poor families with preg- not adequate and the latter may have contnbuted to
nant and lactating women and chDdren under a decline in the demand for health care. Peru suf-
three. The plan reflects valid objectives and the fers from relatively high rates of child malnutri-
Govemeit ow neds to takestop to implement it. tion. The response to malnutrition has excessivelyrelied on food assistance and given insufficient at-
Coucluslos tention to complementary health measures, mnicro-nutrient supplementation, and the promotion of
3.34 This chapter has reviewed the status of the better health and nutrition practices, including
education, health and nutrition services most im- breast-feeding and child growth and development
portant for the poor. The major issues confronting monitoring. The next chapter will carry this analy-
these prgrams also have been highlighted In edu- sis fiuther by looking in detail at the use of these
cation the main concerns are higb repetition rates, services by the poor and identifying activities for a
wide disparities in education antainment and effi- poverty alleviation program.ciency within the country and the persistence of
36

4
Towards a Poverty Alleviation Strategy
fttroduction broad-based growth and improved, more equitablydistrbuted social services. A discssion of two
4.1 In the long run poverty can be reduced only such progams concludes this chapter. Mechanismsif broad-based growth is achieved. However, the to generate employment are the subject of muchpoor must have sufficient access to health and interest in Penr Food assistance is a major publiceducation services. Otherwise they may not be program spending substantial resources.educated or healthy enough to take advantage of theopportunities available in an expanding economy. Sodal ServicesAlso, it will take time to dismantle bad policies andrespond to new incentives. The benefits of growth Educationmay not flow immediately to some of the poor,pariculalyinPeruwheremacroeconomicinstabil- 43 EDUCATION AND THE POOR. Povertyity and economic deterioration have been so severe influences school attendance in two ways. First,and where extreme regional disparities exist in the children of poor families begin attending school atwelfare of the population. Vulnerable groups such a later age; second, a larger proportion of childrenas mothers and young children, the old and the sick of the poorest families never attend school or drop-are not able to participate fully in the economy. For out very early. Data show that attendance rates forthese reasons, a strategy to alleviate poverty needs chidren between the ages of 6 and 10 are lower forto incorporate special efforts in social services. The thepoor.(rable4.1)Amongpoorhouseholdsintheissues relating to basic education, primary health rural sierra, 8 percent of children aged 6-10 are notand nutrition services, which were discussed in the attending school, a high figure in the context ofprevious chapter, suggest cerain lines of action. In neary universal primay education in other pars ofthis chapter that information is supplemented with the country.' Two possible explanations for thedata on the use of social servicesby the poorin order higherattendance rates for older children from poorto Wdentify specific p ams frpoverty alleviation householdscomparedto those for younger children
are that they start school at a later age and that they4.2 Even with improved social services, in theshort-run some groups may remain vulnerable be- 1. Anendace mm fmm te PLSS are higher than Govenmentcause they are already living on the edge. For these admat (ppg.aph 3.3). The Govenmnt figures ane deivedpeoplewelldgnedsociacompensationproams from enrome informadon frwm schools wad esimates of thecould complement the two main elements in pouaon fiee dh oemagecategorks.n pthecase oftheSSbthe poverty alleviation strategy - promotion of hndef anbd on rpopdlmation
3-

TABLE" .PERU:SCHOOLATTENDANCEDY 4.6 EDUCATION PROGRAMS TO ALLE
AGE GROUP AND POVERTY LEVEL VIATE POVERTY. The first priority is to increasethe internal efficiency of schools in poor areas. The
Extremely Poor Poor Non-Poor poor academic performance of primary students
ADAa and low completion rates among those in rural andpoor uban areas, demonstrate the importance of
6.10 yxeasf improving the capacity to retain students, to moveAntrtdsSchool 94.1 95.6 989 them faster through the system by reducing repeti-Does Not Attend School 5.9 4A 1.1 tion, and to increase the knowledge they get through
1114 yars schooling. Improving conditions in rural multi-Atends School 98.8 993 99A grade schools would particularly benefit the poor.Does Not Attend School 1.2 0.7 0.6 This can be done by developing specialized text-
Pi"al Sian books and materials and providing teachers withRtaining geared specifically to the requirements of
6.10 years multigrade schools.Attends School 92.2 92.1 97.2Does Not Atend School 7.8 7.9 28 4.7 Second, a program to provide textbooks
11.144 ye and teaching materials and to train teachers forAttends School 97.1 98.0 98.6 otherschoolsinpoormarginalurbanandruralareasDoes Not Ated School 2.9 2.0 1A can improve the quality of teaching, increase stu-
Source: 1991 dent time dedicated to school work and provideSourc: 1991 PLsS more relevant learning experiences. These contib-
ute to reducing repetition and to improving intemalrepeat grades. efficiency which will load eventually to higher
primary school graduation rates at fewer school
4.4 Attendance rates for female students are years per graduate.somewhat lower than for male students, but by arelatively small amount Thepatternisevidentinall 4.8 Third, pre-school programs that concen-
areas except Uma, but the pattern is more pro -
nouncedamongtheextremelypoor,withtheexcep- TABLE 4.=
tion of the rural sierra where it is present among all PERU: KINDERGARTEN AIF1ENDANCE BY
households. POVERTY GROUP
4.5 One factor behind the relativey high rep- Ermly Poor Non-Poor
etition rates for children from poorer households is Poor
lower kindergarten attendance (Table 4.2). About Peree Atending 22 25 37
86 percent of 5-year olds in non-poor householdsattend kindergarten, whereas the share for the poor PRONOE 43 34 19
is 55 percent snd for the extremely poor only 45 Go[e K 8 4
percent.Thelowerattendancemayreflectapercep- o 1 1 o
tion of low quality services or a lack of knowledgeof the benefits of kindergarten because the main Kindat by Age
reason given for non-attendance is that the "chil- 2 9 7 10dren are too small", not financial constaints or a 3 18 18 24
lack of facilities. Children from poor households 4 34 40 60
attend mainly PRONOEI or Government-run 5 45 55 86
schools, while children frm better off householdsattend private kindergartens in substantial num- Sore: 1991 PLssbers, as well as Government-run schools.
38

trate on prepaing students for primary education TABLE 4.3.have been shown to be useful in other countries in PERU: PERCENTAGE OF CILRENreducing repetition in the early primary grades. RECEIVING ALL REQURD VACCINATIONSSuch programs both improve the likelihood of (Sff Reported)student promotion and reduce the risks of ay Poor* Non- 0-2 3-5 6 9-12dropout and should be stressed more in the poorer poor.areas of Peru. Steps need to be taken to improve thepreparation of children for school in the PRONOEI Al Are 75 81 52 78 86 90and Government-run kindergartens and to promote ijma 84 86 58 88 94 96greater awareness of the values of kindergarten Urban Coast 75 80 61 68 85 93Urban Sierra 77 82 53 81 91 89among the poor. One way to attract poorer students Rural Siem 65 70 37 69 75 78would be to offer school feeding programs at thislevel in some localities. 'Ages 0-12
4.9 Fourth, a program to teach non-Spanish Soume: 1991 PLSSspeaking women basic functional skldls should bepart of poverty alleviation efforts. The incidence of based or PLSS-based rates for younger children.poverty among non-Spanish speakers is vety high. mmunization coverage for children under two inSince illiteracy creates obstacles to using informa- other areas ranges from 50 - 60 percent. Thesetion and hence to impoving living standards for compareto coverage of nearly 90 percent for olderthemselves and theirchildren, poor illiterate women children. In general, vaccination rates are higherforare trapped in a vicious cycle. Basic literacy and children in better off households.numeric skills can help to break this cycle. Pro-grams to reduce illiteracy in this group must con- 4.11 Vaccination coverage usually overstatessiderthattheyarewidelydispersedandthushardto access to health services because immunizationsreach and that their free time is minimal. Experi- are the focus of special campaigns. Table 4.4 pre-nce from other countries suggests using NGOs. sents data on the share of ill people who seek
They have the capacity to reach deprived areas and medical care. As expected, these numbers show ato incorporate literacy programs into ongoing ac- lower coverage than for vaccimtions. There is alsotivities, thereby reducing costs. a wider gap between the poor and the non-poor.
Overall, half of all ill people seek medical care.Health Among the extremely poor, this drops to about one
in three. As for vaccinations, that gap is matched4.10 HEALTHANDTHEPOOR.Vaccinations and in some areas (rural sierra) exceeded by differ-are important to improve the health of children. ences between regions. Access to health services isData from the Expanded Programme on Immuniza- more equitably distributed in Lima relative to othertion (EPI) indicate that coverage of infants under 1with 3 doses of DPT (a common measure of vacci- T .4LE"nation program success) was 71 percent in 1991. PERU: PERCENTAGE OF ILL WHO SEEKThe lowest coverage registered under EPI was 59 MEDICALAITENTIONpercent for the measles vaccine. Yet based on the Eeely Poor Non-Porresponse of mothers, recent data from the PLSS Poorsuggest lower coverage of immunitions amongchildren under age two (Table 4.3). In the wral AD Areas 34 44 56sierra, only 37 percent of children under two were Lima 44 53 59
Urba Coast 49 54 63reported to be fully immunized. While this may be Urban Siea 31 40 55partially explained by the inclusion of infants too s Rau &erra 24 27 46
young to have been fully imunized it appears tosignal a breakdown in services since rates among Sowce 1991 PLSSolder children are much higher than either the EPI-
39

areas. There is a particularly large gap between the which have public sewerage facilities account forpoor and the non-poor in the sierra. fewer than 40 percent of the cases.
4.12 Where are the poor likely to go for care 4.15 Health Propms for Poverty Alevia.when they are ill and whom are they likely to tDon. The first priority is to provide mothers andconsult? In general, the poor are more likely to use young children with adequate primary healthhealth centers, health posts, and pharmacies, than care. This would include: (a) pre-natal anti-tetanusthe non-poor. Nevertheless, the highest proportion immunizations,andironsupplementation;(b)sani-of the poor (30 percent) use hospitals. On the other tary home delivery and trained personnel for high
hand, clinics - most of which are private - ar. risk deliveries; (c) child immunization and growth
overwhelmingly used by wealthier households. In monitoring; (d) family planning information and
Lima, while the extremely poor are more likely to supplies; (e) health education; and (f) treatment ofvisit a health center, the poor make greater use of common infectious diseases and first aid.
hospitals. In the urban sierra, the poor use hospitalsto a greater extent and there is little reliance on 4.16 Thegreatestbarriersthehealthsystemfaceshealth centers, particularly by the extremely poor. in providing care are lack of supplies and inad-
In the rural sierra, the extremely poor make greater equate human resources, particularly in areas ofuse of hospitals and less use of health centers and extreme poverty. It is important to improve the
posts than the rest of the population. The poor are supply of basic equipment, mateials and medi-more likely than others to consult paramedics, clues necessary for carrying out these activities.pharmacists and traditional healers. But across all These would include cold chain and related equip-expenditure levels the main source of medical ment for immunizations, iron tablets, ORS packets
consultations are doctors, obstetricians, and and basic drugs, family planning supplies, educa-
nurses.In Lima and the coastal urban regions, they tional materials, growth monitoring equipmern, di-account for over 80 percent of consultations by the agnostic equipment and materials for first aid and
poor. In the rural sierra the shares are 66 percent for delivery procedures. Also critical is the hmprove-the extremely poor and 60 percent for the poor. meat of human resources in primary health care,
through technical and management training and4.13 Table 4.5 provides figures on the share of improved working conditions or other incentivesthose ill or injured who purchase drugs. The data for staff in poor areas. The Government also needs
show that the extremely poor household is less to shift human resources into primary care fromlikely to purchase drugs than others. However, in other areas.both Lima and the coastal urban regions there isoniy a minor difference between the extremely 4.17 Since deteriorated infrstrcture is likely
poor and the rest of the population. In the sierra the to pose another significant barrier to primary healthfraction of extremely poor households that pur- care, these facilities should be repaired. As the
chase drugs faUs from the 80 percent registered in distribution of infrastructure is generally adequate,Lima and the coastal urban area to less than 60 the Government need not construct new facilities.
percent. There is only a small regional variation However, if poor living conditions make it difficultin the fraction of non-poor householdb purchasng to attract staff, a program to upgrade staff hous-
dgrg. ing for primary health care facilities might behelpful.
4.14 The lack of access to a public seweragesystem is clearly related to problems of diarrhea 4.18 Cholera prevention and treatment is a
among children. While only 17 percent of house- second priority following maternal and child care.holds lack sewerage facilities, they account for 35 Cholera is a serious health problem. The fact that it
percent of child diarrhea cases. Some improvement affects primarily the poor lends it added urgency as
is seen with use of latrines; 16 percent of house- a poverty issue. In the short run, the Governmentholds rely on latrines and they account for newly 20 can strengthen and expand the educational cam-percent of the cases. The 63 percent of households palg launched following the first outbrealk It can
40
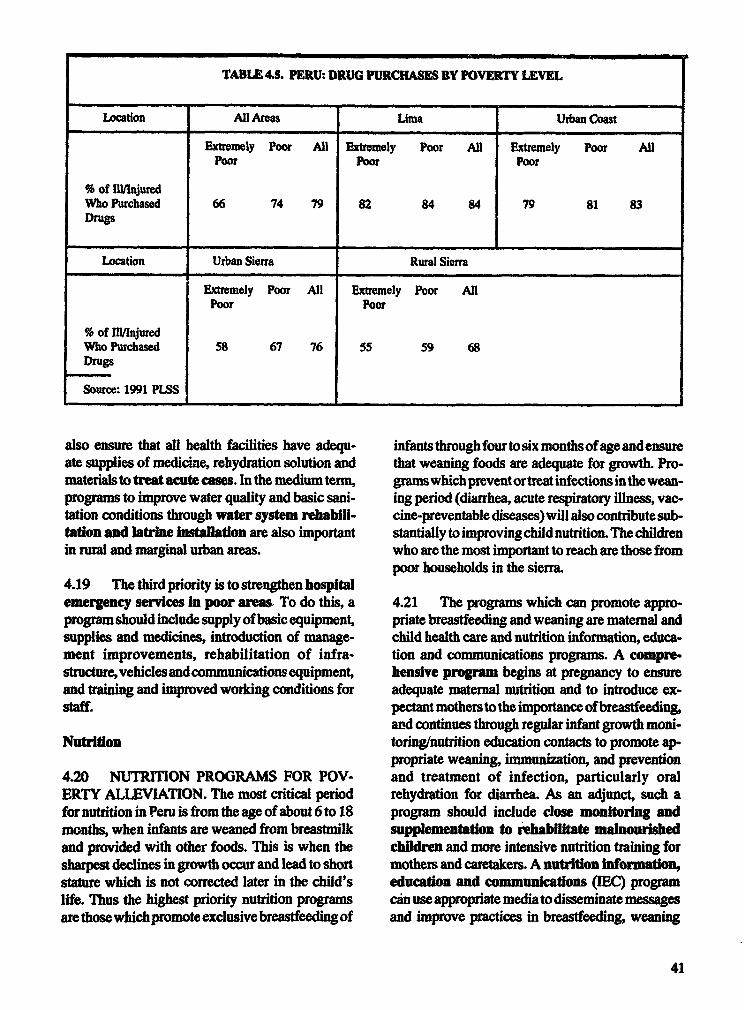
TABLE 4.. PERU: DRUG PURCHASES BY POVERYf LEVEL
Location All Areas Lhna Urban Coast
Extremely Poor All Extremely Poor All Extremely Poor AllPoor Poor Poor
% of lIU/njutedWbo Purchased 66 74 79 82 84 84 79 81 83Drugs
Location Urban Sierra Rural Sier
Etremely Poor All Extemely Poor AllPoor Poor
% of IlMlnjuredWho Purchased 58 67 76 55 59 68Drugs
Source: 1991 PLSS
aLso ensure that all health facilities have adequ- infantsthroughfourtosixmonthsofageandensureate supplies of medicine, rehydration solution and that weaning foods are adequate for growth. Pro-materials to treat acte cases. In the medium term, grams which prevent or treat infections in the wean-programs to improve water quality and basic sani- ing period (diarrhea, acute respiratory ilness, vac-tation conditions through water system rehabili- cine-preventable diseases) will also contribute sub-tation and latrine Installation are also important stantially to improving child nutrition. The childrenin rural and margial urban areas. who are the most important to reach are those from
poor households in the sierra.4.19 The third priority is to strengthen hospitalemergency services In poor areas To do this, a 4.21 The programs which can promote appro-program should include supply of basic equipment, priate breastfeeding and weaning are maternal andsuppiies and medicines, introduction of manage- child health care and nutrition information, educa-ment improvements, rehabilitation of infra- tion and communications programs. A compre.structure,vehiclesandcommunicationsequipment, hensive program begins at pregnancy to ensureand taining and improved working conditions for adequate maternal nutrition and to introduce ex-staff. pectant mothers to the importance of breastfeeding,
and continues through regular infant growth moni-Nutritfon toring/nutrition education contacts to promote ap-
propriate weaning, immunization, and prevention4.20 NUITION PROGRAMS FOR POV- and treatment of infection, particularly oralERTY ALLEVIATION. The most critical period rehydration for diarrhea. As an adjunct, such afor nutrition in Peru is from the age of about 6 to 18 program should include close monitoring andmonths, when infants are weaned from breastmilk supplementation to rehabilitate malnoedand provided with other foods. This is when the children and more intensive nutrition training forsharpest declines in growth occur and lead to short mothers and caretakers. A nutrition information,stture which is not corrected later in the child's education and communications (IEC3 programlife. Thus the highest priority nutrition programs ctnuseappropriatemediatodisseminatemessagesarethosewhichpromoteexclusivebreastfeedingof and improve pracfices in breastfeeding, weaning
41

and the prevention and treatment of childhood among other groups and if the project improves
infections. infrastructure or facilities used by the poor. Abouttwo-thirds of unemployed-leaded households are
4.22 A second prionity is the protection of vul- poor and about 30 percent of these households are
nerable groups with inadequate food intake (mal- extremely poor. However, the unemployed-headed
nourished children, lactating and pregnant women, households account for a very small proportion of
the sickandinstitutionalized,pre-schoolers)through the poor (3.3 percent) and the extremely poor (4
supplementation. This is discussed in the context of ereent). Thus employment programs cannot be the
food assistance later in this chapter. main tool to address poverty. In order to better reachthe poor, an employment program should focus on
4.23 A third group of high priority nutrition the aeas where the incidence of poverty is greatest
interventions addresses deftciencies of micronutri- among the unemployed (area outside of Lima) and
ents, particularly iron, iodine and vitamin A. Such wherethe unemployed account for more of the poor
programs are impoant within apoverty alleviation (the urban coast and urban sierra). Poor farmers also
programbecausethepoorarelesslikelytoconsume would benefit from other employment opportuni-
these micronutrients because of the expense (iron, ties. Two issues related to cost-effectiveness of
vitamin A) and because they live in the areas which these programs are discussed below - wage rates
are most deficient (iodine). The Goverment's goi- and administrative mechanisms.ter prevention and treatment program(PRONABCE) needs to be supported and to add 4.25 WAGE RATES. When a poverty reduc-
measures to ensure the iodination of salt from small tion strategy includes a temporary employment
producers and temporary iodine supplementation program, the persons employed should be poor.
in endemic iodine deficient areas until iodized salt This can most easily be accomplished if the wage is
use becomes more widespreadL Vitamin A defi- set sufficiently lowthatpersonswith higherpayingciency can be addressed parialy through the IEC (andhigherproductivity)altemativesarenottemptedprogram by promoting consumption of vitamin-A to leave them in order to gain temporary employ-
rich vegetables and fruits, and adequate oil con- ment with the emergency program. A low rate
sumption. The maternal and child health program ensures that an automatic self-selection will occur.
can also prevent vitamin A deficiency in children It also means that resources wil stretch further than
by including semi-annual vitamin A distribution in if the wages were higher. An analysis of the impact
conjunction with immunization or when children of the Bolivian Emergency Social Fund (ESF)
are treated for illnesses. Iron deficiency can be showed that the magnitude of benefits which ac-
addressedbyincludingironsupplementationamong crmed to the workers who participated vaneo de-
the activities of the maternal and child health care pending on the pte-ESF employment status. The
pgam (particularly for pregnant women) and average ESF worker experienced a 35 percent in-
by fortifying staple foods with iron where cost- creaseinweeklyeamingsoverandabovewbattheyeffective. could have expected without the ESF. However,
those workers who were either unemployed or
Soda! Compensation Prorm who, prior to the ESF, had salary levels well be-low average, experienced increases five times that
4.24 PUBLIC EMPLOYMENT SCHEMES. high.2
Employment programs can reduce povery by pro-viding employment (and thus income) to those in 4.26 Considerable administrative advantage
need and can generate additional benefits through accompanies the use of an appropriate wage rate.
the rehabilitation and reation of infiasucture. No wmeza test needs to be applied to ensure that
These programs canbecost-effectivebecausepoor beneficiaies are poor since only the poor will be
r-oplearewillingtoworkforarelativelylowwage.The impact of an employment program on poverty 2NmigeneandPrdam,HowDidWorkrsBeaefi
wil be greater if unemployed-headed households hm Bolvia'sSoLialFund? Dhe WorldBankEconomicReew,
are found to a greater extent amuag the poor than May 1991, volume 5, No. 2, pp 367-393.
42
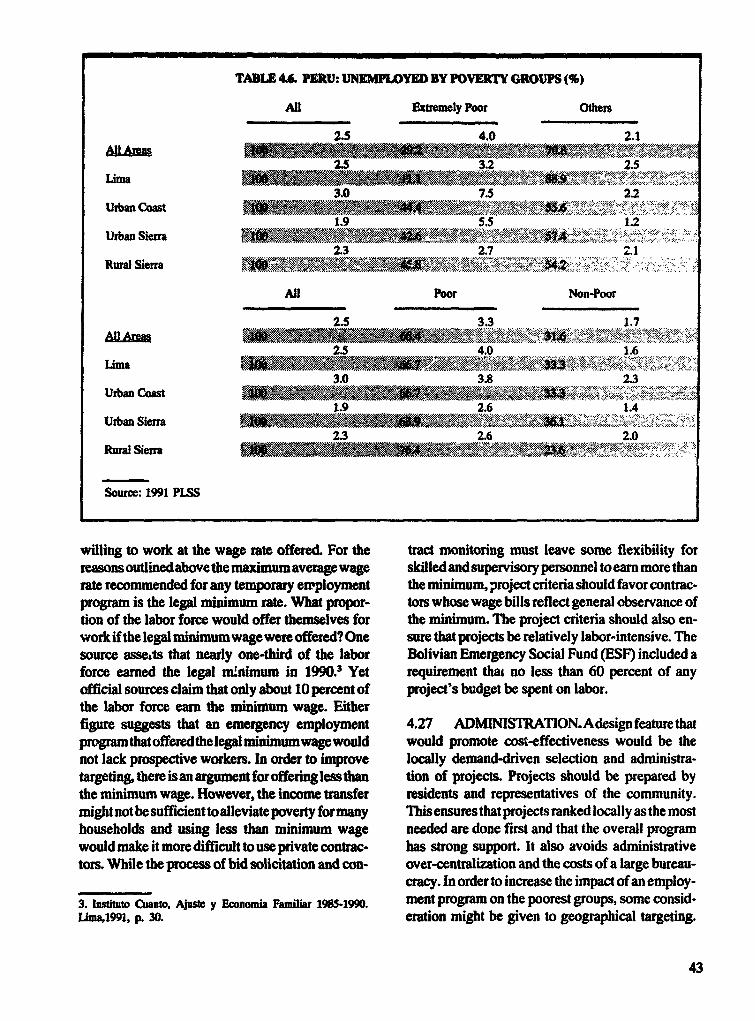
TABLE 46 PEMU: UNEMPLYEl BY POVERTY GROUPS (%)
All Etemely Poor Others
2.S 4.0 2.1
2.5 3.2 25
3.0 7.5 2.2
Urban coast5.5 1.2
Urban Siem2.3 2.7 21
Rural Siera m2.1
AM Poor Non-Poor
2.S 3.3 1.7
AU _2.S 4.0 ~~~~~~~~~~~~1.6
Limal3.0 3.8 2.3
Ubanst coa.1.9 2.6 1A4
Urban Sierra2.3 2.6 2.0
Rural Sienra /.
Source: 1991 PISS
willing to work at the wage rate offered. For the tract monitoring must leave some flexibility for
reasons outinedabove the maximum average wage skilled and supavisory personnel to earn more than
rate recommended for any temporary ewployment the minimum, project criteria should favor contrac-
program is the legal minimum rate. What propor- tors whose wage bills reflect general observance of
tion of the labor force would offer themselves for the minimum. The project criteria should also en-
work if the legal minimum wage were offered? One sure that projects be relatively labor-intensive. The
source asse.ts that nearly one-third of the labor Bolivian Emergency Social Fund (ESF) included a
force earned the legal m.nimum in 1990.3 Yet requirement that no less than 60 percent of any
official sources claim that only about 10 percent of project's budget be spent on labor.
the labor force earn the minimum wage. Eitherfigure suggests that an emergency employment 4.27 ADMINISTRATION.Adesignfeaturethatprogramthatofferedthelegalminimumwagewould would promote cos.-effectiveness would be the
not lack prospective workers. In order to improve locally demand-driven selection and administra-targeting, there isan argumentforofferingless than tion of projects. Projects should be prepared by
the minimum wage. However, the income transfer residents and representatives of the community.
mightnotbesufficienttoalleviatepovertyfor many Thisensuresthatprojects rankedlocally asthe most
households and using less than minimum wage needed are done first and that the overall program
would make it more difficult to use private contrac- has strong support. It also avoids administrativetors. While the process of bid solicitation and con- over-centralization and the costs of a large bureau-
cracy. In order to increase the impact of an employ-
3. lusftwo Cuanwo, Ajuste y Economia Familiu 98S-990. ment program on the poorest groups, some consid-Lima,1991, p. 30. eration might be given to geographical targeting.
43
Althougli all regions could be eligible to receive 431 INSTITUIONS. A wide variety of gov-financing, higher-income locations (Lima, for ex- emmentalandnon-governmentalorganizationsplayample) might be required to offer a greater propor- important roles in food assistance. Within the Gov-tion of local counterpart contributions. In order to emient, the National Food Assistance Officeencourage efficiency in resource use, the participa- (O.NAA) was responsible for coordinating the re-tion of private contractors also should be promoted. ception, transport and distribution of food assis-
tance commodities nationwide. In practice, ONAAFood Assisance performed these functions foronly aportion offood
assistance programs. The Government has recentlyCurrentStatus: Magtude,Agendes,Pomg s created a new agency, PRONAA (the National
Food Assistance Program) which combines ONAA4.28 This section examines how well current and PAD, another agency formerly responsible forfood assistance programs meet the dual objectives some food assistance to urban women's groupsof protecting food security for the poor and protect- (comedores). Within the Ministry of Health, theing the nutritional status of vulnerable groups. It National Feeding and Nutrition Institute (INAN)begins with a review of food assistance - its coordinates the implementation of several directmagnitude, institutions and existing programs. It food assistance projects.then discusses major issues in food assistance andprovides recommendations for both broad rt loo is 4.32 Non-Governmental Organizations possessand specific programs. considerable capability in food assistance.
CARlTAS operates a nationwide network which4.29 MAGNITUDE. Food assistance in Peru is distributes a greater volume of food assistance thanof growing importance in relation to worldwide ONAA.CARE,PRISMAandOFASAimportfoodfood assistance and Peru's social sector resources. sommodities, design and supervise food programsne severe needs facing the population make it and mobilize donor support for food assistanceimperative that these resources be used effectively. programs. CARE also monetizes imported foodWhile the volume of worldwide food assistance commodities on the commercial market in Peru toincreased by about 40 percent, food assistance to generate local currency for food assistance progrmPeru increased by about 240 percent (1980 -1987).In 1991, food assistance programs provided over 4.33 EXISTING PROGRAMS. Eight major226,000 metric tons of food to at least nine million food assistance programs operate in Peru. Three ofbeneficiaries. In the same year, while the central these programs target food assistance to womengovernment's budgets for the social sector minis- and children; one to school children; two to thetieswere $186 million forHealth and $245 million urban poor; and two to the rural poor. Table 4.7for Education, donor food assistance resources to- summarizes coverage and cost information.taled at least $150 mnillion.
4.34 The three programs which target food as-4.30 The transfer value of food assistance is also sistance to pregnant and lactating women and pre-important relative to the overall expenditures of the school children are PAT-PAMI, PANFAR andpoor in Lima. According to results from the 1991 Vaso de Leche. The PAT-PAMI project is fundedPLSS, in Lima food assistance and other transfers by the World Food Programme and implementedfrom non-profit organizations represent one fourth of by ONAA, INAN and the Ministry of Education. Ittotal expenditures in extremely poor households and operatesit Lima-Callao,Ancash,Cajamarca,Cuzcoalmost ten percent of expenditures for poor house- and Puno. It aims to protect the nutritional status ofholds. Without this assistance, the extremely poor in pregnant and lactating women and pre-school chil-Lima would consume at the same expenditure levels dren. The PANFAR program is funded by AID andas the extremely poor in the rural sierra. For the poor implemented by sub-regional health authoritiesoutside Lima, this accounts for a mninor percentage (UDES) under the supervision of INAN. ONAA isof household expenditures because the levels of responsible for food warehousing and the NGOfood assistance outside Lima are relatively low. PRISMA is responsible for transporting food to the
44

TAU 4.7. ffERU: MJOR FOOD ASSISTA4CE PROGRAM 1991
VssodeLeich Escuela
PAT- (IUa. DefendeProgrm Name PAMI PANFAR Calbs) la Vida ARCA DAIREZOD Cawdor PRODIA
Poam TYpOCH MC MCii Sdcool Rual Poor Rwr Poor lgaIm Poor Urban PoorFood Soure WFP AID Treas Treasury AID WFP WPP AIDMetricTons 17,300 21,000 7,100 .. 1,20 6,600 22,20 31,200Food Value (in USS milibns) $6.7 8 0 S10.8 . $0.5 $33 S4.0 S12.1TotalProgrm Value(inUS$millons) .. $23.7 S113 $13.7 S1A - - StS3Beneficaries 209,000 596,000 1,200,000 3,500,000 45,000 71.000 440000 635,000Food CohBcnflcy $32 $13 $9 .. $11 S47 $9 S19
Total Pogram Cost/Beneficiary .. $40 S9 $4 S30 .. $24FoodVBeneficbay (kg) 83 35 6 .. 28 94 50 49
Food Cost/Kilo $039 $038 $1.52 .. $0.40 $0.50 $0.18 $0.39
Pogram CosVi/togrm Food .. $1.13 $1.59 .. $1.09 .. - $0.49Ohr Costs as % Food Value .. 197% ,% .. 170% . 27
SouTce: Compibtion from Maguina, Yamada, MOE, AID, WFP, CARE, PRISMA, CARlTAS repom

UDES level. This program operates in 22 of the PogamopeatesiAncashApunmacAyacucho.county's 25 dpartments. It also seeks to improve Cajamarca, Cuzco, Huancavelica, Junin and Puno.the nutritional status of pregnant and lactating The DAIREZOD Program operates in Ancash,women and pre-school children through supple- Apudmnac.Areqipa,Ayacuho,Cajamarca,Cuzco,metary feeding. Although Table 4.7 includes in- Huancavelica, Ica, La Libertad, Moquegua, Piurasformation only for the Vaso de Leche Prgram in PunoandTacna lhe beneficiaries of these projectsLiTma and c,IIlao, the Vaso de Leche program is are relatively few and food assistance is only one offunded by th,. Government of Peru and operates several components.nationwide, wherever provincial governments arewilling to assume responsibility for its manage- 4.38 PROGRAM COVERAGE AND INCI-ment. It provides milk to children under six and to DENCE. The October 1991 PLSS information pro-pregnant and lactating women on a daily basis. It vides insights into the way some food assistancealso supplements school children up to age 13 programs actually work. lhe survey covers theduring school vacations. Its objective is to stop Vaso de Leche program, food assistance throughmalnutrition among its target groups. comedores and other simila outlets, and municipal
progms. First, it suggests that food assistance4.35 The major school feeding program is the reaches a significant proportion of the extremelyEscuela Defende La Vida program created within poor or the critically poor only in Lima. There 74the Ministry of Education in 1990 under the Social percent of the extremely poor receive some foodEmergency Program This program seeks to reduce assistance4. Among the poor, 37 percent benefit,school desertion and absenteeism and to improve while among the non-poor, only 6.5 percent benefit.academic performance. From August 1990 through In all other areas, fewer than four percent of theJuly 1991, the program provided sporadic food extremely poor or critically poor benefit from foodassistance to 3.5 miUion school children. Fifty assistance.percent of resources were spent in Lima, whichaccounts for 21 percent of school enrollments. 4.39 Second, in Lima most food assistance ap-
pears to be relatively well targeted to the poor, the4.36 The two major programs which provide non-poorgenerally havelowparticipationrates anddirect food to the urban poor are the WFP-sup- receivearelatively small share ofprogram benefits.ported comedor program and the AID-supported However, in other areas, 44 percent of the benefi-PRODIA program. Combined they targeted over 1 ciaries of all food programs combined are from themillion urban beneficiaries in 1991. Both programs non-poor.employ the same vehicle-the comedor, commu-nity kitchens which self-selected groups of women 4.40 Third, actual coverage appears to be sig-in poor urban neighborhoods establish to provide nificantly lower than programming levels. For ex-low-cost lunches to their members or the general ample, VasodeLeche program documents indicatepublic. The WFP comedor program operates in thatittargetedl.2millionbeneficiariesinLimaandLima and Callao through Caritas. Imported food Callao alone. At the same unit costs, the $42.5commoditiesaremonetizedtoprovidefundsforthe million national budget was sufficient to reachpurchase of local foods which are distributed to about 4.5 million. Yet, according to the surveycomedores.ThePRODIAprogramoperatesinLima- results, only about 700,000 beneficiaries were re-Callao, Cajamarca, Chimbote, Piura, Puno and ceiving milk in October 1991, and not all of themTrujillo. Its nutritional objective is to provide from the Vaso de Leche program. Of these, 88comedoruserswith40percentof theirdailycalorie percent were in Lima. The actual coverage of alland 50 percent of their daily protein requirements. food assistance through women's groups (club de
4.37 The two programs which target food assis-tancetotheruralpooraretheAID-supportedARCA 4. This assmes no overlap of beneficiaries among programs. Itis possible that some people patticipate in several programs. inand the WFP-supported DAIREZOD program. which case the oveall peentage who participate would beARCA, or the Food-Assisted Rural Agroforestry lower.
46

madres, cocinapopular, comedorpopularandoga the government may later be expected to meet.comun) was about 500,000, or approximately halfthe number that the two urban programs have as 4.44 Food assistance does not reach importanttheir combined target groups. groups among the poor-the rnual poor or the chroni-
cally ill such as tuberculosis sufferers. Even among4.41 Fourth, the municipality's role in provid- groups reached, the lack of complementary healthing food assistance is surpisingly large. In Lima, care and nutrition education measures means thatnearly 17 percent of the extremely poor and nearly impact on nutritional stats is likely to be negligible.8 percent of the poor receive food assistance fromthe municipality. In both cases, these percentages 4.45 The lack of establishedstandards andprac-are higher than for any other source of food assis- tices for program implementation poses severaltance except for Vaso deLeche. Municipalities are problems. First, different agencies fulfill the samerelatively less effectivethan othersourcesatdirect- functions using different approaches (e.g.,ing food assistance exclusively to the poor. While PRONAA and Caritas both handle food logistics).only 10 percent of all food assistance beneficiaries Second,programsprovidefoodcommoditieswhichin all areas are among the non-poor, nearly 25 are not cost-effective. Given pronounced variationspercent of those receiving food assistnce from in the costs of nutrients, Peru's food progmmingmunicipalities are not poor. is not oriented to maximize the nutrient value of
each dollar spent. Third, programs with the same4.42 Finally, programs are not necessarily ef- taget groups and objectives vary in the levels andfective at reaching their intended target groups. An duration of the assistance they provide. Fourth, unitexamination of Vaso de Leche beneficiaries sug- costs of programs vary substantially, as showngests that the progmm is less successfil at reaching earlier in Table 4.7. Finally, no mechanism ensuresits intended target groups than at reaching others. that all food assistance programs are monitored andWhile it aims to reach children under six and evaluated systematically.women, the largest proportion of its beneficiariesare school aged children. Fifty percent of beneficia- Major Recommendationsries are between the ages of6 and 14, while only onein four is under age 6. Nearly 20 percent of benefi- 4.46 ESTABLISH THE POLICY FRAME-ciaries are not poor. WORK.TheGovernmentshouldfocusitsattention
on areas which individual agencies cannot under-Major Issues in Food Assistace take-setting priorities, identifying viable strate-
gies and evaluating approaches and impact. The
4.43 The major issues in food assistance are the Government should spearhead a collaborative ef-
lack of an overall policy framework, the failure to fort with donors and non-governmental agencies to
reach important target groups among the poor, and devise a strategic plan for food assistance. This
the lack of established standards and practices for plan would spell out the objectives, target groups,
program implementation. Peru does not have an institutional arrangements and total resource re-
overall policy framework or strategic plan which quirements. The plan would also set standards for
would set forth the objectives of food assistance, levels and duration of assistance, entry and exit
defme institutional arrangements, assign priorities criteria, unit costs and implementation standards.to target groups and identify appropriate strategies. This plan would ensure that the food assistanceIn its absence, practice is largely determined by the strategies of all agencies contribute to the same
individual judgements and actions of particular national objectives (see paragraph 3.33).agencies. This leads to the use of substantial devel-opment assistance and Treasury resources without 4.47 DEFINE TARGET GROUPS. Special ef-
central guidance, clear objectives, or measurable forts are requied to reach high priority target groups
impact. This is inappropriate because decision mak- not well served by food assistance at present. The
ers lack incentives to be efficient, and because even failure of food assistance to reach the rural poor to
non-governmental progams create demands which date suggests that other mechanisms should be
47

explored. Food coupons have been successful in * timely distribution;other countries. Experience shows that success * efficient delivery and logistics systems; andwith coupons depends on several key prerequisites: * strong participation by beneficiaries.(a) infrastructure to identify beneficiaries and dis-tribute coupons; (b) food marketing and banking 4.50 In Peru, the areas where standards are mostnetworks to accept them; and (c) adequate security necessary are: (a) the institutional arrangements formeasures to protect against fraud. Under such a food logistics; (b)the selection of commodities; (c)system, geographic targeting can be used to reach unit costs; (d) levels and duration of assistance; andpoor areas. The Government could encourage the (e) monitoring and evaluation. Logistics are crucialtesting of this or other mechanisms for reaching the for effective food assistance programming, andrural poor by providing funding to agencies to depend on budgeting adequate resources and em-experiment with new approaches. ploying efficient operating mechanisms. Food lo.
gtiscs in Peru cost between 7 and 22 percent of food4.48 For the urban poor in general, who are less value, or between $18 and $55 per metric ton ofneedy than others on the basis of nutritional risk or food. In the past, ONAA suffered from a lack offood security problems, the Government should establishedperformanceandcoststandards,aweakencourage agencies to explore other potentialy information system and dispersion of efforts out-more cost-effective forms of assistance. For ex- side its central role of managing food logistics. Theample, ways could be found to facilitate the pur- government's decision to maintain a state agencychase of food and equipment by comedor groups. such as PRONAA to manage food assistance logis-Comedoresconstituteanimportantnetworkamong tics should be based on a determination thatthe urban poor and are organized and skilled at PRONAAis more efficient and less expensive thanmobilizing support Their abity to respond to private sector alternatives. It should have to com-waves of economic crises has been central to sus- pete with the private sector. Its funding shouldtaming the urban poor in social emergencies. Any come largely via service contracts based on theattempt to restructa urban food assistance should volume of food and the mix of ports and beneficiarybring comedor leaders into the process of identify- destinations.Acarefulstudyoflogisticscostswoulding and designing alternatives. enable the Government to plan adequate resources
to cover them.4.49 ESTABLISH IMPLEMENTATIONSTANDARDS. The implementation of food assis- 4.51 Commodity selection should use the leasttance should be standardized to a greater extent. expensive sourcesof nutrients acceptable to benefi-This would complement the introduction of a clear ciaries. Milk is often used asa source of protein (e.g.policy framework. International experience points Vaso deLeche). Yet with milk at $1,300/metric tonto key factors which can improve the implementa- (1991 WFP price for dried skim milk), it would betion of food assistance. These include: possible to obtain fourtimes as much protein forthe
same price with wheat or soy-fortified bulgur, or* targeting to high risk groups; twice as much with lentils or rolled oats. While* the careful selection of rations; $1.00will purchase 3,00caloriesofwheatorcor,* anticipating and planning for dilution and the same dollar spent on rice purchases less than
substitution effects; half this amount. Efforts to optimize ration mixes* strong nutrition education; should also consider additional factors such as the* growthmonitoring/nutritionalstatusmoni- bulk and digestibility of different commodities.
toring; Staple foods used in assistance programs should be* strong links with other primary health care fortified with iron.
services;e anticipating and planning for opportunity 4.52 A set of unit cost guidelines should be
costs of participation; developed for food assistance to determine how* clear and applicable entry and exit criteria; much it should cost to reach a specific target group* consideration of seasonal food consump- in a given location with a given level of assistance.
tion patterns; When transportation expenses push the cost of
48

imported food above its local cost and when local 4.56 The Vaso de Leche program needs to in-suppliesareadequate,importedcommoditiesshould crease its ration level and strengthen the quality ofbe sold to purchase local food. management and controls in order to reach a higher
proportion of its target group and have a significant4.53 Once food assistance objectives and target impact on nutrition. This can be done through moregroups become more explicit, it should be possible intensive management training and nutrition edu-for agencies to develop standards for levels and cation to local program managers. It should alsoduation of assistance. Beneficiary rations should seek ways to provide sources of nutrients whichbe based on an understanding ofthe nutrient gaps of cost less than milk.participants. Programs with the same objectivesand target groups should provide similar levels of 4.57 TheLaEscuelaDefiendeLa Vida Programassistance. For example, to improve the nutritional should target children in grades 1 -4 and place firststatus of malnourished pre-school children, chil- priority on rural sierra provinces where the inci-dren who are at the same nutritional risk shod be pro- dence of poverty is high. Because it was started asvided with similar levels of supplementary food for an emergency program, it has relied heavily onthe period necessary to reverse this risk. The duration resources already within the education sector. Fu-of assistance will depend on each child's progress. ture budgets should incorporate greater resources
for program administration so that school feeding4.54 The Government should assume the pri- does not divert resources away from educatingmary responsibility for monitoring the perfor- children. Future implementation should also seekmance and evaluating the Impact of food assis- to overcome some of the program's early weak-tanceprograms.TheMinistryofHealthcouldevalu- nesses, including an excessive concentration inate different project strategies on a sample basis to Lima and a lack of continuity in feeding.test their cost-effectiveness. This would strengthenthe Government's dialogue with donors and enable Conclusionit to allocate resources to the most cost-effectivestrategies. The Ministry could also conduct impact 4.58 This chapter has outlined some of the com-evaluations on different programs to determine if ponents of a poverty alleviation strategy for Peru.the strategies are effective at achieving the desired The first plank of the program is the promotion ofobjectives in nutrition. broad-basedgrowth through implementation of the
stabilization and adjustment program. The secondogram Specific Issues and Recommendations plank comprises social service programs focusing
on activities most critical to the poor and on the4.55 MCH programs could be improved by rural sierra, where the incidence of extreme povertyintroducing mechanisms for better targeting, stron- is highest. These programs include improvementsger linkage to other services and better impact in the quality of primary and pre-primary educa-evaluation. Food assistance to the MCH population tion, promotion of higher attendance at the kinder-should be expanded. In rural areas, the use of food garten level by children from poor households andcoupons should be explored to protect vulnerable literacyprogramsfornon-Spanishspeakingwomenmothers and children. The PANFAR program is in rural areas. In health, the emphasis should be onappropriate forareaswith fairly good health service primary health care for mothers and children. Spe-coverage, good outreach to identify beneficiaries cial efforts are needed to increase vaccination cov-and adequate infrastructure to allow warehousing erage, family planning services and the supply ofof food commodities at health centers. An advan- basic drugs in the sierra region. Nutrition interven-tage of this approach is that it strengthens contact tions need to be more closely linked to healthbetween the health center and the maternal and improvementsandanational nutritionpolicyshouldchild population. This initial contact may be used to be defined and implemented. Recommendationsprovide other important services such as pre-natal were made on the design of two social compensa-care,immunizations,treatmentofdiarrheaandacute tion programs -public employment and food assis-respiratory illnesses and nutrition and health pro- tance.The next step after defining a poverty allevia-motion activities. tion strategy is to execute it. The following chapter
49

disces some of the issues the Government is pwvt in Peu and how for the Government haslikely to fce in implmentig pgms to reduce advancedinid ftygapovertyaUeviaonsutegy.
.
50
5
Implementing a Poverty Alleviaton Strategy
ntroduction program to lessen the severty of poverty mightfocus on bringing the extremely poor up to some
5.1 Earlier sections have set forth key issues more acceptable level of welfare. Extreme poveryand recommendations in the social sectors as they is prevalent in Pem and the extremely poor are therelate to poverty alleviation. This section exploes least likely to be lifted out of poverty in the short-two important issues in the implementation of a run by opporatities arising from adjustmet. 11ipoverty alleviation strategy. First, we examine suggests that In Per poverty alleviation hter.what available infoTmation reveals about how to ventions should be rgeted prmarly to the ex-target measures to the pooresl. Second, we con- tremely poor In order to bring them up to asider three facts in the instiutional arrangements more acceptable levd of welfrefor povety alleviation: (a) the role of a social fund;(b) the regional compensation fund; and (c) the 5.3 While targeting m anisms are often dis-role for NGOs. Tie constaint posed by the lack of cussed in terms of transfers to the poor to increasesecurty in some pats of the country is also briefly expenditure levels, another approach is to target adiscussed The chapter concludes with an exami- safety net of services to the poor to protect themnation of the Government's poverty alleviation from the most deleterious effects of low expendi-strategy. ture levels. This approach would seek reductions
in infant and child motality, malnutrition and in-Targetng fection; and increases in literacy and school atten-
dance to inree the welfare of the poor indepen-5.2 The best targeting achieves the greatest dent of expenditure levels.impact at the lowest cost. Targeting mechanismsdepend on objectives, the interplay between effi- 5.4 Targeting seeks to distribute transfers orciency concerns and political factors, and the some other benefits only to those identified as thestrength of institutional capacity. Under the broad beneficiary group in the interest of efficiency. Theheading of "poverty alleviation" objectives, a administrative mechanism must not cost so muchmuber of options exis, each with implications for to operate that it absorbs the savngs from exclud-targeting A program to reduce the national aggre- ing the non-needy beneficiaries. If targeting costsgate poverty gap might focus on the regions with more than it saves, universal distribution is a bettethe highest incidence of extreme poverty. A sec- option. Shor-term efficiency gains fiom tugetingond program might aim to reduce the number must also be weighed against longer-termor percentage of people in povery by concentrat- sustinability. If targeting is so effective that onlying on those just below the poverty line. A third the poor have a vested interest in a prowam,then it
51

is unlikely to sustain the public support necesary latrines and the absence of household lighting.for it to survive political processes. This suggests Seventy-one percent of those who use kerosene arethat broadening the beneficiary group somewhat to poor (51 percent are extremely poor). Sixty-eightinclude those with a stronger political voice may percent of households who use latrines are poorbe desirable. Somewhat "inefficient" targeting of (46 percent are extremely poor). All householdsbenefits may be the cost of ensuring long term without a source of light are poor; but they repre-sustainability. sent only one percent of the poor. Within regions
(Lima, urban coast, urban sierra, rural sierra), few5.5 Targeting uses indicators closely associ- characteristics serve as useful targeting indscators.ated with need, direct testing to assess need, or The successful targeting of food assistance pro-program design which makes the opportunity costs grams in Lima suggests that a combination of self-of participation so high as to exclude those with targeting and geographic targeting can be used ef-better alternatives (self-targeting). Indicator target- fectively.ing and direct testing both depend on selecting in-dicators which potential beneficiaries cannot easily Insttutional Arrangementsmanipulate. Self-targeting is often achieved by re-quiring beneficiaries to work to receive benefits or 5.9 THE ROLE OF A SOCIAL INVEST-by providing public goods of lower quality which MENT FUND. To determine the role of a socialthe non-poor would prefer to obtain privately at a investment fund in carrying out a poverty allevia-higher quality. tion strategy, two questions must be addressed.
one, is a social fund appropriate given country5.6 In Peru, geography is the indicator with conditions; and two, what are the main prerequi-the greatest value as a targeting mechanism. sites for its successful operation?' A social invest-Even with no additional information, a household ment fund is a mechanism now being experi-in the rural sier.; has a 68 percent likelihood of mented with in many countries. It is a financial in-being poor, and a 47 percent likelihood of being termediary with a streamlined bureaucratic struc-extremely poor. By targeting benefits to rural si- ture which mobilizes and channels resources to aerra households, nearly one in every two extremely wide range of implementing groups who carry outpoor households can be reached. small projects proposed by communities. The
projects range from labor-intensive construction or5.7 Another indicator which is strongly asso- rehabi'itation works which generate employmentciated with poverty is language. Throughout the for the poor to activities which improve social ser-country, 70 percent of Aymara speakers are ex- vices for the poor. Experience shows that a socialtremely poor; among Quechua speakers, 32 per- investment fund is most appropriate where exist-cent are extremely poor. Targeting all Aymara and ing infrastructure is in need of rehabilitation andOuechua speakers will capture 41 percent of the where existing institutions are weak, as in Peru. Inextremely poor. Since most non-Spanish speakers addition, a social fund is a suitable mechanism when:live in the sierra, geographic targeting would alsoreach them. Non-Spanish speaking households in * a country faces an emergency and needsother regions are not disproportionately poor. quick and tangible results;
5.8 Some characteristcs closely associated * the emergency is of a temporary nature,with poverty suggest the types of assistance e.g., policies are in place that will ensurewhich would manly benefit the poor. Nearly all growth and redistribution in the medium(82 percent ) households which draw their waterfrom wells are poor (26 percent are extremely 1. The foUowing discussion is drawn from 'Easing the Poor
poor). Thus, a program to improve water supply through EconominCrisis and Adjustment -The Story of Bolivia's
for well-users would benefit primarily poor house- Emergency Social Fund' by Jorgenson, Grosh and Schacter.Latin America and the Caribbean Technical Department, Regional
holds. Other housing characteristics closely associ- Studies Program, Report No. 3. and the Povety Reduction
ated with poverty include the use of kerosene and Handbook, World Bank 1992
52
to long term; activities to benefit the poor. It is intended to be a* the country needs a social safety net be- short-te*rm response to worsening poverty until the
cause social services are weak; capacity of the Ministries of Health and Education* the agency can be allowed to work with as is sufficiently strengthened. FONCODES finances
broad a range of institutions as possible; small projects (thus primarily rehabilitation/up-* overall policies favor private sector devel- grading of facilities, not new construction) and re-
opment; and gional governments have an advisory role in itsa willingness exists to accept market based operation, including project selection.solutions, i.e. when there is not a "plannerknows best" attitude. 5.13 Progress in making FONCODES fully op-
erational was slow and initially there was confu-5.10 Peru meets these conditions and thus it sion over whether the agency was going to be awould appear that a social fund could play a useful "demand-drive" or a "top-down" operation whichand important role in the poverty alleviation strat- adversely affected the quality of some projects. - ow-egy. Yet, social funds involve tradeoffs. Since so- ever, in mid-1992 perfamance began to improve.cial funds are demand-driven, projects risk not be-ing integrated with investment priorities. In Peru, 5.14 REGIONAL COMPENSATION FUND.this issue may not be critical. Investment spending The Regional Compensation Fund (FCR) has theby central ministries is almost nonexistent because potential to contribute to a poverty alleviationof the fiscal austerity program and the decentrali- strategy. This fund was created by the Januaryzation of social service provision. A social fund is 1990 Law of Regional Government Financing tounlikely to reach key vulnerable groups (for ex- finance regional capital spending. Until now, theample, mothers and children), although they are FCR has been financed on the basis of a formula -likely to benefit from the rehabilitation of infra- 8 percent of Treasury resources and 25 percent ofstructure. This is inherent in a reliance on demand- the revenue from the general sales tax. The distri-driven and market mechanisms. Thus, a social bution of these funds to the regions has been basedfund would need to be complemented by interven- on a formula as well. Half of the funds are allo-tions in education, health and nutrition. cated equally to all regions and the other half in
accordance with population size. No attempt is5.11 Experience with social funds in other made to channel more resources to poorer areas. Acountries indicates that effectiveness depends pri- change in this formula to enable the fund to play amanly on the capacity to select the right projects role in poverty reduction would only be feasible ifwhich in turn depends on the quality of staff and tax revenues increase and after fiscal stabilizationtheir independence from political pressures. Be- is achieved.cause social funds are "wholesalet operations, ad-equate supervision a-id monitoing of sub-projects 5.15 THE ROLE FOR NGOs. The magnitudeis essential. and seriousness of the poverty facing Peru call for the
active participation of all resources, including NGOs.5.12 THE NATIONAL FUND FOR SOCIAL In 1990, NGOs mobilized between $170 million andCOMPENSATION AND DEVELOPMENT. In $200 million in external funding. The United StatesAugust 1991 the Pemvian Govermnent established channelled about $100 million through NGOsa social investment fund, the National Fund for Qarly in the foam of food ass-stance); Holland - $20Social Compensation and Development million; Cnad2 , Germany and Italy - $10 million(FONCODES). It is a temporary public institution each and Switzerland - $4 million. NGOs have awith technical, administrative and financial au- comparative advantage in mobilizing extenal re-tonomy which finances projects proposed by gov- sources becase of their fexibiliy ani their ability toernment agencies, NGOs and community-based respond to donor priorities.organizations. The focus is on employment gen-eration, but FONCODES also funds projects inbealth, food assistance, basic education and other 2 Cada esimate i fo 1991.
53

5.16 NGOs are also able to reach underserved the Vaso de Leche. An estimated 23 percent of
populations groups effectively. NOOs often pro- NGOs work in health and nutrition. Some operatevide social services to populations which have in- community health posts in response to community
adequate access to state services due to terrorism demand. NMOs in health and nutrition are flexibleor emergency situations. In 1990 NMOs partici- and able to experiment with a variety of models for
pated actively in the National Drought Thnergency service provision, cost recovery and informationProgram, the Socal Emergency Program and the management. NOO activity in education is con-
school feeding initiative, La Escuela Defiende La centrated in non-formal education.Vida. NGO participation in the drought programdemonstrated their ability to operate even in secu- 5.20 While NGOs operate throughout tlh coun-rity emergency zones. The Social Emergency Pro- try, they are concentrated in Lima and lack a
gram demonstrated their ability to mobilize effots sttong presence in the selva. DESCO (Center forrapidly behind an emergency initiative. NGO par- the Study and Promotion of Development) esti-
ticipation in La Escuela Defiende La Vida enabled mates that nearly 60 percent of NGOs are based in
this program to expand rapidly and provide rations Lima, another 12 percent in Cusco and Puno and 5
at low cost. percent in Arequipa. Since Uma NGOs often oper-ate in other areas of the country, concentration in
5.17 CARITAS, the social service arm of the terms of service areas is not as pronounced. NearlyCatholic Church, has a particularly strong com- half of NGOs operate only in urban areas, another
parative advantage in reaching underserved popu- fourth operate only in rural areas and one-fourthlations because it is the only institution other than operate in both areas.the state which can draw upon a nationwide net-work. This presence extends to areas where gov- 5.21 NGOs are constrained by vulnerability to
ernment activity is minimal and other NGOs are donor influence and weakness in formulatingnot active, such as isolated regions of the selva and policy proposals. As NGOs mobilize resources in-
sierra. CARTfAS' participation has proven central dividually or as small consortia, the sector lacks a
to many large-e emergency rehabilitadon efft mechanism to ensure that resources are directed tothe highest priority target groups or activities. In-
5.18 NGOs are a strong constituency for pov- volvement at the micro level leads to difficulties inerty alleviation goals and programs. In many coun- seeing the broad picture and in formulating far
ties, poverty alleviation initiatives have failed be- reaching policy proposals.cause beneficiaries lacked a strong political voice.In the last five years, NGOs in Peru have devel- 5.22 Collaboration between the Government
oped coordinating bodies which strengthen the ad- and NOOs is constrained by real and perceivedvocacy function by channelling communications barries. The dispersion of many Government pro-
and providing fora for discussion. The National grams over a broad range of state institutionsAssociation of Centers registers 22 such NOO net- makes NGO entry into the process difficult. Per-works. The advocacy role of NGOs is strengthened sonalistic management of some government pro-
by their ability to maintain communications with grams makes collaboration with NGOs dependentthe poor. While NOOs do not "epesent" the poor, on the will of individual managers rather than on
they often serve as a channel of communications institutional mchanisms. NGOs are not organizedenabling the poor to express their concerns. as a sector and they lack the mechanisms to plan
and establish collective priorities for spending or
5.19 NOOs are numerous and operate in many impact evaluations. Their actions are frequentlysectors and areas of the country. At least 250 not motivated by long term analysis and planning.
NGOs are active in health and nutrition, education They differ widely in their institutional, manage-and food assistance. They also assist in the institu- ment and administrative capabilities, and theirtion,al development of local governments. NGO ability au analyze problems and propose policies.
collaboration with municipal governments has They lack a clear vision of their operational capacity
been instrumental in intmducing progms such as both individually and collectively. They are not
54
operational in all areas of the country with severe many of them innocent victims caught in thepoverty problems. crossfir of Latin America's most violent and
bloody guerrilla movement. Community orniza-5.23 Perceived barriers are more imporant than tions and the workns of local and central goven-actual anes in constainig Govemment-NGO col- ments have been severely affected. In incrasinglylaboration. Govemment staff do not see NOOs as large areas, the central Government is unable topartners in the identification of national priorities provide basic services of law and order, much lessin poverty alleviation nor as subcontactos to ex- provide social services.pand the Government's implementation capacityin achieving these goals. They perceive NGOs as Poew Ally Iaton Progm of the Govenientcompetitors for a fixed level of resources and con-trol. They object to competing with agencies not 5.26 POVERTY ALLEVIATION SJTRAT-bound by the constraints they face. Likewise, EGY. The Govemment prepared a poverty allevia-NOOs mistrust Govenmden motivation for greater tion stategy in 1992. It is generally consistnt withcollaboration. They are concemed about the state the findings and recommendations of the analysistuning over inmpossible tasks to NMOs in order to conined in this report. The stategy sets clear andavoid accountability for failure. They are reluctant appropriate priorities for a poverty alleviation pro-to share information with Government agencies gram in Peru, thereby providing a framework forbecase they fear the Govement wants to control poverty reduction measures, both for the Govern-their activities. ment and donors. Toe challenge and test of the
Government's resolve will be the extent to which5.24 Wberever NGOs have a comparative ad- both the design and execution of specific projectsvantage, the Government should be willing to mo- are consistent with the principles set out in thebilize and channel resources through them. Several poverty alleviation strategy.steps would improve NGO participation in Peru'spoverty alleviation strategy. The govenmment and 5.27 The strategy recognizes that the allevia-NG0s could work to determine the comprative ton of povety i Peru demands essentially an eco-advantages of NGOs by regions, sectors and popu- nomic strategy The recovery of the economy,lation groups. With NOG participation, the gov- based on a progm of stabilization and liberaliza-ernment coud define the areas for autonomous tion measums, is crucial for the attack on poverty.NGO activity and determine which activities re- The objective set forth is to improve the livingquire coordination. Ihe goverment and NOOs conditionsof the extemely poor through progmscould also determine jointy the magnitude of pro- in the areas of food assistance, health, educationgrams and projects which NOOs are capable of and employment generation projects.underaking. The govermuent should establishdear and efficient mechnisms for NGO colabo- 5.28 The taret group for the Government'sration. NGOs should avoid terial and sectoral poverty alleviation efforts are the extremely poor.isolation which leads to duplication of efforts. The goal is to reduce the incidence of extremeEmerging NGO consortia provide one mechanism poverty fom the ament level of about 20 percentwhich should be suppoed to foster greater coordi- to 15 pere by 1995. The main targeting mecha-nation, dialogue and joint planning with the state. nism would be geography. More detailed goals for
1995 are also set in the areas of health, educationSecuriy Constaint and employment generation. In order to address
the problems of extreme poverty in the country the5.25 The task of improving social services in strategy outlines 5 more specific objectivesmany rural areas is made much more difficult bythe violent activities of the terrorist orgization, * Generate employment and income in ruralSendero Luminoso (Shining Path). Since Sendero and marginal urban areas through projectslaunched its military campaign in May 1980, the focusing on social infiasucurendsupportresulting conflict has claimed ovr 24,000 lives, to production;
55

* Provide food assistnce in order to ensure 5.31 In the area of heal, the main lines of ac-that the basic requirements of the most tion include restoring a system for monitoring thevulnerable groups are met; health status of children; promoting the partic-
ipation of communities in preventive activities;* Improve the coverage and quality of pri- improving pre- and post-natal care and promoting
mary and preventive health services with breastfeeding, and improving the quality and effi-an emphsis on rural and margia uba ciency of services through trmining programs forareas, with a view to contrbuting to the health pesonel. Coverage of primary and preven-reduction of infant morbidity-mortality tive services would be increased through an expan-and the protection of the health of poor sion of the network of health services inwomen; undetseved zones. Related to that, existing infra-
structure (hospitals, health posts and health cen-* Improve the efficiency and quality of edu- ters) would be rehabilitated with an emphasis on
cation especially at the primary level in health poss and centers. There would be coordina-rural and urban marginal areas; tion with the agencies responsible for sanitation in
order to provide services to poor areas. Attention* Meet the basic needs of school-age chil- to the problems which cholera has generated also
dren through school feeding pwrgams. would be strengthened.distribution of texts and teaching materaland the needs of adults through literacy 5.32 In the area of nutrion, the principal linesprograms; and of action include rationalizing and improving food
assistance programs so that they reach the target- Provide financial support through population; increasing the nutritional standards of
FONCODES to activities engaged in by food assistance; and implementing education pro-the poor. grams and a system to monitor nutrition levels.
5.29 The Government envisages a major role 533 For education, the strategy proposes: tofor FONCODES in the implementation of this reduce the illiteracy rate, especially in rural areastregy. There is explicit recognition that the strat- and among women; to lower repetition and drop-egy implies an increase in the volume and effi- out rates and to expand pre-schools in poor areas;ciency of social spending by the Government, the to improve quality through teacher training and up-former to be achieved parly through a reallocation grading infrastructure and teaching methods; toof spending toward social investments& Social ex- integrate the community and the pnvate sector,penditures also would be oriented more to the and to orient the system more to the needs of thepoor. In addtion to an effective FONCODES, this labor market. Education would also play a morewould require s_trgthening the services provided active role in supportng the resolution of other so-by the Ministries of Education and Health and cial problems such as malnutrition and poverty.other agencies to the poor in Pem.
Concldusion5.30 The poverty alleviation strategy sets outprincipal lines of action in three areas: employ- 5.34 There are two sources of financing for thement generation; health, food assistance and nutri- poverty alleviation strategy. The first is govem-tion; and education. In the area of employmet ment resources and the second is donor resources.geeration, the focus is on providing income eam- Public resources will ccntinue to be constraineding opportunities and/or food-for-work progams over the next several yeas because of the stabiliza-for the poor in rural and marginal urban areas tion progam and the time it will take to restore taxthrwough projects in social and productive infra- revenues. However, in order to attract sufficientstruct Small enterprises would also be assisted donor resources the Govemment must demonstrateby deregulation, as well as taining and credit. clearly its own commitment to poverty alleviation.
56

In 1990 it is esftimated that total govenunent spend- larly in the shot-run. Measures are also needed toing on health and education reached only 2.2 per- protect vulnerable groups and to ensure that thecent of GDP, well below the average for Latin poor are able to take advantage of the greater op-America. It is recommended that over the next portunities in the reformed economy. In order tothree years the Government take steps to improve address these latter needs, this report has examinedthe cost-effectiveness of public spending for social the profile of the poor in Peru and recommendedservices and review the possibility of reallocating priority policies and progrms targeted to themresources from the tertiary level to the primary The Government has made a start in this area. Itslevel. As tax reform and the measures to strengthen poverty alleviation strategy sets clear and appro-tax admiis ton aise revenue generation, it is priate priorities and goals for poverty reduction ef-also recommended that the Government endeavor forts within a framework of a contindiation of eco-to increase the resources allocated to health and nomic policies that would maintain macroeco-education. Spending on education and health of nomic stability and promote growt The challengeabout four percent of GDP is the average for Latin and test of the Government's resolve will be toAmerica and about the level that was spent in Peru what extent current and future policies and pro-duing the first half of the 1970's. grams are governed by that strategy. The recent
improvement in FONCODES is an encouraging535 The Government of Peru has taken an un- sign. But in order to ensure that the poor reap theportant step to reduce poverty in the country. Over benefits of adjustment, the Govenment shouldthe medium to long-run what is needed to aUleviate strengthen the social services most cntical forthe high levels of poverty is broad-based growth. them and provide more effective safety nets for theThat is the objective of the stabilization and adjust- most vulnerable in the country.ment prograL However, it is not enough, particu-
57

ibliography
AID. "Analisis del Sector Salud en el Peru. Lima, Latna en losAfos Ochnta. May 1990.ManoD 1991. De Wit, Ton. "ONGs en el Peru y la Planificacion
Amaty laon, Cauos and Curonisy, Dante. La,4i.- Estrategica". unpublished wordng paper ptpredmmacion end Perm Oentro de Investgcion for the World Bank. May 1991.Univetsidad del Pacifico. Lma, Peru. May 1990 ed. FAO. Food Balane Sheets.1979-81 Average 1984.
Aramburu C. Petrua M y Tgliafro G.LosNiWles de FAO. Food Bance Sheets. 1984-86Average 1991.Vi'da en las Provias del Penu INP/ANDEP, FAO. Produtn Yearbook Volume 43. 1989.Llina 1989. Fernandez, H. "Eficienca lntema del Sistema Educ-
alab, Eduardo. Evaluacion del Proyecto PLoto Bono ativo.1 In Fernandez, H. and Rosales J. Educa-Mateno hntil en Hondurase unpubished wokdng cionjUna Mrada HaciaAdenro. IPP, Lima 1990.paper prpared for the World Bank. September 1991. Garcia H. "El Sector Salud en el Peru: Resumen de los
Berg. Alan. "Guidelines for Waok in Nutrion". PHN Resultados de la Misione Febreto 1991.Tecaluical Note 8612 World Bank, March 1986. Glewwe, P. The Distribuion of Welfare in Peru in
B3sley, lgnty and Kanbur, Ravi. The Prinples of 198586. LSMS Working Paper No. 42. The WorldTargeing. PRE Woking Paper 385. World Banlk Bank, 1988.March 1990. *3lewwe, Paul and de Tray, Denois. he Poor in Latin
Ca, 1L, Andia, Y. y Leon, 0. Evauacion de los America duing Adjustment -A Case Study ofPen*.astemas de abasecmiento de agna, acantarilad LSMS Working Paper, No. 56, World Bank 1989.diposiclon de aguas residuales y saneamino de Glewwe, Paul and Halt Gilet Poverty and inequalias zons urbano marginales en el During Unona=dxAdiusnent: 7se Case of Peru
marco de la epidema delcolera. CEPISIOPS, Uma, 1985 to 1990. LSMS Working Paper, No.86, WorldAbuil 1991. Bank 1991.
Cbiroque, Sigfredo. -Evolucion del Poder Adqusitivo World Bank, Perw Economic and Sector Reforms todel Docente Peruano: 1980-1991-" (Unpublished) Sustain Stabiliation ad Lay the Founda for De-nsituto de Pedagogia Popular, 1991. wvopnent White Cover Economic Report
Cobun, J, Bitran R., Griffin, C Levine, R. and Grosh, Margaret, Social Spending in Latin America:RobeR,R Aswsesn ofHealth Sytems, Ihe Story of the 1980's. Discussion Paper No. 106.Financig and Policy Opwons inArequa Regin, The World Bank, 1991.Pera HFS Technical Report No. 3 AID, February Gro, Marget Unpublished notes on a taxonomy of
1991. targeting mechanisms and their costs and outcomes.Cocwhane, Susan H. The Effes of Education on Fer- February 1992.
tility and Mortality." Education and Training Gra, Mare "The Jamaica Food Stamps Progra".Department Discussion Paper No. 26. The World World Bank LATHR. June 1990.Bank, PHR1E. Washington, D. C., 1986. Jorgensen, Steen, Grosh, Marpgret and Schacter, Mark"
ComisWnEconomicaParaAmericLatinoyel Caribe Easing the Poor through Economic Crisis and Ad-(CEPAL), Magniatd de la Pobreza en America justment - The Story of Bolivia's Emergency Social
59
Fund". Latih American and Canibean Teecnical tific Publication No. 524, Washington, 1990.Deparment Regional Studies Proam, Repot no.3. Pavone, and Petters M., "Economic Impact of Cholera
INEI. Direocion Tecnica de Indicadores Economicos. in Peru in 1991", WHO/PAHO StudyPerm Compendlo Estadistco 1989-990. UAms I=ta M. "Efectos de la crisis economica en losSeptiembre 1990. Servicios de Salud Matemo e Infantil y en sU
INEI. Direccion Nacional de Estadisticas Basicas. poblacion. Peru 1985-1990." OPS, Lima, Mayo"Indicadores Sociales. Boletin No. 2 Uma, 1991.Septiembre 1990. PNUDIJNP. La Pobreza en el Peru: Diagnostico y
Instituto Cuanto Ajuste y Economia Familiar, 1985- Propuestas dePoiticas. Bogota, 1990.1990, Lima, 1991 Psacharopoulos, G."The Contribution of Education to
Lopez de Castilla, Marta, Oriheula, Ana Maria, and Economic Growth. International Comparisons." InChiroque, Sigfredo. "Maestros Rurales." IPP, Lima Kendrick, J. W. (ed) International Comparisons of1990. Productvity and Causes ofthe Slowdown American
Lopez de Castilla, Marta, Trapnell, Lucy, and Rengifo, Enterpre Institute/Ballinger Publishing Co. Cam-Moiso.. "Ser maestro en La Amazona." IPP, bridge. 1984.Lima 1989. INIDE. Quinche, Daniel et al. "Documento de Base: Situacion y
Mendoza I. "Proyecto de Apoyo a is Gestion Local del Perspectivas de la Formacion Magisterial en el Peru:Programa Social de Emergecia en Salud, Nutricion Pimer Seminario Nacional Sobre Fonnacion Magis-y Saneamiento Ambiental. Informe Final." OPS, terial", LUia, Per, 1991.Umr, Febrero 1991. Schiefelbein, E. And Heikkinen, S. Peru: Access, Rep-
Ministry of Education. Situacion de la Educacion en los etition and Efficiency in Prinauy EducainCentros Educativos Unitarios del Departamento de OREALC, October, 1991Arquipa. Senado de Is Republica. "Encuesta de Opinion:
Ministerio de Salud. Haca un Sistema Na cional Violencia y Pacificacion en el Peru." Lima, AbrilReglonalzado e Integrado de Salud Lma, Peru, 1989.Enero 1991. Stelcner, M., Arriagada, A. and Moock, P. Wage Aeter-
Ministerio de Salud I OPS / UNICEF / USAID. mnnants and SchoolAttaimnent among Men in Perm"Malnutricion por microutrientes en el Peru" Lima, LSMS Working paper No. 38. The World Bank,Agosto 1991. 1988.
Ministerio de Salud. "Boletin lformativo sobre la UNICEF, (Comite de Coordinacion del Programs deEpidemia del Colera en Peru." lima, Mayo 1991. Cooperacion PERU-UNICEF). Plan deAccionpor
Ministerio de Salud. Oficina General de Planificacion. la Infanca: Proridades Sociales del DesarrolloEvauacion de la Estrategra deAtencionPrimaria de Hwuano, la Reconstruccion Nacional y la PazSaludu Peru 1988-1990. Lima, 1991. ULms, Junio 1991.
Ministerio de Salud. La Epidemia del Cokra en el UNICEF. Estado Mundial de la Infancia 1991. NewPeru. Lima, Junio 1991. York, USA, 1991.
Ministerio de Salud del Peru. Plan Operativo 1991. UNICEF. ElAjuste SociaL Perum Hacia un DesarrolloDireccion General de Salud Integral. Direccion EsenciaL Lima, 1991.Ejecutiva de Crecimiento y Desarrollo. UNICEF. "La Infancia, la Pobreza Y la Mujer en el
Ministerio de Salud del Peru y la OPS.Analisis de los Peru: Analisis de Situacion." Uima, 1991.Recursos Institcionales en Alimentacion y UNICEF. (Carlson, Beverly and Wardlaw, Tessa) ANutriion del Sector Salud Peru, 1988. Globat Regional and Country Assessment of Child
Ministerio de Salud del Peru y la OPS. Fornacion de Mabarion Staff Wording Paper No. 7.1990.Personal de Salud en el Peru. LUma, Peru van de Walle, Dominique, Poverty and Inequalt inAugust, 1989. Latn America and tde Caribbean During 1970's
Moock, P. and Bellew, R. Vocational and Technical and 1980's: An Overview oftdie Evidence.Education n Penu Working Papers, WPS 87, The Webb, R. and Fernandez Baca, G. Peru en NumerosWorld Bank, 1988. 1991. E4tonial Navarete, ULma, Abril 1991.
Newman, Jorgensen and Pradham, "How Did Workers World Bank. Primary Educadon. A World Bank PolicyBenefit From Bolivia's Social Fund?", 7he World Paper. The World Bank, Washington, DC., 1990.BankEconomic Review, May 1991, volume 5, No. 2, World Bank. World Development Report 1991. Thepp 367-393. Challenges of Development The World Bank/Ox-
Ohno, Izumi, "Peru Overview of FY 1991 Budget and ford University Press. Washington, D. C. 1991.Social Expendiures" World Bank, February 1991. Yamada, Gustavo. "Peru's Poverty Profile with the
OPS. Las Condiciones de Salud en lasAmericas. Scien- Available Data" unpublished working paper pre-
60

pared for the World Batk. August 1991. Yamada, Gustavo. "Peru's Glass of MilM Program" us-Yamada, Goustavo. 'Peru's Feeding and Nutrition PFo- published working paper prepaed for the World
gram for High Risk Families (PANFAR)r unpub. Bank. July t991.Lished working paper prepared for the World Bank.July 1991.
Yamada, Gustavo. -Peru's Poplr Kitchens" unpub.lished workig paper pepard for the World BankJuly 1991.
61

PERU
POVERTY ASMNT AND SOCLAL POLICIESAND PROGRAMS FOR TH POOR
I

Am= A
... .. .... ..wow
-Zsi........ .. ... ..........M-,,s`*Me�,-M-,--,:,:K� *s:s: :3:S**AR.W
..... .....U -M
AN.......... .......
...... .... ... . ......
O hi..........*
V W,
iX
65

. l i!
S l |ii
S .Eg s
E ! | = | ! ! ~ ~ ~ ~ ~ '
E~~~~~'r i| *e= l | 4
66

Anex B
RECENT REPSEARCH ON POVERTY IN PERU
Bamo Central de 'Docmlet on Banco nl dLg ya, Mms of Health,Poverty (unprocessed workig paper, 1990). St al. Proyecto Salud y Seguidad SocilaAsse 1985186 Peru Living Standards (1991). Idcludes 3 dunt. Docum_nSurvey. Methodology for caLculation of No.1 is a Mapa de Sad (1988). Comparisonpoverty line differs fom most other studies. is made of differnt parts of the health systmThe authors converted the physical item of as estmated by prwviders of sices and thefood consumption ino their equivalent in resuts of the 1985/86 PISS, Constucts acalories for each individual. A regrion was map of the production of health services innm between those caleoies and the regisred differe regions of the couy. Con)uslon
per capia food expendiu and t was used to i that in general the healh system is notesimate the expnditures on food needed to producing adequate services. Estimates haut aflulfl the required daily calories of 2,900 for quart of the population Is unco d byan adult equivalent. Paper also inctudes a health seices. Doc_uet No. 2 is "Eectos
basic needs assessment. Auth lculate the D ibutivos del Gastc Publico en SaludcntrbuDt tDo poverty of various factors - Conclusion i hat the provsio of publiceducation, occpation, area of residence, etc. health services tends to alleviate poverty inThe document also reviews several urban areas, but not in rua areas. Poor (notemployment progams in Latn America, extreme poor) bendit significantlyfrom publicincluding the PArT, and food assistance health services becaem they resid mostly Inprograms in Pen:. urban areas. Total impact of public spending
in health on income dubon is notNatioal PEa6 Institute and UNDP. La sificant. Docum No. 3 is ctosPobreis en d Peru: Diagnostc y Dsrbutvos del Programa Enfeedad-
opuests de PoNUca (1990). Analyzes Materidad del InSto Peuano de Segurdcharacterisi of povety in 1986 using the Soclal. This prgm only covers 20 percet1985186 Peru Liing Standard Survey and of the popation and only 6 percent in thetrends since 1981. Combines use of povety lowest quintile or in rural areas. Alsoline and basic needs Recomme", diues the impact of cial secuity beftprogams to address poverty, and contrbis on the distrbuion of
income. Finding is that it slightly lessen
Insdtu ,Ajuste yEconomla FamWi income inequalities.1965-190 (1990). Examines the Impact ofeoonomic trends between 1985 and 1990 on World dL A series of studies basd on the
houseold conumption in Lima comparing 1985/86 PLSS were published as Ivgiormaton from two Peru livig Standards Standdss StudyWoringPaper.Sureys (1985/86 and 1990). Also eaines eey covered topics such as poverty proffle,the Impact of the measwures taken by the labor markets, and socia service.Govenm t in August 1990 on low andmiddle-income households in Lima using datafrom another updaft of the PLSS.
67

Annex C
Calcuton of Poverty LUes
1. Two estimates of the povet line to meet t calorie and protein eqirementshave been used in this report. Both ae becase conumption patterns and thebased on the capacity of a household to availabili of certai food items are quitoconsume a basic food baset. -Households differen from the other egions of theare classified as extremelv poor if their total county. In order to select the specificexpeditus are less thn the cost of a basic products and the ditbution of osumptionfood basket. Households are classified as over broad categories (meat, vegetables,gM if their expenditus are less than the fiuits, et.), the consumption patterns ofcost of a basic commodity basket inchuding small farmers in the siera as shown in thefood and non-food items. In order to define ENCA (1971-72) household survey werethe laKtter poverty line, the expenditure used as a model. The resulting basketneceossay to purchase a basic food basket supplies 2241 calories and 55was inflated by a factor to take into account grams/person/day). The composition ofnon-food iems. The factor was determined both the Liur and the nual siewa basketsby locating the decile in which the mean was checked against acual food purcasexpditure on food was closest to the cost pattems of survey respondeats and bothof the basic food baket. Then the cost oi were found to reflect cumnt patterns amongthe basic food basket was scaled up using low-income households in tbhes areas.the same proportion of food/non-food Deails are prvided in Table 4. The basketexenditur. Region-specific factors for the was then vahled using the averg prices offood/non-food ratio were used to reflect four cities in the sierra, weighted by theacua expealitu patteuns. Thus the popldation of each. The broad consistencyexpenditure level at which households are of these baskets with curent consumptionclassified as poor vates by region because pattens was checked with data fram theof dfferences in both prices and 1991 Living Standards Survey and modfiedconumption patters. accordingly.
2. The calculation of the basic food 3. Both the Lima (and urba coastbaket and its cost also differed slihgtly and the sierra food baskets rresetdepending on the region. In the case of economic mes to meet mtnalLima, the basic food basket determined by reqiements taldng into account thethe National Isitue of Ntion (INAN) coumption patterns among lower icomewas used. It provides 2,169 calories and koseholds. The baskets are meat to62.3 gams of protein per person.' These provide a reasonable guide to the level oflevels are similar to the amount of calories expeiiture reqwired by households to meetand proteins in the consumption basket used their mntrional rqmnents. Neverless,in the earlier CEPAL work (2155 calories. thse baskets do not necessarily rpresentand 58 grams of protein/day.2 The INAN the le"t expensive means to meetbasket reflec t consumption patterns nutitional reqiements. Thus howhldsfound among Lima laborers in the 1971-72 with lower food expendures couldENCA (Encuesta Nacional de Consumo conceivably meet the same mnonalAHmntai) and is widely used in Lima requirebents through more e tfficenamong both private and public sector pur1hases.ageies. For the urban coast, the samecomosition of the basket was used, but 4. In order to facilitate oompaDproducts were valued at the average prices across regions aU the baskets wero thenof three cities in the region weighted by expesd in prices of Lima for the firstpopulatiao. For the sierra it was necessary week of October 1991.to modity the composition of products used
1. The calculation of requimnents for the indiviual takes into account the age and gedercomposition of fth population.
2. Magn ude de la Pobrea en Ated#,a Laud en los Anos Ochea, CEPAL 1990
68
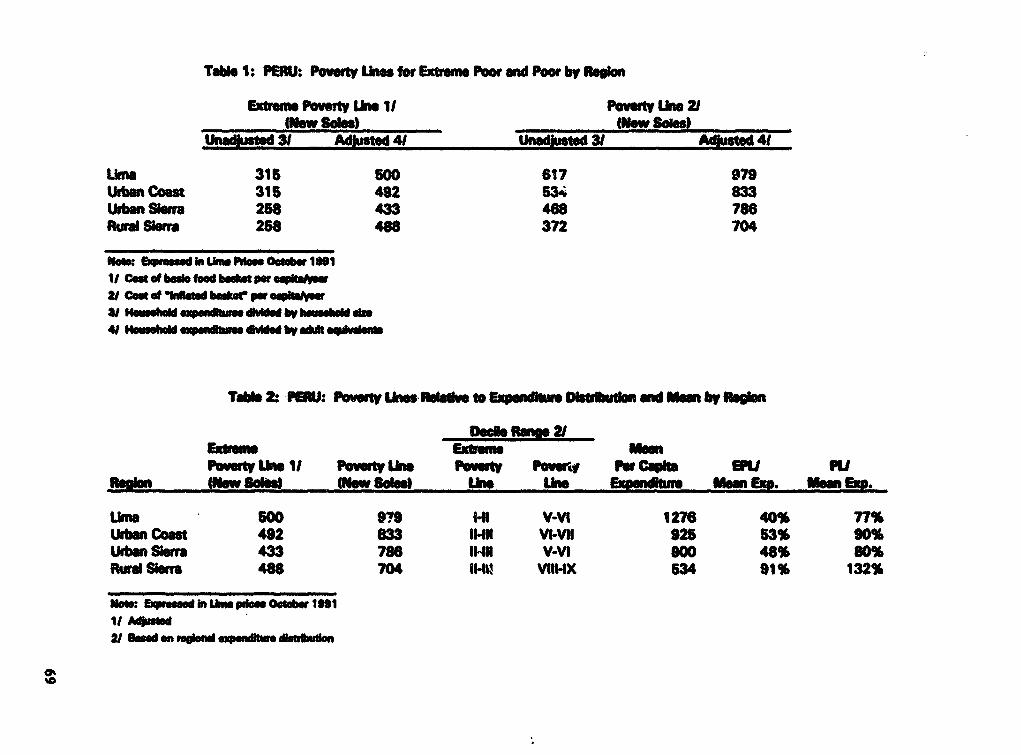
Ta 1: P -.: Povrt Lie for Extem Poo an Poo b Reglon
Exeom Povty Limn 11 Povwty Urno 2!"w Saba) (New Se..)
Unadjusted 31 Adjuted 41 31 Adjuw 41
Uka 315 SOO 617 979UrbanCoast 315 492 53m; 833Urban Sirra 258 433 488 786Rural SIera 258 488 372 704
Nowt i bpea in hns Ptiw OeO_ 1S1
11 Cgt fd boded bedmet p o epkulywR Ct dof uudl bade w epltusea# Heusebel .xp.sdbAom idie by Iwmd I.
Tab 2: PE.: Por Ut L_s Rati to Expend Olstdn Md Mm by Rigion
Dade Rag 2!
Ptyt. 1I Poverty Uiw Poer1 POVIh Per Capul Fll !pPA_N (ewSabd New So,) La" Lime Exeendbs Mom Em. Mm Exm.
ULa 500 979 9 V-V- 1276 40% 77%Uban Coast 492 833 Il-ll VI-VI 925 63% 90%Uban Sr 433 786 I1II1 V-VI 900 48% 80%Rurd Sierra 488 704 114N1 VII.4X 534 91% 132%
NoW. r- we.emm In Lb_ pd*n Osu*e IW9
21 on A_S2/ Bond on e-sind expenitm dIebutsn

Tabl 3: BasIc Food Bat for Lmnd iw o Coastof the HNaonal Instte for Food and Nutdton (INA)
CandadProducto Recommed.
Leche en Polvo 2 trosHuevos 2 urJd.Higado 0.25 Kg.Jurel 0.50 Kg.Zapdb 1,0 Kg.Tomate 0.2 Kg.Ajos 0,015 Kg.PorejIl 0,03 Kg.Pina 0,30 Kg.Naranjs 0,25 Kg.Pbtano 3 Unid.Papa Blanca 1,0 Kg.Arroz Cornente 0,84 Kg.Pan Tolete 19Unid.Acetos Compuseo 0.18 LtMargarina 0,05 Kg.Azucur Blanca 0,30 Kg.Sol 0,03 Kg.Caneta A Granel 0,01 Kg.Te(Cajax57 grs)2/ 0,02 Kg.
SI. 5.25S
Nate:Oe food bssketfora f coomposod of husabnd, AF* nd4 4den (2160 ec*ike e
62.3 vee of protaI ps parasoJ.
* Lime prke hI October 1989 new soles
70

Tabe 4: Basic Food Basket for the SilraClanitdad
Cmnidad Requeuida Requwidapor peona (am.) ,pr famia tars.)
Productos Rubro ProductoCames 45
Cordeso 7.5 45Vacuno 2.5 15Polio 2.5 15Menudencias 5 30Otras cames 7.5 45Huevos 20 120
Leche v Defivados 25Leche Fresca 20 120Quesos 5 30
Vireas 50Tomato 8.33 50Col y colifor 12.5 75Zapalto 4.17 25Cebolla 16.67 100Zanahoria 8.33 50
Frutas 75Naranjas 25 150Otras frutas (manzana) 50 300
Lqgumninosas 50ArveJas 14.29 86Frijoies 17.86 107Habas 17.86 107
Tuberculos v Raices 497Camote 15.27 9200. y Ollueo 40.71 244Papa 400 2400Chuno 20.35 122Otros ubercuilos 20.35 122
5ereales v pofivado" 327Arroz 45.21 271Cebada 33.9 203Mai grano 71.58 249Maiz fresco 22.6 136Qulnius 11.3 68Trigo 0. 14 181Pan 100 600Fideos 22.6 136
Azuc 60Azucar blanea 16.8 101Azucar rubla 43.2 259
Aggi,Us v Grasas 47Mantecas 31.33 188Aceite 15.67 94
Sl.3.96BAfOT,S to the bW_tVdthf /SWrt h eh _dbh_ *emth hwaa. sVwVG4 BA1171-72 Aw ms ,ed *4Ww. t M| t *AM ,A I4 and
_ * <na pS2f emb 8*"W
55g,SfS ef ph ..p..w* 71*Uhpme Gabbe 1S/1 ..
Aim D
PMU LPVMIG STANDARDSMEASUM SURVEY, 1991
SELCE TA
EKIVlEl Standards Measurement &ewm
E.1. Location of the Poor by RegonE.2. Estimated Number of Poor by RegionE.3. Distribution of Populaton by Region and Povt LovelE.4. Characterics of household head by povty lvel: AS are (Colum %)E.S. Cha of houehold head by poverty level: All ares (Row %)E.6. Charactstic of household head by povy levd: Lima (Column %)E.7. Charactriscs of household head by poverty level: Lima (Row %)E.8. Characteriscs of household head by poverty level: Sierra Rural (Column %)E.9. Characics of household head by povety level: Siera Rura (Row %)E.10. Dbtribudon of total expenditr by poverty level: All areE.11. Distribution of total expendits by poverty level: LimaE.12. Ditrution of total expendiures by povery level: Rur SienE.13. Housing characteistics by poverty level: AlU are (Colum %)E.14. Housing characteristics by pove level: Al areas (Row %)E.15. Housing characeristics by poverty level: Lima (Colum %)E.16. Housing characterstis by poverty level: Lima (Row %)E.17. Housing cha isis by poverty level: Sierra Rural (Column %)E.18. Housing characics by poverty level: All areas (Row %)E.19. Occupation of household head by poverty levelE.21. Coverage of vaccinations chidW-. ages 0-12 years: All areasE.22. Coverage of vacciatons children ages 0-12 years: LimaE.23. Coverage of vaccinations, children ages 0-12 years: Sierra RuraE.24. llness by poverty level: All areasE.25. Illness by poverty level: LimaE.26. Illness by poverty level: Sierra RurE.27. Source of care by patient poverty level: all areasE.28. Source of care by patient poverty level: LimaE.29. Source of care by patient poverty level: Siera RuralE.30. Incidence of food assistanceE.31. Use of food assisance by poverty levelE.32. Effect of food trfers on expenditure levelsE.33. Educadon Level and School atndance by Region
75

| | 1 I I I c | | |Y ;s a W |~~~~~~~~~I W k * ; X 'I* | ".l
;t a~~~~~~~~~~~~~~~~~~~~~~~~~~~~~~~~~
-9~~~~~~~~~~~~~~~g
i~~~~~ !Xs|'k i g #lgW ,

TALe 5-4. CHARACTISTICS OF HOUSEHOLD HED BY PRTY LEVEL: ALL MAIS(PRCENTAGE)
EXTREMELY N PER-CAPITACHAR ERISTICS P OTER POOR OTHERS TOTAL AAL
EXPENDITURES 1/(NEW SOES)UNADJUSTED 2/
OEMDER OFHUSHOLD HEAD
NALE Be 82 85 81 83 74FEMALE 12 18 1S 19 17 83
AGE OFHUSEHOD HEAD
16 TO 25 YEARS 5 4 5 S S 70426 TO 3S YEARS 22 17 20 16 18 72036 TO 45 YEARS 30 24 2 23 25 7To" TO 5S YEARS 22 22 23 21 22 711S6 TO 65 YEARS 13 19 16 20 18 821MORE THA 6S YEMS 8 14 10 1S 13 867
LANGsAGE OF
SPAwMSN 59 90 76 91 84 821UIaECUA 19 8 14 7 10 449
TMARA 22 2 10 2 6 242
EMPLOYER OFsOLD HEADPUILIC SECTOR 8 1S 11 16 14 nta
PIIVATE SECTOR 20 22 22 22 n/a
PRIVATE HONE 1 0 1 0 1 n/a
SELF-ENPLOYED 49 38 44 37 40 n/a
UPAID FAMILY RWER 9 5 7 5 6 nta
OTHER 1 0 0 0 0 n/a
UNEMPLOYED 4 2 3 2 3 n/a
RETIRED 8 17 12 18 1S n/a
HIGHEST GRADECOMPLETED BY HEAD
NOME 11 5 9 4 6 431
INITIAL 1 1 1 0 1 418
PRIMARY 55 34 47 30 38 543
INCOMPLETE SECONDARY 1S 13 1S 12 13 633COMPLETE SECONDARY 16 26 21 27 24 808
NON-UNIVERSITY HIGER 2 6 3 7 5 969
INCOMPLETE UNIVERSITY 0 4 2 4 3 1160
COMPLETE UNIVERSITY 1 12 3 16 10 1429
OTHER 0 0 0 0 0 874
100 100 100 100 100 750
78-1/ At first eek october Lim prices 1991.
2V Hosehold *xpenditures divided by household size.

TABLE I-$. CNARACTERITICS OF NOUNO HNEAD I POVERT LEVELS ALL AE(PERCENTAGE)
EXTELY MM P-CITACHRCTERISTICS POOR OTER POOR OTHERS TOTAL ANNtAL
EXPEDITURES 1/(NEW LES)
UNADJUSTD 2/
GENE OFIWUSEHtllD HEAD
NALE 19 81 48 53 100 743FEMALE 13 8 40 60 100 m
AGE OFH0SEi)D HMA
16 TO 25 YEARS 19 Sl 4 54 100 704
26 TO 35 EMS 22 78 52 48 100 72036 TO 45 YEARS 22 78 S0 50 100 ?00w TO SS EARS I8 82 48 S2 100 711S6 TO 65 TE4RS 13 87 40 60 100 021
ORE HAN 65 YEARS 12 8a 36 64 100 867
LANGUAGE OFHOUSEHOLD HEAD
SpANISH 13 8 a 42 5S 100 821
CUECHUA 34 66 62 38 100 449
ATMARA 70 30 8S 14 100 242
EMPLOYER OFHOUSEHOLD HEAD
PUSLIC SECTOR 10 90 3? 63 100 nIa
PRIVATE SECTOR 1T 83 47 53 100 n/a
PRIVATE HOE 41 60 92 8 100 n1a
SELF-EMPLOYED 22 78 50 50 100 nWa
UHPAID FANILYUORXER 29 71 53 47 100 nla
OTHER 56 44 100 0 100 n/a
UNEMPLOYED 29 71 68 32 100 nta
RETIRED 10 90 35 65 100 n/a
HIGHEST GRADECOWPLETED BY HEAD
NOME 30 70 65 35 100 431
INITIAL 33 67 70 30 100 418
PRIlPRY 26 74 58 42 100 543
INCOMPLETE SECONDARY 20 80 52 49 100 633
COMPLETE SECODARY 12 88 41 60 100 808
NON-UNIVERSITY HIGHER 6 94 28 72 100 969
INCOMPLETE UNIVERSITY 0 100 23 77 100 1160
COMPLETE UNIVERSITY 1 99 13 87 100 1429
OTHER 0 100 0 100 100 874
1 At f1rst week october Lina prices 1991.
2V Household expenditures divded by household size.
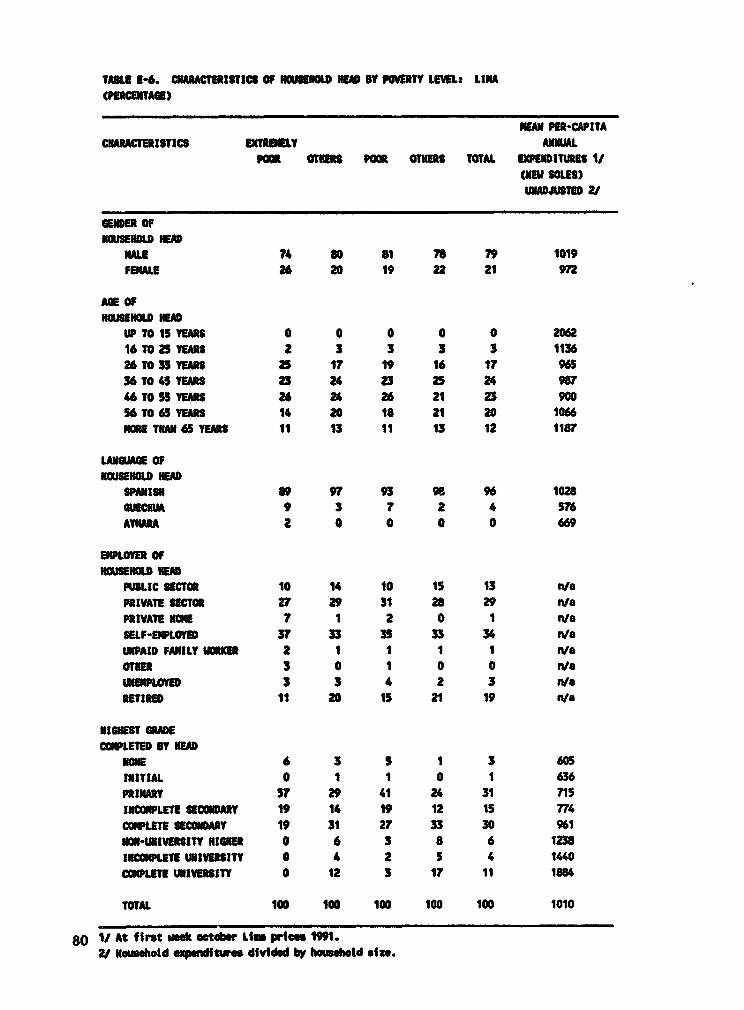
TABIIE 516. CNAACTERISTICU OF I EOUW NW1 BY FTr LEVELt LINA(KNTAGE)
M Pa-CAPITACNARACTERISTICS EXTET LY ANNAL
PoM onmi PM Grim TOTAL v wDIuns 1/1MEv SOLES)UNADJUSTED 2/
NDER OFu"SEHOD HED
NALE 74 S0 81 78 79 1019FINALl 26 20 19 22 21 92
AGE OFHWSEH NEAD
UP TO 1SY EARS 0 0 0 0 0 206216 TO 25 YEAS 2 3 3 3 3 113626 TO 135YE 25 17 19 16 17 "636 TO 45 YE 23 24 23 25 24 98A TO 5SYTUS 26 24 26 21 23 905 O 65YEARS 14 20 18 21 20 1066N110 TUN 65 E 11 13 11 13 12 1187
LANUAGE OFNQUSEN01D HEAD
SPANISR 89 97 93 96 96 1028UECHUA 9 3 7 2 4 576
AYNARA 2 0 0 0 0 669
EMPLOYER OFUWUSUW HEUA
PUSLIC ECTOR 10 14 10 15 13 n/aPRIVATE SECTOR 27 29 31 28 29 nVaPIVATEN NE 7 1 2 0 1 n/aSELF-EMPLOYED 37 33 35 33 34 n/aUNPAID FANILY 1m1EQ 2 1 1 1 1 nIaOTHER 3 0 1 0 0 n/aUNEPLOED 3 3 4 2 3 n/aRETIRED 11 20 15 21 19 n/a
HIGHEST GRADE01PLEED BT HED
NMEl. 6 3 5 1 3 605INITIAL 0 1 1 0 1 636PRINAY ST 29 41 24 31 715INCPLETE SECONARY 19 14 19 12 15 774CONPLETESECONDARY 19 31 27 33 30 961NON-UNIVERSITY HIGHER 0 6 3 8 6 1238INOMPLETE UNIVERSITY 0 4 2 5 4 1440COI1PLETE UMivEsiTY 0 12 3 17 11 1884
TOTAL 100 100 100 100 100 1010
80 1/ At first we* ztbw Lim prim 1991.2/ Household expendtum divided by housemhold size.
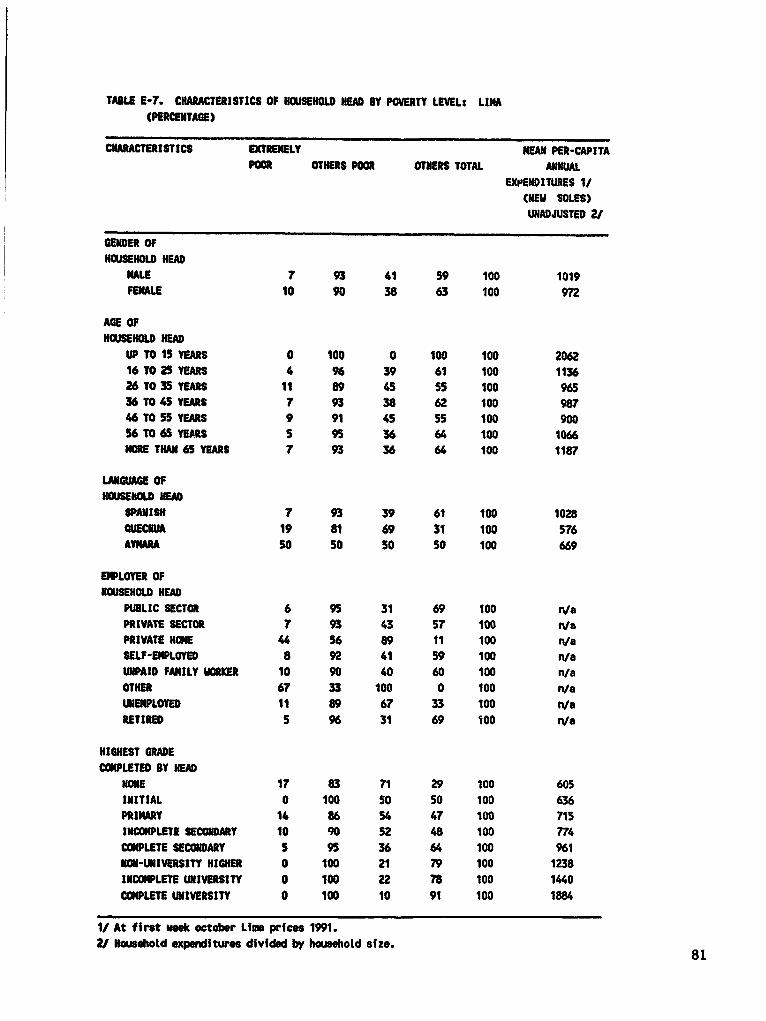
TABLE E-7. CHARACTERISTICS OF HOUS HEAD BY POVERTY LEVEL: LIHA(PERCENTAGE)
CHARACTERISTICS EXTRENELY MEAN PER-CAPITAPOOR OTHERS POOR OTHERS TOTAL ANNUAL
EXPENDITURES 1/(NEW SOLES)UNADJUSTED 21
GENDER OFHOUSEHOLD HEAD
KALE 7 93 41 59 100 1019FEMALE 10 90 38 63 100 972
AGE OF
NOUSEHOLD HEADP TO 15 YEARS 0 100 0 100 100 206216 TO 25 YEARS 4 96 39 61 100 113626 TO 35 YEARS 11 89 45 55 100 965
36 TO 45 YEARS 7 93 38 62 100 987
46 TO 55 YEARS 9 91 45 55 100 900
56 TO 65 YEARS S 95 36 64 100 1066
NORE THA 65 YEARS 7 93 36 64 100 1187
LANGUAGE OFHOUSEhOLD HEAD
SPANISH 7 93 39 61 100 1028
QUECHUA 19 81 69 31 100 576AYMARA SO 50 50 50 100 669
EMPLOYER OFHOUSEHOLD HEAD
PUBLIC SECTOR 6 95 31 69 100 nla
PRIVATE SECTOR 7 93 43 57 100 nWePRIVATEHOME 44 56 89 11 100 n/aSELF-EMPLOYED 8 92 41 59 100 nta
UNPAID FAMILY WORKER 10 90 40 60 100 nta
OTHER 67 33 100 0 100 n/a
UNEMPLOYED 11 89 67 33 100 n/aRETIRED 5 96 31 69 100 n/a
HIGHEST GRADECOMPLETED BY HEAD
NONE 17 83 71 29 100 605INITIAL 0 100 50 50 100 636PRIMARY 14 86 54 47 100 715
INCOMPLETE SECOMNARY 10 90 52 48 100 774COMPLETE SECOMDARY 5 95 36 64 100 961NON-UNIVERSITY HIGHER 0 100 21 79 100 1238INCOMPLETE UNIVERSITY 0 100 22 78 100 1440
COMPLETE UNIVERSITY 0 100 10 91 100 1884
1/ At first week october Lifa prices 1991.2/ Household expenditures divided by household size. 81
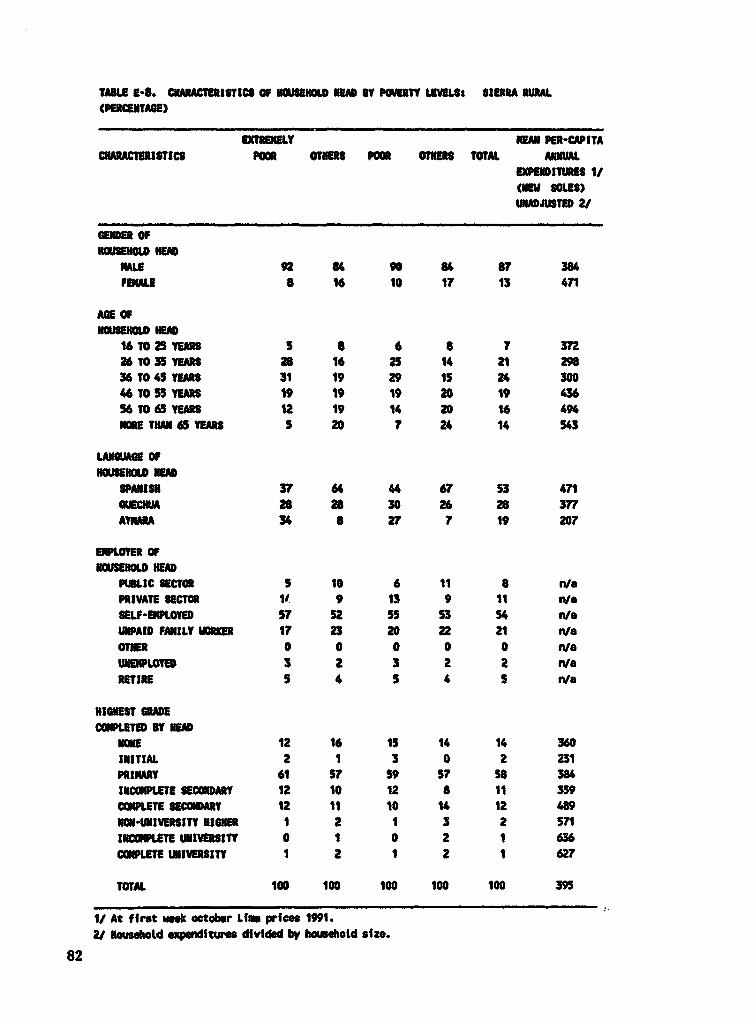
TAMLE 5-. CHAACTEItICS OF NWUEIOL EM BY POV LEVELS, SILEA RURAL
(PERCENTAE)
EXTEMLY M PER-CAPITA
CNAmACTERISIC PM OTERS POOR OHR TOTAL AmAEXPENDITURES 1/(NEW SOES)UNADJUSTED 2/
uENuu oFOUWEHOW HA
MAE 92 84 90 84 ST 384
FENALE 8 16 10 17 13 471
AUE OFNELD ED
61TO 25 EiRS 5 a 6 8 7 372
261TO 35YERS 28 16 2S 14 21 2m
36T 045 YEARS 31 19 29 15 24 300
i TO 55 19 19 19 20 19 436
56 TO 65 YEARS 12 19 14 20 16 494
NORE THAN6S6M 5 20 7 24 14 543
LAMOLUA OFNONEHOLD NE
SPAISH 37 64 44 67 53 471
UECIA 2as 28 30 26 28 377
AIOM 34 a 27 7 19 207
EPLOER OFHOWEHWD NEM
PUBLIC SECTOR S 10 6 11 8 nta
PtIVATE SECTOR 1 9 13 9 11 n/s
SELF-EMPLOYED ST 52 5S 53 54 n/a
UNPAID FMILY lAVR 17 23 20 22 21 n/a
OTHER 0 0 0 0 0 n/a
UNWLOYER 3 2 3 2 2 n/a
RETIRE 5 4 S 4 S n/a
HIGHEST GIUDCOIPLETED BY HEWD
NMOE 12 16 15 14 14 360
INITIAL 2 1 3 0 2 231
PRIMARY 61 57 59 57 58 384
INCONPLE TECONDARY 12 10 12 8 11 359
CWLETE SECONDAY 12 11 10 14 12 489
M1ONI-UNIVERSITY HIIER 1 2 1 3 2 571
INCOIPLE UNIVERSITY 0 1 0 2 1 636
COIMPET UNIVERSITY 1 2 1 2 1 627
TOTAL 100 100 100 100 100 395
1/ At ffret week octbeor Lma prfcee 1991.2/ Huehold e.dittures dIvided by houehold size.
82
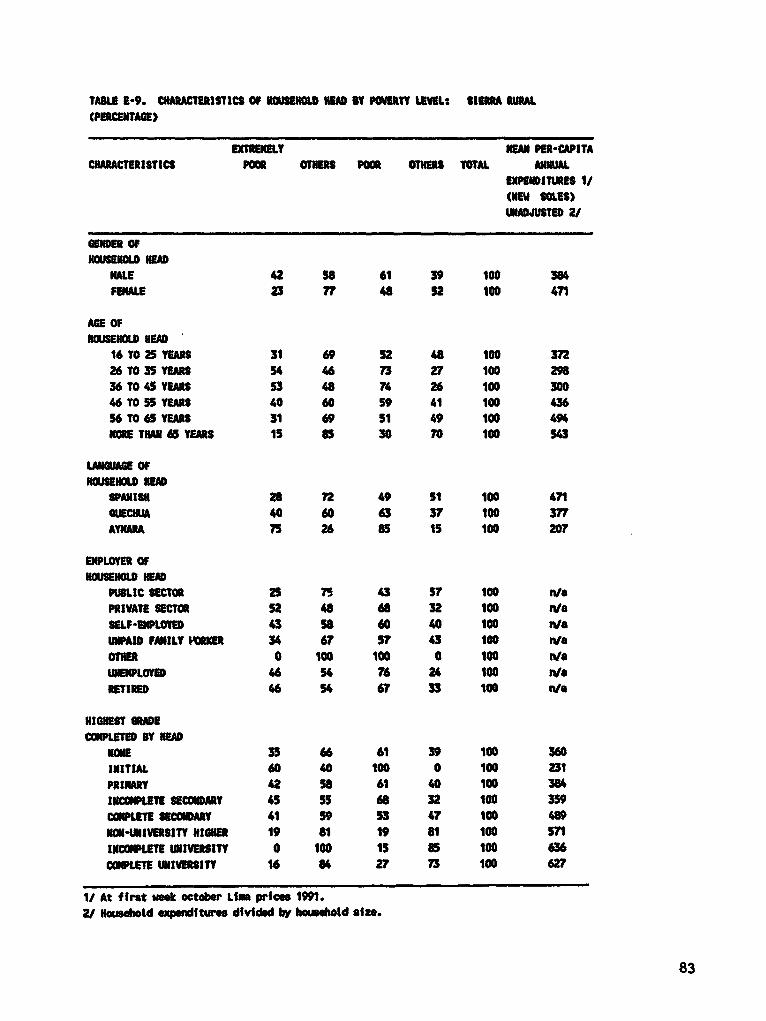
TABLE 1-9. CHARACTERISTICS Of HUIEOL HA U PNTY LEVEL: SIER WAN
(PERMAE)
EXTRMLY NM P-CITA
CHARACTISTICS PO OTHES POOR OTNERS TOTAL An"EXPENDITURES 1/(KM SOLES)UNADJUSTED 2/
GENDER OFIOUSEHOLD ED
KALE 42 S8 61 39 10 384
FEMALE 23 n48 52 100 471
AGE OFHuSEmLD HMEAD
16 TO 25 YEARS 31 69 52 48 100 372
26 TO 35YEAS 54 46 73 2 100 29
36 TO 4S YEARS 53 48 74 26 100 300
T S5 YEAtS 40 60 59 41 100 436
56 T0 65 YAS 31 49 51 49 100 494
M TUTHN 65 YEARS 1S 85 30 70 100 S5
WIAGE OF
HWUSEHOLD HEADS18H 28 72 49 51 100 471
GUECHIA 40 60 63 37 100 377
AYAMA 75 26 85 1S 100 207
EPLOER OFHOUSEHODW HEAD
ULIC SECTOR 25 75 43 5? 100 n/a
PRIVATE SECTOR 52 48 68 32 100 nWa
SELF-MPLOED 43 S8 60 40 100 n/a
UWID FMILY VKR 34 67 5t 43 100 n/a
OTHER 0 100 100 0 100 n/a
UNLOY 46 54 76 24 100 n/a
RETIRED 46 54 67 33 100 We
HIGHEST GRDECOMPLETED SY HEKD
NE 35 66 61 39 100 360
IIITIAL 60 40 100 0 100 231
PRIMARY 42 s8 61 40 100 384
INCOM SECONDARY 45 55 68 32 100 359
COMPLIET SECDARI 41 59 53 47 100 489
MON-UNIVERSITY HIGHER 19 81 19 81 100 5n
INCOMPLETE UNIVERSITY 0 100 15 85 100 636
COlPLET UNIVERSITY 16 84 2 73 100 627
1/ At first week octboer Lim prife 1991.2/ Holuse1d e3spiltures dfvided housbeold size.
83

TABLE E-10. OISTRI1UTSON OF TOTAL EXPENDITURES BY POVERTY LEVEL: ALL AREAS
KEAN PER-CAPITA DISTRIBUTION OF RATIO OFANNUAL EXPENDITURES 1/ EXPEUDITURES FOOD EXPEND1TURES/
(NEW SOLES) (1) TOTAL EXPENDITURESUNADJUSTEO 2/ ADJUSTED 3/ UNADJUSTED 2/ ADJUSTED 3/ UNADJUSTED 2/ ADJUSTED 3/
EXTREMELY POOR 192 327 5 9 70 68NON EXTREMELY POOR 873 1,194 95 91 56 55TOTAL 750 974 100 100 58 58
POOR 329 529 20 33 65 63
IONu POOR 1.111 1.642 80 67 52 50TOTAL 750 974 100 100 58 58
l At first week October Line prices 19912/ Household expenditures divided by household size3/ Household expenditures divided by adult quivalents
TABLE E-11. DISTRIBUTION OF TOTAL EXPENDITURES BY POVERTY LEVEL: LINA
NEAM PER-CAPITA DISTRIBUTION OF RATIO OFANNUAL EXPENDITURES 1/ EXPENDITURES FOOD EXPENDITURES/
(NEIW SOLES) (0) TOTAL EXPENDITURESUNADJUSTED 2/ ADJUSTED 3/ UNADJUSTED 2V ADJUSTED 3/ UNADJUSTED 2/ ADJUSTED 3/
EXTREMELY POOR 239 381 2 3 62 59NON EXTREMELY POOR 1,074 1,392 98 97 50 50
POOR 429 660 17 28 57 56NOMPOOR 1,399 1985 83 72 46 45TOtAL 1.010 1,276 100 100 51 51
1/ At ffirt week October Lima prices2/ Household expenditures divided by household size3/ Nousehold expeditures divided by adult equvfalents
TABLE E-12. DISTRIBUTION OF TOTAL EXPENDITURES BY POVERTY LEVEL: RURAL SIERRA
NEAR PER-CAPITA DISTRIBUTION OF RATIO OFAUMML EXPENDITURES 1/ EXPENDITURES FOOD EXPENDITURES/
(NEW SOLES) (2) TOTAL EXPENDITURESUNADJUSTED 2/ ADJUSTED 3/ UIADJUSTED 2/ ADJUSTED 3/ UNADJUSTED 2/ ADJUStED 31
EXTREMELY POOR 166 302 17 32 75 74NON EXTREIELY POOR 550 836 83 68 70 70
POOR 211 378 32 55 75 74NO POOR 668 1085 68 45 68 66TOTAL 395 534 100 100 72 72
1/ At first wek October Lime prices84 2/ Nousehold expenditures divided by household size
3/ Household expenditures divided by adult equivalents

TOLE i-13. HOUSING CHARACMISTICS BY POTVT LEM: AU. AREA(POTAGE)
EXTREELY MA P-CAPITACNARACTERITICS POOR OTHERS POOR OTHR TOAL AMA EXPEN-
DltURES 1t(vimUS SOLES)UNJUSTED 2/
SOURCE OF DRINKING MATER
PUBLICINSIDE IIELLINO 44 73 sT s a 67INSIDEBUILDING 5 a 7 7 7 624WTSIOE SI)LD1iH 6 S 6 S 5 "6
WELL 26 4 14 3 8 m
RIVER 14 5 9 5 7 377VAM TRUTU 1 3 4 2 3 S84OTHER 4 2 3 2 2 601
HOURS OF PUBLIC WATER SUPPLY
1-3 NOM/M DAY 21 15 19 15 6704-6 NOURS/P DAY 1S 12 14 11 12 695
?-12 HOURS/ EDAY 17 21 21 20 20 m13 OR MORE HOURS/PER DAY 47 53 47 56 52 904
SORCE Of LIGHTING
ELECTRICITY 49 88 71 89 1 S4oKE_OSENE/OIL 44 9 24 9 16 336
CANDLES 6 3 5 2 3 413
NO 0 0 0 0 0 327
OTER 1 0 1 0 0 551
ERA E SERVI
PULIC SERVICE 2 71 49 76 63 924
MULL-SE"IC 4 4 5 3 4 5S5
LATRINE 40 10 23 9 16 423
NMI 29 1S 23 12 17 448
00OKING FURL
ELECRICITY 1 3 1 4 3 1595
GAS 4 34 14 41 29 116l
KEROSENE 39 46 51 39 45 621
COAL 1 0 1 0 0 404
wow 49 16 30 15 22 37
Oar 6 1 3 0 2 215
D ONOT COK 0 1 1 0 1 762
TOTAL 100 100 100 100 100 750
1/ At first sdk october Lm prsi 1991. 852/ Houeold exip ftur.s dividd by househotd size.

TABLE E-14. HUSING CRACEISTICS BY POVERTY LEEL: ALL ARS
(PERETAGE)
EXTRENLY NEA PER-CAPITA
CHARACTISTICS POOR OTlERS PODR OTHERS TOTAL ANUPAL EXPEI-DITURES 1/
(NUEVOS SOLES)uNADJT 2/
SOURCE Of DRINKING WATER
PUBLICINSIDE DWELLING 12 88 39 62 100 Sy5
INSIDE WILDING 13 a 6 54 100 624
OUTSIDE BUILDIN 20 60 54 46 100 646
WELL 61 39 82 l 100 265
RIWElt 36 64 62 38 100 377
WATEI TRUC 9 91 67 33 100 58
OTHE 32 68 66 34 100 601
OURS OF PIUBLIC ATER SUPPLY
1-3 NO RIPERDAY 17 83 48 52 100 670
4-6 HOURS/PE DAY 1S 85 46 54 100 695
7-12 HOURJPER DAY 10 90 41 S9 100 88O
13 OR MORE HOURS/PER DAY 11 89 36 64 100 904
SOURCE OF LIGHTING
ELECTRICITY 11 89 40 60 100 845
KEROSENE/OIL 51 49 71 30 100 336
CANLES 32 68 68 32 100 413
NM 50 50 100 a 100 327
OTHER 45 55 73 2 100 551
SEWERAGE SERVICE
PU3LIC SERVICE a 92 36 64 100 924
VELL-SEPTIC 18 82 59 41 100 555
LATRINE 4 54 68 32 100 423
NMUE 30 70 62 38 100 48
COlllNl FUEL
ELECTRICITY 5 95 21 79 100 158S
Gas 3 98 22 78 100 1187
KEROSENE 16 84 53 47 100 621
COAL 30 70 76 24 100 404
mODm 41 59 63 37 100 387
OTNHER 74 26 90 11 100 215
DO OTI COK 8 92 60 40 100 762
1/ At first weok octoer Lie prices 1991.
2/ Household spmnditures divided by household sfie.
86

TABLE E-15. HUING CMAAACTERISICS BY POTY LEVELt LINA(ERCENTAGE)
EXTRMELY M PER-CAPITACHIRACTERISTICS POOR OTHERS PamR OTHERS TOTAL ANNUIAL
EXPENDITURES 1/(NUIWES 80LES)UNADJUSTE
SORCE OF DRIKING VATER
PUBLICINSIDE DWELLING 60 80 67 86 78 1112INSIDE BUILDING 9 7 8 7 7 n3OUTSIDE UILDINiG 19 7 12 4 7 620
WELL 5 1 4 0 2 444WATEtTRUCK a S 9 2 5 592OTHER 0 1 1 0 1 670
HOURS OF PUBLIC VATER SULY
1-3 RSIMER DAY 33 14 22 12 16 7694-6 URSIMR DAY 14 10 12 9 10 8107-12 H0URS/PER DAY 25 25 25 25 25 100413 OR ME OURS/MR DAY 28 51 41 55 50 1198
SOCE OF LIGHTING
ELECTRICITY 8S 97 92 98 96 1032KEROSENZ/OIL 8 2 4 1 2 544CANDLES 2 1 2 0 1 480NONE 2 0 1 0 0 327OTHER S 0 1 0 1 374
SEVERAGE SERVICE
PUBLIC SERVICE 62 86 7n 92 86 1009WELL-SEPTIC 11 5 10 2 5 S0SLATRINIE 12 5 9 4 6 670NONE 15 4 8 2 5 551
COOKING FUEL
ELECTRICITY 3 3 1 5 3 1909¢aS 9 50 25 62 1303KEROSENE aS 45 72 32 48 668WOOD a 0 1 0 0 29DO1T COOK 2 1 2 1 1 785
TOTAL 100 100 100 100 100 1010
1/ At firt week oteter Lim pries 1991.2f ouwshold expegtum divided by hbwuhtd siz.
87
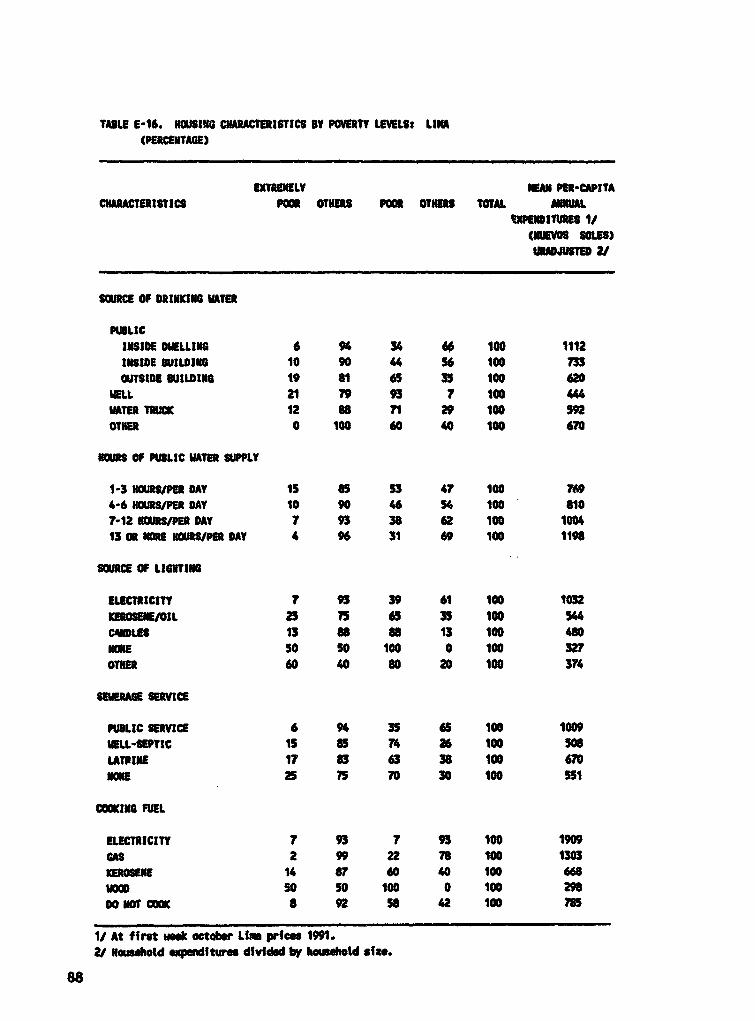
TABLE 5-16. NOUSING CHARACEIICS SY POETY LEVELS: LIA(PENTAGE)
EXTRENELY NEAN P-CAPITA
CHARUCTERISTICS P0 OTHERS NONt OTES TOTAL ANA
UPWI UES 1/( SOLES)IIWJTE 2{
SOURCE OF DRINKING WATM
PUBLICINSIDE DMELLING 6 94 34 60 100 1112
INS1 E BUILDING 10 90 44 56 100 733
WTSIDE UILDING 19 81 65 35 100 420
WELL 21 79 93 7 100 444
VA TERCK 12 a8 71 29 100 52
OTNER 0 100 60 40 100 6R0
NOURS Of PtIBLIC WATE SUPPLY
1-3 NOURS/ EDAY 15 85 53 47 100 769
4-6 NOURS/PERDAY 10 90 46 54 100 S10?-12 NURS/PERDAY 7 93 38 62 100 1004
I3 OR NOREMRS/PER UY 4 96 31 69 100 1198
SOURCE Of LIOHTING
ELECTltICITY 7 9 39 61 100 1032
KEROSENE/OIL 25 75 65 35 100 544
CNLES 13 S8 as 13 100 480
NONE SO SO 100 0 100 32?
OTNER 60 40 80 20 100 374
SEWERAGE SERVICE
REULIC SERVICE 6 94 35 65 100 1009
VELL-SEIC 15 85 74 26 100 50S
LATPINE 17 83 63 38 100 670
NONIE 25 75 70 30 100 551
COOKING fUEL
ELECTRICITY 7 93 7 93 100 1909
GMS 2 99 22 78 100 1303
KEROSENE 14 8? 60 40 100 668WOm 50 SO 100 0 100 2
DO NOt COOK 8 92 58 42 100 785
1/ At first uk oct.bw Liim price 1991.2/ Hosehold experditurs divided by houehold sie.
88

TABLE E-17. IOUSING CHARACTERISTICS BY PCNERTY LEVELS: SIERRA RURAL(PERCENTAGE)
EXtREEILY NEAN PER-CAPITACHARACTERISTICS poOR OTHERS POOR OTHERS TOTAL AUAL
EXPENDItURES 1/(NUEVO$ SOLES)
JUSDTI 2/
SOURCE OF DRINKING WATER
PUBLICINSIDE DWELLING 23 38 24 44 32 S0INSIDE WILDING 5 8 7 6 7 403OUTSIDE UWILDING 4 4 4 5 4 406
WELL 37 14 39 14 23 269RIVER 28 34 32 31 32 378WATE TRUCK 0 0 0 0 0 284OTHER 2 2 3 1 2 329
HOURS OF PUBLIC WAtER SWLY
1-3 HUS/PER DAY 9 17 7 21 14 5604-6 OURSPER DAY 6 13 8 14 11 4947-12 HOURS/MPER DAY 6 9 6 10 8 m13 OR NOREURS/PER DAY 79 61 79 55 67 426
SOURCE OF LIGHTING
ELECTRICITY 19 39 22 44 31 Su8KEROSENEjOIL 74 S0 68 47 59 332CANDLES 7 11 10 9 9 423OTHER 0 0 0 0 0 3%9
SEUESASE SVICE
PUBLIC SERVICE 3 12 4 14 a 606HELL-SEPTIC 3 8 3 10 6 637LATRINE 51 29 42 31 38 346NONE 44 52 51 45 49 370
COOKING PUEL
ELECTRICITY 0 I 0 1 0 2016GAS 0 1 0 2 1 764KEROSENE 3 10 4 12 7 470COAL 0 0 1 0 0 252XIWm 84 84 s8 84 84 393OTHER 12 3 10 2 7 21700 lOT ClK 0 0 0 0 0 282
TOTAL 100 100 100 100 100 395
1/ At first week ostobw LU prtes 1991.2/ Household expendItures divided by hcusehold sfze.
89
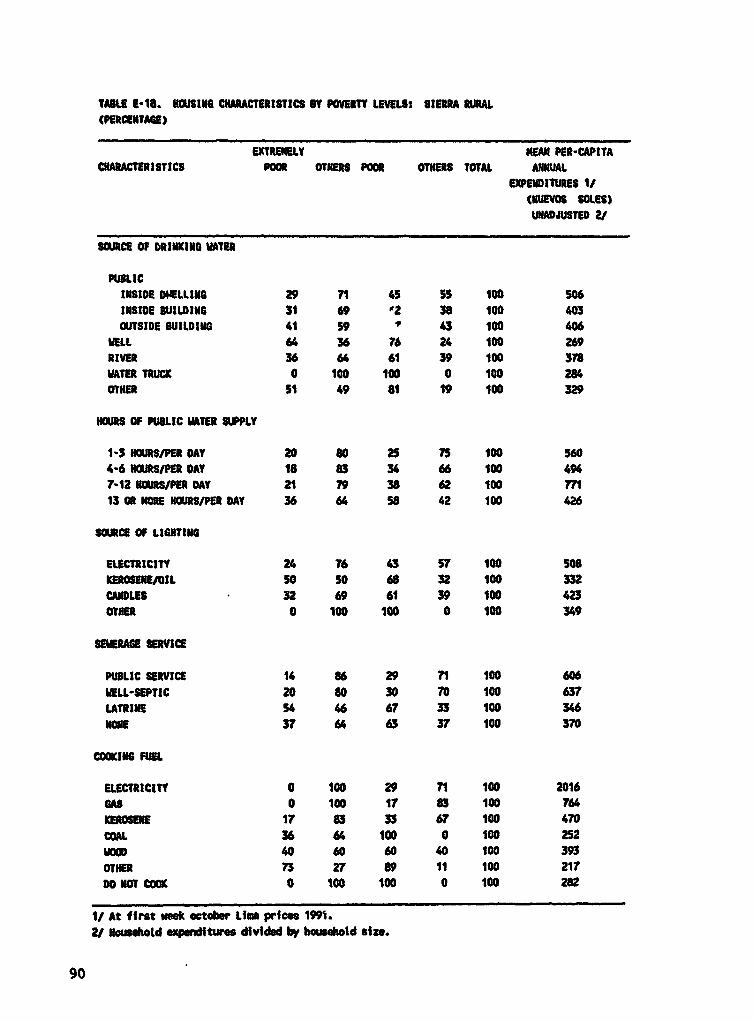
TABU 1-18. 151SING CNAACERISTICS BY PETY LELIs 81ER OUAL
(PERCENTARE)
EIREL NEAR PER-CAPITA
CHARACTERISTICS POOR OTHERS POOR OTHERS TOTAL ANNUALEXPENIIDURES 1f
(NUEVOS SOLES)ADJUSTED 2/
SOURCE OF DRINKING WATER
PRULICINSIDE DWELLIIM 29 71 45 SS 100 506
INSIDE 3UILJDIN 31 69 2 38 100 403
OUTSIDE BUILDING 41 59 43 100 406
NELL 64 36 7 24 100 269
RIVER 36 64 61 39 100 378
WMTERIRUCK 0 100 100 0 100 284
O1HER 51 49 81 19 100 329
HOURS OF PUBLIC WATER SUPPLY
1-3 HOUSIM PDAY 20 80 25 i5 100 560
4-6 SIPER AY 16 83 36 66 100 494
T-i2 HRS/M DrA 21 79 38 62 100 m13 OR NORE HURS/PER DAY 36 64 S8 42 100 426
SOURCE OF LIGHTING
ElECTRICITy 24 76 43 s5 100 S08
KOSENEIL SO 50 68 32 100 332
CANDLES 32 69 61 39 100 423
tHER 0 100 100 0 100 349
SEWERAGE SERVICE
PUHLIC SERVICE 14 86 29 71 100 606
WELL-SEPTIC 20 80 30 70 100 637
LATRINE 54 6 67 33 100 346
NOME 37 64 63 37 100 370
COOMING FUEL
ELECtRtCITY 0 100 29 71 100 2016
GaS 0 100 1 83 100 764
KEROSENE 17 83 33 67 100 470
COAL 36 64 100 0 100 252
WOOD 40 60 60 40 100 393
OTHER 73 27 89 11 100 217
DO IT Col 0 100 100 0 100 282
I/ At first weuk october Lifs prices 199S.
2/ Nouhold explnitum divided by heubold size.
90

TABLe -19. OCCUPATION OF HOUHD HAD BY PERTY LEVEL (PERCENTAGE)
EXTRELYPOOR OTERS POOR OTERS TOTAL
ALL AREAS:PUBLIC 8 15 11 16 14
PRIVATE 20 22 22 22 22
PRIVATE tME 1 0 1 0 1
SELF PEMPLOD 49 3o 44 3 40
UPAID FAMILY TRE 9 5 7 5 6
OTHERS 1 0 0 0 0
UIEIWLOYENIT 4 2 3 2 3
MUIACTIVE 6 17 12 18 IS
LIMAPUBLIC 10 14 10 1S 13
PRIVATE 27 29 31 28 29
PRIVATE HWE 7 1 2 0 1
SELF EMPLOYED 37 33 35 33 34
UNPAIO FANILYVOK 2 1 1 1 1
OTHERS 3 0 1 0 0
UNEMPLOYMENT 3 3 4 2 3
MH ACTIVE 11 20 15 21 19
uSD1 coASTPUBLIC 10 12 10 13 11
PRIVATE 31 23 22 26 24
PRIVATEHIE 0 0 1 0 0
SELF EMPLOYED 40 40 46 34 40
UNPAID FAMILY OKE 0 2 1 2 2
OTHERS 0 0 0 0 0
UNEMPLOYMENT 8 2 4 2 3
1101 ACTIVE 12 21 17 23 20
lIA SIERPUBLIC 13 26 23 25 24
PRIVATE 22 17 20 16 18
PRIVATE VWE 1 0 1 0 0
SELF ENPLOTED 47 38 42 37 39
UNPAID FANILY VWXER 2 2 2 2 2
OTHERS 0 0 0 0 0
UNEMPLOMNENT 6 1 3 1 2
NON ACTIVE 9 i7 10 19 15
SIERRA RURPUBLIC 5 10 6 11 8
PRIVATE 14 9 13 9 11
SELF EPLOYED ST S2 5S 53 54
MIPAID FANILYUE 17 23 20 22 21
OTHERS 0 0 0 0 0
UNEMPLOYMENT 3 2 3 2 2
MON ACTIVE S 4 5 4 5
URWAPUBLIC 11 16 13 17 16
PRIVATE 27 25 26 24 25
PRIVATE NHOE 3 1 2 0 1
SELF EMPLOYED 41 36 39 34 36
UMIPAID FAMILY WR(lR 1 2 2 2 2
OTHERS 1 0 0 0 0
UNEPLOYENT 5 2 4 2 3
MON ACTIVE 11 19 14 21 18100 100 100 100 100
91

TABLE *-21. CoEAG OF VACCINATION 14 CHILDREN AMES 0-12 YEARS: ALL ARM(PCNTWAUE)
All gm *ne Total
ulE 17 22 1 loSfRLXE 78 20 1 100
0-2 TMS 52 45 3 1003-5 tEAS T8 22 0 1006-S EARS as 13 1 1008-12 YEAS 90 10 0 100
BY POVERTY LEVELSEXTREMELY POP 73 25 1 100OTHERS 79 19 1 100CRITICALLY POOR 75 23 1 100aTHERS 81 18 1 100
BY JINTILESI (POEST) 72 26 1 100II 77 21 1 100III 79 20 1 100IV 80 17 1 - 100v (ULTHIEST) 88 11 0 100
/ Vaccination ae am, Po.11, Tripte aN Meles
92
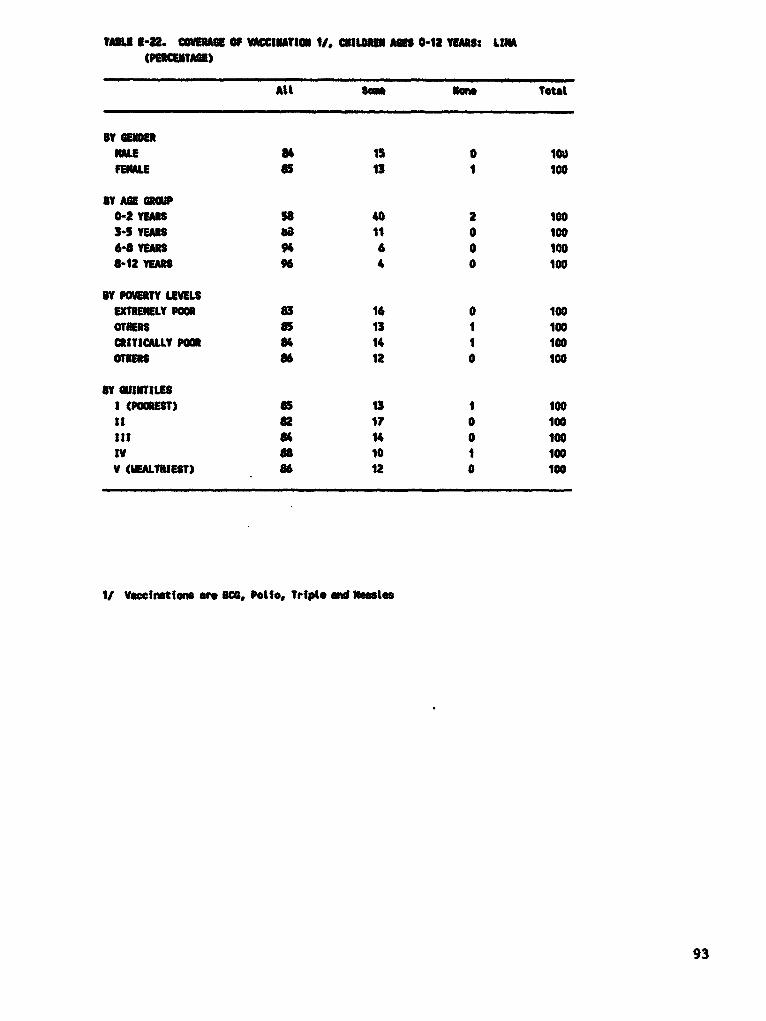
TAI I-2U. CWhRAI OF CIUATIU Ul CNiLOU AM 0-12 VIMO LINA(PERCHIAU)
All Seem Toul
By GlEDERALIE S 15 0 1W
FEMALE 05 13 1 100
Y AGE GRUP0-2 m s 0 2 100
3-Tam SO 11 0 100
6-S TES 94 6 0 140
S-1lTun 96 4 0 100
By POVE LILSEXTREMELY POOR as 16 0 100
OTHM SS 13 1 100
CRITICALLY PMOR 84 14 1 100
OTIERS S6 12 0 100
ST UINTILESI (POCEST) aS 13 1 100
it 82 1? 0 100III 85 14 0 100IV so 10 1 100
V (EALTIEST) 86 12 0 100
If VYcclntotns Ul ;, Pltoo, TrIple aN Nesest
93

TA3LE E-D. COVE"RA OF VACCINATION V. CHILOEN AGES, 0-12 WARs SIERRUL (PERCENTAGES)
All So= total
By erderNIb 66 32 2 100Fme 46 31 2 100
0-2 YES 37 5S S 1003-5 YEAS 69 30 1 1006-STmS 75 23 2 1008-12 EAR 78 21 1 100
BY POETY LEVELSEXTREMELY 63 33 2 100OTHERS 69 29 2 100
CRITICALL 65 32 3 100OTHERS 70 29 1 100
BY QUINTILES1 63 35 1 100!1 66 30 2 100III 67 29 5 100IV 6 33 1 100V 77 23 0 100
I/ Vaecnottions am BCG, Polio, triple ad N tesi
94

TABLE E-24. ILUIESS BY PWERTh LEVELt ALL AUM
(MECENTAGE)
EXTRIELYPOOR OTERS POOR OTHERS TOTAL
X PEOPLE RETINGILLNESS OR1t I Y 24 33 31 34 32
X PEOE ILLSEEKING MEDICAL CAE 34 54 4 56 50
DAYS ILL 9 9 9 9 9
DAYS ICTIVIE 2 2 2 2 2
Vote: Ibm dys I tt an day Inactive refer to pest 4 weeks
TAIILE -25. ILLNESS BY POETY LEL: LINA
(PERENTAOE)
EXTRMLY
PO OTHIERS POOR OTERS TOTAL
X PEOLE RETING
ILLNESS OR INJY 35 36 35 36 36
% PEOPLE IULSEEK IN MEDICAL CARE 44 sT 53 59 56
DAYS ILL 9 9 9 9 9
DAYS INACTIVE 2 2 2 2 2
note: Neon das ftt and d"s lnwtive reter to post 4 weeks
TABLE E-26. ILLNESS Y PMERTY LEVEL: SIERRA RURAL
(PERCENTAGE)
EXTREMELYPOOR OTHERS POOR OTHERS TOTAL
X PEOPLE REPORTINGILLNESS OR INIURY 26 36 29 3? 32
X PEOPLE ILLSEEKING NEDICAL CARE 24 41 27 46 34
DAYS ILL 9 8 9 a 9
DAYS INATIIE 2 3 3 2 3
note: Nen dap ilt tnd dys nactive refer to pest 4 weks 95

TABLE E3-2. SOURCE OF CARE 31 PATIENT POVERTY LEVEL ALL AREAS
ExtrmolyPoW others PoW others Total
Hosp1tal 30 3? 37 35 36Center 24 1 18 12 14
Heatth Post a 6 7 5 6
ComaMity Post 2 1 2 0 1
Ctinic 11 29 19 34 2?Pharmeacy 14 9 11 9 10
ome of Practitioner I I 1 1 1
Home of Patient 7 3 4 2 3Other 3 1 1 2 2
Total 100 100 100 100 100
IABLE E-28. SOURCE OF CARE n PATIENT POVERTY LEVEL: LIMA
Extretelypoor Other Poor Others Total
Hoepital 24 3S 39 35 3Center 42 13 20 11 15
Health Post 6 2 3 2 2
Caunmity Post 1 1 1 0 1
Clinfc 8 33 23 37 31Pharmacy 1S 10 11 9 10
Nome of Practitioner 0 1 1 1 1
Howe of Patfent 0 1 1 2 1
Other 4 1 2 2 2
Total 100 100 100 100 100
TABLE E-29. SOURCE OF CARM BY PATIENT POVERTY LEVELS: SIERR RURAL
Extremely Others Poor Others Total
Poor
Hospitat 2? 1S 19 23 21Center 17 19 19 18 18Helth Post 14 31 24 27 26Commfty Post 6 1 3 1 2Clinic 8 12 9 13 11Phiamcey 13 7 12 6 9How of Practitewr 4 2 4 2 3How of Patient 9 6 9 4 7Other 2 4 1 6 3
Total 100 100 100 100 100
96
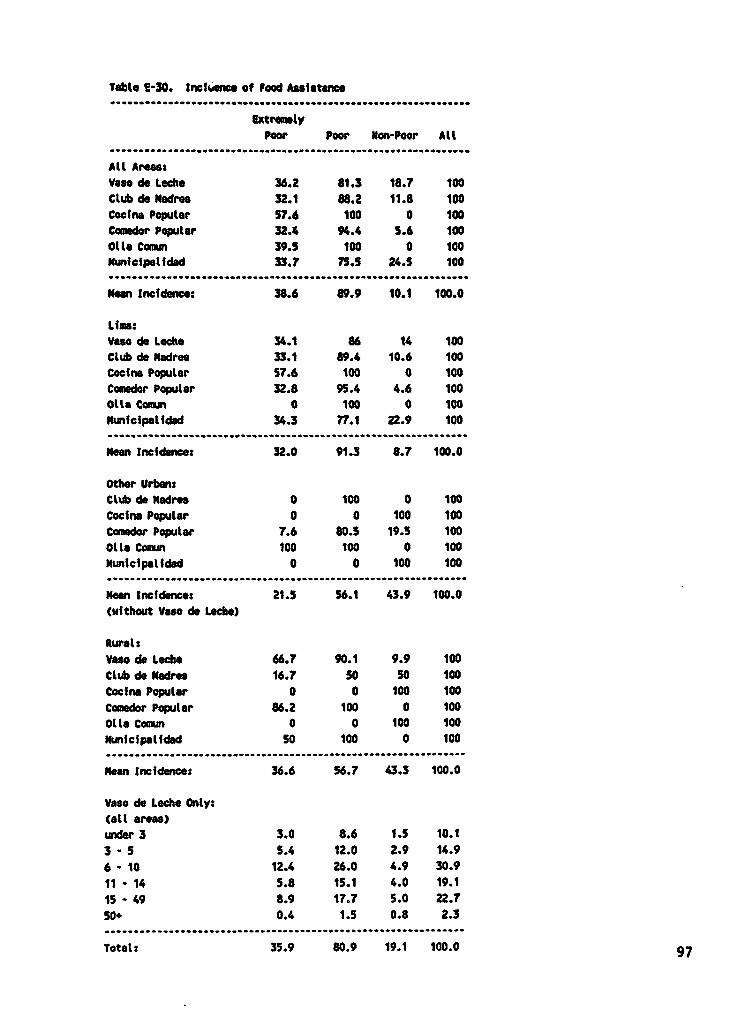
Table E-30. IncNence of Food Assistance...................... *.............................................
ExtromolyPoor Poor Non-Poor All
...............................................................
All Areas:Vasa de Loch. 36.2 81.3 18.7 100Club de Madres 32.1 88.2 11.8 100Coetna Popular 57.6 100 0 100Comeder Popuar 32.4 94.4 5.6 100Otlt Commn 39.5 100 0 100
Nw,ictpaltdad 33.7 75.s 24.5 100......................................................................................
Mean Incidence: 38.6 89.9 10.1 100.0
Lam:Vaso de Leche 34.1 86 14 100Club de Madres 33.1 89.4 10.6 100Cocina Popular 57.6 100 0 100Comedor Popular 32.8 95.4 4.6 100Ottoa oun 0 100 0 100Mknieipatidad 34.3 77.1 22.9 100.................................................. ................................................................ _
owan Ineidwnce: 32.0 91.3 8.7 100.0
Other Urban:
Ctub de adres 0 100 0 100Cocfna Popular 0 0 100 100Comedor Popular 7.6 80.5 19.5 100ollatoamun 100 100 0 100Municipalidad 0 0 100 100......................................................................................................... _
Mon Incidence: 21.5 56.1 43.9 100.0(without Vaso de Loche)
Rural:
Vaso do Leche 66.7 90.1 9.9 100Club de Madres 16.7 SO 50 100Cocina Popular 0 0 100 100
Cacedr Popular 86.2 100 0 100
Oltta Cm 0 0 100 100municipalIdad 50 100 0 100
...............................................................
Mean Inciddnce: 36.6 56.7 43.3 100.0
Vase do Leche Only:
(all areas)under 3 3.0 8.6 1.5 10.1
3 - 5 5.4 12.0 2.9 14.96 - 10 12.4 26.0 4.9 30.9
11 - 14 5.8 15.1 4.0 19.1
15 - 49 8.9 17.7 5.0 22.7
50+ 0.4 1.5 0.8 2.3...............................................................
Total: 35.9 80.9 19.1 100.0 97

TWLE E131. USE OF FOWO AISIPAS I POETY LEVEL
EXTREILYPOOR OTHE POOR OTHR ALL
ALL AREAS:VASO E LE 7 4 7 2 4CLUB DEOfSo 2 1 2 O 1COCINAPOPALt I 0 1 0 0COOEDPOPULAR 2 1 3 0 1O.LA COIN 0 0 0 0 0.MICIPAI.O 3 2 3 a 2
TOTAL 16 a 1S 4 10
LINAVASO DE LECNE 32 7 16 3 9CLUI 0E DRES 11 3 6 1 3COCIIAPOPULAR 4 0 2 0 1CONR POPULAR 10 2 6 0 3a" COI= 0 0 0 0 0IIMICIPALIDAD 17 4 8 2 5
TOTAL 74 16 37 7 22
OTNER U13M 1/;OE INADRES 0 0 0 0 0
COCIIAPOPULA 0 0 0 0 0CONEDORUPPUL 0 0 1 0 0
LA CI 0 0 0 0 0
NULICIPALIDAO 0 0 0 0 0TOTAL
RRL
VASO DE LECHE 3 1 3 1 2CLUI DE NADRES 0 0 0 0 0COCHA POPULA 0 0 0 0 0CONEDORPOPULAR 0 0 0 0 0OLLA COU 0 0 0 0 0
IUICIPALIDAD 0 0 0 0 0TOTAL 4 2 4 1 3
1/ Costs y Serra U#bom
98

a'0o
s X: 8 t w s J
i j n H } i~~~~~
9~~ 3}§';

I~ ~~~~~~~~~~~~~~~~~~~~~~~~~~~~~ -@j U fJ
U ! 11111-f _
mf gg -_--- 0ag~~hiIi I I"*w
3a E'0"X-oo-
, 3 |1';~~~~~~~~~~~~~~~~~~~~~~~~~~~~~~~~~~~0
i o~~~~~~~~~~~~~~~~~~~~~~~~~~~~~~~~~~~~~~~~~~~~~~~~~~~~~~~-

PERU
POVERTY AT AND SOCIAL POLICIESAND PROGRAS FOR TE POOR
STATISICAL APPENDIX

SmAN mAL
1. Education
1.1 Enrollment by Level1.2 Distribution of Enrollment by Level1.3 Annual Growth of Enrollment by Level1.4 Distribution of Enrollment by Level and Public Sector, 19891.5 Enrollment by Age and Level, 19891.6 Gross Enrollment Ratios by Education Level in Seletted South American Countries, 1960-
19901.7 Education Budget by Function and Region, 19911.8 Distribution of Education Budget by Function and Region, 19911.9 Education Budget by Line tem, 19911.10 Intnal Efficiency of Primary Education, 19881.11 Flow of a Hypotetical Student Cohort1.12 Indicators of Internal Efficiency and Reurces by Region1.13 Students Achievement in Grade 6 by Regions and Subject, 19811.14 Comparadve Education Indicators for Sdected Latin American Countries
HI. Healh
2.1 Reported Cases of Selected Communicable Diseases, 1985-19882.2 Evolution of Cholera Epidemic, 19912.3 Prevalence of Low Birth Weight, Hospital Maria Auxiliadora Lima, 1987-19902.4 Coverage of Immunization Progam for Cbfldren Under 1, 1985-19902.5 Health Establishmeit and Beds, 1985-19902.6 Distrbution of Hospitals and Beds by Provider, 19882.7 Availability of Selected Health Resources by Region, 19882.8 Human Resources in Health, 198S-19902.9 Human Resources in Health (per 10,000 Inhabitats), 1989-19902.10 Supply of Human Resources for Basic Health, 19902.11 Medical and Obstetrical Consultation Per Hour Worked, UDES, Lima, 1988-19902.12 Health Services in the South of Lima, 1988-1990
103

TABLE 1.1ENROLLMENT BY LEVEL
(IN THOUSANDS)
1960 1970 1980 1986 1900
PRIMARY 1500 2500 3200 3537 3968SECONDARY 198 550 1200 1421 1714HIGHER NON-UNIV 4 24 S6 89 223HIGHER Ut"IV 31 109 248 354 512TOTAL 1733 3183 4704 6410 6417
TABLE 1.2DISTRIMON OF ENROLLMENT BY LEVEL
1960 1970 1980 1985 1990PRIMARY 86.6% 78.5% 68.0% 65.4% 61.8%SECONDARY 11.4% 17.3% 25.5% 26.3% 26.7%HIGHER NON-UNIV 0.2% 0.8% 1.2% 1.8% 3.5%HIGHER UNIV 1.8% 3.4% 5.3% 6.5% 8.0%TOTAL 100.0% 100.0% 100.0% 100.0% 100.0%
TABLE 1.3ANNUA GROWTH RATE OF ENROLLMENT BY LEVEL
19070 1970-80 1980-90 1980-85 1985-90PRIMARY 5.2% 2.5% 2.2% 2.0% 2.3%SECONDARY 10.8% 8.1% 3.6% 3.4% 3.8%HIGHER NON-UNIV 19.6% 8.8% 14.8% 11.8% 17.9%HIGHER UNIV 13.4% 8.6% 7.5% 7.4% 7.7%TOTAL 6.3% 4.0% 3.2% 2.8% 3.5%
Sourc: MInfstty of Educaton, PAnnin Office
105

0
Tabb 1.4PERU: Drbutln of Enrolment by LOv and Publl Setor. 1989
TOTAL PUBLIC % PUBLIC
Lewd Formd Non-Formal Totd % Fonna Non-Fonmd Totd Fonmal Non-Forna TOtW
ProSchool 531.8 344.7 878.5 11.5% 415.5 337.4 7S2.9 78.1% 97.9% 85.9%
Prlma, 3874.6 37.7 3912.3 51.4% 3519.9 33.8 3S53.7 90.8% 89.7% 90.8%
Seconday 1872.4 20.9 1893.3 24.9% 1820.1 14.6 1634.7 86.5% 69.9% 86.3%
Speial Ed 21.6 0.0 21.6 0.3% 19.4 0.0 19.4 89.8% 0.0% 89.8%
Hight Ed. O.%
Teache Tnding 49.1 0.0 49.1 0.6% 44.S 0.0 44.5 90.6% 0.0% 90.6%
Technology 148.1 0.0 148.1 1.9% 81.6 0.0 81.6 55.1% 0.0% 55.1%
Vocaonad 206.4 18.9 225.3 3.0% 103.9 17.2 121.1 SO.3% 91.0% 53.8%
Arts 7.0 0.0 7.0 0.1% 7.0 0.0 7.0 100.0% 0.0% 100.0%
Unlvekty 475.5 0.0 475.5 6.2% 322.9 0.0 322.9 67.9% 0.0% 67.9%
TOTAL 7186.5 422.2 7608.7 100.0% 8134.8 403 6537.8 85.4% 95.S% 8S.9%
Soumee: MliOr of Edutn Ffw Office, OD tmt of Stabtti

Tabe 1.S: Enoniment by Ase and Level. 1989
Ages FORMAL NON FORMAL Higher EnromlPreSch PrimarV Secondary Specia Ed PeSch Pimary Secondary Educaton TOTAL Population Rate
1 3.3 0.0 0.0 0.0 4.8 0.0 0.0 0.0 8.2 623.5 1.3%2 4.5 0.0 0.0 0.1 8.1 0.0 0.0 0.0 12.7 616.2 2.1%3 87.5 0.0 0.0 0.2 97.5 0.0 0.0 0.0 185.2 609.9 30.4%4 183.1 0.0 0.0 0.4 112.6 0.0 0.0 0.0 296.1 603.6 49.1%5 241.6 28.9 0.0 0.8 117.9 0.0 0.0 0.0 389.2 600.6 64.8%6 11.6 517.8 0.0 1.0 3.8 1.6 0.0 0.0 535.9 593.4 90.3%7 0.2 529.2 0.0 1.2 0.0 1.3 0.0 0.0 531.9 585.9 90.8%8 0.0 527.4 0.0 1.4 0.0 1.4 0.0 0.0 530.2 578.2 91.7%9 0.0 525.4 0.0 1.7 0.0 1.6 0.0 0.0 528.6 570.5 92.7%
10 0.0 521.7 0.5 2.0 0.0 1.7 0.0 0.1 526.0 562.6 93.5%11 0.0 494.1 24.1 2.1 0.0 2.2 0.0 0.2 522.7 554.4 94.3%12 0.0 289.1 215.2 2.1 0.0 4.0 0.1 0.5 511.0 547.5 --93.3%13 0.0 186.6 290.1 1.9 0.0 5.6 0.2 1.2 485.7 542.5 89.5%14 0.0 132.7 322.8 1.6 0.0 7.0 0.4 3.4 467.9 538.9 86.8%15 0.0 63.9 361.6 1.3 0.0 11.4 1.2 8.3 447.7 534.9 83.7%16 0.0 37.5 338.8 1.1 0.0 11.5 1.7 22.0 412.6 530.7 77.7%17 0.0 13.7 152.8 0.8 0.0 11.7 1.8 44.8 225.5 526.6 42.8%18 0.0 5.3 86.1 0.5 0.0 13.4 2.5 79.9 187.7 522.5 35.9%19 0.0 1.8 42.8 0.3 0.0 11.2 3.0 99.6 158.8 518.1 30.7%
20 + 0.0 1.0 37.6 0.8 0.0 46.4 9.8 644.9 740.6 2499.8 29.6%TOTAL 531.8 3876 1872.4 21.6 344.7 132.0 20.9 905 7704.4 14877.0 51.8%
% 6.9% 50.3% 24.3% 0.3% 4.5% 1.7% 0.3% 11.7% 100.0%
Soure: Ministy of Education, Planning Office, Opt. of Statstics
0

Figure 1: Enrollment Rates by Age, 1989
0.9 Os ..
0.7 -
-0.6
~0.504-
~~~~~O4 ~ ~ ~ ~ Oe
03 .
0.2
0.1
0 1 3 s 7 9 11 13 15 17 19
2 4 6 8 10 12 14 16 18 20 +ABUs
108

60t I If' Ij''Fit
I 8 i88
I !I;J"Ii;hi I S S ;g;;;
_ _ _ _ if£ " a 8s s q * O '
Bbb4bX .b * . bppI@A$ 3 t
" Qg s" "8 uS a| XI.4 .4 .4. . 4bt
"l e ;. b . tx " > h x .4
= J p p @.. gr -r
.4..44.44. 34
.40 *tSt
aXXX@X$@ t8

Tale 1.7
Educatin lBudgt bY FFaon aWd R8sh9L 1691 Unli)
Region Sated" Maul Son TOl % nro
Gnu s59160 687960 444083 8691203 8.7% 459.1 9.2%
Anizonas 3190942 237330 177698 606270 4.7% 223.1 4.8%
Nor atd" ddNlManon 10536460 1006531 660729 12235715 16.1% 736.2 15.8%
Ucyll 1365911 83430 62573 1501914 2.0% 86.8 1.9%
Inca 65696053 557970 41847s 7572501 9.9% 441.5 9.5%
Sn Mardtn- La Llbeid 7058609 705528 461093 8223230 10.8% 512.0 11.0%
LesULbe,adoes- Wed 7348468 544320 408241 8301029 10.9% 512.3 11.0%
Andr" Aveli QCMe 7365327 828190 848144 9029661 11.9% 621.4 13.4%
Chovn 4840814 3s86o3 269123 5468767 7.2% 315.9 6.8%
Araup 4216448 45o540 231225 4931211 6.5% 287.2 6.2%
Jose Cados MWueteod 7768136 507060 380296 8646491 11.4% 460.6 9.7%
TOTAL 65722321 6966689 4419982 76108992 1000% 4s6.7 100.0%
Souwe.: MIEb*te cb lduecl. Abn de Ovew'So cb Sbetar Imadon, 1991
TOW. 1.0DOt*_um of Eduhata Budget by Funhton ed Reglon 1991
Sali MateWas Sendoe TOtal
Region 82.8% 10.4% 6.7% 100.0%
Gnu 88.5% 6.6% 4.8% 1000%
Anmaona 86.1% 8.2% 5.6% 100.0%
Nor Oiet del Mranon 90.3% 5.6% 4.2% 100.0%
aely 87.1% 7.4% 5.S% 100.0%
na 85.8% 8.6% 5.6% 100.0%
Sn Martin- La Ubertad 88.5% 0.6% 4.9% 100.0%
Los Lbobrtedoms - Wed 81.5% 9.2% 9.4% 100.0%
Andr AveinoCcere 88.5% 6.6% 4.9% 100.0%
Chown 85.6% 9.1% 5.3% 100.0%
Arequipa 8U.7% 5.6% 4.4% 100.0%
Muwum - Tao - Puno 86.4% 7.8% 6.8% 100.0%
TOTAL
Sowo.: Mbtatdr de Eduen.wL Pkn do Cbsw.nd del Sec*r Edwadan, 1991
Educscon, 191t
TaWb 1.9Educton Btuest by Lnc hem. 1991 Onduelm Pubic
Treasury % Tota %
150325806 52.5% 150325806 S2.2%
84066177 29.4% 84066177 29.2%
MOE Eudet (1) 517S8987 18.1% 61758987 18.0%
Tnsfwrs to ODescnt bInstt (3) 86259629 23.1% 66259629 23.0%
Talon to Unlverdee (31 84066177 29,4% 89586938 29.8%
Not Budget MOE (1-2)- (4) 517586897 18.1% 53276848 18.S%
Budge of Oecent Inst (5) 13596S641 47.5% 135965PA1 47.2%
Budget of Unwvesi"e (6) 286291447 100.0% 288184208 100.0%
Reional Govnmet m
Tota Educaton Budget (4+5+7)
Seoe: heJt r E _ n do Oeaa,ulo dot Setor leim_ 1991
110
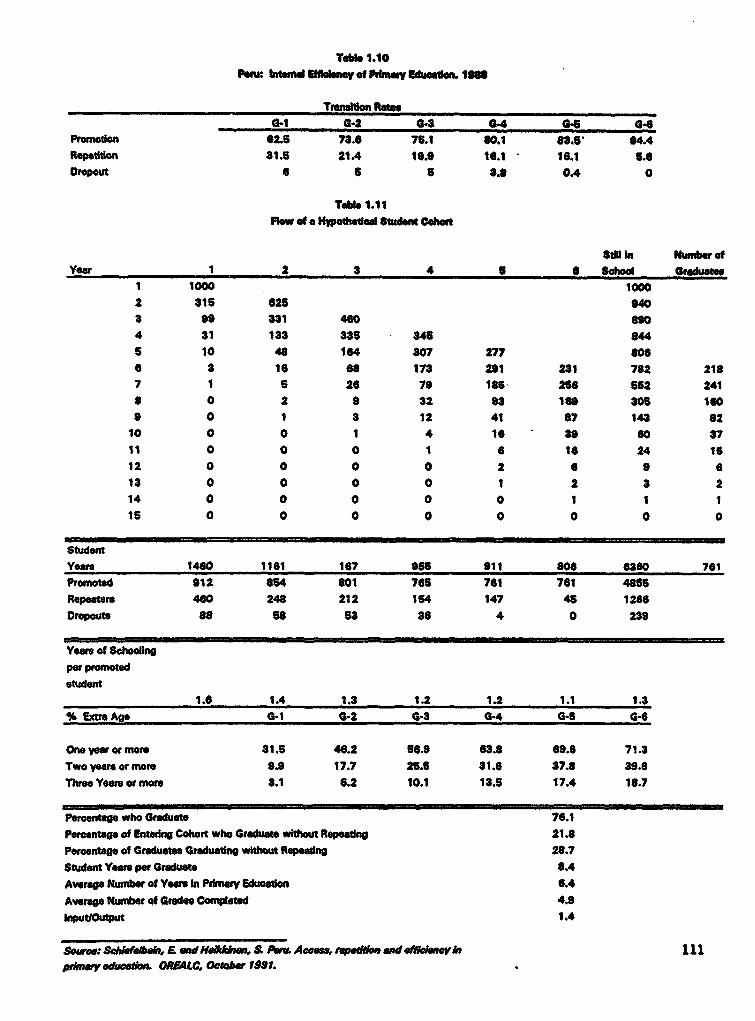
Tab 1.10
Pen: bhuea Wlee of ? emv Edure 188
Tranion Ratese1 69-2 0e3 , 4 0-5 -6
Promtoton 02.5 73.0 76.1 80.1 03.5' 04.4
Repetion 31.5 21.4 10.9 16.1 1*.1 5.6
rpout 6 a 5 3.8 0.4 0
Tabe 1.11Flow of* HWpodhee Studnt Cohet
Sti In Number of
Year 1 2 3 4 5 6 School Graduae
1 1000 1000
2 315 625 940
3 99 331 400 890
4 31 133 335 345 844
5 10 48 14 307 277 8066 3 16 es 173 251 231 782 218
7 1 6 26 79 18S- 290 562 241
8 0 2 9 32 03 109 30s 16O
e 0 1 3 12 41 87 143 82
10 0 0 1 4 16 39 6o 37
11 0 0 0 1 6 10 24 15
12 0 0 0 0 2 a 9 6
13 0 0 0 0 1 2 3 2
14 0 0 0 0 0 1 1 1
15 0 0 0 0 0 0 0 0
StudentYea. 14.0 116 167 955 911 800 6360 701
Promted 912 a54 801 765 761 761 4865
Rqepeate 460 248 212 154 147 45 1266
Dropouts 88 58 53 36 4 0 239
Years of Schoolingper pmoedstudent
1.6 1.4 1.3 1.2 1.2 1.1 1.3
% Extb A8e G-1 G-2 6-3 604 0.5 0-0
Oneyeror more 31.5 48.2 56.9 63.8 69.0 71.3
Two yeas o more 9.9 17.7 25.5 31.6 37.8 39.6
Three Yoem or m 3.1 6.2 10.1 13.5 17.4 18.7
Perentage who Graduat 76.1
Prntage of Enteig Cohort who Grduat without Repeaftg 21.8
Percentag of Grduste. Graduatng who Repadng 28.7
Student Yea per Graduate 8.4
Average Number of Years In Primary Education 6.4
Average Nuber f Gtrade. Completed 4.9
InputlOut 1.4
Sow..: Sd _efe/s E and Heah,S. & Pot& Ac.., rsWs arnd Wyhr In
pr&niy .d&wat1W. ORAALC, Octob 1991.

N
Table 1.12PERU: Indicators of Intemal Effciency and Resources by Region
Percentage % stdent Avwese Percentage % Schools withRepters ompleting # years to P tage Uncerffied no eletrkictPrmary Ed Grade 6 graduate literaes Teachors water, sewere
Depwbents 1988 (8188 8188) 1981 1988 1978
Ayacucho 27.8% 28.3% 15.2 45.1% 64.9% 77.1%Huancavelka 27.2% 30.3% 15.8 44.2% 71.3% 81.9%Caamarca 22.7% 33.9% 15.3 35.4% 58.6% 80.5%Huanuco 29.6% 34.1% 14.7 32.4% 61.5% 83.4%ApuTmac 33.3% 39.5% 13.9 52.3% 51.7% 78.9%Ucayll 27.6% 41.1% 12.2 11.4% 58.5% 85.7%Amazonas 26.8% 41.4% 13.8 26.8% 53.8% 81.8%Loreto 31.6% 41.5% 14.2 15.0% 70.8% 85.6%Cuzco 26.6% 44.4% 11.9 37.2% 48.9% 61.2%San Matin 30.8% 50.3% 11.5 16.4% 61.5% 82.2%Madre de Dios 26.6% 50.8% 10.6 10.7% 72.5% 83.5%Puno 22.2% 53.8% 10.8 32.7% 60.5% 61.5%CalIlo 9.3% 56.3% 9.5 2.9% 47.4% 5.0%Pium 17.6% 57.9% 9.8 22.0% 62.9% 75.6%Junin 18.4% 58.1% 9.6 18.6% 48.1% 54.4%Ancash 25.7% 61.2% 9.9 28.4% 52.9% 72.2%La Ubertad 16.8% 61.4% 9.4 17.7% 33.6% 61.0%Pasco 22.1% 66.9% 8.9 22.4% 75.6% 70.2%Lambayeque 16.2% 67.1% 8.3 13.4% 51.7% 68.4%Moquegua 12.4% 72.4% 8.4 12.4% 34.1% 51.7%Tacna 11.9% 73.6% 7.9 8.9% 28.8% 37.4%Arequipa 12.9% 78.4% 7.7 10.8% 29.4% 38.9%Ica 13.4% 78.4% 8.2 6.8% 16.2% 37.9%Tumbes 20.1% 80.2% 7.9 8.5% 51.0% 69.0%Uma 10.1% 84.5% 7.0 4.5% 46.6% 22.5%Tota Peru 20.0% 57.0% 10.3 18.1% 51.2% 64.3%
Sotace: ,Fwnar H. and Rosaes, J. EducacInww Mlr8do Head A dnro. Irno, IPP, 1990

Table 1.13PERU: Students Achievement In Grade 6 by Regons and Sublect 1981
N8tional Schools Areas ReoionsSubject Averae Public Prva Urban Rural Lma Costa Sierra 80hMathematics Avg 7 7 11 7 8 9 9 5 6
% Faling 76% 81% 64% 72% 85% 63% 73% 93% 93%Langage Avg 14 14 17 15 13 16 14 13 15
% Failing 15% 19% 3% 10% 27% 7% 14% 24% 20%Natural Sciences Avg 13 14 17 14 12 18 15 11 14
% Failing 23% 29% 7% 16% 38% 8% 22% 46% 26%Social Sciences Avg 12 12 13 12 10 12 12 11 14
% Faiing 38% 41% 31% 36% 4E% 34% 33% 51% 45%Average 12 12 14 12 10 13 13 10 12
Source: Mkintry of Education. Diagnostico del Rendimiento Academico de los Estudlantes de Sexto Grado de EM. Lim, 1981
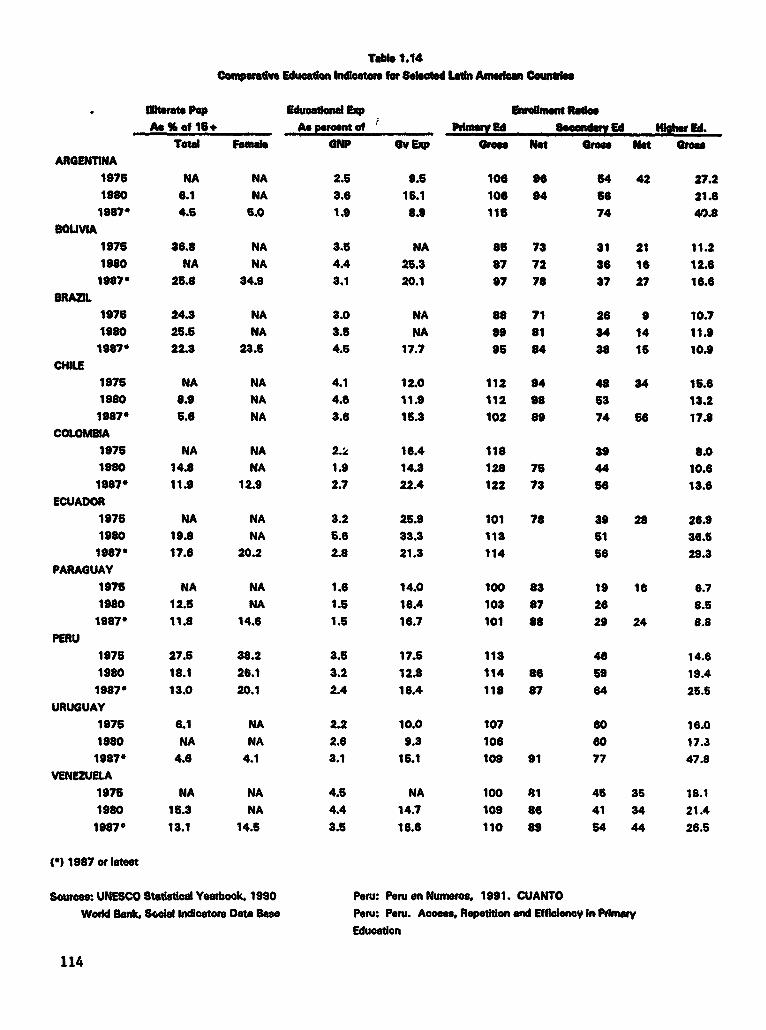
Table 1.14
CoMphavi Educatic dbatorms for Selected Latin Ameica Cmutdse
_mvate pop Edutol Exp olm t
AsS of 16+ As pwcet Pomfad I
Totd Female GNP O Exp or"s Nt Grow Nt Sea
ARGENTNA1975 NA NA 2.5 9.5 108 90 54 42 27.2
1980 6.1 NA 3.6 16.1 106 94 Se 21.6
1S87' 4.6 6.0 1.9 8.9 115 74 40.8
BOUVIA1975 M6.8 NA 3.5 NA 85 73 31 21 11.2
1980 NA NA 4.4 25.3 87 72 36 16 12.0
1987- 25.8 34.9 8.1 20.1 97 78 37 27 10.6
BRAZIL1976 24.3 NA 3.0 NA 88 71 26 9 10.7
1980 25.5 NA 3.5 NA 99 81 34 14 11.9
1987- 22.3 23.5 4.5 17.7 95 84 38 16 10.9
CHILE1975 NA NA 4.1 12.0 112 94 48 34 15.6
1980 8.9 NA 4.6 11.9 112 98 63 13.2
1987* 5.6 NA 3.6 15.3 102 89 74 56 17.8
COLOMBIA1975 NA NA 2.2 16.4 118 39 8.0
1980 14.8 NA 1.9 14.3 128 75 44 10.6
1987' 11.9 12.9 2.7 22.4 122 73 56 13.6
ECUADOR1975 NA NA 3.2 25.9 101 78 39 28 26.9
1980 19.8 NA 5.6 33.3 113 61 36.5
1987* 17.6 20.2 2.8 21.3 114 56 29.3
PARAGUAY1975 NA NA 1.6 14.0 100 83 19 16 6.7
1980 12.6 NA 1.5 16.4 103 87 26 8.5
1987* 11.8 14.6 1.5 16.7 101 88 29 24 8.8
PERU1975 27.6 38.2 3.5 17.6 113 46 14.6
1980 18.1 26.1 3.2 12.8 114 86 59 19.4
19870 13.0 20.1 2.4 16.4 118 87 64 25.5
URUGUAY1975 6.1 NA 2.2 10.0 107 60 16.0
1980 NA NA 2.6 9.3 106 60 17.3
1987' 4.6 4.1 3.1 15.1 109 91 77 47.8
VENEZUELA1975 NA NA 4.5 NA 100 81 45 35 18.1
1980 16.3 NA 4.4 14.7 109 86 41 34 21.4
19870 13.1 14.5 3.5 16.6 110 89 54 44 26.5
I*) 1987 or late
Soures: UNESCO Stetstil Yeaubook. 1990 Peau: Peru en Numme.s 1991. CUANTO
Wwod Bank. S"ol Indicators Date See Peru: Pem. Access, Repetion and EfficIency In 100nary
Educton
114

Table 2.1Reported Cases of Sdected Communicable Diseases
1985-1988(Thousands)
Ano Measles Tuborculosis Typhoid Malaria Hepatitis
1985 9.4 22.7 17.9 35 7.31986 6.1 24.7 17 36.9 7.31987 6.2 22.1 18.2 39.9 8.81988 5.8 28.7 20.6 35.2 6.91989 ^ 1 24.1 14.8 35.5 6.3
Sourw: MAs of meah, O0ke of 4WdmIkgv
A'ovA,odInformatin
Table 2.2Evolution of Cholera Epidemic
March - May 1991
Epidemhologkal Cases Hospitals DeahsWeek N N % N %
5 901 255 28.3 12 1.36 11581 2030 17.5 50 0.47 16751 3959 23.6 47 0.38 16077 4576 28.5 92 0.69 14988 4743 31.6 82 0.510 19175 7504 39.1 155 0.811 19325 8570 44.8 201 1
12 19533 9440 48.3 231 1.213 16571 7776 47 148 0.914 16967 7532 44.4 156 0.915 12953 5622 43.7 108 0.816 11849 5319 44.9 122 117 9014 3943 43.7 121 1.318 8116 3504 43.2 99 1.219 6951 3051 43.9 132 1.920 6513 2399 36.8 105 1.621 5128 1760 34.3 106 2.122 4354 1311 30.1 79 1.823 3957 1803 45.6 73 1.824 2024 844 41.7 33 1.6
25 480 189 39.4 9 1.9
SORce: cuwa0. Peun aSme, 1991.
* PrevblonbfenneUee
115

Table 2.3Prevalence of Low Birth Weight
Hospital Maria AuxdiadoraUma 1987-1990.
Y"r Total Number of <2500 9.Births Births %
1987 2741 312 11.41988 4611 563 12.21989 4226 674 15.91990 4088 616 15.1
w) h0 nunmb 1991
Table 2.4Coverage of Immunization Program
for Chiklren under 11985-1990
ANTI-
Year Polio DPT BCG SARAMPION
1985 33.3 33.8 32.4 34.6
1986 50.3 49.8 53.6 40.7
1987 44.7 42.6 61.3 35.21988 60.8 60.9 70.0 52.01989 58.8 58.3 61.8 52.1
1990 ' 60.0 59.0 71.0 53.0
1: M6
116

Table 2.5Health Establishmnts and Beds
1985-1990
Health HealthYear Hospitals Beds Centers Posts1985 349 30032 859 19311986 353 30413 920 26001987 354 30629 963 28511988 368 35715 1017 31411989 368 35715 1019 31621990 368 35715 1019 3173
Sowe.: MAs of HWh
Table 2LoDistrbution of Hospitals and Beds by Provider
1988
Hosptals BedsInstituton n %n Public Sector 193 50 26070 80
Mln. of Health 129 33 16867 52Social Securt 36 9 5661 17Armed Fofces Pol. 15 4 2856 9PublicSoc. Bee. 3 1 200 1
tP Ste 10 3 486 1
Prvate SecW 193 50 6447 20
Private CUnics 135 35 4502 14Private Companis 41 11 914 3Cooperatives 11 3 533 2Chaitable Inst. 5 1 483 1
TOTAL 386 100 32517 100
SON".: MktY ofHKamm
117

TabW 2.7Aviabily of Seletd Health Resource by Regon 1988
Per 1000 InhabIantsRegon Beds Estblishments Doctors NursesAmazonas 12 3.7 2.6 3.4Ceceres 12.2 3.2 2.5 5.5Arquipa 21.1 2.7 12.5 19.3Chavin 8.8 2.5 2.5 1.4Grau 8.8 1.7 2.6 2.2Inca 7.5 2.4 1.5 4.4Warl 11.9 3.3 4.1 3.1Marategul 10.2 2.7 2.4 4.7Maranon 7.1 2.1 0.4 4S M-la Ubertad 11.8 3.2 7.9 5.6Ucayal 9.8 5 1.9 0.5Uma 24.8 1.1 23.8 13.1callao 29.2 1.2 - 9.6
TOTAL 15.3 2.2 9.5 7.4
hwJds hosp4tas end heah contos. d postSaWee: Mfib*y - Helh
Tabl 2.8Human Resource I Heat 1985-1990
Year Doctors Nurses Obstetrician Pharmacist1985 18103 13951 3114 45411986 19635 14709 2868 53501987 20031 15429 3137 55671988 20979 16140 3338 58751989 21856 15796 3437 61131990 * 22900 17600 3900 6400
* Auvisl.nbthEwteSo woe: Mh*try of f. WU, Gwwl Ofeo of StiSw
118
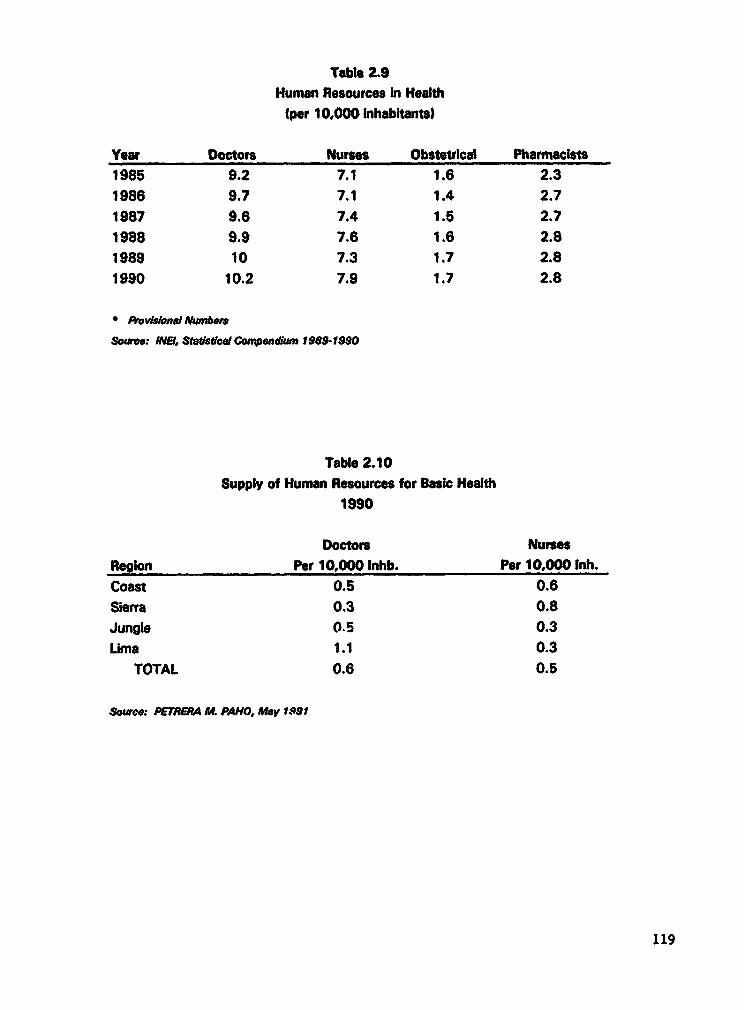
Table 2.9Human Resources In Health
Iper 10.000 lnhabltants)
Year Doctors Nurses Obstetrical Pharmacists1985 9.2 7.1 1.6 2.3
1986 9.7 7.1 1.4 2.71987 9.6 7.4 1.5 2.7
1988 9.9 7.6 1.6 2.81989 10 7.3 1.7 2.81990 10.2 7.9 1.7 2.8
* fotvalone Numb.,s
Sowo: MtE1 Ststlc Copendiwn 1989-1980
Table 2.10Supply of Human Resources for Basic Health
1990
Doctors NursesRegion Per 10,000 Inhb. Per 10,000 Inh.
Coast 0.5 0.6sierra 0.3 0.8
Jungle 0.5 0.3Lima 1.1 0.3
TOTAL 0.6 0.5
Souwce: PETRMeA M. PAHO, May 1991
119

Table 2.11: Medical and Obstetrical Consultatfon per Hour WorkedUDES, Uma 1988-1990
Year Medical ConsultantionlHour Obstetrical Consultation/Hour1988 2.66 2.011989 2.23 2.071990 2.36 2.03
Average 2.44 2.04
120
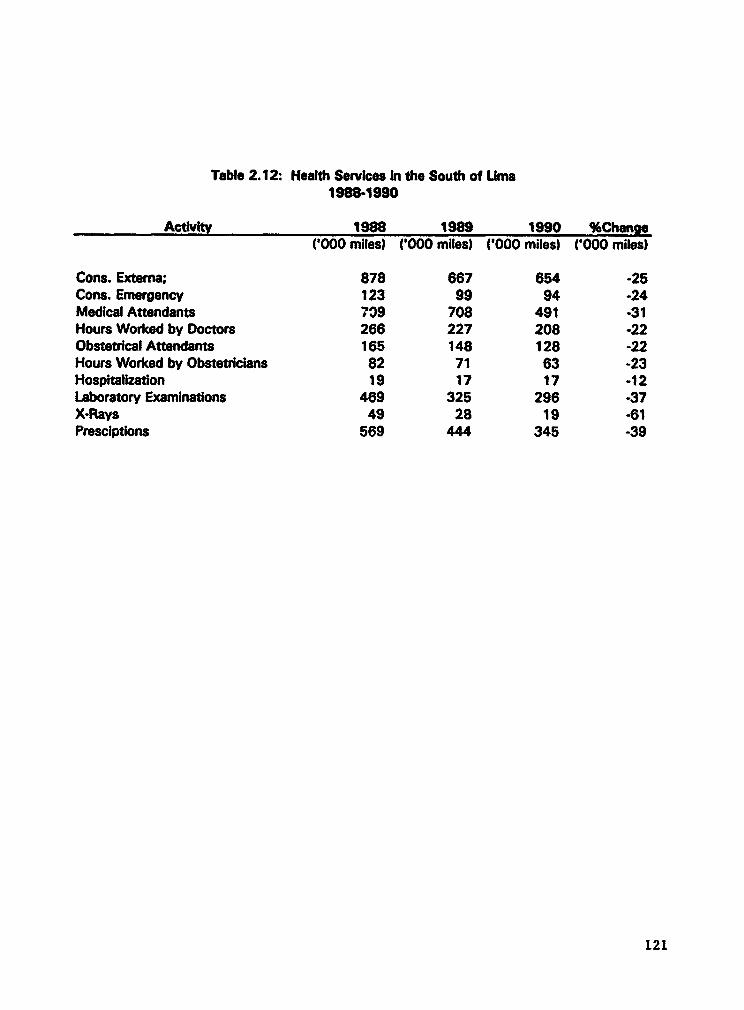
Table 2.12: Health Services In the South of Lima1988-1990
ActivIy 1988 1989 1990 %Chango('000 miles) ('000 miles) ('000 miles) ('000 miles)
Cons. Extema; 878 667 654 -25Cons. Emergency 123 99 94 -24Medical Attendants 709 708 491 -31Hours Worked by Doctors 266 227 208 -22Obstetrical Attendants 165 148 128 -22Hours Worked by Obstetricians 82 71 63 -23Hospitalizaton 19 17 17 -12Laboratory Examinations 469 325 296 -37X-Rays 49 28 19 -61Presciptions 569 444 345 -39
121