Perspectives of creators and performers on the digital era
71
Perspectives of creators and performers on the digital era Abstract In this contribution, a nearly comprehensive survey among creators and performers in media, arts and entertainment in the Netherlands is presented. It concerns the implications of digital reproduction and distribution for the creative professions as perceived by those working in it. Based on regressions and cluster analysis of the survey data, an analysis is provided of income developments and perceived threats and opportunities of digitisation, as well as an exploration of the underlying socio-economic and professional factors. Many creators and performers perceive digitisation primarily as a threat. Although age is a relevant explanatory factor for the opinions regarding digitisation, the notion of a generation gap is shown to be an oversimplification. Other relevant dimensions include
-
Upload
hogeschool-rotterdam -
Category
Documents
-
view
1 -
download
0
Transcript of Perspectives of creators and performers on the digital era

Perspectives of creators and performers on the digital era
Abstract
In this contribution, a nearly comprehensive survey among
creators and performers in media, arts and entertainment in
the Netherlands is presented. It concerns the implications
of digital reproduction and distribution for the creative
professions as perceived by those working in it. Based on
regressions and cluster analysis of the survey data, an
analysis is provided of income developments and perceived
threats and opportunities of digitisation, as well as an
exploration of the underlying socio-economic and
professional factors. Many creators and performers perceive
digitisation primarily as a threat. Although age is a
relevant explanatory factor for the opinions regarding
digitisation, the notion of a generation gap is shown to be
an oversimplification. Other relevant dimensions include

income development, education level, and the way
digitisation has affected respondents’ discipline.
Keywords
Survey, Creators, Performers, Digitisation, Copyright,
Cluster analysis
1 Introduction
On 22 April 2010, YouTube removed several parodies of the
famous bunker scene in the film Der Untergang after the
producer, Constantin Films, filed a complaint about
copyright infringement. However, the director, Oliver
Hirschbiegel, responded that these parodies were a
compliment for him and had actually amused him. Along with
other anecdotic evidence, such as the experiment of the
band Radiohead who posted their album In Rainbows on their
website for a voluntary payment, and Lady Gaga stating that
she has no problem with people downloading her music, this

news item suggests that creators and performers are more
lenient towards copyright issues in the digital era than
most producers and publishers. In contrast, Madonna and
Scorpions guitarist Rudolf Schenker have been very critical
about file sharing, which suggest that not all popular
artists take a lenient position towards copyright
infringement. Could this be a generational issue or are
there other factors at play here?
Digitisation, a term used in this article as shorthand for
digital production, reproduction and the distribution of
works through free or paid download or streaming services,
websites and social media, contains both threats and
opportunities for creators and performing artists. On the
one hand, it enables them to reach their audience or
clients without intermediation. They can bypass traditional
media companies and create ‘buzz’ through social networks
which can be capitalised in live performances or

assignments. On the other hand, digitisation implies a loss
of control over the distribution of and payment for their
work as a consequence of unauthorised file sharing
(commonly referred to as ‘piracy’). Despite the many
commentaries on the changes in the cultural and media
landscape caused by digitisation, a systematic analysis of
the perspectives of creators and performers on these
matters is lacking.
This article is aimed at filling this gap. The positions of
creators and performers on copyright in the digital
environment and their perception of the implications of
digitisation for their profession are investigated. A broad
scope is chosen for the study, investigating individuals
working in the nucleus of the creative process in those
domains and sectors in which copyright is a crucial part of
the business model, both for creators and performers, and
for institutions and corporations active in the

exploitation of those rights. These corporate players
remain unaddressed in this study, since the implications of
digitisation for them have been addressed frequently. What
the creators and performers focussed on in this study have
in common is their role as an initial source of creative
input, but they are expected to differ in their perceptions
of the consequences of digitisation. The specific
development phase of the creative sector they work in, the
nature of the works in their professions (for instance the
written word, music or audio-visual) as well as the
mediation of their creative output to their main audiences
(directly face-to-face or through electronic media) are
expected to lead to different perceptions and opinions.
Therefore, a wide range of creators and performers is
addressed, from photographers to journalists and from
translators to video artists.
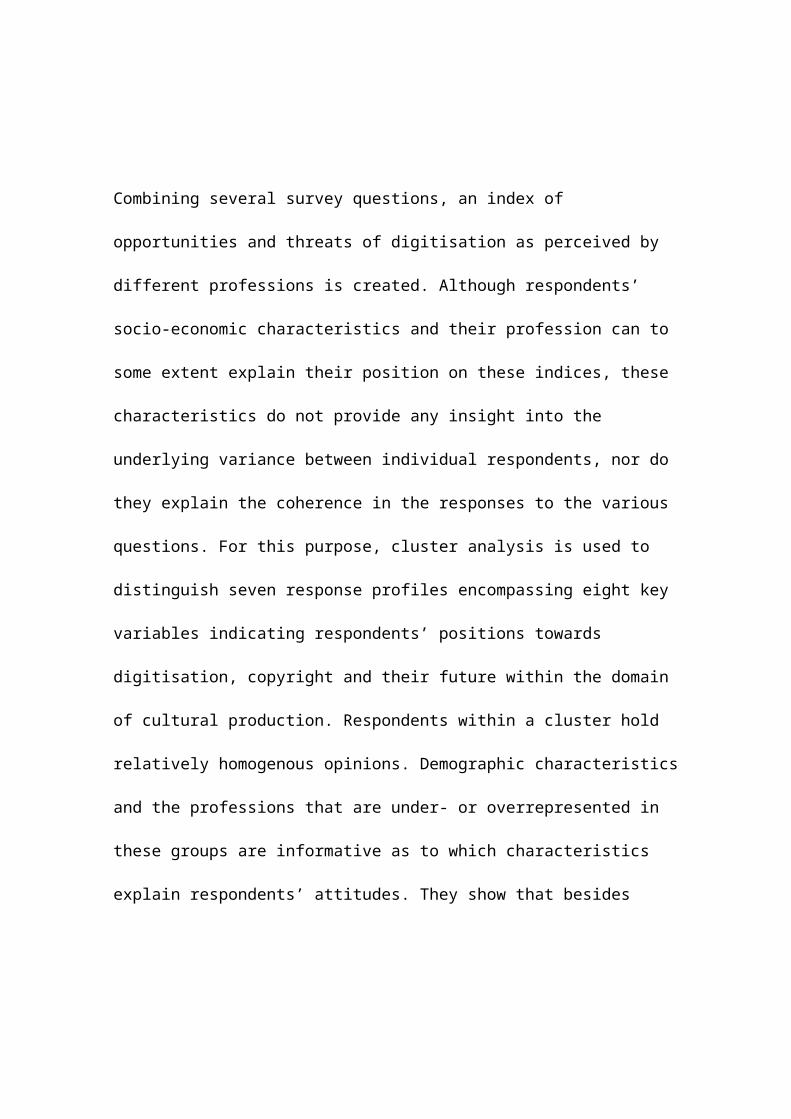
Combining several survey questions, an index of
opportunities and threats of digitisation as perceived by
different professions is created. Although respondents’
socio-economic characteristics and their profession can to
some extent explain their position on these indices, these
characteristics do not provide any insight into the
underlying variance between individual respondents, nor do
they explain the coherence in the responses to the various
questions. For this purpose, cluster analysis is used to
distinguish seven response profiles encompassing eight key
variables indicating respondents’ positions towards
digitisation, copyright and their future within the domain
of cultural production. Respondents within a cluster hold
relatively homogenous opinions. Demographic characteristics
and the professions that are under- or overrepresented in
these groups are informative as to which characteristics
explain respondents’ attitudes. They show that besides

generation the way creators perceive their role and
position in the digital age is influenced by education,
income development and creative discipline.
2 Background
Digitisation brings new opportunities and challenges for
creators and performers, centred around disintermediation,
new players, and unauthorised distribution and re-use.
Disintermediation involves the disruption of the
traditional vertical set‐up in which media institutions
were in charge of producing and distributing content, and
changing it into a more horizontal paradigm allowing
creators and performers to operate independently. Many now
reach their audience directly through social media. They
can communicate with their clients over the Internet and
sell their work without intermediaries, making them less
dependent and providing them with a stronger bargaining

position towards producers and publishers. On the other
hand, professional creators and performers face competition
from debutants and amateurs who use social media and online
distribution to bypass the traditional selection mechanisms
and quality filters.
Simultaneously, companies that are new to the media
industries manifest themselves as information providers and
publishers: Apple and Google have developed into media
institutions, providing access to information and cultural
products.
Digitisation also spurred the unauthorised distribution of
creative works: never before has it been so easy for
creators and performers to reach an almost worldwide
audience, yet never before has it been so easy for their
audience to obtain content without paying for it. Within
certain creative disciplines, free digital distribution of
content may be part of a business model in which it serves

as promotion for live performances. In other disciplines,
however, no such alternative sources of income exist.
The balance of these opportunities and threats and the
future structure of the entertainment industry has so far
remained undecided. Notably, the effect of file sharing on
sales is a much debated issue in the academic literature
(see Smith and Telang (2012) for a literature review). A
majority of authors find a negative effect of file sharing
on sales, but others find little or no effect and
occasionally even a positive effect. Moreover, even with
negative effects on sales, short-term welfare effects are
likely to be positive, while the dynamic effects on
creative production need not be negative either (AUTHORS,
2010). A study on the evolution of the quality of recorded
music over time indicated it has increased rather than
decreased since the launch of Napster in 1999 (Waldfogel,

2011). Underlying the debate to what extent performers and
creators experience harm from file sharing, is a more
ideological debate as to whether copyright enforcement
should be stricter or more lenient in the face of massive
unauthorised file sharing.
In comparison to the rather extensive literature on the
effects of file sharing on media sales, studies on the
perspectives of creators and performers on the impact of
digitisation are scarce. Most of the research on artists’
labour markets originates from the time before digital
reproduction and distribution were widely adopted (see
Towse (2001) for an extensive discussion). Madden (2004)
performed a survey amongst self-declared artists and
musicians. It turned out that both groups were using the
Internet more than the general public was. In particular
musicians used the Internet to reach their audience and as
a source of inspiration. Musicians with lower income stated

more often that the Internet increases their opportunities
to reach their audience. At the time of Madden’s survey,
most artists were still hardly affected by digital
developments, yet they were largely in favour of using
technologies for copyright protection (DRM). Especially
successful musicians were concerned that file sharing would
harm them. Of the surveyed musicians, 83% provided free
samples of their work online. Nevertheless, two thirds of
both artists in general and musicians agreed that copyright
holders should have complete control over the use of their
work.
Kretschmer and Hardwick (2007) surveyed professional
writers in the United Kingdom and Germany about their
income. They found that in both countries authors’ incomes
have decreased since 2000. Authors earn considerably less
than typical wages in other professions, a conclusion also
found in earlier work on artists’ earnings (Towse, 2001;

Chapter 3). Authors in the UK earned 64% of the net median
wage, while German authors earned only 42%. This is in line
with Frey’s (1997, 1999) assertion that the supply in
artist labour markets depends on both intrinsic and
extrinsic motivations and rewards. As Caves (2000: 4) put
it: “...on average [they] earn lower pecuniary incomes than
their general ability, skill and education would otherwise
warrant.”
Equally typical for artists’ labour markets is the skewed
income distribution, which implies that average income
statistics are of relatively little value to understand the
artists’ economic position: the winner takes all. This is,
however, mitigated by incomes outside creative professions.
Only one out of five writers earned their total income as a
writer. As Kretschmer and Hardwick (2007) coined it, most
authors lead ‘portfolio lives’.

Kretschmer et al. (2011) conducted a similar study among
visual creators in the United Kingdom in 2010 and found a
comparable pattern of lower wages, portfolio lives and a
more skewed distribution than in other sectors. The peak of
income was found to be in the age bracket of 35-44, which
is in line with other studies on artists’ income
development with age (Towse, 2001; Chapter 3) but in
contrast to the typical labour market pattern that income
peaks close to the retirement age.
Apart from income, Kretschmer et al. (2011) surveyed
respondents on terms of contracts and bargaining power. The
results are mixed: photographers generally feel that their
bargaining power has decreased, while visual artists and
designers see improvement. Illustrators occupy a middle
position. A speculative explanation for these differences
is that through the general availability of good-quality
digital cameras and editing software, professional

photographers face more competition from amateurs than
other visual artists do.
3 Method
3.1 Survey design
In this study, an online questionnaire was used among
creators and performing artists in the Netherlands. It
includes 54closed questions/statements and was conducted in
October-November 2010. Statements were presented using 5-
point Likert scales, ranging from ‘strongly agree’ to
‘strongly disagree’, plus a sixth scale item for ‘don’t
know’ (Pelsmacker and Kenhove, 2006).
Apart from questions about the socio-economic and
professional background of respondents, the main themes in
the questionnaire were:
Digital developments and preferences concerning
online exploitation;
Contracts and bargaining position vis-à-vis
producers and publishers;
File sharing, remixing, copyright enforcement and
digital rights management (DRM);
The role and performance of collecting societies
(also known as copyright collectives).
3.2 Targeting individual rights holders
Five major collecting societies and seven professional
associations invited their members to participate by
sending them an e-mail with some background information
about the survey, a hyperlink and a unique username and
password to log in to the survey.1 As nearly all of these
organisations chose to handle the e-mailing themselves for
privacy reasons, it was impossible to merge mailing lists 1 Two professional associations chose to propagate the survey by means of a
press release or newsletter. Their members had to apply for a username and
password themselves. This option was also offered to non-affiliated creators
and performers. In order to reach them, announcements were posted on blogs,
including a hyperlink to a website where they could apply for participation.

and delete double entries (i.e. people included in more
than one mailing list). To be able to estimate the actual
number of creators and performers addressed, respondents
were asked how many invitations they had received.
A total of 32,000 members of collecting societies and
professional associations were invited to partake in the
survey.2 Respondents reported having received 1.4 e-mails
about the survey on average. Correcting for this overlap,
an estimated maximum of 23,500 individuals was invited.3
3.3 Response characteristics
A total of 6,054 people responded to the invitation: a
gross response rate of 25.8%. Several filters were applied
to convert this response into a valid sample. First of all,
people who are not or no longer active as a creator or
2 Including the self-applicants discussed in footnote 1.3 This is likely to be an overestimation, since the number of e-mail bounces is
unknown for four sending organizations. Moreover, some respondents may have
received an additional invitation after they responded.

performer (e.g. retired performers and creators, or
successors) and people who spend less than 12 hours a week
on creative activities and have no intention of increasing
this, were excluded from the sample. Furthermore, several
people quit after seeing the introduction screen, which is
most probably the result of receiving a second or third
invitation to the questionnaire. Checks were then performed
to ensure that the number of duplicate respondents (an
analysis of double IP addresses) and deliberately
inaccurate respondents (an analysis of case-wise data
variance) was minimised.
A net sample of 4,645 respondents resulted, of which 3,935
completed the survey. 710 people partly completed the
survey and 210 people were presented a short version of the
questionnaire as they neither now nor in the future expect
their creative work to be digitally distributed.
Considering that a respondent on average spent over 27

minutes filling out the questionnaire (excluding partly
completed surveys, short versions of the questionnaire and
extreme values), this response is very satisfactory.
Respondents were asked to tick their creative activities
within 19 occupations. In case they ticked more than one
activity, they were asked to indicate their primary
activity. The self-proclaimed primary activities of
creators and performers are listed in Table 1.4 Most
respondents are male (69%) and the mean age in the sample
is 49 years, with occupation means ranging from 44 to 56
years old. Most (80%) have been active in their discipline
for more than 10 years, and half for more than 20 years.
4 Only 15 occupational groups are listed in Table 1, as comedians (N=15),
choreographers (N=5), dancers (N=5) and game developers (N=4) have been added
to the group of ‘other disciplines’.

3.4 Representativeness
Too little is known about the demographic characteristics
of Dutch creators and performers to allow for an extensive
analysis of the representativeness of the response.
Statistics Netherlands (CBS) published a study on Dutch
artists (Jenje-Heijdel and Haar, 2007). An advantage of
this study is its large sample size and hence its
representativeness for the total Dutch artists population.
However, the aggregated manner in which statistics are
presented, entails that artist categories are
‘contaminated’ by the inclusion of occupations that were
not part of our study, such as urban planners and landscape
architects. Only two aggregated groups can serve as
benchmarks: (1) Dance, Theatre & Music, and (2) Visual
Arts, Language & Miscellaneous.
Compared with Jenje-Heijdel and Haar (2007), our sample has
an underrepresentation of age groups younger than 34 and by

consequence an overrepresentation of age groups older than
54. This age bias is reflected in other studies in which
the same mailing lists were used (IJdens et al., 2009; Fuhr
et al., 2010; Brouwer and Zijderveld, 2003). The difference
in age distribution also affects age-related
characteristics such as years of experience, household
position and income. The age bias can be explained by the
fact that the relevance of copyright and neighbouring
rights increases with age. As creators and performers build
up their oeuvre, a larger part of their income is derived
from royalty payments from collecting societies and
publishers. This also explains why a comparison with the
age distribution of the mailing lists used in this study
does not indicate a systematic age difference.
There may be a slight survival bias in our sample as
compared to the entire population of creators and
performing artists. However, it does not impair the valid

analysis of the various topics in this study. The number of
young respondents is sufficiently large (over 500
respondents are younger than 35). Moreover, possible age
effects are isolated by means of multivariate techniques.
3.5 Analysis
In the next section, the current and expected future
earnings of creators and performers are assessed. Next,
questions relating to the perceived opportunities and
threats of digitisation are combined into two indices, and
the factors influencing the position of respondents and
professional groups on these indices are analysed.
Subsequently, cluster analysis is used to shed some light
on the patterns of answers given by respondents. A cluster
is a homogenous group of respondents in terms of their
answers to survey questions. Profiles of respondents of
different clusters are, on the other hand, heterogeneous.

The result elucidates the diversity of opinions among
creators and performers, illustrating the social and
cultural differences between groups (or ‘clusters’) of
respondents, their different views on copyright,
neighbouring rights, collecting societies, and
digitisation. These clusters were obtained by means of two
related multivariate techniques: factor analysis and
cluster analysis.
Cluster analysis is a technique that identifies groups of
respondents with similar response patterns. Given the wide
array of questions, the number of questions on which
cluster analysis was performed (i.e. the cluster variables)
was first reduced by means of factor analysis – a technique
that identifies groups of correlated questions.
Factor analysis was applied through a total of 54 questions
seen by all 4,435 respondents who were presented the

complete questionnaire. In order to assign each survey
participant to a cluster, it was necessary to determine
factor scores for all respondents. Missing values were
therefore imputed an Expectation Maximisation (EM)
algorithm (SAS Institute Inc., 2004: 2536).5 The resulting
factor scores were then used as variables in the cluster
analysis, following a two-stage approach of hierarchical
and non-hierarchical techniques (Burns and Burns, 2008;
Norušis, 2010; Punj and Stewart, 1983). First, hierarchical
cluster analysis (Ward’s Method) was performed in order to
find an indication of the ‘optimal’ number of clusters in
the data. These were then tested using non-hierarchical (K-
means) cluster analysis with the centroids – the average
5 Since the factor analysis was performed on Likert data, which is prone to
contain a relatively large amount of error variance, Common Factor Analysis
(CFA) was preferred over Principal Components Analysis (PCA), as the former
does not distribute error variance among factors (Hair et al., 1998). We opted
for Principal Axis Factoring (PAF), since ordinal data rarely have a normal
distribution, and oblique rotation, as the resulting factors are expected to
be correlated (Fabrigar et al., 1999).

score of a cluster on a cluster variable – of the
hierarchical cluster analysis as initial cluster centres.
Prior to cluster analysis, cases were randomised and
disposed of outliers6 because K-means cluster analysis is
sensitive to case order and outliers (Norušis, 2010).
Initial factor analysis with all 54 Likert statements
produced a 12-factor solution, which was then judged on
validity and statistical qualities. Validity in this
context relates to interpretability of the factor: Do all
items in the factor make sense? Are item scores highly
correlated with occupation? Et cetera. The statistical
qualities of an item are its standard deviation,
communality, factor loading and measure of sampling
adequacy (MSA). Additionally, the Kaiser-Meyer-Olkin (KMO)
Measure and the Bartlett’s Test of Sphericity of each
6 Outliers are cluster variable scores of 1.5 interquartile range (IQR) below
the first quartile or 1.5 IQR above the third quartile.
factor solution were taken into account (Hair et al.,
1998).
After these various tests concerning validity and
statistical quality, 14 of the 54 Likert statements were
dropped as a result of a relative lack of variation between
respondents, and an 8-factor solution resulted. These eight
factors and the number of statements in each factor are
listed in the first column of Table 4.7
Regression factor scores were subsequently used for
clustering. As a rule of thumb clustering is stopped when
the coefficients in Ward’s Method for hierarchical cluster
analysis increase steeply, as this indicates that two
inconsistent groups are being merged and a heterogeneous
group results. In our analysis, Ward’s Method indicated
7 The factors’ Cronbach’s Alpha values, a metric expressing internal
consistency, are 0.6 or higher and therefore acceptable for explorative
measurement scales (Hair et al., 1998).

that there are at least four homogeneous groups of
respondents. This procedure was repeated using random
selections of 50% of the respondents, in order to test the
reliability of this outcome (Norušis, 2010: 375). These
split-sample analyses show primary inflection points
between five and seven clusters.
Hierarchical cluster analysis thus suggests solutions of
four to seven clusters. Next, non-hierarchical (K-means)
cluster analysis was performed and respondent assignments
in both approaches were compared. A small overlap indicates
that hierarchical cluster analysis may be overly
restrictive.8 There is significant switching between both
clustering techniques from four to six clusters. This
stabilises in the 7-cluster-solution, which is also the
most intuitive of all solutions and was therefore adopted.
8 In non-hierarchical cluster analysis, respondents can switch from the initial
cluster to which they were attributed using hierarchical cluster analysis, to
the cluster they actually have most in common with.
Almost all differences between factor scores are
significant at the 1% level, indicating that each cluster
has a distinct opinion profile.9 Demographic profiles, on
the other hand, are less clear-cut as clustering was based
on opinions and not on socio-economic variables.
Nevertheless, various demographic characteristics differ
significantly between clusters (see Section 4.3).
4 Results
The outcomes of the survey are presented in this section.
First, the income position of artists and performers is
discussed, as well as their perceptions about the effect of
digitisation on their earnings. Next, a 2-dimensional
‘opportunities-and-threats space’ is constructed, in which
several survey questions are combined. The effect of
respondents’ socio-economic characteristics and profession
on their position in this space is discussed. Subsequently,
9 Differences were tested using Tukey’s HSD, a One-Way ANOVA post hoc test.

cluster analysis is used to identify groups of artists and
performers with similar attitudes towards digitisation,
revealing heterogeneity within professions.
4.1 Income distribution and sources of income
In concordance with Kretschmer and Hardwick (2007) and
Kretschmer et al. (2011), many creators and performers are
found to lead ‘portfolio lives’: they supplement their
income outside their creative profession. Over the entire
sample, such earnings amounted to 17.4%. The most common
income bracket for creators and performers is €16,000 to
€32,000 in 2009 (Figure 1). This includes all sources of
income, both within and outside the creative discipline.
In addition to the income distribution of the sample, the
same is plotted for the entire Dutch working population in
Figure 1. The two are very similar, unlike the results of
earlier research on creative income distribution

(Kretschmer and Hardwick, 2007; Kretschmer et al., 2011;
Towse, 2001). This is probably a consequence of the
aforementioned earnings outside respondents’ creative
discipline.
The distribution over sources of income is shown in Figure
2. Designers and illustrators/cartoonists on average earn
around 90% of their income within their creative
discipline. Authors, composers/lyricists, illustrators,
translators and singer-songwriters rely most heavily on
royalties from their operators and payments from collecting
societies. Over the entire sample, these comprise less than
10% of the artists’ income.
Past income development and expected future income
development in relation to file sharing and digitisation
are displayed in Figure 3 and Figure 4. While there is a
striking correlation between respondents’ past income
development and their perception of the effect of file
sharing on their income (Figure 3), a majority is
optimistic about the future (Figure 4). Note that the
writing professions (translators, journalists, authors) are
least optimistic.
4.2 Opportunities and threats of digitisation
Past and future income development can be understood in
relation to (perceived) threats and opportunities that
digitisation entails, and vice versa. The survey contains
various questions that relate to these perceived threats
and opportunities of digitisation in general and file
sharing & remixing in particular. For a comprehensive
assessment of perceived threats and opportunities, relevant
survey questions were combined into two indices: one for
opportunities and one for threats, since creators and
performers may or may not experience both simultaneously.

The ‘opportunities index’ is the unweighted conditional
mean of eight statements, standardised to obtain deviations
from the sample mean.10 The ‘threats index’ is composed of
the four statements. The statements in both indices are
outlined in Table 2.In general, 73% of respondents see
digital distribution and exploitation as an opportunity
while only 28% see them as a threat. Respondents are also
fairly positive about the effect of digital distribution
and exploitation on earning opportunities and opportunities
to reach an audience. On the threats index, file sharing
and remixing are generally looked upon critically.
The average position of occupations on these combined
indices is plotted in Figure 5, with sphere size indicating
the share of each occupation in the total sample. This
expresses the average stance within each occupation towards
10 Missing values and the answer category ‘do not know/no opinion’ were
excluded for the indices.

digital developments, without controlling for respondent
characteristics. There is an obvious correlation between
both indices, as creators who see more opportunities are
likely to see fewer threats.
Translators turn out to be the most traditional of all
groups, perceiving high threat and low opportunity. Video
artists are their opposites. Taking into account their high
exposure to digitisation (in particular unauthorised file
sharing), performing musicians occupy a notable position in
this chart: low on threat and high on opportunity. The
other music-related professions, composers and singer-
songwriters, perceive comparable opportunities, but their
sense of threat is above average and therefore considerably
higher than that of performing musicians. The position of
photographers is also noteworthy: their perception of
opportunities is equal to that of authors, actors and
designers, but they feel much more threatened (almost as
much as translators).
A perception of threats and opportunities of an
occupational group is partially explained by the group’s
underlying demographics. For instance, a group that is
averagely young, may be more optimistic than an older
group. Also, an individual’s earnings may influence their
perception about threats and opportunities. To understand
the socio-economic drivers of respondents’ positions on the
threats and opportunities indices, four Ordinary Least
Squares (OLS) regressions were performed.
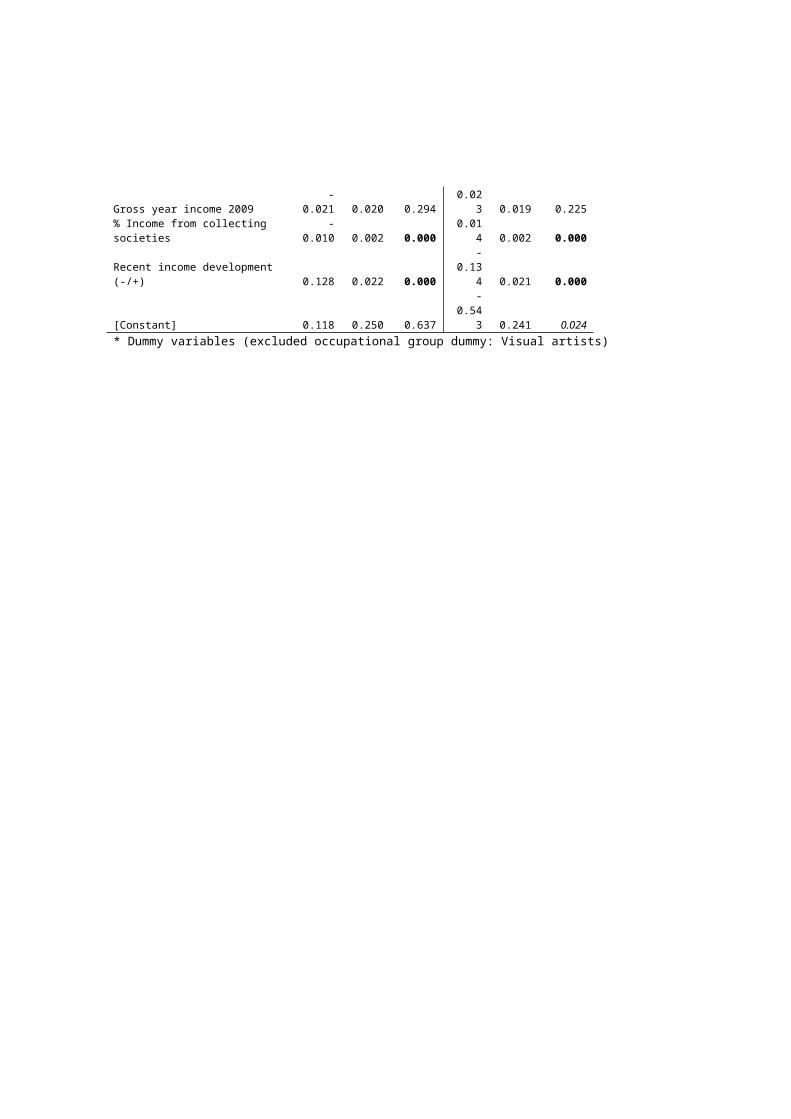
The regression models which explain the opportunity and
threat indices by demographic variables are presented in
:11 for each index, the top model includes occupation as an
11 A higher score on the opportunities index equates to a respondent perceiving
more opportunities; a higher score on the threats index corresponds to a
respondent perceiving more threats.

exogenous variable (i.e. the explanatory power of
demographics, corrected for occupation), and the bottom
model does not.
The OLS models including occupation dummies show that age
is an important ‘driver’ of anxiety about digital
developments (older respondents see more threats) but not
of perceived opportunities, and that female artists
perceive more threats. Income turns out not to be a
determinant of opportunity and threat perceptions but
rather the share of income derived from royalties from
collecting societies and the recent income development:
artists who depend more on copyright and neighbouring
rights for their income, see significantly fewer
opportunities and more threats. The same holds for those
who saw their creative income decline in recent years.
People working more hours in their creative discipline
sense more threats and fewer opportunities of digitisation.

Finally, a higher education level correlates with artists
feeling less threatened by digital developments.
The models without occupation dummies serve two purposes:
(1) as a robustness check of the explanatory power of
demographics (which shows that all correlations that are
significant at 99% or more remain so) (2) to assess the
stance of occupational groups vis-à-vis digitisation,
corrected for its underlying demographics. To do the
latter, the residuals of the OLS model without occupation
dummies ( Figure 6) are confronted with the original,
‘uncorrected’ two-dimensional graph (Figure 5). An arrow
connects the original position of each profession (the red
spheres) with its position corrected for underlying
demographics (the black diamonds). Notable shifts are those
of journalists – the only group that switches quadrants
(from threatened above average to threatened below average)
– and those of visual artists, translators, video artists
and the rest group ‘other activities’. The opinions of
these groups turn out to be highly ‘coloured’ by their
demographic composition.
4.3 Patterns and diversity: cluster analysis
In Figure 5 and Figure 6, the underlying heterogeneity of
opinions within each occupation is disregarded. Also, the
relationship between the various themes in the
questionnaire are not explored in the previous section,
other than the opportunities-and-threats indices. Although
occupation often has a significant impact on perceived
opportunities and threats (see the dummy coefficients in ),
there are other determinants. Cluster analysis was used to
create groups that are relatively homogeneous in their
answers yet differ significantly from the other groups.
As set out in Section 3.5, it is not possible to determine
the number of clusters solely on statistical grounds:
hierarchical cluster analysis suggests cluster solutions

between four and seven clusters. The optimal number has
been reached when an additional cluster would not be
sufficiently different from the other clusters. Based on an
analysis of the number of respondents changing clusters
when adding one, as well as the interpretability of the
factor scores within clusters, a 7-cluster solution is
adopted and presented in Table 4.
The names for the clusters have been chosen on the basis of
the opinion patterns within each cluster, with occasional
reference to age patterns that were found in some clusters.
In the top half of Table 4, the relative position of each
cluster on the factors is summarised, while the positions
on demographic and income variables are summarised in the
bottom half. The differences in opinions turn out to be
much more outstanding than the demographic differences.
This should not be surprising, as no demographic variables
were used in the clustering. Nonetheless, all demographic
differences referred to in the description of clusters
below are significant as defined in Table 4. The clusters
on the indices for opportunities and threats are plotted in
Figure 7 as was done for occupational groups in Figure 5
and Figure 6. Which groups of creators and performers are
overrepresented or underrepresented in each cluster is
shown in Table 5.
Generation 2.0
Generation 2.0 sees many opportunities in digital
developments, file sharing and remixing and hardly feels
threatened by these developments. Its members use social
media intensively. They are much more critical than other
groups about collecting societies; a relatively large
proportion of this group (20%) is not associated with a
collecting society.
Generation 2.0 members are predominantly male, relatively
young and work fewer hours as creators or performers than
the average respondent. They earn less and derive a
relatively large share of their income from activities
outside their creative profession. Nevertheless, their
income has increased over the past few years. Generation
2.0 members characteristically rely on performing fees for
their income rather than on royalties from collecting
societies.
The music industry – singer-songwriters, composers and
musicians – are overrepresented in this group. This is
remarkable, since the music industry was profoundly changed
by digitisation, dramatically affecting those working in
it.
Generation Analogue
Generation Analogue is the antipode of Generation 2.0 (see
also Figure 7). Its members see no opportunities but many
threats in digitisation and file sharing and do not approve
of remixing. They are more positive about collecting

societies than other groups and favour measures to improve
their bargaining position. Of all clusters, they make the
least use of social media.
Generation Analogue members are older than the average
respondent and work many hours. They derive a large share
of their income from royalties from collecting societies
and have experienced a negative income development over the
past few years.
Translators, cartoonists/illustrators and to a lesser
extent authors, journalists and photographers are
overrepresented in this group, while the music industry,
directors, writers and visual artists are underrepresented.
Non-Affected
A third cluster that stands out in Figure 7 is called the
Non-Affected: they score relatively low on both the
opportunities and the threats index. Digital developments
have little impact on these creators and performers. They

feel no need for empowerment and are critical about
collecting societies. They do not mind remixing of their
work. Visual artists, designers and directors12 make up a
relatively large part of this group, whereas authors,
singer-songwriters, composers and illustrators are
underrepresented.
In demographic and economic terms, this group is quite
average: their income, income development and working hours
do not differ from the sample mean. Their age is older than
average, however, and unlike most respondents, they would
like to work fewer hours. They derive a relatively small
share of their income from rights and royalties.
Claimers
Claimers in turn are in many ways the opposites of the Non-
Affected. This relatively small but distinct group sees
12 Stage directors (as opposed to movie directors) comprise over 80% of the
group of directors, which explains this group is overrepresented amongst the
Non-Affected.

many opportunities in digital developments but sees an
equally large threat in unauthorised file sharing. Claimers
see no opportunities in file sharing and disapprove of
remixing. They endorse stricter measures against file
sharing and measures to improve their bargaining position
vis-à-vis publishers and clients. Claimers are very
satisfied with their collecting societies.
They are often responsible for a substantial part of the
household income, but their earnings have decreased over
the past few years. On average they are older than all
other groups (80% of this group is older than 45 years),
work more hours and are less highly educated.
Within this group, illustrators, photographers and authors
are overrepresented. More than the average respondent, they
depend on copyright for their income, but their work can be
shared relatively easily over the Internet, with or without
their consent. This explains why the Internet is both an

opportunity and a threat to them. Musicians are
underrepresented amongst the Claimers. Musicians, who have
already experienced the consequences of digitisation and
had to find new ways to deal with it, are underrepresented
amongst the Claimers.
Concerned Young People
On the opportunities and threats indices, the Concerned
Young People resemble the Claimers. They see serious
threats in file sharing, do not appreciate remixing of
their work and are concerned about their bargaining
position. In other respects, however, they are more like
Generation 2.0 members: they are relatively young, make
active use of social media and have professional
backgrounds that are similar to those of Generation 2.0
members. Also, they are relatively unsatisfied with
collecting societies. Their income has decreased in recent
years, and they would like to work more. They have less
education than Generation 2.0 members.
Digital Newcomers
The last two groups, Digital Newcomers and Self-Conscious
Creators, score similarly on the opportunities and threats
indices. On other criteria, they are very different.
Digital Newcomers see opportunities in digitisation and
file sharing but also experience threats and make very
little use of social media. They are fairly satisfied with
the collecting societies and perceive their bargaining
position as rather weak. On the other hand, they appreciate
remixing more than other groups do and feel no need for
empowerment.
The overrepresented professions in this group
(screenwriters, actors, directors and authors)
predominantly work in sectors that have yet to experience
the opportunities and consequences of digitisation.
They earn their creative income relatively often with
(temporary) jobs or contracts. Digital Newcomers are
relatively old, work fewer hours than average and would
prefer to work even less. Their income has declined over
the past few years.
Self-Conscious Creators
Self-Conscious Creators perceive digitisation as an
opportunity but also feel threatened by file sharing and
have a negative view of remixing. They work many hours and
would prefer to work even more. Their income development is
comparatively positive. Self-Conscious Creators earn their
income mainly by commercialising their own work instead of
from copyright or royalties. This is a typical feature of
the various professions that are overrepresented in this
group: photographers, visual artists,
cartoonists/illustrators, and designers. Self-Conscious
Creators frequently use new media and are optimistic about
their own bargaining position. Nevertheless, they support
measures to improve this position further and are fairly
satisfied with their collecting society.
5 Conclusion
Creators and performers hold on to more traditional
opinions than often suggested. Unauthorised file sharing is
primarily seen as a threat, and tougher enforcement is
supported by a majority of them. Remixing is also perceived
negatively. The use of DRM is endorsed by a significant
share in order to keep control over copyrighted work.
Finally, despite the criticism they receive in the media,
collecting societies are generally approved of.
Beneath this general, fairly traditional approach towards
copyright, our analysis reveals a relatively diverse and
multifaceted picture. Some creators and performers see the
opportunities created by digital technologies to gain more

control over the distribution and exploitation of their
works. They seek a more independent position from producers
and publishers, and digitisation provides opportunities to
achieve this.
Age is clearly an important driver of this underlying
diversity, but simply pointing towards a generation gap is
an oversimplification. Perceived opportunities of
digitisation are surprisingly stable over the different age
brackets. On the other hand, the perception of threats
tends to increase with age. On the financial axis, current
income was not found to determine the threats and
opportunities that performers and creators perceive.
Instead, a negative income development over the past few
years and a large share of income from collecting societies
induces a high score on the threats index and a low score
on the opportunities index.

Another finding is the impact of profession. Translators
are an interesting example. They combine perceived high
threats and low opportunities as a result of digitisation.
For them, more self-control over their work as a result of
digital distribution is not an option, because they do not
produce works that can be exploited independently from
traditional parties such as publishers. At the other
extreme are video-artists whose work is predominantly
financed through public subsidies. They do not expect
digital technology to harm them financially. On the
contrary, they see the Internet as an inspirational
environment to experiment.
Creators and performers composing, recording and performing
music all see many opportunities. Yet, composers and
lyricists see more threats than the average respondent
does, while performing musicians score relatively low on
threats. The music industry and those working in it have

weathered the digital storm and are now coming back in
shape, facing the future in a modest optimistic fashion.
Meanwhile, photographers, journalists and authors are still
on the gloomy side seeing more threats than the average
creator or performer does and scoring modestly on
opportunities. Their home base, the print media, is still
in flux. This warrants the conclusion that the digital
transition phase of a sector influences the perspective of
creators and performers working there. For those parts of
the creative industries that still have to experience the
full impact of digitisation, the fear factor leads to
fairly pessimistic views, boiling down to a fear to lose
income, combined with a traditional attitude towards
copyright and neighbouring rights and a rather strict view
on rights protection implying strong DRM measures to be
taken.

The perspectives on copyright and digitisation of creators
and performers have been summarised in seven clusters.
Plotted against two axes of perceived threats and
opportunities of digitisation, the dominant position of
these clusters is on the diagonal from high threats and low
opportunities to the contrary (see Figure 7). Generation
Analogue takes the gloomiest position. Members of this on
average older group work relatively many hours, make little
use of social media for their work and derive a large part
of their income from copyright royalties, which explains
their adherence to collecting societies and their firm
stance on support of the present copyright system. At the
other end of the spectrum, we find Generation 2.0, a
relatively young group of people who (as of yet) work fewer
hours in their creative profession than Generation Analogue
members and consequently earn a larger share of their
income outside their creative discipline. They see many

opportunities in digitisation and not many threats, make
intensive use of social media and are critical about
collecting societies. Interesting outliers from the
diagonal in Figure 7 are the Concerned Young People and
Claimers. They combine a relatively high score on threats
and an average score on opportunities. They have
expectations concerning the digital possibilities but are
hesitant because they see their position threatened.
Another outlier are the Non-Affected. They do not see too
many possibilities but also hardly experience any threats.
Digital developments hardly seem to touch them.
These findings show that the position of creators and
performers is the result of a specific interplay of
variables, combining creative professions, age, income
development and dependence on income from copyright
royalties. They result in different positions vis-à-vis the
future of copyright in the digital domain. Apart from the

fact that they point to relevant coherent and identifiable
groups, their positions connote a specific ideological
stance towards copyright in the digital age.
Acknowledgements
This paper is based on research commissioned by the
Research and Documentation Centre of the Dutch Ministry of
Security and Justice and by the Ministry of Education,
Culture and Science. A Dutch research report was published
as: AUTHORS (2010).
References
AUTHORS. (2010)
Brouwer N and Zijderveld C. (2003) De markt voor beeldende kunst en de financiële positie van beeldend kunstenaars 2001. Amsterdam SEO Economisch Onderzoek
Burns RP and Burns RA. (2008) Business Research Methods and Statistics Using SPSS, London: Sage Publications Ltd.
Caves R. (2000) Creative industries. Contracts between art and commerce,Cambridge Mass.: Harvard University Press.

Fabrigar LR, Wegener DT, MacCallum RC, et al. (1999) Evaluating the use of exploratory factor analysis in psychological research. Psychological methods 4: 272-299.
Frey, B. (1997) Not just for the Money, Cheltenham: Edward Elgar
Frey, B. (1999) State Support and Creativity in the Arts: some new considerations. Journal of Cultural Economics, 23 (1/2), 71-85.
Fuhr Svd, Langenberg B, Sentjens M, et al. (2010) Spelen voor de kost. Tilburg: IVA beleidsonderzoek en advies.
Hair JF, Anderson RE, Tatham RL, et al. (1998) Multivariate Data Analysis, Upper Saddle River, NJ: Prentice-Hall International, Inc.
IJdens T, Fuhr Svd and Rooij Jd. (2009) Pop, wat levert hetop? Tilburg: IVA beleidsonderzoek en advies
Jenje-Heijdel W and Haar Dt. (2007) Kunstenaars in Nederland Voorburg/Heerlen: Centraal Bureau voor de Statistiek.
Kretschmer M and Hardwick P. (2007) Authors’ earnings from copyright and non-copyright sources: A survey of 25,000 British and German writers: Bournemouth University / Centre for Intellectual Property Policy & Management.
Kretschmer M, Singh S, Bently L, et al. (2011) Copyright contracts and earnings of visual creators: A survey of 5,800 British designers, fine artists, illustrators and photographers: Centre for Intellectual Property Policy & Management (BournemouthUniversity) / Centre for Intellectual Property & Information Law (University of Cambridge).

Madden M. (2004) Artists, Musicians and the Internet, Washington: PEW/Internet.
Norušis MJ. (2010) PASW Statistics 18: Statistical Procedures Companion, Upper Saddle River, NJ: Prentice Hall / Pearson Education.
Pelsmacker Pd and Kenhove Pv. (2006) Marktonderzoek: Methoden en toepassingen, Amsterdam: Pearson Education.
Punj G and Stewart DW. (1983) Cluster Analysis in MarketingResearch: Review and Suggestions for Application. Journal of Marketing Research 20: 134-148.
SAS Institute Inc. (2004) SAS/Stat® 9.1 User's Guide, Cary, NC: SAS Institute Inc.
Smith MD and Telang R. (2012). Assessing the academic literature regarding the impact of media piracy on sales. [http://ssrn.com/abstract=2132153] Available atSSRN, oi:http://dx.doi.org/10.2139/ssrn.2132153
Towse, R. (2001) Creativity, Incentive and Reward. An Economic Analysis of Copyright and Culture in the Information Age.Cheltenham: EdwardElgar
Waldfogel J. (2011) Copyright Protection, Technological Change, and the Quality of New Products: Evidence fromRecorded Music since Napster. NBER Working Paper Series 17503.
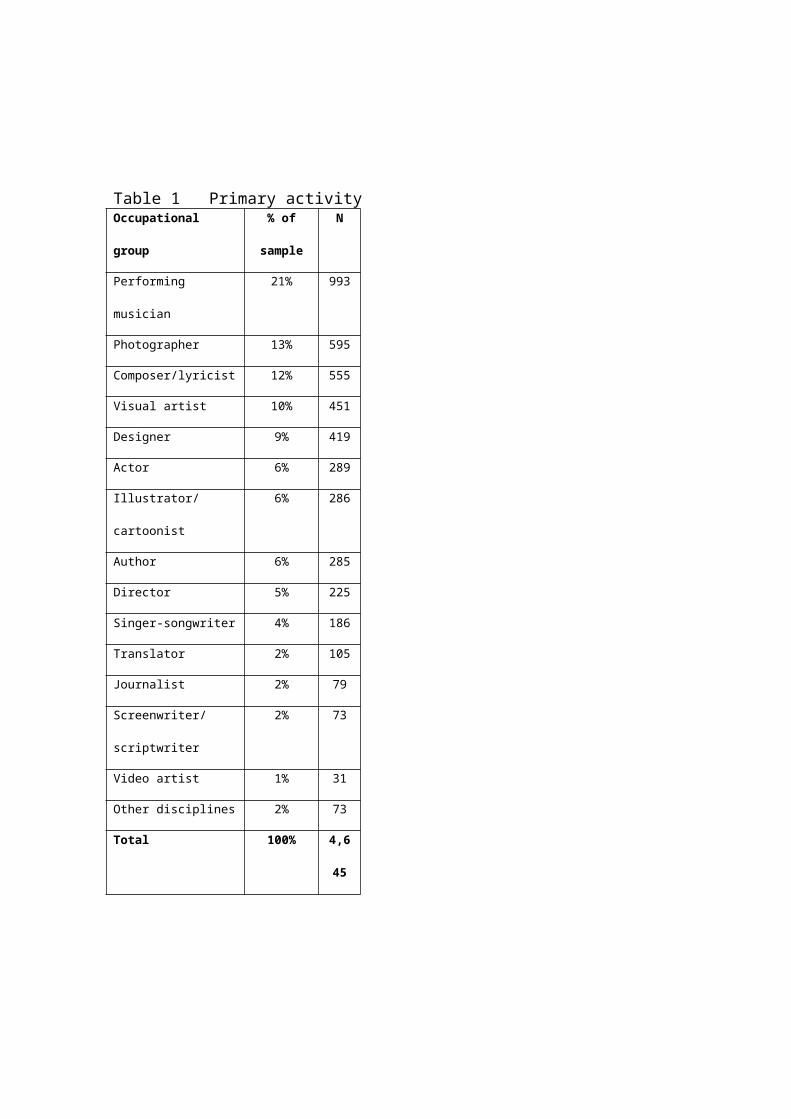
Table 1 Primary activityOccupational
group
% of
sample
N
Performing
musician
21% 993
Photographer 13% 595
Composer/lyricist 12% 555
Visual artist 10% 451
Designer 9% 419
Actor 6% 289
Illustrator/
cartoonist
6% 286
Author 6% 285
Director 5% 225
Singer-songwriter 4% 186
Translator 2% 105
Journalist 2% 79
Screenwriter/
scriptwriter
2% 73
Video artist 1% 31
Other disciplines 2% 73
Total 100% 4,6
45
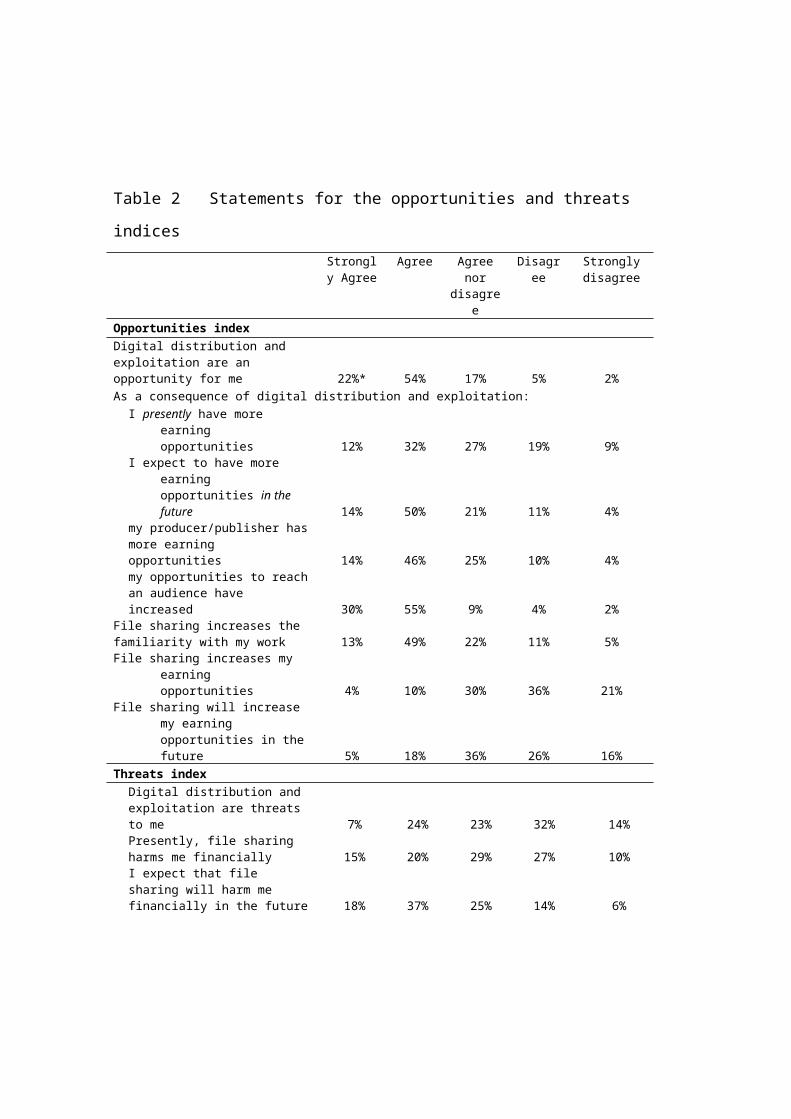
Table 2 Statements for the opportunities and threats
indicesStrongly Agree
Agree Agreenor
disagree
Disagree
Stronglydisagree
Opportunities indexDigital distribution and exploitation are an opportunity for me 22%* 54% 17% 5% 2%As a consequence of digital distribution and exploitation:
I presently have more earning opportunities 12% 32% 27% 19% 9%
I expect to have more earning opportunities in the future 14% 50% 21% 11% 4%
my producer/publisher hasmore earning opportunities 14% 46% 25% 10% 4%my opportunities to reachan audience have increased 30% 55% 9% 4% 2%
File sharing increases the familiarity with my work 13% 49% 22% 11% 5%File sharing increases my
earning opportunities 4% 10% 30% 36% 21%
File sharing will increase my earning opportunities in thefuture 5% 18% 36% 26% 16%
Threats indexDigital distribution and exploitation are threats to me 7% 24% 23% 32% 14%Presently, file sharing harms me financially 15% 20% 29% 27% 10%I expect that file sharing will harm me financially in the future 18% 37% 25% 14% 6%

Remixing of my work without my explicit permission is a threat tomy income 21% 28% 24% 18% 8%
*All percentages recalculated to total 100% after excluding ‘Don’t know/no opinion’.

Table 3 Regression models opportunities and threats indexDependent variable: Opportunities index
Dependent variable: Threats index
N1,634
1,620
F7.1
14.63
Prob > F0.000
0.000
R2
0.0960.18
0Adj R2
0.0820.16
8Coef. S.E. P value Coef. S.E. P value
Author*-
0.387 0.125 0.0020.45
8 0.119 0.000
Translator*-
0.980 0.185 0.0000.66
4 0.176 0.000
Journalist*-
0.351 0.184 0.0560.28
0 0.175 0.109
Screen-/scriptwriter* 0.040 0.182 0.8260.13
3 0.175 0.449
Actor*-
0.330 0.128 0.0100.28
8 0.122 0.019
Director*-
0.095 0.135 0.4780.08
6 0.128 0.500
Singer-songwriter* 0.016 0.156 0.9170.54
1 0.148 0.000
Performing musician*-
0.084 0.104 0.4190.28
5 0.099 0.004
Composer/lyricist*-
0.194 0.121 0.1110.58
8 0.116 0.000
Photographer*-
0.357 0.106 0.0010.69
8 0.101 0.000
Video artist* 0.045 0.283 0.874
-0.07
2 0.269 0.790
Illustrator/cartoonist*-
0.563 0.123 0.0000.61
0 0.118 0.000
Designer*-
0.319 0.116 0.0060.32
2 0.110 0.004
Other activities*-
0.132 0.237 0.578
-0.00
4 0.231 0.987Current working hours per week
-0.081 0.030 0.007
0.082 0.029 0.005
Preferred working hours per week 0.011 0.042 0.795
0.086 0.040 0.030

Age-
0.005 0.003 0.1060.01
9 0.003 0.000
Gender* (Male=0; Female=1)-
0.102 0.058 0.0790.19
2 0.055 0.001
Education 0.015 0.023 0.525
-0.07
0 0.022 0.002
Experience in profession 0.011 0.024 0.636
-0.01
8 0.023 0.431Financial role in household
-0.013 0.036 0.722
0.004 0.034 0.906
Gross year income 2009-
0.013 0.020 0.5230.01
0 0.019 0.601% Income from collecting societies
-0.009 0.002 0.000
0.010 0.002 0.000
Recent income development (-/+) 0.129 0.022 0.000
-0.12
4 0.021 0.000
[Constant] 0.252 0.285 0.377
-1.19
1 0.273 0.000N
1,6341,62
0F
9.9524.2
4Prob > F
0.0000.00
0R2
0.0580.13
1Adj R2
0.0520.12
6
Coef. S.E.P
valueCoef
. S.E.P
valueCurrent working hours per week
-0.112 0.029 0.000
0.086 0.028 0.002
Preferred working hours per week 0.034 0.042 0.411
0.063 0.040 0.115
Age-
0.008 0.003 0.0050.01
9 0.003 0.000
Gender* (Male=0; Female=1)-
0.151 0.057 0.0080.16
6 0.054 0.002
Education 0.002 0.023 0.921
-0.08
2 0.022 0.000
Experience in profession 0.042 0.023 0.065
-0.04
7 0.022 0.031Financial role in household
-0.022 0.036 0.551
0.006 0.035 0.874
Gross year income 2009-
0.021 0.020 0.2940.02
3 0.019 0.225% Income from collecting societies
-0.010 0.002 0.000
0.014 0.002 0.000
Recent income development (-/+) 0.128 0.022 0.000
-0.13
4 0.021 0.000
[Constant] 0.118 0.250 0.637
-0.54
3 0.241 0.024* Dummy variables (excluded occupational group dummy: Visual artists)
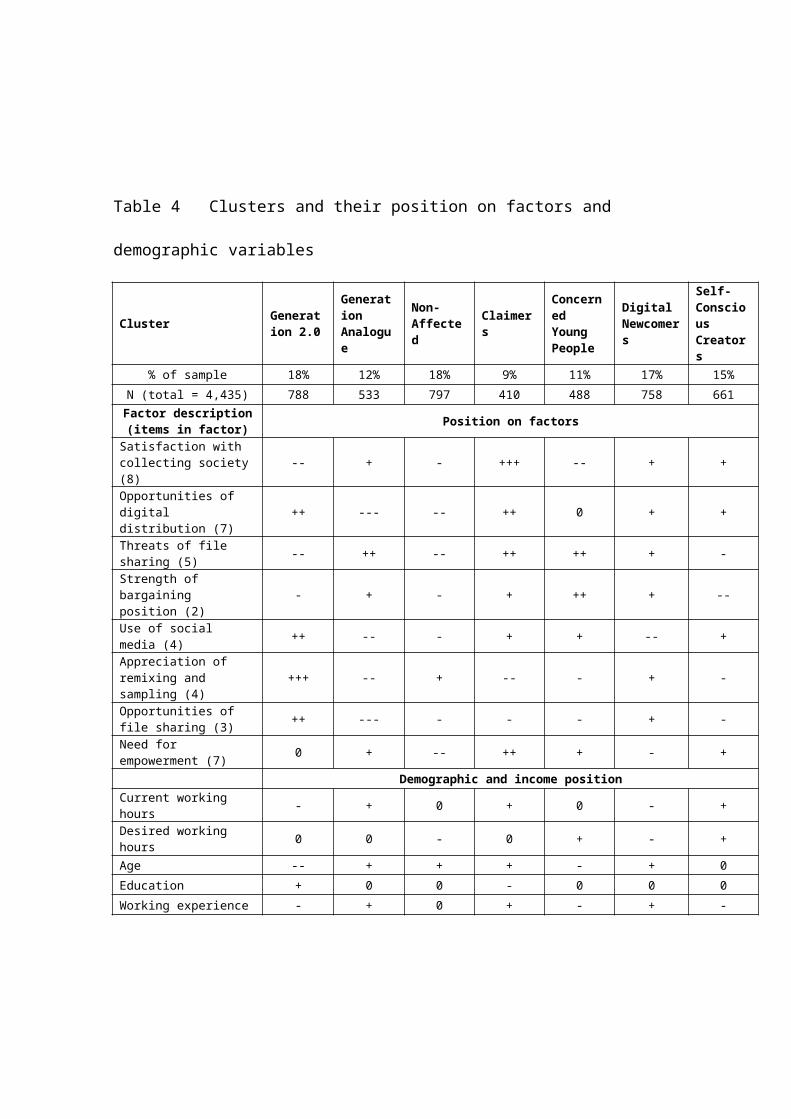
Table 4 Clusters and their position on factors and
demographic variables
Cluster Generation 2.0
Generation Analogue
Non-Affected
Claimers
Concerned Young People
Digital Newcomers
Self-Conscious Creators
% of sample 18% 12% 18% 9% 11% 17% 15%N (total = 4,435) 788 533 797 410 488 758 661Factor description(items in factor) Position on factors
Satisfaction with collecting society(8)
-- + - +++ -- + +
Opportunities of digital distribution (7)
++ --- -- ++ 0 + +
Threats of file sharing (5) -- ++ -- ++ ++ + -
Strength of bargaining position (2)
- + - + ++ + --
Use of social media (4) ++ -- - + + -- +
Appreciation of remixing and sampling (4)
+++ -- + -- - + -
Opportunities of file sharing (3) ++ --- - - - + -
Need for empowerment (7) 0 + -- ++ + - +
Demographic and income positionCurrent working hours - + 0 + 0 - +
Desired working hours 0 0 - 0 + - +
Age -- + + + - + 0Education + 0 0 - 0 0 0Working experience - + 0 + - + -

Contribution to household income 0 0 0 + 0 0 0
Current income - 0 0 0 0 0 0% Income from royalties - + - + 0 0 -
Recent income development + - 0 - - - +
Key to symbols: ‘+’ or ‘-’ mean cluster scores significantly different from sample mean (p<0.05) while: +++/--- means │Z│>= 1; ++/-- means 0,5<=│Z│<1; and+/- means 0 <│Z│<0.5.

Table 5 Occupational profile clusters
Cluster Overrepresented professions*
Underrepresented professions*
Generation 2.0 Singer-songwritersPerforming musiciansComposers
TranslatorsIllustrators/cartoonistsAuthorsActorsPhotographers
Generation Analogue
TranslatorsIllustrators/cartoonistsAuthorsJournalistsPhotographers
Screen-/scriptwritersDirectorsSinger-songwritersPerforming musiciansVisual artists
Non-Affected DirectorsVisual artistsDesigners
AuthorsSinger-songwritersComposersIllustrators/cartoonists
Claimers PhotographersIllustrators/cartoonistsAuthors
Screen-/scriptwritersActorsDirectorsPerforming musiciansDesigners
Concerned Young People
JournalistsSinger-songwritersComposers
TranslatorsVisual artistsScreen-/scriptwritersIllustrators/cartoonistsDesigners
Digital Newcomers AuthorsScreen-/scriptwritersActorsDirectors
PhotographersJournalistsDesigners
Self-Conscious Creators
Illustrators/cartoonistsDesignersPhotographersVisual artists
TranslatorsActorsDirectorsPerforming musiciansComposers

*Overrepresentation and underrepresentation of a profession in a cluster are defined as a representation of at least 25% more and 25% less respectively than the sample average. Bold face professions are overrepresented or underrepresented by at least 50%.
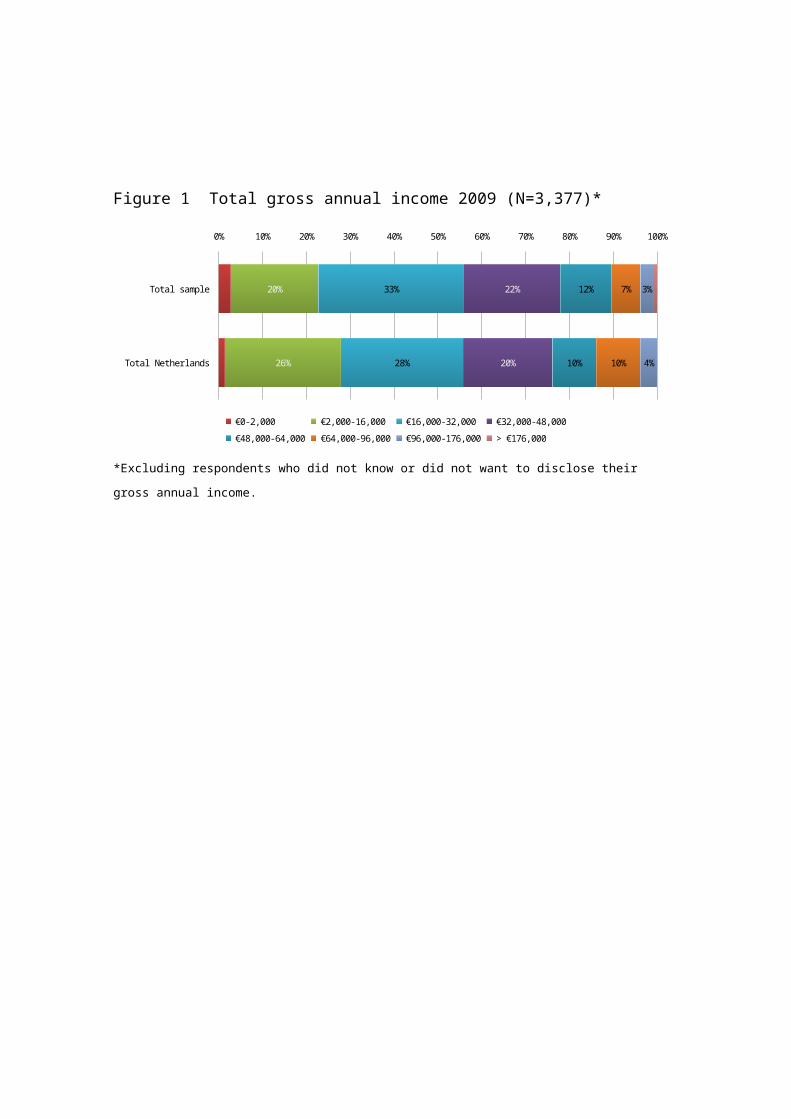
Figure 1 Total gross annual income 2009 (N=3,377)*
Total sample
Total Netherlands
0% 10% 20% 30% 40% 50% 60% 70% 80% 90% 100%
20%
26%
33%
28%
22%
20%
12%
10%
7%
10%
3%
4%
€0-2,000 €2,000-16,000 €16,000-32,000 €32,000-48,000€48,000-64,000 €64,000-96,000 €96,000-176,000 > €176,000
*Excluding respondents who did not know or did not want to disclose their
gross annual income.

Figure 2 Distribution of income within creative discipline
Designer (N=244)Actor (N=172)
Director (N=147)Journalist (N=55)
Illustrator/cartoonist (N=185)Performing musician (N=532)
Other activities (N=34)Photographer (N=369)
Screen-/scriptwriter (N=47)Video artist (N=21)Translator (N=69)
Composer/lyricist (N=312)Visual artist (N=268)
Singer-songwriter (N=104)Author (N=167)
Total sample (N=2,726)
0% 10% 20% 30% 40% 50% 60% 70% 80% 90% 100%
Performances, comissioned work and wages Copyrights, neighbouring rights and royaltiesProfit self-managed exploitation and distribution Sponsoring / social benefitsOther income within creative discipline

Figure 3 Past income development in relation to financial
harm from file sharing
Strong increase
Some increase
Stable
Some decline
Sharp decline
Don't know / don't want to disclose
0% 10% 20% 30% 40% 50% 60% 70% 80% 90% 100%File sharing currently causes me financial harm
Completely agree Agree Agree nor disagree Disagree Completely disagree
Deve
lopm
ent o
f inc
ome
in cr
eati
ve d
isci
plin
e in
rece
nt y
ears
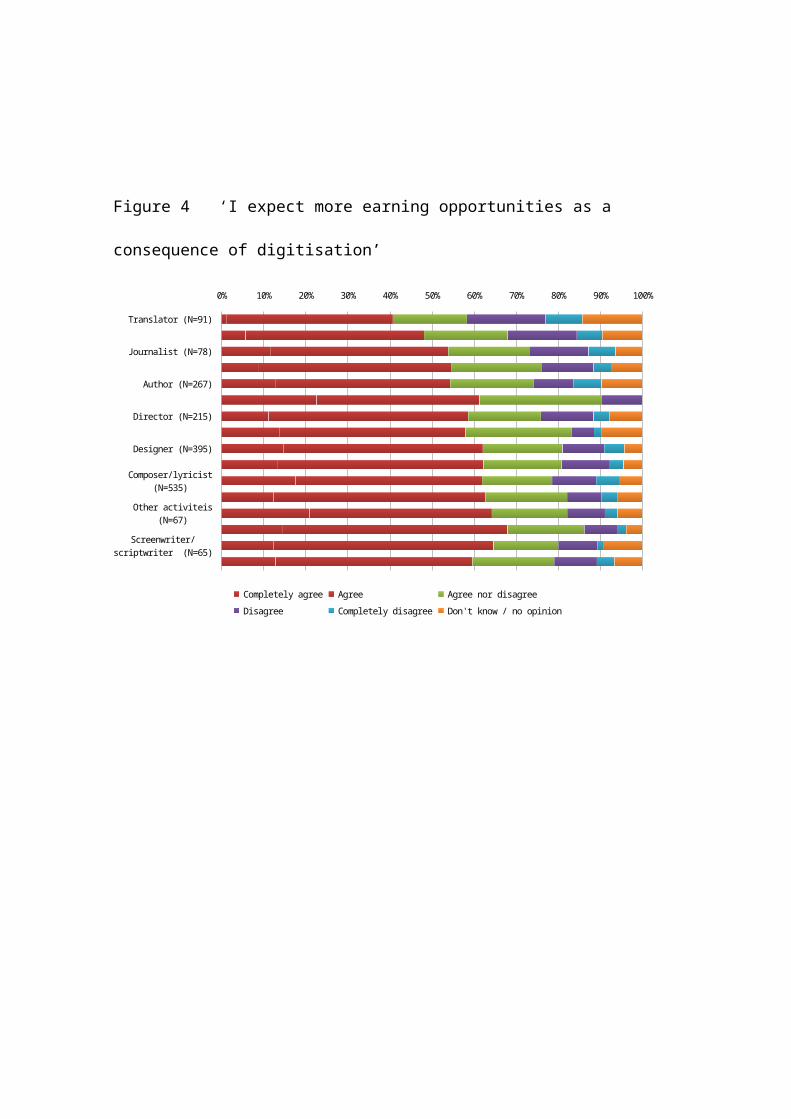
Figure 4 ‘I expect more earning opportunities as a
consequence of digitisation’
Translator (N=91)
Journalist (N=78)
Author (N=267)
Director (N=215)
Designer (N=395)
Composer/lyricist (N=535)
Other activiteis (N=67)
Screenwriter/scriptwriter (N=65)
0% 10% 20% 30% 40% 50% 60% 70% 80% 90% 100%
Completely agree Agree Agree nor disagreeDisagree Completely disagree Don't know / no opinion

Figure 5 Opportunities and threats index per occupational
group
258.00
88.00
76.00
62.00
259.00
213.00
178.00
899.00
528.00
581.00
405.00
31.00
265.00
389.00
66.00
Opportunities HighLow
Thre
ats
High
Low

Figure 6 Opportunities and threats stance is partially
explained by demographics
Authors
Translators
Journalists
Screen-/scriptwriters
Actors
Directors
Singer-songwriters
Perform ing m usicians
Com posers/lyricists
Photographers
Visual artists
Video artists
Illustrators/cartoonists
Designers
O ther activities
Opportunities HighLow
Threats
High
Low

Figure 7 Opportunities and threats index per clusters
751.00
406.00
772.00
524.00
719.00
642.00
483.00
Opportunities HighLow
Thre
ats
High
Low