A New Era - HKEXnews
85
Forging A New Era 邁向新里程 2010 2010 :
-
Upload
khangminh22 -
Category
Documents
-
view
2 -
download
0
Transcript of A New Era - HKEXnews

Forging
A New Era邁向新里程
20102010:

ASM’s Performance in Year 2010
Fiscal Year 2010• Record Group turnover of US$1,224.6 million, a surge of
101.1% over 2009• Record Net Profits of HK$2,842 million and earnings per
share of HK$7.20, a surge of 203.8% over the previous year• Record Equipment turnover of US$1,018.3 million, a surge of
117.4% year on year• Record Lead frame turnover of US$206.3 million, a growth of
46.7% year on year• Record new order bookings of US$1,463.9 million, a surge of
90.4% over 2009• Retained the world’s No. 1 position in the semiconductor
assembly and packaging equipment industry held since 2002
• Record cash on hand of HK$2,055 million at the end of December 2010, with zero debt
Second Half 2010• Record half yearly Group turnover of US$688.1 million, a
growth of 28.3% over the previous six months and 60.9% over same period a year ago
• Record half yearly net profits of HK$1,693.7 million and earnings per share of HK$4.29, a growth of 47.5% over the 1st half year and a surge of 96.8% over the same period a year ago
• Record half yearly equipment turnover of US$577.9 million, achieving 31.3% growth over the preceding half year and 70.0% growth over the same period a year ago
• Record half yearly lead frame turnover of US$110.1 million, achieving 14.5% growth over the preceding half year and 25.7% growth over the same period a year ago
• Half yearly new order bookings of US$556 million, a decline of 38.8% sequentially over the preceding half year
Q4 2010• Group turnover of US$340.1 million, a small decline of 2.5%
over the previous quarter and a growth of 50.3% over the same period a year ago
• Net profits of HK$844.9 million and earnings per share of HK$2.14, a slight decline of 0.4% over the previous quarter and a surge of 83.9% over the same period a year ago
• Equipment turnover of US$288.7 million, a slight decline of 0.5% over the preceding quarter and 60.4% growth over the same period of previous year
• Lead frame turnover of US$51.5 million, a decline of 12.4% over the preceding quarter and 11.0% growth over the same period of previous year
• New order bookings of US$179.3 million, a decline of 52.4% sequentially over the preceding quarter
ASM於二零一零年之業績表現
二零一零年財政年度• 集團營業額創新高達12.246億美元,較二零零九年激增101.1%
• 純利創新高達港幣28.42億元,每股盈利為港幣7.20元,較去年激增203.8%
• 設備業務營業額創新高達10.183億美元,較去年激增117.4%
• 引線框架業務營業額創新高達2.063億美元,較去年增長46.7%
• 新增訂單總額創新高達14.639億美元,較二零零九年激增90.4%
• 自二零零二年起穩佔全球半導體裝嵌及包裝設備行業第一位
• 於二零一零年十二月底的現金結存創新高達港幣20.55億元,負債為零
二零一零年下半年度• 集團半年度營業額創新高達6.881億美元,較前六個月增長28.3%及較去年同期增長60.9%
• 半年度純利創新高達港幣16.937億元;每股盈利為港幣4.29元,較上半年增長47.5%及較去年同期激增96.8%
• 設備業務半年度營業額創新高達5.779億美元,較前半年增長31.3%及較去年同期增長70.0%
• 引線框架業務半年度營業額創新高達1.101億美元,較前半年增長14.5%及較去年同期增長25.7%
• 半年度新增訂單總額為5.56億美元,較前半年減少38.8%
二零一零年第四季度• 集團營業額為3.401億美元,較前一季度輕微減少2.5%及較去年同期增長50.3%
• 純利為港幣8.449億元,每股盈利為港幣2.14元,較前一季度輕微減少0.4%及較去年同期激增83.9%
• 設備業務營業額為2.887億美元,較前一季度輕微減少0.5%及較去年同期增長60.4%
• 引線框架業務營業額為五千一百五十萬美元,較前一季度減少12.4%及較去年同期增長11.0%
• 新增訂單總額為1.793億美元,較前一季度減少52.4%

Corporate Information 2
Financial Highlights 3
Chairman’s Statement 4
Management Discussion and Analysis 14
Directors’ Report 24
Corporate Governance Report 33
Independent Auditor’s Report 41
Consolidated Statement of Comprehensive Income 42
Consolidated Statement of Financial Position 43
Consolidated Statement of Changes in Equity 44
Consolidated Statement of Cash Flows 45
Notes to the Consolidated Financial Statements 46
Five Year Financial Summary 82
Contents

2
CORPORATE INFORMATION
DIRECTORSExecutive Directors:Arthur H. del Prado, ChairmanLo Tsan Yin, Peter, Vice ChairmanLee Wai KwongChow Chuen, James
Non-executive Directors:Charles Dean del PradoPetrus Antonius Maria van Bommel
Independent Non-executive Directors:Orasa LivasiriLee Shiu Hung, RobertLok Kam Chong, John
PRINCIPAL BANKERSThe Hongkong and Shanghai Banking Corporation LimitedStandard Chartered Bank (Hong Kong) LimitedCitibank, N.A.The Bank of Tokyo-Mitsubishi UFJ, Ltd
AUDITORDeloitte Touche Tohmatsu35/F One Pacific Place88 QueenswayHong Kong
SECRETARYSo Sau Ming
REGISTERED OFFICECaledonian HouseGeorge TownGrand CaymanCayman Islands
PRINCIPAL PLACE OF BUSINESS12/F Watson Centre16-22 Kung Yip StreetKwai Chung, New TerritoriesHong Kong
SHARE REGISTRARS AND BRANCH REGISTER OFFICETricor Secretaries Limited26th Floor, Tesbury Centre28 Queen’s Road EastHong Kong
COMPANY WEBSITE AND CONTACTWebsite : http://www.asmpacific.comTelephone : (852) 2424 2021Fax : (852) 2481 3367

3
FINANCIAL HIGHLIGHTS
Year ended 31 December2010 2009
HK$’000 HK$’000
Turnover 9,515,089 4,732,174Cost of sales (5,006,965) (2,776,579)
Gross profit 4,508,124 1,955,595Other income 22,769 7,729Selling and distribution expenses (603,095) (417,324)General and administrative expenses (275,559) (166,509)Research and development expenses (433,987) (307,467)Other gains and losses 1,398 (6,254)Finance costs (3) –
Profit before taxation 3,219,647 1,065,770Income tax expense (377,613) (130,332)
Profit for the year 2,842,034 935,438
Exchange differences on translation of foreign operations, representing other comprehensive income for the year 34,305 2,338
Total comprehensive income for the year 2,876,339 937,776
Earnings per share– Basic HK$7.20 HK$2.38
– Diluted HK$7.18 HK$2.37
0
2,000
4,000
6,0004,556
5,393 5,258
4,732
9,515
2006 2007 2008 2009 2010
8,000
10,000
0
500
1,000
1,500
2,000
2,500
3,000
2006 2007 2008 2009 2010
935
2,842
1,149 1,269974
Turnover(HK$’ Million)
Profit(HK$’ Million)
4
CHAIRMAN’S STATEMENT
Unprecedented new height ASM’s performance in 2010 is a testimonial of its success in riding through the various business cycles of the semiconductor industry.
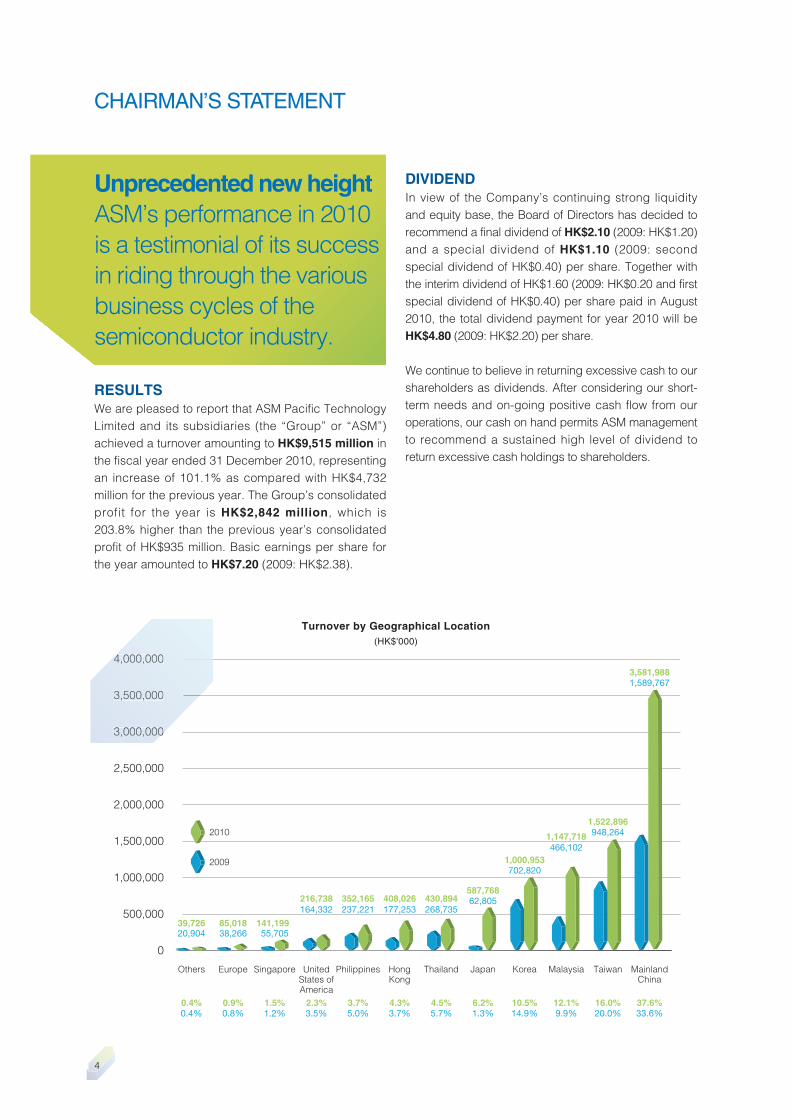
RESULTSWe are pleased to report that ASM Pacific Technology Limited and its subsidiaries (the “Group” or “ASM”) achieved a turnover amounting to HK$9,515 million in the fiscal year ended 31 December 2010, representing an increase of 101.1% as compared with HK$4,732 million for the previous year. The Group’s consolidated profit for the year is HK$2,842 million, which is 203.8% higher than the previous year’s consolidated profit of HK$935 million. Basic earnings per share for the year amounted to HK$7.20 (2009: HK$2.38).
DIVIDENDIn view of the Company’s continuing strong liquidity and equity base, the Board of Directors has decided to recommend a final dividend of HK$2.10 (2009: HK$1.20) and a special dividend of HK$1.10 (2009: second special dividend of HK$0.40) per share. Together with the interim dividend of HK$1.60 (2009: HK$0.20 and first special dividend of HK$0.40) per share paid in August 2010, the total dividend payment for year 2010 will be HK$4.80 (2009: HK$2.20) per share.
We continue to believe in returning excessive cash to our shareholders as dividends. After considering our short-term needs and on-going positive cash flow from our operations, our cash on hand permits ASM management to recommend a sustained high level of dividend to return excessive cash holdings to shareholders.
0
500,000
1,000,000
1,500,000
2,000,000
2,500,000
3,000,000
3,500,000
4,000,000
Others Europe Singapore UnitedStates ofAmerica
Philippines HongKong
2010
2009
0.4%0.4%
39,72620,904
0.9%0.8%
85,01838,266
1.5%1.2%
141,19955,705
2.3%3.5%
216,738164,332
3.7%5.0%
352,165237,221
4.3%3.7%
408,026177,253
4.5%5.7%
430,894268,735
6.2%1.3%
587,76862,805
10.5%14.9%
1,000,953702,820
12.1%9.9%
1,147,718466,102
16.0%20.0%
1,522,896948,264
3,581,9881,589,767
37.6%33.6%
Thailand Japan Korea Malaysia Taiwan MainlandChina
Turnover by Geographical Location(HK$'000)
3,00000,000
3,500,000
4,000,0000

5
ASM Pacific Technology Limited Annual Report 2010
2001 2002 2003 2004 20102005 2006 2007 2008 2009
41 4957
7486
125139 148 141
206
0
50
100
150
200
250
Growth in Lead Frame Turnover(US$ Million)
2001 2002 2003 2004 20102005 2006 2007 2008 2009
159 188277
418 369461
553 527470
Growth in Equipment Turnover
0
200
400
600
800
1,000
1,2001,018
(US$ Million)
6
CHAIRMAN’S STATEMENT(CONTINUED)
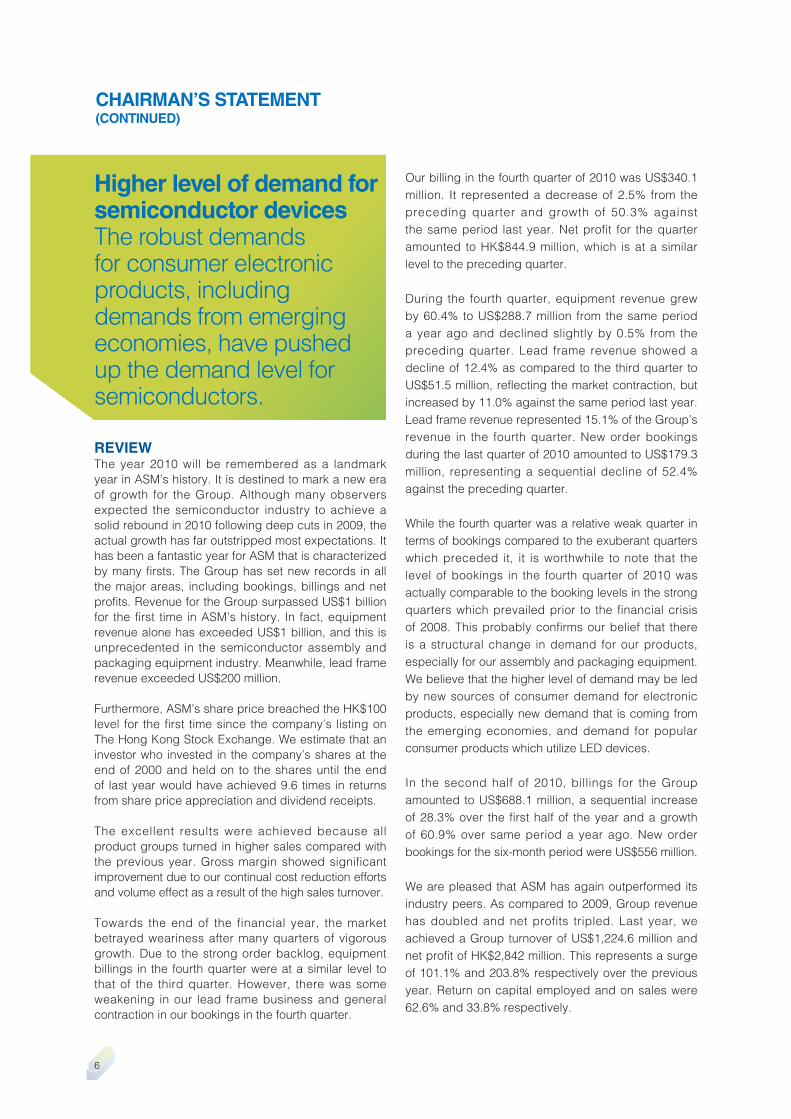
Higher level of demand for semiconductor devices The robust demands for consumer electronic products, including demands from emerging economies, have pushed up the demand level for semiconductors.
REVIEWThe year 2010 will be remembered as a landmark year in ASM’s history. It is destined to mark a new era of growth for the Group. Although many observers expected the semiconductor industry to achieve a solid rebound in 2010 following deep cuts in 2009, the actual growth has far outstripped most expectations. It has been a fantastic year for ASM that is characterized by many firsts. The Group has set new records in all the major areas, including bookings, billings and net profits. Revenue for the Group surpassed US$1 billion for the first time in ASM’s history. In fact, equipment revenue alone has exceeded US$1 billion, and this is unprecedented in the semiconductor assembly and packaging equipment industry. Meanwhile, lead frame revenue exceeded US$200 million.
Furthermore, ASM’s share price breached the HK$100 level for the first time since the company’s listing on The Hong Kong Stock Exchange. We estimate that an investor who invested in the company’s shares at the end of 2000 and held on to the shares until the end of last year would have achieved 9.6 times in returns from share price appreciation and dividend receipts.
The excellent results were achieved because all product groups turned in higher sales compared with the previous year. Gross margin showed significant improvement due to our continual cost reduction efforts and volume effect as a result of the high sales turnover.
Towards the end of the financial year, the market betrayed weariness after many quarters of vigorous growth. Due to the strong order backlog, equipment billings in the fourth quarter were at a similar level to that of the third quarter. However, there was some weakening in our lead frame business and general contraction in our bookings in the fourth quarter.
Our billing in the fourth quarter of 2010 was US$340.1 million. It represented a decrease of 2.5% from the preceding quarter and growth of 50.3% against the same period last year. Net profit for the quarter amounted to HK$844.9 million, which is at a similar level to the preceding quarter.
During the fourth quarter, equipment revenue grew by 60.4% to US$288.7 million from the same period a year ago and declined slightly by 0.5% from the preceding quarter. Lead frame revenue showed a decline of 12.4% as compared to the third quarter to US$51.5 million, reflecting the market contraction, but increased by 11.0% against the same period last year. Lead frame revenue represented 15.1% of the Group’s revenue in the fourth quarter. New order bookings during the last quarter of 2010 amounted to US$179.3 million, representing a sequential decline of 52.4% against the preceding quarter.
While the fourth quarter was a relative weak quarter in terms of bookings compared to the exuberant quarters which preceded it, it is worthwhile to note that the level of bookings in the fourth quarter of 2010 was actually comparable to the booking levels in the strong quarters which prevailed prior to the financial crisis of 2008. This probably confirms our belief that there is a structural change in demand for our products, especially for our assembly and packaging equipment. We believe that the higher level of demand may be led by new sources of consumer demand for electronic products, especially new demand that is coming from the emerging economies, and demand for popular consumer products which utilize LED devices.
In the second half of 2010, billings for the Group amounted to US$688.1 million, a sequential increase of 28.3% over the first half of the year and a growth of 60.9% over same period a year ago. New order bookings for the six-month period were US$556 million.
We are pleased that ASM has again outperformed its industry peers. As compared to 2009, Group revenue has doubled and net profits tripled. Last year, we achieved a Group turnover of US$1,224.6 million and net profit of HK$2,842 million. This represents a surge of 101.1% and 203.8% respectively over the previous year. Return on capital employed and on sales were 62.6% and 33.8% respectively.

7
ASM Pacific Technology Limited Annual Report 2010
100
95
90
85
80
75
70
65
60
Bill
ion
s o
f U
S$
2007 2008 2009 2010 2011 2012 2013
China Semiconductor Market Revenue
Source: iSuppli
1.80
1.75
1.70
1.65
1.60
1.55
1.50
1.45
Bill
ion
s o
f Un
its
2009 2010 2011 2012 2013 2014
Global Consumer Electronics Shipment Forecast
Source: IHS, January 2011

8
CHAIRMAN’S STATEMENT(CONTINUED)
Exceptional growth potential for LED ASM is in a unique position to capture the opportunities offered by the LED market.
REVIEW (Continued)Last year, our equipment revenue was US$1,018.3 million, representing 83.2% of the Group’s turnover and an increase of 117.4% over the previous year. ASM was again the top supplier in its industry, which is a position we have maintained since 2002. We have once again widened our gap with the closest rival from US$212 million in 2009 to over US$305.2 million last year. Revenue for our lead frame business in 2010 was US$206.3 million, growing by 46.7%. This solid performance again highlights our strong market position in the lead frame business.
New order bookings for 2010 amounted to a new record of US$1,463.9 million, which is an increase of 90.4% as compared to the previous year. Our book-to-bill ratio, representing net bookings over billings, was 1.20. Our backlog as of 31 December 2010 decreased to US$450.2 million.
Our customer base continues to be well diversified. By geographical distribution, China, Taiwan, Malaysia, South Korea and Japan were the top 5 markets for ASM in 2010. In particular, the contribution from the China market has further increased, from 33.6% in 2009 to 37.6% in 2010. Also, there was a significant growth of the business originating from Japan, largely arising from demand for equipment for producing LEDs. Generally, all geographical areas have shown strong improvement over the previous year.
In 2010, our top 5 customers accounted for only 16.2% of the Group’s revenue. While demand has improved in all areas, the demand from subcontractors has generally improved to a greater extent than the demand from IDMs. On the whole, all our products performed very well during the year.
We continue to see strong momentum in the demand for our copper wire bonders and copper wire bonding conversion kits. Many of our gold wire bonders in the field have now been converted into copper wire bonders thus enhancing ASM’s premier position in copper wire bonding technology.
We have the largest product portfolio to address both the semiconductor market and the LED market, which allowed ASM to take advantage of the strong growth in demand in the LED market in 2010. We have been very successful in our strategy of expanding our product line-up for LED applications. Our LED sorters, test handlers, taping machines and LED encapsulation system have all been very well received by the market.
Capacity constraints in 2010 limited our ability to launch many new products. With the easing of capacity this year, we will be stepping up our efforts to launch many new products to the market.
During the year, ASM entered the Surface Mount Technology (“SMT”) business by acquiring the Siemens Electronics Assembly Systems (“SEAS”) business from Siemens AG. The acquisition was officially completed on 7 January 2011.
We were pleased to observe that the SEAS business recovered very well from the financial crisis and managed to achieve operational profits during the second half of 2010. Its revenue in 2010 achieved a strong growth of 116.3% against 2009. Its newly-deve loped SX ser ies p lacement mach ine is especially well-received by the market with strong bookings received from customers in Europe. With the acquisition of the SEAS business, our beginning backlog as of 1 January 2011 has instantly expanded by €101.1 million. China has become the largest market for the SEAS business, which coincidentally is also the largest and most successful market for ASM.
After the acquisition by ASM, the SEAS business has been renamed “ASM Assembly Systems”. Since SEAS is considered to be one of the top suppliers in the SMT equipment market, the SMT business’ contribution to ASM’s top line is immediate and sizeable. The integration activities to ensure that positive synergies between the two existing businesses are realized at the earliest possible time are well on track.

9
ASM Pacific Technology Limited Annual Report 2010
160
140
120
100
80
60
40
20
0
Bill
ion
s o
f H
K$
2009 2010 2011 2012 2013 2014
Growth Forecast For The LED Market
Source: Strategies Unlimited, November 2010

10
CHAIRMAN’S STATEMENT(CONTINUED)
Capture the growth in China New etching lines will be set up in China to capture QFN opportunities there. QFN is a popular package being used in mobile gadgets.
LIQUIDITY AND FINANCIAL RESOURCESWe ended the last fiscal year in a very healthy financial position. Due to the booming demand, our aggressive working capital management through tight control of inventory and aggressive collection efforts, our cash on hand at year-end is at a historical high. Therefore, we are in a comfortable position to fund the acquisition and integration of the SMT business, as well as the capex budget in the coming year.
Cash on hand as of 31 December 2010 was HK$2,055 million (2009: HK$1,254 million). During the twelve-month period, HK$1,262 million was paid as dividends. Capital addition during the period amounted to HK$858 million, which was partially funded by the year’s depreciation of HK$227 million. Accounts receivable have been tightly monitored during the year. Due to our aggressive collection efforts and the slight reduction in sales activities in the last quarter, accounts receivable have decreased to 72.7 days sales outstanding (2009: 104.7 days).
There was no bank borrowing as of 31 December 2010. Current ratio was 2.41, with a debt-equity ratio of 48.2%. As there were no long term borrowings, gearing of the Group was zero, the same as for the past ten years. The Group’s shareholders’ funds increased to HK$5,140 million as at 31 December 2010 (2009: HK$3,410 million).
The Group has moderate currency exposure as the majority of all sales were denominated in U.S. dollars. On the other hand, the disbursements were mainly in U.S. dollars, Hong Kong dollars, Singapore dollars, Malaysian Ringgit and China Renminbi. Our limited yen-based receivables were offset by some accounts payable in yen to Japanese vendors. With the addition of the SMT equipment business, the Group’s exposure to the Euro has increased starting from 2011.
We continue to believe in returning excessive cash to our shareholders as dividends. After considering our short-term needs and on-going positive cash flow from our operations, our cash on hand permits ASM management to recommend a sustained high level of dividend.
HUMAN RESOURCESASM recognizes human resources as one of the Company’s most important assets. Recruit ing and retaining high-calibre employees is always of high priority in ASM. Besides offering competitive remuneration packages, ASM also commits to special ized yet demanding staff development and training programs. In general, salary review is conducted annually. In addition to salary payments, other benefits include contributions to provident fund schemes, medical and training subsidies. Discretionary bonus and incentive shares may be granted to eligible staff based on the Group’s financial results and individual performance.
As of 31 December 2010, the total headcount of the Group worldwide was approximately 15,200 people. After completion of the acquisition of the SEAS business, total headcount of the Group increased by 1,200.
PROSPECTSConsumer products will continue to lead innovation in 2011, particularly in the field of mobile technology. Healthy demand for consumer electronics products will continue to fuel the market. Some analysts have predicted that, after the high growth rates in capital equipment spending in 2010 of more than 100% as compared to a weak 2009, spending in 2011 will likely be flat resulting in a single-digit growth for the assembly and packaging equipment industry.
Since growth is likely to moderate in the near term, we expect 2011 to be generally comparable to 2010. Demand appears to be stabilizing based on recent data. It is possible that we have already crossed the bottom of the current cycle.
11
ASM Pacific Technology Limited Annual Report 2010

12
CHAIRMAN’S STATEMENT(CONTINUED)
PROSPECTS (Continued)In the LED sector, there appears to be some oversupply of LED products at present, but we believe that such oversupply should be a short-term situation. It is likely that the LED market will proceed to grow again after the inventory adjustment. Besides LED Back-Lighting Units, LED general lighting will become an additional driver to propel growth. Upon the turnaround in the business cycle, we are in a prime position to add significant growth to our top and bottom lines as a result of our investment in capacity and the structural improvements to our operations.
We expect the SMT business to become an additional growth engine for ASM which will contribute materially to ASM’s profitability in the future. Given the current market conditions and the successful turnaround of the SEAS business in 2010, we now expect the newly acquired SMT business to have an immediate contribution to our bottom line starting from this year, although it may be at a lower level initially. We are currently putting in place plans to bring the profitability of the SMT business to a comparable level to ASM’s norms. It appears that the SMT equipment market is somewhat similar to the semiconductor assembly and packaging equipment market. After a few quarters of robust growth, demand came down during the second half of 2010. However, it seems that the SMT equipment market is also settling at a relatively high level compared to the pre-crisis period. We are confident that the acquisition will enable the Group to continue to deliver growth and returns to its shareholders that are in line with ASM’s historical performance.
We will focus on launching new products to the market in 2011 in order to recapture the ground which we had to concede to the competition due to our capacity constraints experienced last year, when our resources were stretched to the limit to meet the robust market demand. The growing demand for LEDs in backlighting as well as general lighting has given us the confidence to aggressively expand our range of equipment offered for LED applications beyond our present product line-up. Going forward, we will further develop LED lead frames and packages for high-brightness LEDs. Our ultimate target is to become a total solution provider to the LED market.
Our heavy aluminum wire bonder is one of the key products that we will be launching this year. We expect that there will be a strong demand for such wire bonders in the production of power drivers and power management electronic devices due to the booming demand for electric cars and the drive for “green” products.
We had previously announced that a R&D centre has been set up in Chengdu, China, and that we are in the process of expanding its operations. The new building which is due to be completed in the third quarter of 2011 will allow ASM to significantly boost its R&D strength and resources. Moreover, the acquisition of the SEAS business has added a fourth R&D centre in Munich, Germany to the Group. We believe that with the aforesaid increase in R&D resources, ASM’s long-term strategic positioning as the leader of the assembly and packaging equipment business, as well as a leading supplier of SMT equipment, would be significantly strengthened.
Equipment
Lead frame
Turnover by Products (HK$' Million)
2010
83.2%
16.8%
1,602.8
7,912.3
Turnover by Products (HK$' Million)
Equipment
Lead frame
76.9%
23.1%
1,092.4
3,639.8
2009
13
ASM Pacific Technology Limited Annual Report 2010
PROSPECTS (Continued)Our new manufacturing plant in Huizhou, China is now fully-operational, and is progressing into its second phase of expansion. A new casting centre and a fabrication centre will be ready by the first half of 2012. It will allow ASM to further enhance its production capacity to cater for the growth of both the assembly and packaging equipment and SMT equipment businesses, and to facilitate new investments in casting technology. We will further supplement our etched lead frame capacity by setting up new etching facilities in Fuyong, China to capture the growing China market.
The rapid growth of the Group, as exemplified by the acquisition of the SEAS business, has accelerated the need for changes to be made to our supply chain management structure to cater for the increasing complexity of our business. A decentralized model consisting of multiple regional centers of operations which has served us well until now needs to be streamlined in order to meet the new challenges. Learning from the best practices of other large multinational companies, we decide to reorganize the Group’s global supply chain structure by establishing a principal company for centralizing the supply chain operations. These changes are aimed at simplifying our supply chain management across the many worldwide locations where our various subsidiaries, customers and suppliers are located. Accordingly, some management functions such as strategic business planning, global procurement, marketing, corporate finance, human resource management, legal and intellectual property management would be centralized in the principal company. After exploring the relative merits of potential locations for establishing the principal company, we have decided to base the principal company in Singapore. We are very pleased to announce that in conjunction with the decision to base the principal company in Singapore, the Group’s subsidiary in Singapore, ASM Technology Singapore Pte Ltd. has been awarded the International Headquarters Award by the Singapore Economic Development Board.
ASM’s management team has always sought to adopt a long-term business strategy that would enable the company to seize opportunities during good times and at the same time sharpen its competitive edge to achieve sustainable and profitable growth. Our long-term business strategies include offering multiple products serving diversified application markets, a customer-centric approach focusing on customer value creation, a vertical integration strategy and strategic choice of low-cost manufacturing locations, and last but not least providing customers with innovative, total packaging solutions based on ASM’s equipment and lead frames to meet their ever-expanding new product requirements. With the addition of the SMT equipment business, we are able to further expand the scope of our total solutions to customers.
APPRECIATIONOur shareholders and investors have been thrilled by the success which we have achieved in 2010. They have expressed their confidence in our future prospects, as reflected in the share price of the company which has surpassed the HK$100 mark for the first time since the company’s listing on the Hong Kong Stock Exchange. It has been a bountiful year for ASMPT, and it will be remembered as a landmark year in the company’s history. Nevertheless, all these successes would not have been possible without the outstanding hard work and contributions from all our employees. We wish to take this opportunity to express our heartfelt gratitude to our employees, customers, suppliers and stakeholders for the support they have provided to ensure the success of the company.
Arthur H. del PradoChairman2 March 2011

14
MANAGEMENT DISCUSSION AND ANALYSIS
Strengthen our long term strategic position The addition of R&D centers in Chengdu and Munich brings ASM’s total R&D strength to around 1,000 people with high quality.
OVERVIEWWe have again soared to new heights in 2010! Our revenue was US$1.22 billion, representing an increase of 101.1% over the previous year. In fact, Equipment revenue alone had exceeded US$1 billion, which is a first for the semiconductor assembly and packaging equipment industry. Besides the record annual turnover, new records were set in all other major areas, including bookings and net profits.
Back at the beginning of 2008, we had set for ourselves the target of achieving total annual revenues of US$1 billion by 2010, with lead frame revenue exceeding US$200 million. We were forced to put the target aside and to deal with the challenges posed to us by the global financial crisis towards the end of that year. However, riding on the robust demand brought about by the crest of the economic recovery, we had not only achieved the milestone annual revenue target on time, but had exceeded it by 22.5%!
Once again, the unprecedented results demonstrate ASM’s resilience, seamless execution of its winning strategies and ability to continuously increase its momentum in the marketplace across the various semiconductor industry business cycles. If we had not been held back by capacity constraints, we would have turned in even stronger results last year.
In 2010, Equipment revenue was US$1.02 billion, representing 83.2% of the Group’s turnover and an increase of 117.4% over the previous year. Revenue for our lead frame business was US$206.3 million, growing by 46.7%. New order bookings amounted to a new record of US$1.46 billion, which is an increase of 90.4% as compared to the previous year. Our book-to-bill ratio, representing net bookings over billings, was 1.20. Our backlog as of 31 December 2010 was US$450.2 million. Net profits surged by 203.8% over the previous year to HK$2.84 billion.
There was strong growth in overall demand throughout the f i rst to third quarters last year. The strong momentum had taken many people by surprise. Our quarterly bookings during the second quarter last year already exceeded US$500 million! For quite some time last year, there had been debate about whether the strong demand was sustainable, whether it only represented the pent-up demand following the economic crisis or whether it was a reflection of a structural change in the level of demand for electronic products. Benefiting from a diversified customer base, we were able to feel the pulse of the market. We quickly recognized the opportunity brought about by both the strong growth of the LED market and the robust demand for consumer electronic products, probably driven by new demand from the emerging economies. We decided to set up our third manufacturing plant in Huizhou, China. Determined to capitalize on the opportunity, we raised our capital expenditure budget from HK$500 million to HK$800 million last year.
Our strong belief in the overall increased demand for consumer electronic products and the excellent growth potential of the LED market served as the guiding principles for our business planning. Setting up a third manufacturing plant in Huizhou was the first task on our agenda in mid-2008, just before the arrival of the financial crisis. Our vertical integration manufactur ing model and our decis ion not to downsize our operations in the face of the financial crisis enabled ASM to respond swiftly to the market rebound starting from the second quarter of 2009. However, once our installed capacity was fully utilized, our growth in output slowed down as reflected in the fourth quarter of 2009 and the first quarter of last year. We had actually realized the problem and started to turn to subcontractors as early as the end of the third quarter of 2009. However, as outsourcing was previously not part of our business model, it took us up to the second quarter last year to reach the level of outsourcing we had desired. In the meantime, we decided to resume our plan to set up the third factory in Huizhou. Since the original buildings were not designed for our applications, it took us some time to plan for the modification and renovation. Fortunately, suppor ted by our h ighly-devoted employees, contractors and suppliers, we managed to get the plant operationally-ready in just 83 days, starting from the first day construction workers were mobilized into the site. Nevertheless, our capacity constraint before the new plant was completed still caused us to concede some ground to the competition last year.

15
ASM Pacific Technology Limited Annual Report 2010

16
MANAGEMENT DISCUSSION AND ANALYSIS (CONTINUED)
Invest for further growth ASM raised its CAPEX budget for 2011 to HK$1 billion to expand its production capacity further.
OVERVIEW (Continued)We are not concerned about the softening in demand in the fourth quarter last year, which is typically a seasonally low period. During the first nine months of last year, we had already received record bookings of US$1.28 billion. By the fourth quarter of last year, most customers had already consumed their capital expenditure (“capex”) budgets for 2010. Even so, new order bookings for the fourth quarter of 2010 still amounted to US$179.3 million, which was in fact higher than what we had anticipated. There is no doubt that the fourth quarter of 2010 was a relative weak quarter in terms of bookings as compared to the exuberant quarters which preceded it. On the other hand, it is interesting to note that the level of bookings in the fourth quarter of 2010 was actually comparable to the booking levels in the strong quarters which prevailed prior to the f inancial crisis of 2008. It probably confirms our belief that there is a structural change in demand for our products, especially for our assembly and packaging equipment. We believe that the higher level of demand may be led by new sources of consumer demand for electronic products, especially new demand that is coming from the emerging economies, and demand for popular consumer products which utilize LED devices.
We expect that bookings for our products will pick up again once our customers’ new capex budgets for 2011 are available. In fact, most customers had indicated to us that their capex budgets for 2011 wil l be similar to that of 2010. By now, it seems that there is already a general consensus that the extraordinary high level of demands seen in 2010 will be sustainable, at least for 2011.
In the LED sector , there appears to be some oversupply of LED products at present, but we believe that such oversupply should be a short-term situation. The LED market will proceed to grow again after inventory adjustment. The LED market continues
to present excellent growth potential. Besides LED Back-Lighting units, LED general lighting will be an additional driver to propel growth.
The reduction of our order backlog during the fourth quarter was actually good for ASM, as it enabled us to bring our lead-times back to more acceptable levels. Otherwise we would continue to be at risk of losing orders to the competition just because of our inability to meet the lead-times required by our customers when faced with heavy demand.
The enduring success of the company owes much to its diversified customer base. In 2010, our top 5 customers accounted for only 16.2% of our total revenue. The growing acceptance of the Group’s products by a larger pool of customers has built a highly stable revenue base on which we have thrived. This is further complemented by our wide product range which is highly diversified, and enables us to offer a broad range of assembly and packaging solutions for the different groups of customers that we serve. Such diversity demands that we deliver a good sales and support network and accompanying infrastructure to provide a high level of service to customers, and we have consistently risen to the challenge.
Apart f rom our divers i f ied customer base and wide product range, our strength also lies in our geographical diversification. China, Taiwan, Malaysia, South Korea and Japan are the greatest contributors to our revenue. China remains our largest market, and is still experiencing further growth.
As a result of our efforts as well as market factors, our gross margins have significantly improved due to the increase in our sales levels and our successful ongoing cost reduction efforts.
We believe in the concept of making strategic changes while our core business is still performing strongly. Therefore, the opportunity to acquire the SEAS business from Siemens AG is timely. We consider that the SMT industry is a natural field of expansion for the Group and an area to achieve significant synergies given that it has similar engineering, technical and production process characteristics as compared to the semiconductor equipment industry. Moreover, it is apparent that the SMT industry is in the midst of a strong cyclical recovery with solid long-term growth prospects.

17
ASM Pacific Technology Limited Annual Report 2010

18
MANAGEMENT DISCUSSION AND ANALYSIS (CONTINUED)
Additional growth engine The SMT equipment business offers huge growth potential to ASM for both revenue and profit.
OVERVIEW (Continued)The acquisition of the SEAS business is an attractive entry point into the SMT industry given its leading position, advanced research and development and technological capabilities, experienced management, brand awareness with customers and comprehensive global sales footprint. We intend to realize significant synergies from the enlarged Group by adopting a variety of measures. We aim at achieving aggressive reduction of direct materials costs by leveraging on our larger purchasing power, by shifting the supplier base from Europe to Asia and by moving from out-sourcing to in-sourcing from our manufacturing plants in China over time. The SMT business unit may further exploit revenue opportunities in the Asian region by drawing on our deep knowledge and established position in the Asian markets. It can further increase its revenue base by horizontally expanding its product portfolio. Additionally, product development is an area where there are many possible synergies in the enlarged Group.
We expect the newly-acquired SMT business to become an additional growth engine for ASM and that it will make a material and significant contribution to ASM’s profitability in the future. With the current market conditions and the successful turnaround of the SEAS business in 2010, we now expect it to make an immediate contribution to our bottom line starting from this year, although it may be at a lower level initially. We are currently putting in place plans to bring the profitability of the SMT business to a comparable level to ASM’s norms.
I t appears tha t the SMT equ ipment market is somewhat similar to the semiconductor assembly and packaging equipment market. After a few quarters of robust growth, demand did come down during the second half of 2010. However, it seems that the SMT equipment market is also settling at a relatively high level compared to the pre-crisis period. We are confident that with the SMT equipment business, ASM will continue to report strong year-on-year revenue growth this year. In the new era of growth, ASM will
continue to deliver outstanding growth and returns to our shareholders.
MARKET AND PRODUCT DEVELOPMENT Equipment DivisionLast year, our equipment revenue was US$1,018.3 million, representing 83.2% of the Group’s turnover and a surge of 117.4% as compared to the previous year. This is unprecedented in the semiconductor assembly and packaging equipment industry. ASM retained the number one position in the assembly and packaging equipment industry, keeping the premier posit ion i t has held since 2002. We have again widened the revenue gap between us and our closest rival from US$212 million in 2009 to US$305 million in 2010, representing a commanding lead of 42.8%. We note that the gap would have been even greater if we had not been hampered by our capacity constraints which prevented us from accepting all the orders that our customers intended to place with ASM during our busiest periods. That issue has now been addressed with the new capacity which has been made available through the expansion activities we have recently undertaken.
We achieved quarterly billings of US$288.7 million for our equipment during the last quarter of 2010, which were an increase of 60.4% from a year ago and a slight decrease of 0.5% as compared to the preceding quarter. The high level of equipment shipment in the last quarter strengthened our view that demand for semiconductor devices has reached a new level.
Our die bonders and wire bonders were our leading products last year. ASM maintains its position as the world’s top supplier of die bonders and die handling equipment. Our portfolio encompasses a wide range of die bonder models to address the diverse needs of our customers in many different applications such as IC, discrete, power and LED. We are recognized for providing solutions for handling different die sizes, and we are also known for the versatility of our die bonders. Our die bonders can be utilized for many different applications and they assist our customers tremendously to enhance their productivity. Last year, we introduced the AD838, an 8-inch wafer die bonder and the AD8312, a 12-inch wafer die bonder, as successors to the very successful and popular AD830 die bonder. They combine our advanced in-house developed linear motor technology and our knowledge and expertise in handling dies of different sizes. Both models were very well received by the market and clearly surpasses their competitors in both throughput and cost effectiveness. They have both instantly become important revenue generators for ASM.

19
ASM Pacific Technology Limited Annual Report 2010

20
MANAGEMENT DISCUSSION AND ANALYSIS (CONTINUED)
Forging a new era Propelled by multiple growth engines, ASM embarks on a new journey of growth.
MARKET AND PRODUCT DEVELOPMENT (Continued)Equipment Division (Continued)ASM continues to be one of the leaders in wire bonding technology. Our gold wire bonder, the Eagle XtremeTM, is capable of cutting-edge 30μm fine pitch bonding. Our dual head gold wire bonder based on the Eagle XtremeTM platform is unique and unparalleled in its cost-effectiveness, and is an excellent example of the success of our Blue Ocean Strategy. We also hold a leadership position in copper wire bonding technology. This is an area where customers driven by the need to reduce cost and to enhance electrical performance for dies with very small line widths have increasingly been turning to us to provide them with suitable solutions. Recognizing that there is usually a reduction of throughput when customers switch from gold wire bonding to copper wire bonding, ASM is actively pursuing solutions to bridge the gap. This year, we will be introducing to the market a very advanced copper wire bonding technology that will serve to close the throughput gap between gold wire bonding and copper wire bonding.
Our heavy aluminum wire bonder is one of the key products that we will be launching this year. We expect that there will be a strong demand for such wire bonders in the production of power drivers and power management electronic devices due to the booming demand for electric cars and the drive for “green” products.
The strong demand in the LED backlight and general lighting industries is met by our wide range of LED products, including LED sorters and test handlers. In order to further tap into this growth market, we intend to develop and to supply LED lead frames and laser saws for LED wafers to LED manufacturers.
Our Encapsulat ion Solut ions Group (ESG) has continued to make further advancements. ASM
is now the choice of many key customers for its superior molding technology, such as Pinnacle Gating System (PGS), high density lead frame molding and Package-on-Package (PoP) molding, which are especially suitable for the development of advanced new packages. These advanced capabilities have helped ASM gain entry to a number of new accounts, including the world’s top semiconductor assembly and packaging companies. The ESG group has made significant progress in compression molding technology with the IDEALcompressTM which is applicable in areas such as wafer level packages, high brightness LED and other optical devices. This year the group wil l introduce to the market the latest IDEALmold 3G platform which combines traditional transfer molding and the latest compression molding technology in one system. The group has also delivered solutions for the packaging of high concentration solar cells, a cutting edge technology in solar cell manufacturing. Even our competitors have recognized the strong performance of our ESG group, as demonstrated by the growth and gain in market share of our ESG group in the past few years at the expense of our competitors.
The Back End Product (BEP) bus iness un i t is an amalgamation of our encapsulation and post encapsulation equipment operations, such as our encapsulation systems, ball placement, package singulation and test handler equipment groups. The BEP business unit has kept up its good performance last year, and remains well-positioned to further contribute to our revenue streams.
Lead Frame DivisionOur lead frames revenue in 2010 was US$206.3 mi l l ion, which is an improvement of 46.7% as compared to 2009. To sat isfy strong customer demand, we expanded our capacity for both stamped and etched lead frames last year. We increased our factory floor space in Fuyong, China by 33% which was shared between the stamped lead frame operations and the BEP operations. Addit ional stamping machines and plating lines were installed. In Singapore, we installed a second reel-to-reel etching line which increased our etching capacity by more than 20%. All the new capacities were ready by the beginning of the fourth quarter last year, which allowed ASM to bring the lead-time back to normal levels. The promising growth that we witnessed, especially in China, has necessitated the addition of further capacity by establishing another etching plant in Fuyong. We target it to be operationally-ready by the third quarter of this year.

21
ASM Pacific Technology Limited Annual Report 2010

22
MANAGEMENT DISCUSSION AND ANALYSIS (CONTINUED)
MARKET AND PRODUCT DEVELOPMENT (Continued)Lead Frame Division (Continued)Lead frame revenue in the fourth quarter increased by 11.0% from the same quarter last year to US$51.5 million and decreased by 12.4% from the preceding quarter. Lead frame revenue contributed to about 15.1% of the Group’s turnover. The reduction of lead frame revenue during the last quarter reflected both the contraction of the market and the lead frame inventory build-up experienced by our customers during the preceding quarter in anticipation of the shortage of lead frame supplies. Nevertheless, the 11% year-on-year growth once again confirmed our view that market activities were actually at a higher level during this relatively weak quarter as compared to the strong quarters before the financial crisis.
The profit margins for our lead frame business were somewhat negatively impacted by the higher metal prices last year, particularly for copper, gold, silver and palladium. However, we were able to partially offset such increases in raw material costs through the strong demand and by raising our productivity levels. We are now also working with various customers to change the pricing formula for lead frames to incorporate the prices of copper and the various precious metals used in the production of lead frames.
ASM’s high-density open-tool lead frame solutions continue to offer good value propositions to our customers. Offering such open-tool lead frame solutions has not only helped the Company penetrate new accounts but has in turn created business opportunities for our related equipment.
We have been very successful in the development of MSL 1 (moisture sensitivity level 1) lead frames to meet the growing demand from customers. Tests carried out both in-house and by our customers confirm that our brown oxide treatment solution offers the best results in the market. Last year we expanded our capacity for brown oxide treatment. While we are offering our Micro-etching technology (ME1) to customers as an excellent MSL 1 solution for pre-plated lead frames (PPF), we have developed an even more advanced ME2 technology. The ME2 technology is very well received by the market. This year, we will ramp up our capacity to satisfy the growing customer demand.
ASM has introduced its new packaging concept, the DreamPakTM, to address customers’ need for high
I/O QFN. This solution combines ASM’s expertise and know how in lead frames, molding technology, package development and assembly processes. It demonstrates ASM’s understanding of customers’ needs and its innovative solutions to satisfy those needs. We are also developing new lead frames for LED products. This year we will ramp up our production of selectively silver-plated QFN lead frames. Last year, we had already completed the installation of all related production equipment.
FINANCIALWe cont inue to streamline our working capital management to deal with a wide range of products and high production run rates. Last year, we achieved an inventory turnover of 7.2 times (2009: 5.0 times), with an ending inventory of HK$1,624 million to deal with the increased demand for our products. Although capital investments amounting to HK$858 million were made in 2010, our sound working capital management resulted in a free cash flow of HK$1,618 million (2009: HK$886 million) and a return on invested capital of 121.9% (2009: 40.8%). Receivables have been tightly monitored, resulting in 72.7 days sales outstanding. So far our bad debt exposure, if any, is immaterial and well-covered by provisions made in conformity with ASM’s policy. There was a cash conversion cycle of 106.7 days. Cash on hand as of 31 December 2010 was HK$2,055 million (2009: HK$1,254 million).
With no bank borrowing either for the short or long term, ASM achieved an all bank debt to equity ratio of zero and no gearing for the Group, essentially the same situation as during the past years. With rigorous control over our current assets and liabilities, the current ratio stood comfortably at 2.41. The Group’s shareholders’ funds increased by about 50.7% to HK$5,140 million as of 31 December 2010 (2009: HK$3,410 million).
ASM’s strong financial position is the result of our consistently profitable and cash-generating business performance in past years, as well as our conservative fiscal policy, prudent investment planning and strict working capital management. With continual positive cash generation from our on-going operations, we aim to maintain our policy of operating the Group with the optimum shareholder funds and returning any excessive cash holdings to our shareholders.
23
ASM Pacific Technology Limited Annual Report 2010
CAPACITY AND PLANT DEVELOPMENTThe acquisition of the SEAS business has expanded our addressable market but also introduces increased challenges in dealing with a more diverse product mix, diverse geographical locations and an expanded supply chain. In anticipation of further growth, and to ensure that we are in a strong position to capitalize on future opportunities, we are actively expanding our production capacity for both equipment and lead frames.
We are mindful that despite our record business turnover during the year, we had nevertheless not been able to fully take advantage of the rocketing demand due to our capacity constraints during that period. We are gearing ourselves to once again gain additional market share, and we can do so by improving our long-term cost advantages and by enhancing our technological leadership.
The second phase of expansion of our new factory in Huizhou, China is on-going. We will add a casting center and a fabrication center. With the new casting center, we can upgrade our casting technology and increase the portion of castings which are supplied internally. The new fabrication center will provide room for the further expansion of both our assembly and SMT equipment businesses. The expansion is scheduled to be completed by the beginning of 2012. In conjunction with the increase of our internal capacity, we will also source for and engage more external subcontractors where practical to complement our in-house manufacturing activities.
In order to take advantage of the high level of demand for Quad Flat No-lead (“QFN”) packages, we intend to expand our current capacity for manufacturing etched lead frames. QFN packages are commonly used in mobile phones and other portable devices which are now very popular amongst consumers. In addition to our Singapore factory which is now conducting the etching of lead frames, we will set up new etching lines in our factory in Fuyong, China to add to our production capacity for etched lead frames. It is targeted to be ready by the third quarter of this year.
We wil l also al locate more resources to further upgrade our IT infrastructure, and we expect that this will contribute positively to improving our efficiency. More resources will also be put into further enhancing our R&D capability.
Addit ional ly , we plan to expand our factory in Singapore so that we can integrate our SMT facilities in Singapore under one roof.
This year, our capital expenditure budget will be HK$1,023 million, which is higher than in 2010. It will be fully funded by our depreciation this year and internal resources.
RESEARCH AND DEVELOPMENTASM’s long term commitment in R&D has become one of our competitive advantages, and will be a major factor to support the future growth of the company. With our continued investment in R&D, we will further widen our technology leadership over our peers.
We are satisfied with the progress made by our new R&D center in Chengdu, China, which has strengthened our R&D capability. Construction of a new R&D building in Chengdu will be completed later this year. With the expansion, the Chengdu R&D operations will be well-placed to support all the different business units of the Group, including the SMT business unit.
A fourth R&D centre has been added in Munich, Germany as a result of the acquisition of the SMT business. Both the R&D centers in Munich and Singapore for the SMT equipment business will be expanded to develop solutions to address market segments that have not been addressed by us so far and to expand our product portfolio in the SMT equipment market horizontally. We consider these to be important strategies to increase our market share and revenue.
We believe that with the aforesaid increase in R&D resources, ASM’s long-term strategic positioning as the leader of the assembly and packaging equipment business, as wel l as a leading supplier of SMT equipment, would be significantly strengthened. ASM will be in a unique position to capture the market trend of convergence of chip packaging and SMT processes.
ASM’s strategy over the years has been to deliver the best value propositions to our customers. We believe in investing substantially in R&D to implement this strategy. Thus, we have maintained our long-standing policy of spending 10% of our equipment turnover on R&D while ignoring short-term sales fluctuations. This has been very important to enable us to widen our product portfolio to supply diversified market segments.
Our current research and development teams based in Hong Kong, Singapore, Chengdu and Munich consist of around 1,000 people with close to 64% of them having a Master or PhD degree. Our net R&D expenditure increased by 41.1% to HK$434 million (2009: HK$307 million), not including the R&D expenses of the SMT business unit, representing 5.5% of our equipment sales and in line with our R&D funding guidelines.
24
DIRECTORS’ REPORT
The Directors present their annual report and the audited consolidated financial statements of the Company and its subsidiaries (hereinafter collectively referred to as the “Group”) for the year ended 31 December 2010.
PRINCIPAL ACTIVITIESThe Company acts as an investment holding company. Its principal subsidiaries are engaged in the design, manufacture and marketing of machines, tools and materials used in the semiconductor industry.
RESULTS AND APPROPRIATIONSThe Directors recommend the payment of a final dividend of HK$2.10 (2009: Final dividend of HK$1.20) per share and a special dividend of HK$1.10 (2009: second special dividend of HK$0.40) per share which, together with the interim dividend of HK$1.60 (2009: Interim dividend of HK$0.20 and a first special dividend of HK$0.40) per share paid during the year, makes a total dividend for the year of HK$4.80 (2009: HK$2.20) per share.
Details of the results of the Group are set out in the consolidated statement of comprehensive income on page 42.
PROPERTY, PLANT AND EQUIPMENTDuring the year, the Group continued to expand its manufacturing facilities. The Group acquired plant and machinery for HK$658,727,000.
Details of these and other movements in the property, plant and equipment of the Group during the year are set out in note 19 to the consolidated financial statements.
SUBSIDIARIESDetails of the Company’s principal subsidiaries at 31 December 2010 are set out in note 33 to the consolidated financial statements.
SHARE CAPITALOn 15 December 2010, 1,726,900 shares were issued at par to certain employees pursuant to their entitlements under the Company’s Employee Share Incentive Scheme.
During the year, neither the Company nor any of its subsidiaries purchased, sold or redeemed any of the Company’s listed securities.
DISTRIBUTABLE RESERVES OF THE COMPANYThe Company’s reserves available for distribution to shareholders, calculated in accordance with Hong Kong Financial Reporting Standards issued by the Hong Kong Institute of Certified Public Accountants, as at 31 December 2010 amounted to HK$2,091,361,000 (2009: HK$1,492,197,000). In accordance with the Company’s Articles of Association, dividends can only be distributed out of profits of the Company.

25
ASM Pacific Technology Limited Annual Report 2010
DIRECTORSThe Directors of the Company during the year and up to the date of this report were:
Executive Directors:
Arthur H. del Prado, ChairmanLo Tsan Yin, Peter, Vice ChairmanLee Wai Kwong, Chief Executive OfficerChow Chuen, James, Chief Operating OfficerTang Koon Hung, Eric, Chief Financial Officer (resigned on 1 February 2010)
Non-executive Directors:
Charles Dean del Prado (appointed on 29 April 2010)Petrus Antonius Maria van Bommel (appointed on 29 October 2010)Robert A. Ruijter (resigned as Non-executive Director on 29 October 2010
and appointed as Alternate Director to Charles Dean del Prado and Petrus Antonius Maria van Bommel for the period from 29 October 2010 to 11 February 2011)
Independent Non-executive Directors:
Orasa LivasiriLee Shiu Hung, RobertLok Kam Chong, John
In accordance with Articles 113 and 114 of the Company’s Articles of Association, Arthur H. del Prado, Lee Wai Kwong and Chow Chuen, James will retire and, being eligible, will offer themselves for re-election at the forthcoming annual general meeting.
The biographical details of the Directors during the year and up to the date of this report are set out below:
Arthur H. del Prado, aged 79, is the Chairman of the Company and founder of ASM International N.V. (“ASM International”), the ultimate holding company of the Company. Mr. del Prado currently serves on the Board of several companies, civic and non profit organisations, among which the MEDEA+ Board, the “Micro Electronics Development for European Applications” project. Mr. del Prado was formerly a member of the Board of Directors of: Océ van der Grinten Nederland N.V., Manufacturer of Copiers and Printers; G.T.I. Holding N.V., an Electronic Equipment and Installations company; Delft Instruments N.V., a Manufacturer of High-Technology Industrial and Defence Products; Breevast N.V., Project Development and Management; Dujat, Dutch & Japanese Trade Federation and ABN-AMRO Bank, Advisory Counsel.
Lo Tsan Yin, Peter, aged 62, was appointed to the Board as the Vice Chairman of the Company on 1 January 2007. He has a Bachelor of Science degree in Electronics Engineering from the University of Southampton, England. Mr. Lo joined the Group in 1980. He has over 30 years of experience in the computer and semiconductor industry.

26
DIRECTORS’ REPORT(CONTINUED)
DIRECTORS (Continued)Lee Wai Kwong, aged 56, was appointed to the Board as the Chief Executive Officer on 1 January 2007. He has a Bachelor of Science degree and a Master of Philosophy degree from The Chinese University of Hong Kong, Hong Kong; both degrees are in Electronics. He also has a Masters degree in Business Administration from the National University of Singapore, Singapore. Mr. Lee joined the Group in 1980. He has over 30 years of working experience in the semiconductor industry. Mr. Lee served as a member of the Management Board of ASM International from 1 January 2007 to 31 December 2010.
Chow Chuen, James, aged 54, was appointed to the Board as the Chief Operating Officer of the Company on 1 January 2007. He has a Bachelor of Science degree in Electrical Engineering from the University of Hong Kong and a Master of Science degree in Manufacturing System Engineering from the University of Warwick, England. Mr. Chow joined the Group in 1982. He has over 25 years of working experience in the electronics and semiconductor industry.
Tang Koon Hung, Eric, aged 65, was re-designated as an Executive Director and was appointed as the Chief Financial Officer of the Company on 1 February 2007. Mr. Tang was qualified as a Chartered Accountant in Canada and he is also a member of the Hong Kong Institute of Certified Public Accountants. He has worked in the fields of manufacturing, banking, and public utilities with some major corporations both in Canada and in Hong Kong. Graduated from the University of Toronto, Canada, Mr. Tang holds a Bachelor degree in Industrial Engineering and a Masters degree in Business Administration. Mr. Tang retired on completion of his three years contract with the Company on 1 February 2010.
Robert A. Ruijter, aged 59, was appointed as the Non-executive Director of the Company on 30 October 2009. He is a Dutch national and retired as Chief Financial Officer and Executive Director of The Nielsen Company, a US-based global information and media group, in October 2007. He has also served as Chief Financial Officer in several international businesses including VNU, the media information and publishing group, and KLM, the Dutch national airline. He holds non-executive board positions at Wavin N.V. and Unit 4 Agresso N.V.. He is also a member of the Audit Committee of Wavin N.V. and the chairman of the Audit Committee of Unit 4 Agresso N.V.. Mr. Ruijter became the Interim Chief Financial Officer of ASM International in May 2009 and has been a non-statutory member of the Management Board of ASM International since May 2009. Mr. Ruijter retired as Chief Financial Officer of ASM International on 1 September 2010 and resigned as Non-executive Director of the Company on 29 October 2010. He was appointed as Alternate Director to Mr. Charles Dean del Prado and Mr. Petrus Antonius Maria van Bommel for the period from 29 October 2010 to 11 February 2011.
Charles Dean del Prado (He is also known as “Mr. Chuck del Prado”), aged 49, was appointed as the Non-executive Director of the Company on 29 April 2010. He is a member of the Management Board of ASM International since 2006. He assumed the position of Chief Executive Officer (CEO) of ASM International on 1 March 2008. As CEO, Mr. Charles Dean del Prado oversees the operations of the worldwide organization from the company headquarters in Almere, the Netherlands. Mr. Charles Dean del Prado is the son of Mr. Arthur H. del Prado, the Chairman of the Company. During his twenty-year career, Mr. Charles Dean del Prado has had worldwide experience in sales, marketing, manufacturing, and customer service of high technology computer and semiconductor products. From 2003 to 2008, he served as President and General Manager of ASM America, responsible for the R&D, sales, manufacturing, and service of the Epitaxy and TCP product lines, which include high-k and atomic layer CVD deposition. He also directed sales and service of ASM International’s Front-end product lines to all US customers. Previously, Mr. Charles Dean del Prado served as Director of Marketing, Sales & Service of ASM Europe. Prior to joining ASM International in 2001, Mr. Charles Dean del Prado spent five years at ASML in Taiwan and the Netherlands managing wafer stepper manufacturing and customer program management. From 1988-1996, Mr. Charles Dean del Prado had assignments in sales and global account management at IBM Nederland N.V.. Mr. Charles Dean del Prado received a Master of Science degree in Industrial Engineering and Technology Management from the University of Twente in the Netherlands.

27
ASM Pacific Technology Limited Annual Report 2010
DIRECTORS (Continued)Petrus Antonius Maria van Bommel, aged 54, was appointed as the Non-executive Director of the Company on 29 October 2010. He is the Chief Financial Officer of ASM International. He was appointed as a member of the Management Board of ASM International in May 2010 for a period of 4 years. He holds a Master’s degree in economics from the Erasmus University, Rotterdam, the Netherlands. He has more than twenty years experience in the electronics and semiconductor industry. He spent most of his career at Philips, which he joined in 1979. From the mid-1990s until 2005, Mr. Petrus Antonius Maria van Bommel acted as Chief Financial Officer of several business units of the Philips group. Between 2006 and 2008, he was Chief Financial Officer at NXP (formerly Philips Semiconductors) and was Chief Financial Officer of Odersun AG, a manufacturer of thin-film solar cells and modules, from January 2009 until 31 August 2010. During the period from March 2006 to September 2008, Mr. Petrus Antonius Maria van Bommel served as a Non-executive Director of Advanced Semiconductor Manufacturing Corporation Limited (“ASMC”), a company incorporated in the People’s Republic of China and listed on The Stock Exchange of Hong Kong Limited. From January 2007 to September 2008, he was also a Vice Chairman of the Board of Directors of ASMC.
Orasa Livasiri, Independent Non-executive Director, aged 55, was appointed to the Board as an Independent Non-executive Director in 1994. She is a solicitor in private practice and is a partner of Messrs. Ng, Lie, Lai & Chan.
Lee Shiu Hung, Robert, Independent Non-executive Director, aged 78, was appointed to the Board on 23 December 2004. Mr. Lee is a Certified Public Accountant with over 40 years of practical experience in auditing, accounting and finance, taxation and general management. He was engaged in public accounting practice in the name of Robert S.H. Lee & Co., Certified Public Accountants, since 1984 until his retirement in 2000. Mr. Lee previously held senior executive positions in multinational groups, including Jardine Matheson & Co. Limited and Hutchison International Limited. He was a President of the Society of Chinese Accountants & Auditors, Hong Kong in 1983/84 and a President of the Australian Society of Certified Practicing Accountants (CPA Australia) Hong Kong Branch in 1986/87. He is a fellow member of the Hong Kong Institute of Certified Public Accountants, CPA Australia; the Institute of Chartered Secretaries and Administrators and The Hong Kong Institute of Chartered Secretaries. He is a member of the Advisory Board of the Society of Chinese Accountants & Auditors, Hong Kong.
Lok Kam Chong, John, Independent Non-executive Director, aged 48, was appointed to the Board as an Independent Non-executive Director on 9 March 2007. Mr. Lok is a fellow member of the Hong Kong Institute of Certified Public Accountants and the Association of Chartered Certified Accountants. He has 20 years of experience in financial management and corporate controllership. Mr. Lok started his career as an auditor in an international accounting firm and then moved to work for some major financial information companies, including Moneyline Telerate (Hong Kong) Ltd. and Dow Jones Telerate. He is currently a director of Oriental Link CPA Limited. Mr. Lok holds Dual Degrees in Master in Business Administration and Master of Science in Information Technology from The Hong Kong University of Science and Technology.

28
DIRECTORS’ REPORT(CONTINUED)
SENIOR MANAGEMENTThe Group’s senior management team includes, other than the Executive Directors, Mr. Wong Yam Mo, the Chief Technical Officer of the Group, and Mr. Ng Cher Tat, Robin, who was appointed as the Chief Financial Officer of the Group with effect from 1 February 2010. Their biographical information is as follows:
Wong Yam Mo, aged 51, is the Chief Technical Officer of the Group. He has a Bachelor of Science degree in Mechanical Engineering and a Master degree in Industrial Engineering, both from the University of Hong Kong, Hong Kong. He also holds a Master degree in Precision Engineering from Nanyang Technological University, Singapore. Mr. Wong joined the Group in 1983.
Ng Cher Tat, Robin, aged 47, was appointed as the Chief Financial Officer of the Group. Mr. Ng holds an accountancy degree from the National University of Singapore and a Master of Laws (Commercial Law) from the University of Derby. Mr. Ng is also a Fellow Certified Public Accountant of Singapore who has acquired more than 20 years of working experience in finance, audit and accounting.
EMPLOYEE SHARE INCENTIVE SCHEMEThe Group has an Employee Share Incentive Scheme (the “Scheme”) which is for the benefit of the Group’s employees and members of management and has a life of 10 years starting from March 1990. On 25 June 1999, at an extraordinary general meeting of the Company, the shareholders approved to extend the period of the Scheme for a further term of 10 years up to 23 March 2010 and allow up to 5% of the issued share capital of the Company from time to time, excluding any shares of the Company subscribed for or purchased pursuant to the Scheme since 23 March 1990, to be subscribed for or purchased pursuant to the Scheme during the extended period.
At the annual general meeting of the Company held on 24 April 2009, the shareholders approved to extend the period of the Scheme for a term of a further 10 years up to 23 March 2020 and allow up to 7.5% of the issued share capital of the Company from time to time (excluding any shares subscribed for or purchased pursuant to the Scheme since 23 March 1990) to be subscribed for or purchased pursuant to the Scheme during the extended period and that no more than 3.5% of the issued share capital of the Company from time to time (excluding any shares subscribed for or purchased pursuant to the Scheme since 23 March 1990) to be subscribed for or purchased pursuant to the Scheme for the period from 24 March 2010 to 23 March 2015.
On 2 March 2010, the Directors resolved that the Company should contribute HK$174,710 to the Scheme, enabling the trustees of the Scheme to subscribe for a total of 1,747,100 shares in the Company for the benefit of employees and members of the management of the Group in respect of their services for the year ended 31 December 2009 upon expiration of the defined qualification period. 284,000 of these shares entitlements were allocated to certain Directors of the Company.
29
ASM Pacific Technology Limited Annual Report 2010
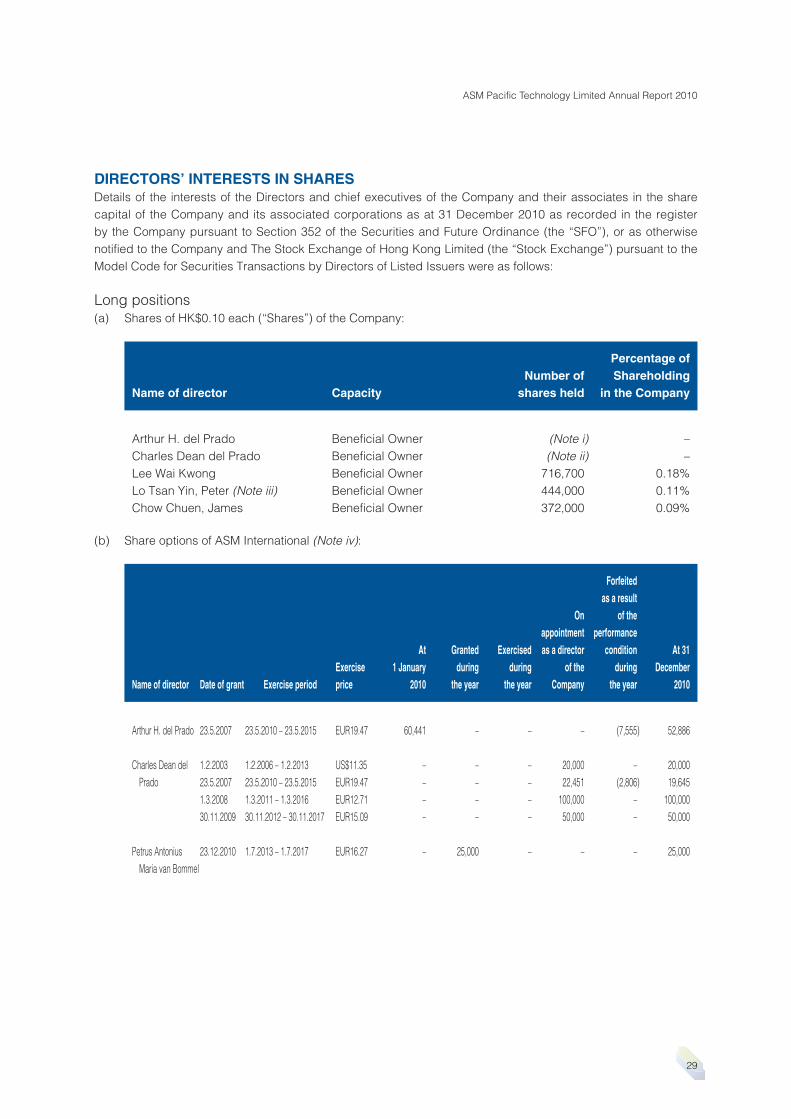
DIRECTORS’ INTERESTS IN SHARESDetails of the interests of the Directors and chief executives of the Company and their associates in the share capital of the Company and its associated corporations as at 31 December 2010 as recorded in the register by the Company pursuant to Section 352 of the Securities and Future Ordinance (the “SFO”), or as otherwise notified to the Company and The Stock Exchange of Hong Kong Limited (the “Stock Exchange”) pursuant to the Model Code for Securities Transactions by Directors of Listed Issuers were as follows:
Long positions(a) Shares of HK$0.10 each (“Shares”) of the Company:
Name of director CapacityNumber of
shares held
Percentage of Shareholding
in the Company
Arthur H. del Prado Beneficial Owner (Note i) –Charles Dean del Prado Beneficial Owner (Note ii) –Lee Wai Kwong Beneficial Owner 716,700 0.18%Lo Tsan Yin, Peter (Note iii) Beneficial Owner 444,000 0.11%Chow Chuen, James Beneficial Owner 372,000 0.09%
(b) Share options of ASM International (Note iv):
Name of director Date of grant Exercise period Exerciseprice
At1 January
2010
Grantedduring
the year
Exercisedduring
the year
On appointmentas a director
of the Company
Forfeitedas a result
of theperformance
conditionduring
the year
At 31December
2010
Arthur H. del Prado 23.5.2007 23.5.2010 – 23.5.2015 EUR19.47 60,441 – – – (7,555) 52,886
Charles Dean del Prado
1.2.2003 1.2.2006 – 1.2.2013 US$11.35 – – – 20,000 – 20,00023.5.2007 23.5.2010 – 23.5.2015 EUR19.47 – – – 22,451 (2,806) 19,6451.3.2008 1.3.2011 – 1.3.2016 EUR12.71 – – – 100,000 – 100,00030.11.2009 30.11.2012 – 30.11.2017 EUR15.09 – – – 50,000 – 50,000
Petrus Antonius Maria van Bommel
23.12.2010 1.7.2013 – 1.7.2017 EUR16.27 – 25,000 – – – 25,000

30
DIRECTORS’ REPORT(CONTINUED)
DIRECTORS’ INTERESTS IN SHARES (Continued)Long positions (Continued)Notes:
(i) As at 31 December 2010, Arthur H. del Prado, as well as a Dutch private liability company and a foundation both controlled by him, altogether held about 21.43% of the share capital of ASM International, represented by 11,342,878 common shares. ASM International through its wholly-owned subsidiary, ASM Pacific Holding B.V., is a controlling shareholder of the Company, holding 207,427,500 shares which is approximately 52.36% of the entire share capital of the Company. ASM International also holds the fixed-rate participating shares of ASM Assembly Automation Limited, ASM Assembly Materials Limited and ASM Asia Limited which are wholly-owned subsidiaries of the Company. These shares carry no voting rights, no rights to participate in a distribution of profits, and very limited rights on a return of capital.
(ii) Mr. Charles Dean del Prado and his spouse directly held 134,317 common shares in ASM International, together with his interest of 713,000 common shares in ASM International held through a foundation controlled by Mr. Arthur H. del Prado, he is deemed to be interested in an aggregate of 847,317 common shares in ASM International, representing 1.6% shareholding in the issued share capital in ASM International.
(iii) As at 31 December 2010, Mr. Lo beneficially owned 2,500 shares of ASM International (representing 0.0047% shareholding in the issued share capital in ASM International).
(iv) Details of the share option schemes of ASM International are set out in note 31 to the consolidated financial statements.
Save as disclosed above and other than certain nominee shares in subsidiaries held by the Directors in trust for the Company or its subsidiaries, as at 31 December 2010, none of the Directors or chief executives of the Company nor their associates had any interest or short positions in the shares, underlying shares or debentures of the Company or any of its associated corporations.
DIRECTORS’ RIGHTS TO ACQUIRE SHARES OR DEBENTURESOther than those rights described under the section headed “Employee Share Incentive Scheme” and the share options of ASM International disclosed above, none of the Directors or chief executives or their spouses or children under the age of 18 had any right to subscribe for shares of the Company, or had exercised any such right during the year; and at no time during the year was the Company, any of its holding companies, fellow subsidiaries or subsidiaries a party to any arrangements to enable the Directors of the Company to acquire benefits by means of the acquisition of shares in, or debentures of, the Company or any other body corporate.

31
ASM Pacific Technology Limited Annual Report 2010
SUBSTANTIAL SHAREHOLDERSAs at 31 December 2010, the following persons (other than the interests disclosed above in respect of Directors or chief executives of the Company) had interests in the share capital of the Company as recorded in the register required to be kept by the Company under Section 336 of the SFO:
Long positions Lending pool
Name of shareholder CapacityNumber of
shares held
Percentage of Shareholding
in the CompanyNumber of
shares held
Percentage of Shareholding
in the Company
ASM International Interest of a controlled corporation
207,427,500 52.36% – –
ASM Pacific Holding B.V. Beneficial owner 207,427,500 52.36% – –
Aberdeen Asset Management Plc and its associates on behalf of accounts managed by Aberdeen Asset Management Plc and its associates
Investment manager
39,565,420 9.99% – –
Save as disclosed above, as at 31 December 2010, according to the register of interests required to be kept by the Company under Section 336 of the SFO, there was no other person who had any interests or short positions in the shares or underlying shares of the Company.
DIRECTORS’ INTERESTS IN CONTRACTS AND CONNECTED TRANSACTIONSDuring the year, the Group entered into a transaction with the ASM International, details of which are set out in note 32 to the consolidated financial statements.
The Independent Non-executive Directors of the Company confirmed that the connected transactions have been entered into by the Group in the ordinary and usual course of business, on normal commercial terms, and in accordance with the terms of the agreement governing such transactions that are fair and reasonable and in the interests of the shareholders of the Company as a whole.
Arthur H. del Prado, Charles Dean del Prado and Lo Tsan Yin, Peter have an interest in ASM International as disclosed in the section headed “Directors’ interests in shares” above.
Save as disclosed above, no contracts of significance to which the Company, any of its holding companies, fellow subsidiaries or subsidiaries was a party and in which a Director of the Company had a material interest, whether directly or indirectly, subsisted at the end of the year or at any time during the year.

32
DIRECTORS’ REPORT(CONTINUED)
DIRECTORS’ SERVICE CONTRACTSNo Director of the Company has a service contract with any company in the Group which is not determinable by the Group within one year without payment of compensation (other than statutory compensation).
EMOLUMENT POLICYThe emolument policy of the employees of the Group is established by the management with reference to the employees’ merit, qualifications and competence.
The emoluments of the Directors and the senior management of the Company are decided by the Remuneration Committee, having regard to the Company’s operating results, individual performance and comparable market statistics.
The Company currently has an Employee Share Incentive Scheme as an incentive to Directors and eligible employees, details of which are set out in note 26 to the consolidated financial statements.
PRE-EMPTIVE RIGHTSThere are no provisions for pre-emptive rights under the Company’s Articles of Association although there are no restrictions against such rights under the laws in the Cayman Islands.
MAJOR CUSTOMERS AND SUPPLIERSThe aggregate sales attributable to the five largest customers of the Group were less than 30% of the Group’s turnover for the year under review.
The aggregate purchases attributable to the five largest suppliers of the Group were less than 30% of the Group’s purchases for the year under review.
DONATIONSDuring the year, the Group made charitable and other donations amounting to HK$1,619,000.
APPOINTMENT OF INDEPENDENT NON-EXECUTIVE DIRECTORSThe Company has received from each of the Independent Non-executive Directors an annual confirmation of the independence pursuant to Rule 3.13 of the Rules Governing the Listing of Securities on the Stock Exchange. The Company considers all of the Independent Non-executive Directors are independent.
SUFFICIENCY OF PUBLIC FLOATThe Company has maintained a sufficient public float throughout the year ended 31 December 2010.
AUDITORA resolution will be submitted to the annual general meeting to re-appoint Messrs. Deloitte Touche Tohmatsu as the auditor of the Company.
On behalf of the BoardLee Wai KwongDIRECTOR2 March 2011

33
CORPORATE GOVERNANCEREPORT
The manner in which the principles and code provisions in the Code on Corporate Governance Practices (“CG Code”) contained in Appendix 14 of the Rules Governing the Listing of Securities on The Stock Exchange of Hong Kong Limited (“Stock Exchange”) (“Listing Rules”) are applied and implemented are explained as follows:–
CORPORATE GOVERNANCE PRACTICESThe Group is committed to achieving high standards of corporate governance to safeguard the interests of shareholders and to enhance corporate value and accountability.
The Company has complied with all the code provisions set out in the CG Code throughout the year ended 31 December 2010 except for the deviations from Code Provision A.4.1 and Code Provision E.1.2 as described in this report.
The Company reviews its corporate governance practices regularly to ensure compliance with the CG Code.
THE BOARDBoard compositionThe Board of the Company comprises the following directors during the year ended 31 December 2010:
Executive Directors
Arthur H. del Prado (Chairman of the Board and Remuneration Committee)Lo Tsan Yin, Peter (Vice Chairman of the Board)Lee Wai Kwong (Chief Executive Officer)Chow Chuen, James (Chief Operating Officer)Tang Koon Hung, Eric* (Chief Financial Officer)
Non-Executive Directors
Robert A. Ruijter** (Member of Audit Committee and Alternate Director to Charles Dean del Prado and Petrus Antonius Maria van Bommel)Charles Dean del Prado***Petrus Antonius Maria van Bommel**** (Member of Audit Committee)
Independent Non-Executive Directors
Orasa Livasiri (Chairman of Audit Committee and Member of Remuneration Committee)Lee Shiu Hung, Robert (Member of Audit Committee and Remuneration Committee)Lok Kam Chong, John (Member of Audit Committee and Remuneration Committee)
* Mr. Tang Koon Hung, Eric resigned as Chief Financial Officer and Executive Director with effect from 1 February 2010.** Mr. Robert A. Ruijter resigned as Non-Executive Director and Member of Audit Committee with effect from 29 October
2010 and was appointed as Alternate Director to Mr. Charles Dean del Prado and Mr. Petrus Antonius Maria van Bommel for the period from 29 October 2010 to 11 February 2011.
*** Mr. Charles Dean del Prado was appointed as Non-Executive Director with effect from 29 April 2010.**** Mr. Petrus Antonius Maria van Bommel was appointed as Non-Executive Director and Member of Audit Committee with
effect from 29 October 2010.

343434
CORPORATE GOVERNANCEREPORT (CONTINUED)
THE BOARD (Continued)Board composition (Continued)Mr. Charles Dean del Prado is the son of Mr. Arthur H. del Prado, besides this, none of the members of the Board is related to one another.
During the year ended 31 December 2010, the Company’s Board at all times met the requirements of the Listing Rules relating to the appointment of at least three independent non-executive directors with at least one independent non-executive director possessing appropriate professional qualifications, or accounting or related financial management expertise.
The Company has received written annual confirmation from each independent non-executive director of his independence pursuant to the requirements of the Listing Rules. The Company considers all independent non-executive directors to be independent in accordance with the independence guidelines set out in the Listing Rules.
Chairman and Chief Executive OfficerThe Company fully supports the division of responsibility between the Chairman of the Board and the Chief Executive Officer to ensure a balance of power and authority. The position of the Chairman is held by Mr. Arthur H. del Prado while the position of Chief Executive Officer is held by Mr. Lee Wai Kwong during the year ended 31 December 2010. Their respective responsibilities are clearly defined and set out in writing.
The Chairman provides leadership and is responsible for ensuring that the Board is functioning properly, with good corporate governance practices and procedures. With the support of the senior management, the Chairman is also responsible for ensuring that the directors receive adequate, complete and reliable information in a timely manner and appropriate briefing on issues arising at Board meetings.
The Chief Executive Officer, supported by the executive directors, is responsible for managing the Group’s business, including implementation of objectives, policies and major strategies and initiatives adopted by the Board.
Appointment and re-election of directorsIn accordance with the Company’s Articles of Association (“Articles”), all directors of the Company are subject to retirement by rotation at least once every three years and any new director appointed to fill a causal vacancy or as an addition to the Board shall submit himself for re-election by shareholders at the first general meeting after appointment.
The Company has not yet adopted Code Provision A.4.1 which provides that non-executive directors should be appointed for a specific term, subject to re-election. All the non-executive directors of the Company are not appointed for a specific term but they are subject to retirement by rotation and re-election at the Company’s annual general meetings at least once every three years pursuant to the Company’s Articles. As such, the Company considers that such provisions in the Articles are sufficient to meet the underlying objective of the relevant provision of the CG Code.
The Board reviewed its own structure, size and composition regularly to ensure that there is a balance of expertise, skills and experience appropriate for the requirements of the business of the Company. The Company does not have written director nomination procedure.

35
ASM Pacific Technology Limited Annual Report 2010
THE BOARD (Continued)Appointment and re-election of directors (Continued)The Chairman and the Chief Executive Officer are responsible for the selection and recommendation of candidates for directorship of the Company by making reference to the skills, experience, professional knowledge, personal integrity and time commitments of the proposed candidates, the Company’s needs and other relevant statutory requirements and regulations.
Pursuant to Article 117 of the Company’s Articles, Mr. Charles Dean del Prado and Mr. Petrus Antonius Maria van Bommel, who were appointed as Non-Executive Directors by the Board with effect from 29 April 2010 and 29 October 2010 respectively, re-elected as directors at the extraordinary general meeting held on 6 January 2011.
In addition, Mr. Arthur H. del Prado, Mr. Lee Wai Kwong and Mr. Chow Chuen, James shall retire by rotation in accordance with Articles 113 and 114 of the Company’s Articles and being eligible, offer themselves for re-election at the forthcoming annual general meeting.
The Board recommended the re-appointment of the directors standing for re-election at the 2011 annual general meeting of the Company.
The Company’s circular dated 24 March 2011 contains detailed information of the directors standing for re-election.
Induction and continuing development for directorsEach newly appointed director receives comprehensive, formal and tailored induction on the first occasion of his appointment, so as to ensure that he has proper understanding of the business and operations of the Company and that he is fully aware of his responsibilities and obligations under the Listing Rules and relevant regulatory requirements.
The directors are continually updated with legal and regulatory developments, and the business and market changes to facilitate the discharge of their responsibilities. Continuing briefings and professional development to directors will be arranged whenever necessary.
Board meetingsBoard practices and conduct of meetingsNotices of regular Board meetings are served to all directors at least 14 days before the meetings while reasonable notice is generally given for other board meetings. For committee meetings, notices are served in accordance with the required notice period stated in the relevant terms of reference.
Agenda and Board papers together with all appropriate, complete and reliable information are sent to all directors in a timely manner before each Board or committee meeting to keep the directors apprised of the latest developments and financial position of the Company and to enable them to make informed decisions. The Board and each director also have separate and independent access to the senior management whenever necessary.
Minutes of all Board meetings and Audit Committee meetings are kept by the Company Secretary while minutes of Board meetings relating to the Employee Share Incentive Scheme and Remuneration Committee meetings are kept by the executive secretary of the Chief Executive Officer. Draft minutes are normally circulated to directors for comment within a reasonable time after each meeting and the final version is open for directors’ inspection.
According to current Board practice, any material transaction, which involves a conflict of interests for a substantial shareholder or a director, will be considered and dealt with by the Board at a duly convened Board meeting. The Company’s Articles also contain provisions requiring directors to abstain from voting and not to be counted in the quorum at meetings for approving transactions in which such directors or any of their associates have a material interest.

363636
CORPORATE GOVERNANCEREPORT (CONTINUED)
THE BOARD (Continued)Board meetings (Continued)Directors’ attendance recordsFive Board meetings were held during the year.
The individual attendance (either in person or through other electronic means of communication) record of each director at the meetings of the Board, the Audit Committee and the Remuneration Committee during the year ended 31 December 2010 is set out below:
Attendance/Number of Meetings heldduring the tenure of directorship
Directors BoardAudit
CommitteeRemuneration
Committee
Executive Directors
Arthur H. del Prado (Chairman of the Board and Remuneration Committee) 4/5 N/A 1/1
Tang Koon Hung, Eric (resigned on 1 February 2010) 0/0 N/A N/ALo Tsan Yin, Peter (Vice Chairman of the Board) 5/5 N/A N/ALee Wai Kwong 5/5 N/A N/AChow Chuen, James 5/5 N/A N/A
Non-executive Directors
Robert A. Ruijter (resigned on 29 October 2010) 5/5 4/4 N/ACharles Dean del Prado (appointed on 29 April 2010) 3/3 N/A N/APetrus Antonius Maria van Bommel
(appointed on 29 October 2010) 0/0 0/0 N/A
Independent Non-executive Directors
Orasa Livasiri (Chairman of Audit Committee) 5/5 4/4 1/1Lee Shiu Hung, Robert 5/5 4/4 1/1Lok Kam Chong, John 5/5 4/4 1/1
Model code for securities transactionsThe Company has adopted the Model Code for Securities Transactions by Directors of Listed Issuers (the “Model Code”) as set out in Appendix 10 to the Listing Rules.
Specific enquiry has been made to all the directors and the directors have confirmed that they have complied with the Model Code throughout the year ended 31 December 2010.
The Company has also established written guidelines on no less exacting terms than the Model Code for securities transactions by employees (the “Employees Written Guidelines”) who are likely to be in possession of unpublished price-sensitive information of the Company.
No incident of non-compliance of the Employees Written Guidelines by the employees was noted by the Company.

37
ASM Pacific Technology Limited Annual Report 2010
DELEGATION OF MANAGEMENT FUNCTIONSThe Company has formalized and adopted the written terms on the division of functions reserved to the Board and delegated to the management.
The Board reserves for its decisions all major matters of the Company, including: objectives and overall strategies of the Company; annual budgets and financial matters; internal control and risk management systems; equity related transactions such as issue of shares/options, repurchase of shares, dividend, raising of capital loan; determination of major business strategy; merger and acquisition; disposal of business unit; major investment; annual financial budget in turnover, profitability and capital expenditure; review and approval of financial performance and announcement; and matters as required by laws and regulations.
All directors have full and timely access to all relevant information as well as the advice and services of the Company Secretary, with a view to ensuring that Board procedures and all applicable rules and regulations are followed. Each director is normally able to seek independent professional advice in appropriate circumstances at the Company’s expense, upon making request to the Board.
The day-to-day management, administration and operation of the Company are delegated to the Chief Executive Officer and the senior management. The delegated functions and work tasks are periodically reviewed. Approval has to be obtained from the Board prior to any significant transactions entered into by the abovementioned officers.
The Board has established two committees, namely, the Remuneration Committee and the Audit Committee, for overseeing particular aspects of the Company’s affairs. All Board committees of the Company are established with defined written terms of reference which are posted on the Company’s website and are available to shareholders upon request.
The Board committees are provided with sufficient resources to discharge their duties.
REMUNERATION OF DIRECTORSThe Company has established a formal and transparent procedure for formulating policies on remuneration of the executive directors of the Company. Details of the remuneration of each of the directors of the Company for the year ended 31 December 2010 are set out on page 65 in note 14 to the consolidated financial statements.
Remuneration CommitteeThe Remuneration Committee comprises four members during the year ended 31 December 2010. Mr. Arthur H. del Prado is the chairman while all other members are the independent non-executive directors.
The primary functions of the Remuneration Committee include making recommendations on and approving the remuneration policy and structure and remuneration packages of the executive directors and the senior management. The Remuneration Committee is also responsible for establishing formal and transparent procedures for developing such remuneration policy and structure to ensure that no director or any of his associates will participate in deciding his own remuneration, which remuneration will be determined by reference to the performance of the individual and the Company as well as market practice and conditions.
The Remuneration Committee held one meeting during the year ended 31 December 2010 and the attendance records are set out under “Directors’ attendance records” on page 36.

383838
CORPORATE GOVERNANCEREPORT (CONTINUED)
REMUNERATION OF DIRECTORS (Continued)Remuneration Committee (Continued)The Remuneration Committee has reviewed the remuneration policy and structure of the Company, and the remuneration packages of the executive directors for the year under review.
The Remuneration Committee has also consulted the Chairman and/or the Chief Executive Officer of the Company about their recommendations on remuneration policy and packages of the executive directors.
ACCOUNTABILITY AND AUDITDirectors’ responsibilities for financial reportingThe directors acknowledge their responsibility for preparing the financial statements of the Company for the year ended 31 December 2010.
The Board is responsible for presenting a balanced, clear and understandable assessment of annual and interim reports, price-sensitive announcements and other financial disclosures required under the Listing Rules and other regulatory requirements.
The Management provides such explanation and information to the Board so as to enable the Board to make an informed assessment of the financial information and position of the Company put to the Board for approval.
Internal controlsDuring the year under review, the Board has conducted a review of the effectiveness of the internal control system of the Group.
The internal control system of the Group is designed to facilitate effective and efficient operations, to ensure reliability of financial reporting and compliance with applicable laws and regulations, to identify and manage potential risks and to safeguard assets of the Group.
The Group Internal Audit Department plays a major role, independent of the Company’s management, in providing objective assurance and consulting services to the Company by bringing a disciplined systematic approach to evaluate and improve the effectiveness and efficiency of risk management, internal control and governance processes and the integrity of the operations. The Department is accountable to the Audit Committee and has unrestricted access to information that allows it to perform its functions. On a regular basis, it conducts audits on financial, operational and compliance controls, and effectiveness of risk management functions of all business and functional units as well as subsidiaries. Management is responsible for ensuring that control deficiencies highlighted in internal audits are rectified within a reasonable period. The Department produces an annual internal audit plan derived from risk assessment for the Audit Committee’s review. The Group Internal Audit Manager reports to the Audit Committee his audit findings and his opinions on the system of internal controls. The Committee was satisfied with the existing controls.

39
ASM Pacific Technology Limited Annual Report 2010
ACCOUNTABILITY AND AUDIT (Continued)Audit CommitteeThe Audit Committee comprises the three independent non-executive directors (including two independent non-executive directors who possess the appropriate professional qualifications or accounting or related financial management expertise) and one Non-executive director during the year ended 31 December 2010. Miss Orasa Livasiri is the chairman of the committee. None of the members of the Audit Committee is a former partner of the Company’s existing external auditor.
The main duties of the Audit Committee include the following:
• To review the financial statements and reports and consider any significant or unusual items raised by the staff responsible for the accounting and financial reporting function, internal auditor or external auditor before submission to the Board.
• To review the relationship with the external auditor by reference to the work performed by the auditor, their fees and terms of engagement, and make recommendation to the Board on the appointment, re-appointment and removal of external auditor.
• To review the adequacy and effectiveness of the Company’s financial reporting system, internal control system, including the adequacy of resources, qualifications and experience of staff of the Company’s accounting and financial reporting function and their training programmes and budget, and risk management system and associated procedures.
In 2010, a total of four meetings of Audit Committee were convened. The attendance record of the Audit Committee’s members is shown on page 36. The following is a summary of the tasks completed by the Audit Committee during 2010:
• reviewed the Group’s financial reports for the year ended 31 December 2009, for the six months ended 30 June 2010, and for the quarters ended 31 March 2010 and 30 September 2010;
• reviewed the financial reporting system;
• reviewed the effectiveness of internal controls system;
• reviewed risk management system;
• reviewed work plan for 2010 audit and fees budget of the auditor; and
• made recommendations on the re-appointment of the auditor.
There is no material uncertainty relating to events or conditions that may cast significant doubt on the Company’s ability to continue as a going concern.
There is no disagreement between the Board and the Audit Committee regarding the selection, appointment, resignation or dismissal of the external auditor.

404040
CORPORATE GOVERNANCEREPORT (CONTINUED)
ACCOUNTABILITY AND AUDIT (Continued)Auditor’s remunerationThe statement of the external auditor of the Company about their reporting responsibilities on the financial statements is set out in the “Independent Auditor’s Report” on page 41.
During the year under review, the remuneration paid to the Company’s auditor, Messrs. Deloitte Touche Tohmatsu, in respect of audit services amounted to HK$6,128,000 and non-audit services amounted to HK$6,639,000 (including a fee for reviewing working capital sufficiency and preparing accountants’ report on pro forma financial information in respect of acquisition of the SEAS Business) which were reviewed and approved by the Audit Committee.
The Audit Committee recommends the re-appointment of Messrs. Deloitte Touche Tohmatsu as auditor at the forthcoming annual general meeting.
COMMUNICATIONS WITH SHAREHOLDERS AND INVESTORSThe Company believes that effective communication with shareholders is essential for enhancing investor relations and investors’ understanding of the Group’s business performance and strategies. The Group also recognises the importance of transparency and timely disclosure of corporate information which enables shareholders and investors to make the best investment decision.
The general meetings of the Company provide the best opportunity for communication between the Board and the shareholders. The Chairman of the Board as well as chairman of the Remuneration Committee and the Audit Committee or, in their absence, other members of the respective committees and, where applicable, the independent Board committee, are available to answer questions at the shareholders’ meetings.
Under Code Provision E.1.2 of the CG Code, the chairman of the Board should attend the annual general meeting of the Company. The chairman of the Board did not attend the annual general meeting of the Company held on 23 April 2010 due to other commitment but the Chairman of the audit committee and other members of the remuneration committee of the Company were available to answer question at the shareholders’ meeting.
An extraordinary general meeting of the Company was held on 6 January 2011 to consider and approve the proposed acquisition of the business of “Siemens Electronics Assembly Systems” (“SEAS Business”) from Siemens Aktiengesellschaft. The chairman of the Board and other six directors including all independent non-executive directors had attended the meeting to communicate with shareholders on any concerns they had in relation to such proposed acquisition. The proposed acquisition was duly approved by the shareholders with 100% of the votes at such extraordinary general meeting.
All announcements and notices which have been published on the Stock Exchange’s website are also available for viewing on the Company’s own website.
SHAREHOLDER RIGHTSTo safeguard the shareholders’ interests and rights, separate resolutions are proposed at shareholders’ meetings on each substantial issue, including the re-election of the retiring directors.
All votes of the shareholders at the shareholders’ meeting will be taken by poll. Poll results will be posted on the websites of the Company and of the Stock Exchange following the shareholders’ meeting.

41
INDEPENDENT AUDITOR’S REPORT
TO THE MEMBERS OF ASM PACIFIC TECHNOLOGY LIMITED(incorporated in the Cayman Islands with limited liability)
We have audited the consolidated financial statements of ASM Pacific Technology Limited (the “Company”) and its subsidiaries (collectively referred to as the “Group”) set out on pages 42 to 81, which comprise the consolidated statement of financial position as at 31 December 2010, and the consolidated statement of comprehensive income, consolidated statement of changes in equity and consolidated statement of cash flows for the year then ended, and a summary of significant accounting policies and other explanatory information.
DIRECTORS’ RESPONSIBILITY FOR THE CONSOLIDATED FINANCIAL STATEMENTSThe directors of the Company are responsible for the preparation of consolidated financial statements that give a true and fair view in accordance with Hong Kong Financial Reporting Standards issued by the Hong Kong Institute of Certified Public Accountants and the disclosure requirements of the Hong Kong Companies Ordinance, and for such internal control as the directors determine is necessary to enable the preparation of consolidated financial statements that are free from material misstatement, whether due to fraud or error.
AUDITOR’S RESPONSIBILITYOur responsibility is to express an opinion on these consolidated financial statements based on our audit and to report our opinion solely to you, as a body, in accordance with our agreed terms of engagement, and for no other purpose. We do not assume responsibility towards or accept liability to any other person for the contents of this report. We conducted our audit in accordance with Hong Kong Standards on Auditing issued by the Hong Kong Institute of Certified Public Accountants. Those standards require that we comply with ethical requirements and plan and perform the audit to obtain reasonable assurance about whether the consolidated financial statements are free from material misstatement.
An audit involves performing procedures to obtain audit evidence about the amounts and disclosures in the consolidated financial statements. The procedures selected depend on the auditor’s judgment, including the assessment of the risks of material misstatement of the consolidated financial statements, whether due to fraud or error. In making those risk assessments, the auditor considers internal control relevant to the entity’s preparation of the consolidated financial statements that give a true and fair view in order to design audit procedures that are appropriate in the circumstances, but not for the purpose of expressing an opinion on the effectiveness of the entity’s internal control. An audit also includes evaluating the appropriateness of accounting policies used and the reasonableness of accounting estimates made by the directors, as well as evaluating the overall presentation of the consolidated financial statements.
We believe that the audit evidence we have obtained is sufficient and appropriate to provide a basis for our audit opinion.
OPINIONIn our opinion, the consolidated financial statements give a true and fair view of the state of affairs of the Group as at 31 December 2010 and of the Group’s profit and cash flows for the year then ended in accordance with Hong Kong Financial Reporting Standards and have been properly prepared in accordance with the disclosure requirements of the Hong Kong Companies Ordinance.
Deloitte Touche TohmatsuCertified Public AccountantsHong Kong2 March 2011

424242
CONSOLIDATED STATEMENT OFCOMPREHENSIVE INCOMEFor the year ended 31 December 2010
2010 2009Notes HK$’000 HK$’000
Turnover 7 9,515,089 4,732,174Cost of sales (5,006,965) (2,776,579)
Gross profit 4,508,124 1,955,595Other income 22,769 7,729Selling and distribution expenses (603,095) (417,324)General and administrative expenses (275,559) (166,509)Research and development expenses 9 (433,987) (307,467)Other gains and losses 10 1,398 (6,254)Finance costs 11 (3) –
Profit before taxation 3,219,647 1,065,770Income tax expense 12 (377,613) (130,332)
Profit for the year 13 2,842,034 935,438
Exchange differences on translation of foreign operations, representing other comprehensive income for the year 34,305 2,338
Total comprehensive income for the year 2,876,339 937,776
Earnings per share 18– Basic HK$7.20 HK$2.38
– Diluted HK$7.18 HK$2.37

43
CONSOLIDATED STATEMENT OFFINANCIAL POSITIONAt 31 December 2010
2010 2009Notes HK$’000 HK$’000
Non-current assetsProperty, plant and equipment 19 1,528,498 890,456Prepaid lease payments 20 28,782 7,901Deposits paid for acquisition of property, plant and equipment 65,511 19,339Rental deposits paid 21 10,261 –Deferred tax assets 27 23,495 21,057
1,656,547 938,753
Current assetsInventories 22 1,624,182 1,003,945Trade and other receivables 21 2,280,470 1,572,752Prepaid lease payments 20 977 494Bank deposits with original maturity of more than three months 23 76,798 –Bank balances and cash 23 1,978,182 1,253,872
5,960,609 3,831,063
Current liabilitiesTrade and other payables 24 1,993,404 1,167,831Taxation 482,992 191,354
2,476,396 1,359,185
Net current assets 3,484,213 2,471,878
5,140,760 3,410,631
Capital and reservesShare capital 25 39,612 39,439Dividend reserve 1,267,581 631,027Other reserves 3,832,957 2,739,610
Equity attributable to owners of the Company 5,140,150 3,410,076
Non-current liabilitiesDeferred tax liabilities 27 610 555
5,140,760 3,410,631
The consolidated financial statements on pages 42 to 81 were approved and authorised for issue by the Board of Directors on 2 March 2011 and are signed on its behalf by:
Arthur H. del Prado Lee Wai KwongDIRECTOR DIRECTOR

444444
CONSOLIDATED STATEMENT OF CHANGES IN EQUITYFor the year ended 31 December 2010
Attributable to owners of the Company
Share capital
Sharepremium
Employeeshare-based
compensationreserve
Capitalredemption
reserveCapitalreserve
Translationreserve
Retainedprofits
Dividendreserve Total
HK$’000 HK$’000 HK$’000 HK$’000 HK$’000 HK$’000 HK$’000 HK$’000 HK$’000
At 1 January 2009 39,236 380,782 – 155 72,979 (74,223) 2,248,993 196,178 2,864,100
Profit for the year – – – – – – 935,438 – 935,438Exchange differences on translation of
foreign operations – – – – – 2,338 – – 2,338
Total comprehensive income for the year – – – – – 2,338 935,438 – 937,776
Sub-total 39,236 380,782 – 155 72,979 (71,885) 3,184,431 196,178 3,801,876Recognition of equity-settled share-
based payments – – 39,792 – – – – – 39,792Shares issued under the Employee
Share Incentive Scheme 203 39,589 (39,792) – – – – – –2008 final dividend paid – – – – – – – (196,178) (196,178)2009 interim dividend paid – – – – – – (78,471) – (78,471)2009 first special dividend paid – – – – – – (156,943) – (156,943)2009 final dividend proposed – – – – – – (473,270) 473,270 –2009 second special dividend
proposed – – – – – – (157,757) 157,757 –
At 31 December 2009 and 1 January 2010 39,439 420,371 – 155 72,979 (71,885) 2,317,990 631,027 3,410,076
Profit for the year – – – – – – 2,842,034 – 2,842,034Exchange differences on translation of
foreign operations – – – – – 34,305 – – 34,305
Total comprehensive income for the year – – – – – 34,305 2,842,034 – 2,876,339
Sub-total 39,439 420,371 – 155 72,979 (37,580) 5,160,024 631,027 6,286,415Recognition of equity-settled share-
based payments – – 115,789 – – – – – 115,789Shares issued under the Employee
Share Incentive Scheme 173 115,616 (115,789) – – – – – –2009 final and second special
dividend paid – – – – – – – (631,027) (631,027)2010 interim dividend paid – – – – – – (631,027) – (631,027)2010 final dividend proposed – – – – – – (831,850) 831,850 –2010 special dividend proposed – – – – – – (435,731) 435,731 –
At 31 December 2010 39,612 535,987 – 155 72,979 (37,580) 3,261,416 1,267,581 5,140,150

45
CONSOLIDATED STATEMENT OF CASH FLOWSFor the year ended 31 December 2010
2010 2009HK$’000 HK$’000
Operating activitiesProfit before taxation 3,219,647 1,065,770Adjustments for:
Depreciation 226,758 225,941Release of prepaid lease payments 553 494Loss on disposal/write-off of property, plant and equipment 15,474 98Share-based payments under the Employee Share Incentive Scheme 115,789 39,792Interest income (6,215) (5,196)Interest expense 3 –
Operating cash flows before movements in working capital 3,572,009 1,326,899Increase in inventories (609,405) (102,600)Increase in trade and other receivables (710,183) (569,933)Increase in trade and other payables 613,823 519,231Effect of foreign exchange rate changes on inter-company balances (7,809) (254)
Cash generated from operations 2,858,435 1,173,343Income taxes paid (91,052) (222,339)Income taxes refunded 597 811
Net cash from operating activities 2,767,980 951,815
Investing activitiesInterest received 6,215 5,196Proceeds on disposal of property, plant and equipment 910 307Purchase of property, plant and equipment (631,763) (98,140)Placement of bank deposits with original maturity of more than three months (76,798) –Deposits paid for acquisition of property, plant and equipment (65,511) (19,339)Additions of prepaid lease payments (21,193) –
Net cash used in investing activities (788,140) (111,976)
Cash used in financing activitiesDividends paid (1,262,054) (431,592)Interest paid (3) –
Net cash used in financing activities (1,262,057) (431,592)
Net increase in cash and cash equivalents 717,783 408,247Cash and cash equivalents at beginning of the year 1,253,872 845,521Effect of foreign exchange rate changes 6,527 104
Cash and cash equivalents at end of the year, comprising bank balances and cash 1,978,182 1,253,872

464646
NOTES TO THE CONSOLIDATED FINANCIAL STATEMENTSFor the year ended 31 December 2010
1. GENERALThe Company is an exempted company incorporated in the Cayman Islands and its shares are listed on The Stock Exchange of Hong Kong Limited. Its parent company is ASM Pacific Holding B.V. and its ultimate holding company is ASM International N.V. (“ASM International”), companies incorporated in the Netherlands. The addresses of the registered office and principal place of business of the Company are disclosed in the corporate information of the annual report.
The consolidated financial statements are presented in Hong Kong dollars which is the functional currency of the Company.
The Company acts as an investment holding company. Its principal subsidiaries are engaged in the design, manufacture and marketing of machines, tools and materials used in semiconductor industry.
2. APPLICATION OF NEW AND REVISED HONG KONG FINANCIAL REPORTING STANDARDS (“HKFRS”s)In the current year, the Group has applied the following new and revised Hong Kong Accounting Standards (“HKAS”s), HKFRSs, amendments and interpretations (“INT”s) (hereinafter collectively referred to as “new and revised HKFRSs”) issued by the Hong Kong Institute of Certified Public Accountants (“HKICPA”).
HKFRS 2 (Amendments) Group cash-settled share-based payment transactionsHKFRS 3 (as revised in 2008) Business combinationsHKAS 27 (as revised in 2008) Consolidated and separate financial statementsHKAS 39 (Amendments) Eligible hedged itemsHKFRSs (Amendments) Improvements to HKFRSs issued in 2009HKFRSs (Amendments) Amendments to HKFRS 5 as part of Improvements to HKFRSs issued in
2008HK(IFRIC*) – INT 17 Distributions of non-cash assets to ownersHK – INT 5 Presentation of financial statements – Classification by the borrower of
a term loan that contains a repayment on demand clause
* IFRIC represents the IFRS Interpretations Committee (formerly known as the International Financial Reporting Interpretations Committee).
The application of the new and revised HKFRSs in the current year has had no material effect on the amounts reported in these consolidated financial statements and/or disclosures set out in these consolidated financial statements.

47
ASM Pacific Technology Limited Annual Report 2010
2. APPLICATION OF NEW AND REVISED HONG KONG FINANCIAL REPORTING STANDARDS (“HKFRS”s) (Continued)The Group has not early applied the following new and revised standards, amendments or interpretations that have been issued but are not yet effective.
HKFRSs (Amendments) Improvements to HKFRSs 20101
HKFRS 7 (Amendments) Disclosures – Transfers of financial assets3
HKFRS 9 Financial instruments4
HKAS 12 (Amendments) Deferred tax: Recovery of underlying assets5
HKAS 24 (Revised) Related party disclosures6
HKAS 32 (Amendments) Classification of rights issues7
HK(IFRIC) – INT 14(Amendments)
Prepayments of a minimum funding requirement6
HK(IFRIC) – INT 19 Extinguishing financial liabilities with equity instruments2
1 Effective for annual periods beginning on or after 1 July 2010 and 1 January 2011, as appropriate.2 Effective for annual periods beginning on or after 1 July 2010.3 Effective for annual periods beginning on or after 1 July 2011.4 Effective for annual periods beginning on or after 1 January 2013.5 Effective for annual periods beginning on or after 1 January 2012.6 Effective for annual periods beginning on or after 1 January 2011.7 Effective for annual periods beginning on or after 1 February 2010.
The directors of the Company anticipate that the application of these new and revised standards, amendments or interpretations will have no material impact on the consolidated financial statements.
3. SIGNIFICANT ACCOUNTING POLICIESThe consolidated financial statements have been prepared under the historical cost basis.
The consolidated financial statements have been prepared in accordance with HKFRSs issued by the HKICPA. In addition, the consolidated financial statements include applicable disclosures required by the Rules Governing the Listing of Securities on The Stock Exchange of Hong Kong Limited (the “Listing Rules”) and by the Hong Kong Companies Ordinance.
Basis of consolidationThe consolidated financial statements incorporate the financial statements of the Company and entities controlled by the Company (its subsidiaries). Control is achieved where the Company has the power to govern the financial and operating policies of an entity so as to obtain benefits from its activities.
The results of subsidiaries acquired or disposed of during the year are included in the consolidated statement of comprehensive income from the effective date of acquisition or up to the effective date of disposal, as appropriate.
Where necessary, adjustments are made to the financial statements of subsidiaries to bring their accounting policies into line with those used by other members of the Group.
All intra-group transactions, balances, income and expenses are eliminated on consolidation.

484848
For the year ended 31 December 2010
NOTES TO THE CONSOLIDATED FINANCIAL STATEMENTS (CONTINUED)
3. SIGNIFICANT ACCOUNTING POLICIES (Continued)Revenue recognitionRevenue is measured at the fair value of the consideration received or receivable and represents amounts receivable for goods sold in the normal course of business, net of discounts and sales related taxes.
Revenue from sale of goods is recognised when the goods are delivered and title has been passed.
Interest income from a financial asset is accrued on a time basis, by reference to the principal outstanding and at the effective interest rate applicable, which is the rate that exactly discounts the estimated future cash receipts through the expected life of the financial asset to that asset’s net carrying amount on initial recognition.
Property, plant and equipmentProperty, plant and equipment including buildings held for use in the production of goods, or for administrative purposes are stated at cost less subsequent accumulated depreciation and accumulated impairment losses.
Depreciation is recognised so as to write off the cost of items of property, plant and equipment other than properties under construction less their residual values over their estimated useful lives, using the straight-line method. The estimated useful lives, residual values and depreciation method are reviewed at the end of each reporting period, with the effect of any changes in estimate accounted for on a prospective basis.
Construction in progress includes property, plant and equipment in the course of construction for production or for its own use purposes. Construction in progress is carried at cost less any recognised impairment loss. Construction in progress is classified to the appropriate category of property, plant and equipment when completed and ready for intended use. Depreciation of these assets, on the same basis as other property assets, commences when the assets are ready for their intended use.
An item of property, plant and equipment is derecognised upon disposal or when no future economic benefits are expected to arise from the continued use of the asset. Any gain or loss arising on the disposal or retirement of an item of property, plant and equipment is determined as the difference between the sales proceeds and the carrying amount of the asset and is recognised in profit or loss.
InventoriesInventories are stated at the lower of cost and net realisable value. Cost is calculated using the first-in, first-out method.

49
ASM Pacific Technology Limited Annual Report 2010
3. SIGNIFICANT ACCOUNTING POLICIES (Continued)Research and development expenditureExpenditure on research activities is recognised as an expense in the period in which it is incurred.
An internally-generated intangible asset arising from development (or from the development phase of an internal project) is recognised if, and only if, all of the following have been demonstrated:
• the technical feasibility of completing the intangible asset so that it will be available for use or sale;• the intention to complete the intangible asset and use or sell it;• the ability to use or sell the intangible asset;• how the intangible asset will generate probable future economic benefits;• the availability of adequate technical, financial and other resources to complete the development and
to use or sell the intangible asset; and• the ability to measure reliably the expenditure attributable to the intangible asset during its
development.
The amount initially recognised for internally-generated intangible asset is the sum of the expenditure incurred from the date when the intangible asset first meets the recognition criteria listed above. Where no internally-generated intangible asset can be recognised, development expenditure is charged to profit or loss in the period in which it is incurred.
Subsequent to initial recognition, internally-generated intangible asset is measured at cost less accumulated amortisation and accumulated impairment losses (if any), on the same basis as intangible assets acquired separately.
Impairment loss on tangible assetsAt the end of the reporting period, the Group reviews the carrying amounts of its tangible assets to determine whether there is any indication that those assets have suffered an impairment loss. If any such indication exists, the recoverable amount of the assets is estimated in order to determine the extent of the impairment loss, if any. If the recoverable amount of an asset is estimated to be less than its carrying amount, the carrying amount of the asset is reduced to its recoverable amount. An impairment loss is recognised as an expense immediately.
Where an impairment loss subsequently reverses, the carrying amount of the asset is increased to the revised estimate of its recoverable amount, but so that the increased carrying amount does not exceed the carrying amount that would have been determined had no impairment loss been recognised for the asset in prior years. A reversal of an impairment loss is recognised as income immediately.

505050
For the year ended 31 December 2010
NOTES TO THE CONSOLIDATED FINANCIAL STATEMENTS (CONTINUED)
3. SIGNIFICANT ACCOUNTING POLICIES (Continued)TaxationIncome tax expense represents the sum of the tax currently payable and deferred tax.
The tax currently payable is based on taxable profit for the year. Taxable profit differs from profit as reported in the consolidated statement of comprehensive income because it excludes items of income or expense that are taxable or deductible in other years, and it further excludes items that are never taxable or deductible. The Group’s liability for current tax is calculated using tax rates that have been enacted or substantively enacted by the end of the reporting period.
Deferred tax is recognised on temporary differences between the carrying amounts of assets and liabilities in the consolidated financial statements and the corresponding tax base used in the computation of taxable profit. Deferred tax liabilities are generally recognised for all taxable temporary differences. Deferred tax assets are generally recognised for all deductible temporary differences to the extent that it is probable that taxable profits will be available against which deductible temporary differences can be utilised. Such assets and liabilities are not recognised if the temporary difference arises from the initial recognition (other than in a business combination) of assets and liabilities in a transaction that affects neither the taxable profit nor the accounting profit.
Deferred tax liabilities are recognised for taxable temporary differences associated with investments in subsidiaries, except where the Group is able to control the reversal of the temporary difference and it is probable that the temporary difference will not reverse in the foreseeable future. Deferred tax assets arising from deductible temporary differences associated with such investments are only recognised to the extent that it is probable that there will be sufficient taxable profits against which to utilise the benefits of the temporary differences and they are expected to reverse in the foreseeable future.
The carrying amount of deferred tax assets is reviewed at the end of the reporting period and reduced to the extent that it is no longer probable that sufficient taxable profits will be available to allow all or part of the asset to be recovered.
Deferred tax assets and liabilities are measured at the tax rates that are expected to apply in the period in which the liability is settled or the asset is realised, based on tax rate (and tax laws) that have been enacted or substantively enacted by the end of the reporting period.
The measurement of deferred tax liabilities and assets reflects the tax consequences that would follow from the manner in which the Group expects, at the end of the reporting period, to recover or settle the carrying amount of its assets and liabilities. Deferred tax is recognised in profit or loss, except when it relates to items that are recognised in other comprehensive income or directly in equity, in which case the deferred tax is also recognised in other comprehensive income or directly in equity respectively.

51
ASM Pacific Technology Limited Annual Report 2010
3. SIGNIFICANT ACCOUNTING POLICIES (Continued)LeasingLeases are classified as finance leases whenever the terms of the lease transfer substantially all the risks and rewards of ownership to the lessee. All other leases are classified as operating leases.
Operating lease payments are recognised as an expense on a straight-line basis over the lease term. Contingent rentals arising under operating leases are recognised as an expense in the period in which they are incurred.
In the event that lease incentives are received to enter into operating leases, such incentives are recognised as a liability. The aggregate benefit of incentives is recognised as a reduction of rental expense on a straight-line basis.
Leasehold land and buildingsWhen a lease includes both land and building elements, the Group assesses the classification of each element as a finance or an operating lease separately based on the assessment as to whether substantially all the risks and rewards incidental to ownership of each element have been transferred to the Group. Specifically, the minimum lease payments (including any lump-sum upfront payments) are allocated between the land and the building elements in proportion to the relative fair values of the leasehold interests in the land element and building element of the lease at the inception of the lease.
To the extent the allocation of the lease payments can be made reliably, interest in leasehold land that is accounted for as an operating lease is presented as “prepaid lease payments” in the consolidated statement of financial position and is released over the lease term on a straight-line basis. When the lease payments cannot be allocated reliably between the land and building elements, the entire lease is generally classified as a finance lease and accounted for as property, plant and equipment, unless it is clear that both elements are operating leases, in which case the entire lease is classified as an operating lease.
Financial instrumentsFinancial assets and financial liabilities are recognised in the consolidated statement of financial position when a group entity becomes a party to the contractual provisions of the instrument.
Financial assets and financial liabilities are initially measured at fair value. Transaction costs that are directly attributable to the acquisition or issue of financial assets and financial liabilities (other than financial assets and financial liabilities at fair value through profit or loss) are added to or deducted from the fair value of the financial assets or financial liabilities, as appropriate, on initial recognition. Transaction costs directly attributable to the acquisition of financial assets or financial liabilities at fair value through profit or loss are recognised immediately in profit or loss.
Financial assetsThe Group’s financial assets are mainly loans and receivables.
Loans and receivables are non-derivative financial assets with fixed or determinable payments that are not quoted in an active market. Subsequent to initial recognition, loans and receivables (including trade and other receivables, and bank balances and cash) are carried at amortised cost using the effective interest method, less any identified impairment losses.

525252
For the year ended 31 December 2010
NOTES TO THE CONSOLIDATED FINANCIAL STATEMENTS (CONTINUED)
3. SIGNIFICANT ACCOUNTING POLICIES (Continued)Financial instruments (Continued)Impairment of financial assetsLoans and receivables are assessed for indicators of impairment at the end of the reporting period. Loans and receivables are impaired where there is objective evidence that, as a result of one or more events that occurred after the initial recognition of the financial asset, the estimated future cash flows of the financial assets have been affected.
Objective evidence of impairment could include:
• significant financial difficulty of the issuer or counterparty; or• breach of contract, such as default or delinquency in interest or principal payments; or• it becoming probable that the borrower will enter bankruptcy or financial re-organisation; or• the disappearance of an active market for the financial asset because of financial difficulties.
Loans and receivables assessed not to be impaired individually are subsequently assessed for impairment on a collective basis. Objective evidence of impairment for a portfolio of receivables could include the Group’s past experience of collecting payments, an increase in the number of delayed payments in the portfolio past the credit period of 30 days to 60 days and observable changes in national or local economic conditions that correlate with default on receivables.
For financial assets carried at amortised cost, an impairment loss is recognised in profit or loss when there is objective evidence that the asset is impaired, and is measured as the difference between the asset’s carrying amount and the present value of the estimated future cash flows discounted at the original effective interest rate.
The carrying amount of loans and receivables is reduced through the use of an allowance account. Changes in the carrying amount of the allowance account are recognised in profit or loss. When a loan or receivable is considered uncollectible, it is written off against the allowance account. Subsequent recoveries of amounts previously written off are credited to profit or loss.
Financial liabilities and equityFinancial liabilities and equity instruments issued by a group entity are classified according to the substance of the contractual arrangements entered into and the definitions of a financial liability and an equity instrument. An equity instrument is any contract that evidences a residual interest in the assets of the Group after deducting all of its liabilities.
The Group’s financial liabilities, including trade and other payables, are subsequently measured at amortised cost, using the effective interest method.
Equity instruments issued by the Company are recorded at the proceeds received, net of direct issue costs.

53
ASM Pacific Technology Limited Annual Report 2010
3. SIGNIFICANT ACCOUNTING POLICIES (Continued)Financial instruments (Continued)DerecognitionFinancial assets are derecognised when the rights to receive cash flows from the assets expire or, the financial assets are transferred and the Group has transferred substantially all the risks and rewards of ownership of the financial assets.
On derecognition of a financial asset in its entirety, the difference between the asset’s carrying amount and the sum of the consideration received and receivable and the cumulative gain or loss that had been recognised in other comprehensive income and accumulated in equity is recognised in profit or loss.
On derecognition of a financial asset other than in its entirety (e.g. when the Group retains an option to repurchase part of a transferred asset or retains a residual interest that does not result in the retention of substantially all the risks and rewards of ownership and the Group retains control), the Group allocates the previous carrying amount of the financial asset between the part it continues to recognise under continuing involvement, and the part it no longer recognises on the basis of the relative fair values of those parts on the date of the transfer. The difference between the carrying amount allocated to the part that is no longer recognised and the sum of the consideration received for the part no longer recognised and any cumulative gain or loss allocated to it that had been recognised in other comprehensive income is recognised in profit or loss. A cumulative gain or loss that had been recognised in other comprehensive income is allocated between the part that continues to be recognised and the part that is no longer recognised on the basis of the relative fair values of those parts.
Financial liabilities are derecognised when the obligation specified in the relevant contract is discharged, cancelled or expires. The difference between the carrying amount of the financial liability derecognised and the consideration paid and payable is recognised in profit or loss.
Foreign currenciesIn preparing the financial statements of each individual group entity, transactions in currencies other than the functional currency of that entity (foreign currencies) are recorded in the respective functional currency (i.e. the currency of the primary economic environment in which the entity operates) at the rates of exchange prevailing on the dates of the transactions. At the end of the reporting period, monetary items denominated in foreign currencies are re-translated at the rates prevailing at that date. Non-monetary items that are measured in terms of historical cost in a foreign currency are not re-translated.
Exchange differences arising on the settlement of monetary items, and on the re-translation of monetary items, are recognised in profit or loss in the period in which they arise, except for exchange differences arising on a monetary item that forms part of the Company’s net investment in a foreign operation, in which case, such exchange differences are recognised in other comprehensive income and accumulated in equity and will be reclassified from equity to profit or loss on disposal of the foreign operation.
For the purposes of presenting the consolidated financial statements, the assets and liabilities of the Group’s foreign operations are translated into the presentation currency of the Group (i.e. Hong Kong dollars) at the rate of exchange prevailing at the end of the reporting period, and their income and expenses are translated at the average exchange rates for the year, unless exchange rates fluctuate significantly during the period, in which case, the exchange rates prevailing at the dates of transactions are used. Exchange differences arising, if any, are recognised in other comprehensive income and accumulated equity (translation reserve) and will be reclassified from equity to profit or loss on disposal of the foreign operation.

545454
For the year ended 31 December 2010
NOTES TO THE CONSOLIDATED FINANCIAL STATEMENTS (CONTINUED)
3. SIGNIFICANT ACCOUNTING POLICIES (Continued)Foreign currencies (Continued)From 1 January 2010 onwards, on the disposal of a foreign operation (i.e. a disposal of the Group’s entire interest in a foreign operation, or a disposal involving loss of control over a subsidiary that includes a foreign operation), all of the exchange differences accumulated in equity in respect of that operation attributable to the owners of the Company are reclassified to profit or loss. In addition, in relation to a partial disposal of a subsidiary that does not result in the Group losing control over the subsidiary, the proportionate share of accumulated exchange differences are re-attributed to non-controlling interests and are not recognised in profit or loss.
Share-based payment transactionsEquity-settled share-based payment transactionsThe fair value of services received from employees determined by reference to the fair value of shares granted at the grant date is expensed on a straight-line basis over the vesting period, with a corresponding increase in equity (employee share-based compensation reserve).
At the end of the reporting period, the Group revised its estimates of the number of shares that are expected to ultimately vest. The impact of the revision of the estimates during the vesting period, if any, is recognised in profit or loss, with a corresponding adjustment to employee share-based compensation reserve.
At the time when the shares are subsequently vested and issued, the amount previously recognised in the employee share-based compensation reserve will be transferred to share capital and share premium.
Government grantsGovernment grants are not recognised until there is reasonable assurance that the Group will comply with the conditions attaching to them and that the grants will be received.
Government grants are recognised in profit or loss on a systematic basis over the periods in which the Group recognises as expenses the related costs for which the grants are intended to compensate. Grants related to expense items are recognised in the same period as those expenses are charged to profit or loss and are deducted in the reporting of the related expenses. Government grants that are receivable as compensation for expenses or losses already incurred or for the purpose of giving immediate financial support to the Group with no future related costs are recognised in profit or loss in the period in which they become receivable.
Retirement benefit costsPayments to defined contribution retirement benefit plans/state-managed retirement benefit schemes/the Mandatory Provident Fund Scheme are charged as an expense when employees have rendered service entitling them to the contributions.
Borrowing costsBorrowing costs directly attributable to the acquisition, construction or production of qualifying assets, which are assets that necessarily take a substantial period of time to get ready for their intended use or sale, are added to the cost of those assets until such time as the assets are substantially ready for their intended use or sale. Investment income earned on the temporary investment of specific borrowings pending their expenditure on qualifying assets is deducted from the borrowing costs eligible for capitalisation.
All other borrowing costs are recognised in profit or loss in the period in which they are incurred.

55
ASM Pacific Technology Limited Annual Report 2010
4. KEY SOURCES OF ESTIMATION UNCERTAINTYThe following are the key assumptions concerning the future, and other key sources of estimation uncertainty at the end of the reporting period, that have a significant risk of causing a material adjustment to the carrying amounts of assets and liabilities within the next financial year.
InventoriesA significant portion of the Group’s working capital is devoted to inventories and the nature of inventories is subject to frequent technological changes. As at 31 December 2010, the carrying amount of inventories was HK$1,624,182,000. The management reviews the inventory age listing on a periodic basis to identify slow-moving, obsolete and defective inventories. The management estimates that the net realisable value for such inventories based primarily on the latest invoice prices and current market conditions. The amount of allowance would be changed as a result of changes in current market conditions and technology subsequently.
Impairment of trade receivablesOn assessing any impairment of the Group’s trade receivables, the management regularly reviews the recoverability, creditworthiness of customers and ages of the trade receivables. Impairment on trade receivables is made based on estimation of the future cash flows discounted at the original effective interest rates. If the financial condition of the customers of the Group deteriorates, resulting in an impairment of their ability to make payments, additional impairment may be required. As at 31 December 2010, the carrying amount of trade receivables was HK$1,895,898,000.
5. CAPITAL RISK MANAGEMENTThe Group manages its capital to ensure that entities in the Group will be able to continue as a going concern while maximising the return to stakeholders through the optimisation of the debt and equity balance. The Group’s overall strategy remains unchanged from prior year.
The capital structure of the Group consists of cash and cash equivalents and equity attributable to owners of the Company, comprising issued share capital and reserves including retained profits.
The directors of the Company review the capital structure on a regular basis. As part of this review, the directors consider the cost of capital and the risks associated with each class of capital. Based on recommendations of the directors, the Group will balance its overall capital structure through the payment of dividends and new share issues.

565656
For the year ended 31 December 2010
NOTES TO THE CONSOLIDATED FINANCIAL STATEMENTS (CONTINUED)
6. FINANCIAL INSTRUMENTSCategories of financial instruments
2010 2009HK$’000 HK$’000
Financial assetsLoans and receivables (including cash and cash equivalents) 4,113,962 2,797,301
Financial liabilitiesAmortised cost 1,390,846 902,028
Financial risk management objectives and policiesThe Group’s financial instruments include bank balances and cash, trade and other receivables, and trade and other payables. Details of the financial instruments are disclosed in respective notes. The risks associated with these financial instruments and the policies on how to mitigate these risks are set out below. The management manages and monitors these exposures to ensure that appropriate measures are implemented on a timely and effective manner.
Market riskThere has been no change to the Group’s exposure to market risks or the manner in which it manages and measures the risks.
Currency riskSeveral subsidiaries of the Company have foreign currency sales and purchases, which expose the Group to foreign currency risk. Approximately 65% and 81% of the Group’s sales and purchases respectively are denominated in currencies other than the functional currency of the group entities making the sales and the purchases.
The carrying amounts of the group entities’ foreign currency denominated monetary assets and monetary liabilities at the reporting date are as follows:
Assets LiabilitiesCurrency 2010 2009 2010 2009
HK$’000 HK$’000 HK$’000 HK$’000
US dollars US$ 1,690,676 1,505,730 286,045 336,306Euro EUR 426,110 44,990 27,037 40,014Renminbi RMB 419,187 248,655 280,520 153,055Japanese Yen JPY 210,515 151,293 204,037 134,561Singapore dollars SG$ 49,527 39,822 89,684 60,216Others 6,317 9,445 19,747 23,230
Majority of the Group’s foreign currency financial assets and financial liabilities are denominated in US dollars which are linked up with Hong Kong dollars, where Hong Kong dollars is the functional currency of the relevant group entities. Therefore, the Group considers that it has limited currency exposure to US dollars. The currency risk of certain Japanese Yen-based receivables was eliminated against Japanese Yen trade payables. It is the Group’s policy to maintain a similar level of Japanese Yen financial assets and Japanese Yen financial liabilities to minimise the currency risk exposure of Japanese Yen. The management conducts periodic review of the exposure and requirements of various currencies, and will consider hedging significant foreign currency exposures should the need arise.

57
ASM Pacific Technology Limited Annual Report 2010
6. FINANCIAL INSTRUMENTS (Continued)Financial risk management objectives and policies (Continued)Market risk (Continued)Currency risk (Continued)Sensitivity analysisThe Group is mainly exposed to Euro, Renminbi, Japanese Yen and Singapore dollars.
The following table details the Group’s sensitivity to a 5% increase and decrease in the functional currency of the group entities against the relevant foreign currencies. 5% is the sensitivity rate used when reporting foreign currency risk internally to key management personnel and represents management’s assessment of the reasonably possible change in foreign exchange rates. The sensitivity analysis includes only outstanding foreign currency denominated monetary items and adjusts their translation at the year end for a 5% change in foreign currency rates. The analysis illustrates the impact for a 5% strengthening of the functional currency of the relevant group entities against the relevant currency and a positive and negative number below indicates an increase and a decrease in profit respectively. For a 5% weakening of the functional currency of the relevant group entities against the relevant currency, there would be an equal and opposite impact on the profit.
Euro impact (i) Renminbi impact (ii)Japanese Yen
impact (iii)Singapore
dollars impact (iv)2010 2009 2010 2009 2010 2009 2010 2009
HK$’000 HK$’000 HK$’000 HK$’000 HK$’000 HK$’000 HK$’000 HK$’000
(Decrease) increase in post tax profit (19,954) (248) (6,933) (4,780) (324) (837) 2,008 1,020
(i) This is mainly attributable to the exposure on outstanding bank balances, trade and other payables denominated in Euro at the year end.
(ii) This is mainly attributable to the exposure on outstanding bank balances, other receivables, trade and other payables denominated in Renminbi at the year end.
(iii) This is mainly attributable to the exposure on outstanding bank balances and trade payables denominated in Japanese Yen at the year end.
(iv) This is mainly attributable to the exposure on outstanding bank balances, other receivables, trade and other payables denominated in Singapore dollars at the year end.
Interest rate riskInterest income is derived from the Group’s current and fixed deposits that carry interest at the respective banking deposit rate of the banks located in Hong Kong and overseas countries.
The cash flow interest rate risk relates primary to the Group’s bank deposits (set out in note 23) carried at prevailing market rates. The Group’s bank deposits are short-term in nature and the exposure of the interest rate risk is minimal and no sensitivity to interest rate risk is presented.

585858
For the year ended 31 December 2010
NOTES TO THE CONSOLIDATED FINANCIAL STATEMENTS (CONTINUED)
6. FINANCIAL INSTRUMENTS (Continued)Financial risk management objectives and policies (Continued)Credit riskThe Group’s maximum exposure to credit risk in the event of the counterparties’ failure to perform their obligations as at 31 December 2010 in relation to each class of recognised financial assets is the carrying amount of those assets as stated in the consolidated statement of financial position. In order to manage the credit risk, the management of the Group has delegated a team responsible for determination of credit limits, credit approvals and other monitoring procedures to ensure that follow-up action is taken to recover overdue debts. In addition, the Group reviews the recoverable amount of each individual trade debt at end of the reporting period to ensure that adequate impairment losses are made for irrecoverable amounts. In this regard, the directors of the Company consider that the Group’s credit risk is significantly reduced.
The credit risk on liquid funds is limited because the counterparties are banks with high credit ratings assigned by international credit-rating agencies and authorised banks in Mainland China with high credit-ratings.
Other than concentration of credit risk on liquid funds which are deposited with several banks with high credit ratings, the Group has no significant concentration of credit risk, with exposure spread over a number of counterparties and customers and across diverse geographical areas.
Liquidity riskIn the management of the liquidity risk, the Group monitors and maintains a level of cash and cash equivalents deemed adequate by the management to finance the Group’s operations and mitigate the effects of fluctuations in cash flows.
7. TURNOVERTurnover represents the amounts received or receivable for goods sold to customers during the year, less returns.

59
ASM Pacific Technology Limited Annual Report 2010
8. SEGMENT INFORMATIONThe Group has two operating segments: sales of equipment and lead frame. The operating segments are identified on the basis of internal reports about components of the Group that are regularly reviewed by the chief operating decision maker for the purpose of allocating resources to segments and assessing their performance. The Group is organised and managed around the two major types of products manufactured by the Group. Segment results represent the profit before taxation earned by each segment without allocation of interest income, finance costs, unallocated other (expenses) income and unallocated general and administrative expenses.
An analysis of the Group’s turnover and results by operating segment is as follows:
Segment revenues and results
2010 2009HK$’000 HK$’000
Segment revenue from external customersEquipment 7,912,246 3,639,774Lead frame 1,602,843 1,092,400
9,515,089 4,732,174
Segment profitEquipment 3,140,895 948,622Lead frame 135,650 152,974
3,276,545 1,101,596Interest income 6,215 5,196Finance costs (3) –Unallocated other (expenses) income (3) 725Unallocated general and administrative expenses (63,107) (41,747)
Profit before taxation 3,219,647 1,065,770
No analysis of the Group’s assets and liabilities by operating segments is disclosed as they are not regularly provided to the chief operating decision maker for review.
The accounting policies of the operating segments are the same as the Group’s accounting policies described in note 3. This is the measure reported to the Group’s Chief Executive Officer, the chief operating decision maker, for the purpose of resource allocation and assessment of segment performance.
All of the segment revenue derived by the segments is from external customers.

606060
For the year ended 31 December 2010
NOTES TO THE CONSOLIDATED FINANCIAL STATEMENTS (CONTINUED)
8. SEGMENT INFORMATION (Continued)Other segment information
2010
Equipment Lead frame
Unallocatedgeneral and
administrativeexpenditure Consolidated
HK$’000 HK$’000 HK$’000 HK$’000
Amounts regularly provided to chief operating decision maker:Capital additions 693,819 163,703 – 857,522Additions of prepaid lease payments 21,193 – – 21,193
Amounts included in the measure of segment profit:Depreciation of property, plant and
equipment 150,864 75,894 – 226,758Release of prepaid lease payments 114 439 – 553(Gain) loss on disposal/write-off of
property, plant and equipment (364) 15,838 – 15,474Share-based payments 87,724 11,148 16,917 115,789
2009
Equipment Lead frame
Unallocatedgeneral and
administrativeexpenditure Consolidated
HK$’000 HK$’000 HK$’000 HK$’000
Amounts regularly provided to chief operating decision maker:Capital additions 72,256 38,318 – 110,574
Amounts included in the measure of segment profit:Depreciation of property, plant and
equipment 143,192 82,749 – 225,941Release of prepaid lease payments 50 444 – 494(Gain) loss on disposal of property,
plant and equipment (90) 188 – 98Share-based payments 29,651 4,159 5,982 39,792

61
ASM Pacific Technology Limited Annual Report 2010
8. SEGMENT INFORMATION (Continued)Other segment information (Continued)The information of the Group’s non-current assets by geographical location are detailed below:
Non-current assets2010 2009
HK$’000 HK$’000
Mainland China 1,167,616 521,144Malaysia 237,837 198,495Singapore 169,683 151,662Hong Kong 50,328 40,922Taiwan 3,123 2,308Japan 1,507 413Europe 821 1,032Others 2,137 1,720
1,633,052 917,696
Note: Non-current assets excluded deferred tax assets.
Geographical information by location of customers
Turnover2010 2009
HK$’000 HK$’000
Mainland China 3,581,988 1,589,767Taiwan 1,522,896 948,264Malaysia 1,147,718 466,102Korea 1,000,953 702,820Japan 587,768 62,805Thailand 430,894 268,735Hong Kong 408,026 177,253Philippines 352,165 237,221United States of America 216,738 164,332Singapore 141,199 55,705Europe 85,018 38,266Others 39,726 20,904
9,515,089 4,732,174
The revenue from individual customers contribute less than 10% of the total sales of the Group of the respective year.

626262
For the year ended 31 December 2010
NOTES TO THE CONSOLIDATED FINANCIAL STATEMENTS (CONTINUED)
9. RESEARCH AND DEVELOPMENT EXPENSESIncluded in research and development expenses are depreciation for property, plant and equipment of HK$9,706,000 (2009: HK$9,733,000) and rental of land and buildings under operating leases of HK$7,170,000 (2009: HK$7,461,000).
10. OTHER GAINS AND LOSSES
2010 2009HK$’000 HK$’000
The gains (losses) comprise:
Loss on disposal/write-off of property, plant and equipment (15,474) (98)Net foreign exchange gain (loss) 16,872 (6,156)
1,398 (6,254)
11. FINANCE COSTSThe amount represented interest on notes payable to a bank wholly repayable within five years.
12. INCOME TAX EXPENSE
2010 2009HK$’000 HK$’000
The charge (credit) comprises:
Current tax:Hong Kong 312,808 109,241Other jurisdictions 67,016 31,344
379,824 140,585
(Over)underprovision in prior years:Hong Kong (14) (99)Other jurisdictions 48 2,194
34 2,095
Deferred tax credit (note 27)Current year (2,202) (12,348)Attributable to change in tax rate (43) –
(2,245) (12,348)
377,613 130,332

63
ASM Pacific Technology Limited Annual Report 2010
12. INCOME TAX EXPENSE (Continued)(a) Hong Kong Profits Tax is calculated at 16.5% (2009: 16.5%) of the estimated assessable profit for the
year.
(b) Under the Law of the People’s Republic of China (the “PRC”) on Enterprise Income Tax (the “EIT Law”) and Implementation Regulations of the EIT Law, the Enterprise Income Tax rate of the Group’s subsidiaries in the PRC was increased from 10% and 15% to 25% progressively from 1 January 2008 onwards. The relevant tax rates for the Group’s subsidiaries in the PRC range from 22% to 25% for the year ended 31 December 2010 (2009: 20% to 25%).
(c) ASM Technology Singapore Pte Limited (“ATS”), a principal subsidiary of the Company, was previously granted the Manufacturing Headquarters (“MH”) status by the Singapore Economic Development Board (“EDB”) whereby the Group’s profit arising from the manufacturing of semiconductor equipment and materials by ATS in Singapore is non-taxable under a tax incentive covering certain new products. The tax exemption applies to profits arising for a period of 10 years from 1 January 2001, subject to the fulfillment of certain criteria during the period.
On 12 July 2010, the EDB granted a Pioneer Certificate (“PC”) to ATS to the effect that profits arising from certain new equipment and lead frame products will be exempted from tax for a period of 10 years effective from dates commenced or to be commenced between 1 June 2010 and 1 January 2012 across specified products, subject to fulfillment of certain criteria during the relevant periods. EDB also granted a 5-year Development and Expansion Incentive to ATS to the effect that the profits arising from certain existing products shall be subject to a concessionary tax rate of 10% for a period of 5 years from 1 January 2011, subject to the fulfillment of certain criteria during the relevant period.
On the same date, EDB also granted ATS an International Headquarters Award to the effect that certain income arising from qualifying activities conducted by ATS, excluding income from business transactions with companies or end customers in Singapore, shall be subject to a concessionary tax rate of 5% for a period of 10 years from 1 January 2011, subject to fulfillment of certain criteria during the relevant period.
Income arising from activities not covered under the abovementioned incentives is taxed at the prevailing corporate tax rate in Singapore of 17% (2009: 17%).
(d) Taxation for other jurisdictions is calculated at the rates prevailing in the relevant jurisdictions.

646464
For the year ended 31 December 2010
NOTES TO THE CONSOLIDATED FINANCIAL STATEMENTS (CONTINUED)
12. INCOME TAX EXPENSE (Continued)The tax charge for the year can be reconciled to the profit before taxation in the consolidated statement of comprehensive income as follows:
2010 2009HK$’000 HK$’000
Profit before taxation 3,219,647 1,065,770
Tax at the domestic income tax rate of 16.5% (2009: 16.5%) 531,242 175,852Tax effect of expenses not deductible in determining taxable profit 12,903 1,679Tax effect of income not taxable in determining taxable profit (7,505) (1,937)Tax effect of tax losses not recognised 6,417 13,915Tax effect of utilisation of tax losses previously not recognised (35,066) (863)Effect of different tax rates of subsidiaries operating in
other jurisdictions 728 (13,987)Effect of tax exemption under the MH status and PC granted by EDB (135,079) (36,965)Other temporary difference arising from change in the EIT Law – (9,191)Underprovision in prior years 34 2,095Others 3,939 (266)
Tax charge for the year 377,613 130,332
Note: The domestic income tax rate (which is the Hong Kong Profits Tax rate) in the jurisdiction where the operation of the Group is substantially based is used.
The Company continued to receive letters from the Hong Kong Inland Revenue Department during the year ended 31 December 2010 seeking information relating to Hong Kong Profits Tax and other tax affairs of certain subsidiaries of the Company. The enquiries might lead to additional tax being charged on profits from some overseas subsidiaries that have not previously been included in the scope of charge for Hong Kong Profits Tax. As at 31 December 2010, the Group purchased tax reserve certificates amounting to HK$137,929,000 (2009: HK$101,000,000), as disclosed in note 21.
Based on legal and other professional advice that the Company has sought, the directors continued to be of the opinion that the Company and its subsidiaries have a case to pursue. The directors also consider that sufficient provision for taxation has been made in the consolidated financial statements and the amounts paid under the tax reserve certificates are fully recoverable.

65
ASM Pacific Technology Limited Annual Report 2010
13. PROFIT FOR THE YEAR
2010 2009HK$’000 HK$’000
Profit for the year has been arrived at after charging:
Auditor’s remuneration 6,587 5,420Depreciation for property, plant and equipment 226,758 225,941Employee benefits expense, including directors’ emoluments 1,643,483 975,147Minimum lease payments for land and buildings under
operating leases 59,624 48,527Release of prepaid lease payments 553 494Shipping and handling expenses (included in selling and
distribution expenses) 46,453 23,019
and after crediting:
Government grants (Note) 5,741 12,649Interest income on bank deposits 6,215 5,196
Note: Government grants included an amount of HK$2,222,000 (2009: HK$10,672,000) which has been received in the current year towards employment subsidy under the Jobs Credit Scheme in Singapore. This amount has been deducted in reporting employee benefits expense for the year. The remaining amount represents mainly government grants received from government authorities in Mainland China.
14. DIRECTORS’ EMOLUMENTSThe emoluments paid or payable to each of the eleven (2009: ten) directors were as follows:
Year ended 31 December 2010
Arthur H.del Prado
CharlesDean del
PradoRobert A.
Ruijter
PetrusAntonius
Maria vanBommel
Lee WaiKwong
Lo TsanYin, Peter
Chow Chuen,James
Tang Koon Hung, Eric
OrasaLivasiri
Lee ShiuHung,
Robert
Lok Kam Chong,
John TotalHK$’000 HK$’000 HK$’000 HK$’000 HK$’000 HK$’000 HK$’000 HK$’000 HK$’000 HK$’000 HK$’000 HK$’000
(Note e) (Note f) (Note g) (Note d)
Fees – – – – – – – – 300 300 300 900Other emoluments
Salaries and other benefits – – – – 11,568 10,067 7,951 185 – – – 29,771Contributions to retirement
benefits schemes – – – – 211 12 293 1 – – – 517Performance related incentive
bonus payments (Note a) – – – – 1,877 1,867 1,494 826 – – – 6,064
Total emoluments – – – – 13,656 11,946 9,738 1,012 300 300 300 37,252

666666
For the year ended 31 December 2010
NOTES TO THE CONSOLIDATED FINANCIAL STATEMENTS (CONTINUED)
14. DIRECTORS’ EMOLUMENTS (Continued)
Year ended 31 December 2009
Arnold Lee Lo Chow Tang Lee LokArthur H. Robert A. J.M. Wai Tsan Yin, Chuen, Koon Hung, Orasa Shiu Hung, Kam Chong,del Prado Ruijter van der Ven Kwong Peter James Eric Livasiri Robert John Total
HK$’000 HK$’000 HK$’000 HK$’000 HK$’000 HK$’000 HK$’000 HK$’000 HK$’000 HK$’000 HK$’000(Note c) (Note b)
Fees – – – – – – – 300 300 300 900Other emoluments
Salaries and other benefits – – – 5,757 5,282 3,865 2,805 – – – 17,709Contributions to retirement
benefits schemes – – – 199 12 269 12 – – – 492Performance related incentive
bonus payments (Note a) – – – 1,738 1,750 1,400 315 – – – 5,203
Total emoluments – – – 7,694 7,044 5,534 3,132 300 300 300 24,304
Notes:
(a) The performance related incentive bonus payments are determined with reference to the operating results, individual performance and comparable market statistics in both years.
(b) Resigned on 27 May 2009.
(c) Appointed on 30 October 2009.
(d) Resigned on 1 February 2010.
(e) Appointed on 29 April 2010.
(f) Resigned as a non-executive director on 29 October 2010 and then appointed as an alternate director to Petrus Antonius Maria van Bommel upon his appointment as a non-executive director (see note (g) below) and Charles Dean del Prado.
(g) Appointed on 29 October 2010.
For the year ended 31 December 2010, 284,000 shares (2009: 334,000 shares) of the Company were issued to certain executive directors under the Employee Share Incentive Scheme (the “Scheme”), and the fair value of these shares amounting to HK$19,042,000 (2009: HK$6,530,000) at the grant date was included in salaries and other benefits above.
No directors waived any emoluments in both years.
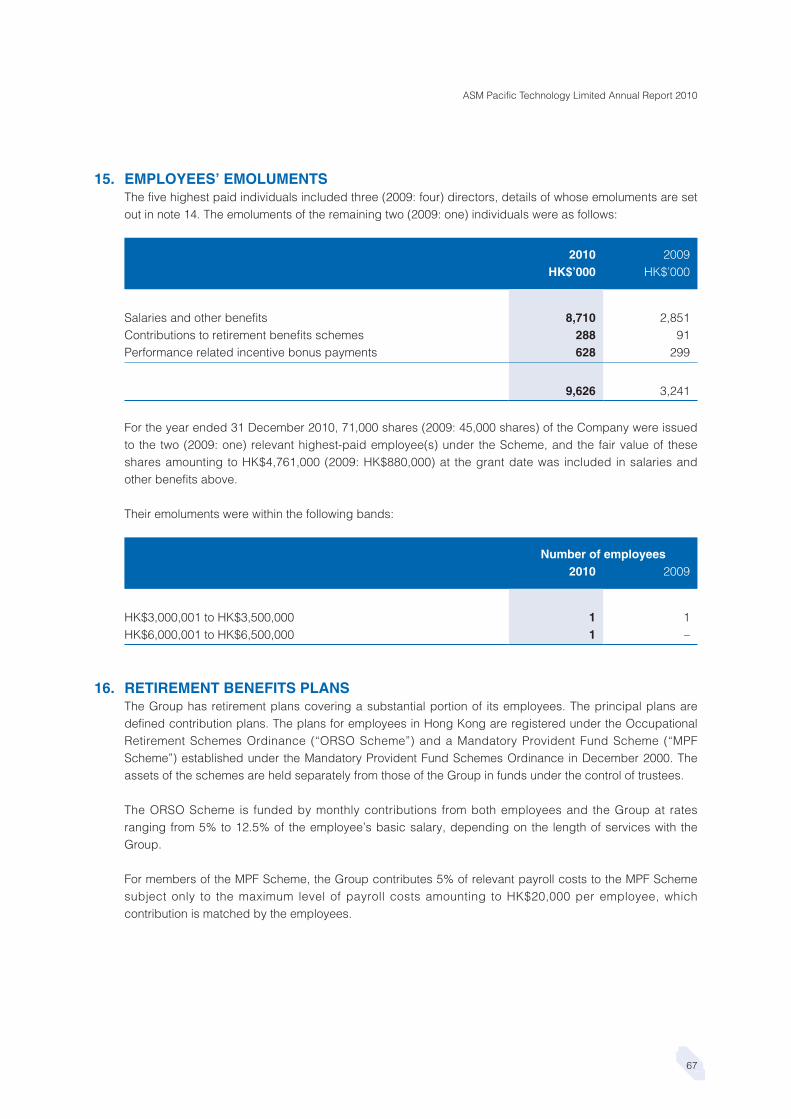
67
ASM Pacific Technology Limited Annual Report 2010
15. EMPLOYEES’ EMOLUMENTSThe five highest paid individuals included three (2009: four) directors, details of whose emoluments are set out in note 14. The emoluments of the remaining two (2009: one) individuals were as follows:
2010 2009HK$’000 HK$’000
Salaries and other benefits 8,710 2,851Contributions to retirement benefits schemes 288 91Performance related incentive bonus payments 628 299
9,626 3,241
For the year ended 31 December 2010, 71,000 shares (2009: 45,000 shares) of the Company were issued to the two (2009: one) relevant highest-paid employee(s) under the Scheme, and the fair value of these shares amounting to HK$4,761,000 (2009: HK$880,000) at the grant date was included in salaries and other benefits above.
Their emoluments were within the following bands:
Number of employees2010 2009
HK$3,000,001 to HK$3,500,000 1 1HK$6,000,001 to HK$6,500,000 1 –
16. RETIREMENT BENEFITS PLANSThe Group has retirement plans covering a substantial portion of its employees. The principal plans are defined contribution plans. The plans for employees in Hong Kong are registered under the Occupational Retirement Schemes Ordinance (“ORSO Scheme”) and a Mandatory Provident Fund Scheme (“MPF Scheme”) established under the Mandatory Provident Fund Schemes Ordinance in December 2000. The assets of the schemes are held separately from those of the Group in funds under the control of trustees.
The ORSO Scheme is funded by monthly contributions from both employees and the Group at rates ranging from 5% to 12.5% of the employee’s basic salary, depending on the length of services with the Group.
For members of the MPF Scheme, the Group contributes 5% of relevant payroll costs to the MPF Scheme subject only to the maximum level of payroll costs amounting to HK$20,000 per employee, which contribution is matched by the employees.
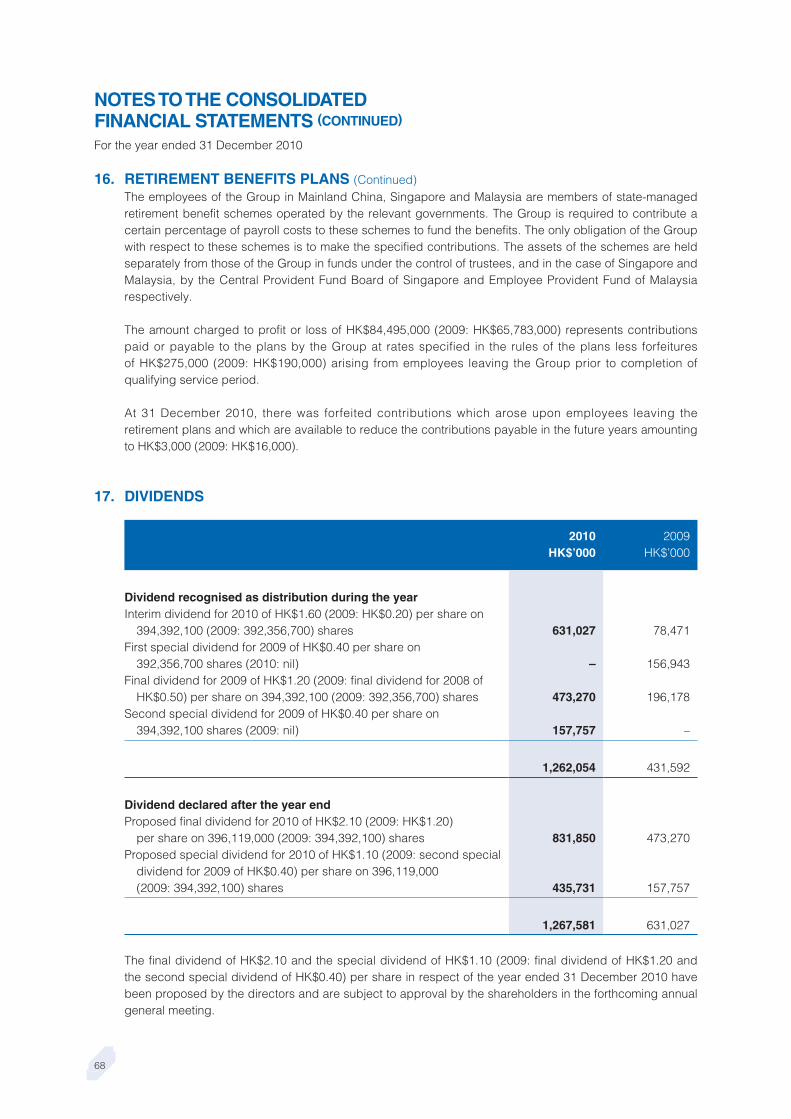
686868
For the year ended 31 December 2010
NOTES TO THE CONSOLIDATED FINANCIAL STATEMENTS (CONTINUED)
16. RETIREMENT BENEFITS PLANS (Continued)The employees of the Group in Mainland China, Singapore and Malaysia are members of state-managed retirement benefit schemes operated by the relevant governments. The Group is required to contribute a certain percentage of payroll costs to these schemes to fund the benefits. The only obligation of the Group with respect to these schemes is to make the specified contributions. The assets of the schemes are held separately from those of the Group in funds under the control of trustees, and in the case of Singapore and Malaysia, by the Central Provident Fund Board of Singapore and Employee Provident Fund of Malaysia respectively.
The amount charged to profit or loss of HK$84,495,000 (2009: HK$65,783,000) represents contributions paid or payable to the plans by the Group at rates specified in the rules of the plans less forfeitures of HK$275,000 (2009: HK$190,000) arising from employees leaving the Group prior to completion of qualifying service period.
At 31 December 2010, there was forfeited contributions which arose upon employees leaving the retirement plans and which are available to reduce the contributions payable in the future years amounting to HK$3,000 (2009: HK$16,000).
17. DIVIDENDS
2010 2009HK$’000 HK$’000
Dividend recognised as distribution during the year Interim dividend for 2010 of HK$1.60 (2009: HK$0.20) per share on
394,392,100 (2009: 392,356,700) shares 631,027 78,471First special dividend for 2009 of HK$0.40 per share on
392,356,700 shares (2010: nil) – 156,943Final dividend for 2009 of HK$1.20 (2009: final dividend for 2008 of
HK$0.50) per share on 394,392,100 (2009: 392,356,700) shares 473,270 196,178Second special dividend for 2009 of HK$0.40 per share on
394,392,100 shares (2009: nil) 157,757 –
1,262,054 431,592
Dividend declared after the year endProposed final dividend for 2010 of HK$2.10 (2009: HK$1.20)
per share on 396,119,000 (2009: 394,392,100) shares 831,850 473,270Proposed special dividend for 2010 of HK$1.10 (2009: second special
dividend for 2009 of HK$0.40) per share on 396,119,000 (2009: 394,392,100) shares 435,731 157,757
1,267,581 631,027
The final dividend of HK$2.10 and the special dividend of HK$1.10 (2009: final dividend of HK$1.20 and the second special dividend of HK$0.40) per share in respect of the year ended 31 December 2010 have been proposed by the directors and are subject to approval by the shareholders in the forthcoming annual general meeting.

69
ASM Pacific Technology Limited Annual Report 2010
18. EARNINGS PER SHAREThe calculation of the basic and diluted earnings per share attributable to the owners of the Company is based on the following data:
2010 2009HK$’000 HK$’000
Earnings for the purposes of basic and diluted earnings per share (Profit for the year) 2,842,034 935,438
Number of shares(in thousands)
Weighted average number of ordinary shares for the purpose of basic earnings per share 394,472 392,451
Effect of dilutive potential shares from the Scheme 1,378 1,622
Weighted average number of ordinary shares for the purpose of diluted earnings per share 395,850 394,073
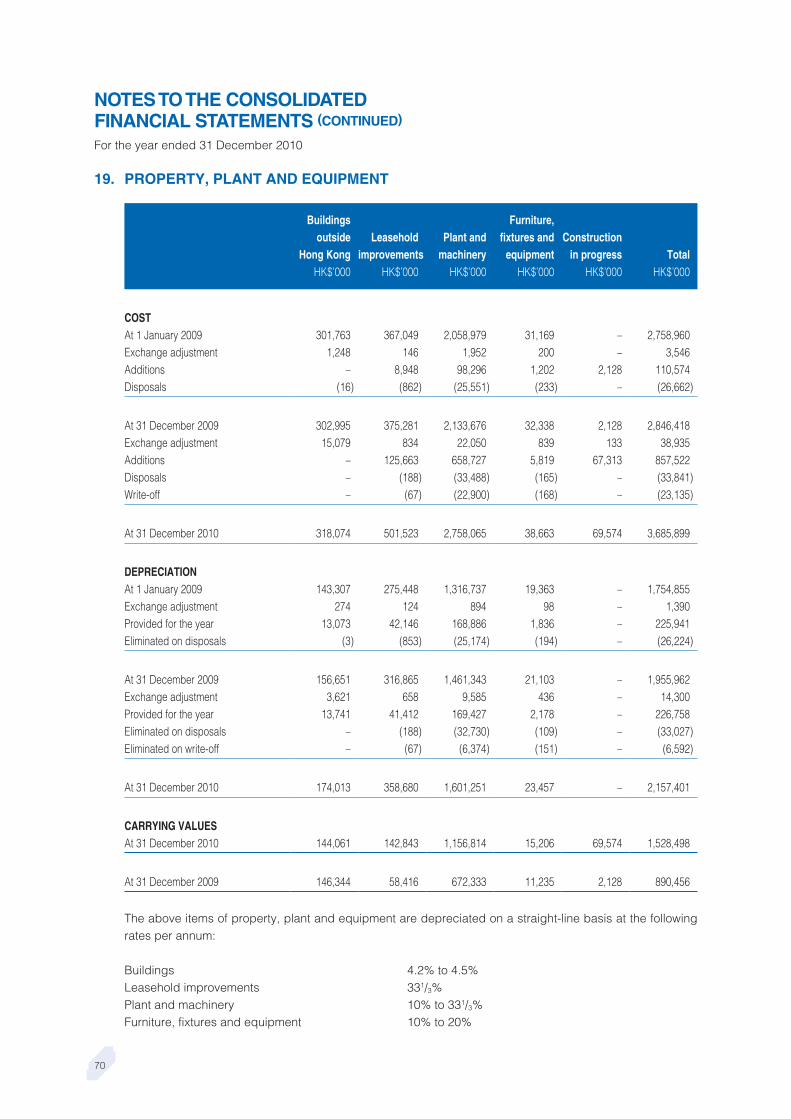
707070
For the year ended 31 December 2010
NOTES TO THE CONSOLIDATED FINANCIAL STATEMENTS (CONTINUED)
19. PROPERTY, PLANT AND EQUIPMENT
Buildingsoutside
Hong KongLeasehold
improvementsPlant and
machinery
Furniture,fixtures and
equipmentConstruction
in progress TotalHK$’000 HK$’000 HK$’000 HK$’000 HK$’000 HK$’000
COSTAt 1 January 2009 301,763 367,049 2,058,979 31,169 – 2,758,960Exchange adjustment 1,248 146 1,952 200 – 3,546Additions – 8,948 98,296 1,202 2,128 110,574Disposals (16) (862) (25,551) (233) – (26,662)
At 31 December 2009 302,995 375,281 2,133,676 32,338 2,128 2,846,418Exchange adjustment 15,079 834 22,050 839 133 38,935Additions – 125,663 658,727 5,819 67,313 857,522Disposals – (188) (33,488) (165) – (33,841)Write-off – (67) (22,900) (168) – (23,135)
At 31 December 2010 318,074 501,523 2,758,065 38,663 69,574 3,685,899
DEPRECIATIONAt 1 January 2009 143,307 275,448 1,316,737 19,363 – 1,754,855Exchange adjustment 274 124 894 98 – 1,390Provided for the year 13,073 42,146 168,886 1,836 – 225,941Eliminated on disposals (3) (853) (25,174) (194) – (26,224)
At 31 December 2009 156,651 316,865 1,461,343 21,103 – 1,955,962Exchange adjustment 3,621 658 9,585 436 – 14,300Provided for the year 13,741 41,412 169,427 2,178 – 226,758Eliminated on disposals – (188) (32,730) (109) – (33,027)Eliminated on write-off – (67) (6,374) (151) – (6,592)
At 31 December 2010 174,013 358,680 1,601,251 23,457 – 2,157,401
CARRYING VALUESAt 31 December 2010 144,061 142,843 1,156,814 15,206 69,574 1,528,498
At 31 December 2009 146,344 58,416 672,333 11,235 2,128 890,456
The above items of property, plant and equipment are depreciated on a straight-line basis at the following rates per annum:
Buildings 4.2% to 4.5%Leasehold improvements 331/3%Plant and machinery 10% to 331/3%Furniture, fixtures and equipment 10% to 20%

71
ASM Pacific Technology Limited Annual Report 2010
20. PREPAID LEASE PAYMENTSThe Group’s prepaid lease payments represent property interests in leasehold land outside Hong Kong under medium-term leases.
Analysed for reporting purposes as:
2010 2009HK$’000 HK$’000
Current 977 494Non-current 28,782 7,901
29,759 8,395
21. TRADE AND OTHER RECEIVABLES
2010 2009HK$’000 HK$’000
Trade receivables 1,895,898 1,357,057Amount due from ASM International – trade (Note a) 30 32Other receivables, deposits and prepayments (Note b) 256,874 114,663Tax reserve certificate recoverable 137,929 101,000
2,290,731 1,572,752
Less: Non-current rental deposits paid shown under non-current assets (10,261) –
2,280,470 1,572,752
An aging analysis of trade receivables is as follows:
Not yet due 1,444,641 978,543Overdue within 30 days 252,653 202,379Overdue within 31 to 60 days 116,569 107,160Overdue within 61 to 90 days 50,781 31,052Overdue over 90 days 31,254 37,923
1,895,898 1,357,057
Notes:
(a) Amount due from ASM International is not yet due, unsecured, non-interest bearing and repayable according to normal trade terms.
(b) The amount included VAT receivables amounting to HK$198,657,000 (2009: HK$67,067,000).

727272
For the year ended 31 December 2010
NOTES TO THE CONSOLIDATED FINANCIAL STATEMENTS (CONTINUED)
21. TRADE AND OTHER RECEIVABLES (Continued)Credit policy: Payment terms with customers are mainly on credit together with deposits received in
advance. Invoices are normally payable within 30 days to 60 days of issuance, except for certain well established customers, where the terms are extended to 3 to 4 months. Each customer has a pre-set maximum credit limit.
Included in the Group’s trade receivables are debtors with an aggregate amount of HK$451,257,000 (2009: HK$378,514,000) which are past due at the reporting date for which the Group has not provided for impairment loss. Based on the historical experiences of the Group, those trade receivables that are past due but not impaired are generally recoverable. The trade and other receivables that are neither past due nor impaired are of good credit quality.
22. INVENTORIES
2010 2009HK$’000 HK$’000
Raw materials 485,539 286,936Work in progress 988,146 559,795Finished goods 150,497 157,214
1,624,182 1,003,945
23. BANK DEPOSITS WITH ORIGINAL MATURITY OF MORE THAN THREE MONTHS/BANK BALANCES AND CASHBank balances, current and fixed deposits carry interest at market rates which ranges from 0.001% to 2.2% (2009: 0.001% to 2.325%) per annum.

73
ASM Pacific Technology Limited Annual Report 2010
24. TRADE AND OTHER PAYABLES
2010 2009HK$’000 HK$’000
Trade payables 982,204 737,116Amounts due to subsidiaries of ASM International – trade (Note) 880 277Accrued charges 515,963 292,888Deposits received from customers 280,848 136,835Payables arising from acquisition of property, plant and equipment 206,137 116Other payables 7,372 599
1,993,404 1,167,831
An aging analysis of trade payables is as follows:
Not yet due 615,949 497,834Overdue within 30 days 270,895 189,557Overdue within 31 to 60 days 72,067 39,075Overdue within 61 to 90 days 16,977 4,284Overdue over 90 days 6,316 6,366
982,204 737,116
Note: Amounts due to subsidiaries of ASM International are not yet due, unsecured, non-interest bearing and repayable according to normal trade terms.
The average credit period on purchases of goods is 90 days. The Group has financial risk management policies in place to ensure that all payables are within the credit time frame.

747474
For the year ended 31 December 2010
NOTES TO THE CONSOLIDATED FINANCIAL STATEMENTS (CONTINUED)
25. SHARE CAPITAL OF THE COMPANY
Number of shares Share capital2010 2009 2010 2009’000 ’000 HK$’000 HK$’000
Issued and fully paid:
At 1 January 394,392 392,357 39,439 39,236Shares issued under the Scheme 1,727 2,035 173 203
At 31 December 396,119 394,392 39,612 39,439
The authorised share capital of the Company is HK$50 million, comprising 500 million shares of HK$0.10 each.
During the year, 1,726,900 (2009: 2,035,400) shares were issued at par to eligible employees and members of management under the Scheme.
26. EMPLOYEE SHARE INCENTIVE SCHEMEThe Scheme is for the benefit of the Group’s employees and members of management and has a life of 10 years starting from March 1990. On 25 June 1999, at an extraordinary general meeting of the Company, the shareholders approved to extend the period of the Scheme for a further term of 10 years up to 23 March 2010 and allow up to 5% of the issued share capital of the Company from time to time, excluding any shares of the Company subscribed for or purchased pursuant to the Scheme since 23 March 1990, to be subscribed for or purchased pursuant to the Scheme during the extended period.
At the annual general meeting of the Company held on 24 April 2009, the shareholders approved to extend the period of the Scheme for a term of a further 10 years up to 23 March 2020 and allow up to 7.5% of the issued share capital of the Company from time to time (excluding any shares subscribed for or purchased pursuant to the Scheme since 23 March 1990) to be subscribed for or purchased pursuant to the Scheme during such extended period and that no more than 3.5% of the issued share capital of the Company from time to time (excluding any shares subscribed for or purchased pursuant to the Scheme since 23 March 1990) to be subscribed for or purchased pursuant to the Scheme for the period from 24 March 2010 to 23 March 2015.
On 2 March 2009, the directors resolved to contribute HK$205,660 to the Scheme and to grant a total of 2,056,600 shares in the Company, enabling the trustees of the Scheme to subscribe for the shares granted for the benefit of employees and members of the management of the Group upon expiration of the defined qualification period as determined by the Board of Directors. The vesting period of such grant was from 2 March 2009 to 15 December 2009. 2,035,400 of these shares entitlements were issued on 15 December 2009 and the estimated fair value of these shares at the grant date amounted to HK$39,792,000. 21,200 shares were forfeited and unallotted by the Company on the same date. The fair value was determined with reference to market value of shares at the grant date taking into account of the expected dividend as employee is not entitled to receive dividend paid during the vesting period.

75
ASM Pacific Technology Limited Annual Report 2010
26. EMPLOYEE SHARE INCENTIVE SCHEME (Continued)On 2 March 2010, the directors resolved to contribute HK$174,710 to the Scheme and to grant a total of 1,747,100 shares in the Company, enabling the trustee of the Scheme to subscribe for the shares granted for the benefit of employees and members of the management of the Group upon expiration of the defined qualification period as determined by the Board of Directors. The vesting period of such grant was from 2 March 2010 to 15 December 2010. 1,726,900 of these shares entitlements were issued on 15 December 2010 and the estimated fair value of these shares at the grant date amounted to HK$115,789,000. 20,200 shares were forfeited and unallotted by the Company on the same date. The fair value was determined with reference to market value of shares at the grant date taking into account of the expected dividends as employee is not entitled to receive dividends paid during the vesting period.
27. DEFERRED TAXATIONA summary of the major deferred tax liabilities and assets recognised and movements thereon during the current and prior years is as follows:
Depreciation Tax losses Others TotalHK$’000 HK$’000 HK$’000 HK$’000
(Note)
At 1 January 2009 (184) (1,806) (6,091) (8,081)(Credit) charge to profit or loss
for the year (9,322) 337 (3,363) (12,348)Exchange differences 2 (28) (47) (73)
At 31 December 2009 (9,504) (1,497) (9,501) (20,502)Charge (credit) to profit or loss
for the year 277 1,610 (4,089) (2,202)Effect of change in tax rate – – (43) (43)Exchange differences (11) (113) (14) (138)
At 31 December 2010 (9,238) – (13,647) (22,885)
Note: The deferred tax arose from the temporary difference between the carrying amount of the property, plant and equipment and its tax base. As at 31 December 2010 and 2009, the tax depreciation was less than accounting depreciation. A deductible temporary difference arose, and resulted in a deferred tax asset. During the year ended 31 December 2009, one of the Group’s PRC subsidiaries changed the residual value of property, plant and equipment for tax purpose from 10% to 0% and an amount of HK$9,191,000 was credited to profit or loss during the year ended 31 December 2009.

767676
For the year ended 31 December 2010
NOTES TO THE CONSOLIDATED FINANCIAL STATEMENTS (CONTINUED)
27. DEFERRED TAXATION (Continued)The following is the analysis of the deferred tax balances for the purpose of presentation in the consolidated statement of financial position:
2010 2009HK$’000 HK$’000
Deferred tax liabilities 610 555Deferred tax assets (23,495) (21,057)
(22,885) (20,502)
At 31 December 2010, the Group had unused tax losses of HK$461,113,000 (2009: HK$455,866,000) available to offset future taxable profits. At 31 December 2009, a deferred tax asset amounting to HK$1,497,000 was recognised for such losses and no deferred tax asset was recognised in respect of the remaining tax losses of HK$451,589,000 due to the unpredictability of future profit streams. At 31 December 2010, no deferred tax was recognised in respect of the tax losses of HK$461,113,000 due to the unpredictability of future profit streams. Included in the unrecognised tax losses are losses of HK$14,969,000 that will expire during the year 2016 to 2019 (2009: HK$75,485,000 that will expire during the year 2010 to 2018). Other losses may be carried forward indefinitely.
Under the EIT Law of PRC, withholding tax is imposed on dividends declared in respect of profits earned by PRC subsidiaries from 1 January 2008 onwards. Deferred taxation has not been provided in the consolidated financial statements in respect of temporary difference attributable to accumulated profits of the PRC subsidiaries amounted to HK$208,379,000 (2009: HK$84,173,000) as the Group is able to control the timing of the reversal of the temporary difference and it is probable that the temporary differences will not reverse in the foreseeable future.
28. CONTINGENT LIABILITIES
2010 2009HK$’000 HK$’000
Guarantees given to the Singapore government for work permits of foreign workers in Singapore 3,000 443
29. CAPITAL COMMITMENTS
2010 2009HK$’000 HK$’000
Capital expenditure in respect of the acquisition of property, plant and equipment contracted for but not provided in the consolidated financial statements 213,378 87,554
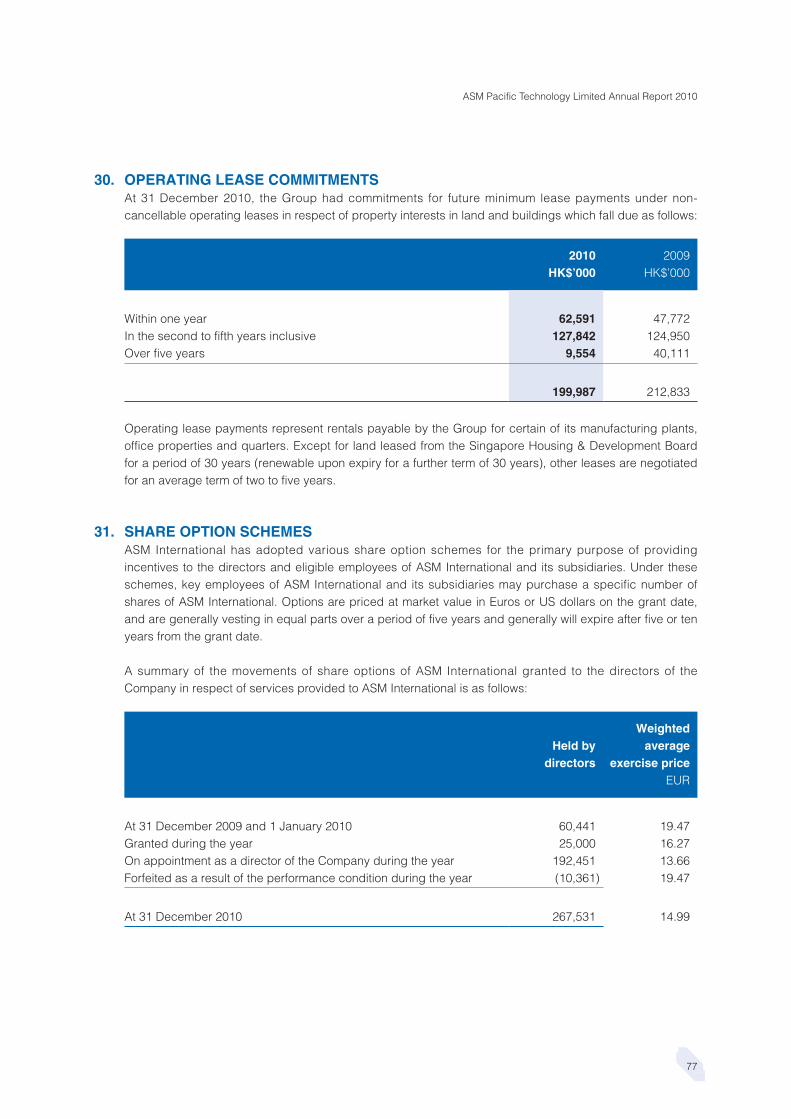
77
ASM Pacific Technology Limited Annual Report 2010
30. OPERATING LEASE COMMITMENTSAt 31 December 2010, the Group had commitments for future minimum lease payments under non-cancellable operating leases in respect of property interests in land and buildings which fall due as follows:
2010 2009HK$’000 HK$’000
Within one year 62,591 47,772In the second to fifth years inclusive 127,842 124,950Over five years 9,554 40,111
199,987 212,833
Operating lease payments represent rentals payable by the Group for certain of its manufacturing plants, office properties and quarters. Except for land leased from the Singapore Housing & Development Board for a period of 30 years (renewable upon expiry for a further term of 30 years), other leases are negotiated for an average term of two to five years.
31. SHARE OPTION SCHEMESASM International has adopted various share option schemes for the primary purpose of providing incentives to the directors and eligible employees of ASM International and its subsidiaries. Under these schemes, key employees of ASM International and its subsidiaries may purchase a specific number of shares of ASM International. Options are priced at market value in Euros or US dollars on the grant date, and are generally vesting in equal parts over a period of five years and generally will expire after five or ten years from the grant date.
A summary of the movements of share options of ASM International granted to the directors of the Company in respect of services provided to ASM International is as follows:
Held by directors
Weighted average
exercise priceEUR
At 31 December 2009 and 1 January 2010 60,441 19.47Granted during the year 25,000 16.27On appointment as a director of the Company during the year 192,451 13.66Forfeited as a result of the performance condition during the year (10,361) 19.47
At 31 December 2010 267,531 14.99

787878
For the year ended 31 December 2010
NOTES TO THE CONSOLIDATED FINANCIAL STATEMENTS (CONTINUED)
32. CONNECTED AND RELATED PARTY TRANSACTIONS(a) During the year, the Group paid a management fee of HK$750,000 (2009: HK$750,000) to ASM
International under a consultancy agreement between ASM International and the Company, which also constituted a connected transaction as defined under the Listing Rules. Pursuant to the original consultancy agreement, an annual management fee of HK$1.5 million is payable to ASM International which acts as a consultant, introduces new business and provides assistance in business development, general management support and services, international expertise and market information to the Group. The annual management fee was revised to HK$750,000 effective from 1 January 2006. The consultancy agreement, which commenced on 5 December 1988, was for an initial period of three years and is terminable thereafter by six months’ notice in writing by either party.
(b) Compensation of key management personnel
The emoluments of directors and other members of key management during the year were as follows:
2010 2009HK$’000 HK$’000
Short-term benefits 23,751 21,146Post-employment benefits 888 743Share-based payments 24,607 7,898
49,246 29,787
Shares of the Company were issued to the key management under the Scheme. The estimated fair value of such shares were included in share-based payments for both years.
The emoluments of directors and key executives are determined by the Remuneration Committee having regard to the performance of individuals and market trends.
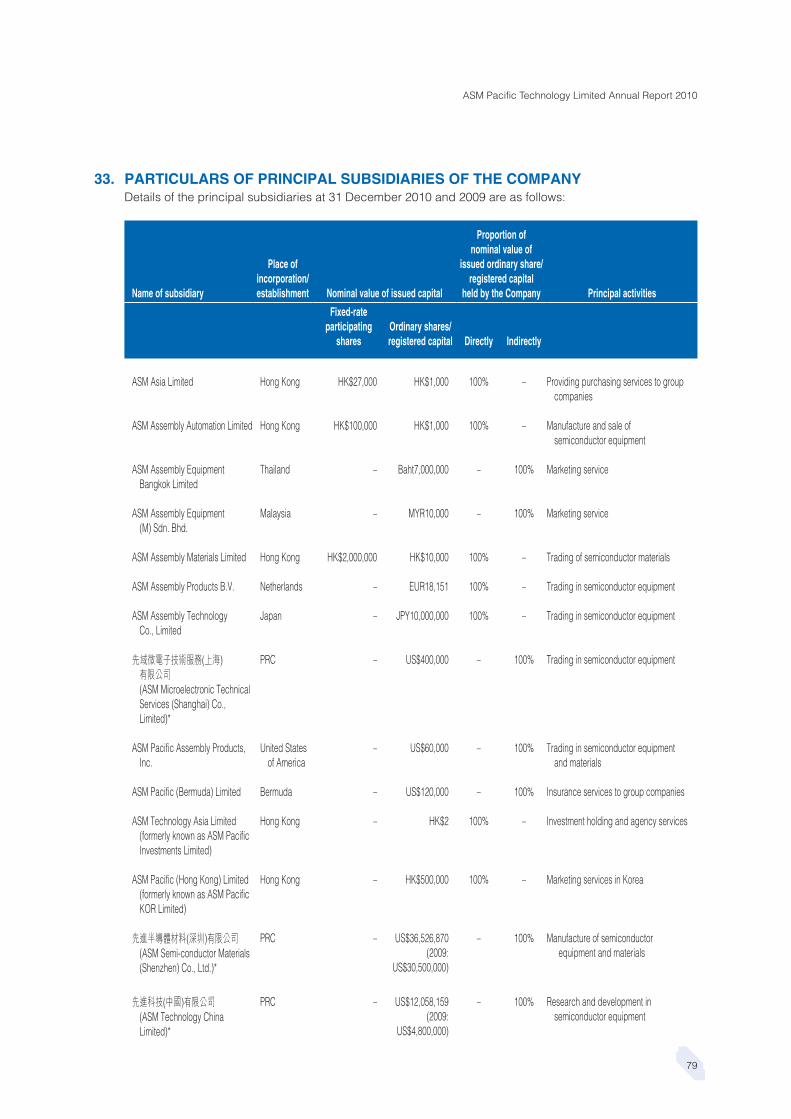
79
ASM Pacific Technology Limited Annual Report 2010
33. PARTICULARS OF PRINCIPAL SUBSIDIARIES OF THE COMPANYDetails of the principal subsidiaries at 31 December 2010 and 2009 are as follows:
Name of subsidiary
Place of incorporation/establishment Nominal value of issued capital
Proportion of nominal value of
issued ordinary share/registered capital
held by the Company Principal activities
Fixed-rate participating
sharesOrdinary shares/registered capital Directly Indirectly
ASM Asia Limited Hong Kong HK$27,000 HK$1,000 100% – Providing purchasing services to group companies
ASM Assembly Automation Limited Hong Kong HK$100,000 HK$1,000 100% – Manufacture and sale ofsemiconductor equipment
ASM Assembly EquipmentBangkok Limited
Thailand – Baht7,000,000 – 100% Marketing service
ASM Assembly Equipment(M) Sdn. Bhd.
Malaysia – MYR10,000 – 100% Marketing service
ASM Assembly Materials Limited Hong Kong HK$2,000,000 HK$10,000 100% – Trading of semiconductor materials
ASM Assembly Products B.V. Netherlands – EUR18,151 100% – Trading in semiconductor equipment
ASM Assembly Technology Co., Limited
Japan – JPY10,000,000 100% – Trading in semiconductor equipment
先域微電子技術服務(上海)有限公司(ASM Microelectronic Technical Services (Shanghai) Co., Limited)*
PRC – US$400,000 – 100% Trading in semiconductor equipment
ASM Pacific Assembly Products, Inc.
United Statesof America
– US$60,000 – 100% Trading in semiconductor equipmentand materials
ASM Pacific (Bermuda) Limited Bermuda – US$120,000 – 100% Insurance services to group companies
ASM Technology Asia Limited(formerly known as ASM Pacific Investments Limited)
Hong Kong – HK$2 100% – Investment holding and agency services
ASM Pacific (Hong Kong) Limited (formerly known as ASM Pacific KOR Limited)
Hong Kong – HK$500,000 100% – Marketing services in Korea
先進半導體材料(深圳)有限公司(ASM Semi-conductor Materials (Shenzhen) Co., Ltd.)*
PRC – US$36,526,870(2009:
US$30,500,000)
– 100% Manufacture of semiconductor equipment and materials
先進科技(中國)有限公司(ASM Technology China Limited)*
PRC – US$12,058,159(2009:
US$4,800,000)
– 100% Research and development in semiconductor equipment

808080
For the year ended 31 December 2010
NOTES TO THE CONSOLIDATED FINANCIAL STATEMENTS (CONTINUED)
33. PARTICULARS OF PRINCIPAL SUBSIDIARIES OF THE COMPANY (Continued)
Name of subsidiary
Place of incorporation/establishment Nominal value of issued capital
Proportion of nominal value of
issued ordinary share/registered capital
held by the Company Principal activities
Fixed-rate participating
sharesOrdinary shares/registered capital Directly Indirectly
先進科技(惠州)有限公司(ASM Technology (Huizhou) Co.,
Ltd.) (Note b)*
PRC – US$34,000,000 – 100% Manufacture of semiconductor equipment
ASM Technology (M) Sdn. Bhd. Malaysia – MYR74,000,000 100% – Manufacture of semiconductor equipment and materials
ASM Technology SingaporePte Limited
Singapore – S$53,000,000 100% – Manufacture and sale of semiconductor equipment and materials
Edgeward Development Limited Guernsey, Channel Islands
– US$10,000 – 100% Investment holding and provision of manufacturing and marketing infrastructure in Mainland China and Asia
進峰貿易(深圳)有限公司(Edgeward Trading (Shenzhen) Limited)*
PRC – US$300,000 – 100% Trading in semiconductor equipment and materials
深圳先進微電子科技有限公司(Shenzhen ASM Micro Electronic TechnologyCo., Limited)
PRC – (Note a) – (Note a) Manufacture of semiconductor equipment
Notes:
(a) Under a joint venture agreement, the Group has committed to contribute 100% of the registered capital of HK$638,300,000 in 深圳先進微電子科技有限公司 (Shenzhen ASM Micro Electronic Technology Co., Limited) (“MET”), a co-operative joint venture company established in the PRC with a term of 10 years commencing October 1994. On 23 February 2004, the term was approved to be extended for a period of five years to October 2009. On 23 June 2009, the term was approved to be extended for a further period of seven years to October 2016. At 31 December 2010, the Group has paid up HK$632,955,170 (2009: HK$497,300,000) as registered capital of MET. The Group has to bear the entire risk and liabilities of MET and, other than annual amount of HK$8,160,000 (2009: HK$7,794,000) attributable to assets provided by the PRC joint venture partner, is entitled to the entire profit or loss of MET. On cessation of the joint venture company, the Group will be entitled to all assets other than those provided by the PRC joint venture partner and those irremovable building improvements. The annual amount paid to the PRC joint venture partner was included in the minimum lease payments during the year. The commitment for the future payments was included in the operating lease commitments as at 31 December 2010 and 2009 in note 30.
(b) Established on 9 June 2010.
* Established as a wholly foreign owned enterprise in the PRC.

81
ASM Pacific Technology Limited Annual Report 2010
33. PARTICULARS OF PRINCIPAL SUBSIDIARIES OF THE COMPANY (Continued)All the principal subsidiaries operate predominantly in their respective places of incorporation/establishment unless specified otherwise under the heading “principal activities”.
The fixed-rate participating shares of the subsidiaries are held by ASM International. These shares carry no voting rights, no rights to participate in a distribution of profits, and very limited rights on a return of capital.
No debt security has been issued by any of the subsidiaries at any time during the year or is outstanding at the end of the year.
The above table lists the subsidiaries of the Group which, in the opinion of the directors, principally affected the results or net assets of the Group. To give details of other subsidiaries would, in the opinion of the directors, result in particulars of excessive length.
34. EVENT AFTER THE REPORTING PERIODOn 28 July 2010, the Company entered into an acquisition agreement (the “Acquisition Agreement”) with Siemens Aktiengesellschaft (the “Seller”) pursuant to which the Company has conditionally agreed to acquire the entire interest of 13 direct and indirect subsidiaries of the Seller operating the Siemens Electronics Assembly Systems Business (the “SEAS Business”) in 11 countries, including Germany, the PRC, the United Kingdom, France, Austria, the United States of America, Mexico, Singapore, Sweden, Italy and Brazil.
An extraordinary general meeting of the Company was held on 6 January 2011 (“EGM”) for the purpose of considering and approval of the acquisition of the SEAS Business. The acquisition was approved by the shareholders of the Company at the EGM. The acquisition of SEAS Business was completed on 7 January 2011.
Pursuant to the Acquisition Agreement, the Company paid to Siemens Electronics Assembly Systems GmbH & Co. KG (“SEAS KG”), one of the 13 entities comprising the SEAS Business and an indirect wholly-owned subsidiary of the Company upon completion of the Acquisition Agreement, an amount of EUR20 million (equivalent to approximately HK$208 million) on 7 January 2011 by increasing SEAS KG’s registered limited partnership interest and granted SEAS KG a revolving loan facility of up to EUR20 million (equivalent to approximately HK$208 million) for a period of at least three years from 7 January 2011 subject to the terms and conditions as set out in the Acquisition Agreement. The Company also provided a letter of support to SEAS KG amounting to EUR120 million (equivalent to approximately HK$1,246 million), valid as for a duration of six years following completion. The Company also provided the Seller with a bank guarantee in an amount of EUR20 million (equivalent to approximately HK$208 million) which shall secure certain obligations of the Group as set out in the Acquisition Agreement.
As of the date of approval for issuance of these financial statements, management of the Group is still in the midst of determining the financial effect of the acquisition.
Details of the acquisition are set out in the Circular on “Major Transaction – Acquisition of the SEAS Business and Re-Election of Retiring Directors” of the Company dated 21 December 2010.

828282
FIVE YEAR FINANCIAL SUMMARY
For the year ended 31 December2010 2009 2008 2007 2006
HK$’000 HK$’000 HK$’000 HK$’000 HK$’000
Results
Turnover 9,515,089 4,732,174 5,258,413 5,392,661 4,555,953
Profit before taxation 3,219,647 1,065,770 1,103,564 1,450,125 1,278,774Income tax expense (377,613) (130,332) (129,891) (180,628) (129,297)
Profit for the year 2,842,034 935,438 973,673 1,269,497 1,149,477
At 31 December2010 2009 2008 2007 2006
HK$’000 HK$’000 HK$’000 HK$’000 HK$’000
Assets and Liabilities
Non-current assets 1,656,547 938,753 1,034,853 1,040,759 868,995
Current assets 5,960,609 3,831,063 2,750,211 3,019,792 2,617,736Current liabilities (2,476,396) (1,359,185) (919,052) (1,108,904) (922,590)
Net current assets 3,484,213 2,471,878 1,831,159 1,910,888 1,695,146
Non-current liabilities (610) (555) (1,912) (1,528) (2,067)
Equity attributable to owners of the Company 5,140,150 3,410,076 2,864,100 2,950,119 2,562,074

2010
ASM Pacific Technology Limited12/F Watson Centre16-22 Kung Yip StreetKwai Chung, New TerritoriesHong KongTelephone (852) 2424 2021Facsimile (852) 2481 3367
SubsidiariesASM Asia LimitedASM Assembly Automation LimitedASM Assembly Materials LimitedASM Technology Singapore Pte LimitedASM Technology (M) Sdn. Bhd.Shenzhen ASM Micro Electronic Technology Company LimitedASM Semi-conductor Materials (Shenzhen) Company Limited
www.asmpacific.com
This annual report is printed on environmental paper此年報以環保紙張印製