Perspective of Chinese GF-1 high-resolution satellite data in ...
10
Journal of Integrative Agriculture 2017, 16(2): 242–251 REVIEW Available online at www.sciencedirect.com ScienceDirect Perspective of Chinese GF-1 high-resolution satellite data in agricultural remote sensing monitoring ZHOU Qing-bo 1 , YU Qiang-yi 1 , LIU Jia 1 , WU Wen-bin 1, 2 , TANG Hua-jun 1 1 Key Laboratory of Agri-informatics, Ministry of Agriculture/Institute of Agricultural Resources and Regional Planning, Chinese Academy of Agricultural Sciences, Beijing 100081, P.R.China 2 College of Urban & Environmental Sciences, Central China Normal University, Wuhan 430079, P.R.China Abstract High-resolution satellite data have been playing an important role in agricultural remote sensing monitoring. However, the major data sources of high-resolution images are not owned by China. The cost of large scale use of high resolution imagery data becomes prohibitive. In pace of the launch of the Chinese “High Resolution Earth Observation Systems”, China is able to receive superb high-resolution remotely sensed images (GF series) that equalizes or even surpasses foreign similar satellites in respect of spatial resolution, scanning width and revisit period. This paper provides a perspective of using high resolution remote sensing data from satellite GF-1 for agriculture monitoring. It also assesses the applicability of GF-1 data for agricultural monitoring, and identifies potential applications from regional to national scales. GF-1’s high resolution (i.e., 2 m/8 m), high revisit cycle (i.e., 4 days), and its visible and near-infrared (VNIR) spectral bands enable a continuous, effi- cient and effective agricultural dynamics monitoring. Thus, it has gradually substituted the foreign data sources for mapping crop planting areas, monitoring crop growth, estimating crop yield, monitoring natural disasters, and supporting precision and facility agriculture in China agricultural remote sensing monitoring system (CHARMS). However, it is still at the initial stage of GF-1 data application in agricultural remote sensing monitoring. Advanced algorithms for estimating agronomic parameters and soil quality with GF-1 data need to be further investigated, especially for improving the performance of remote sensing monitoring in the fragmented landscapes. In addition, the thematic product series in terms of land cover, crop allocation, crop growth and production are required to be developed in association with other data sources at multiple spatial scales. Despite the advantages, the issues such as low spectrum resolution and image distortion associated with high spatial resolution and wide swath width, might pose challenges for GF-1 data applications and need to be addressed in future agricultural monitoring. Keywords: GF-1, high resolution, agricultural monitoring, remote sensing, CHARMS 1. Introduction Information on crop acreage, spatial distribution and its growth condition is critical for governments at multiple levels to make decisions so as to ensure national food security, particularly for those countries like China with a large population and limited land resources (Shi et al. 2014). Received 10 October, 2015 Accepted 7 September, 2016 ZHOU Qing-bo, E-mail: [email protected]; Correspondence YU Qiang-yi, E-mail: [email protected]; TANG Hua-jun, E-mail: [email protected] © 2017, CAAS. Published by Elsevier Ltd. This is an open access article under the CC BY-NC-ND license (http:// creativecommons.org/licenses/by-nc-nd/4.0/) doi: 10.1016/S2095-3119(16)61479-X
-
Upload
khangminh22 -
Category
Documents
-
view
1 -
download
0
Transcript of Perspective of Chinese GF-1 high-resolution satellite data in ...

Journal of Integrative Agriculture 2017, 16(2): 242–251
REVIEW
Available online at www.sciencedirect.com
ScienceDirect
Perspective of Chinese GF-1 high-resolution satellite data in agricultural remote sensing monitoring
ZHOU Qing-bo1, YU Qiang-yi1, LIU Jia1, WU Wen-bin1, 2, TANG Hua-jun1
1 Key Laboratory of Agri-informatics, Ministry of Agriculture/Institute of Agricultural Resources and Regional Planning, Chinese Academy of Agricultural Sciences, Beijing 100081, P.R.China
2 College of Urban & Environmental Sciences, Central China Normal University, Wuhan 430079, P.R.China
AbstractHigh-resolution satellite data have been playing an important role in agricultural remote sensing monitoring. However, the major data sources of high-resolution images are not owned by China. The cost of large scale use of high resolution imagery data becomes prohibitive. In pace of the launch of the Chinese “High Resolution Earth Observation Systems”, China is able to receive superb high-resolution remotely sensed images (GF series) that equalizes or even surpasses foreign similar satellites in respect of spatial resolution, scanning width and revisit period. This paper provides a perspective of using high resolution remote sensing data from satellite GF-1 for agriculture monitoring. It also assesses the applicability of GF-1 data for agricultural monitoring, and identifies potential applications from regional to national scales. GF-1’s high resolution (i.e., 2 m/8 m), high revisit cycle (i.e., 4 days), and its visible and near-infrared (VNIR) spectral bands enable a continuous, effi-cient and effective agricultural dynamics monitoring. Thus, it has gradually substituted the foreign data sources for mapping crop planting areas, monitoring crop growth, estimating crop yield, monitoring natural disasters, and supporting precision and facility agriculture in China agricultural remote sensing monitoring system (CHARMS). However, it is still at the initial stage of GF-1 data application in agricultural remote sensing monitoring. Advanced algorithms for estimating agronomic parameters and soil quality with GF-1 data need to be further investigated, especially for improving the performance of remote sensing monitoring in the fragmented landscapes. In addition, the thematic product series in terms of land cover, crop allocation, crop growth and production are required to be developed in association with other data sources at multiple spatial scales. Despite the advantages, the issues such as low spectrum resolution and image distortion associated with high spatial resolution and wide swath width, might pose challenges for GF-1 data applications and need to be addressed in future agricultural monitoring.
Keywords: GF-1, high resolution, agricultural monitoring, remote sensing, CHARMS
1. Introduction
Information on crop acreage, spatial distribution and its growth condition is critical for governments at multiple levels to make decisions so as to ensure national food security, particularly for those countries like China with a large population and limited land resources (Shi et al. 2014).
Received 10 October, 2015 Accepted 7 September, 2016ZHOU Qing-bo, E-mail: [email protected]; Correspondence YU Qiang-yi, E-mail: [email protected]; TANG Hua-jun, E-mail: [email protected]
© 2017, CAAS. Published by Elsevier Ltd. This is an open access art ic le under the CC BY-NC-ND l icense (http:/ /creativecommons.org/licenses/by-nc-nd/4.0/)doi: 10.1016/S2095-3119(16)61479-X

243ZHOU Qing-bo et al. Journal of Integrative Agriculture 2017, 16(2): 242–251
Remote sensing is widely used to collect agriculture and agronomy information over time and space. Based on this information, stakeholders can spatially identify the areas with large variations in production and productivity and make appropriate decisions in response to these changes (Atzberger 2013; Tang et al. 2015). Recently, high-resolution satellites have been developing rapidly, leading by the US and European Union countries and resulting in a dramatic increase in the number of high-resolution satellites. In 1994, the US lifted its control over high-resolution remote sens-ing technologies and started allowing the business sector to enter this field. The successful launch of the IKONOS satellite in 1999, which was capable of collecting imagery at a spatial resolution of 1 m, marked the advent of the era of commercial high-resolution satellites. Since then, the tremendous military and economic benefits brought by high-resolution satellites have attracted significant worldwide attention from those in the civil and military applications and prompted an upsurge in the development of high-resolution satellites. There are many high-resolution satellites that are currently in orbit, including the US IKONOS, OrbView, GeoEye, QuickBird and WorldView, French SPOT series of satellites, Germany RapidEye constellation satellites, British TopSat series of satellites, Indian IRS ResourceSat and Cartosat series of satellites, Israeli EROS-B series of satellites, Russian Resurs DK series of satellites, South Korean KOMPSAT series of satellites, Japanese ALOS series of satellites, Thailand THEOS series of satellites, and Malaysian RazakSat series of satellites (Hassen and Loveland 2012).
China’s collection of medium- and high-resolution data has been significantly increasing. The CBERS-01 satellite was successfully launched on October, 1999, followed by other three satellites, CBERS-02, CBERS-02B and CBERS-02C. The CBERS-01, CBERS-02 and CBERS-02B satellites can provide 19.5 m resolution multispectral data and 2.36 m resolution panchromatic data, while the CBERS-02C satellite can provide 10 m resolution multispectral data. The HJ-1A and HJ-1B satellites for environmental and disaster forecasting and monitoring were successfully launched on September, 2008, which can provide 30 m resolution multispectral data. All these overseas and domestic and remote sensing satellites have been widely used to gather and provide timely and accurate information of agricultural sector over large areas with high revisit frequency.
In 2010, China launched a landmark program of “High Resolution Earth Observation Systems”, one of the 16 key projects of the National Medium and Long-term Plan for Science and Technology Development (2006–2020), aiming at developing satellite-, aircraft- and airship-based advanced
earth observation system and establishing the earth obser-vation ground support system (Dong 2015). This program includes 7 different types of high resolution earth observation satellites. The first satellite GF-1 was successfully launched on April 26, 2013 and can provide multi-resolution (2, 8 and 16 m) data (Bai 2013; Lu et al. 2014). When comparing the sensor parameters of in-orbit high-resolution satellites, the GF-1 has equalized or even surpassed foreign similar satellites in terms of spatial resolution, scanning width and revisit period. These two satellites would definitely contrib-ute to agricultural monitoring and provide a strong spatial data support for agriculture sector. The present paper thus aims to analyze the agricultural applicability of GF-1 data, summarize the potential applications, and discuss the future application trend, with a focus on regional to national scales.
2. Applicability of GF-1 data in agricultural monitoring
The current high-resolution satellites can be classified into three categories, represented by the US high-resolution satellites (such as QuickBird), the European high-resolution satellites (such as SPOT), the China-Brazil high-resolution resource satellites (such as CBERS). The GF-1 satellite data are between those of the first and second types of high-resolution satellites, it has a spatial resolution similar to that of SPOT-5 series of satellites and a spectral resolution similar to that of the QuickBird (detailed instructions for these sensors can be found in Table 1).
The wide orbit coverage of GF-1 makes it useful for agricul-ture monitoring at regional scale. Agriculture monitoring by remote sensing is normally conducted at administrative level and natural regionalization level. The former ranges from county, city, provincial to national scales, and the latter con-sists of two-level regionalization system, that is, 9 level-one regions and 40 level-two regions. The GF-1 satellite has a swath of 60 km for its panchromatic band and 800 km for its multispectral band, which provide the capability of agricultural monitoring at a regional scale depending on the completeness of the orbit coverage of different regions (Bai 2013; Lu et al. 2014).
The short revisit cycle of GF-1 satellite is critical for agri-cultural dynamics monitoring. China has a vast territory area and a wide variety of crops. These crops grow in different ecological-environment and thus have different calendars. The monitoring of crop dynamics includes the inter-annual and seasonal changes in crops as well as the changes within crop phenological periods. The GF-1 2 m/8 m panchromatic band data have a revisit cycle of 26 days, and 16 m multi-spectral bands have a revisit cycle of 5–6 days. Under the condition that average cloud amount equals to

244 ZHOU Qing-bo et al. Journal of Integrative Agriculture 2017, 16(2): 242–251
55%, the 2 m/8 m spatial resolution data can cover the entire country each 52 days, and the 16 m spatial resolu-tion data can cover the entire country each 10 days. This continuum of observation is of great importance for crop dynamics monitoring.
Spatial resolution is another important factor in agri-cultural monitoring. Fragmented farmlands with complex terrain conditions and various crop growth patterns pose a great challenge for agricultural remote sensing monitoring in China. The increase in spatial resolution of GF-1 satellite data can help to solve these problems. In general, the 2 m resolution data can be used to monitor more than 90% of the plots, 8 m resolution data can be used to monitor the crops in low mountain and hill areas, and 16 m resolution data can be used to monitor the crops that are intensively planted in plains or basin areas.
The band settings of GF-1 allow agricultural monitoring to be conducted under limited conditions as spectral mixture widely exist in crops, agricultural facilities and soils. Thus at a certain time period, the same object may have different spectra and different objects may have the same spectrum, resulting in a low spectral discrimination. For instance, it is difficult to effectively distinguish winter wheat from garlic using the visible spectral band alone in North China Plain. This may become more frequent due to the atmospheric effects and radiation accuracy. In this regard, the ancillary information such as topographic data and expert knowledge on the spectral difference between one crop and other crops in the same field in different growing seasons is critically helpful for identifying most of the crops in the main grain production areas in China using the GF-1 satellite.
3. General structure of GF-1 based agri-cultural monitoring system
Crops in China are grown in complex and diverse land-scapes and commonly mixed with other vegetation. To effectively and efficiently monitor crop conditions at a regional level, the China agricultural remote sensing mon-itoring system (CHARMS) was established by the Agricul-
ture Remote Sensing Application Center of the Ministry of Agriculture, China, in 1998, by combining remote sensors, in situ observation stations, and wireless sensor networks (Tang et al. 2010). Using data generated by this system, discriminative crop diagnostic techniques incorporating complex quantitative inversion algorithms were developed and deployed nationwide to gather data on major crop and agro-environmental variables for assessment and analy-sis. The system has been under operational running since 2002, providing rapid and reliable agricultural information to support important decisions regarding the management of crops throughout China. However, foreign satellite data are the main choice for CHARMS since its establishment, resulting in huge cost for the long-term domestic application. The launch of GF series enables the substitution of Chinese satellite data for the foreign satellite data in CHARMS, and GF-1 data gradually became the essential data source for its superb spatial resolution, scanning width and revisit period in agricultural remote sensing monitoring.
The general structure of GF-1 based agricultural monitor-ing system is shown in Fig. 1. The transmission, storage and processing of GF-1 data are co-operated between CHARMS and the China Centre For Resources Satellite Data and Application (CCFRSDA). GF-1 raw data product (level 2) has been distributed from the CCFRSDA to the agricultural data nodes as basic input for producing the agricultural re-mote sensing thematic products. The first step of GF-1 data application in CHARMS is to produce level 3 data product through radiometric and geometric calibration, applying the generic technology of GF-1 data processing scheme. Data processing from this step and forward are finished in the agricultural application system. The aim of the second step is to produce the primary agricultural remote sensing data products such as surface albedo and vegetation index, which is followed by the third step to produce agricultural thematic data products in terms of spatial datasets and statistical forms. Finally, agricultural thematic information in terms of assessment reports and maps for decision-maker and stakeholders are produced (Liu 2015).
Table 1 Instructions for the main sensors
Satellite Sensor1) Spatial resolution (m)2)
Bands (μm)3) Swath (km)
Repeat cycle (d)Blue Green Red NIR SWIR PAN
GF-1 WFV 16 0.45–0.52 0.52–0.59 0.63–0.69 0.77–0.89 800 4PMS 8/2 (PAN) 0.45–0.52 0.52–0.59 0.63–0.69 0.77–0.89 0.45–0.90 60 41
QuickBird-2 QuickBird 2.44/0.61 (PAN) 0.45–0.52 0.52–0.60 0.63–0.69 0.76–0.90 16.5 1–3.5SPOT-5 HRG 10/5/2.5 (PAN) 0.49–0.61 0.61–0.68 0.78–0.89 1.58–1.78 0.49–0.69 60 26CBERS-02B CCD 19.5 0.45–0.52 0.52–0.59 0.63–0.69 0.77–0.89 0.51–0.73 113 261) WFV, wide field of view; PMS, panchromatic multispectral sensors; HRG, high resolution geometry; CCD, charge coupled device.2) PAN, panchromatic band. 3) NIR, near-infrared; SWIR, short-wave infrared.

245ZHOU Qing-bo et al. Journal of Integrative Agriculture 2017, 16(2): 242–251
4. Major applications of GF-1 in agricul-tural monitoring
4.1. Mapping of crop planting areas
Three major activities, i.e., crop inventory survey, crop area dynamic changes monitoring and early identification of the crop area for crop growth monitoring, make the monitoring of crop distribution and planting areas the main application field of agricultural monitoring (Hu et al. 2015). The GF-1 data performed great potential in all of these three activities when comparing with the traditional methods, although the requirements of monitoring are slightly different to each other.
Crop inventory survey requires the satellite data to spa-tially cover the whole crop cultivation area or at least the main crop production area. In terms of the time require-ments, at least onetime phase in the crop growing season is needed, during which the target crop can be identified. The previous crop inventory surveys were mainly carried out at regional level given to the coverage ability of the data source. The minimum mapping unit was approximately 10 m×10 m (e.g., a rice area map in Northeast China was produced based on the SPOT-5 images), which cannot meet the requirements while the non-free satellite data are used to cover the whole county and while some plots in the South are extremely fragmented (Liu et al. 2014). From a pilot study, a multi-characteristic dataset has been developed by the use of GF-1 wide field view (WFV) images, which has been used in the rice and maize planted area identification in Heilongjiang Province, and displayed a better separability of crops (Huang et al. 2015a).
The previous crop area dynamic monitoring also suffered a lot due to the inadequate data coverage. In such a case, the frame of spatial sampling was used to randomly select the satellite images for the targeted region, and then the extrapolation method is performed to obtain the information on the target crop in whole monitoring areas. An interactive sampling and mapping method combining with object-ori-ented and changing vector analysis improves the accuracy and efficiency simultaneously (Sun et al. 2015). However, regardless of the method used, it is still necessary to obtain images of the same coverage area for two periods (the cur-rent year and the previous year), so as to have a better un-derstanding on the dynamic changes. With the wilder width and the more frequent revisit circles, the application of GF-1 data greatly solved this problem, suggested by Liu et al. (2015), who developed a method for crop area sampling and mapping based on GF-1 Wide Field View Sensor and Panchromatic and Multispectral Sensor, respectively.
While comparing to the crop area dynamic monitoring, the early identification of crop area requires more timely informa-
Original satellite data
Inpu
t (G
F-1
data
LV
0/1
/2)
Radiometric calibration product
Geometric correction product
GF-1 standard data productsData distributed to agricultural application system
Ortho-rectification product
Pre
-pro
cess
ing
(dat
a LV
-3)
Precise radiometric calibration product
Precise geometric calibration product
GF-1 advanced data productsData processing supported by the GF applied technology center
Image processing product
Vegetation physical parameter product
Prim
ary
data
(dat
a LV
-4/5
)
Earth surface physical parameter product
Land cover product
GF-1 agricultural remote sensing primary data productsData released through special network
Agricultural disasters monitoring product
Them
atic
dat
a (d
ata
LV-6
) Crop area, growth and yield estimation product
Agricultural resources monitoring product
GF-1 agricultural remote sensing thematic data productsData released through special network
Agricultural engineering planning product
Precision agriculture planning product
Agricultural disasters monitoring information
Them
atic
info
rmat
ion
(dat
a LV
-7)
Crop area, growth and yield estimation product
Agricultural resources monitoring information
GF-1 agricultural remote sensing thematic informationInformation reported to decision-makers
Agricultural engineering planning information
Precision agriculture planning information
Data processed in the GF ground system (CCFRSDA)
Data processed in the GF agricultural application system (CHARMS)
Ste
p 1
Ste
p 2
Ste
p 3
Ste
p 4
Agricultural-ecological parameter product
Fig. 1 The general structure of GF-1 based agricultural monitoring system.

246 ZHOU Qing-bo et al. Journal of Integrative Agriculture 2017, 16(2): 242–251
tion for the subsequent crop growth monitoring, the informa-tion related to the crop spatial distribution should generally be obtained within 1 mon of sprouting. The previous activity was mainly based on the moderate resolution imaging spectrora-diometer (MODIS) data, resulting the minimum mapping unit available at 250 m×250 m approximately (Peng et al. 2011; Zhang et al. 2015). The coarse resolution combined with the relatively lower monitoring frequency means that great potential exists if the MODIS data would be replaced by the GF-1 data in the crop area early identification.
The 2 m/8 m resolution data collected by the GF-1 sat-ellite can be used to perform crop area monitoring in all of these three aspects. If a revisit cycle of 42 days and the duration of the growth period of early rice (100 days, the shortest among the crops) are used for the calculation, 2.5 times of data can be collected. After removing the invalid data due to cloud coverage and the early and late periods of the crop, at least one period of data collection within the growth period of early rice can be acquired. If the duration of the growth period of winter wheat (240 days, the longest among the crops) is used for the calculation, six periods of data collection can be acquired. After removing the invalid data (e.g., cloud cover data and the data collected during the early (the sowing period), middle (the wintering period), and late periods, during which it is difficult to distinguish winter wheat from other crops), at least two times of data collection can be acquired. Furthermore, the 16 m resolution data collected by the GF-1 satellite can be used to perform the large scale crop inventory mapping as well as the early identification of the crop area (Wang et al. 2015). The first national level wheat area map has been produced by using GF-1 16 m data from CHARMS (Fig. 2). Moreover, the 16 m resolution data have a revisit cycle of 5 days. If this revisit cycle is used for the calculation, nine periods of early-period data collection of the crop can be acquired. After removing the invalid data (e.g., the data collected during the period after sowing and before sprouting, during which the crop cannot be identified, as well as the cloud cover data, etc.), two to three periods of early-period data collection of the crop can be acquired. These data are expected to be able to meet the requirements for monitoring the crop growth condi-tions and for performing early identification of the crop area. Finally, the potential of combining GF-1 and other sources of remote sensing data should be aware in the agricultural monitoring. For example, the fusion of GF-1 and RapidEye data improves the ability for monitoring seasonal vegetable growth in suburbs of metropolis (Liang et al. 2015).
4.2. Monitoring of crop growth
Currently, the MODIS data are used as the data source for monitoring crop growth conditions (Zhou et al. 2005). It is
conducted once every 14 days for the whole China as the spatial resolution of 250 m. Totally nine crops including winter wheat, spring wheat, summer maize, spring maize, early rice, late rice, one-season rice, soybeans and cotton are routinely monitored. The main shortcoming is that the monitoring period is relatively long, the correlation between the growth condition index and the crop yield needs to be improved, the number of economic and sugar crops that are monitored needs to be increased, and the accuracy of the early crop identification is low (Huang et al. 2010).
It is expected that these gaps may be eliminated or shortened when the EOS/MODIS data are replaced by the 16 m GF-1 data for crop growth monitoring. The monitoring temporal frequency can be shortened from 14 to 10 days and the accuracy of the early identification of crops can reach 16 m, which is an obvious improvement in comparison with existing resolution of 250 m (Jia et al. 2015b). Taking such advantages, GF-1 images had been made good applica-tion in rice growth monitoring in southern terrain complex region (Zhang et al. 2015), and in multi-crop simultaneous monitoring in the northeast flat plain region (He et al. 2016). In addition, the growth sensitivity of different crops also in-creases. As a result, the accuracy of the growth condition index and the correlation between crop growth and crop yield can be increased. With the improvement of the spatial resolution and spectral sensitivity, the capacity to identify economic crops (e.g., peanuts, rapeseed, etc.) and sugar crops (e.g., sugar cane, etc.) is also improved, which in
Legend
0 250 500 1 000km
Winter wheat distribution regions
Fig. 2 Wheat area mapping of 2014 using GF-1 16 m data.

247ZHOU Qing-bo et al. Journal of Integrative Agriculture 2017, 16(2): 242–251
turn makes it possible to monitor the growth conditions of these crops. An example by Liu et al. (2014) showed that sugarcane area in the southern fragmented hilly area has been successfully identified using the multi-temporal GF-1 WFV data. Moreover, the application of GF-1 data improves the estimation chlorophyll relative content (SPAD) during the complete winter wheat growing season (Li et al. 2015).
4.3. Estimation of crop yields
Remote sensing-based crop yield estimation is normally con-ducted with two different methods, statistical model based on vegetation indexes such as normalized difference vegetation index (NDVI) and enhanced vegetation index (EVI), and mechanism model based on photosynthetic efficiency of crops (Yang et al. 2008). The former method can be completely replaced by the GF-1 data, which can facilitate to obtain a good yield index that is consistent with the crop growth con-ditions (Fig. 3). Yet, the vegetation index-based model has a relatively poor stability and applicability when it is used to monitor crop yields in different areas at different growth times. It is necessary to modify the model based on the time and location at which it is used to monitor the crop yield.
The mechanism model based on photosynthetic efficiency needs to use remote sensing data to calculate many param-eters such as the photosynthetically active radiation (PAR), net primary productivity (NPP), fraction of PAR (fPAR), ratio of the dry weight of the yield to the dry weight of the crop. Although this model can best illustrate the effects of crop growth conditions on yields at different growth stages, it is only used to monitor the crop yield in some provinces and regions due to its relatively large number of parameters (Huang et al. 2015b). The GF-1 satellite cannot provide data for calculating the PAR due to its current spectral band settings, other satellite data have to be concluded. Therefore, the GF-1 satellite data can only be partially used in this crop yield model.
4.4. Monitoring of natural disasters
There are several types of natural disasters including droughts, floods, accumulated snow, diseases and pests, which frequently occur in China’s agricultural sector. Currently, the routine operational monitoring of droughts, floods and accumulated snow have been operated, but the real-time emergency monitoring services have not been conducted. The monitoring of plant diseases, pests and freezing is still at the research stage and has not been put into operation.
The GF-1 satellite can be used to partially solve the problems with disasters monitoring. The increase in spatial resolution of GF-1 visible bands is significantly useful for
improving the accuracy of drought index and water bodies identification, thus the accuracy of monitoring droughts and floods can be improved (Cai et al. 2015). Moreover, the 16 m resolution data also helps to yield an early accurate identification of crop areas, which is consequently possible to perform a precise evaluation on the affected area and pro-duction loss caused by droughts and floods in small regions. An example of soil moisture monitoring is shown in Fig. 4. But for snow disasters, due to the lack of a 1.63–1.65 µm snow-sensitive channel, the snow monitoring capacity of the GF-1 satellite will not be significantly improved. It can be used to evaluate the snow-affected area over a small region. Similar to snow disaster, the monitoring capacity of the GF-1 satellite for plant diseases, pests, and freezing will not be significantly improved due to the lack of an accu-mulation of multiyear data and sensitive bands, although it is possible to use these data to evaluate the affected area in a small region based on information on the level of the impact of the disaster.
4.5. Supporting of precision and facility agriculture
With the adjustment and optimization of the crop planting structure, the proportion of precision and facility agriculture
Winter wheat yield (kg ha–1)
4 178–4 5004 500–5 0005 000–5 5005 500–6 0006 000–8 300
114°E 115°E 116°E 117°E 118°E 119°E
114°E
36°N
37°N
38°N
39°N
40°N
41°N
42°N
36°N
37°N
38°N
39°N
40°N
41°N
42°N
115°E 116°E 117°E 118°E 119°E
0 40 80 160 km
Fig. 3 Estimation of winter wheat yields in Jing-Jin-Ji region in 2014 using GF-1 16 m data.

248 ZHOU Qing-bo et al. Journal of Integrative Agriculture 2017, 16(2): 242–251
among agricultural production in China has continually increased, particularly in urban suburbs. However, ground-water pollution and rapid decrease in the groundwater level caused by high inputs of chemical fertilizers and large amounts of water consumption in precision and facility agriculture have gained much attention from different com-munities. Thus, macro-control and guidance of precision and facility agriculture has become part of the government’s agenda. Unfortunately, this has rarely or never been con-ducted due to the limitations of remote sensing data and processing techniques.
The availability of GF-1 satellite data may provide some potential for supporting development of precision and facility agriculture. The requirements of precision and fa-cility agriculture for remote sensing are different. Precision agriculture needs not only to understand the spatial distri-bution of crops, but also, more importantly, to understand the plot-level crop growing conditions (e.g., soil moisture content, fertilizers application) as well as the corresponding farming and management measurements. In contrast, map-ping and monitoring of the spatial distribution of areas and its changes are more important for facility agriculture. The good spatial resolution and wide coverage of GF-1 satellite can play an important role in monitoring areas and spatial distribution of precision and facility agriculture (an example is shown in Fig. 5), but it cannot meet the requirements for monitoring soil moisture content, crop growth conditions and fertilizers. Therefore, the GF-1 satellite can be used to identify area distribution of precision and facility agriculture, but it cannot be independently used to fully support precision and facility agriculture.
5. Future trends of GF-1 application in CHARMS
5.1. Advantage, limitation and challenge
The collaborative transmission, storage and processing be-tween CHARMS and GF-1 system provides new perspective for the national level agricultural monitoring. Requests for objective information will largely increase in the future due to the expected changes in the agricultural sector. Agricultural remote sensing monitoring systems should thus be able to provide timely information on crop production, growth status and yield over large areas and with low costs. Such infor-mation needs to be provided as early as possible during the growing season and updated periodically through the sea-son until harvest. In general, the wide coverage, high spatial resolution and short revisit cycle of GF-1 satellite make it possible to play an important role in operational agricultural monitoring systems of China. In particular, the 8 m resolution data, together with the 10 m resolution data of ZY02C and SPOT5, can form a virtual satellite constellation to ensure the remotely-sensed data availability for agro-resources survey, natural disasters monitoring and assessment, and engineering planning and effects evaluation at a low cost. The 16 m multi-spectral data can fully replace the widely used satellite data in CHARMS such as SPOT2, SPOT4, Landsat TM and AWIFS and efficiently solve the problems
0–77–1010–1515–2525–50
Soil moisture (%)(March 2014)
31°N
32°N
33°N
34°N
35°N
36°N
31°N
32°N
33°N
34°N
35°N
36°N
111°E 112°E 113°E 114°E 115°E 116°E
111°E 112°E 113°E 114°E 115°E 116°E
0 50 100 200 km
Fig. 4 Monitoring of soil moisture in Henan Province in 2014 using GF-1 16 m data.
0 5 10 20 30 40km
Facility agriculture
115°20´E 115°40´E 116°0´E 116°20´E
115°20´E 115°40´E 116°0´E 116°20´E
38°2
0´N
38°0
´N37
°40´
N37
°20´
N
38°2
0´N
38°0
´N37
°40´
N37
°20´
N37
°0´N
37°0
´N
Fig. 5 Mapping of facility agriculture in Hengshui City, Hebei Province in 2014 using fused GF-1 2 m/8 m data.
249ZHOU Qing-bo et al. Journal of Integrative Agriculture 2017, 16(2): 242–251
of these satellites in spatial resolution and swath width, which could greatly meet the requirements of large-scale agricultural monitoring (Jia et al. 2015a; Xin et al. 2015). However, there are still some great challenges in using GF-1 data for agricultural monitoring at regional levels.
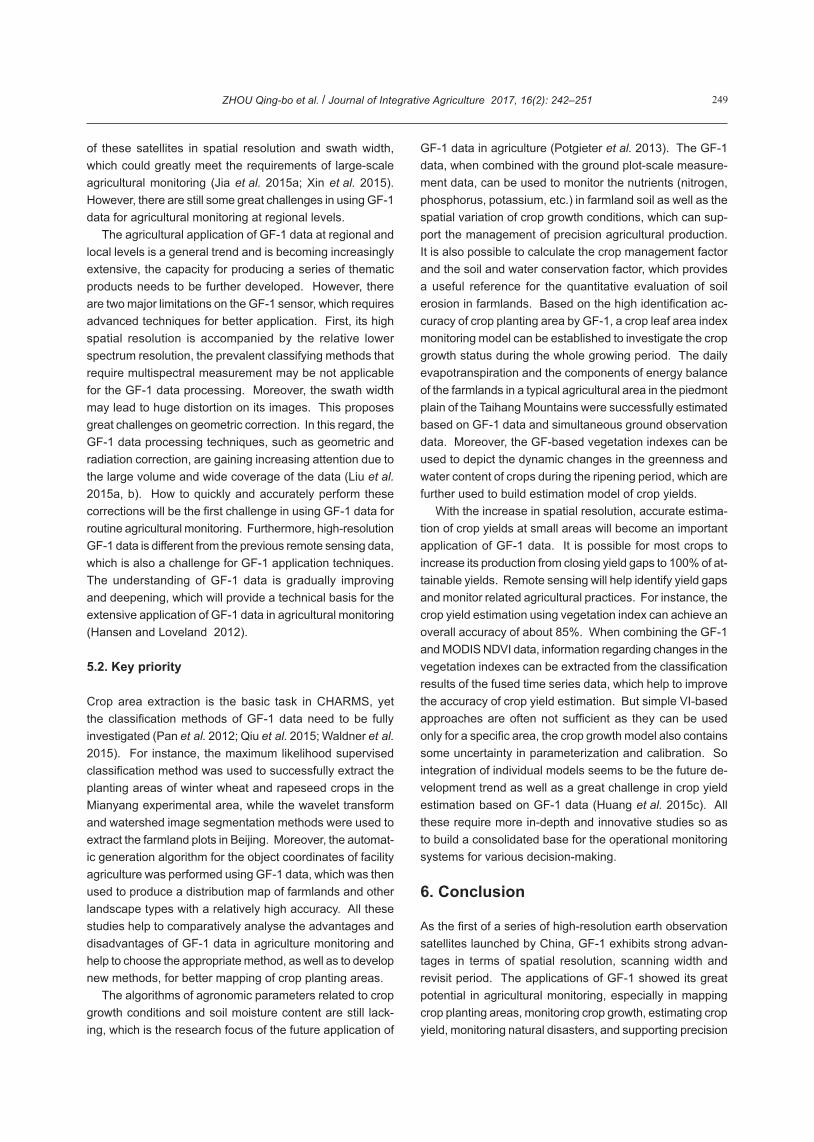
The agricultural application of GF-1 data at regional and local levels is a general trend and is becoming increasingly extensive, the capacity for producing a series of thematic products needs to be further developed. However, there are two major limitations on the GF-1 sensor, which requires advanced techniques for better application. First, its high spatial resolution is accompanied by the relative lower spectrum resolution, the prevalent classifying methods that require multispectral measurement may be not applicable for the GF-1 data processing. Moreover, the swath width may lead to huge distortion on its images. This proposes great challenges on geometric correction. In this regard, the GF-1 data processing techniques, such as geometric and radiation correction, are gaining increasing attention due to the large volume and wide coverage of the data (Liu et al. 2015a, b). How to quickly and accurately perform these corrections will be the first challenge in using GF-1 data for routine agricultural monitoring. Furthermore, high-resolution GF-1 data is different from the previous remote sensing data, which is also a challenge for GF-1 application techniques. The understanding of GF-1 data is gradually improving and deepening, which will provide a technical basis for the extensive application of GF-1 data in agricultural monitoring (Hansen and Loveland 2012).
5.2. Key priority
Crop area extraction is the basic task in CHARMS, yet the classification methods of GF-1 data need to be fully investigated (Pan et al. 2012; Qiu et al. 2015; Waldner et al. 2015). For instance, the maximum likelihood supervised classification method was used to successfully extract the planting areas of winter wheat and rapeseed crops in the Mianyang experimental area, while the wavelet transform and watershed image segmentation methods were used to extract the farmland plots in Beijing. Moreover, the automat-ic generation algorithm for the object coordinates of facility agriculture was performed using GF-1 data, which was then used to produce a distribution map of farmlands and other landscape types with a relatively high accuracy. All these studies help to comparatively analyse the advantages and disadvantages of GF-1 data in agriculture monitoring and help to choose the appropriate method, as well as to develop new methods, for better mapping of crop planting areas.
The algorithms of agronomic parameters related to crop growth conditions and soil moisture content are still lack-ing, which is the research focus of the future application of
GF-1 data in agriculture (Potgieter et al. 2013). The GF-1 data, when combined with the ground plot-scale measure-ment data, can be used to monitor the nutrients (nitrogen, phosphorus, potassium, etc.) in farmland soil as well as the spatial variation of crop growth conditions, which can sup-port the management of precision agricultural production. It is also possible to calculate the crop management factor and the soil and water conservation factor, which provides a useful reference for the quantitative evaluation of soil erosion in farmlands. Based on the high identification ac-curacy of crop planting area by GF-1, a crop leaf area index monitoring model can be established to investigate the crop growth status during the whole growing period. The daily evapotranspiration and the components of energy balance of the farmlands in a typical agricultural area in the piedmont plain of the Taihang Mountains were successfully estimated based on GF-1 data and simultaneous ground observation data. Moreover, the GF-based vegetation indexes can be used to depict the dynamic changes in the greenness and water content of crops during the ripening period, which are further used to build estimation model of crop yields.
With the increase in spatial resolution, accurate estima-tion of crop yields at small areas will become an important application of GF-1 data. It is possible for most crops to increase its production from closing yield gaps to 100% of at-tainable yields. Remote sensing will help identify yield gaps and monitor related agricultural practices. For instance, the crop yield estimation using vegetation index can achieve an overall accuracy of about 85%. When combining the GF-1 and MODIS NDVI data, information regarding changes in the vegetation indexes can be extracted from the classification results of the fused time series data, which help to improve the accuracy of crop yield estimation. But simple VI-based approaches are often not sufficient as they can be used only for a specific area, the crop growth model also contains some uncertainty in parameterization and calibration. So integration of individual models seems to be the future de-velopment trend as well as a great challenge in crop yield estimation based on GF-1 data (Huang et al. 2015c). All these require more in-depth and innovative studies so as to build a consolidated base for the operational monitoring systems for various decision-making.
6. Conclusion
As the first of a series of high-resolution earth observation satellites launched by China, GF-1 exhibits strong advan-tages in terms of spatial resolution, scanning width and revisit period. The applications of GF-1 showed its great potential in agricultural monitoring, especially in mapping crop planting areas, monitoring crop growth, estimating crop yield, monitoring natural disasters, and supporting precision

250 ZHOU Qing-bo et al. Journal of Integrative Agriculture 2017, 16(2): 242–251
and facility agriculture. It has gradually replied the use of foreign data sources in the China agricultural remote sensing monitoring system, suggesting that the Chinese high reso-lution earth observation satellites (i.e., GF-1 and others) will play a more critical role in the global remote sensing and agricultural monitoring community. Further investigations on advanced algorithms of information processing and inter-comparisons with other data sources are anticipated in future researches.
Acknowledgements
This work is financed by the National Natural Science Foun-dation of China (41501111 and 41271112), and the National Non-profit Institute Research Grant of Chinese Academy of Agricultural Sciences (CAAS) (IARRP-2015-10).
References
Atzberger C. 2013. Advances in remote sensing of agriculture, Context description, existing operational monitoring systems and major information needs. Remote Sensing, 5, 949–981.
Bai Z. 2013. Technology of characters of GF-1 satellite. Aerospace China, 8, 5–9. (in Chinese)
Cai Y, Zhu X, Chen A. 2015. Crop loss assessment based on remote sensing and statistical sampling techniques. Research of Agricultural Modernization, 36, 690–695. (in Chinese)
Dong F. 2015. Chinese high resolution satellites and its application. Satellite Application, 3, 44–48. (in Chinese)
Hansen M C, Loveland T. 2012. A review of large area monitoring of land cover change using Landsat data. Remote Sensing of Environment, 122, 66–74.
He P, Xu X, Zhang B, Li Z, Jin X, Zhang Q, Zhang Y. 2016. Crop classification extraction based on multitemporal GF-1 remote sensing image. Journal of Henan Agricultural Sciences, 45, 152–159. (in Chinese)
Huang J, Jia S, Wu H, Su W. 2015a. Extraction method of crop planted area based on GF-1 WFV image. Transactions of the Chinese Society for Agricultural Machinery, 46, 253–259. (in Chinese)
Huang J, Ma H, Su W, Zhang X, Huang Y, Fan J, Wu W. 2015b. Jointly assimilating MODIS LAI and ET products into the SWAP model for winter wheat yield estimation. IEEE Journal of Selected Topics in Applied Earth Observations and Remote Sensing, 8, 4060–4071.
Huang J, Tian L, Liang S, Ma H, Becker-Reshef I, Huang Y, Su W, Zhang X, Zhu D, Wu W. 2015c. Improving winter wheat yield estimation by assimilation of the leafarea index from Landsat TM and MODIS data into the WOFOST model. Agricultural and Forest Meteorology, 204, 106–121.
Huang Q, Tang H, Zhou Q, Wu W, Wang L, Zhang L. 2010. Remote-sensing based monitoring of planting structure and growth condition of major crops in Northeast China.
Transactions of the Chinese Society of Agricultural Engineering, 26, 218–223. (in Chinese)
Hu Q, Wu W, Song Q, Yu Q, Yang P, Tang H. 2015. Recent progresses in research of crop patterns mapping by using remote sensing. Scientia Agricultura Sinica, 48, 1900–1914. (in Chinese)
Jia Y Q, Li B, Cheng Y Z, Liu T, Guo Y, Wu X H, Wang L G. 2015a. Comparison between GF-1 images and Landsat-8 images in monitoring maize LAI. Transactions of the Chinese Society of Agricultural Engineering, 31, 173–179. (in Chinese)
Jia Y Q, Zhang X W, Cheng Y Z, Liu T, Guo Y, Wu X H, Wang L G. 2015b. Verification of structure characteristics of winter wheat pixel identified by MODIS NDVI product by GF1 Image. Journal of Henan Agricultural Sciences, 44, 156–160. (in Chinese)
Li F, Wang L, Liu J, Chang Q. 2015. Remote sensing estimation of SPAD value for wheat leaf based on GF-1 data. Transactions of the Chinese Society for Agricultural Machinery, 46, 273–281. (in Chinese)
Liang J, Wang D, Lai K, Li L, Fan N, Chen T, Lu Y. 2015. Monitoring and analyzing of fall vegetable land based on multi-temporal and multi-source remote sensing data, case in Daxing District of Beijing. Geomatics & Spatial Information Technology, 38, 25–27. (in Chinese)
Liu G, Wu M, Niu Z, Wang C. 2015. Investigation method for crop area using remote sensing sampling based on GF-1 satellite data. Transactions of the Chinese Society of Agricultural Engineering, 31, 160–166. (in Chinese)
Liu K, Liu S, Lu Z, Song Q, Liu Y, Zhang D, Wu W. 2014. Extraction on cropping structure based high spatial resolution remote sensing data. Chinese Journal of Agricultural Resources and Regional Planning, 35, 21–26. (in Chinese)
Liu J. 2015. Agricultural application of domestic high-resolution satellite data. Satellite Application, 3, 31–33. (in Chinese)
Liu J, Wang L, Yang L, Shao J, Teng F, Yang F, Fu C. 2015a. Geometric correction of GF-1 satellite images based on block adjustment of rational polynomial model. Transactions of the Chinese Society of Agricultural Engineering, 31, 146–154. (in Chinese)
Liu J, Wang L, Yang L, Teng F, Shao J, Yang F, Fu C. 2015b. GF-1 satellite image atmospheric correction based on 6S model and its effect. Transactions of the Chinese Society of Agricultural Engineering, 31, 159–168. (in Chinese)
Liu J, Zhong S, Xu Y, Chen Y. 2014. Sugarcane extraction in the southern hills using multi-temporal GF-1 WFV data. Guangdong Agricultural Sciences, 18, 149–154. (in Chinese)
Lu C, Wang R, Yin H. 2014. GF-1 satellite remote sensing characters. Spacecraft Recovery and Remote Sensing, 35, 67–73. (in Chinese)
Pan Y, Li L, Zhang J, Liang S, Zhu X, Sulla-Menashe D. 2012. Winter wheat area estimation from MODIS-EVI time series data using the Crop Proportion Phenology Index. Remote Sensing of Environment, 119, 232–242.

251ZHOU Qing-bo et al. Journal of Integrative Agriculture 2017, 16(2): 242–251
Peng D, Huete A, Huang J, Wang F, Sun H. 2011. Detection and estimation of mixed paddy rice cropping patterns with MODIS data. International Journal of Applied Earth Observation and Geoinformation, 13, 13–23.
Potgieter A B, Lawson K, Huete A R. 2013. Determining crop acreage estimates for specific winter crops using shape attributes from sequential MODIS imagery. International Journal of Applied Earth Observation and Geoinformation, 23, 254–263.
Qiu B, Li W, Tang Z, Chen C, Qi W. 2015. Mapping paddy rice areas based on vegetation phenology and surfacemoisture conditions. Ecological Indicators, 56, 79–86.
Shi Y, Ji S, Shao X, Tang H, Wu W, Yang P, Zhang Y, Shibasaki R. 2014. Framework of SAGI agriculture remote sensing and its perspectives in supporting national food security. Journal of Integrative Agriculture, 13, 1443–1450.
Sun P, Yang J, Zhang J, Pan Y, Yun Y. 2015. Combined object-oriented and changing vector analysis for remote sensing extraction of autumn crops. Journal of Beijing Normal University (Natural Science), 51, 89–94. (in Chinese)
Tang H, Wu W, Yang P, Zhou Q, Chen Z. 2010. Recent progresses in monitoring crop spatial patterns by using remote sensing technologies. Scientia Agricultura Sinica, 43, 2879–2888. (in Chinese)
Tang H, Wu W, Yu Q, Xia T, Yang P, Li Z. 2015. Key research priorities for agricultural land system studies. Scientia Agricultura Sinica, 48, 900–910. (in Chinese)
Waldner F, Sepulcre Canto G, Defourny P. 2015. Automated annual cropland mapping using knowledge-based temporal
features. ISPRS Journal of Photogrammetry and Remote Sensing, 110, 1–13.
Wang L, Liu J, Yang F, Fu C, Teng F, Gao J. 2015. Early recognition of winter wheat area based on GF-1 satellite. Transactions of the Chinese Society of Agricultural Engineering, 31, 194–201. (in Chinese)
Xin R, Lu Z, Liu Y, Fu B, Liu K. 2015. Comparison on linear feature real width and interpretation width using Landsat TM8 images and GF-1 images. Transactions of the Chinese Society of Agricultural Engineering, 31, 196–205. (in Chinese)
Yang P, Wu W, Zhou Q, Zha Y. 2008. Research progress in crop yield estimation model based on spectral reflectance data. Transactions of the Chinese Society of Agricultural Engineering, 24, 262–268. (in Chinese)
Zhang G, Xiao X, Dong J, Kou W, Jin C, Qin Y, Zhou Y, Wang J, Angelo Menarguez M, Biradar C. 2015. Mapping paddy rice planting areas through time series analysis of MODIS land surface temperature and vegetation index data. ISPRS Journal of Photogrammetry and Remote Sensing, 106, 157–171.
Zhang S Q, Jia Y Q, Cheng Y Z, Liu T, Guo Y, Wu X H, Wang L G. 2015. Study on rice growth monitoring based on GF-1 images. Journal of Henan Agricultural Sciences, 44, 173–176. (in Chinese)
Zhou Q, Liu J, Wang L, Deng H. 2005. Current situation and prospect analysis of the application of EOS-MODIS satellite data in agriculture. Journal of Library and Information Sciences in Agriculture, 17, 202–205. (in Chinese)
(Managing editor SUN Lu-juan)