Persistent Mitochondrial Hyperfusion Promotes G2/M Accumulation and Caspase-Dependent Cell Death
9
Persistent Mitochondrial Hyperfusion Promotes G2/M Accumulation and Caspase-Dependent Cell Death Laura M. Westrate 1,2 , Aaron D. Sayfie 1 , Danielle M. Burgenske 1,2 , Jeffrey P. MacKeigan 1,2 * 1 Laboratory of Systems Biology, Van Andel Research Institute, Grand Rapids, Michigan, United States of America, 2 Van Andel Institute Graduate School, Grand Rapids, Michigan, United States of America Abstract Cancer cells have several hallmarks that define their neoplastic behavior. One is their unabated replicative potential that allows cells to continually proliferate, and thereby contribute to increasing tumor burden. The progression of a cell through the cell cycle is regulated by a series of checkpoints that ensures successful transmission of genetic information, as well as various cellular components, including organelles and protein complexes to the two resulting daughter cells. The mitochondrial reticulum undergoes coordinated changes in shape to correspond with specific stages of the cell cycle, the most dramatic being complete mitochondrial fragmentation prior to cytokinesis. To determine whether mitochondrial fission is a required step to ensure proper mitochondrial segregation into two daughter cells, we investigated the importance of mitochondrial dynamics to cell cycle progression. We found that mitochondrial hyperfusion promotes a defect in cell cycle progression characterized by an inability for cells to exit G2/M. Additionally, extended periods of persistent mitochondrial fusion led to robust caspase-dependent cell death. The cell death signals were coordinated through activation and cleavage of caspase-8, promoting a potent death response. These results demonstrate the importance of mitochondrial dynamics in cell cycle progression, and that inhibiting mitochondrial fission regulators may provide a therapeutic strategy to target the replicative potential of cancer cells. Citation: Westrate LM, Sayfie AD, Burgenske DM, MacKeigan JP (2014) Persistent Mitochondrial Hyperfusion Promotes G2/M Accumulation and Caspase- Dependent Cell Death. PLoS ONE 9(3): e91911. doi:10.1371/journal.pone.0091911 Editor: Dhyan Chandra, Roswell Park Cancer Institute, United States of America Received January 11, 2014; Accepted February 15, 2014; Published March 14, 2014 Copyright: ß 2014 Westrate et al. This is an open-access article distributed under the terms of the Creative Commons Attribution License, which permits unrestricted use, distribution, and reproduction in any medium, provided the original author and source are credited. Funding: This research was supported by award number RO1CA138651 from the National Cancer Institute to J.P. MacKeigan and a fellowship from the Van Andel Institute Graduate School to L.M. Westrate. The funders had no role in study design, data collection and analysis, decision to publish, or preparation of the manuscript. Competing Interests: The authors have declared that no competing interests exist. * E-mail: [email protected] Introduction Mitochondria play critical roles in meeting the bioenergetics needs of the cell, which include the generation of cellular ATP through oxidative phosphorylation [1]. Maintaining mitochondrial function is therefore a priority for cells. The evolutionarily conserved process of mitochondrial fission and fusion has proven to be an important mechanism by which mitochondria maintain function and respond to changing cellular demands. Many tumors, however, have a glycolytic metabolic profile that is no longer dependent on the mitochondria as the source for their metabolic and energetic needs [2,3]. Despite this, mitochondria in cancer cells are highly active and dynamic, suggesting an important role for mitochondrial fission and fusion in cancer biology. Mitochon- drial fission and fusion is controlled by a series of well conserved GTPases from the dynamin family [1]. Mitochondrial fusion of the outer mitochondrial membrane (OMM) is initiated through interactions between two transmembrane GTPases, mitofusin-1 (Mfn1) and mitofusin-2 (Mfn2), while fusion of the inner mitochondrial membrane (IMM) is regulated by a third GTPase, optic atrophy 1 (OPA1) [4,5,6,7]. A fourth GTPase, dynamin related protein 1 (Drp1) regulates mitochondrial fission and is recruited from the cytosol to the mitochondrial by a series of OMM proteins (mitochondrial fission factor, Mff; fission 1, Fis1; mitochondrial elongation factor 49, MiD49; mitochondrial elon- gation factor, MiD51; or endophilin B1) [8,9]. Influenced by their surrounding cellular environment, mitochondrial morphology is not only important for maintaining mitochondrial function, but has recently been marked as an important cellular feature for the completion of biological processes, including cellular proliferation and apoptosis [10,11,12]. Recently, mitochondria have been shown to undergo dramatic remodeling prior to cell division [11]. Mitotic cell division of eukaryotic cells can be divided into four major stages including a growth stage (G1), a DNA replication stage (S), a secondary growth stage (G2), and cell division (M) [13]. Quantitative assessment of mitochondrial morphology throughout the various stages of the cell cycle reveals that mitochondria fuse to form a large, hyperfused network at the G1-S transition before undergo- ing coordinated fragmentation in G2/M [11]. While in its hyperfused state, the mitochondrial network is electrically contin- uous, resulting in greater ATP output which may be required to promote transition of cells through S [11]. Additionally, mitochondrial hyperfusion can result in a buildup of cyclin E, which at the G1-S transition, is responsible for the initiation of DNA replication and further commitment of the cell to undergo mitosis [11]. Loss of Drp1, the GTPase involved in regulating mitochondrial fission, resulted in G2/M accumulation [12]. This result suggests that mitochondrial fission is necessary for continued progression through the cell cycle following entrance of the cell into S phase [12]. PLOS ONE | www.plosone.org 1 March 2014 | Volume 9 | Issue 3 | e91911
Transcript of Persistent Mitochondrial Hyperfusion Promotes G2/M Accumulation and Caspase-Dependent Cell Death

Persistent Mitochondrial Hyperfusion Promotes G2/MAccumulation and Caspase-Dependent Cell DeathLaura M. Westrate1,2, Aaron D. Sayfie1, Danielle M. Burgenske1,2, Jeffrey P. MacKeigan1,2*
1 Laboratory of Systems Biology, Van Andel Research Institute, Grand Rapids, Michigan, United States of America, 2 Van Andel Institute Graduate School, Grand Rapids,
Michigan, United States of America
Abstract
Cancer cells have several hallmarks that define their neoplastic behavior. One is their unabated replicative potential thatallows cells to continually proliferate, and thereby contribute to increasing tumor burden. The progression of a cell throughthe cell cycle is regulated by a series of checkpoints that ensures successful transmission of genetic information, as well asvarious cellular components, including organelles and protein complexes to the two resulting daughter cells. Themitochondrial reticulum undergoes coordinated changes in shape to correspond with specific stages of the cell cycle, themost dramatic being complete mitochondrial fragmentation prior to cytokinesis. To determine whether mitochondrialfission is a required step to ensure proper mitochondrial segregation into two daughter cells, we investigated theimportance of mitochondrial dynamics to cell cycle progression. We found that mitochondrial hyperfusion promotes adefect in cell cycle progression characterized by an inability for cells to exit G2/M. Additionally, extended periods ofpersistent mitochondrial fusion led to robust caspase-dependent cell death. The cell death signals were coordinatedthrough activation and cleavage of caspase-8, promoting a potent death response. These results demonstrate theimportance of mitochondrial dynamics in cell cycle progression, and that inhibiting mitochondrial fission regulators mayprovide a therapeutic strategy to target the replicative potential of cancer cells.
Citation: Westrate LM, Sayfie AD, Burgenske DM, MacKeigan JP (2014) Persistent Mitochondrial Hyperfusion Promotes G2/M Accumulation and Caspase-Dependent Cell Death. PLoS ONE 9(3): e91911. doi:10.1371/journal.pone.0091911
Editor: Dhyan Chandra, Roswell Park Cancer Institute, United States of America
Received January 11, 2014; Accepted February 15, 2014; Published March 14, 2014
Copyright: � 2014 Westrate et al. This is an open-access article distributed under the terms of the Creative Commons Attribution License, which permitsunrestricted use, distribution, and reproduction in any medium, provided the original author and source are credited.
Funding: This research was supported by award number RO1CA138651 from the National Cancer Institute to J.P. MacKeigan and a fellowship from the VanAndel Institute Graduate School to L.M. Westrate. The funders had no role in study design, data collection and analysis, decision to publish, or preparation of themanuscript.
Competing Interests: The authors have declared that no competing interests exist.
* E-mail: [email protected]
Introduction
Mitochondria play critical roles in meeting the bioenergetics
needs of the cell, which include the generation of cellular ATP
through oxidative phosphorylation [1]. Maintaining mitochondrial
function is therefore a priority for cells. The evolutionarily
conserved process of mitochondrial fission and fusion has proven
to be an important mechanism by which mitochondria maintain
function and respond to changing cellular demands. Many tumors,
however, have a glycolytic metabolic profile that is no longer
dependent on the mitochondria as the source for their metabolic
and energetic needs [2,3]. Despite this, mitochondria in cancer
cells are highly active and dynamic, suggesting an important role
for mitochondrial fission and fusion in cancer biology. Mitochon-
drial fission and fusion is controlled by a series of well conserved
GTPases from the dynamin family [1]. Mitochondrial fusion of the
outer mitochondrial membrane (OMM) is initiated through
interactions between two transmembrane GTPases, mitofusin-1
(Mfn1) and mitofusin-2 (Mfn2), while fusion of the inner
mitochondrial membrane (IMM) is regulated by a third GTPase,
optic atrophy 1 (OPA1) [4,5,6,7]. A fourth GTPase, dynamin
related protein 1 (Drp1) regulates mitochondrial fission and is
recruited from the cytosol to the mitochondrial by a series of
OMM proteins (mitochondrial fission factor, Mff; fission 1, Fis1;
mitochondrial elongation factor 49, MiD49; mitochondrial elon-
gation factor, MiD51; or endophilin B1) [8,9]. Influenced by their
surrounding cellular environment, mitochondrial morphology is
not only important for maintaining mitochondrial function, but
has recently been marked as an important cellular feature for the
completion of biological processes, including cellular proliferation
and apoptosis [10,11,12].
Recently, mitochondria have been shown to undergo dramatic
remodeling prior to cell division [11]. Mitotic cell division of
eukaryotic cells can be divided into four major stages including a
growth stage (G1), a DNA replication stage (S), a secondary
growth stage (G2), and cell division (M) [13]. Quantitative
assessment of mitochondrial morphology throughout the various
stages of the cell cycle reveals that mitochondria fuse to form a
large, hyperfused network at the G1-S transition before undergo-
ing coordinated fragmentation in G2/M [11]. While in its
hyperfused state, the mitochondrial network is electrically contin-
uous, resulting in greater ATP output which may be required to
promote transition of cells through S [11]. Additionally,
mitochondrial hyperfusion can result in a buildup of cyclin E,
which at the G1-S transition, is responsible for the initiation of
DNA replication and further commitment of the cell to undergo
mitosis [11]. Loss of Drp1, the GTPase involved in regulating
mitochondrial fission, resulted in G2/M accumulation [12]. This
result suggests that mitochondrial fission is necessary for continued
progression through the cell cycle following entrance of the cell
into S phase [12].
PLOS ONE | www.plosone.org 1 March 2014 | Volume 9 | Issue 3 | e91911
Given the observation that mitochondria fragment prior to cell
division, we predicted that the shape of the mitochondria plays an
important role in the ability for cells to progress through the cell
cycle. Here, we investigate the role of mitochondrial fission
machinery in cell cycle progression. We found that when
mitochondria are maintained in a state of fusion, cell cycle
progression is significantly delayed and cells accumulate in G2/M
[12]. This cell cycle defect is recapitulated upon knockdown of key
mitochondrial fission regulators, Drp1 or Mff, supporting the
finding that mitochondrial fission is a requisite step for cell
division. This suggests that mitochondrial fission may be an
important mechanism to ensure proper segregation of mitochon-
dria into the two daughter cells. Surprisingly, loss of either Drp1 or
Mff results not only in a G2/M cell cycle defect, but also in potent
induction of caspase 8 dependent cell death. Taken together, these
results demonstrate the important role mitochondrial fission and
fusion play in cell cycle progression and cell survival. Given the
unabated replicative potential of cancer cells, therapeutic strategies
targeting mitochondrial dynamics may provide a novel means to
target cancer’s neoplastic behavior.
Materials and Methods
Cell Culture and RNAi TransfectionU2OS cells (ATCC) were cultured in normal cell maintenance
media containing McCoy’s 5A (Life Technologies) supplemented
with 10% fetal bovine serum (CellGro). For RNAi transfection
experiments, U2OS cells were seeded in 6-well plates at a density
of 7.56104 cells per well for 24 hours before being transfected with
either control (non-targeting) siRNAs or siRNAs targeted against
mitochondrial fission regulators, Drp1 and Mff: (Qiagen Drp1 #1
S104320092, Drp1 #2 SI04202464, Mff #1 SI04320386, Mff #2
SI04374174) at a final concentration of 50 nM using 3 ml
Oligofectamine (Life Technologies) in 0.2 ml Opti-MEM (Life
Technologies) and 0.8 ml normal cell maintenance media.
Transfection wells were supplemented with an additional 1 ml of
normal cell maintenance media 4 hours following the addition of
the transfection reagent. Drp1 siRNA SI04320092 and Mff siRNA
SI04320386 resulted in the highest level of mitochondrial fusion
and were subsequently used to assess the cellular consequences of
mitochondrial fusion for both cell cycle and cell death experi-
ments. Knockdown was measured by qRT-PCR using specific
primers against Drp1 and Mff and the endogenous hypoxanthine
phosphoribosyltransferase 1 (HPRT) control. Relative copy
number was determined using the delta-delta Ct method for
control, Drp1, and Mff siRNA samples [14].
Cell Cycle AnalysisU2OS cells were seeded in 6-well plates at a density of 7.56104
cells per well and transfected for 48 hours with siRNAs directed
against Drp1 and Mff, as described above. Adherent cells were
collected and resuspended in ice-cold 70% ethanol. Samples were
permeabilized at 220uC overnight. Propidium iodide (PI; Sigma)
was prepared as a 1 mg/ml stock solution in H2O. RNase A was
prepared as a 10 mg/ml stock solution in 10 mM sodium acetate,
pH 5.025.2. DNase was inactivated by heating the RNase A
solution to 100uC for 15 minutes before adjusting to 100 mM
Tris, pH 7.4 by adding 0.1 volume of 1 M Tris-HCl. Samples
were washed 1x with PBS to remove residual ethanol and
resuspended in a PI working stock (20 mg/ml PI, 2 mg DNase free
RNase A added to PBS) for 10 minutes before being analyzed for
DNA content on a FACSCaliber flow cytometer (BD Biosciences)
using the FL2 channel to determine PI fluorescence. At least
10,000 events were captured for each sample. Cell Cycle profiles
were analyzed using Modfit LT following the manufacturer’s
protocol to determine the percentage of cells in G1, S and G2/M,
error was determined by calculating the standard deviation of
replicate experiments.
Cell SynchronizationU2OS cells were synchronized at late G1, early S by a double
thymidine block. U2OS cells were seeded in 6-well plates and
transfected as described above. The first thymidine block was
started 8 hours following siRNA transfection by the addition of
thymidine (Sigma) to wells at a final concentration of 2 mM for
16 hours. Cells were then washed 1x with PBS and cultured in
normal cell maintenance media for 8 hours followed by a second
16 hour thymidine (2 mM) block. Cells were released from the
double thymidine block into normal cell maintenance media and
collected every 4 hours following release. Cells were put into their
first thymidine block exactly 8 hours following siRNA transfection
to ensure that the 0 hour release collection was timed at 48 hours
post knockdown. Samples were fixed in ice-cold 70% ethanol and
permeabilized at 220uC overnight. Cell cycle analysis was
performed following PI incorporation as described above. Cell
Cycle profiles were analyzed using Modfit software to determine
percentage of cells in G1, S and G2/M. Error was determined by
calculating the standard deviation of the replicate experiments.
ImmunofluorescenceA monoclonal population of U2OS cells expressing mito_EYFP
(U2OS_mitoEYFP) was generated following selection with
500 mg/ml G418. U2OS_mitoEYFP cells were seeded onto 1.5
coverglass, 35 mm glass bottom culture dishes (MatTek) at a
density of 7.56104 cells per well 72 hours prior to imaging.
Mitochondrial morphology was altered through knockdown of
mitochondrial fission regulators Drp1 and Mff. All images were
taken in an environmental chamber, 48 hours after knockdown on
a Nikon Ti Eclipse fluorescent microscope which maintained a
humid environment of 37uC and 5% CO2. Imaging of
U2OS_mitoEYFP was performed using a 60x oil immersion
objective (NA 1.4) in the FITC channel (25% lamp power; ND4
and ND8 neutral density filters; 100 ms exposure).
For extended live cell imaging movies, U2OS_mitoEYFP were
seeded in 35 mm, #1.5 glass bottom, 4 chambered dishes
(MatTek) and were transfected with siRNA targeting Drp1 and
Mff for 48 hours before the start of the time-lapse movie. Cells
were imaged in the FITC channel using a 40x dry objective. Fields
of view were chosen, and NIS Elements software (Nikon) was set to
image each position every 10 minutes for 18 hours using the
Perfect Focus System (PFS) to maintain the original focal plane.
Individual cells were manually tracked throughout the entire time
series to determine whether cells underwent mitotic cell division,
cell death, or neither. If cells moved out of the field of view at any
point during the time series, they were no longer considered part
of the data set. Cell death was identified as cells undergoing
classical morphological characteristics of apoptosis, such as plasma
membrane blebbing and nuclear condensation.
To obtain 3D-reconstruction of dividing cells, live cell imaging
was performed on a Nikon A1Rsi Confocal System. U2OS_mi-
toEYFP cells were seeded in 1.5 coverglass, 35 mm glass bottom
culture dishes as described above in 2 ml normal cell maintenance
media for 48 hours prior to imaging. Cells were then placed on the
stage of the Nikon A1 microscope within a Okolab stage-top
incubation system that maintained a humid environment of 37uCand 5% CO2. Cells were imaged following simulation with the
488 nm diode laser using a 60x oil (NA 1.4) objective. A z-stack of
6 mm in width (made up of 1 mm stacks) was set up to capture the
Hyperfusion Induces G2/M Accumulation
PLOS ONE | www.plosone.org 2 March 2014 | Volume 9 | Issue 3 | e91911
entire mitochondrial reticulum through cytokinesis. Fields of view
were chosen and images were taken every 10 minutes for
11 hours. The focal plane was maintained throughout the length
of the movie using PFS. NIS-Elements software was used to
perform 3D reconstructions and visualize the mitochondrial
reticulum throughout cellular division.
Cell Death and Apoptosis AssaysActivation of apoptosis through the detection of cleaved
caspases was performed on the FACSCaliber flow cytometer
according to the protocol previously described [15]. Antibodies
towards cleaved caspase-3 (Cell Signaling Technologies) and
cleaved caspase-8 (Cell Signaling Technologies) were used to
detect apoptotic induction. Necrostatin (Enzo Life Sciences) and
zVAD (Millipore) were used at final concentrations of 10 mM and
20 mM, respectively, in cell culture medium prior to PI exclusion
assays. Treatment of necrostatin or zVAD was initiated 24 hours
after siRNA transfection, and continued every 24 hours until the
endpoint of the assay. PI exclusion assays were performed by
collecting cells, washing in PBS, and incubating in samples in
2 mg/ml PI for 5 minutes before analyzing for PI positivity as a
marker for cell death. At least 10,000 events were captured per
experimental condition. Data were analyzed using CellQuest
software (BD Biosciences) and error bars plotted represent
standard deviation of replicate conditions.
Results
Mitochondria undergo architectural changes duringprogression through the cell cycle
Mitochondria are in constant flux, the reticulum transitioning
from states of heavily fused networks to individual punctate
fragments spread throughout the cytosol. Alterations to mitochon-
drial shape are coordinated through two opposing processes,
mitochondrial fission and fusion, often in response to cellular
demands [1]. Given that mitochondrial morphology is altered in
preparation for mitotic cell division [11], we proposed that
mitochondrial fission and fusion are important regulatory
processes in determining the success of a cell division event by
ensuring segregation of the mitochondrial reticulum to the
resulting daughter cells. We monitored mitochondrial morphology
throughout mitotic cell division using a monoclonal osteosarcoma
cell line expressing a mitochondrial-targeted enhanced yellow
fluorescent protein (U2OS_mitoEYFP). The EYFP construct is
fused to subunit VIII of cytochrome c oxidase (complex IV) and
provides a specific means to monitor changes in mitochondrial
morphology in real time [16]. Using live cell imaging, we tracked
cells progressing through the cell cycle and observed dramatic
remodeling of the mitochondrial reticulum during cell division
(Figure 1A). Because the mitochondrial reticulum of a dividing cell
often moves in and out of the focal plane as the cell begins to enter
mitosis [17,18], we acquired stacks of mitochondrial images (6 mm
total depth) along the z-axis of cells. These stacks were then
volumetrically rendered following 3D image reconstruction to
Figure 1. Mitochondrial Fragmentation Prior to Cytokinesis. (A) Mitochondria were tracked through mitotic division events inU2OS_mitoEYFP cells by confocal microscopy. An example cell is shown representing a 3D reconstruction of a 6 mm z-stack (1 mm thick slices)that has been re-colored according to the depth (see color coded legend) of the fluorescent signal within the z-stack. Insets are 3.5x magnifications ofboxed regions. (B) Example cells are shown which demonstrate similar morphological alterations in mitochondrial reticulum throughout multiplemitotic cell divisions.doi:10.1371/journal.pone.0091911.g001
Hyperfusion Induces G2/M Accumulation
PLOS ONE | www.plosone.org 3 March 2014 | Volume 9 | Issue 3 | e91911
allow us to track morphological changes of the entire reticulum.
U2OS_mitoEYFP cells were tracked for 11 hours with images
taken every 10 minutes. We found that prior to cytokinesis, or
about 40 minutes before the formation of the resulting daughter
cells, mitochondria condense and undergo widespread fragmen-
tation (Figure 1A). This form of mitochondrial remodeling was
consistent in all mitotic cells that we tracked (15 cellular division
events from over 100 cells), suggesting that the alterations in
mitochondrial morphology, specifically through mitochondrial
fission, is an important step for preparation of the mitochondrial
reticulum prior to cellular division (Figure 1B).
Persistent mitochondrial hyperfusion results in delayedcell cycle progression
We investigated whether mitochondrial fission is a requisite step
to ensure proper segregation of the mitochondria into two
daughter cells by inhibiting mitochondrial fission using siRNA
directed against key mitochondrial fission regulators, Mff and
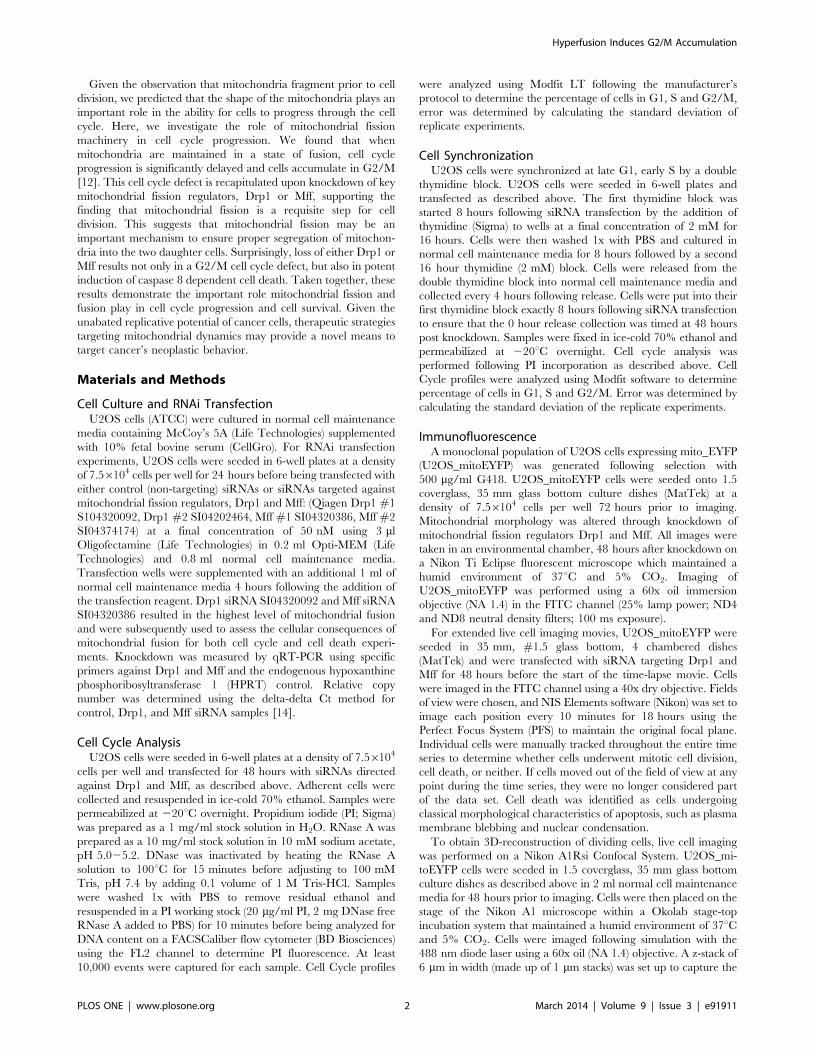
Figure 2. Mitochondrial Hyperfusion Promotes Cellular Accumulation in G2/M. (A) Relative Drp1 and Mff expression (mRNA) was measuredby qRT-PCR (relative to HPRT, normalized to control siRNA). Bars represent standard error of replicate experiments. (B) Mitochondrial morphology ofU2OS_mitoEYFP following siRNA transfection (48 hours) of mitochondrial fission regulators, Drp1 and Mff compared to control. Insets are 4xmagnification of boxed regions. (C) Cell cycle distributions of cells following knockdown of Control, Drp1, or Mff (48 hours) by FACSCaliber analysis ofDNA area of propidium iodide-stained cells. The black histogram represents the original cell cycle profile, while the shaded areas represent the fittedcell cycle model following analysis with Modfit LT. The histogram indicates the percentage of cells in G1 (first red peak positioned over 50), G2/M(second red peak positioned over 100), and S phase (the dashed area lying between the two red peaks). Aneuploidy populations are indicated by thegreen shaded area located along the axis at DNA areas 150 to 200. The percentage of cells in G2/M represents the average (6 standard deviation)calculated from two independent experiments.doi:10.1371/journal.pone.0091911.g002
Hyperfusion Induces G2/M Accumulation
PLOS ONE | www.plosone.org 4 March 2014 | Volume 9 | Issue 3 | e91911
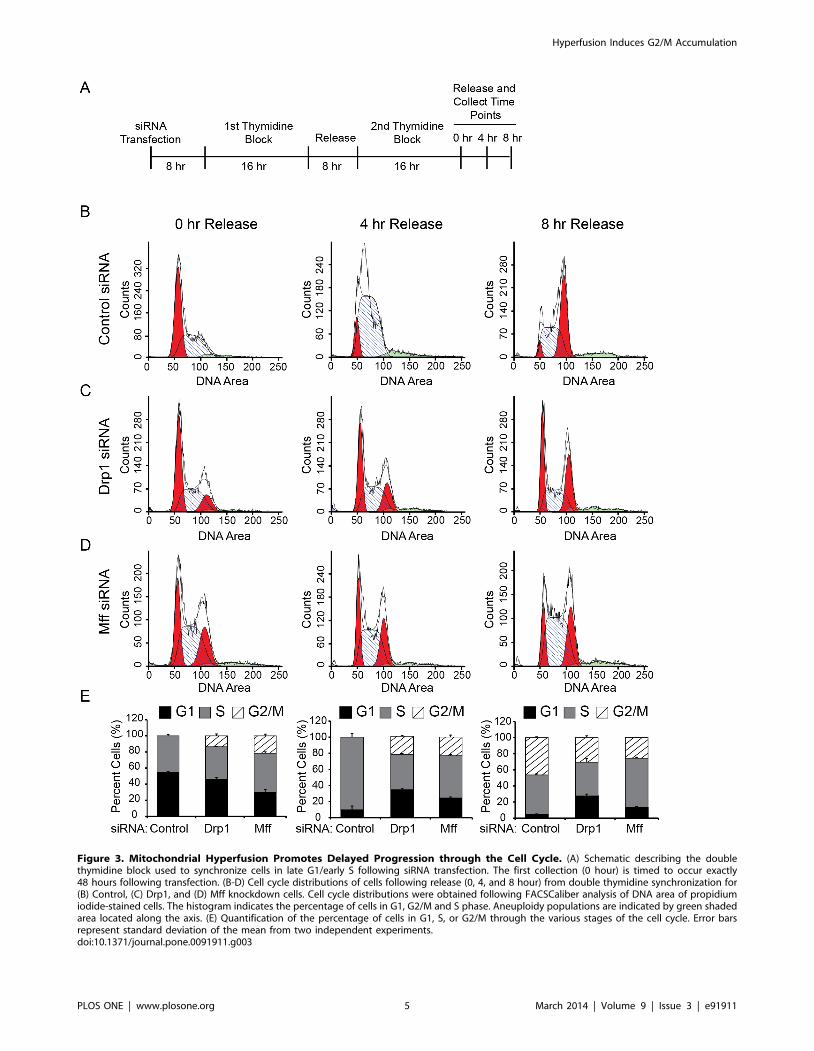
Figure 3. Mitochondrial Hyperfusion Promotes Delayed Progression through the Cell Cycle. (A) Schematic describing the doublethymidine block used to synchronize cells in late G1/early S following siRNA transfection. The first collection (0 hour) is timed to occur exactly48 hours following transfection. (B-D) Cell cycle distributions of cells following release (0, 4, and 8 hour) from double thymidine synchronization for(B) Control, (C) Drp1, and (D) Mff knockdown cells. Cell cycle distributions were obtained following FACSCaliber analysis of DNA area of propidiumiodide-stained cells. The histogram indicates the percentage of cells in G1, G2/M and S phase. Aneuploidy populations are indicated by green shadedarea located along the axis. (E) Quantification of the percentage of cells in G1, S, or G2/M through the various stages of the cell cycle. Error barsrepresent standard deviation of the mean from two independent experiments.doi:10.1371/journal.pone.0091911.g003
Hyperfusion Induces G2/M Accumulation
PLOS ONE | www.plosone.org 5 March 2014 | Volume 9 | Issue 3 | e91911
Drp1. Depletion of both Drp1 and Mff was confirmed at the RNA
level through quantitative real-time PCR (qRT-PCR) (Figure 2A).
Targeted knockdown of either Drp1 or Mff resulted in extensive
fusion of the mitochondrial reticulum following 48 hours of
knockdown as compared to control cells (Figure 2B). Collectively,
these data demonstrate that targeted knockdown of distinct
mitochondrial fission regulators drives a persisted state of
mitochondrial fusion, and that this approach could be used to
determine the impact mitochondrial fission on cell cycle progres-
sion.
Given the alterations in mitochondrial morphology throughout
mitotic cell division, we examined the functional consequence to
cell division when mitochondria were held in a persistent state of
hyperfusion (Figure 2A). U2OS cells transfected with siRNA
against Drp1 or Mff for 48 hours were collected and stained with
propidium iodide, a DNA intercalating agent, and analyzed by
flow cytometry for DNA content. Compared to control, the cell
cycle profiles for both Drp1 and Mff knockdown cells suggested a
defect in the ability for cells with hyperfused mitochondria to
progress through the cell cycle. Specifically, loss of either Drp1 or
Mff resulted in cell accumulation in G2/M as compared to
control, indicating that mitochondrial fission is an important
feature for cell cycle progression (Figure 2B). Cell cycle quanti-
fication revealed that compared to control, cells with mitochon-
drial hyperfusion showed a 1.7 and 2.0 fold increase block in G2/
M for Drp1 and Mff, respectively. The percentage of cells in G2/
M for control cells was 1963.8% compared to 3262.8% and
3866.2% for Drp1 and Mff knockdown, respectively.
The accumulation of cells in G2/M suggests an inability for cells
to successfully undergo mitosis when the mitochondrial reticulum
is unable to be divided prior to the formation of the daughter cells.
To better understand whether the observed G2/M accumulation
is the result of either a delay or block in cell cycle progression, we
examined cell cycle progression over time following cellular release
from a double thymidine block (Figure 3A-D). Thymidine is a
pyrimidine deoxynucleoside used to synchronize cells in early S
phase[19]. Cell synchronization using a double thymidine block
ensures entry into S phase (024 hours) and synchronous mitosis
(728 hours) for . 95% of control cells. U2OS cells were
transfected with siRNA against Drp1, Mff or control siRNA
before the addition of the first of two thymidine blocks. The
transfection timing was staged such that the first cell collection (0
hour release) was taken at 48 hours post transfection (Figure 3A).
Collected cells were stained with propidium iodide prior to
analysis for DNA content by flow cytometry. As expected, the
majority of control cells were stalled in G1 or S following the
second thymidine block (Figure 3B. In comparison, cell cycle
profiles for both Drp1 and Mff knockdown cells revealed a
significant proportion of cells retained in G2/M (Figure 3C-D).
Cell cycle profiles 4 hours after release from the thymidine block
further confirm that a large proportion of cells with hyperfused
mitochondria remain in G2/M compared to control cells (Figure
3B-C). Despite this, a small proportion of cells are able to progress
back into G1 (Figure 3B-C) at 8 hours, suggesting the G2/M block
is not complete in both Drp1 and Mff siRNA knockdown cells.
However, this level of progression back into G1 is at a slower rate
compared to control cells. These data suggest that mitochondrial
hyperfusion promotes a significant delay in cell cycle progression
at the level of G2/M exit and G1 entry (Figure 3E), and is
consistent with idea that mitochondrial fission is an important
regulatory step in the preparation of the cell for mitotic cell
division.
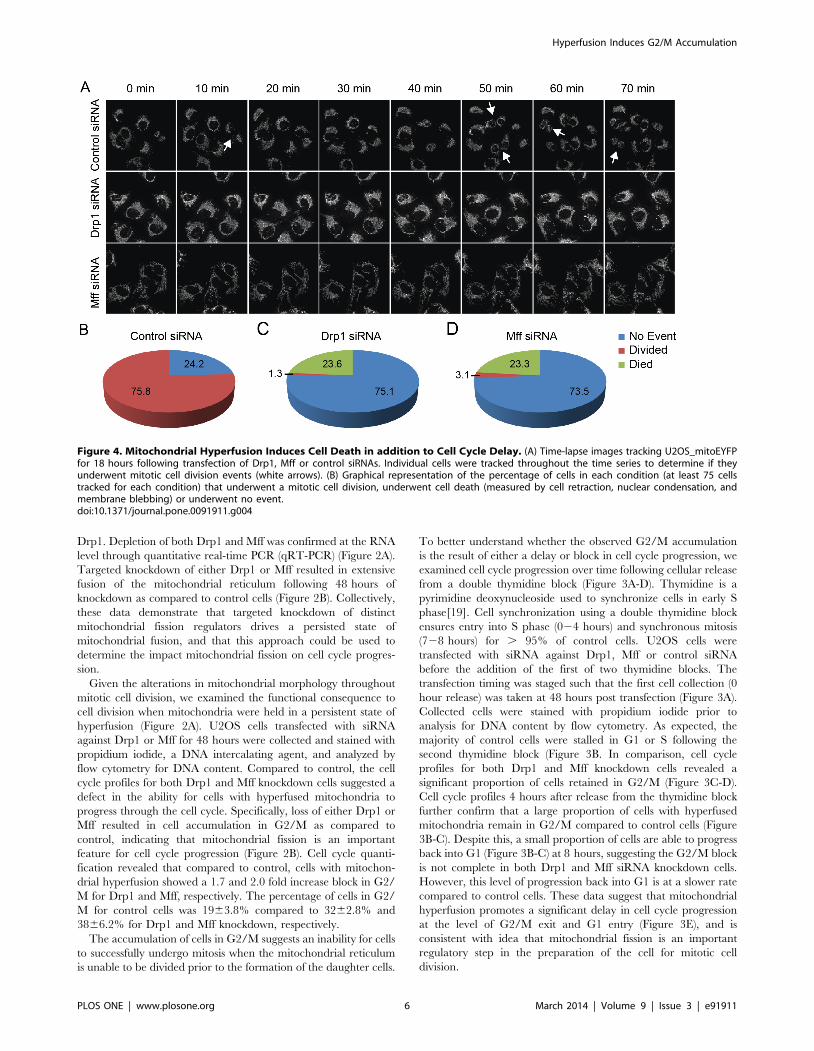
Figure 4. Mitochondrial Hyperfusion Induces Cell Death in addition to Cell Cycle Delay. (A) Time-lapse images tracking U2OS_mitoEYFPfor 18 hours following transfection of Drp1, Mff or control siRNAs. Individual cells were tracked throughout the time series to determine if theyunderwent mitotic cell division events (white arrows). (B) Graphical representation of the percentage of cells in each condition (at least 75 cellstracked for each condition) that underwent a mitotic cell division, underwent cell death (measured by cell retraction, nuclear condensation, andmembrane blebbing) or underwent no event.doi:10.1371/journal.pone.0091911.g004
Hyperfusion Induces G2/M Accumulation
PLOS ONE | www.plosone.org 6 March 2014 | Volume 9 | Issue 3 | e91911
Persisted mitochondrial hyperfusion sensitizes cells toextrinsic apoptosis
To better understand the proliferation defect observed in Drp1
and Mff knockdown cells, we tracked individual mitotic events
using time-lapse imaging. U2OS_mitoEYFP cells were transfected
48 hours prior to the start of the movie and imaged every 10
minutes for 18 hours. The number of mitotic events were counted
and compared to the number of cells that underwent no cellular
division for the duration of the movie (Figure 4A). As expected, the
number of mitotic events for Drp1 and Mff knockdown cells was
significantly lower compared to control cells. In stark contrast to
control cells, in which 76% of cells divided at least once during the
18 hour series, mitotic events in Drp1 and Mff knockdown cells
were far more rare at 1% and 3% respectively (Figure 4B-D). This
decrease in mitotic events supports our previous results (Figures 2
and 3) that mitochondrial hyperfusion results in delayed cell cycle
progression.
Interestingly, we found that cells depleted of Drp1 and Mff had
a much higher level of cell death than control cell counterparts.
Cell death was defined by cells retracting off the plate and
demonstrating morphological characteristics of apoptosis such as
nuclear condensation and plasma membrane blebbing (Figure 4B-
D) [20]. We observed 24% and 23% cell death in Drp1 and Mff
knockdown cells respectively, while no cell death events were
recorded in control cells. This suggests that these cells may be
unable to tolerate extended periods of mitochondrial fusion.
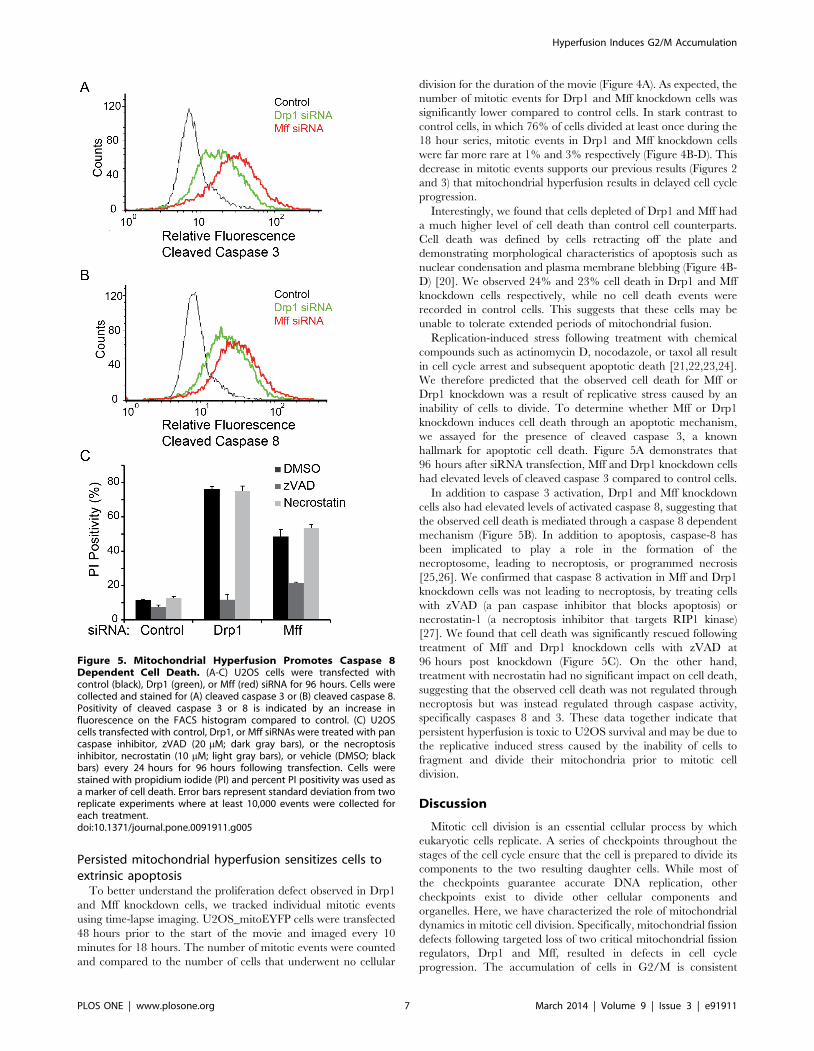
Replication-induced stress following treatment with chemical
compounds such as actinomycin D, nocodazole, or taxol all result
in cell cycle arrest and subsequent apoptotic death [21,22,23,24].
We therefore predicted that the observed cell death for Mff or
Drp1 knockdown was a result of replicative stress caused by an
inability of cells to divide. To determine whether Mff or Drp1
knockdown induces cell death through an apoptotic mechanism,
we assayed for the presence of cleaved caspase 3, a known
hallmark for apoptotic cell death. Figure 5A demonstrates that
96 hours after siRNA transfection, Mff and Drp1 knockdown cells
had elevated levels of cleaved caspase 3 compared to control cells.
In addition to caspase 3 activation, Drp1 and Mff knockdown
cells also had elevated levels of activated caspase 8, suggesting that
the observed cell death is mediated through a caspase 8 dependent
mechanism (Figure 5B). In addition to apoptosis, caspase-8 has
been implicated to play a role in the formation of the
necroptosome, leading to necroptosis, or programmed necrosis
[25,26]. We confirmed that caspase 8 activation in Mff and Drp1
knockdown cells was not leading to necroptosis, by treating cells
with zVAD (a pan caspase inhibitor that blocks apoptosis) or
necrostatin-1 (a necroptosis inhibitor that targets RIP1 kinase)
[27]. We found that cell death was significantly rescued following
treatment of Mff and Drp1 knockdown cells with zVAD at
96 hours post knockdown (Figure 5C). On the other hand,
treatment with necrostatin had no significant impact on cell death,
suggesting that the observed cell death was not regulated through
necroptosis but was instead regulated through caspase activity,
specifically caspases 8 and 3. These data together indicate that
persistent hyperfusion is toxic to U2OS survival and may be due to
the replicative induced stress caused by the inability of cells to
fragment and divide their mitochondria prior to mitotic cell
division.
Discussion
Mitotic cell division is an essential cellular process by which
eukaryotic cells replicate. A series of checkpoints throughout the
stages of the cell cycle ensure that the cell is prepared to divide its
components to the two resulting daughter cells. While most of
the checkpoints guarantee accurate DNA replication, other
checkpoints exist to divide other cellular components and
organelles. Here, we have characterized the role of mitochondrial
dynamics in mitotic cell division. Specifically, mitochondrial fission
defects following targeted loss of two critical mitochondrial fission
regulators, Drp1 and Mff, resulted in defects in cell cycle
progression. The accumulation of cells in G2/M is consistent
Figure 5. Mitochondrial Hyperfusion Promotes Caspase 8Dependent Cell Death. (A-C) U2OS cells were transfected withcontrol (black), Drp1 (green), or Mff (red) siRNA for 96 hours. Cells werecollected and stained for (A) cleaved caspase 3 or (B) cleaved caspase 8.Positivity of cleaved caspase 3 or 8 is indicated by an increase influorescence on the FACS histogram compared to control. (C) U2OScells transfected with control, Drp1, or Mff siRNAs were treated with pancaspase inhibitor, zVAD (20 mM; dark gray bars), or the necroptosisinhibitor, necrostatin (10 mM; light gray bars), or vehicle (DMSO; blackbars) every 24 hours for 96 hours following transfection. Cells werestained with propidium iodide (PI) and percent PI positivity was used asa marker of cell death. Error bars represent standard deviation from tworeplicate experiments where at least 10,000 events were collected foreach treatment.doi:10.1371/journal.pone.0091911.g005
Hyperfusion Induces G2/M Accumulation
PLOS ONE | www.plosone.org 7 March 2014 | Volume 9 | Issue 3 | e91911
with the concept that the mitochondrial network must fragment to
ensure the mitochondrial reticulum can be adequately segregated
to the two daughter cells. In a recent report by Qian et al., loss of
Drp1 caused a G2/M arrest as well as induced replication stress
leading to centrosome duplication and chromosomal instability
[12]. Interestingly, the G2/M arrest and aneuploidy observed
following loss of Drp1 could be reversed through knockdown of
cyclin E or ATM (a critical regulator of the DNA damage
response). These data suggest that the observed genome instability
is induced by replicative stress mediated by Drp1 in an ATM
signaling dependent manner [12]. Similar to their findings, our
data supports the hypothesis that cell cycle dependent fragmen-
tation of the mitochondria may serve as a novel cellular checkpoint
to ensure mitochondrial segregation prior to cytokinesis.
Although the mechanism by which Drp1 initiates coordinated
fragmentation of the reticulum prior to cytokinesis remains
unknown, one study by Strack et al. has strong evidence that
posttranslational modifications, specifically phosphorylation, may
play a critical role in activating Drp1-dependent fission [28]. Drp1
is regulated at several levels including alternate splicing of the
GTPase and variable domains, in addition to a series of post-
translation modifications including sumoylatin, S-nitrosylation, O-
glycosylation, and phosphorylation [29]. Although the functional
impact of each of these forms of Drp1 regulation remains
unknown, the authors demonstrated that specific subcellular
localization of select Drp1 splice variants to microtubules was
dependent on cyclin regulation. Specifically, splice variants
including the third but excluding the second alternative axon
localized to microtubules but were released into the cytosol from
the microtubule bundles following Cdk1 phosphorylation [28].
Cdk1 may therefore be regulating cytoplasmic levels of Drp1 as a
mechanistic strategy to induce mitochondrial fission prior to
mitotic division.
In addition to the role of mitochondrial fission regulators Drp1
and Mff in cell cycle progression, we found that persistent
mitochondrial hyperfusion induced potent apoptotic cell death.
Loss of Drp1 or Mff promoted caspase dependent apoptosis,
suggesting that mitochondrial fission is an important cellular
process to maintain cellular health. Given that cancer cells are
inherently reliant on their replicative potential for cellular survival,
it is attractive to hypothesize that the cell cycle arrest caused by
mitochondrial fusion may sensitize cell survival through replicative
stress. Support for the role of mitochondrial dynamics in cancer
progression comes from a study in lung cancer, where it was
revealed that human lung cancer cell lines have imbalanced
expression levels of Drp1/Mfn-2 that promote a state of
fragmented mitochondria [30]. Moreover, restoration of mito-
chondrial fusion through targeted knockdown of Drp1 or
overexpression of Mfn-2 resulted not only in a drop in
proliferation, but also an increase in apoptotic induction [30].
Inhibition of Drp1 through therapeutic treatment with mdivi-1, a
specific Drp1 inhibitor, resulted in significant decrease in murine
tumor growth, providing additional support the importance of
mitochondrial fission in cancer survival and proliferation [30].
The coordinated action of mitochondrial fission and fusion has
critical functions in maintaining mitochondrial function. While the
role of mitochondrial dynamics in maintaining mitochondrial
health has been well accepted, the role of mitochondrial fission on
fusion on cellular fate is less clear. The role of mitochondrial
dynamics in cancer cells is even more elusive, as most cancer cell
types no longer rely on mitochondrial for energy production and
are instead characterized by a glycolytic metabolic profile [3].
Although mitochondria have clear roles in regulating intrinsic
apoptosis, we highlight a potential non-canonical function for
mitochondrial morphology in regulating cell cycle progression.
Given that cancers are hallmarked by their seemingly limitless
replicative potential and their relative resistance to apoptosis,
finding methods to modulate mitochondrial dynamics in cancer
cells may provide new and effective therapeutic targets.
Author Contributions
Conceived and designed the experiments: LMW ADS DMB JPM.
Performed the experiments: LMW ADS DMB. Analyzed the data:
LMW ADS DMB JPM. Contributed reagents/materials/analysis tools:
JPM. Wrote the paper: LMW JPM.
References
1. Chan DC (2012) Fusion and fission: interlinked processes critical formitochondrial health. Annual review of genetics 46: 2652287.
2. Vander Heiden MG, Cantley LC, Thompson CB (2009) Understanding the
Warburg effect: the metabolic requirements of cell proliferation. Science 324:102921033.
3. Warburg O (1956) On the origin of cancer cells. Science 123: 3092314.
4. Rojo M, Legros F, Chateau D, Lombes A (2002) Membrane topology and
mitochondrial targeting of mitofusins, ubiquitous mammalian homologs of thetransmembrane GTPase Fzo. Journal of cell science 115: 166321674.
5. Santel A, Fuller MT (2001) Control of mitochondrial morphology by a human
mitofusin. Journal of cell science 114: 8672874.
6. Song Z, Chen H, Fiket M, Alexander C, Chan DC (2007) OPA1 processingcontrols mitochondrial fusion and is regulated by mRNA splicing, membrane
potential, and Yme1L. The Journal of cell biology 178: 7492755.
7. Alexander C, Votruba M, Pesch UE, Thiselton DL, Mayer S, et al. (2000)OPA1, encoding a dynamin-related GTPase, is mutated in autosomal dominant
optic atrophy linked to chromosome 3q28. Nature genetics 26: 2112215.
8. Smirnova E, Griparic L, Shurland DL, van der Bliek AM (2001) Dynamin-related protein Drp1 is required for mitochondrial division in mammalian cells.
Molecular biology of the cell 12: 224522256.
9. Youle RJ, van der Bliek AM (2012) Mitochondrial fission, fusion, and stress.Science 337: 106221065.
10. Frank S, Gaume B, Bergmann-Leitner ES, Leitner WW, Robert EG, et al.
(2001) The role of dynamin-related protein 1, a mediator of mitochondrialfission, in apoptosis. Developmental cell 1: 5152525.
11. Mitra K, Wunder C, Roysam B, Lin G, Lippincott-Schwartz J (2009) A
hyperfused mitochondrial state achieved at G1-S regulates cyclin E buildup andentry into S phase. Proceedings of the National Academy of Sciences of the
United States of America 106: 11960211965.
12. Qian W, Choi S, Gibson GA, Watkins SC, Bakkenist CJ, et al. (2012)
Mitochondrial hyperfusion induced by loss of the fission protein Drp1 causes
ATM-dependent G2/M arrest and aneuploidy through DNA replication stress.Journal of cell science 125: 574525757.
13. Alberts B, Johnson A., Lewis J., Raff M., Roberts K., (2007) Molecular Biology
of the Cell: Taylor and Francis. 1382 p.
14. Looyenga BD, Hutchings D, Cherni I, Kingsley C, Weiss GJ, et al. (2012)STAT3 is activated by JAK2 independent of key oncogenic driver mutations in
non-small cell lung carcinoma. PloS one 7: e30820.
15. Niemi NM, Lanning NJ, Westrate LM, MacKeigan JP (2013) Downregulationof the mitochondrial phosphatase PTPMT1 is sufficient to promote cancer cell
death. PloS one 8: e53803.
16. Yi M, Weaver D, Hajnoczky G (2004) Control of mitochondrial motility anddistribution by the calcium signal: a homeostatic circuit. The Journal of cell
biology 167: 6612672.
17. Boucrot E, Kirchhausen T (2007) Endosomal recycling controls plasmamembrane area during mitosis. Proceedings of the National Academy of
Sciences of the United States of America 104: 793927944.
18. Boucrot E, Kirchhausen T (2008) Mammalian cells change volume duringmitosis. PloS one 3: e1477.
19. Harper JV (2004) Synchronization of Cell Populations in G1/S and G2.M
Phases of the Cell Cycle. Methods in Molecular Biology 296: 1572166.
20. Tait SW, Green DR (2012) Mitochondria and cell signalling. Journal of cellscience 125: 8072815.
21. Wahl AF, Donaldson KL, Fairchild C, Lee FY, Foster SA, et al. (1996) Loss of
normal p53 function confers sensitization to Taxol by increasing G2/M arrestand apoptosis. Nature medicine 2: 72279.
22. Marchenko ND, Zaika A, Moll UM (2000) Death signal-induced localization of
p53 protein to mitochondria. A potential role in apoptotic signaling. The Journalof biological chemistry 275: 16202216212.
23. Philpott NJ, Turner AJ, Scopes J, Westby M, Marsh JC, et al. (1996) The use of
7-amino actinomycin D in identifying apoptosis: simplicity of use and broad
spectrum of application compared with other techniques. Blood 87: 224422251.
Hyperfusion Induces G2/M Accumulation
PLOS ONE | www.plosone.org 8 March 2014 | Volume 9 | Issue 3 | e91911
24. Masuda A, Maeno K, Nakagawa T, Saito H, Takahashi T (2003) Association
between mitotic spindle checkpoint impairment and susceptibility to theinduction of apoptosis by anti-microtubule agents in human lung cancers. The
American journal of pathology 163: 110921116.
25. Gunther C, Martini E, Wittkopf N, Amann K, Weigmann B, et al. (2011)Caspase-8 regulates TNF-alpha-induced epithelial necroptosis and terminal
ileitis. Nature 477: 3352339.26. Christofferson DE, Yuan J (2010) Necroptosis as an alternative form of
programmed cell death. Current opinion in cell biology 22: 2632268.
27. Degterev A, Hitomi J, Germscheid M, Ch’en IL, Korkina O, et al. (2008)Identification of RIP1 kinase as a specific cellular target of necrostatins. Nature
chemical biology 4: 3132321.
28. Strack S, Wilson TJ, Cribbs JT (2013) Cyclin-dependent kinases regulate splice-
specific targeting of dynamin-related protein 1 to microtubules. The Journal of
cell biology 201: 103721051.
29. Chang CR, Blackstone C (2010) Dynamic regulation of mitochondrial fission
through modification of the dynamin-related protein Drp1. Annals of the New
York Academy of Sciences 1201: 34239.
30. Rehman J, Zhang HJ, Toth PT, Zhang Y, Marsboom G, et al. (2012) Inhibition
of mitochondrial fission prevents cell cycle progression in lung cancer. FASEB
journal : official publication of the Federation of American Societies for
Experimental Biology 26: 217522186.
Hyperfusion Induces G2/M Accumulation
PLOS ONE | www.plosone.org 9 March 2014 | Volume 9 | Issue 3 | e91911