
Does Knowing the Oceanic PDO Phase Help Predict the Atmospheric Anomalies in Subsequent Months?
Upload
independentCategory
view
2download
0
Persistent Atmospheric and Oceanic Anomalies in the North Atlanticfrom Summer 2009 to Summer 2010
ZENG-ZHEN HU AND ARUN KUMAR
NOAA/NWS/NCEP Climate Prediction Center, Camp Springs, Maryland
BOHUA HUANG
Center for Ocean–Land–Atmosphere Studies, Calverton, Maryland, and Department of Atmospheric, Oceanic,
and Earth Sciences, College of Science, George Mason University, Fairfax, Virginia
YAN XUE AND WANQIU WANG
NOAA/NWS/NCEP Climate Prediction Center, Camp Springs, Maryland
BHASKAR JHA
NOAA/NWS/NCEP Climate Prediction Center, and Wyle Information Systems, Camp Springs, Maryland
(Manuscript received 19 November 2010, in final form 14 March 2011)
ABSTRACT
In this work, the authors analyze the air–sea interaction processes associated with the persistent atmo-
spheric and oceanic anomalies in the North Atlantic Ocean during summer 2009–summer 2010 with a record-
breaking positive sea surface temperature anomaly (SSTA) in the hurricane Main Development Region
(MDR) in the spring and summer of 2010. Contributions to the anomalies from the El Nino–Southern Os-
cillation (ENSO), the North Atlantic Oscillation (NAO), and a long-term trend are identified. The warming
in the tropical North Atlantic during summer 2009–summer 2010 represented a typical response to ENSO,
preconditioned and amplified by the influence of a strong and persistent negative phase of the NAO. The long-
term trends enhanced the warming in the high and low latitudes and weakened the cooling in the midlatitudes.
The persistent negative phase of the NAO was associated with active thermodynamic air–sea interaction in
the North Atlantic basin. Surface wind anomalies associated with the NAO altered the ocean surface heat flux
and changed the SSTA, which was likely further enhanced by the positive wind speed–evaporation–SST
feedback. The total heat flux was dominated by the latent and sensible heat fluxes, while the shortwave
radiation contributed to the tropical SSTA to a lesser degree. Sensitivity experiments with an atmospheric
general circulation model forced by observed SST in the Atlantic Ocean alone suggested that the Atlantic
SSTA, which was partly forced by the NAO, had some positive contribution to the persistence of the negative
phase of the NAO. Therefore, the persistent NAO condition is partly an outcome of the global climate
anomalies and the ocean–atmosphere feedback within the Atlantic basin. The combination of the ENSO,
NAO, and long-term trend resulted in the record-breaking positive SSTA in the MDR in the boreal spring
and summer of 2010. On the basis of the statistical relationship, the SSTA pattern in the North Atlantic was
reasonably well predicted by using the preceding ENSO and NAO as predictors.
1. Introduction
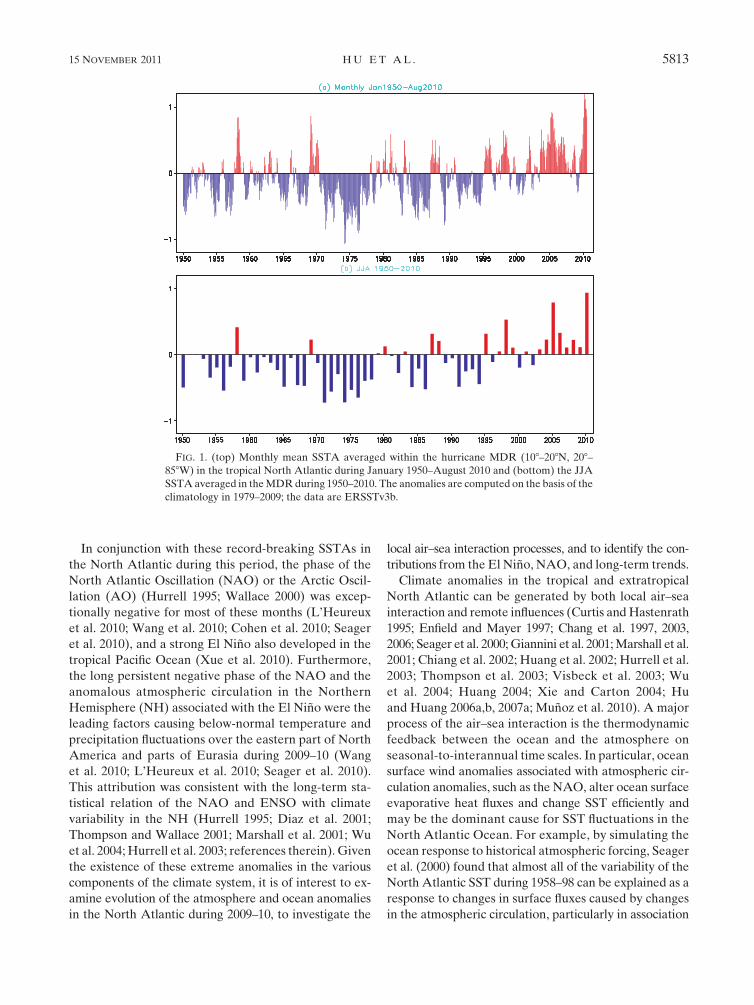
During the period from the summer of 2009 to the
summer of 2010, a strong warming tendency of sea
surface temperature (SST) occurred in the tropical and
subtropical North Atlantic Ocean (Fig. 1a), ending with
a record-breaking SST anomaly (SSTA) for several months
in the hurricane Main Development Region (MDR:
108–208N, 208–858W; see the rectangular box in Fig. 2f).
The SSTA in the MDR reached 0.948C for the mean from
June to August (JJA) 2010 and was a record value since
1950 (Fig. 1b), which partly set the background for the
active hurricane season in 2010.
Corresponding author address: Zeng-Zhen Hu, NOAA/NWS/
NCEP, Climate Prediction Center, 5200 Auth Rd., Suite 605, Camp
Springs, MD 20746.
E-mail: [email protected]
5812 J O U R N A L O F C L I M A T E VOLUME 24
DOI: 10.1175/2011JCLI4213.1
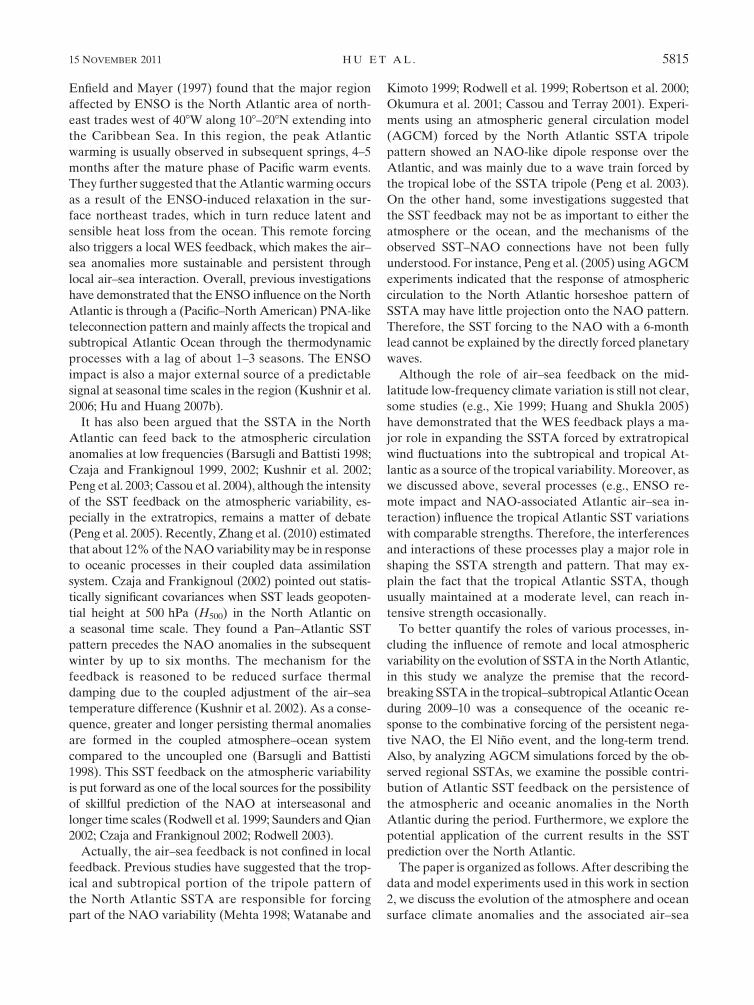
In conjunction with these record-breaking SSTAs in
the North Atlantic during this period, the phase of the
North Atlantic Oscillation (NAO) or the Arctic Oscil-
lation (AO) (Hurrell 1995; Wallace 2000) was excep-
tionally negative for most of these months (L’Heureux
et al. 2010; Wang et al. 2010; Cohen et al. 2010; Seager
et al. 2010), and a strong El Nino also developed in the
tropical Pacific Ocean (Xue et al. 2010). Furthermore,
the long persistent negative phase of the NAO and the
anomalous atmospheric circulation in the Northern
Hemisphere (NH) associated with the El Nino were the
leading factors causing below-normal temperature and
precipitation fluctuations over the eastern part of North
America and parts of Eurasia during 2009–10 (Wang
et al. 2010; L’Heureux et al. 2010; Seager et al. 2010).
This attribution was consistent with the long-term sta-
tistical relation of the NAO and ENSO with climate
variability in the NH (Hurrell 1995; Diaz et al. 2001;
Thompson and Wallace 2001; Marshall et al. 2001; Wu
et al. 2004; Hurrell et al. 2003; references therein). Given
the existence of these extreme anomalies in the various
components of the climate system, it is of interest to ex-
amine evolution of the atmosphere and ocean anomalies
in the North Atlantic during 2009–10, to investigate the
local air–sea interaction processes, and to identify the con-
tributions from the El Nino, NAO, and long-term trends.
Climate anomalies in the tropical and extratropical
North Atlantic can be generated by both local air–sea
interaction and remote influences (Curtis and Hastenrath
1995; Enfield and Mayer 1997; Chang et al. 1997, 2003,
2006; Seager et al. 2000; Giannini et al. 2001; Marshall et al.
2001; Chiang et al. 2002; Huang et al. 2002; Hurrell et al.
2003; Thompson et al. 2003; Visbeck et al. 2003; Wu
et al. 2004; Huang 2004; Xie and Carton 2004; Hu
and Huang 2006a,b, 2007a; Munoz et al. 2010). A major
process of the air–sea interaction is the thermodynamic
feedback between the ocean and the atmosphere on
seasonal-to-interannual time scales. In particular, ocean
surface wind anomalies associated with atmospheric cir-
culation anomalies, such as the NAO, alter ocean surface
evaporative heat fluxes and change SST efficiently and
may be the dominant cause for SST fluctuations in the
North Atlantic Ocean. For example, by simulating the
ocean response to historical atmospheric forcing, Seager
et al. (2000) found that almost all of the variability of the
North Atlantic SST during 1958–98 can be explained as a
response to changes in surface fluxes caused by changes
in the atmospheric circulation, particularly in association
FIG. 1. (top) Monthly mean SSTA averaged within the hurricane MDR (108–208N, 208–
858W) in the tropical North Atlantic during January 1950–August 2010 and (bottom) the JJA
SSTA averaged in the MDR during 1950–2010. The anomalies are computed on the basis of the
climatology in 1979–2009; the data are ERSSTv3b.
15 NOVEMBER 2011 H U E T A L . 5813
with the NAO. Czaja et al. (2002) also showed that the
SST variability on interannual to interdecadal time scales
can be largely explained as a result of direct atmospheric
forcing. Analysis also indicated that nearly half of the SST
variability at interannual and decadal time scales is a man-
ifestation of coupled variability in the tropical Atlantic
climate system alone, with regional ocean–atmosphere
coupling playing a critical role (Liu et al. 2004).
More importantly, a positive feedback among the sur-
face wind, evaporation, and SST through coupling be-
tween the lower atmosphere and the oceanic mixed layer
plays a key role in generating SSTA in the tropical and
subtropical Atlantic Ocean. This wind–evaporation–SST
(WES) feedback not only refers to the forcing of SSTAs
by the atmosphere as a result from changing wind speeds
(which in turn locally affects air–sea fluxes and SST), but
also includes a circulation response of the atmosphere
through SST-induced anomalous sea level pressure gra-
dients, as well as atmospheric convection through a
feedback loop. As a result, the circulation response of the
atmosphere may also generate a cross-equatorial wind
anomaly that changes the SST elsewhere (Saravanan and
Chang 2004). Thus, the WES is essentially a nonlocal
interaction and has been posited to play an important
role in the SST variability in the tropical–subtropical
Atlantic Ocean (e.g., Xie and Philander 1994; Chang et al.
1997; Xie 1999; Seager et al. 2000; Huang and Shukla
2005; Mahajan et al. 2010).
The other important influence on the climate anom-
alies in the tropical and subtropical North Atlantic is
from the Pacific ENSO (Curtis and Hastenrath 1995;
Enfield and Mayer 1997; Chang et al. 1997, 2003, 2006;
Giannini et al. 2001; Chiang et al. 2002; Huang et al.
2002; Huang 2004; Munoz et al. 2010; Mahajan et al.
2010). For example, Liu et al. (2004) suggested that the
remote impact, largely due to ENSO, may contribute to
nearly a half of the total variance of the tropical Atlantic
SST variability at interannual and decadal time scales.
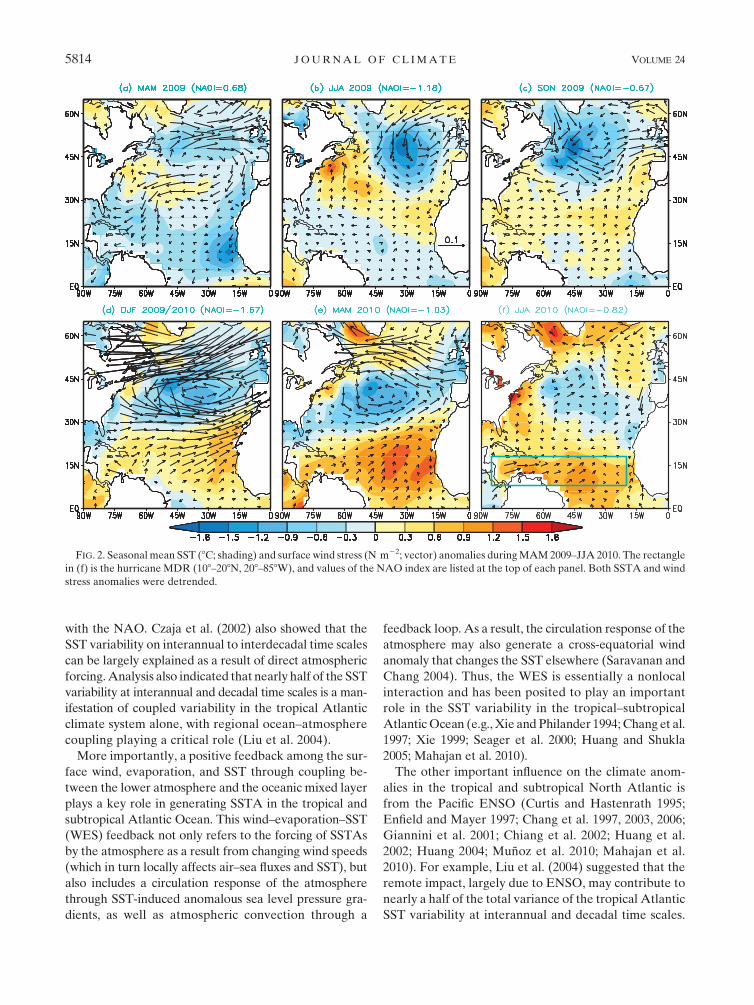
FIG. 2. Seasonal mean SST (8C; shading) and surface wind stress (N m22; vector) anomalies during MAM 2009–JJA 2010. The rectangle
in (f) is the hurricane MDR (108–208N, 208–858W), and values of the NAO index are listed at the top of each panel. Both SSTA and wind
stress anomalies were detrended.
5814 J O U R N A L O F C L I M A T E VOLUME 24
Enfield and Mayer (1997) found that the major region
affected by ENSO is the North Atlantic area of north-
east trades west of 408W along 108–208N extending into
the Caribbean Sea. In this region, the peak Atlantic
warming is usually observed in subsequent springs, 4–5
months after the mature phase of Pacific warm events.
They further suggested that the Atlantic warming occurs
as a result of the ENSO-induced relaxation in the sur-
face northeast trades, which in turn reduce latent and
sensible heat loss from the ocean. This remote forcing
also triggers a local WES feedback, which makes the air–
sea anomalies more sustainable and persistent through
local air–sea interaction. Overall, previous investigations
have demonstrated that the ENSO influence on the North
Atlantic is through a (Pacific–North American) PNA-like
teleconnection pattern and mainly affects the tropical and
subtropical Atlantic Ocean through the thermodynamic
processes with a lag of about 1–3 seasons. The ENSO
impact is also a major external source of a predictable
signal at seasonal time scales in the region (Kushnir et al.
2006; Hu and Huang 2007b).
It has also been argued that the SSTA in the North
Atlantic can feed back to the atmospheric circulation
anomalies at low frequencies (Barsugli and Battisti 1998;
Czaja and Frankignoul 1999, 2002; Kushnir et al. 2002;
Peng et al. 2003; Cassou et al. 2004), although the intensity
of the SST feedback on the atmospheric variability, es-
pecially in the extratropics, remains a matter of debate
(Peng et al. 2005). Recently, Zhang et al. (2010) estimated
that about 12% of the NAO variability may be in response
to oceanic processes in their coupled data assimilation
system. Czaja and Frankignoul (2002) pointed out statis-
tically significant covariances when SST leads geopoten-
tial height at 500 hPa (H500) in the North Atlantic on
a seasonal time scale. They found a Pan–Atlantic SST
pattern precedes the NAO anomalies in the subsequent
winter by up to six months. The mechanism for the
feedback is reasoned to be reduced surface thermal
damping due to the coupled adjustment of the air–sea
temperature difference (Kushnir et al. 2002). As a conse-
quence, greater and longer persisting thermal anomalies
are formed in the coupled atmosphere–ocean system
compared to the uncoupled one (Barsugli and Battisti
1998). This SST feedback on the atmospheric variability
is put forward as one of the local sources for the possibility
of skillful prediction of the NAO at interseasonal and
longer time scales (Rodwell et al. 1999; Saunders and Qian
2002; Czaja and Frankignoul 2002; Rodwell 2003).
Actually, the air–sea feedback is not confined in local
feedback. Previous studies have suggested that the trop-
ical and subtropical portion of the tripole pattern of
the North Atlantic SSTA are responsible for forcing
part of the NAO variability (Mehta 1998; Watanabe and
Kimoto 1999; Rodwell et al. 1999; Robertson et al. 2000;
Okumura et al. 2001; Cassou and Terray 2001). Experi-
ments using an atmospheric general circulation model
(AGCM) forced by the North Atlantic SSTA tripole
pattern showed an NAO-like dipole response over the
Atlantic, and was mainly due to a wave train forced by
the tropical lobe of the SSTA tripole (Peng et al. 2003).
On the other hand, some investigations suggested that
the SST feedback may not be as important to either the
atmosphere or the ocean, and the mechanisms of the
observed SST–NAO connections have not been fully
understood. For instance, Peng et al. (2005) using AGCM
experiments indicated that the response of atmospheric
circulation to the North Atlantic horseshoe pattern of
SSTA may have little projection onto the NAO pattern.
Therefore, the SST forcing to the NAO with a 6-month
lead cannot be explained by the directly forced planetary
waves.
Although the role of air–sea feedback on the mid-
latitude low-frequency climate variation is still not clear,
some studies (e.g., Xie 1999; Huang and Shukla 2005)
have demonstrated that the WES feedback plays a ma-
jor role in expanding the SSTA forced by extratropical
wind fluctuations into the subtropical and tropical At-
lantic as a source of the tropical variability. Moreover, as
we discussed above, several processes (e.g., ENSO re-
mote impact and NAO-associated Atlantic air–sea in-
teraction) influence the tropical Atlantic SST variations
with comparable strengths. Therefore, the interferences
and interactions of these processes play a major role in
shaping the SSTA strength and pattern. That may ex-
plain the fact that the tropical Atlantic SSTA, though
usually maintained at a moderate level, can reach in-
tensive strength occasionally.
To better quantify the roles of various processes, in-
cluding the influence of remote and local atmospheric
variability on the evolution of SSTA in the North Atlantic,
in this study we analyze the premise that the record-
breaking SSTA in the tropical–subtropical Atlantic Ocean
during 2009–10 was a consequence of the oceanic re-
sponse to the combinative forcing of the persistent nega-
tive NAO, the El Nino event, and the long-term trend.
Also, by analyzing AGCM simulations forced by the ob-
served regional SSTAs, we examine the possible contri-
bution of Atlantic SST feedback on the persistence of
the atmospheric and oceanic anomalies in the North
Atlantic during the period. Furthermore, we explore the
potential application of the current results in the SST
prediction over the North Atlantic.
The paper is organized as follows. After describing the
data and model experiments used in this work in section
2, we discuss the evolution of the atmosphere and ocean
surface climate anomalies and the associated air–sea
15 NOVEMBER 2011 H U E T A L . 5815
interaction in section 3. In section 4, we examine the
historical connection between the North Atlantic cli-
mate variability with the NAO and ENSO and explore
the possible prediction aspects for SSTA and hurricane
activities in the North Atlantic. The possible connection
of the SST anomalies with the long-term variation of
SST and ocean surface wind stress is also discussed. A
summary with some discussion is given in section 5.
2. Data and model experiments
The data used in this work are mainly from National
Centers for Environmental Prediction (NCEP) and U.S.
Department of Energy atmospheric reanalysis 2 (R2)
(Kanamitsu et al. 2002a) and monthly oceanic analysis
from the Global Ocean Data Assimilation System
(GODAS) (Behringer and Xue 2004). In GODAS, ob-
served oceanic surface and subsurface temperatures,
as well as sea surface heights, are assimilated into the
Geophysical Fluid Dynamics Laboratory Modular Ocean
Model, version 3 (MOM3), in a domain of the global
ocean within 758S–658N with a three-dimensional varia-
tional data assimilation (3D-VAR) scheme (Behringer
et al. 1998). The model has 40 vertical levels with 10-m
resolution in the upper 200 m. The horizontal resolution
is 18 by 18 with a meridional resolution of 1/38 within 108 of
the equator. At the ocean surface the model is forced by
the momentum flux, heat flux, and freshwater flux from R2
(Kanamitsu et al. 2002a). Readers can refer to Behringer
and Xue (2004) for more details about GODAS. The
variables used in this analysis include surface wind stress
from GODAS and total heat flux and its components
from R2 on a 28 3 28 resolution.
In addition, SST used in this work is from the version
3b of the extended reconstruction of the SST analyses
(ERSSTv3b) on a 28 3 28 grid over the period January
1950–August 2010 (Smith et al. 2008). The monthly mean
Nino-3.4 index is available from the Climate Prediction
Center (CPC) Web page (at http://www.cpc.ncep.noaa.
gov/data/indices/nino34.mth.ascii.txt), which is the SSTA
averaged in 58S–58N, 1208–1708W based on the ERSSTv3b
SST. The monthly mean NAO index is also available from
the CPC Web page (http://www.cpc.noaa.gov/products/
precip/CWlink/pna/norm.nao.monthly.b5001.current.ascii.
table), which was calculated on the basis of the first rotated
principal component analysis of monthly standardized
H500 anomaly obtained from the NCEP–National Center
for Atmospheric Research (NCEP–NCAR) reanalysis
(Kalnay et al. 1996) in the region 208–908N between
January 1950 and August 2010. We note that the loading
pattern is varied with seasons in the NAO index calcu-
lation. All anomalies are relative to their monthly mean
climatologies averaged for January 1979–December 2009.
To examine the feedback of SST a suite of AGCM
simulations are conducted and examined to evaluate the
Atlantic SST feedback on the persistent atmospheric
circulation anomalies in the North Atlantic. The AGCM
is the NCEP Global Forecast System (GFS) (Kanamitsu
et al. 2002b), which is the atmospheric component of the
NCEP Climate Forecast System (Saha et al. 2006). The
horizontal resolution of the model is T62 and has 64
unequally spaced sigma levels. The experiment is forced
by observed SST in the Atlantic Ocean from 308S
northward and climatology SST elsewhere. Sea ice in the
North Atlantic was specified as observed. Nine ensem-
ble number integrations with slightly different initial
conditions are carried out and the integrations are from
January 2009 to August 2010. The anomalies are com-
puted as the departure from monthly mean climatology
of a 35-yr integration of the GFS forced by global cli-
matological SST. The ensemble mean anomalies of H500
and surface wind at 10 m are examined here.
3. Atmospheric and oceanic anomaliesand air–sea interaction
a. Evolution of the atmospheric and oceanicanomalies and thermodynamical processes
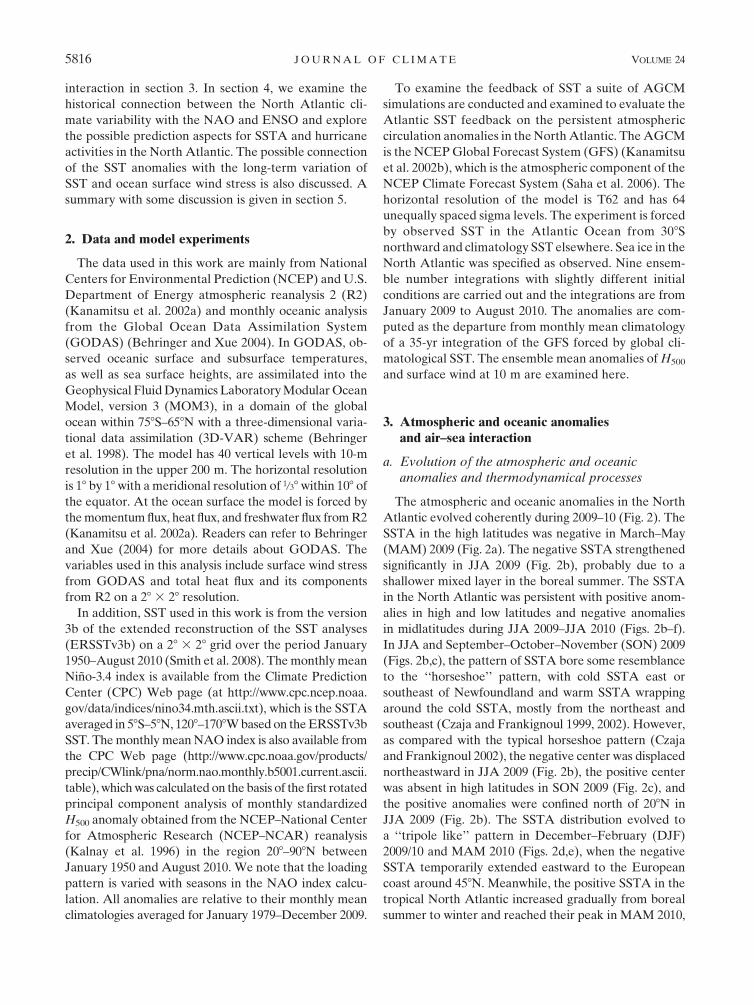
The atmospheric and oceanic anomalies in the North
Atlantic evolved coherently during 2009–10 (Fig. 2). The
SSTA in the high latitudes was negative in March–May
(MAM) 2009 (Fig. 2a). The negative SSTA strengthened
significantly in JJA 2009 (Fig. 2b), probably due to a
shallower mixed layer in the boreal summer. The SSTA
in the North Atlantic was persistent with positive anom-
alies in high and low latitudes and negative anomalies
in midlatitudes during JJA 2009–JJA 2010 (Figs. 2b–f).
In JJA and September–October–November (SON) 2009
(Figs. 2b,c), the pattern of SSTA bore some resemblance
to the ‘‘horseshoe’’ pattern, with cold SSTA east or
southeast of Newfoundland and warm SSTA wrapping
around the cold SSTA, mostly from the northeast and
southeast (Czaja and Frankignoul 1999, 2002). However,
as compared with the typical horseshoe pattern (Czaja
and Frankignoul 2002), the negative center was displaced
northeastward in JJA 2009 (Fig. 2b), the positive center
was absent in high latitudes in SON 2009 (Fig. 2c), and
the positive anomalies were confined north of 208N in
JJA 2009 (Fig. 2b). The SSTA distribution evolved to
a ‘‘tripole like’’ pattern in December–February (DJF)
2009/10 and MAM 2010 (Figs. 2d,e), when the negative
SSTA temporarily extended eastward to the European
coast around 458N. Meanwhile, the positive SSTA in the
tropical North Atlantic increased gradually from boreal
summer to winter and reached their peak in MAM 2010,
5816 J O U R N A L O F C L I M A T E VOLUME 24
likely partly due to the remote influence of the 2009–10
ENSO event that developed in the tropical Pacific (Xue
et al. 2010), and will be discussed in the next section.
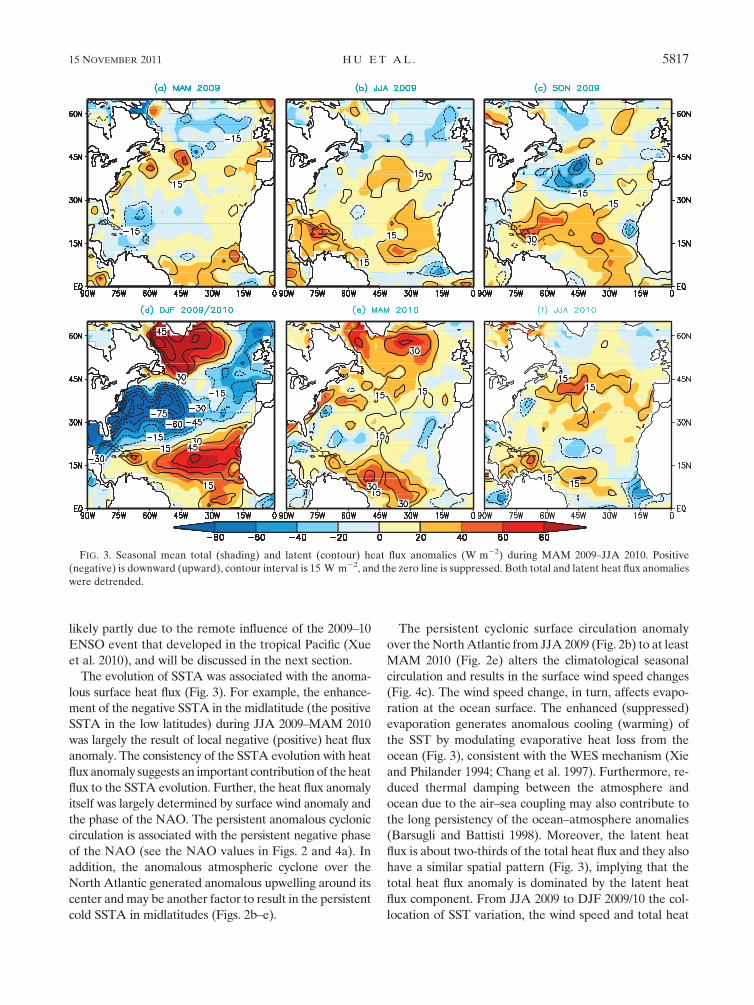
The evolution of SSTA was associated with the anoma-
lous surface heat flux (Fig. 3). For example, the enhance-
ment of the negative SSTA in the midlatitude (the positive
SSTA in the low latitudes) during JJA 2009–MAM 2010
was largely the result of local negative (positive) heat flux
anomaly. The consistency of the SSTA evolution with heat
flux anomaly suggests an important contribution of the heat
flux to the SSTA evolution. Further, the heat flux anomaly
itself was largely determined by surface wind anomaly and
the phase of the NAO. The persistent anomalous cyclonic
circulation is associated with the persistent negative phase
of the NAO (see the NAO values in Figs. 2 and 4a). In
addition, the anomalous atmospheric cyclone over the
North Atlantic generated anomalous upwelling around its
center and may be another factor to result in the persistent
cold SSTA in midlatitudes (Figs. 2b–e).
The persistent cyclonic surface circulation anomaly
over the North Atlantic from JJA 2009 (Fig. 2b) to at least
MAM 2010 (Fig. 2e) alters the climatological seasonal
circulation and results in the surface wind speed changes
(Fig. 4c). The wind speed change, in turn, affects evapo-
ration at the ocean surface. The enhanced (suppressed)
evaporation generates anomalous cooling (warming) of
the SST by modulating evaporative heat loss from the
ocean (Fig. 3), consistent with the WES mechanism (Xie
and Philander 1994; Chang et al. 1997). Furthermore, re-
duced thermal damping between the atmosphere and
ocean due to the air–sea coupling may also contribute to
the long persistency of the ocean–atmosphere anomalies
(Barsugli and Battisti 1998). Moreover, the latent heat
flux is about two-thirds of the total heat flux and they also
have a similar spatial pattern (Fig. 3), implying that the
total heat flux anomaly is dominated by the latent heat
flux component. From JJA 2009 to DJF 2009/10 the col-
location of SST variation, the wind speed and total heat
FIG. 3. Seasonal mean total (shading) and latent (contour) heat flux anomalies (W m22) during MAM 2009–JJA 2010. Positive
(negative) is downward (upward), contour interval is 15 W m22, and the zero line is suppressed. Both total and latent heat flux anomalies
were detrended.
15 NOVEMBER 2011 H U E T A L . 5817
flux anomalies increased, and both negative and positive
anomalies of the wind speed and total heat flux intensified,
reflecting the seasonality of atmospheric forcing (Portis
et al. 2001; Hurrell and Deser 2009). The southward dis-
placement of the atmospheric cyclone from boreal fall to
winter follows the seasonal migration of the midlatitude
westerlies and the subtropical high in the North Atlantic.
This displacement may also be partly prompted by the
warm SSTA generated by the westerly anomalies at its
southern flank of the subtropical high, which in turn in-
duces warm SSTA farther south, as the WES mechanism
would predict. After reaching their maxima in DJF 2009/
10 (Figs. 2d and 3d), both amplitudes of the surface wind
stress and total heat flux anomalies decreased gradually in
the following seasons (Figs. 2e,f, and 3e,f), consist with the
seasonality of atmospheric forcing.
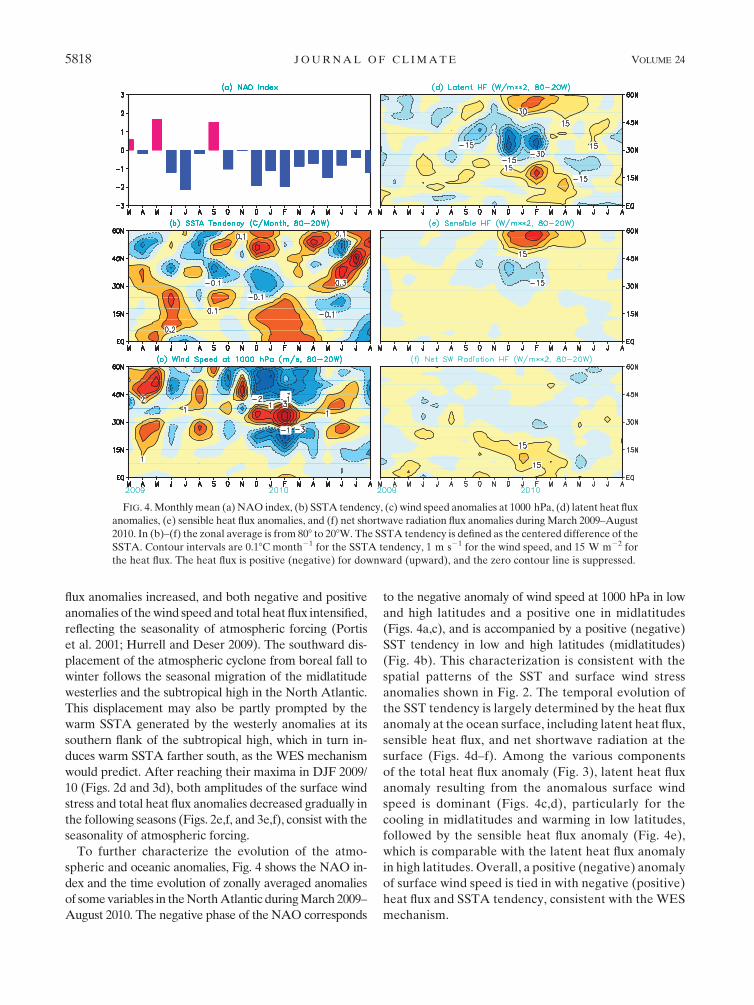
To further characterize the evolution of the atmo-
spheric and oceanic anomalies, Fig. 4 shows the NAO in-
dex and the time evolution of zonally averaged anomalies
of some variables in the North Atlantic during March 2009–
August 2010. The negative phase of the NAO corresponds
to the negative anomaly of wind speed at 1000 hPa in low
and high latitudes and a positive one in midlatitudes
(Figs. 4a,c), and is accompanied by a positive (negative)
SST tendency in low and high latitudes (midlatitudes)
(Fig. 4b). This characterization is consistent with the
spatial patterns of the SST and surface wind stress
anomalies shown in Fig. 2. The temporal evolution of
the SST tendency is largely determined by the heat flux
anomaly at the ocean surface, including latent heat flux,
sensible heat flux, and net shortwave radiation at the
surface (Figs. 4d–f). Among the various components
of the total heat flux anomaly (Fig. 3), latent heat flux
anomaly resulting from the anomalous surface wind
speed is dominant (Figs. 4c,d), particularly for the
cooling in midlatitudes and warming in low latitudes,
followed by the sensible heat flux anomaly (Fig. 4e),
which is comparable with the latent heat flux anomaly
in high latitudes. Overall, a positive (negative) anomaly
of surface wind speed is tied in with negative (positive)
heat flux and SSTA tendency, consistent with the WES
mechanism.
FIG. 4. Monthly mean (a) NAO index, (b) SSTA tendency, (c) wind speed anomalies at 1000 hPa, (d) latent heat flux
anomalies, (e) sensible heat flux anomalies, and (f) net shortwave radiation flux anomalies during March 2009–August
2010. In (b)–(f) the zonal average is from 808 to 208W. The SSTA tendency is defined as the centered difference of the
SSTA. Contour intervals are 0.18C month21 for the SSTA tendency, 1 m s21 for the wind speed, and 15 W m22 for
the heat flux. The heat flux is positive (negative) for downward (upward), and the zero contour line is suppressed.
5818 J O U R N A L O F C L I M A T E VOLUME 24
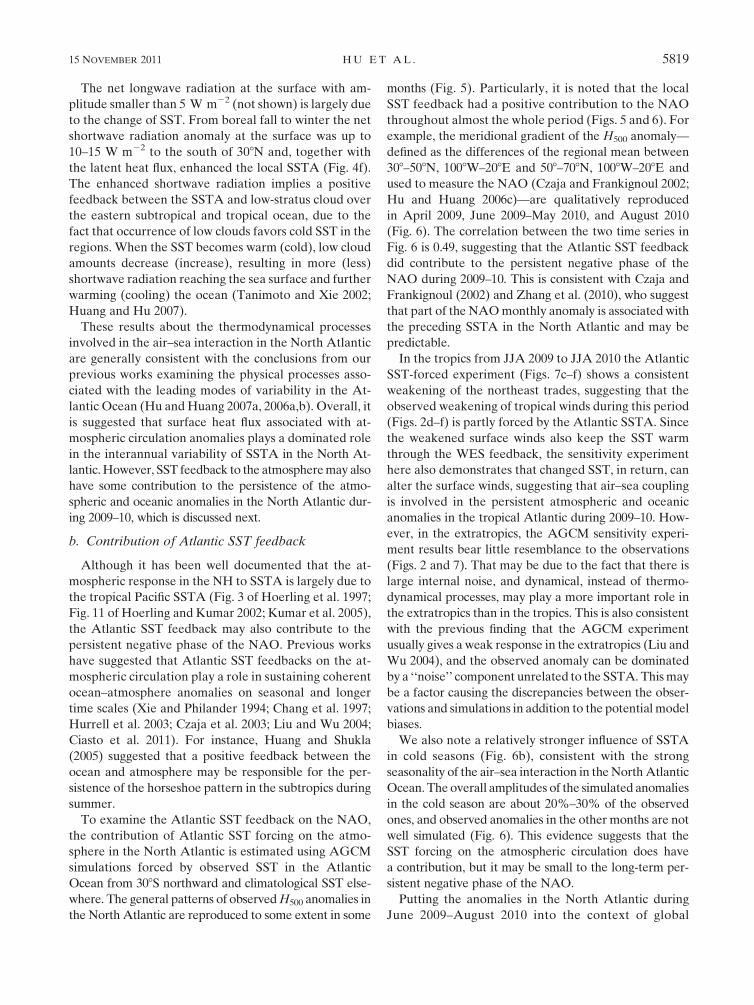
The net longwave radiation at the surface with am-
plitude smaller than 5 W m22 (not shown) is largely due
to the change of SST. From boreal fall to winter the net
shortwave radiation anomaly at the surface was up to
10–15 W m22 to the south of 308N and, together with
the latent heat flux, enhanced the local SSTA (Fig. 4f).
The enhanced shortwave radiation implies a positive
feedback between the SSTA and low-stratus cloud over
the eastern subtropical and tropical ocean, due to the
fact that occurrence of low clouds favors cold SST in the
regions. When the SST becomes warm (cold), low cloud
amounts decrease (increase), resulting in more (less)
shortwave radiation reaching the sea surface and further
warming (cooling) the ocean (Tanimoto and Xie 2002;
Huang and Hu 2007).
These results about the thermodynamical processes
involved in the air–sea interaction in the North Atlantic
are generally consistent with the conclusions from our
previous works examining the physical processes asso-
ciated with the leading modes of variability in the At-
lantic Ocean (Hu and Huang 2007a, 2006a,b). Overall, it
is suggested that surface heat flux associated with at-
mospheric circulation anomalies plays a dominated role
in the interannual variability of SSTA in the North At-
lantic. However, SST feedback to the atmosphere may also
have some contribution to the persistence of the atmo-
spheric and oceanic anomalies in the North Atlantic dur-
ing 2009–10, which is discussed next.
b. Contribution of Atlantic SST feedback
Although it has been well documented that the at-
mospheric response in the NH to SSTA is largely due to
the tropical Pacific SSTA (Fig. 3 of Hoerling et al. 1997;
Fig. 11 of Hoerling and Kumar 2002; Kumar et al. 2005),
the Atlantic SST feedback may also contribute to the
persistent negative phase of the NAO. Previous works
have suggested that Atlantic SST feedbacks on the at-
mospheric circulation play a role in sustaining coherent
ocean–atmosphere anomalies on seasonal and longer
time scales (Xie and Philander 1994; Chang et al. 1997;
Hurrell et al. 2003; Czaja et al. 2003; Liu and Wu 2004;
Ciasto et al. 2011). For instance, Huang and Shukla
(2005) suggested that a positive feedback between the
ocean and atmosphere may be responsible for the per-
sistence of the horseshoe pattern in the subtropics during
summer.
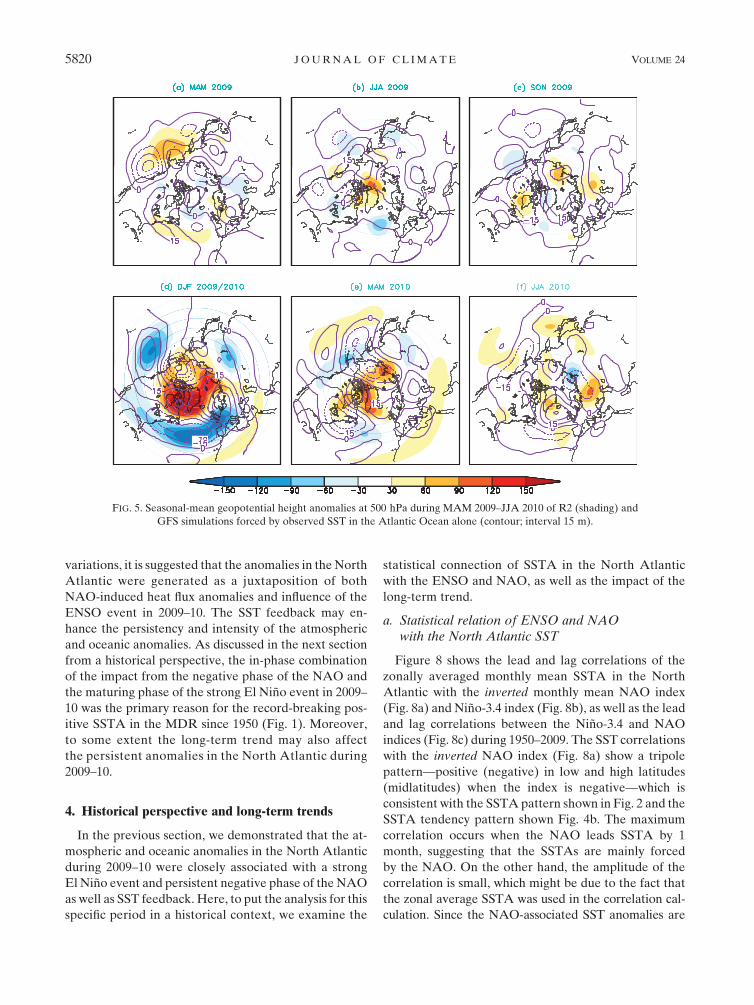
To examine the Atlantic SST feedback on the NAO,
the contribution of Atlantic SST forcing on the atmo-
sphere in the North Atlantic is estimated using AGCM
simulations forced by observed SST in the Atlantic
Ocean from 308S northward and climatological SST else-
where. The general patterns of observed H500 anomalies in
the North Atlantic are reproduced to some extent in some
months (Fig. 5). Particularly, it is noted that the local
SST feedback had a positive contribution to the NAO
throughout almost the whole period (Figs. 5 and 6). For
example, the meridional gradient of the H500 anomaly—
defined as the differences of the regional mean between
308–508N, 1008W–208E and 508–708N, 1008W–208E and
used to measure the NAO (Czaja and Frankignoul 2002;
Hu and Huang 2006c)—are qualitatively reproduced
in April 2009, June 2009–May 2010, and August 2010
(Fig. 6). The correlation between the two time series in
Fig. 6 is 0.49, suggesting that the Atlantic SST feedback
did contribute to the persistent negative phase of the
NAO during 2009–10. This is consistent with Czaja and
Frankignoul (2002) and Zhang et al. (2010), who suggest
that part of the NAO monthly anomaly is associated with
the preceding SSTA in the North Atlantic and may be
predictable.
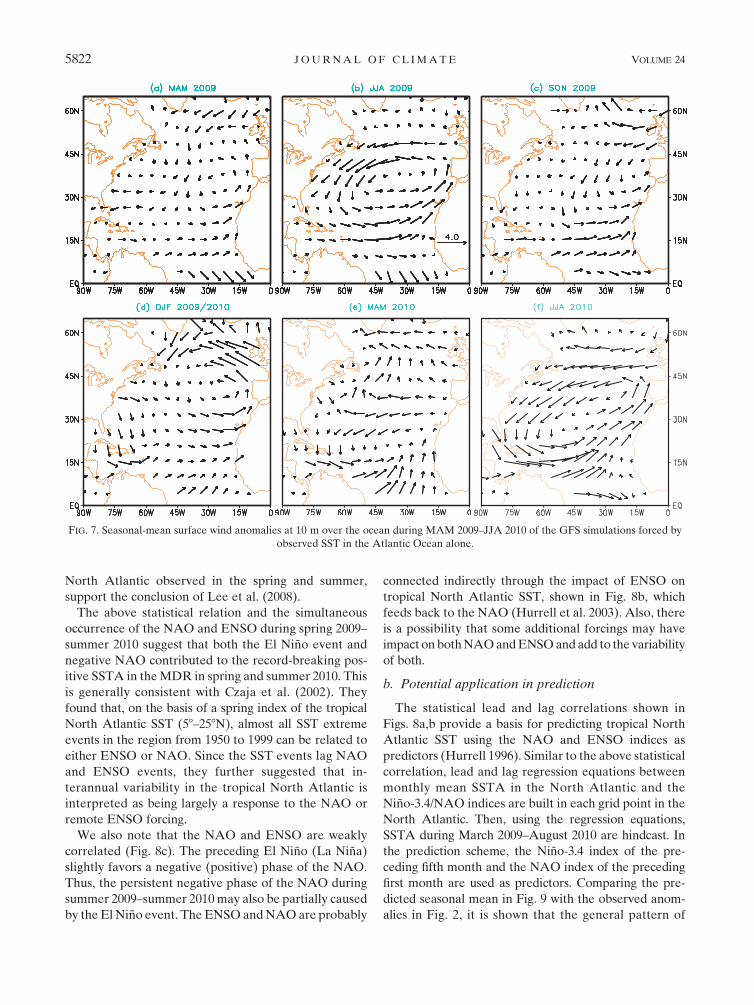
In the tropics from JJA 2009 to JJA 2010 the Atlantic
SST-forced experiment (Figs. 7c–f) shows a consistent
weakening of the northeast trades, suggesting that the
observed weakening of tropical winds during this period
(Figs. 2d–f) is partly forced by the Atlantic SSTA. Since
the weakened surface winds also keep the SST warm
through the WES feedback, the sensitivity experiment
here also demonstrates that changed SST, in return, can
alter the surface winds, suggesting that air–sea coupling
is involved in the persistent atmospheric and oceanic
anomalies in the tropical Atlantic during 2009–10. How-
ever, in the extratropics, the AGCM sensitivity experi-
ment results bear little resemblance to the observations
(Figs. 2 and 7). That may be due to the fact that there is
large internal noise, and dynamical, instead of thermo-
dynamical processes, may play a more important role in
the extratropics than in the tropics. This is also consistent
with the previous finding that the AGCM experiment
usually gives a weak response in the extratropics (Liu and
Wu 2004), and the observed anomaly can be dominated
by a ‘‘noise’’ component unrelated to the SSTA. This may
be a factor causing the discrepancies between the obser-
vations and simulations in addition to the potential model
biases.
We also note a relatively stronger influence of SSTA
in cold seasons (Fig. 6b), consistent with the strong
seasonality of the air–sea interaction in the North Atlantic
Ocean. The overall amplitudes of the simulated anomalies
in the cold season are about 20%–30% of the observed
ones, and observed anomalies in the other months are not
well simulated (Fig. 6). This evidence suggests that the
SST forcing on the atmospheric circulation does have
a contribution, but it may be small to the long-term per-
sistent negative phase of the NAO.
Putting the anomalies in the North Atlantic during
June 2009–August 2010 into the context of global
15 NOVEMBER 2011 H U E T A L . 5819
variations, it is suggested that the anomalies in the North
Atlantic were generated as a juxtaposition of both
NAO-induced heat flux anomalies and influence of the
ENSO event in 2009–10. The SST feedback may en-
hance the persistency and intensity of the atmospheric
and oceanic anomalies. As discussed in the next section
from a historical perspective, the in-phase combination
of the impact from the negative phase of the NAO and
the maturing phase of the strong El Nino event in 2009–
10 was the primary reason for the record-breaking pos-
itive SSTA in the MDR since 1950 (Fig. 1). Moreover,
to some extent the long-term trend may also affect
the persistent anomalies in the North Atlantic during
2009–10.
4. Historical perspective and long-term trends
In the previous section, we demonstrated that the at-
mospheric and oceanic anomalies in the North Atlantic
during 2009–10 were closely associated with a strong
El Nino event and persistent negative phase of the NAO
as well as SST feedback. Here, to put the analysis for this
specific period in a historical context, we examine the
statistical connection of SSTA in the North Atlantic
with the ENSO and NAO, as well as the impact of the
long-term trend.
a. Statistical relation of ENSO and NAOwith the North Atlantic SST
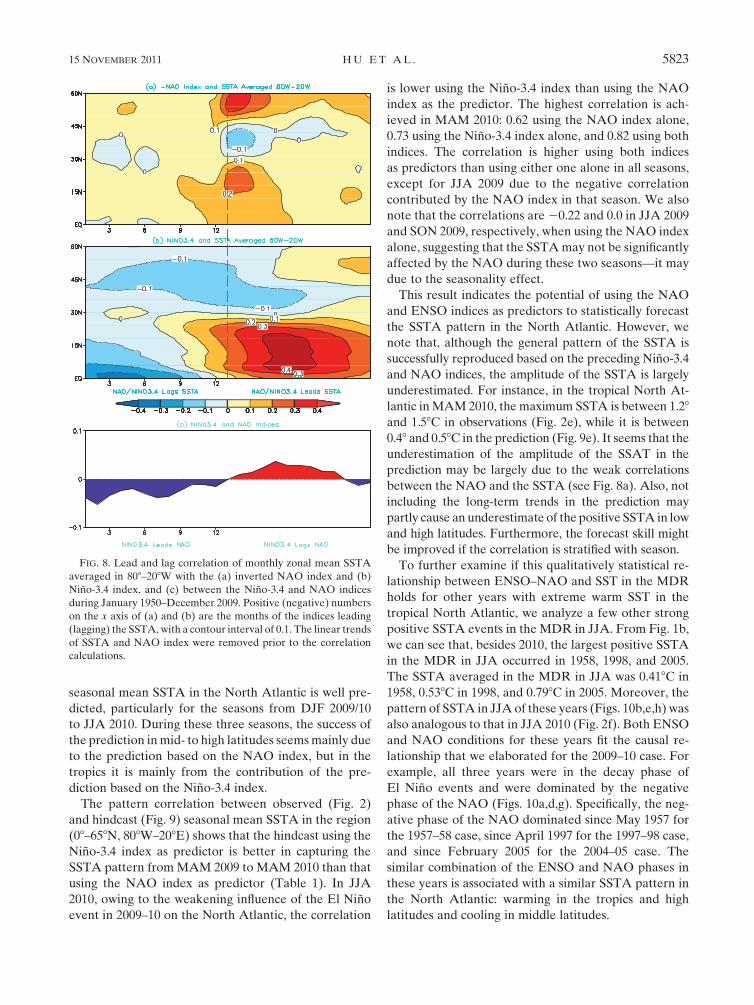
Figure 8 shows the lead and lag correlations of the
zonally averaged monthly mean SSTA in the North
Atlantic with the inverted monthly mean NAO index
(Fig. 8a) and Nino-3.4 index (Fig. 8b), as well as the lead
and lag correlations between the Nino-3.4 and NAO
indices (Fig. 8c) during 1950–2009. The SST correlations
with the inverted NAO index (Fig. 8a) show a tripole
pattern—positive (negative) in low and high latitudes
(midlatitudes) when the index is negative—which is
consistent with the SSTA pattern shown in Fig. 2 and the
SSTA tendency pattern shown Fig. 4b. The maximum
correlation occurs when the NAO leads SSTA by 1
month, suggesting that the SSTAs are mainly forced
by the NAO. On the other hand, the amplitude of the
correlation is small, which might be due to the fact that
the zonal average SSTA was used in the correlation cal-
culation. Since the NAO-associated SST anomalies are
FIG. 5. Seasonal-mean geopotential height anomalies at 500 hPa during MAM 2009–JJA 2010 of R2 (shading) and
GFS simulations forced by observed SST in the Atlantic Ocean alone (contour; interval 15 m).
5820 J O U R N A L O F C L I M A T E VOLUME 24

largely a horseshoe or tripole-like pattern with appreciable
zonal heterogeneity, the zonal average makes the signal
weak. The small correlation may also be caused by the
strong internal variability and the large seasonality of
the NAO, particularly its strong seasonal migration in
the meridional direction (Portis et al. 2001; Hurrell and
Deser 2009). The major impact of the NAO on the North
Atlantic SST is during boreal winter and early spring, and
the lack of NAO coherence and persistence in boreal
summer may also lead to a weak SST imprint. In addition,
interdecadal change of the NAO-associated spatial pat-
tern (Hilmer and Jung 2000) may also be a factor weak-
ening the long-term statistical correlation between the
NAO and North Atlantic SST.
Besides the NAO, ENSO is another factor affecting
tropical Atlantic SST variability (Czaja et al. 2002, 2003;
Liu et al. 2004; references therein). Figure 8b displays
the lead and lag correlation between the Nino-3.4 index
and the zonal averaged SSTA. Maximum positive cor-
relations are seen between the equator and 308N when
the index leads the SSTA by 3–8 months, and the maxi-
mum negative correlations are present along the equator
when the index lags the SSTA by 6–12 months. The
amplitude of the positive correlation coefficient reaches
0.4, which is larger than the corresponding correlation
with the NAO shown in Fig. 8a, suggesting a more robust
and longer persistent connection between the ENSO and
SSTA in the tropical and subtropical North Atlantic than
between the NAO and SSTA. It should be indicated that
the ENSO teleconnection is also seasonally dependent,
with the tropical North Atlantic SSTA in boreal spring
strongly correlated with the Nino-3.4 index at the pre-
vious winter.
These results about the connection of the SSTA in the
tropical and subtropical North Atlantic with ENSO are
generally consistent with previous works (e.g., Curtis
and Hastenrath 1995; Enfield and Mayer 1997; Xie and
Carton 2004; Wang 2002; Liu et al. 2004), and have been
confirmed by regional coupling experiments of Huang
et al. (2002) and Huang (2004), and model sensitivity
experiments of Chang et al. (2006). Nevertheless, the
impact of an El Nino event on the tropical North Atlantic
in the following spring and early summer may depend
on the end time of the El Nino event. For example,
an El Nino event causes warming in the tropical North
Atlantic in the following spring and early summer only if
it does not end before April (Lee et al. 2008). For the
El Nino event in 2009–10, the evidence of a persistent
strong positive SSTA in the tropical central Pacific until
April 2010, and a significant warming in the tropical
FIG. 6. Monthly mean anomalies of the meridional gradient of H500 (m) between its regional
means in 308–508N, 1008W–208E and 508–708N, 1008W–208E for the (a) R2 and (b) GFS sim-
ulation forced by observed SST in the Atlantic Ocean alone. The linear correlation between the
two time series is 0.49.
15 NOVEMBER 2011 H U E T A L . 5821
North Atlantic observed in the spring and summer,
support the conclusion of Lee et al. (2008).
The above statistical relation and the simultaneous
occurrence of the NAO and ENSO during spring 2009–
summer 2010 suggest that both the El Nino event and
negative NAO contributed to the record-breaking pos-
itive SSTA in the MDR in spring and summer 2010. This
is generally consistent with Czaja et al. (2002). They
found that, on the basis of a spring index of the tropical
North Atlantic SST (58–258N), almost all SST extreme
events in the region from 1950 to 1999 can be related to
either ENSO or NAO. Since the SST events lag NAO
and ENSO events, they further suggested that in-
terannual variability in the tropical North Atlantic is
interpreted as being largely a response to the NAO or
remote ENSO forcing.
We also note that the NAO and ENSO are weakly
correlated (Fig. 8c). The preceding El Nino (La Nina)
slightly favors a negative (positive) phase of the NAO.
Thus, the persistent negative phase of the NAO during
summer 2009–summer 2010 may also be partially caused
by the El Nino event. The ENSO and NAO are probably
connected indirectly through the impact of ENSO on
tropical North Atlantic SST, shown in Fig. 8b, which
feeds back to the NAO (Hurrell et al. 2003). Also, there
is a possibility that some additional forcings may have
impact on both NAO and ENSO and add to the variability
of both.
b. Potential application in prediction
The statistical lead and lag correlations shown in
Figs. 8a,b provide a basis for predicting tropical North
Atlantic SST using the NAO and ENSO indices as
predictors (Hurrell 1996). Similar to the above statistical
correlation, lead and lag regression equations between
monthly mean SSTA in the North Atlantic and the
Nino-3.4/NAO indices are built in each grid point in the
North Atlantic. Then, using the regression equations,
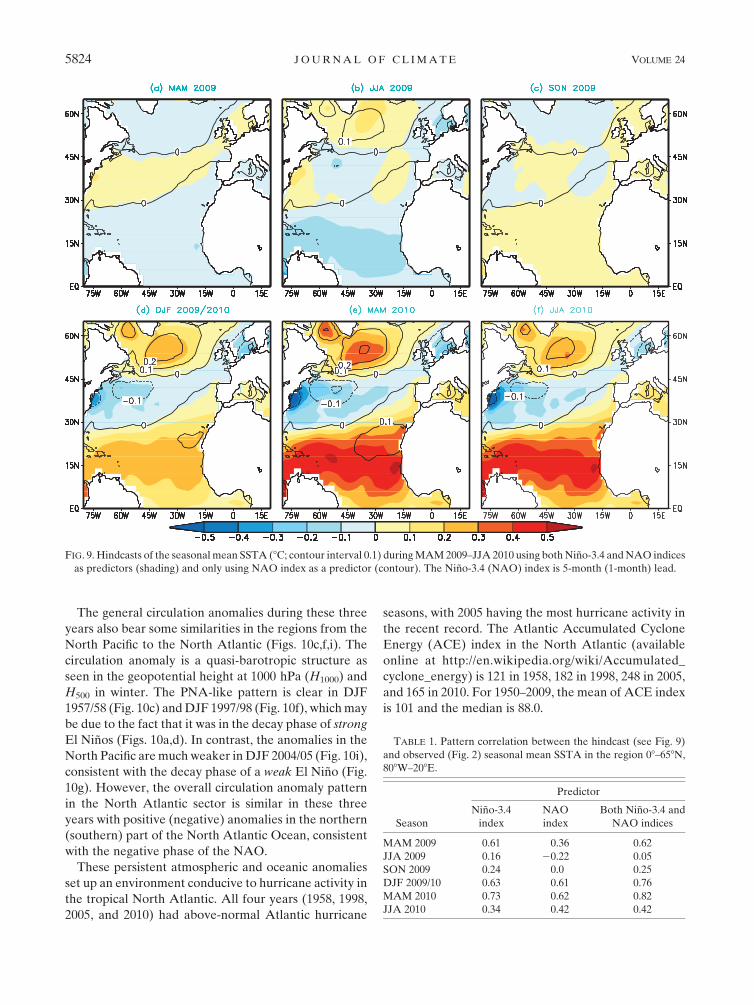
SSTA during March 2009–August 2010 are hindcast. In
the prediction scheme, the Nino-3.4 index of the pre-
ceding fifth month and the NAO index of the preceding
first month are used as predictors. Comparing the pre-
dicted seasonal mean in Fig. 9 with the observed anom-
alies in Fig. 2, it is shown that the general pattern of
FIG. 7. Seasonal-mean surface wind anomalies at 10 m over the ocean during MAM 2009–JJA 2010 of the GFS simulations forced by
observed SST in the Atlantic Ocean alone.
5822 J O U R N A L O F C L I M A T E VOLUME 24
seasonal mean SSTA in the North Atlantic is well pre-
dicted, particularly for the seasons from DJF 2009/10
to JJA 2010. During these three seasons, the success of
the prediction in mid- to high latitudes seems mainly due
to the prediction based on the NAO index, but in the
tropics it is mainly from the contribution of the pre-
diction based on the Nino-3.4 index.
The pattern correlation between observed (Fig. 2)
and hindcast (Fig. 9) seasonal mean SSTA in the region
(08–658N, 808W–208E) shows that the hindcast using the
Nino-3.4 index as predictor is better in capturing the
SSTA pattern from MAM 2009 to MAM 2010 than that
using the NAO index as predictor (Table 1). In JJA
2010, owing to the weakening influence of the El Nino
event in 2009–10 on the North Atlantic, the correlation
is lower using the Nino-3.4 index than using the NAO
index as the predictor. The highest correlation is ach-
ieved in MAM 2010: 0.62 using the NAO index alone,
0.73 using the Nino-3.4 index alone, and 0.82 using both
indices. The correlation is higher using both indices
as predictors than using either one alone in all seasons,
except for JJA 2009 due to the negative correlation
contributed by the NAO index in that season. We also
note that the correlations are 20.22 and 0.0 in JJA 2009
and SON 2009, respectively, when using the NAO index
alone, suggesting that the SSTA may not be significantly
affected by the NAO during these two seasons—it may
due to the seasonality effect.
This result indicates the potential of using the NAO
and ENSO indices as predictors to statistically forecast
the SSTA pattern in the North Atlantic. However, we
note that, although the general pattern of the SSTA is
successfully reproduced based on the preceding Nino-3.4
and NAO indices, the amplitude of the SSTA is largely
underestimated. For instance, in the tropical North At-
lantic in MAM 2010, the maximum SSTA is between 1.28
and 1.58C in observations (Fig. 2e), while it is between
0.48 and 0.58C in the prediction (Fig. 9e). It seems that the
underestimation of the amplitude of the SSAT in the
prediction may be largely due to the weak correlations
between the NAO and the SSTA (see Fig. 8a). Also, not
including the long-term trends in the prediction may
partly cause an underestimate of the positive SSTA in low
and high latitudes. Furthermore, the forecast skill might
be improved if the correlation is stratified with season.
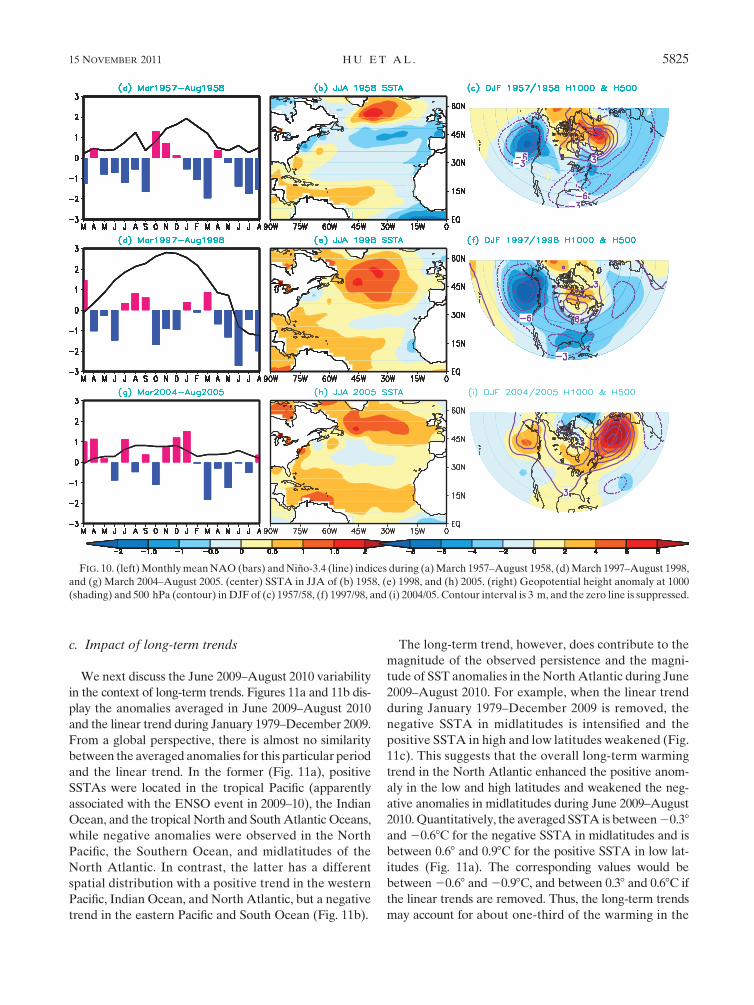
To further examine if this qualitatively statistical re-
lationship between ENSO–NAO and SST in the MDR
holds for other years with extreme warm SST in the
tropical North Atlantic, we analyze a few other strong
positive SSTA events in the MDR in JJA. From Fig. 1b,
we can see that, besides 2010, the largest positive SSTA
in the MDR in JJA occurred in 1958, 1998, and 2005.
The SSTA averaged in the MDR in JJA was 0.418C in
1958, 0.538C in 1998, and 0.798C in 2005. Moreover, the
pattern of SSTA in JJA of these years (Figs. 10b,e,h) was
also analogous to that in JJA 2010 (Fig. 2f). Both ENSO
and NAO conditions for these years fit the causal re-
lationship that we elaborated for the 2009–10 case. For
example, all three years were in the decay phase of
El Nino events and were dominated by the negative
phase of the NAO (Figs. 10a,d,g). Specifically, the neg-
ative phase of the NAO dominated since May 1957 for
the 1957–58 case, since April 1997 for the 1997–98 case,
and since February 2005 for the 2004–05 case. The
similar combination of the ENSO and NAO phases in
these years is associated with a similar SSTA pattern in
the North Atlantic: warming in the tropics and high
latitudes and cooling in middle latitudes.
FIG. 8. Lead and lag correlation of monthly zonal mean SSTA
averaged in 808–208W with the (a) inverted NAO index and (b)
Nino-3.4 index, and (c) between the Nino-3.4 and NAO indices
during January 1950–December 2009. Positive (negative) numbers
on the x axis of (a) and (b) are the months of the indices leading
(lagging) the SSTA, with a contour interval of 0.1. The linear trends
of SSTA and NAO index were removed prior to the correlation
calculations.
15 NOVEMBER 2011 H U E T A L . 5823
The general circulation anomalies during these three
years also bear some similarities in the regions from the
North Pacific to the North Atlantic (Figs. 10c,f,i). The
circulation anomaly is a quasi-barotropic structure as
seen in the geopotential height at 1000 hPa (H1000) and
H500 in winter. The PNA-like pattern is clear in DJF
1957/58 (Fig. 10c) and DJF 1997/98 (Fig. 10f), which may
be due to the fact that it was in the decay phase of strong
El Ninos (Figs. 10a,d). In contrast, the anomalies in the
North Pacific are much weaker in DJF 2004/05 (Fig. 10i),
consistent with the decay phase of a weak El Nino (Fig.
10g). However, the overall circulation anomaly pattern
in the North Atlantic sector is similar in these three
years with positive (negative) anomalies in the northern
(southern) part of the North Atlantic Ocean, consistent
with the negative phase of the NAO.
These persistent atmospheric and oceanic anomalies
set up an environment conducive to hurricane activity in
the tropical North Atlantic. All four years (1958, 1998,
2005, and 2010) had above-normal Atlantic hurricane
seasons, with 2005 having the most hurricane activity in
the recent record. The Atlantic Accumulated Cyclone
Energy (ACE) index in the North Atlantic (available
online at http://en.wikipedia.org/wiki/Accumulated_
cyclone_energy) is 121 in 1958, 182 in 1998, 248 in 2005,
and 165 in 2010. For 1950–2009, the mean of ACE index
is 101 and the median is 88.0.
FIG. 9. Hindcasts of the seasonal mean SSTA (8C; contour interval 0.1) during MAM 2009–JJA 2010 using both Nino-3.4 and NAO indices
as predictors (shading) and only using NAO index as a predictor (contour). The Nino-3.4 (NAO) index is 5-month (1-month) lead.
TABLE 1. Pattern correlation between the hindcast (see Fig. 9)
and observed (Fig. 2) seasonal mean SSTA in the region 08–658N,
808W–208E.
Predictor
Season
Nino-3.4
index
NAO
index
Both Nino-3.4 and
NAO indices
MAM 2009 0.61 0.36 0.62
JJA 2009 0.16 20.22 0.05
SON 2009 0.24 0.0 0.25
DJF 2009/10 0.63 0.61 0.76
MAM 2010 0.73 0.62 0.82
JJA 2010 0.34 0.42 0.42
5824 J O U R N A L O F C L I M A T E VOLUME 24
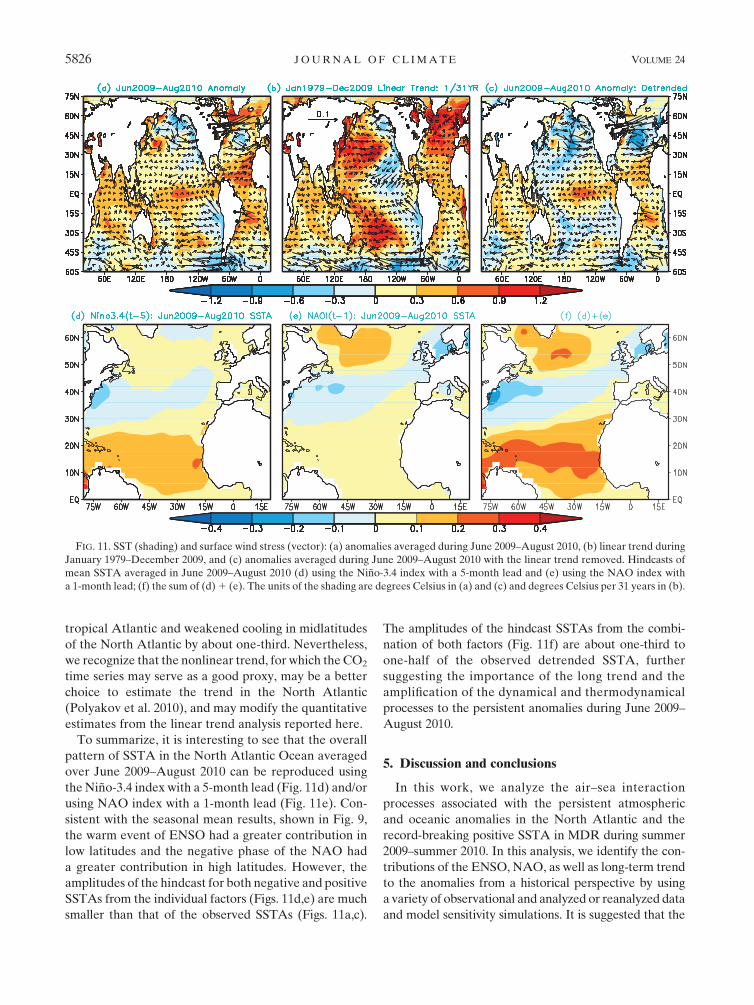
c. Impact of long-term trends
We next discuss the June 2009–August 2010 variability
in the context of long-term trends. Figures 11a and 11b dis-
play the anomalies averaged in June 2009–August 2010
and the linear trend during January 1979–December 2009.
From a global perspective, there is almost no similarity
between the averaged anomalies for this particular period
and the linear trend. In the former (Fig. 11a), positive
SSTAs were located in the tropical Pacific (apparently
associated with the ENSO event in 2009–10), the Indian
Ocean, and the tropical North and South Atlantic Oceans,
while negative anomalies were observed in the North
Pacific, the Southern Ocean, and midlatitudes of the
North Atlantic. In contrast, the latter has a different
spatial distribution with a positive trend in the western
Pacific, Indian Ocean, and North Atlantic, but a negative
trend in the eastern Pacific and South Ocean (Fig. 11b).
The long-term trend, however, does contribute to the
magnitude of the observed persistence and the magni-
tude of SST anomalies in the North Atlantic during June
2009–August 2010. For example, when the linear trend
during January 1979–December 2009 is removed, the
negative SSTA in midlatitudes is intensified and the
positive SSTA in high and low latitudes weakened (Fig.
11c). This suggests that the overall long-term warming
trend in the North Atlantic enhanced the positive anom-
aly in the low and high latitudes and weakened the neg-
ative anomalies in midlatitudes during June 2009–August
2010. Quantitatively, the averaged SSTA is between 20.38
and 20.68C for the negative SSTA in midlatitudes and is
between 0.68 and 0.98C for the positive SSTA in low lat-
itudes (Fig. 11a). The corresponding values would be
between 20.68 and 20.98C, and between 0.38 and 0.68C if
the linear trends are removed. Thus, the long-term trends
may account for about one-third of the warming in the
FIG. 10. (left) Monthly mean NAO (bars) and Nino-3.4 (line) indices during (a) March 1957–August 1958, (d) March 1997–August 1998,
and (g) March 2004–August 2005. (center) SSTA in JJA of (b) 1958, (e) 1998, and (h) 2005. (right) Geopotential height anomaly at 1000
(shading) and 500 hPa (contour) in DJF of (c) 1957/58, (f) 1997/98, and (i) 2004/05. Contour interval is 3 m, and the zero line is suppressed.
15 NOVEMBER 2011 H U E T A L . 5825
tropical Atlantic and weakened cooling in midlatitudes
of the North Atlantic by about one-third. Nevertheless,
we recognize that the nonlinear trend, for which the CO2
time series may serve as a good proxy, may be a better
choice to estimate the trend in the North Atlantic
(Polyakov et al. 2010), and may modify the quantitative
estimates from the linear trend analysis reported here.
To summarize, it is interesting to see that the overall
pattern of SSTA in the North Atlantic Ocean averaged
over June 2009–August 2010 can be reproduced using
the Nino-3.4 index with a 5-month lead (Fig. 11d) and/or
using NAO index with a 1-month lead (Fig. 11e). Con-
sistent with the seasonal mean results, shown in Fig. 9,
the warm event of ENSO had a greater contribution in
low latitudes and the negative phase of the NAO had
a greater contribution in high latitudes. However, the
amplitudes of the hindcast for both negative and positive
SSTAs from the individual factors (Figs. 11d,e) are much
smaller than that of the observed SSTAs (Figs. 11a,c).
The amplitudes of the hindcast SSTAs from the combi-
nation of both factors (Fig. 11f) are about one-third to
one-half of the observed detrended SSTA, further
suggesting the importance of the long trend and the
amplification of the dynamical and thermodynamical
processes to the persistent anomalies during June 2009–
August 2010.
5. Discussion and conclusions
In this work, we analyze the air–sea interaction
processes associated with the persistent atmospheric
and oceanic anomalies in the North Atlantic and the
record-breaking positive SSTA in MDR during summer
2009–summer 2010. In this analysis, we identify the con-
tributions of the ENSO, NAO, as well as long-term trend
to the anomalies from a historical perspective by using
a variety of observational and analyzed or reanalyzed data
and model sensitivity simulations. It is suggested that the
FIG. 11. SST (shading) and surface wind stress (vector): (a) anomalies averaged during June 2009–August 2010, (b) linear trend during
January 1979–December 2009, and (c) anomalies averaged during June 2009–August 2010 with the linear trend removed. Hindcasts of
mean SSTA averaged in June 2009–August 2010 (d) using the Nino-3.4 index with a 5-month lead and (e) using the NAO index with
a 1-month lead; (f) the sum of (d) 1 (e). The units of the shading are degrees Celsius in (a) and (c) and degrees Celsius per 31 years in (b).
5826 J O U R N A L O F C L I M A T E VOLUME 24
record-breaking warming in the tropical North Atlantic
during summer 2009–summer 2010 included a typical
response to ENSO, which was amplified by the influence
due to the negative phase of the NAO and long-term
trend.
The persistent negative phase of the NAO was associ-
ated with active thermodynamic air–sea interaction. The
surface wind stress anomaly associated with the NAO
altered the ocean surface heat flux and changed the SSTA
by a wind speed–evaporation–SST mechanism. The total
heat flux was dominated by latent and sensible heat flux,
while the shortwave radiation enhanced the SSTA to
a certain degree. The thermodynamical processes played
an important role in the SSTA in the tropical and sub-
tropical North Atlantic Ocean. Actually, the long per-
sistence of the atmospheric and oceanic anomalies in
the North Atlantic may have been due to coupling of the
ocean and atmosphere. Through conducting some
AGCM sensitivity experiments forced by the observed
SST in the Atlantic Ocean alone, it is demonstrated that
the feedback of Atlantic SSTA on the NAO enhanced
persistence of the negative phase of the NAO to some
extent. Moreover, as compared with the observed long-
term trends in the last 31 years, it is suggested that the
anomalies during summer 2009–summer 2010 were
mainly short-term fluctuations, particularly for the cool-
ing in the midlatitudes of the North Atlantic. However,
overall warming trends enhanced the warming in high and
low latitudes and weakened the cooling in midlatitudes.
Combination of the impact from the El Nino event in
2009–10 and the negative phase of the NAO as well as
the long-term trend resulted in the record-breaking
positive SSTA in the MDR. By using the statistical re-
lationship, the SSTA pattern in the North Atlantic can
be reasonably well predicted by using the preceding
ENSO and NAO as predictors. That may imply some
additional predictability of Atlantic hurricane activity
using these predictors.
It is clear that in order to predict the North Atlantic
SST, we have to successfully predict ENSO and NAO. It
has been well known that ENSO can be predicted rea-
sonably well a few seasons in advance (Chen and Cane
2008; references therein). However, the assessment of
predictability of the NAO is controversial. It has been
documented that the low-frequency part of the NAO
can be forced by SSTA (Rodwell et al. 1999; Latif et al.
2000). Later, Czaja and Frankignoul (2002) also found
that SSTA in the North Atlantic in spring and summer
may itself be a predictor for the following winter NAO.
The anomalous evolution of air–sea interaction in the
North Atlantic during summer 2009–summer 2010 was
indeed consistent with the so-called NAO interseasonal
prediction signals documented in previous investigations,
such as Czaja and Frankignoul (2002), Cassou et al.
(2004), and Saunders and Qian (2002). Czaja and
Frankignoul suggested that 15% of the NAO monthly
anomaly variance in winter may be predictable by using
the preceding spring and summer SSTA in the North
Atlantic. However, the 15% predictability might be the
average predictability with a larger contribution from
a few anomalous NAO years (Hu and Huang 2006c).
By using two NAO indices in winter, Hu and Huang
(2006c) compared their connection with the preceding
SSTA in the North Atlantic. They found that, although
the two indices are highly correlated, one index is sig-
nificantly correlated with a tripole pattern of SSTA in the
North Atlantic up to the preceding spring, and may have
some predictability up to 7–9 months in advance, and the
other one has little predictability beyond the SSTA two
months prior to early winter. To gain further insights
into the seasonal–interannual predictability over the
North Atlantic, continued examination of the air–sea
interaction effects presents an interesting challenge.
Moreover, the NAO/AO is also associated with strato-
spheric processes, particularly in the NH winter, and the
variability in the lower-stratospheric polar vortex may
provide some prediction potential for the NAO/AO
(Thompson et al. 2003; Cohen et al. 2010; references
therein). Furthermore, the NAO displayed a long-term
change, which may be associated with the meridional
heat transport of the fluctuating overturning circulation
and sea ice extension (Hilmer and Jung 2000), as well as
increasing greenhouse gas concentrations (Ulbrich and
Christoph 1999; Gillett et al. 2003; Hu and Wu 2004).
In the North Atlantic, besides surface fluxes, a slowly
evolving subsurface oceanic temperature anomaly (OTA)
might also play a role in affecting the SSTA, especially in
midlatitudes. An analysis of OTA also indicates the extent
of penetration of the influence of surface variability, which
may govern the time scale and memory associated with
the extreme atmospheric circulation anomalies that
occurred during summer 2009–summer 2010. In fact,
the distribution pattern of the SSTA (Fig. 2) is quite
consistent with OTA at both 50 and 300 m north of 308N
(not shown), although the similarity is confined well above
300 m in low latitudes. This shallower (deeper) penetra-
tion of OTA in the low (high) latitudes may partially re-
flect the latitude dependence of the ocean mixed layer
depth. The relatively shallow OTA in low latitudes im-
plies the dominance of air–sea interaction through heat
flux in generating the OTA within a shallow ocean layer.
Vertical coherence of the OTA in the mid- and high lat-
itudes may suggest a connection with the anomalous
upper-ocean heat content probably associated with
perturbation of the Gulf Stream extension and deep-
water convection, which deserves further investigation.
15 NOVEMBER 2011 H U E T A L . 5827
The results of OTA are consistent with that of the
tendency due to dynamical processes, for example, ad-
vection, Ekman transport, and heat flux (not shown)
inferred based on an analysis of the mixed layer heat
budget diagnosed using outputs from GODAS (Huang
et al. 2010). Both dynamical processes and heat flux have
a large contribution to the SST tendency in mid- to high
latitudes. In comparison with the heat flux, the dynam-
ical processes have a relatively smaller contribution in
the tropical and subtropical North Atlantic and act to
damp the total tendency during DJF 2009/10–JJA 2010.
This is generally consistent with Seager et al. (2000). In
addition, the reemergence and spread of cold ocean
temperature anomalies in the subsurface ocean in late
fall and winter might also have helped to enhance the
tripole SSTA pattern (Timlin et al. 2002).
Acknowledgments. We appreciate the comments of
Michelle L’Heureux and Hui Wang, M. Alexander, and the
anonymous reviewers, which significantly improved the
manuscript. Thanks also are given to Boyin Huang, Mingyue
Chen, and Scott Weaver for their help. Huang is sup-
ported by the NOAA CVP Program (NA07OAR4310310)
as well as the COLA omnibus program from NSF (ATM-
0830068), NOAA (NA09OAR4310058), and NASA
(NNX09AN50G).
REFERENCES
Barsugli, J. J., and D. S. Battisti, 1998: The basic effects of
atmosphere–ocean thermal coupling on midlatitude vari-
ability. J. Atmos. Sci., 55, 477–493.
Behringer, D. W., and Y. Xue, 2004: Evaluation of the global ocean
data assimilation system at NCEP: The Pacific Ocean. Pre-
prints, Eighth Symp. on Integrated Observing and Assimilation
Systems for Atmosphere, Oceans, and Land Surface, Seattle,
WA, Amer. Meteor. Soc., 11–15.
——, M. Ji, and A. Leetmaa, 1998: An improved coupled model for
ENSO prediction and implications for ocean initialization.
Part I: The ocean data assimilation system. Mon. Wea. Rev.,
126, 1013–1021.
Cassou, C., and L. Terray, 2001: Oceanic forcing of the wintertime
low-frequency atmospheric variability in the North Atlantic
European sector: A study with the ARPEGE model. J. Cli-
mate, 14, 4266–4291.
——, C. Deser, L. Terray, J. W. Hurrell, and M. Drevillon, 2004:
Summer sea surface temperature conditions in the North
Atlantic and their impact upon the atmospheric circulation in
early winter. J. Climate, 17, 3349–3363.
Chang, P., L. Ji, and H. Li, 1997: A decadal climate variation in the
tropical Atlantic Ocean from thermodynamic air-sea inter-
actions. Nature, 385, 516–518.
——, R. Saravanan, and L. Ji, 2003: Tropical Atlantic seasonal
predictability: The roles of El Nino remote influence and
thermodynamic air-sea feedback. Geophys. Res. Lett., 30,
1501, doi:10.1029/2002GL016119.
——, Y. Fang, R. Saravanan, L. Ji, and H. Seidel, 2006: The cause
of the fragile relationship between the Pacific El Nino and the
Atlantic Nino. Nature, 443, 324–328.
Chen, D., and M. A. Cane, 2008: El Nino prediction and pre-
dictability. J. Comput. Phys., 227, 3625–3640, doi:10.1016/
j.jcp.2007.05.014.
Chiang, J. C. H., Y. Kushnir, and A. Giannini, 2002: Decon-
structing Atlantic Intertropical Convergence Zone variability:
Influence of the local cross-equatorial sea surface temperature
gradient and remote forcing from the eastern equatorial Pa-
cific. J. Geophys. Res., 107, 4004, doi:10.1029/2000JD000307.
Ciasto, L. M., M. A. Alexander, C. Deser, and M. H. England, 2011:
On the persistence of cold-season SST anomalies associated
with the annular modes. J. Climate, 24, 2500–2515.
Cohen, J., J. Foster, M. Barlow, K. Saito, and J. Jones, 2010: Winter
2009–2010: A case study of an extreme Arctic Oscillation
event. Geophys. Res. Lett., 37, L17707, doi:10.1029/2010GL044256.
Curtis, S., and S. Hastenrath, 1995: Forcing of anomalous sea sur-
face temperature evolution in the tropical Atlantic during
Pacific warm events. J. Geophys. Res., 100, 15 835–15 847.
Czaja, A., and C. Frankignoul, 1999: Influence of the North At-
lantic SST anomalies on the atmospheric circulation. Geophys.
Res. Lett., 26, 2969–2972.
——, and ——, 2002: Observed impact of Atlantic SST anomalies
on the North Atlantic Oscillation. J. Climate, 15, 606–623.
——, P. van der Vaart, and J. Marshall, 2002: A diagnostic study of
the role of remote forcing in tropical Atlantic variability.
J. Climate, 15, 3280–3290.
——, A. W. Robertson, and T. Huck, 2003: The role of Atlantic
ocean–atmosphere coupling in affecting North Atlantic Os-
cillation variability. The North Atlantic Oscillation: Climate
Significance and Environmental Impact, Geophys. Monogr.,
Vol. 134, Amer. Geophys. Union, 147–172.
Diaz, H. F., M. P. Hoerling, and J. K. Eischeid, 2001: ENSO vari-
ability, teleconnections and climate change. Int. J. Climatol.,
21, 1845–1862, doi:10.1002/joc.631.
Enfield, D. B., and D. A. Mayer, 1997: Tropical Atlantic sea surface
temperature variability and its relation to El Nino-Southern
Oscillation. J. Geophys. Res., 102, 929–945.
Giannini, A., J. C. H. Chiang, M. A. Cane, Y. Kushnir, and
R. Seager, 2001: The ENSO teleconnection to the tropical
Atlantic Ocean: Contributions of the remote and local SSTs
to rainfall variability in the tropical Americas. J. Climate, 14,
4530–4544.
Gillett, N., H. F. Graf, and T. J. Osborn, 2003: Climate change and
the North Atlantic Oscillation. The North Atlantic Oscillation:
Climate Significance and Environmental Impact, Geophys.
Monogr., Vol. 134, Amer. Geophys. Union, 193–209.
Hilmer, M., and T. Jung, 2000: Evidence for a recent change in the
link between the North Atlantic Oscillation and Arctic sea ice
export. Geophys. Res. Lett., 27, 989–992.
Hoerling, M. P., and A. Kumar, 2002: Atmospheric response pat-
terns associated with tropical forcing. J. Climate, 15, 2184–2203.
——, ——, and M. Zhong, 1997: El Nino, La Nina, and the non-
linearity of their teleconnections. J. Climate, 10, 1769–1786.
Hu, Z.-Z., and Z. Wu, 2004: The intensification and shift of the
annual North Atlantic Oscillation in a global warming sce-
nario simulation. Tellus, 56A, 112–124.
——, and B. Huang, 2006a: Physical processes associated with
tropical Atlantic SST meridional gradient. J. Climate, 19, 5500–
5518.
——, and ——, 2006b: Air-sea coupling in the North Atlantic
during summer. Climate Dyn., 26, 441–457, doi:10.1007/s00382-
005-0094-4.
——, and ——, 2006c: On the significance of the relationship
between the North Atlantic Oscillation in early winter and
5828 J O U R N A L O F C L I M A T E VOLUME 24
Atlantic sea surface temperature anomalies. J. Geophys. Res.,
111, D12103, doi:10.1029/2005JD006339.
——, and ——, 2007a: Physical processes associated with tropical
Atlantic SST gradient during the anomalous evolution in the
southeastern ocean. J. Climate, 20, 3366–3378.
——, and ——, 2007b: The predictive skill and the most predictable
pattern in the tropical Atlantic: The effect of ENSO. Mon.
Wea. Rev., 135, 1786–1806.
Huang, B., 2004: Remotely forced variability in the tropical At-
lantic Ocean. Climate Dyn., 23, 133–152, doi:10.1007/s00382-
004-0443-8.
——, and J. Shukla, 2005: The ocean–atmosphere interactions in
the tropical and subtropical Atlantic Ocean. J. Climate, 18,
1652–1672.
——, and Z.-Z. Hu, 2007: Cloud-SST feedback in southeastern
tropical Atlantic anomalous events. J. Geophys. Res., 112,
C03015, doi:10.1029/2006JC003626.
——, P. S. Schopf, and Z. Pan, 2002: The ENSO effect on the
tropical Atlantic variability: A regionally coupled model study.
Geophys. Res. Lett., 29, 2039, doi:10.1029/2002GL014872.
——, Y. Xue, D. Zhang, A. Kumar, and M. J. McPhaden, 2010: The
NCEP GODAS ocean analysis of the tropical Pacific mixed
layer heat budget on seasonal to interannual time scales.
J. Climate, 23, 4901–4925.
Hurrell, J. W., 1995: Decadal trends in the North Atlantic Oscil-
lation: Regional temperatures and precipitation. Science, 269,
676–679.
——, 1996: Influence of variations in extratropical wintertime
teleconnections on Northern Hemisphere temperatures. Geo-
phys. Res. Lett., 23, 665–668.
——, and C. Deser, 2009: North Atlantic climate variability: The
role of the North Atlantic Oscillation. J. Mar. Syst., 78, 28–41.
——, Y. Kushnir, G. Ottersen, and M. Visbeck, 2003: An overview
of the North Atlantic Oscillation. The North Atlantic Oscil-
lation: Climate Significance and Environmental Impact, Geo-
phys. Monogr., Vol. 134, Amer. Geophys. Union, 1–36.
Kalnay, E., and Coauthors, 1996: The NCEP/NCAR 40-Year
Reanalysis Project. Bull. Amer. Meteor. Soc., 77, 437–471.
Kanamitsu, M., W. Ebisuzaki, J. Woollen, S.-K. Yang, J. J. Hnilo,
M. Fiorino, and G. L. Potter, 2002a: NCEP-DOE AMIP-II
Reanalysis (R-2). Bull. Amer. Meteor. Soc., 83, 1631–1643.
——, and Coauthors, 2002b: NCEP dynamical seasonal forecast
system 2000. Bull. Amer. Meteor. Soc., 83, 1019–1037.
Kumar, A., Q. Zhang, P. Peng, and B. Jha, 2005: SST-forced at-
mospheric variability in an atmospheric general circulation
model. J. Climate, 18, 3953–3967.
Kushnir, Y., W. A. Robinson, I. Blade, N. M. J. Hall, S. Peng, and
R. Sutton, 2002: Atmospheric GCM response to extratropical
SST anomalies: Synthesis and evaluation. J. Climate, 15, 2233–
2256.
——, ——, P. Chang, and A. W. Robertson, 2006: The physical
basis for predicting Atlantic sector seasonal-to-interannual
climate variability. J. Climate, 19, 5949–5970.
L’Heureux, M., A. Butler, B. Jha, A. Kumar, and W. Wang, 2010:
Unusual extremes in the negative phase of the Arctic Oscilla-
tion during 2009. Geophys. Res. Lett., 37, L10704, doi:10.1029/
2010GL043338.
Latif, M., K. Arpe, and E. Roeckner, 2000: Oceanic control of
decadal North Atlantic sea level pressure variability in winter.
Geophys. Res. Lett., 27, 727–730.
Lee, S.-K., D. B. Enfield, and C. Wang, 2008: Why do some
El Ninos have no impact on tropical North Atlanti SST? Geo-
phys. Res. Lett., 35, L16705, doi:10.1029/2008GL034734.
Liu, Z., and L. Wu, 2004: Atmospheric response to North Pacific
SST: The role of ocean atmosphere coupling. J. Climate, 17,
1859–1882.
——, Q. Zhang, and L. Wu, 2004: Remote impact on tropical At-
lantic climate variability: Statistical assessment and dynamic
assessment. J. Climate, 17, 1529–1549.
Mahajan, S., R. Saravanan, and P. Chang, 2010: Free and forced
variability of the tropical Atlantic Ocean: Role of the wind–
evaporation–sea surface temperature feedback. J. Climate, 23,
5958–5977.
Marshall, J., and Coauthors, 2001: North Atlantic climate vari-
ability: Phenomena, impacts and mechanisms. Int. J. Climatol.,
21, 1863–1898.
Mehta, V. M., 1998: Variability of the tropical ocean surface tem-
peratures at decadal–multidecadal timescales. Part I: The
Atlantic Ocean. J. Climate, 11, 2351–2375.
Munoz, E., C. Wang, and D. Enfield, 2010: The Intra-Americas Sea
springtime surface temperature anomaly dipole as fingerprint
of remote influences. J. Climate, 23, 43–56.
Okumura, Y., S.-P. Xie, A. Numaguti, and Y. Tanimoto, 2001:
Tropical Atlantic air-sea interaction and its influence on the
NAO. Geophys. Res. Lett., 28, 1507–1510.
Peng, S., W. A. Robinson, and S. Li, 2003: Mechanisms for the
NAO responses to the North Atlantic SST tripole. J. Climate,
16, 1987–2004.
——, ——, ——, and M. P. Hoerling, 2005: Tropical Atlantic SST
forcing of coupled North Atlantic seasonal responses. J. Cli-
mate, 18, 480–496.
Polyakov, I. V., V. A. Alexeev, U. A. Bhatt, E. I. Polyakova, and
X. Zhang, 2010: North Atlantic warming: Patterns of long-
term trend and multidecadal variability. Climate Dyn., 34,
439–457, doi:10.1007/s00382-008-0522-3.
Portis, D. H., J. E. Walsh, M. E. Hamly, and P. J. Lamb, 2001:
Seasonality of the North Atlantic Oscillation. J. Climate, 14,
2069–2078.
Robertson, A. W., C. R. Mechoso, and Y.-J. Kim, 2000: The in-
fluence of Atlantic sea surface temperature anomalies on the
North Atlantic Oscillation. J. Climate, 13, 122–138.
Rodwell, M. J., D. P. Rowell, and C. K. Folland, 1999: Oceanic
forcing of the winter North Atlantic Oscillation and European
climate. Nature, 398, 320–323.
Rodwell, M. K., 2003: On the predictability of North Atlantic cli-
mate. The North Atlantic Oscillation: Climate Significance and
Environmental Impact, Geophys. Monogr., Vol. 134, Amer.
Geophys. Union, 173–192.
Saha, S., and Coauthors 2006: The NCEP climate forecast system.
J. Climate, 19, 3483–3517.
Saravanan, R., and P. Chang, 2004: Thermodynamic coupling and
predictability of tropical sea surface temperature. Earth’s Cli-
mate: The Ocean–Atmosphere Interaction, Geophys. Monogr.,
Vol. 147, Amer. Geophys. Union, 171–180.
Saunders, M. A., and B. Qian, 2002: Seasonal predictability of the
winter NAO from North Atlantic sea surface temperatures.
Geophys. Res. Lett., 29, 2049, doi:10.1029/2002GL014952.
Seager, R., Y. Kushnir, M. Visbeck, N. Naik, J. Miller, G. Krahmann,
and H. Cullen, 2000: Causes of Atlantic Ocean climate vari-
ability between 1958 and 1998. J. Climate, 13, 2845–2862.
——, ——, J. Nakamura, M. Ting, and N. Naik, 2010: Northern
Hemisphere winter snow anomalies: ENSO, NAO and the
winter of 2009/10. Geophys. Res. Lett., 37, L14703, doi:10.1029/
2010GL043830.
Smith, T. M., R. W. Reynolds, T. C. Peterson, and J. Lawrimore,
2008: Improvements to NOAA’s historical merged land–ocean
15 NOVEMBER 2011 H U E T A L . 5829
surface temperature analysis (1880–2006). J. Climate, 21, 2283–
2296.
Tanimoto, Y., and S.-P. Xie, 2002: Inter-hemispheric decadal var-
iations in SST, surface wind, heat flux and cloud cover over the
Atlantic Ocean. J. Meteor. Soc. Japan, 80, 1199–1219.
Thompson, D. W. J., and J. M. Wallace, 2001: Regional climate
impacts of the Northern Hemisphere Annular Mode. Science,
293, 85–89.
——, S. Lee, and M. P. Baldwin, 2003: Atmospheric processes
governing the Northern Hemisphere Annular Mode/North
Atlantic Oscillation. The North Atlantic Oscillation: Climate
Significance and Environmental Impact, Geophys. Monogr.,
Vol. 134, Amer. Geophys. Union, 81–112.
Timlin, M. S., M. A. Alexander, and C. Deser, 2002: On the re-
emergence of North Atlantic SST anomalies. J. Climate, 15,2707–2712.
Ulbrich, U., and M. Christoph, 1999: A shift of the NAO and in-
creasing storm track activity over Europe due to anthropo-
genic greenhouse gas forcing. Climate Dyn., 15, 551–559.
Visbeck, M., E. P. Chassignet, R. G. Curry, T. L. Delworth, R. R.
Dickson, and G. Krahmann, 2003: The ocean’s response to
North Atlantic Oscillation variability. The North Atlantic
Oscillation: Climate Significance and Environmental Impact,
Geophys. Monogr., Vol. 134, Amer. Geophys. Union, 113–146.
Wallace, J. M., 2000: North Atlantic Oscillation/Annular Mode:
Two paradigms—One phenomenon. Quart. J. Roy. Meteor.
Soc., 126, 791–806.
Wang, C., 2002: Atlantic climate variability and its associated at-
mospheric circulation cells. J. Climate, 15, 1516–1536.
——, H. Liu, and S.-K. Lee, 2010: The record-breaking cold tem-
perature during the winter of 2009/10 in the North Hemi-
sphere. Atmos. Sci. Lett., 11, 161–168, doi:10.1002/asl.278.
Watanabe, M., and M. Kimoto, 1999: Tropical-extratropical con-
nection in the Atlantic atmosphere-ocean variability. Geo-
phys. Res. Lett., 26, 2247–2250.
Wu, L., Q. Zhang, and Z. Liu, 2004: Toward understanding tropical
Atlantic variability using coupled modeling surgery. Earth’s
Climate: The Ocean–Atmosphere Interaction, Geophys. Mon-
ogr., Vol. 147, Amer. Geophys. Union, 157–170.
Xie, S.-P., 1999: A dynamic ocean–atmosphere model of the
tropical Atlantic decadal variability. J. Climate, 12, 64–70.
——, and J. A. Carton, 2004: Tropical Atlantic variability: Pat-
terns, mechanisms, and impacts. Earth’s Climate: The Ocean–
Atmosphere Interaction, Geophys. Monogr., Vol. 147, Amer.
Geophys. Union, 121–142.
——, and S. G. H. Philander, 1994: A coupled ocean–atmosphere
model of relevance to the ITCZ in the eastern Pacific. Tellus,
46A, 340–350.
Xue, Y., R. W. Reynolds, and V. Banzon, 2010: Sea surface tem-
peratures. Bull. Amer. Meteor. Soc., 91, S53–S56.
Zhang, S., A. Rosati, and T. Delworth, 2010: The adequacy of
observing systems in monitoring the Atlantic meridional
overturning circulation and North Atlantic climate. J. Climate,
23, 5311–5323.
5830 J O U R N A L O F C L I M A T E VOLUME 24
Copyright © 2022 FDOKUMEN