Peroxidase-mediated oxidation of l-dopa: A kinetic approach
7
Biochemical Engineering Journal 52 (2010) 248–254 Contents lists available at ScienceDirect Biochemical Engineering Journal journal homepage: www.elsevier.com/locate/bej Peroxidase-mediated oxidation of l-dopa: A kinetic approach Mihaela Puiu ∗ , Irina Babaligea, C˘ atalina Olmazu, Adina R˘ aducan, Dumitru Oancea Department of Physical Chemistry, Faculty of Chemistry, University of Bucharest, 4-12 Elisabeta Blvd., 030018 Bucharest, Romania article info Article history: Received 28 June 2010 Received in revised form 23 August 2010 Accepted 24 August 2010 Keywords: Horseradish peroxidase Auto-oxidation l-Dopa Dopachrome abstract A kinetic model able to adequately describe the accumulation of p-topaquinone in peroxidase-mediated oxidation of l-dopa was developed, and the rate constants for both enzymatic and non-enzymatic branch were estimated either experimentally or using a computing program for detailed kinetic simulation. It is demonstrated that the accumulation of p-topaquinone in significant amounts occurred in excess of hydrogen peroxide or during auto-oxidation of l-dopa, but changes in the ratio of initial concentrations of the reactants can reduce considerably the production of this intermediate. © 2010 Elsevier B.V. All rights reserved. 1. Introduction Tyrosinase-catalyzed oxidation of l-dopa to dopachrome is one of the most important stages of eumelanin biosynthesis [1,2]. How- ever, the formation of hydrogen peroxide or other reactive oxygen species (ROS) through the non-enzymatic steps of this reaction might be responsible for the observed cytotoxic effects partly by increasing the oxidative stress and also by generating the excito- toxin p-topaquinone (PTQ) [3,4]. It was recently reported that the presence of PTQ is associated to the demise of neurons in several neurodegenerative disorders, such as Parkinson’s and Huntington’s diseases (PD, HD) [5,6]. Moreover, it was also suggested that the chronic oxidative stress induces progressive, irreversible damage affecting the normal physiological functions of the central nervous system (CNS) [7,8]. Several mechanisms were proposed in order to identify the pathways of hydrogen peroxide generation during the proximal and distal phase of melanogenesis [9–11]. Proxi- mal phase includes the tyrosinase-catalyzed oxidation of tyrosine to l-dopa, and the oxidation of l-dopa to the highly reactive o- dopa-quinone (Q) followed by a non-enzymatic branch that finally yields dopachrome (DC) [12]. The distal phase starts with the slow decarboxylation of DC to 5,6-dihydroxyindol succeeded by several oxidations and polymerizations and formally stops with Abbreviations: HRP, horseradish peroxidase; SOD, superoxide dismutase; dl- dopa, (3,4-dihydroxyphenyl alanine); DC, dopachrome; Q, o-dopaquinone-H + ; PTQ, p-topaquinone-H + ; ROS, reactive oxygen species. ∗ Corresponding author. Tel.: +40 213143508x2205; fax: +40 213159249. E-mail addresses: [email protected], [email protected] (M. Puiu). formation of melanins [13]. Literature data had previously demon- strated the existence of peroxidase/hydrogen peroxide system in the melanosomas of skin melanocites [2,9], so it is of interest to study in “vitro” conditions the role of hydrogen peroxide on l-dopa oxidation in the initial stages of melanogenesis. Horseradish per- oxidase (HRP) catalyzes the oxidation of reducing substrates (SH 2 ) to the corresponding free radical products (SH·) according to the following mechanism in Scheme 1 [14,15]: where E–Fe III is the native enzyme, · + E–Fe IV O and + EH–Fe IV O are two enzymatic active intermediates often referred as Cpd I and Cpd II. Earlier studies on peroxidase inactivation in excess of H 2 O 2 pointed out the release of low-reactive intermediate, designated as Cpd III, this step being responsible for the operational inactivation of peroxidase [16]. Recent literature data reported the formation of the corresponding phenoxy radicals (QH·) during the oxidation of l- dopa in the presence of HRP followed by radical dismutation [17], as shown in Scheme 2. Once Q emerged, the other steps leading to DC are the same occurring in the non-enzymatic branch of the proximal phase of melanogenesis. Taking into account the moderate stability of DC [17], a kinetic model containing the single significant steps can be developed for describing the non-catalytic reactions of the proximal stage. Most kinetic studies of tyrosinase-l-dopa were undertaken using spectrophotometric and oxymetric methods [18] either monitor- ing the formation of the colored product DC, or the consumption of dioxygen, while the intermediates were isolated and identified by HPLC and cyclic voltammetry [1]. According to Napolitano et al. [8] in the presence of exceeding hydrogen peroxide, Q is oxi- dized to PTQ which further undergoes a slow cyclization to DC. If in the tyrosinase-catalyzed oxidation of l-dopa, p-topaquinone can barely be detected, in the case of l-dopa auto-oxidation, hydro- 1369-703X/$ – see front matter © 2010 Elsevier B.V. All rights reserved. doi:10.1016/j.bej.2010.08.017
Transcript of Peroxidase-mediated oxidation of l-dopa: A kinetic approach
P
MD
a
ARRA
KHAlD
1
oesmitpndcasttmtdyss
dp
e
1d
Biochemical Engineering Journal 52 (2010) 248–254
Contents lists available at ScienceDirect
Biochemical Engineering Journal
journa l homepage: www.e lsev ier .com/ locate /be j
eroxidase-mediated oxidation of l-dopa: A kinetic approach
ihaela Puiu ∗, Irina Babaligea, Catalina Olmazu, Adina Raducan, Dumitru Oanceaepartment of Physical Chemistry, Faculty of Chemistry, University of Bucharest, 4-12 Elisabeta Blvd., 030018 Bucharest, Romania
r t i c l e i n f o
rticle history:eceived 28 June 2010eceived in revised form 23 August 2010
a b s t r a c t
A kinetic model able to adequately describe the accumulation of p-topaquinone in peroxidase-mediatedoxidation of l-dopa was developed, and the rate constants for both enzymatic and non-enzymatic branchwere estimated either experimentally or using a computing program for detailed kinetic simulation. It
ccepted 24 August 2010
eywords:orseradish peroxidaseuto-oxidation-Dopa
is demonstrated that the accumulation of p-topaquinone in significant amounts occurred in excess ofhydrogen peroxide or during auto-oxidation of l-dopa, but changes in the ratio of initial concentrationsof the reactants can reduce considerably the production of this intermediate.
© 2010 Elsevier B.V. All rights reserved.
opachrome
. Introduction
Tyrosinase-catalyzed oxidation of l-dopa to dopachrome is onef the most important stages of eumelanin biosynthesis [1,2]. How-ver, the formation of hydrogen peroxide or other reactive oxygenpecies (ROS) through the non-enzymatic steps of this reactionight be responsible for the observed cytotoxic effects partly by
ncreasing the oxidative stress and also by generating the excito-oxin p-topaquinone (PTQ) [3,4]. It was recently reported that theresence of PTQ is associated to the demise of neurons in severaleurodegenerative disorders, such as Parkinson’s and Huntington’siseases (PD, HD) [5,6]. Moreover, it was also suggested that thehronic oxidative stress induces progressive, irreversible damageffecting the normal physiological functions of the central nervousystem (CNS) [7,8]. Several mechanisms were proposed in ordero identify the pathways of hydrogen peroxide generation duringhe proximal and distal phase of melanogenesis [9–11]. Proxi-
al phase includes the tyrosinase-catalyzed oxidation of tyrosineo l-dopa, and the oxidation of l-dopa to the highly reactive o-
opa-quinone (Q) followed by a non-enzymatic branch that finallyields dopachrome (DC) [12]. The distal phase starts with thelow decarboxylation of DC to 5,6-dihydroxyindol succeeded byeveral oxidations and polymerizations and formally stops withAbbreviations: HRP, horseradish peroxidase; SOD, superoxide dismutase; dl-opa, (3,4-dihydroxyphenyl alanine); DC, dopachrome; Q, o-dopaquinone-H+; PTQ,-topaquinone-H+; ROS, reactive oxygen species.∗ Corresponding author. Tel.: +40 213143508x2205; fax: +40 213159249.
E-mail addresses: [email protected],[email protected] (M. Puiu).
369-703X/$ – see front matter © 2010 Elsevier B.V. All rights reserved.oi:10.1016/j.bej.2010.08.017
formation of melanins [13]. Literature data had previously demon-strated the existence of peroxidase/hydrogen peroxide system inthe melanosomas of skin melanocites [2,9], so it is of interest tostudy in “vitro” conditions the role of hydrogen peroxide on l-dopaoxidation in the initial stages of melanogenesis. Horseradish per-oxidase (HRP) catalyzes the oxidation of reducing substrates (SH2)to the corresponding free radical products (SH·) according to thefollowing mechanism in Scheme 1 [14,15]:
where E–FeIII is the native enzyme, ·+E–FeIV O and +EH–FeIV Oare two enzymatic active intermediates often referred as Cpd I andCpd II. Earlier studies on peroxidase inactivation in excess of H2O2pointed out the release of low-reactive intermediate, designated asCpd III, this step being responsible for the operational inactivationof peroxidase [16]. Recent literature data reported the formation ofthe corresponding phenoxy radicals (QH·) during the oxidation of l-dopa in the presence of HRP followed by radical dismutation [17],as shown in Scheme 2. Once Q emerged, the other steps leadingto DC are the same occurring in the non-enzymatic branch of theproximal phase of melanogenesis.
Taking into account the moderate stability of DC [17], a kineticmodel containing the single significant steps can be developedfor describing the non-catalytic reactions of the proximal stage.Most kinetic studies of tyrosinase-l-dopa were undertaken usingspectrophotometric and oxymetric methods [18] either monitor-ing the formation of the colored product DC, or the consumptionof dioxygen, while the intermediates were isolated and identified
by HPLC and cyclic voltammetry [1]. According to Napolitano etal. [8] in the presence of exceeding hydrogen peroxide, Q is oxi-dized to PTQ which further undergoes a slow cyclization to DC. If inthe tyrosinase-catalyzed oxidation of l-dopa, p-topaquinone canbarely be detected, in the case of l-dopa auto-oxidation, hydro-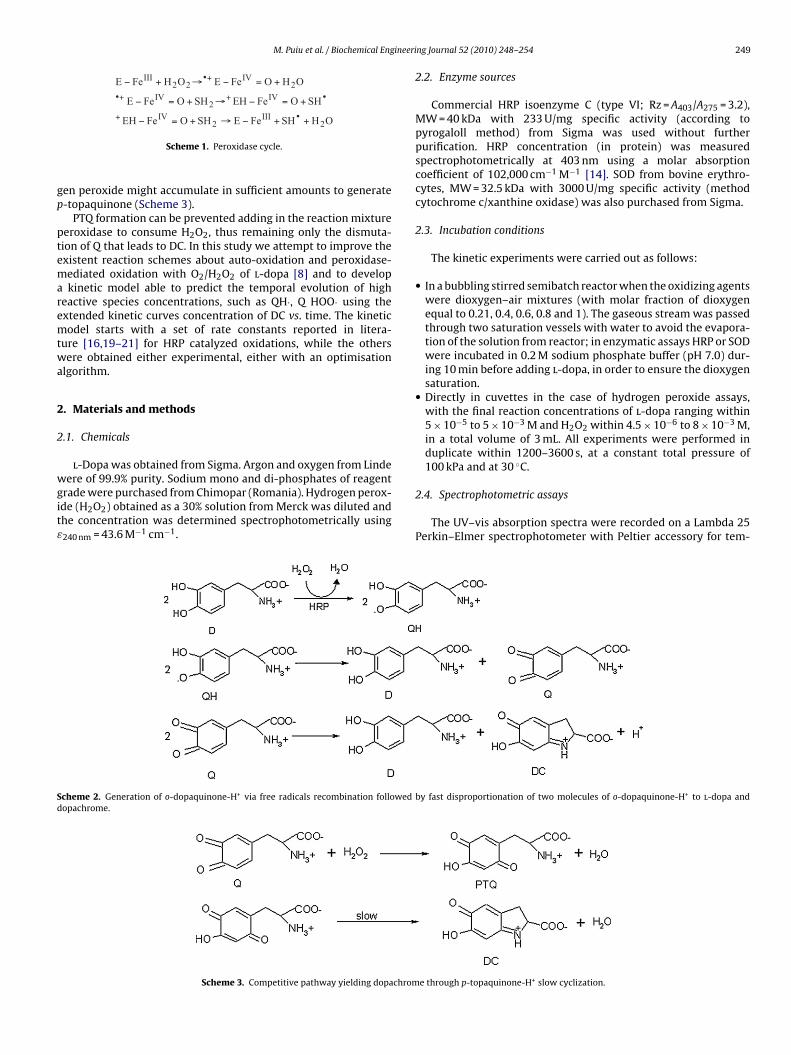
M. Puiu et al. / Biochemical Engineeri
SHOFeEHSHOFeE
OHOFeEOHFeE
IIIIV
IV2
IV2
IV22
III
+=−→+=−
+=−→+−
•+
•+•+
•+
gp
ptemaremtwa
2
2
wgitε
Sd
OHSHFeESHOFeEH 22 ++−→+=−
Scheme 1. Peroxidase cycle.
en peroxide might accumulate in sufficient amounts to generate-topaquinone (Scheme 3).
PTQ formation can be prevented adding in the reaction mixtureeroxidase to consume H2O2, thus remaining only the dismuta-ion of Q that leads to DC. In this study we attempt to improve thexistent reaction schemes about auto-oxidation and peroxidase-ediated oxidation with O2/H2O2 of l-dopa [8] and to developkinetic model able to predict the temporal evolution of high
eactive species concentrations, such as QH·, Q HOO· using thextended kinetic curves concentration of DC vs. time. The kineticodel starts with a set of rate constants reported in litera-
ure [16,19–21] for HRP catalyzed oxidations, while the othersere obtained either experimental, either with an optimisation
lgorithm.
. Materials and methods
.1. Chemicals
l-Dopa was obtained from Sigma. Argon and oxygen from Lindeere of 99.9% purity. Sodium mono and di-phosphates of reagent
rade were purchased from Chimopar (Romania). Hydrogen perox-de (H2O2) obtained as a 30% solution from Merck was diluted andhe concentration was determined spectrophotometrically using240 nm = 43.6 M−1 cm−1.
cheme 2. Generation of o-dopaquinone-H+ via free radicals recombination followedopachrome.
Scheme 3. Competitive pathway yielding dopachrom
ng Journal 52 (2010) 248–254 249
2.2. Enzyme sources
Commercial HRP isoenzyme C (type VI; Rz = A403/A275 = 3.2),MW = 40 kDa with 233 U/mg specific activity (according topyrogaloll method) from Sigma was used without furtherpurification. HRP concentration (in protein) was measuredspectrophotometrically at 403 nm using a molar absorptioncoefficient of 102,000 cm−1 M−1 [14]. SOD from bovine erythro-cytes, MW = 32.5 kDa with 3000 U/mg specific activity (methodcytochrome c/xanthine oxidase) was also purchased from Sigma.
2.3. Incubation conditions
The kinetic experiments were carried out as follows:
• In a bubbling stirred semibatch reactor when the oxidizing agentswere dioxygen–air mixtures (with molar fraction of dioxygenequal to 0.21, 0.4, 0.6, 0.8 and 1). The gaseous stream was passedthrough two saturation vessels with water to avoid the evapora-tion of the solution from reactor; in enzymatic assays HRP or SODwere incubated in 0.2 M sodium phosphate buffer (pH 7.0) dur-ing 10 min before adding l-dopa, in order to ensure the dioxygensaturation.
• Directly in cuvettes in the case of hydrogen peroxide assays,with the final reaction concentrations of l-dopa ranging within5 × 10−5 to 5 × 10⁻³ M and H2O2 within 4.5 × 10⁻⁶ to 8 × 10⁻³ M,in a total volume of 3 mL. All experiments were performed induplicate within 1200–3600 s, at a constant total pressure of100 kPa and at 30 ◦C.
2.4. Spectrophotometric assays
The UV–vis absorption spectra were recorded on a Lambda 25Perkin–Elmer spectrophotometer with Peltier accessory for tem-
by fast disproportionation of two molecules of o-dopaquinone-H+ to l-dopa and
e through p-topaquinone-H+ slow cyclization.

2 ineering Journal 52 (2010) 248–254
ptttu(
Hwtddswsrio
toAnip
3
3
[baoto
av
tiT
mc
araaio[i
TR
of the progress kinetic curve (Fig. 1). Since SOD increases the rateof step (4), the faster generation of H2O2 should have consequentlyincreased the overall rate of HRP-catalyzed reaction, if one of theseenzymatic steps would have been limiting.
50 M. Puiu et al. / Biochemical Eng
erature control and stirring of samples. The stability of l-dopa inhe absence of oxygen was verified by passing an argon streamhrough the reaction mixture, when no significant transforma-ion of l-dopa was observed. The kinetic assays were carried outsing the characteristic absorption wavelength of DC, � = 475 nmε = 3600 M−1 cm−1) [18].
Oxidations occurring with dioxygen in the presence/absence ofRP/SOD: samples were removed from reactor and DC formationas monitored at fixed wavelength. Chemical transformation of
he substrate was monitored by product (DC) analysis. In order toetect a possible reaction between HRP and D in the absence ofioxygen, an argon stream was passed trough a 2 × 10⁻⁷ M HRPolution in phosphate buffer for 10 min. A 5 mM bulk solution of Das prepared by dissolving solid D in an air-free solution. An aliquot
ample was injected in the reactor and the UV–vis spectrum wasecorded. No significant changes in the UV–vis region, which mightndicate a possible reduction of HRP by D to ferrous enzyme, werebserved.
Oxidations with H2O2 in presence/absence of HRP: the reac-ion mixtures were prepared directly in cuvettes and the increasef absorbance at 475 nm was followed until it remained constant.fter near 3600 s, no increase of absorbance at this wavelength wasoticed. It was observed that DC was obtained according to the sto-
chiometric ratio of D to DC 1:1. In these conditions, the overallrocess of DC formation can be treated as a single reaction.
. Results and discussion
.1. Kinetic modelling
According to recent reported data about oxidation of l-dopa13,17] and other o-diphenols [22], a suitable kinetic model cane proposed comprising the generation of ROS species during theuto-oxidation of l-dopa in aerated solutions as well as formationf free radical products via enzymatic steps, and other single reac-ions occurring in the non-enzymatic branch of the proximal stagef melanogenesis (Scheme 4).
In this scheme step (2) was considered by some authors [15]s being reversible, but in the present study it was treated as irre-ersible for simplification.
The simulation revealing the kinetic behaviour of the entire sys-em has to start from a particular set of values of rate constants andnitial concentrations of the chemical species involved in the model.he rate constants found in literature are summarized in Table 1.
In addition, several rate constants can be estimated experi-entally, carrying out the kinetic measurements in the following
onditions:Estimation of k1: the substrate was oxidized with dioxygen or
ir/oxygen mixtures in a semi-batch reactor in air/dioxygen satu-ated solution in the presence/absence of HRP in order to ensurepparent first-order conditions. HRP was added in the system for
voiding the formation of PTQ at higher concentration of l-dopa. Its generally assumed that the rate-determining step in the auto-xidation of phenols is the formation of the phenoxy radicals20,24–26] (Eq. (1)). Thus, with HRP incubated the only slow stepn the proposed model that might lead to dopachrome remains theable 1ate constants used in the optimisation procedure.
Rate constants at pH 7.0
Rate constant Value/M−1 s−1 Reference−→k 3 3.4 × 10⁵ [23]k4 1.6 × 10⁵ [19,20]k5 1.7 × 10⁷ [4,14]k7 1.12 × 10³ [17]
Scheme 4. Pathways for the oxidation of l-dopa catalyzed by peroxidase in aeratedsolution.
step given by Eq. (1). This hypothesis was checked by performinganother three experiments with 5 × 10⁻⁵ M initial concentrationof l-dopa and 1.17 × 10⁻³ M concentration of dioxygen kept con-stant through continuous bubbling of oxygen stream (calculatedfrom the molar fraction of dissolved oxygen [26]) at three differentconcentrations of HRP: 2 × 10⁻⁸, 5 × 10⁻⁸ and 2 × 10⁻⁷ M. Again,no noticeable differences were observed on the progress kineticcurves of DC (data not shown). At that, the presence of SOD at thesame concentration as HRP does not change significantly the shape
Fig. 1. Extended kinetic curves DC concentration vs. time. [l-dopa]0 = 5 × 10⁻⁴ M,[HRP]0 = 2 × 10⁻⁷ M, and [O2] = 1.17 × 10⁻³ M.

ineering Journal 52 (2010) 248–254 251
paiHtrqv
mltspa[vpeeeiE(
wt
[
E(
w
l
atkieF
0k
rrwtoifsstt
M. Puiu et al. / Biochemical Eng
Estimation of k8: oxidation of l-dopa in the excess of H2O2 in theresence of HRP can be pursued using an isoconversional methods described elsewhere [27]. As long as the concentration of HRPs much lower than the both substrates concentrations l-dopa and
2O2, a quasi-steady state is attained and the time evolution ofhe system can be described by a single reaction rate. The cor-esponding kinetic equation, based on the quasi-steady state oruasi-equilibrium assumptions, coupled with the enzyme conser-ation equation takes the general form:
d[DC]dt
= [HRP]0 × f ([DC]) (13)
In the isoconversional methods the kinetic runs are performedaintaining the same initial concentration of both substrates
-dopa (as a limiting substrate) and H2O2 and varying HRP concen-ration. Several time values (i.e. t1, t2, t3, etc.) corresponding to aettled conversion of substrate (a certain concentration of reactionroduct [DC]) can be estimated from the kinetic curves [DC] = f(t)t different enzyme initial concentrations [HRP]0. Let’s considerDC]isoconv the concentration of DC corresponding to a settled con-ersion of l-dopa. The first derivative with respect to time in eachoint of product concentration (d[DC]isoconv/dt)1, (d[DC]isoconv/dt)2,tc. can be estimated by numerical methods in the points t1, t2,tc., after fitting a proper function, selected for the best fit, on thextended kinetic curves. Since [DC]isoconv is constant due to thesoconversional conditions, results that f([DC]isoconv) = constant andq. (13) can be written as:
d[DC]dt
)i= f ([DC]isoconv) × [HRP]∗0,i (14)
here [HRP]∗0,i is the total enzyme concentration for run i, active atime ti. For a hypothetical first-order inactivation it is given by:
HRP]∗0,i = [HRP]0,i × e−kint (15)
Replacing the concentration of active enzyme from Eq. (15) inq. (13), one obtains:
d[DC]dt
)i= f ([DC]isoconv) × [HRP]0,i × e−kint (16)
The inactivation constant kin can be estimated from Eq. (16)ritten in the logarithmic form:
n
((d[DC]
dt
)i× 1
[HRP]0,i
)= ln(f ([DC]isoconv)) − kint (17)
Considering the reaction of Compound II with exceeding H2O2s the most probable inactivation pathway, it can be assumedhat the overall inactivation process follows apparent first-orderinetics. The inactivation kinetic constant can be calculated insoconversional conditions, using Eq. (17) as the slope of the lin-ar dependence ln((d[DC]/dt)i × 1/[HRP]0,i) vs. time as shown inig. 2.
The apparent first-order rate constant being kin = (2.033 ±.076) × 10−4 s−1 (with a level of significance, ˛ = 0.05) the value of8 can be estimated as the ratio kin/[H2O2] = 2.52 × 10⁻² M−1 s−1.
The stoichiometry of the overall reaction was checked withespect to l-dopa, H2O2 and DC. When l-dopa was the limitingeactant, at the end of the reaction, the final concentration of DCas found equal to initial concentration of D. When H2O2 was
he limiting reactant, at the end of the reaction the concentrationf DC was found half the initial concentration of H2O2. Accord-ng to these observations, the HRP-catalyzed oxidation of l-dopa
ollows the accepted mechanism for peroxidase reaction and con-equently the rising of DC can be described by two overall singleteps: the catalytic one – the generation of phenoxy radicals andhe non-catalytic one – via o-dopaquinone formation. According tohe present model, both pathways leading to DC formation, withFig. 2. Linear plot proving apparent first-order inactivation of HRP accordingto the isoconversional method. [l-dopa]0 = 5 × 10⁻⁵ M, [H2O2]0 = 8 × 10⁻³ M, and[DC]isoconv = 2 × 10⁻⁵ M.
or without accumulation of p-topaquinone, support the overall
stoichiometry D + 2H2O2HRP−→DC + 4H2O, agreeing with the experi-
mental data obtained at the end of the reaction.The quasi-steady state assumption can be successfully applied
for the peroxidase-catalyzed branch, in order to obtain an overallfirst-order rate constant kenz depending on the total concentrationof the enzyme, but the relative stability of p-topaquinone (if gen-erated) in excess of H2O2 raises the question if PTQ can be treatedas an active intermediate. According to Munoz-Munoz et al. [17]peroxidase prevents the accumulation p-topaquinone due to fastconsumption of H2O2 to generate Cpd I. Thereby, several exper-iments were made in the presence of peroxidase and exceedingH2O2 and others with H2O2 as limiting reactant. The overall sto-
ichiometry for the enzymatic branch being 2D + H2O2HRP−→2QH
• +2H2O and taking into account the enzymatic reaction sequence(5)–(7), the kinetic equation derived from the quasi-steady stateapproximation for Cpd I and Cpd II and the conservation equationfor HRP, can be written as:
d[DC]dt
= 2 · k5[HRP]0[H2O2](k5(k6 + k7)/k6k7) · ([H2O2]/[D]) + 1
(18)
Considering the large value of k5 reported in literature, the valueof k7 and the fact that k6 exceeds at least with one order of mag-nitude k7 [4,17], the fraction from the denominator of Eq. (18)becomes much greater than unity. Therefore the kinetic equationbecomes:
d[DC]dt
= kenz[D] (19)
where kenz = 2 · (k6k7/(k6 + k7)) · [HRP]0.In these conditions it is to expect that in 100-fold excess of
H2O2, the reaction will follow an apparent first-order kinetics withrespect to D and zero-order kinetics with respect to H2O2 in 100-fold excess of D. It was observed (and it was also demonstrated,as it will be shown further) that the auto-oxidation rate of L-dopais negligible comparing to the enzymatic oxidation. The shape ofthe progress kinetic curves was not as it might be expected, anexponential growth but rather a sequential growth, typical for two
consecutive first-order processes coupled by a normal intermediate(Fig. 3).The observations were confirmed with a non-linear regressionanalysis, when the best-fit parameters were obtained for a sequen-

252 M. Puiu et al. / Biochemical Engineering Journal 52 (2010) 248–254
Fca
t
y
mpacvmwHt5tak
awfk
F[
ig. 3. Sigmoid-shaped kinetic curves [DC] vs. time at various initial substrate con-entrations, typical for two sequential first-order reactions. [H2O2]0 = 8 × 10⁻³ Mnd [HRP]0 = 2 × 10⁻⁷ M.
ial (1, 1 order) function:
= a ·(
1 + b · exp(−cx) − c · exp(−bx)c − b
)(20)
Assuming that in the reaction sequence 1–12 the only inter-ediate which undergoes a slow cyclization to dopachrome is
-topaquinone and its formation, as well as its disappearance obeypparent first-order kinetics, the parameters in the function (20)an be assigned as it follows: a = [D]0, b = kenz and c = k12. Thealues of a for different data sets were identical to the experi-ental initial concentrations of l-dopa. The kinetic constant kenz
as estimated from several progress curves obtained in 8 mM2O2 and 0.05 mM l-dopa at the following HRP total concentra-
ions: 5 × 10⁻⁸, 6.46 × 10⁻⁸, 1.5 × 10⁻⁷, 1.8 × 10⁻⁷, 2 × 10−7 and× 10−7 M. The ratio k6k7/k6 + k7 was estimated as the slope of
he linear dependence of the pseudo-first order rate constant kenz
gainst 2·[HRP]0 (Fig. 4). The slope was used to calculate the value6 since k7 is known from literature data, k6 = 1.22 × 10⁵ M−1 s−1.
The same function was fitted on the experimental data obtained
t l-dopa concentration ranging from 5 × 10⁻⁵ to 5 × 10⁻³ M. Theeighted value of k12 for dopachrome formation via p-topaquinoneor all experiments occurring in excess of hydrogen peroxide is12 = (1.66 ± 0.03) × 10−2s−1.
ig. 4. Linear dependence of kenz on enzyme concentration. [H2O2]0 = 8 mM andD]0 = 0.05 mM.
Fig. 5. Progress kinetic curves [DC] vs. time at various [H2O2]0. [D]0 = 1 × 10⁻³ M and[HRP]0 = 2 × 10⁻⁷.
The experiments performed with H2O2 as limiting reactant and100-fold excess l-dopa (Fig. 5) gave similar results, but the best-fitparameters were obtained for a sequential (0, 1 order) function:
y = a · x − a
b· (1 − exp(−b · x)) (21)
where the parameters have the following significance: a is thezero-order rate constant of the enzymatic branch in the specificwork conditions and b represents the first-order rate constant k12.According to Eq. (19):
a = kenz[D]0 = 2 · k6k7[HRP]0
k6 + k7· [D]0 (22)
It was observed that in 250 s the concentration of DC reachesa maximum, thereafter remaining constant. For the entire rangeof initial concentrations of H2O2, the concentrations of DC corre-sponding to the end of the reaction were found equal to half initialconcentration of H2O2, indicating a stoichiometry H2O2:DC = 2:1.The fact that the fitting function properly describing the exper-imental behavior is Eq. (21) for the experiments performed atinitial concentrations of H2O2 larger than 1 × 10⁻⁵ M, supports theassumption that PTQ is formed during the reaction. At initial con-centrations of H2O2 below 1 × 10⁻⁵ M, the best fit parameters wereobtained for the zero-order kinetic equation:
y = a (23)
where a has the significance from Eq. (22). This result upholds thefact that DC formation occurs mainly via o-dopaquinone-H+, andthe competitive pathway of consuming H2O2 for p-topaquinone-H+
formation can be neglected.The experiments for high and low initial concentrations of H2O2
yield the conclusion that the peroxidase-catalyzed oxidation of l-dopa occurs with significant accumulation of p-topaquinone-H+ atinitial concentrations of H2O2 exceeding 1 × 10⁻⁵ M.
In order to estimate the rate-constants from the non-enzymaticbranch: Eqs. (1)–(3) and (9)–(12), the oxidation of l-dopa wascarried-out with dioxygen and oxygen/air mixtures in the presenceor absence of peroxidase, in a stirred semibatch reactor in dioxy-gen saturated solutions. The kinetic progress curves obtained inthe absence of HRP might not be conclusive for the estimation of
k1. It was reported for the auto-oxidation of many phenols that therate determining step was the generation of phenoxy radicals [26],the other being fast oxidation, disproportionation, but in the caseof l-dopa, the slow cyclization of p-topaquinone in a parallel loop(specially at high concentrations of l-dopa) might be considered
M. Puiu et al. / Biochemical Engineeri
F[
rofttctdtrtb
tod5Tabtl
o˛tfirs
F[
parameterization shows that all the rate constants 1–12influence the shape of the simulated kinetic curve and noneof the steps from the proposed model (Scheme 4) can beconsidered kinetically non-significant. The optimized val-ues of k2
�k3, k4, k5 are: k2 = (1.45 ± 0.17) × 103 M−1 s−1, �k3 =
ig. 6. Initial reaction rate toward initial concentration of l-dopa.HRP]0 = 2 × 10⁻⁷ M and [O2] = 1.17 × 10⁻³ M.
ate-determining step as well. In order to avoid the accumulationf p-topaquinone in significant amounts several assays were per-ormed in the presence of HRP, being expected that H2O2 generatedrough the slow auto-oxidation of l-dopa do not exceed concentra-ions above 1 × 10⁻⁵ M. The plot of initial reaction rate vs. initialoncentration of l-dopa reveals first order kinetics with respecto l-dopa (Fig. 6). The partial reaction order with respect to l-opa was estimated when fitting the function y = a·xb, where: y ishe initial reaction rate, x is the initial concentration of l-dopa, aepresents the apparent first-order rate constant k′ and b the par-ial reaction order with respect to l-dopa. The obtained value was= 1.035 ± 0.011 (with ˛ = 0.05 and r2 = 0.999).
In order to improve the precision in estimating k′, the exponen-ial equation of product formation y = a · (1 − exp( − b · x) was fittedn the extended kinetic curves DC concentration vs. time, from theata sets with initial concentration of D ranging within 1 × 10−5 to× 10−3 M, where a is the initial concentration of l-dopa and b is k′.he obtained value was k′ = (1.08 ± 0.01) × 10−4 s−1 (with ˛ = 0.05nd r2 = 0.998). The partial reaction order with respect to O2 cane estimated by plotting the apparent first-order rate constant k′
owards molar fraction O2 in the oxidant stream passed through-dopa–HRP solution (Fig. 7).
The fitted function was y = a · xb where b is the partial reactionrder with respect to O2 and it was found b = 0.968 ± 0.031, with= 0.05 and r2 = 0.998. Thus, even in the presence of HRP the par-
ial reaction orders with respect to both l-dopa and dioxygen wereound nearly 1, confirming that reaction (1) is the rate determin-
ng step. Moreover, the rate constant k1 can be calculated as theatio k′/[O2] = 9.2 × 10⁻² M−1 s−1 and can be used further in theimulation assays.ig. 7. Apparent-first order rate constant toward initial molar fraction of O2.D]0 = 5 × 10⁻⁵ M and [HRP]0 = 2 × 10⁻⁷ M
ng Journal 52 (2010) 248–254 253
3.2. Simulation assays
The temporal evolution of the reacting system was describedby a set of differential equations obtained from the reaction steps(1)–(12), corresponding to the transformation rates for all speciesinvolved in the proposed model. The optimisation process wasaccomplished with Kintecus [28] starting from the input values:
• [D]0 = 5 × 10⁻⁵ M, [H2O2]0 = 8 × 10⁻³ M, [HRP]0 rangingwithin 1 × 10⁻⁸ to 5 × 10⁻⁷ M; [H2O2]0 = 8 × 10⁻³ M, [HRP]0 =2 × 10⁻⁷ M, [D]0 ranging within 5 × 10⁻⁵ and 5 × 10⁻⁴ M; [HRP]0 =2 × 10⁻⁷ M, [D]0 = 1 × 10⁻³ M for the peroxidase–hydrogenperoxide system.
• [D]0 = 5 × 10⁻⁵ M, [O2] = 1.17 × 10⁻³ M, [HRP]0 ranging within1 × 10−8 M to 5 × 10⁻⁷ M for dioxygen–peroxidase system.
The integration time was t = 1200–3600 s. The fitting procedureused the least-squares method, assuming that the experimentalerrors are normally distributed; the numerical integration was per-formed with the Adams–Bashford–Gear algorithm for stiff systemssupplied by Kintecus program. The rate constants used as inputdata were those from Table 1 and the following experimentallyobtained values: k1 = 9.2 × 10⁻² M−1 s−1, k6 = 1.22 × 10⁵ M−1 s−1,k8 = 2.52 × 10⁻² M−1 s−1, k12 = 1.66 × 10⁻² s−1. In the simulationassays for dioxygen–peroxidase system the step (8) correspondingof enzyme inactivation by H2O2 was replaced with the equation:
E − FeIII + HOO• k′
8−→•E − FeIII − OOH (24)
with k′8 = 8.2 × 10⁻³ M−1 s−1 since it was previously demonstrated
by sensitivity analysis [20] that k8 has no influence on the sim-ulated kinetic curves in these specific working conditions. In thesimulations of experiments occurring with SOD pre-incubated, k4was replaced with-the second order specificity constant of SOD,k′
4 = 3 × 10⁵ M−1 s−1 in the fast dismutation of peroxy radicals [29].
3.3. Sensitivity analysis
The sensitivity analysis, accomplished with Kintecusat three different time intervals in order to avoid over-
Fig. 8. Simulated and experimental extended kinetic curves of main reaction inter-mediates and product. [D]0 = 3 × 10⁻⁴ M and [HRP]0 = 2 × 10⁻⁷ M.

2 ineeri
(kalwd
csgcteF
4
oowaattpmcaaattitms
R
[
[
[
[
[[
[
[
[
[
[
[
[
[
[
[
[
[
54 M. Puiu et al. / Biochemical Eng
2.72 ± 0.33) × 103 M−1 s−1, �k9 = (2.92 ± 0.12) × 104 M−1 s−1,�
9 = (1.65 ± 0.11) × 103 M−1 s−1, k10 = (6.17 ± 0.02) × 103 M−1 s−1
nd k11 = (5.09 ± 0.04) × 106 M−1 s−1 (with ˛ = 0.05). The simu-ated progress curves for several intermediates (Q, PTQ) together
ith both simulated and experimental kinetic curves for DC areisplayed in Fig. 8.
The agreement between experimental and simulated kineticurves of DC was noticed likewise on the other experimental dataets, including the oxidations in the assays accomplished in dioxy-en saturated conditions. No difference in the simulated kineticurves in the presence and absence of SOD was observed, meaninghat the increase of dismutation rate of peroxy radicals has no influ-nce on dopachrome formation (observed also experimentally, seeig. 1).
. Conclusions
The proposed kinetic model offers a satisfactory descriptionf the behaviour of peroxidase-l-dopa system in aerated aque-us solutions. The main question to response in this approachas if the moderate stable p-topaquinone can be treated as an
ctive intermediate, within the specific working conditions. Itsccumulation in variable amounts splits the overall process intowo consecutive single steps. At relative long periods, its concentra-ion becomes negligible with respect to concentration of oxidationroduct, dopachrome, and thereby it can be excluded from theass-balance equation. The quasi-steady assumption can be suc-
essfully applied in the enzymatic branch of the overall reactionnd also in the non-enzymatic branch for phenoxy, peroxy radicalsnd o-dopaquinone. The relative stability p-topaquinone involvesboundary treatment – as normal intermediate at short reaction
imes and active intermediate at long reaction times. The accumula-ion of p-topaquinone can be prevented by changing the ratio of thenitial concentrations of l-dopa, hydrogen peroxide and peroxidaseo ensure low concentrations of H2O2. The validity of the proposed
odel is supported by the literature data and by the results of ourimulation assays.
eferences
[1] F. Garcia-Carmona, J.L. Garcia-Canovas, J.A. Iborra, Lozanos kinetic study ofmelanization between l-dopa and dopachrome, Biochim. Biophys. Acta 717(1982) 124–131.
[2] G. Prota, M. d’Ischia, A. Napolitano, The chemistry of melanins and relatedmetabolites, in: J.J. Nordlund, R.E. Boissy, V.J. Hearing, R.A. King, J.P. Ortonne(Eds.), The Pigmentary System, Physiology and Pathology, Oxford UniversityPress, Oxford, 1998, pp. 307–332.
[3] J.N. Rodriguez-Lopez, J. Tudela, R. Varon, F. Garcia-Carmona, F. Garcia-Canovas,Analysis of a kinetic model for melanin biosynthesis pathway, J. Biol. Chem.267 (1992) 3801–3810.
[4] H. Fedorow, F. Tribl, G. Halliday, M. Gerlach, P. Riederer, K.L. Double, Neurome-
lanin in human dopamine neurons: comparison with peripheral melanins andrelevance to Parkinson’s disease, Prog. Neurobiol. 75 (2005) 109–124.[5] A. De Iuliis, G. Arrigoni, L. Anderson, A. Zambenedetti, A. Burlina, P. James, P.Arslan, F. Vianello, Oxidative metabolism of dopamine: a colour reaction fromhuman midbrain analysed by mass spectrometry, Biochim. Biophys. Acta 1784(2008) 1687–1693.
[
[
ng Journal 52 (2010) 248–254
[6] D.M. Dooley, Structure and biogenesis of topaquinone and related cofactors,JBIC 4 (1999) 1–11.
[7] T. Newcomer, P.A. Rosenberg, E. Aizenman, Topaquinone, a kainate-like agonistand excitotoxin, is generated by a catecholaminergic cell line, J. Neurol. 15(1995) 3172–3177.
[8] A. Napolitano, O. Crescenzi, A. Pezzela, G. Prota, Generation of the neurotoxin6-hydroxydopamine by peroxidase/H2O2 oxidation of dopamine, J. Med. Chem.38 (1995) 917–922.
[9] F.E. Ali, K.J. Barnham, C.J. Barrow, F. Separovic, Metal catalyzed oxidation oftyrosine residues by different oxidation systems of copper/hydrogen peroxide,J. Inorg. Biochem. 98 (2004) 173–184.
10] L.G. Fenoll, M.J. Penalver, J.N. Rodriguez-Lopez, R. Varon, F. Garcia-Canovas,J. Tudela, Tyrosinase kinetics: discrimination between two models to explainthe oxidation mechanism of monophenol and diphenol substrates, Intern. J.Biochem. Cell Biol. 36 (2004) 235–246.
11] D. Sulzer, L. Zecca, Intraneuronal dopamine–quinone synthesis: a review, Neu-rotox. Res. 1 (2000) 181–195.
12] A. Sanchez Ferrer, J.N. Rodriguez-Lopez, F. Garcia-Canovas, F. Garcia-Camona,Tyrosinase: a comprehensive review of its mechanism, Biochim. Biophys. Acta1274 (1995) 1–11.
13] F. Garcia-Molina, L.G. Fenoll, J.C. Morote, P.A. Garcia-Ruiz, J.N. Rodriguez-Lopez,F. Garcia-Canovas, J. Tudela, Opposite effects of peroxidase in the initial stagesof tyrosinase-catalysed melanin biosynthesis, Intern. J. Biochem. Cell Biol. 37(2005) 1179–1196.
14] H.B. Dunford, Heme Peroxidases, Wiley-VCH, New York, 1999, pp. 64–80.15] M.A. Gilabert, A.N. Hiner, P.A. Garcia-Ruiz, J. Tudela, F. Garcia-Molina, M. Acosta,
F. Garcia-Canovas, N. Rodriguez-Lopez, Differential substrate behaviour ofphenol and aniline derivatives during oxidation by horseradish peroxidase:kinetic evidence for a two-step mechanism, Biochim. Biophys. Acta 1699 (2004)235–243.
16] S. Adedrian, A.M. Lambeir, Kinetics of the reaction of compound II of horseradishperoxidase with hydrogen peroxide to form compound III, Eur. J. Biochem. 186(1989) 571–576.
17] J.L. Munoz-Munoz, F. Garcia-Molina, R. Varon, J. Tudela, F. Garcia-Canovas, J.N.Rodriguez-Lopez, Generation of hydrogen peroxide in the melanin biosynthesispathway, Biochim. Biophys. Acta 1794 (2009) 1017–1029.
18] J.L. Munoz-Munoz, F. Garcia-Molina, R. Varon, J.N. Rodriguez-Lopez, F. Garcia-Canovas, J. Tudela, Calculating molar absortivities for quinones: application tothe measurements of tyrosinase activity, Anal. Biochem. 351 (2006) 128–138.
19] I. Boutelet, S. Alexandre, J.C. Vincent, A hydrogen peroxide assay based on theperoxidase-oxidase reaction, Eur. J. Biochem. 223 (1994) 489–496.
20] M. Puiu, A. Raducan, A.I. Babaligea, D. Oancea, Oxidase-peroxidase reaction:kinetics of peroxidase-catalysed oxidation of 2-aminophenol, Bioproc. Biosyst.Eng. 31 (2008) 579–586.
21] M. Puiu, M. Constantinovici, I. Babaligea, A. Raducan, C. Olmazu, D. Oancea,Detecting operational inactivation of horseradish peroxidase using an isocon-versional method, Chem. Eng. Technol. 33 (2010) 414–420.
22] L.G. Fenoll, J.N. Rodriguez-Lopez, F. Garcia-Sevilla, P.A. Garcia-Ruiz, R. Varon, F.Garcia-Canovas, J. Tudela, Analysis and interpretation of the action mechanismof mushroom tyrosinase on monophenols and diphenols generating highlyunstable o-quinones, Biochim. Biophys. Acta 1548 (2001) 1–22.
23] D.A. Komarov, A.D. Ryazanova, I.A. Slepneva, V.V. Khramstov, I.M. Dubovskiy,V.V. Clupov, Pathogen-targeted hydroxyl radical generation during melaniza-tion in insect hemolymph: ERP study of a probable cytotoxicity mechanism,Appl. Magn. Reson. 35 (2009) 495–501.
24] V.A. Cooper, J.A. Nicell, Removal of phenols from a foundry wastewater usinghorseradish peroxidase, Water Res. 30 (1996) 954–956.
25] R.H. Carvalho, F. Lemos, M.A. Lemos, V. Vojinovic, L.P. Fonseca, J.M.S. Cabral,Kinetic modelling of phenol co-oxidation using horseradish peroxidase, Bio-proc. Biosyst. Eng. 29 (2006) 99–108.
26] D. Oancea, M. Puiu, Temperature and pH effects on the kinetics of 2-aminophenol auto-oxidation in aqueous solution, Centr. Eur. J. Chem. 3 (2003)233–241.
27] D. Oancea, A. Stuparu, M. Nita, M. Puiu, A. Raducan, Estimation of the overall
kinetic parameters of enzyme inactivation using an isoconversional method,Biophys. Chem. 138 (2008) 50–54.28] J. Ianni, KINTECUS Windows Version 3.1, 2003, http://www.kintecus.addr.com/.
29] T. Bugg, Introduction to Enzyme and Coenzyme Chemistry, Blackwell Publish-ing Ltd., 2004, pp. 29–47.