Periodicities in the high-mass X-ray binary system RX J0146.9+6121/LS I+61 235
11
arXiv:0810.4577v1 [astro-ph] 25 Oct 2008 Mon. Not. R. Astron. Soc. 000, 1–11 (2008) Printed 8 October 2013 (MN L A T E X style file v2.2) Periodicities in the high-mass X-ray binary system RX J0146.9+6121/LS I+61 ◦ 235 Gordon E. Sarty 1 ⋆ , L´ aszl´ o L. Kiss 2 , Richard Huziak 1 , Lionel J.J. Catalan 3 , Diane Luciuk 1 , Timothy R. Crawford 4 , David J. Lane 5 , Roger D. Pickard 4 , Thomas A. Grzybowski 4 , Pere Closas 4 , Helen Johnston 2 , David Balam 6 and Kinwah Wu 7 1 Department of Physics and Engineering Physics, University of Saskatchewan, 9 Campus Drive, Saskatoon, Saskatchewan S7N 5A5, Canada 2 Institute of Astronomy, School of Physics A28, University of Sydney, New South Wales 2006, Australia 3 Lakehead University, 955 Oliver Rd., Thunder Bay, Ontario P7B 5E1, Canada 4 American Association of Variable Star Observers, 49 Bay State Rd., Cambridge, MA 02138, USA 5 Department of Astronomy and Physics, Saint Mary’s University, 923 Robie St., Halifax, Nova Scotia B3H 3C3, Canada 6 Department of Physics and Astronomy, University of Victoria, PO Box 3055, STN CSC, Victoria, British Columbia, V8W 3P6 Canada 7 Mullard Space Science Laboratory, University College London, Holmbury St. Mary, Dorking, Surrey RH5 6NT, United Kingdom in original form August 2008 ABSTRACT The high-mass X-ray binary RX J0146.9+6121, with optical counterpart LS I+61 ◦ 235 (V831 Cas), is an intriguing system on the outskirts of the open cluster NGC 663. It contains the slowest X-ray pulsar known with a pulse period of around 1400s and, primarily from the study of variation in the emission line profile of Hα, it is known to have a Be decretion disk with a one-armed density wave period of approximately 1240d. Here we present the results of an extensive photometric campaign, supplemented with optical spectroscopy, aimed at measuring short time-scale periodicities. We find three significant periodicities in the photometric data at, in order of statistical significance, 0.34d, 0.67d and 0.10d. We give arguments to support the interpretation that the 0.34d and 0.10d periods could be due to stellar oscillations of the B type primary star and that the 0.67d period is the spin period of the Be star with a spin axis inclination of 23 +10 −8 degrees. We measured a systemic velocity of −37.0 ± 4.3 km s −1 confirming that LS I+61 ◦ 235 has a high probability of membership in the young cluster NGC 663 from which the system’s age can be estimated as 20–25 Myr. From archival RXTE ASM data we further find “super” X-ray outbursts roughly every 450d. If these super outbursts are caused by the alignment of the compact star with the one-armed decretion disk enhancement, then the orbital period is approximately 330d. Key words: accretion: accretion discs – stars: high-mass X-ray binaries – stars: neutron stars – stars: close binaries – stars: Be stars 1 INTRODUCTION High-Mass X-ray Binaries (HMXBs) are interacting binary stars which emit X-rays as a result of mass transfer and accretion pro- cesses. Be X-ray binaries (BeXs) consist of a rapidly rotating main sequence Be star with an equatorial decretion disk, which gives rise to the optical emission lines, orbited by a compact object that is usually a neutron star. The other major class of HMXBs is com- posed of the supergiant X-ray binaries (SGXs) that consist of a more evolved OB star closely orbited by a neutron star (or in some cases a black hole, like Cyg X-1). SGXs tend to have short (a few days) orbital periods while the orbital periods of BeXs are ⋆ E-mail: [email protected] considerably longer. BeXs are generally transient X-ray sources with outbursts occurring when the compact star passes periastron (Okazaki 2001). All HMXBs are relatively young, rapidly evolving systems in which one component, in most known cases, has already evolved to a supernova and subsequently to the current compact ob- ject. Mass redistribution within the system together with mass loss may prevent the supernova, however, and leave a white dwarf as the compact object. The HMXB γ Cas, for example, is suspected of containing a white dwarf (Lopes de Oliveira et al. 2006; Haberl 1995). Since a significant fraction of all stars form as binary stars, a complete understanding of the evolution of high-mass stars re- quires an understanding of their evolution in the presence of mass transfer in the interacting binary situation. The physical properties of many HMXB systems, in partic- c 2008 RAS
-
Upload
independent -
Category
Documents
-
view
4 -
download
0
Transcript of Periodicities in the high-mass X-ray binary system RX J0146.9+6121/LS I+61 235

arX
iv:0
810.
4577
v1 [
astr
o-ph
] 25
Oct
200
8Mon. Not. R. Astron. Soc.000, 1–11 (2008) Printed 8 October 2013 (MN LATEX style file v2.2)
Periodicities in the high-mass X-ray binary system RXJ0146.9+6121/LS I+61◦235
Gordon E. Sarty1⋆, Laszlo L. Kiss2, Richard Huziak1, Lionel J.J. Catalan3,Diane Luciuk1, Timothy R. Crawford4, David J. Lane5, Roger D. Pickard4,Thomas A. Grzybowski4, Pere Closas4, Helen Johnston2, David Balam6 andKinwah Wu7
1Department of Physics and Engineering Physics, University of Saskatchewan, 9 Campus Drive, Saskatoon, Saskatchewan S7N 5A5, Canada2Institute of Astronomy, School of Physics A28, University of Sydney, New South Wales 2006, Australia3Lakehead University, 955 Oliver Rd., Thunder Bay, Ontario P7B 5E1, Canada4American Association of Variable Star Observers, 49 Bay State Rd., Cambridge, MA 02138, USA5Department of Astronomy and Physics, Saint Mary’s University, 923 Robie St., Halifax, Nova Scotia B3H 3C3, Canada6Department of Physics and Astronomy, University of Victoria, PO Box 3055, STN CSC, Victoria, British Columbia, V8W 3P6 Canada7Mullard Space Science Laboratory, University College London, Holmbury St. Mary, Dorking, Surrey RH5 6NT, United Kingdom
in original form August 2008
ABSTRACTThe high-mass X-ray binary RX J0146.9+6121, with optical counterpart LS I+61◦235 (V831Cas), is an intriguing system on the outskirts of the open cluster NGC 663. It contains theslowest X-ray pulsar known with a pulse period of around 1400s and, primarily from the studyof variation in the emission line profile of Hα, it is known to have a Be decretion disk witha one-armed density wave period of approximately 1240d. Here we present the results of anextensive photometric campaign, supplemented with optical spectroscopy, aimed at measuringshort time-scale periodicities. We find three significant periodicities in the photometric dataat, in order of statistical significance, 0.34d, 0.67d and 0.10d. We give arguments to supportthe interpretation that the 0.34d and 0.10d periods could bedue to stellar oscillations of theB type primary star and that the 0.67d period is the spin period of the Be star with a spinaxis inclination of 23+10
−8 degrees. We measured a systemic velocity of−37.0 ± 4.3 km s−1
confirming that LS I+61◦235 has a high probability of membership in the young clusterNGC663 from which the system’s age can be estimated as 20–25 Myr.From archivalRXTE ASMdata we further find “super” X-ray outbursts roughly every 450d. If these super outbursts arecaused by the alignment of the compact star with the one-armed decretion disk enhancement,then the orbital period is approximately 330d.
Key words: accretion: accretion discs – stars: high-mass X-ray binaries – stars: neutron stars– stars: close binaries – stars: Be stars
1 INTRODUCTION
High-Mass X-ray Binaries (HMXBs) are interacting binary starswhich emit X-rays as a result of mass transfer and accretion pro-cesses. Be X-ray binaries (BeXs) consist of a rapidly rotating mainsequence Be star with an equatorial decretion disk, which gives riseto the optical emission lines, orbited by a compact object that isusually a neutron star. The other major class of HMXBs is com-posed of the supergiant X-ray binaries (SGXs) that consist of amore evolved OB star closely orbited by a neutron star (or in somecases a black hole, like Cyg X-1). SGXs tend to have short (afew days) orbital periods while the orbital periods of BeXs are
⋆ E-mail: [email protected]
considerably longer. BeXs are generally transient X-ray sourceswith outbursts occurring when the compact star passes periastron(Okazaki 2001). All HMXBs are relatively young, rapidly evolvingsystems in which one component, in most known cases, has alreadyevolved to a supernova and subsequently to the current compact ob-ject. Mass redistribution within the system together with mass lossmay prevent the supernova, however, and leave a white dwarf asthe compact object. The HMXBγ Cas, for example, is suspectedof containing a white dwarf (Lopes de Oliveira et al. 2006; Haberl1995). Since a significant fraction of all stars form as binary stars,a complete understanding of the evolution of high-mass stars re-quires an understanding of their evolution in the presence of masstransfer in the interacting binary situation.
The physical properties of many HMXB systems, in partic-
c© 2008 RAS

2 G.E. Sarty et al.
ular their orbital period, are known from their X-ray behaviour.But the orbital periods of many Galactic systems (approximatelyhalf of those with known optical counterparts) remain unknown(Liu et al. 2006). We have recently initiated a long-term programto obtain time-series optical photometric data for bright HMXBs inan effort to measure periodicities and determine the orbital periods(Sarty et al. 2007). Here we report the results of one of our firstobserving campaigns aimed at RX J0146.9+6121/LS I+61◦235.The data were obtained by observers associated with the Ameri-can Association of Variable Star Observers (AAVSO) in responseto our call to observe HMXBs on an on-going basis. In additionto the photometry, we also made optical spectroscopic radial veloc-ity measurements using the Dominion Astrophysical Observatory’sPlaskett telescope. Significant photometric and radial velocity vari-ation was found which we report and interpret here. We furtherinterpret the optical data alongside publicly available X-ray lightcurves from the All Sky Monitor (ASM) on board the Rossi X-ray Timing Explorer (RXTE) satellite and previously published in-formation to make an estimate of the orbital period. This paper isorganised as follows. The optical and X-ray observations are de-scribed in Sect. 2. The results of period searches in the optical andX-ray light curves are presented in Sect. 3. Interpretationof the re-sults is given in Sect. 4, where we present evidence forβ Cepheitype pulsations in the optical component of the system, confirm itsmembership in the star cluster NGC 663 and argue that the orbitalperiod is about 330d. We conclude the paper in Sect. 5.
2 OBSERVATIONS
2.1 Optical photometry
Three observing seasons of optical photometric data have been ob-tained of LS I+61◦235 covering the ends of 2005, 2006 and 2007.These data were obtained primarily in the JohnsonV band by theobservers listed in Table 1, where they are identified by the observerinitials assigned to them by the AAVSO. The completeV banddataset is shown in Fig. 2, where it may be seen that the first twoseasons were covered exclusively by HUZ. CousinsIC band dataare shown in Fig. 3 and a limited set of JohnsonB−V colour obser-vations were obtained by LDJ. Other observers joined the HMXBobservation program in the third season in response to a general callfor HMXB observations (Sarty et al. 2007) and to AAVSO AlertNotices 348 and 354. All the photometric observations are avail-able from the AAVSO International Database. The total numbers ofobservations are shown in Table 2. The observations were initiallyretrieved from the AAVSO International Database and then the ob-servers were individually contacted to resolve discrepancies and er-rors, if any. This “validation” step is necessary to restoresome ho-mogeneity to an otherwise relatively inhomogeneous dataset. Allobservers reported an estimate of the signal to noise ratio (S/N)of each measurement, usually based on a formal estimate of thePoisson shot noise. All of the photometry reported was differen-tial photometry with the magnitudes being determined relative tothe comparison stars labelled in Fig. 1. A variety of methodswereused by the observers to reduce the data using aperture photom-etry and software like MaxImDL, Aip4Win or MiraAP. None ofthe data were transformed to the standard Johnson/Cousins photo-metric system and therefore are instrumental magnitudes. Since ourmain aim is to determine periodicities from the light curve,instru-mental magnitudes are as valuable as properly standardiseddataprovided there are no large unaccounted offsets between thesub-sets. The majority of our data were obtained independently by two
pb
q
e
East
North
Comparison/Check stars
Star RA Dec B V IC
b 01 46 32.64 61 21 18.0 12.464 11.684 10.643e 01 46 41.76 61 17 13.2 13.560 12.976 12.183p 01 47 22.80 61 21 03.6 11.378 10.857 10.124q 01 47 30.00 61 25 19.2 12.625 12.041 11.334
Figure 1. Comparison stars used by the AAVSO observers for the dif-ferential photometry reported here. The target star, RX J0146.9+6121/LSI+61◦235, is marked by the two dashes. The data are based on measure-ments made at the Sonoita Research Observatory (SRO) by ArneHendenand the constancy of the stars has been verified from data obtained by ob-servers HUZ and CTE. This image is based on the POSS2/UKSTU Redimages from the STScI Digitized Sky Survey. The field of view is 0.25◦.
Table 1. List of observers and their equipment.
Observer Telescope CCD
HUZ, R Huziak 30-cm SCT SBIG ST-9XE30-cm SCT STL-1301E
CTE, L Catalan 25-cm Newtonian KAI-2020MLDJ, DJ Lane 28-cm SCT SBIG ST-9XECTX, TR Crawford 30-cm SCT SBIG ST-9XEPXR, RD Pickard 30-cm SCT Starlight Xpress SXV-H9CPE, P Closas 15-cm refractor Starlight HX516OSC, SC Orlando 20-cm SCT SBIG ST-8XEGTZ, TA Grzybowski 25-cm SCT SBIG ST-402
observers. The photometric values reported by those two observers,at times of simultaneous observation, show excellent agreement.
2.2 Optical spectroscopy
Optical spectroscopy at a resolution of approximately 0.4A (10A /mm, λ/∆λ ∼ 11000) was obtained during two observing runswith the Cassegrain spectrograph on the 1.85-m Plaskett telescopeat the Dominion Astrophysical Observatory (DAO) in Victoria,British Columbia, Canada. The two observing runs were from Au-gust 20 to September 3, 2007 and from December 3 to December
c© 2008 RAS, MNRAS000, 1–11

Periodicities in RX J0146.9+6121 3
11.25
11.3
11.35
11.4
11.45
11.5
11.55 3500 3600 3700 3800 3900 4000 4100 4200 4300 4400 4500
V
HJD - 2450000
All three seasonsV V
HUZCTELDJ
OSCGTZCPEPXR
Figure 2. The completeV band light curve. The first season covers HJD 2453583 to 2453808, the second season covers HJD 2454019 to 2454162, andthe third season covers HJD 2454347 to 2454457. No long term changes greater than about 0.05 magnitude are seen over the approximately 1000 days ofobservations. The two “V” symbols mark the times of the two largest X-ray outbursts during the three observing seasons asseen by theRXTE ASM and shownin Fig. 5(a).
10.42
10.44
10.46
10.48
10.5
10.52
10.54 0.7 0.75 0.8 0.85 0.9 0.95
I C
HJD - 2454418
0.75 0.8 0.85 0.9
HJD - 2454430
Figure 3. CousinsIC band photometric data provided by observer CTX.
Table 2. List of total numbers of photometric observations by the AAVSOobservers broken down by filter.
Observer B V IC Total
HUZ 4702 4702CTE 3961 3961LDJ 64 66 130CTX 556 556PXR 1484 1484CPE 18 18OSC 1 1 2GTZ 4 4Totals 65 10236 556 10857
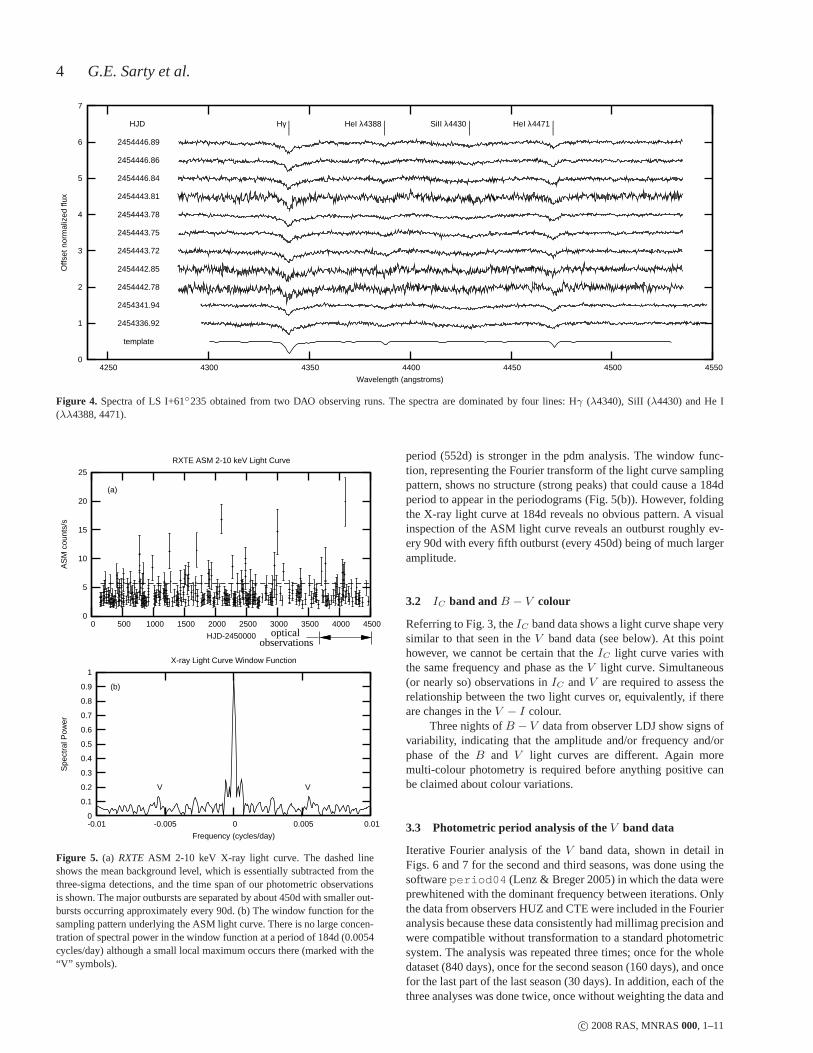
12, 2007. The spectrograph was nominally set to receive the bandfrom 4300 to 4550A with a 0.005-in slit in the “21181” configura-tion, meaning that a 21-in focal length camera, 18-hundred groovesper mm grating and the 1st spectral order were used. The CCDwas a SITe-2, with 1752×532 15µm pixels. Exposure times var-ied from 900 to 2400s. The spectra were extracted and wavelengthcalibrated against the emission lines from an Fe-Ar lamp using theIRAF doslit task.
A total of 11 spectra were obtained as shown in Fig. 4. Ofthose spectra, 3 were quite noisy because of passing clouds.Radialvelocities were measured from these spectra as described inSect. 3.
2.3 RXTE ASM X-ray data
Archived data from theRXTE ASM were used to identify out-bursts that occurred before and during our optical observing runs.TheRXTE ASM is composed of three Scanning Shadow Cameras(SSCs) that perform sets of 90s pointed observations (dwells) cov-ering about 80% of the sky every∼90 minutes (Levine et al. 1996).Definitive ASM data for RX J0146.9+6121 were downloaded fromthe RXTE Guest Observer Facility. The data used were from thedwell by dwell compilation. Each raw data point represents thefitted source flux from one 90 second dwell. Data from all threeSSCs were used and represent nominal 2-10 keV rates in ASMcounts/second (c/s). Nominally, the Crab nebula flux is about 75ASM c/s (when the source is at the centre of an SSC field of viewand all 8 anodes are operational). We retained only the “three-sigma” detections based on the reported variance for each datapoint. The ASM data are shown in Fig. 5.
3 RESULTS
3.1 X-ray outbursts
The previously reported outburst of 1997 (Mereghetti et al.2000;Reig & Roche 1999) can be seen in the X-ray light curve atHJD 2450769. Subsequent outbursts are easily identified, with thelargest outburst occurring at HJD 2454083. The large outburst atHJD 2454083 (see Fig. 5) corresponds to a possible brightening oftheV band light curve in the second observing season peaking atapproximately HJD 2454050 (2006, see Fig. 2) and appears to bethe peak of X-ray activity lasting about 40 days. The peak of the2006V band brightening appears to precede, by a few tens of days,the X-ray peak. The peak inV band brightness seen at about HJD2453630 in the first observing season (2005) precedes, by roughly80 days, the X-ray outburst marked by X-ray flux of about 7.5 ASMc/s (∼0.1 Crab) at HJD 2453710 and 2453770. In this case theVbrightness appears to have faded considerably (by about 0.03 mag)by the time the X-ray outburst occurs.
A formal search for periods in the ASM data was done usingthe period04 (Lenz & Breger 2005) software, a Lomb-Scargleperiodogram (Lomb 1976; Scargle 1982) and a phase dispersionminimisation (pdm) technique (Stellingwerf 1978). All methods re-port a strong 184d period although the third subharmonic of that
c© 2008 RAS, MNRAS000, 1–11
4 G.E. Sarty et al.
0
1
2
3
4
5
6
7
4250 4300 4350 4400 4450 4500 4550
Offs
et n
orm
aliz
ed fl
ux
Wavelength (angstroms)
template
2454336.92
2454341.94
2454442.78
2454442.85
2454443.72
2454443.75
2454443.78
2454443.81
2454446.84
2454446.86
2454446.89
HJD Hγ | HeI λ4388 | SiII λ4430 | HeI λ4471 || | | |
Figure 4. Spectra of LS I+61◦235 obtained from two DAO observing runs. The spectra are dominated by four lines: Hγ (λ4340), SiII (λ4430) and He I(λλ4388, 4471).
0
5
10
15
20
25
0 500 1000 1500 2000 2500 3000 3500 4000 4500
AS
M c
ount
s/s
HJD-2450000
RXTE ASM 2-10 keV Light Curve
(a)
observationsoptical
0
0.1
0.2
0.3
0.4
0.5
0.6
0.7
0.8
0.9
1
-0.01 -0.005 0 0.005 0.01
Spe
ctra
l Pow
er
Frequency (cycles/day)
X-ray Light Curve Window Function
(b)
VV
Figure 5. (a) RXTE ASM 2-10 keV X-ray light curve. The dashed lineshows the mean background level, which is essentially subtracted from thethree-sigma detections, and the time span of our photometric observationsis shown. The major outbursts are separated by about 450d with smaller out-bursts occurring approximately every 90d. (b) The window function for thesampling pattern underlying the ASM light curve. There is nolarge concen-tration of spectral power in the window function at a period of 184d (0.0054cycles/day) although a small local maximum occurs there (marked with the“V” symbols).
period (552d) is stronger in the pdm analysis. The window func-tion, representing the Fourier transform of the light curvesamplingpattern, shows no structure (strong peaks) that could causea 184dperiod to appear in the periodograms (Fig. 5(b)). However, foldingthe X-ray light curve at 184d reveals no obvious pattern. A visualinspection of the ASM light curve reveals an outburst roughly ev-ery 90d with every fifth outburst (every 450d) being of much largeramplitude.
3.2 IC band and B − V colour
Referring to Fig. 3, theIC band data shows a light curve shape verysimilar to that seen in theV band data (see below). At this pointhowever, we cannot be certain that theIC light curve varies withthe same frequency and phase as theV light curve. Simultaneous(or nearly so) observations inIC andV are required to assess therelationship between the two light curves or, equivalently, if thereare changes in theV − I colour.
Three nights ofB − V data from observer LDJ show signs ofvariability, indicating that the amplitude and/or frequency and/orphase of theB and V light curves are different. Again moremulti-colour photometry is required before anything positive canbe claimed about colour variations.
3.3 Photometric period analysis of the V band data
Iterative Fourier analysis of theV band data, shown in detail inFigs. 6 and 7 for the second and third seasons, was done using thesoftwareperiod04 (Lenz & Breger 2005) in which the data wereprewhitened with the dominant frequency between iterations. Onlythe data from observers HUZ and CTE were included in the Fourieranalysis because these data consistently had millimag precision andwere compatible without transformation to a standard photometricsystem. The analysis was repeated three times; once for the wholedataset (840 days), once for the second season (160 days), and oncefor the last part of the last season (30 days). In addition, each of thethree analyses was done twice, once without weighting the data and
c© 2008 RAS, MNRAS000, 1–11

Periodicities in RX J0146.9+6121 5
a second time weighting the data with weightsw = 1/σ2 whereσ is the reported error. The frequencies found from the iterativeweighted Fourier analysis are shown in Table 3.
Selected periodograms associated with the entire dataset (allthree observing seasons) are shown in Fig. 8. For the entire dataset,both the weighted and unweighted analysis found a low frequencycomponent with the highest peak with a period of almost exactly840 days, i.e. the time-span. This corresponds exactly to the ex-pected effect of the single mean brightness offset in the first half ofthe central chunk of data (second season). The 1.49 cycles/day (c/d)frequency is roughly half (not significantly different fromhalf) thatof the prominent period at 2.92 c/d and folded phase graphs atthose two frequencies produces plots (Fig. 9) that are very simi-lar to directly observed all night time series (see Figs. 6 and 7).The 0.18 and 1.21 c/d periods appear to be spurious because ofthedistorted shape of the folded curves, sampling window effects, anon-periodic mean brightness shift, etc. The whole spectrum above∼5 c/d can be very well approximated with a1/f noise which mayhave an astrophysical origin. The 9.679 c/d peak is, however, verynarrow, very strong, and much higher than the noise in the sur-rounding area of the spectrum. A typical method for assessing thesignal to noise (S/N) ratio for a peak in the spectrum is to calculatethe ratio between its amplitude and the mean amplitude of thesur-rounding peaks with a S/N> 3.5 to 4 being a commonly adoptedlimit of significance (very roughly representing, via the central limittheorem, a probability of arising by chance of<5%). The 9.679 c/dpeak is significant by this definition having a S/N in the range4.5to 7.6, depending on width of the frequency bins. The frequenciesof 2.92 c/d (and/or 1.49 c/d) and 9.68 c/d are therefore judged tobe real from the analysis of the whole dataset. There was not muchdifference between the weighted and unweighted analysis, whichshows that the overall photometric quality (from observersHUZand CTE) is quite homogeneous and there is not much effect fromoutliers.
Fourier analysis of the middle season (160 days) showed a lowfrequency artefact (0.0044 c/d, a period of 222 days), a samplingartefact (0.996 c/d), a scatter of power between 2.7 and 2.99c/d andagain the 9.678 c/d peak. As with using the whole dataset, phasingthe data with the doubled 0.68 d period produces a double humpedlight curve with slightly different amplitudes for each hump.
Fourier analysis of the the last 30 days of data, which is thebest subset, produced the results shown in the last three columns ofTable 3. The 2.9 and 9.7 c/d frequencies show up in every analysis.The phase diagram at 2.9 (or 1.5) c/d shows a non-sinusoidal shapewith sharp changes which is very suggestive of geometric varia-tions. The 1.52 c/d frequency may be a pure subharmonic within theuncertainties of the analysis and the 9.678 c/d peak is very strong.
Rotational modulation can cause double humps if, for exam-ple, the modulation is caused by fixed star spots. So, if rotation isthe cause, the formal frequency associated with the 2.9 c/d peakfrom the Fourier spectrum needs to be halved to obtain the truefrequency. Also the 2.9 c/d folded light curve seems to be a bitdifferent in shape when the whole dataset or different subsets areused. If this is due to rotation then shifts are possible if there is dif-ferential rotation on the B-star and/or spots change their latitudes.The 9.678 c/d frequency is very stable and very coherent (perhapssuggestive of some kind of geometric changes) and it is only 6to6.5 times longer than the X-ray pulse period of 25 minutes.
0
0.005
0.01
0.015
0.02
0.025
0.03
0 2 4 6 8 10 12 14
Am
plitu
de
Frequency (c/d)
(a)
0 0.1 0.2 0.3 0.4 0.5 0.6 0.7 0.8 0.9
1 1.1
-3 -2 -1 0 1 2 3
Window Function
0
0.001
0.002
0.003
0.004
0.005
0.006
0.007
0 2 4 6 8 10 12 14
Am
plitu
de
Frequency (c/d)
(b)
0
0.0005
0.001
0.0015
0.002
0.0025
0.003
0 2 4 6 8 10 12 14
Am
plitu
de
Frequency (c/d)
(c)
Figure 8. Periodograms obtained by using all of the HUZ and CTE data. (a)The original periodogram with the observing window shown inthe inset.(b) Prewhitened periodogram showing the peak at 2.93 c/d. (c) Prewhitenedperiodogram showing the peak at 9.68 c/d.
3.4 Radial Velocity Measurements
Two approaches were taken to radial velocity determination: a crosscorrelation with a model spectrum as computed by Munari et al.(2005) and direct line profile fitting for the cores of the fourdomi-nant absorption lines.
For the cross correlation approach, a high resolution (0.05A/pix) template was used after being degraded to the resolutionof the data. The template spectrum (shown at the bottom of Fig. 4)was from the library of model spectra as computed by Munari etal.(2005), with the following parameters:Teff = 24000K (see Ta-ble 4), log g = 3.0 (cgs units), [M/H]=−0.5, vrot = 0 kms−1, microturbulent velocity = 2 km s−1, no [α/Fe] enhancement,old opacity distribution function (ODF) and no overshooting (seeMunari et al. (2005) for details).
The observed spectra were cross-correlated with the tem-plate to compute relative radial velocities using thefxcor taskof IRAF. Barycentric corrections were applied using the IRAF taskrvcorrect. For direct line profile fitting, a sum of Gaussian andLorentzian functions was first tried but ultimately a simpleGaus-sian fit of the line cores was used due to the limited S/N of the
c© 2008 RAS, MNRAS000, 1–11

6 G.E. Sarty et al.
11.35
11.4
11.45
11.5
11.55 4019.7 4019.8 4019.9 4020 4020.1 4020.2
11.35
11.4
11.45
11.5
11.55 4020.7 4020.8 4020.9 4021 4021.1
11.35
11.4
11.45
11.5
11.55 4021.7 4021.8 4021.9 4022 4022.1
11.35
11.4
11.45
11.5
11.55 4034.7 4034.8 4034.9 4035 4035.1
11.35
11.4
11.45
11.5
11.55 4042.6 4042.7 4042.8 4042.9 4043
11.35
11.4
11.45
11.5
11.55 4049.5 4049.6 4049.7 4049.8 4049.9
11.35
11.4
11.45
11.5
11.55 4056.4 4056.5 4056.6 4056.7 4056.8
11.35
11.4
11.45
11.5
11.55 4060.7 4060.8 4060.9 4061 4061.1
11.35
11.4
11.45
11.5
11.55 4069.5 4069.6 4069.7 4069.8 4069.9 4070
11.35
11.4
11.45
11.5
11.55 4089.4 4089.5 4089.6 4089.7 4089.8
11.35
11.4
11.45
11.5
11.55 4090.4 4090.5 4090.6 4090.7 4090.8
11.35
11.4
11.45
11.5
11.55 4099.4 4099.5 4099.6 4099.7 4099.8
11.35
11.4
11.45
11.5
11.55 4100.5 4100.6 4100.7 4100.8 4100.9
11.35
11.4
11.45
11.5
11.55 4104.4 4104.5 4104.6 4104.7 4104.8
11.35
11.4
11.45
11.5
11.55 4105.5 4105.6 4105.7 4105.8 4105.9
11.35
11.4
11.45
11.5
11.55 4126.4 4126.5 4126.6 4126.7 4126.8
11.35
11.4
11.45
11.5
11.55 4130.5 4130.6 4130.7 4130.8 4130.9
11.35
11.4
11.45
11.5
11.55 4133.4 4133.5 4133.6 4133.7 4133.8
11.35
11.4
11.45
11.5
11.55 4162.4 4162.5 4162.6 4162.7 4162.8 4162.9
Figure 6. Night by night presentation of season 2V band data. Abscissas are HJD−2450000, ordinates are instrumentalV magnitude. Observer symbols areas in Fig. 2; in this case HUZ is the only observer. Some nightswhere only a few data points were taken are not shown. Note thepresence of short periodfluctuations (∼0.1d) on every night.
c© 2008 RAS, MNRAS000, 1–11

Periodicities in RX J0146.9+6121 7
11.35
11.4
11.45
11.5
11.55 4396.5 4396.6 4396.7 4396.8 4396.9
11.35
11.4
11.45
11.5
11.55 4398.5 4398.6 4398.7 4398.8 4398.9 4399
11.35
11.4
11.45
11.5
11.55 4399.6 4399.7 4399.8 4399.9 4400
11.35
11.4
11.45
11.5
11.55 4401.6 4401.7 4401.8 4401.9 4402
11.35
11.4
11.45
11.5
11.55 4404.4 4404.5 4404.6 4404.7 4404.8 4404.9
11.35
11.4
11.45
11.5
11.55 4405.4 4405.5 4405.6 4405.7 4405.8
11.35
11.4
11.45
11.5
11.55 4406.5 4406.6 4406.7 4406.8 4406.9
11.35
11.4
11.45
11.5
11.55 4407.6 4407.7 4407.8 4407.9 4408 4408.1
11.35
11.4
11.45
11.5
11.55 4411.5 4411.6 4411.7 4411.8 4411.9 4412
11.35
11.4
11.45
11.5
11.55 4420.5 4420.6 4420.7 4420.8 4420.9
11.35
11.4
11.45
11.5
11.55 4438.5 4438.6 4438.7 4438.8 4438.9
11.35
11.4
11.45
11.5
11.55 4440.2 4440.3 4440.4 4440.5 4440.6
11.35
11.4
11.45
11.5
11.55 4443.6 4443.7 4443.8 4443.9 4444 4444.1
11.35
11.4
11.45
11.5
11.55 4444.5 4444.6 4444.7 4444.8 4444.9
11.35
11.4
11.45
11.5
11.55 4445.3 4445.4 4445.5 4445.6 4445.7
11.35
11.4
11.45
11.5
11.55 4446.5 4446.6 4446.7 4446.8 4446.9
11.35
11.4
11.45
11.5
11.55 4447.3 4447.4 4447.5 4447.6 4447.7 4447.8
11.35
11.4
11.45
11.5
11.55 4450.3 4450.4 4450.5 4450.6 4450.7
11.35
11.4
11.45
11.5
11.55 4451.3 4451.4 4451.5 4451.6 4451.7 4451.8
11.35
11.4
11.45
11.5
11.55 4453.3 4453.4 4453.5 4453.6 4453.7
11.35
11.4
11.45
11.5
11.55 4457.2 4457.3 4457.4 4457.5 4457.6 4457.7
Figure 7. Night by night presentation of season 3V band data. Abscissas are HJD−2450000, ordinates are instrumentalV magnitude. Observer symbols areas in Fig. 2. Some nights where only a few data points were taken are not shown.
c© 2008 RAS, MNRAS000, 1–11

8 G.E. Sarty et al.
Table 3. Frequencies found from the iterative Fourier analysis of the HUZ and CTE data, listed in order of significance. Frequencies that were found in thethird season data subset (the best one) plus at least one of the other two analyses are highlighted in bold face.
Whole dataset | Second season | Last 30 daysFrequency Amplitude S/N | Frequency Amplitude S/N | Frequency Amplitude S/N
(c/d) (mmag) | (c/d) (mmag) | (c/d) (mmag)
0.00119 28.5 40 0.9962 12.8 21 2.9142 5.9 112.9238 6.5 8.1 1.2128 4.5 7.0 0.1502 5.6 100.1846 5.2 7.4 2.7201 7.3 9.0 1.5231 5.2 9.21.2124 4.3 5.8 0.4222 7.9 13 9.6786 2.6 6.51.4983 4.0 5.0 2.9894 5.8 7.29.6791 2.8 7.6 5.4630 3.5 4.0
9.6784 3.2 6.5
11.4
11.41
11.42
11.43
11.44
11.45
11.46
11.47
11.48 0 0.1 0.2 0.3 0.4 0.5 0.6 0.7 0.8 0.9 1
V
Phase
(a)
11.4
11.41
11.42
11.43
11.44
11.45
11.46
11.47
11.48 0 0.1 0.2 0.3 0.4 0.5 0.6 0.7 0.8 0.9 1
V
Phase
(b)
Figure 9. PhotometricV band data from CTE folded two frequencies. (a)Folded at 2.924 c/d. (b) Folded at 1.462 c/d. The lower frequency appearsto be composed of two peaks at slightly different amplitudes.
-80
-70
-60
-50
-40
-30
-20
-10
0
0 0.2 0.4 0.6 0.8 1 1.2 1.4 1.6 1.8
radi
al v
eloc
ity (
km/s
)
phase
Folded at period = 0.342 days
Figure 10. Radial velocity data folded with a 0.342d period. The dashedline shows the best fitting sinusoid with a 0.342d period.
data. Of the four dominant lines in the spectra, the weakest line (SiII at λ4430) was dropped for all spectra and the remaining threelines were fitted. For the noisier spectra (due to clouds) theHe Iλ4387 line could not be fitted, leaving only two fitted lines forthose spectra. The resulting Doppler shifts were convertedto helio-centric velocities usingrvcorrect and the average and standarddeviation of the line velocities were computed for each spectrum togive an uncertainty measure. The results (average line velocities)were comparable to the results obtained from cross-correlation. Weconsidered the cross-correlation radial velocity values to be su-perior to the values obtained from individual line-fitting but thecross-correlation method gave no directly usable measuresof errorsince thecentre1d peak-finding algorithm was used in IRAF.Thecentre1d algorithm was determined to be better for findingthe maximum of the cross-correlation function than function fit-ting methods because the cross-correlation function was frequentlyasymmetrical. So we used the standard deviation (SD) of the line-fits to quantify the error in the cross-correlation radial velocity val-ues. The results, excluding the three noisy spectra are plotted inFig. 10. The radial velocity values for the individual lineswere av-eraged here but will be useful individually for a larger dataset be-cause each line potentially gives information about different layersin the Be star.
Large radial velocity changes were seen in the course of a sin-gle night so the data were folded at the periods, and multiples ofthose periods, found in the period analysis of the photometry data.The radial velocity dataset is too small to permit any more exten-sive period searches. After the radial velocities computedfrom thethree obviously noisy spectra were discarded, the best results werefound at the prominent period of 0.342d. A sine curve was formallyfit to the data folded at that period using a nonlinear least-squaresMarquardt-Levenberg algorithm. The resulting fit, along with themeasured radial velocity data are shown in Fig. 10. For the sinecurve fit,χ2
red = 1.07 (5 degrees of freedom) whereχ2
red is thereducedχ2 value obtained by weighting the terms in the residualsum of squares with the SD values from the line-fits. The systemicvelocity from the fit wasγ = −37.0 ± 4.3 km s−1 and the ra-dial velocity semi-amplitude wasK1 = 21.8 ± 3.6 km s−1. Weshould emphasise that this conclusion about the radial velocity pe-riod is uncertain and subsequent data may lead to support foraperiod other than the ones tried here.
The value ofγ = −37.0 ± 4.3 km s−1 closely matches theradial velocities for other stars in NGC 663 (Liu et al. 1989,1991).Mermilliod et al. (2008) report a cluster mean radial velocity of−33.09±0.34 km s−1 with a dispersion of 1.74 km s−1. Our mea-surements therefore provide further confirmation that the HMXB
c© 2008 RAS, MNRAS000, 1–11

Periodicities in RX J0146.9+6121 9
RX J0146.9+6121/LS I+61◦235 is a member of the open clusterNGC 663 if we assume that the velocity kick from the supernovathat formed the neutron star was non-existent or small. Thisis likelyif RX J0146.9+6121/LS I+61◦235 belongs to the class of BeXswith long orbital periods (Pfahl et al. 2002) as we suspect for thissystem (see the Discussion). One possible mechanism for such asmall or non-existent supernova velocity kick is an electron-capturecollapse of a degenerate O-Ne-Mg core, of a lower mass progen-itor, that can only happen in binary systems (Podsiadlowskiet al.2004).
4 DISCUSSION
LS I+61◦235 (V831 Cas) was identified as the optical counterpartof RX J0146.9+6121 by Motch et al. (1991). They first identifiedthe X-ray source from ROSAT data and subsequently observed Hαemission in the optical counterpart to confirm the BeX classifica-tion of the source. RX J0146.9+6121 is a persistent low-luminosityBeX with low X-ray variability (Lmax/Lmin 6 10) and it contains anX-ray pulsar with the longest pulse period known (Reig & Roche1999). The pulsar period is variable around 1400s (Mereghetti et al.2000) with variability presumably as the result of the increasedmass transfer associated with occasional X-ray bursts.
Coe et al. (1993) placed the distance at 2.2 kpc based ona reddening ofE(B − V ) = 0.92 derived fromuvby photom-etry (per the method of Crawford (1978)). This distance deter-mination is consistent with LS I+61◦235 being a member of theopen cluster NGC 663 (Pigulski et al. 2001) and was confirmed byReig et al. (1997) who further determined the astrophysicalparam-eters listed in Table 4. Pigulski et al. (2001) give the age ofNGC663 to be 20–25 Myr. The age of NGC 663 has been difficultto determine because the cluster contains the highest knownBestar abundance in the Galaxy, and Be stars tend to occupy anoma-lous positions in colour-magnitude diagrams (Fabregat & Torrejon2000). Tapia et al. (1991), for example, give the lowest determi-nation of 9 Myr. Using Stromgrenuvby colour indicies for non-Be stars in the cluster, Fabregat & Torrejon (2000) deduce an ageof 23 Myr in agreement with the determination by Pigulski et al.(2001). Coe et al. (1993) and Reig et al. (1997, 2000) obtained IRJHK photometry that showed long term variations of approximately0.3 mag for J (J∼9.9), 0.3 mag for H (H∼9.6) and up to 0.5 magfor K (K∼9.4).
The Be decretion disk of LS I+61◦235 has been intensivelystudied through the investigation of Violet/Red (V/R) variations inthe Hα emission. The Hα, HeI λ6678 and the Paschen lines Pa11,λ8863, and Pa12,λ8750 all show variable emission (Reig et al.2000). Furthermore, the Hα emission shows a quasi-cyclic varia-tion of 1240± 30 days. The V/R variation of the Hα line corre-lates with long-term changes in Hα EW and IR (JHK) intensity. Asshown by Reig et al. (2000), the V/R and IR variations can be ex-plained by the global one-armed oscillation model (Okazaki1991,1997; Papaloizou et al. 1992) consisting of globalm = 1 oscilla-tions of the cool Be disk in which an enhanced density perturbationdevelops on one side of the disk and slowly precesses, in thiscasein the prograde direction, with one precession cycle being equal tothe V/R cycle. The density perturbation is confined to a few stellarradii in the disk and the precession period is expected to be rel-atively insensitive to the disk size (Savonije & Heemskerk 1993).Since the variations are azimuthal, no variation in IR colour is ex-pected and this is what has been observed. Radial variation in thedisk would cause IR colour variation. We will relate the motion of
Table 4. The astrophysical parameters of LS I+61◦235 (Reig et al. 1997).
Spectral type B1VE(B − V ) 0.93± 0.02Teff 24000± 1500 KRadius 7± 1 R⊙
Mass 11± 2 M⊙
MV -3.1± 0.5Distance 2.3± 0.5 kpcBC -2.4± 0.2Mbol -5.5± 0.5 (1.2 × 10⁴ L⊙)log g 3.9± 0.2 log(cm/s2)vrot sin i 200± 30 km s−1
the one-armed density perturbation with the X-ray behaviour of RXJ0146.9+6121 below.
The strongest results arising from our data for LSI+61◦235/RX J0146.9+6121 are three frequencies in theV bandlight curve: 2.9 c/d, 1.5 c/d and 9.7 c/d. That is, the periods0.34d,0.67d and 0.10d are present. Such short periods have been arguedfor other Be stars to be due to rotation or non-radial pulsation(Balona 1990). The 0.67d period is almost surely a subharmonic ofthe 0.34d period and, if the light variation is caused by a geomet-rical effect such as ellipsoidal variation (the Z-shape of the foldedlight curve implies a more complex geometry than simple ellip-soidal variation), then the spin period of the Be star is 0.68d. Thisconclusion can be checked using the astrophysical parameters forLS I+61◦235 previously published by Reig et al. (1997) (see Table4). Using the value of 2.9238 c/d (0.34d period) as determined fromthe analysis of all three observing seasons and a Be star radius of7±1 R⊙ we find a surface velocity of 1036±148 km s−1. With arotation frequency of half that, a surface velocity of 518±74 kms−1 results. The break-up velocity is
vcrit =
√
GM∗
R∗
. (1)
Using M∗ = 11 M⊙ and R∗ = 7 R⊙, the critical velocity isvcrit = 547 km s−1. So the rotation period cannot be 0.34d orthe star would break-up. A rotation period of 0.68d is near-critical,a condition that is believed to hold for Be stars (e.g. from statisticalstudies like that of Chauville et al. (2001), from the directinter-ferometric measurement of the oblateness of the Be star Achernarby Domiciano de Souza et al. (2003) and, from theoretical consid-erations on how the decretion disk is formed like that of Lee et al.(1991)). So it is possible that the rotation period may be 0.68d withthe 0.34d period representing when opposite sides of the star arepresented to us.
With a rotation period of 0.67d andvrot = 518 km s−1 we canuse the previously determined value ofvrot sin i = 200 km s−1 todeduce that the inclination isi = 23◦. Taking into account the errorreported forR∗ andvrot sin i we havei = 23 +10
−6 degrees.Next we investigate the possibility that the 0.34d period isthe
binary orbital period since we have some evidence that the radialvelocity period is 0.34d. The mass function,f(M), with massesM1, the mass of the Be star andM2, the mass of the compact com-panion, given in solar masses, the orbital periodPorb in days andthe semi-amplitude of the radial velocity variation,K1, given in kms−1, is
f(M) =M3
2 sin i
(M1 + M2)2= (1.0361×10⁻⁷)(1 − e2)
3
2 K1Porb (2)
c© 2008 RAS, MNRAS000, 1–11

10 G.E. Sarty et al.
wheree is the eccentricity of the orbit (Hilditch 2001). Takinge =0, M1 = 11 M⊙, K1 = 22 km s−1 andi = 23◦ (assuming the Bespin axis and the orbital axis to be aligned) in Eq. 2 gives themassof the compact companion asM2 = 0.45 M⊙ for Porb = 0.34d.The semi-major axis of the orbit is given by Kepler’s law as
a =
(
P 2
orb4π2
G(M1 + M2)
)1
3
. (3)
UsingM2 = 0.45 M⊙ andPorb = 0.34d givesa = 4.6 R⊙. Sincethe radius of the Be star is 7±1 M⊙, the proposed orbit is clearlytoo small, so 0.34d cannot be the orbital period.
The mass and luminosity of LS I+61◦235 as given in Table 4put it in the middle of theβ Cep instability strip on the Hertzsprung-Russell diagram (Pamyatnykh 1999; Stankov & Handler 2005).Ina recent catalogue (Stankov & Handler 2005),β Cep stars are de-fined to be massive nonsupergiant variable stars with spectral typeO or B whose light, radial velocity and/or line profile variations arecaused by low-order pressure and gravity mode pulsations. For loworder radial modes the light curve and radial velocity will have thesame period. This is what appears here if we take the radial velocityperiod to be 0.34d. In that case the pulsation constant,Q, given by
Q = P
√
3M
4πR3(4)
whereP is the period andM andR are the mass and radius of thestar in solar units, is 0.03±0.01d, if the astrophysical parametersfrom Table 4 are used. The modalQ of knownβ Cep variables is0.033d (Stankov & Handler 2005) which corresponds to the radialfundamental mode.
If, between the two periods 0.34d and 0.67d, we take 0.34das the pulsation period, we can not interpret the 0.67d period as aharmonic due to a non-sinusoidal pulsation in time. Thus theinter-pretation of the 0.67d period as the Be star spin period with aspinaxis inclination of 23◦ may still hold. The combination of 0.34d be-ing a harmonic (or close to a harmonic) of the 0.67d period plus apulsation period of 0.34d would make the 0.34d period the promi-nent one, as observed, since two processes would contributing tothe light variation at that period. A simpler interpretation is that the0.34 radial velocity period is spurious and the 0.34d photometricperiod is simply a harmonic of the 0.67d period due to the non-sinusoidal shape of the 0.67d period. Further radial velocity datacan resolve this ambiguity. If the 0.10d period is due to pulsationand 0.34d is the fundamental mode, then it must be a higher orderp mode.
Finally, we speculate on the origin of the “super” X-ray out-bursts spaced at approximately 450d. The prograde period oftheone-armed density enhancement in the Be disk has been measuredto be approximately 1240d with some variability (Reig et al.2000).If we assume that the compact star also orbits in a prograde direc-tion (relative to the Be star spin) then we might expect a super out-burst to occur when the arm and the compact star line up. Giventhearm period of 1240d and an outburst (alignment) period of 450d,this means that the compact star’s orbital period is 330d in agree-ment with an expectation of about 300d from the Corbet spin-orbitrelation (Corbet 1986; Reig 2007). This conclusion is roughly con-sistent with the 184d period found in theRXTE ASM data whichwould be explained by the occurrence of X-ray bursts when thecompact star passed through the plane of the decretion disk.Thecause of the apparent 90d intervals between the minor outbursts, ifthese intervals are significant, is, however, not clear in this interpre-tation since the minor outbursts would have to occur four times per
orbit. Perhaps, if the orbit is sufficiently inclined to the Be disk, themass flow onto the neutron star will switch poles 90◦ in the orbitfrom the disk crossing nodes and this switch, through some asyetundetermined mechanism, could lead to a minor X-ray outburst.
An orbital period of 330d matches expectations from the Cor-bet spin-orbit relation but is it consistent with the X-ray luminosityof RX J0146.9+6121 and typical mass loss rates for Be stars? Basedon a distance of 2.5 kpc, Haberl et al. (1998) determined thatthe X-ray luminosity,Lx varies between2 × 1034 and2 × 1035 erg s−1.The X-ray lumiosity is related to the mass accretion rate,M2 ontothe neutron star through the conversion of gravitational potentialenergy to luminosity by
M2 =LxR2
GM2
(5)
where G is the gravitational constant and where we may takeR2 = 106 cm andM2 = 1.4 M⊙ to be the radius and mass ofthe neutron star. SoM2 is between2 × 10−12 and2 × 10−11 M⊙
yr−1. Following Frank, King & Raine (2002) we assume that massleaves the Be star at escape velocity and will be captured within acylindrical region that has an axis through the neutron starin thedirection of the relative wind velocity. Definingvw to be the windvelocity at a large distance from the Be star andvrel as the windvelocity relative to the neutron star, we havevw =
√2vcrit (the
escape velocity, see Eq. 1 for the definition ofvcrit) andvrel = vw
since the Keplerian velocity about the Be star at the neutronstardistance,a, is small relative tovw. So the cylindrical capture axisdirection would be essentially towards the Be star. The radius of thecylindrical capture region,racc, is where the kinetic energy of thewind equals the gravitational potential of the neutron star(Bondi1952),
racc =2GM2
v2rel
. (6)
The ratio of the emitted wind,−M1, to the captured wind,M2,mass flow rates is therefore
M2
−M1
=πr2
acc
4πa2(7)
where the binary separation,a, is given by Eq. 3. Ifvrel =√
2vcrit
then
M2
−M1
=1
4
(
M2
M1
)2 (
R1
a
)2
. (8)
For M1 = 11 M⊙, M2 = 1.4 M⊙ and an orbital period of 330d,a = 480 R⊙, and usingR1 = 7 R⊙ in Eq. 8 gives a ratio ofemitted to captured wind of10−6. So the inferred Be wind rate,−M1, would be between2 × 10−6 and2 × 10−5 M⊙ yr−1. Thisis consistent with Be mass outflow rates of∼10−6 M⊙ yr−1 seenobservationally and expected on theoretical grounds (Lamers et al.2000; Vink et al. 2000). However, we should also note that someobservational and theoretical studies have come to the conclusionthat the Be mass loss rate is much lower at10−9 to 10−8 M⊙ yr−1
(Waters et al. 1988; Haberl et al. 1998).
5 CONCLUSION
TheV band light curve of LS I+61◦235 shows three strong period-icities at 0.34d, 0.67d and 0.10d. In our interpretation, the 0.34dperiod may be from pulsation in the radial fundamental mode,the 0.68d period is the Be star spin period and the 0.10d period
c© 2008 RAS, MNRAS000, 1–11

Periodicities in RX J0146.9+6121 11
is a higher order p mode pulsation. The spin period, when com-bined with a previous determination of the astrophysical param-eters of the Be star, gives an inclination for the Be spin axisofi = 23 +10
−6 degrees. Comparing the latest catalogue ofβ Cep vari-ables (Stankov & Handler 2005) to the latest catalogue of GalacticHMXBs (Liu et al. 2006) reveals that LS I+61◦235 would be thefirst confirmedβ Cep member of a HMXB if subsequent observa-tions uphold these conclusions. The systemic radial velocity con-firms that LS I+61◦235 is a member of the cluster NGC 663. If weinterpret that the X-ray “super” outbursts happen when the compactstar lines up with the one-armed Be decretion disk enhancement,then the orbital period is approximately 330d. This orbitalperiodagrees with the value expected from the Corbet spin-orbit relation(Corbet 1986; Reig 2007).
The variability of theIC light curve looks to be similar to thevariability of theV band light curve and there may be some vari-ability in B − V colour. More observations are needed to investi-gate these possible colour variations which should exist ifpulsationis present.
ACKNOWLEDGEMENTS
GES is supported by a discovery grant from the Natural Sciencesand Engineering Research Council of Canada (NSERC). Thanksto R. Sordo for providing the template spectra. Thanks to S.C. Or-lando for his two photometric data points and a discussion ofcom-parison star variability. Many thanks to Arne Henden for there-duced SRO data used to define the comparison stars. The assis-tance of AAVSO staff members Aaron Price, Matt Templeton andElizabeth Wagner in coordinating alert notices and accommodat-ing the HMXB observing project are greatly appreciated. Thanksto Dmitry Monin for observing support with the DAO telescope.The Digitized Sky Surveys used to produce Fig. 1 were producedat the Space Telescope Science Institute under U.S. Governmentgrant NAG W-2166. The images of these surveys are based on pho-tographic data obtained using the Oschin Schmidt TelescopeonPalomar Mountain and the UK Schmidt Telescope. The plates wereprocessed into the present compressed digital form with thepermis-sion of these institutions. The 30-cm telescopes used by observerHUZ were provided by the Department of Physics and Engineer-ing Physics at the University of Saskatchewan and are primarilymaintained by Stan Shadick.
REFERENCES
Balona L.A., 1990, MNRAS, 245, 92Bondi H., 1952, MNRAS, 112, 195Chauville J., Zorec J., Ballereau D., Morrell N., Cidale L.,GarciaA., 2001, A&A, 378, 861
Coe M.J., Everall C., Norton A.J., Roche P., Unger S.J., FabregatJ., Reglero V., Grunsfeld J.M., 1993, MNRAS, 261, 599
Corbet R.H.D., 1986, MNRAS, 220, 1047Crawford D.L., 1978, ApJ, 83, 48Domiciano de Souza A., Kervella P., Jankov S., Abe L., VakiliF.,di Folco E., Paresce F., 2003, A&A, 407, L47
Fabregat J., Torrejon J.M., 2000, A&A, 357, 451Frank J., King A., Raine D., 2002, Accretion Power in Astro-physics, Cambridge University Press
Haberl F., 1995, A&A, 296, 685Haberl F., Angelini L., Motch C., 1998, A&A, 189, 147
Hilditch R.W., 2001, An Introduction to Close Binary Stars,Cam-bridge University Press
Lamers H.J.G.L.M., Nugis T., Vink J.S., de Koter A., 2000, ASPConf Ser, 204, 395
Lee U., Saio H., Osaki Y., 1991, MNRAS, 250, 432Lenz P., Breger M., 2005, CoAst, 146, 53Levine A.M., Brandt N., Cui W., Jernigan J.G., Morgan E.H.,Remillard R., Shirey R.E., Smith D.A., 1996, ApJ, 469, L33
Liu T., Janes K.A., Bania T.M., 1989, AJ, 98, 626Liu T., Janes K.A., Bania T.M., 1991, AJ, 102, 1103Liu Q.Z., van Paradijs J., van den Heuvel E.P.J., 2006, A&A, 455,1165
Lomb N.R., 1976, ApSS, 39, 447Lopes de Oliveira R., Motch C., Haberl F., Negueruela I., Janot-Pacheco E., 2006, Adv.Sp.Res. 38, 2782
Mereghetti S., Tiengo A., Israel G.L., Stella L., 2000, A&A,354,567
Mermilliod J.C., Mayor M., Udry S., 2008, A&A, 485, 303Motch C., et al., 1991, A&A, 246, L24Munari U., Sordo R., Castelli F., Zwitter T., 2005, A&A, 449,687Okazaki A.T., 1991, PASJ, 43, 75Okazaki A.T., 1997, A&A, 318, 548Okazaki A.T., 2001, A&A, 377, 161Papaloizou J.C., Savonije G.J., Henrichs H.F., 1992, A&A, 265,L45
Pamyatnykh A.A., 1999, Acta Astronomica, 49, 119Pfahl E., Rappaport S., Podsiadlowski P., Spruit H., 2002, ApJ,574, 364
Pigulski A., Kopacki G., Kolaczkowski Z., 2001, A&A, 376, 144Podsiadlowski P., Langer N., Poelarends A.J.T., RappaportS.,Heger A., Pfahl E., 2004, ApJ, 612, 1044
Reig P., Fabregat J., Coe M.J., Roche P., Chakrabarty D., Negueru-ela I., Steele I., 1997, A&A, 322, 183
Reig P., Roche P., 1999, MNRAS, 306, 100Reig P., Negueruela I., Coe J., Fabregat J., Tarasov A.E., ZamanovR.K., 2000, MNRAS, 317, 205
Reig P., 2007, MNRAS, 377, 867Sarty GE, Kiss LL, Johnston HM, Huziak R, Wu K, 2007,JAAVSO (eJAAVSO preprint number 56)
Savonije G.J., Heemskerk M.H.M., 1993, A&A, 276, 409Scargle J.D., 1982, ApJ, 263, 835Stankov A., Handler G., 2005, ApJS, 158, 193Stellingwerf R.F., 1978, ApJ, 224, 953Tapia M., Costero R., Echevarrıa J., Roth M., 1991, MNRAS, 253,649
Vink J.S., de Koter A., Lamers H.J.G.L.M., 2000, A&A, 362, 295Waters L.B.F.M., Taylor A.R., van den Heuvel E.P.J., HabetsG.M.H.J., Persi P., 1988, A&A, 198, 200
c© 2008 RAS, MNRAS000, 1–11