Biodegradable Microfabricated Plug-Filters for Glaucoma Drainage Devices
Upload
khangminh22Category
view
2download
0
Performance of Pilot Scale Plug Flow Microbial Fuel
Cell for Sustainable Wastewater Treatment and
Energy Recovery
Ourania Dimou
Submitted for the degree of Doctor of Philosophy
Heriot-Watt University
Institute of Mechanical, Process and Energy Engineering
School of Engineering and Physical Sciences
March 2017
The copyright in this thesis is owned by the author. Any quotation from the
thesis or use of any of the information contained in it must acknowledge this
thesis as the source of the quotation or information.
i
Abstract
Wastewater is increasingly considered a resource rather than a problem. This study
investigates the rapidly developing Microbial Fuel Cell technology and its potential to be
used in an industrial scale and environment in the context of the whisky industry and to
be used as an alternative or complementary sustainable wastewater treatment process.
This study describes the development of a 122 litre multi-electrode open air cathode
Microbial Fuel Cell. Throughout this study the reactor’s performance is assessed on two
levels; energy recovery and effluent quality.
During initial studies the principle of the MFC’s ability to treat whisky distillation by-
products was established. The reactor was operated directly on diluted spent wash in
ambient Scottish temperatures. During successful start-up, no correlation was found to
temperature. During long-term operation, a positive correlation was found between
temperature and the positive energy balance achieved by the MFC while tCOD removal
efficiency was maintained at approximately 83 %. The reactor was further optimised in
regards to electrical connections, thus its electrical performance which was also validated
through a bench scale study.
The successful initial experiments led to the integration of an operationally optimised
pilot study in a local whisky distillery. The pilot set-up was successfully operated
complementary to an anaerobic digester for over one year in the industrial environment
achieving energy savings and a sustainable tCOD removal efficiency of over 80 %.
Latterly, a simplified electrochemical model was examined to describe the performance
of the MFC to be further developed.
This study concludes that the nature of industrial wastewater treatment is a complex
subject and equally so is the multi-disciplinary MFC technology. The MFC developed for
this study and the industrial experience gained contributes towards a more sustainable,
energy saving and efficient treatment technology with the potential to be used
complementary to existing technologies.

ii
Acknowledgments
I have to admit that during the last 4 years that I have been working on my PhD one of
the thoughts that kept me going was this very final moment. The moment I am writing
the Acknowledgments section of my thesis. I have dreamed about this moment, yet the
reality of it is even more overwhelming than expected. I wouldn’t have made it to this
day if it weren’t for the help, guidance and sometimes unconditional support of others.
There are so many people that I now have the opportunity and joy to thank.
First of all, the greatest acknowledgment should go to my supervisor Alan Harper for his
help, guidance and advice. He was the one person that believed in me already during my
masters’ studies and I am very well aware that with his support, both academic and moral,
and scientific insight I was able to make it to this point. I would also like to extend my
acknowledgments to my other supervisors, Dr. John Andresen of Heriot-Watt University
and Professor Igor Goryanin of University of Edinburgh, for their support and help during
the last four years.
This PhD project was a collaboration between Heriot-Watt University, myself and an
industrial partner. I would therefore like to express my gratitude to the Energy
Technology Partnership (ETP) and MPower World Ltd for their financial, scientific and
moral support. Especially, I would like to thank David J. Simpson and Vyacheslav
(Slava) Fedorovich for the exchange of invaluable scientific knowledge and their help in
moving everything from theory to practise. I would also like to extend a great thank you
to the North British Distillery Ltd. in Edinburgh for providing raw material for my study
and latterly, providing a home for my MFC and helping me take my research to the next
level. Special thanks to Alistair Murphy and Brynjar Olafsson for their support to my
project, and Steven Anderson for always providing a helping hand.
However, my first experiment back in my masters’ days would have never happened and
I would still be trying to figure out how a pipette works if it weren’t for Eileen McEvoy,
the heart and soul of the Heriot-Watt bio-laboratories. Eileen, I would like to thank you
for your support and most importantly for your friendship and moral guidance during
some of the most challenging times of my life, both personally and professionally. I
would also like to thank all the technicians in the Mechanical Engineering laboratories of
Heriot-Watt University for their help but, I would specifically like to thank Richard
Kinsella for sharing so many rides back and forth to the North British Distillery with me
and most importantly for his friendship and advice.

iii
Dr. Amanda Hughes, Dr. Dalila Capão and Gregor Sneddon deserve a great thank you
for introducing me to one of the greatest achievements of civilisation, the Krispy
Kreme®. I would also like to thank Dr. Alan Faulkner-Jones, Dr. Marius Dewar and
Chris Balmer (aka Justin) for their friendship and sharing an office and arguably some
frustration during these 4 years. I would also like to thank Mirte for helping me in a very
critical point in my life.
I would like to take this moment to thank my best and closest friends from the bottom of
my heart for sticking with me through it all, and to officially apologise for the (slightly)
horrible person that I (might) have been from time to time. Argiro, the woman of my life,
Iliana, Todor (yes, this is how you will go down in history), Eli, Meriç, Kostas, Rosario,
Alex, Isadora and Victoria. Thank you, so much, so greatly much for sharing your lives
with me.
Last but not least, I would like to thank my family. My father Tolios, the most popular
guy (I am sure he knows what I mean), my sister Nikolina whom I love so greatly much
and finally my mother Tasoula (Dr. Anastasia Kambamanoli). I do not have the faintest
idea how I would have ever made it without you. You are my rock and I hope you know
how deeply grateful I am for your support.
Ourania Dimou
October 2016
“And once the storm is over you won’t remember how you made it through, how you
managed to survive. You won’t even be sure, in fact, whether the storm is really over.
But one thing is certain. When you come out of the storm you won’t be the same person
who walked in. That’s what this storm’s all about.”
- Haruki Murakami, Kafka on the shore, 2005

iv
ACADEMIC REGISTRY Research Thesis Submission
Name:
School:
Version: (i.e. First,
Resubmission, Final) Degree Sought:
Declaration In accordance with the appropriate regulations I hereby submit my thesis and I declare that:
1) the thesis embodies the results of my own work and has been composed by myself 2) where appropriate, I have made acknowledgement of the work of others and have made
reference to work carried out in collaboration with other persons 3) the thesis is the correct version of the thesis for submission and is the same version as any
electronic versions submitted*. 4) my thesis for the award referred to, deposited in the Heriot-Watt University Library, should
be made available for loan or photocopying and be available via the Institutional Repository, subject to such conditions as the Librarian may require
5) I understand that as a student of the University I am required to abide by the Regulations of the University and to conform to its discipline.
6) I confirm that the thesis has been verified against plagiarism via an approved plagiarism detection application e.g. Turnitin.
* Please note that it is the responsibility of the candidate to ensure that the correct version
of the thesis is submitted.
Signature of Candidate:
Date:
Submission Submitted By (name in capitals):
Signature of Individual Submitting:
Date Submitted:
For Completion in the Student Service Centre (SSC) Received in the SSC by (name in
capitals):
1.1 Method of Submission (Handed in to SSC; posted through internal/external mail):
1.2 E-thesis Submitted (mandatory
for final theses)
Signature:
Date:
v
Nomenclature
AD Anaerobic Digestion
ADLD Anaerobic Digestion Liquid Digestate
AEM Anion Exchange Membrane
BOD Biochemical Oxygen Demand
CCV Closed Circuit Voltage
CE Coulombic Efficiency
CEM Cation Exchange Membrane
COD Chemical Oxygen Demand
EU European Union
HRT Hydraulic Retention Time
IEM Ion Exchange Membrane
MEC Microbial Electrolysis Cell
MET Microbial Electrolysis Technologies
MFC Microbial Fuel Cell
NER Normalised Energy Recovery
NR Neutral Red
OCV Open Circuit Voltage
OLR Organic Loading Rate
PFSA Perfluorosulfonic Acid
PVC Polyvinyl Chloride
tCOD Total Chemical Oxygen Demand
tSS Total Suspended Solids
TVS Total Volatile Solids
UNEP United Nations Environment Programme
UN United Nations
VFA Volatile Fatty Acid
vi
Acknowledgment of contributions
Alan Harper provided guidance with experimental work and revision to all manuscripts.
Dr. John Andresen provided guidance with experimental tools and methods and
interpretation of experimental results.
David J. Simpson provided assistance in MFC construction and guidance on theoretical
background of MFC technology.
Ioannis Katsifarakis provided the 3-dimentional designs of the 122L prototype MFC
presented in Chapter 3.2.
Tatyana Peshkur of Scottish Environmental Technology Network (SETN) of University
of Strathclyde (later Strathclyde Eco Innovation Unit-SEIU) for assistance on wastewater
quality methods and analysis performed in Chapter 5.3.8.
vii
Table of Contents
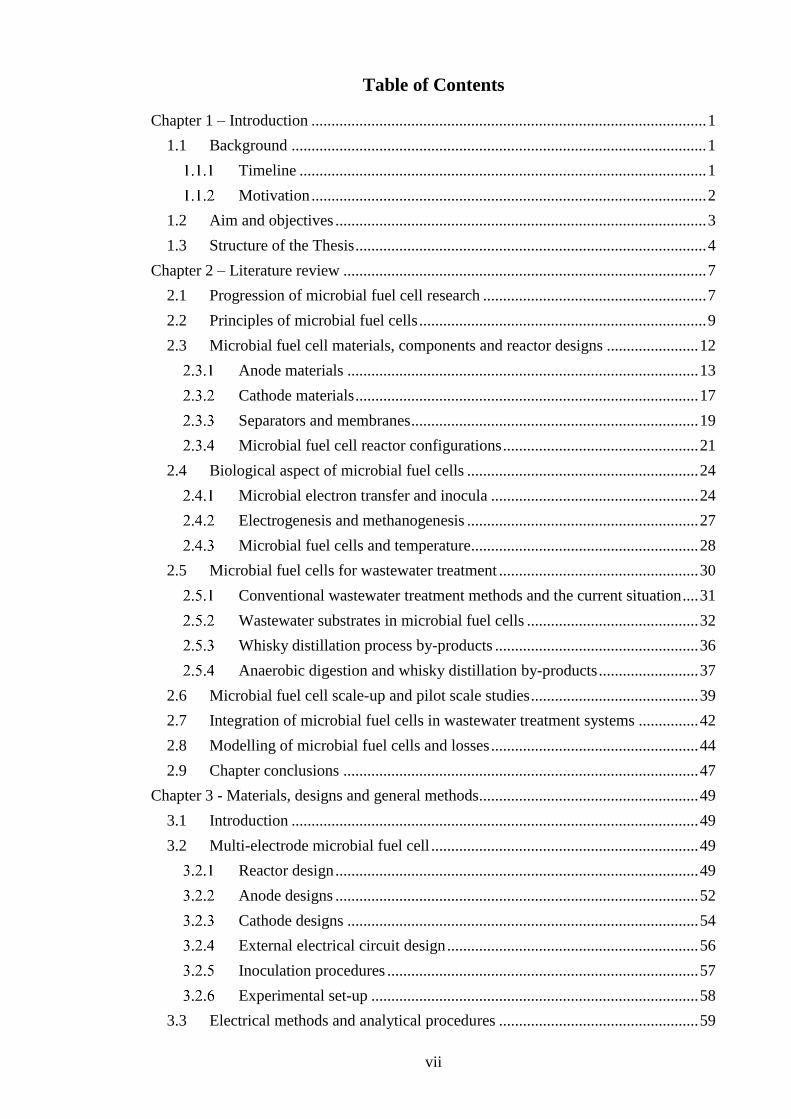
Chapter 1 – Introduction ................................................................................................... 1
1.1 Background ........................................................................................................ 1
Timeline ...................................................................................................... 1
Motivation ................................................................................................... 2
1.2 Aim and objectives ............................................................................................. 3
1.3 Structure of the Thesis ........................................................................................ 4
Chapter 2 – Literature review ........................................................................................... 7
2.1 Progression of microbial fuel cell research ........................................................ 7
2.2 Principles of microbial fuel cells ........................................................................ 9
2.3 Microbial fuel cell materials, components and reactor designs ....................... 12
Anode materials ........................................................................................ 13
Cathode materials ...................................................................................... 17
Separators and membranes ........................................................................ 19
Microbial fuel cell reactor configurations ................................................. 21
2.4 Biological aspect of microbial fuel cells .......................................................... 24
Microbial electron transfer and inocula .................................................... 24
Electrogenesis and methanogenesis .......................................................... 27
Microbial fuel cells and temperature......................................................... 28
2.5 Microbial fuel cells for wastewater treatment .................................................. 30
Conventional wastewater treatment methods and the current situation .... 31
Wastewater substrates in microbial fuel cells ........................................... 32
Whisky distillation process by-products ................................................... 36
Anaerobic digestion and whisky distillation by-products ......................... 37
2.6 Microbial fuel cell scale-up and pilot scale studies .......................................... 39
2.7 Integration of microbial fuel cells in wastewater treatment systems ............... 42
2.8 Modelling of microbial fuel cells and losses .................................................... 44
2.9 Chapter conclusions ......................................................................................... 47
Chapter 3 - Materials, designs and general methods....................................................... 49
3.1 Introduction ...................................................................................................... 49
3.2 Multi-electrode microbial fuel cell ................................................................... 49
Reactor design ........................................................................................... 49
Anode designs ........................................................................................... 52
Cathode designs ........................................................................................ 54
External electrical circuit design ............................................................... 56
Inoculation procedures .............................................................................. 57
Experimental set-up .................................................................................. 58
3.3 Electrical methods and analytical procedures .................................................. 59
viii
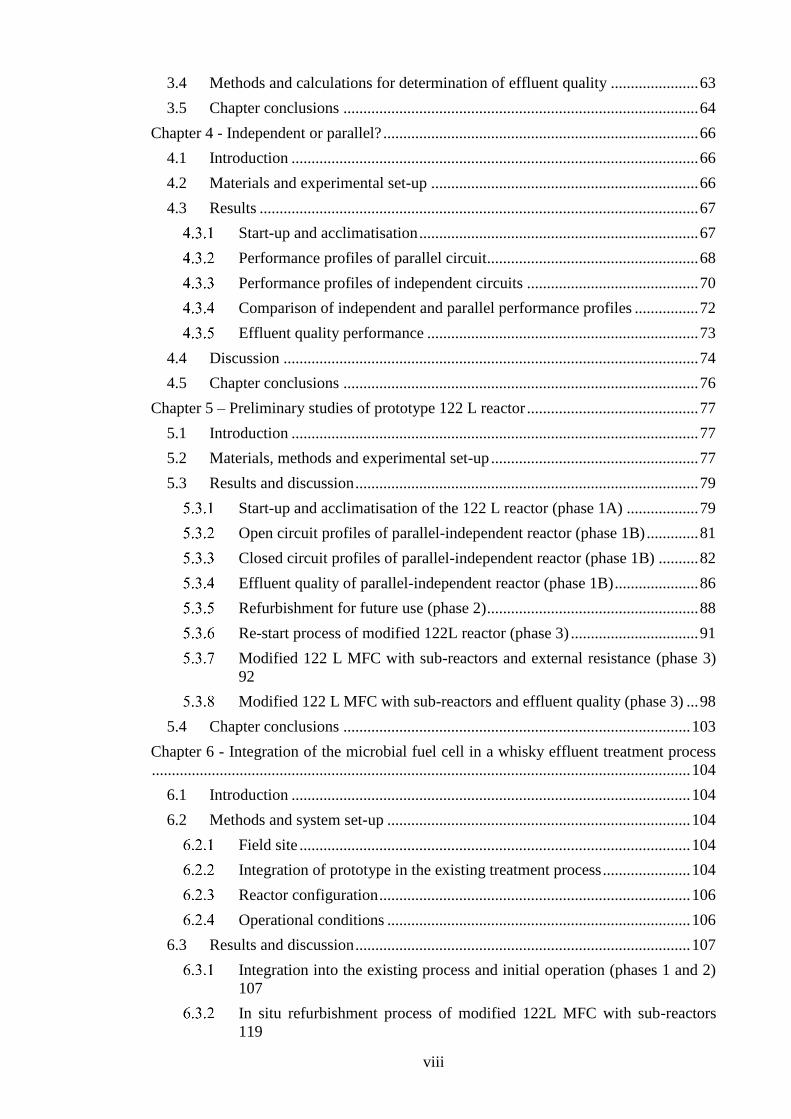
3.4 Methods and calculations for determination of effluent quality ...................... 63
3.5 Chapter conclusions ......................................................................................... 64
Chapter 4 - Independent or parallel? ............................................................................... 66
4.1 Introduction ...................................................................................................... 66
4.2 Materials and experimental set-up ................................................................... 66
4.3 Results .............................................................................................................. 67
Start-up and acclimatisation ...................................................................... 67
Performance profiles of parallel circuit..................................................... 68
Performance profiles of independent circuits ........................................... 70
Comparison of independent and parallel performance profiles ................ 72
Effluent quality performance .................................................................... 73
4.4 Discussion ........................................................................................................ 74
4.5 Chapter conclusions ......................................................................................... 76
Chapter 5 – Preliminary studies of prototype 122 L reactor ........................................... 77
5.1 Introduction ...................................................................................................... 77
5.2 Materials, methods and experimental set-up .................................................... 77
5.3 Results and discussion ...................................................................................... 79
Start-up and acclimatisation of the 122 L reactor (phase 1A) .................. 79
Open circuit profiles of parallel-independent reactor (phase 1B) ............. 81
Closed circuit profiles of parallel-independent reactor (phase 1B) .......... 82
Effluent quality of parallel-independent reactor (phase 1B) ..................... 86
Refurbishment for future use (phase 2) ..................................................... 88
Re-start process of modified 122L reactor (phase 3) ................................ 91
Modified 122 L MFC with sub-reactors and external resistance (phase 3)
92
Modified 122 L MFC with sub-reactors and effluent quality (phase 3) ... 98
5.4 Chapter conclusions ....................................................................................... 103
Chapter 6 - Integration of the microbial fuel cell in a whisky effluent treatment process
....................................................................................................................................... 104
6.1 Introduction .................................................................................................... 104
6.2 Methods and system set-up ............................................................................ 104
Field site .................................................................................................. 104
Integration of prototype in the existing treatment process ...................... 104
Reactor configuration .............................................................................. 106
Operational conditions ............................................................................ 106
6.3 Results and discussion .................................................................................... 107
Integration into the existing process and initial operation (phases 1 and 2)
107
In situ refurbishment process of modified 122L MFC with sub-reactors
119
ix
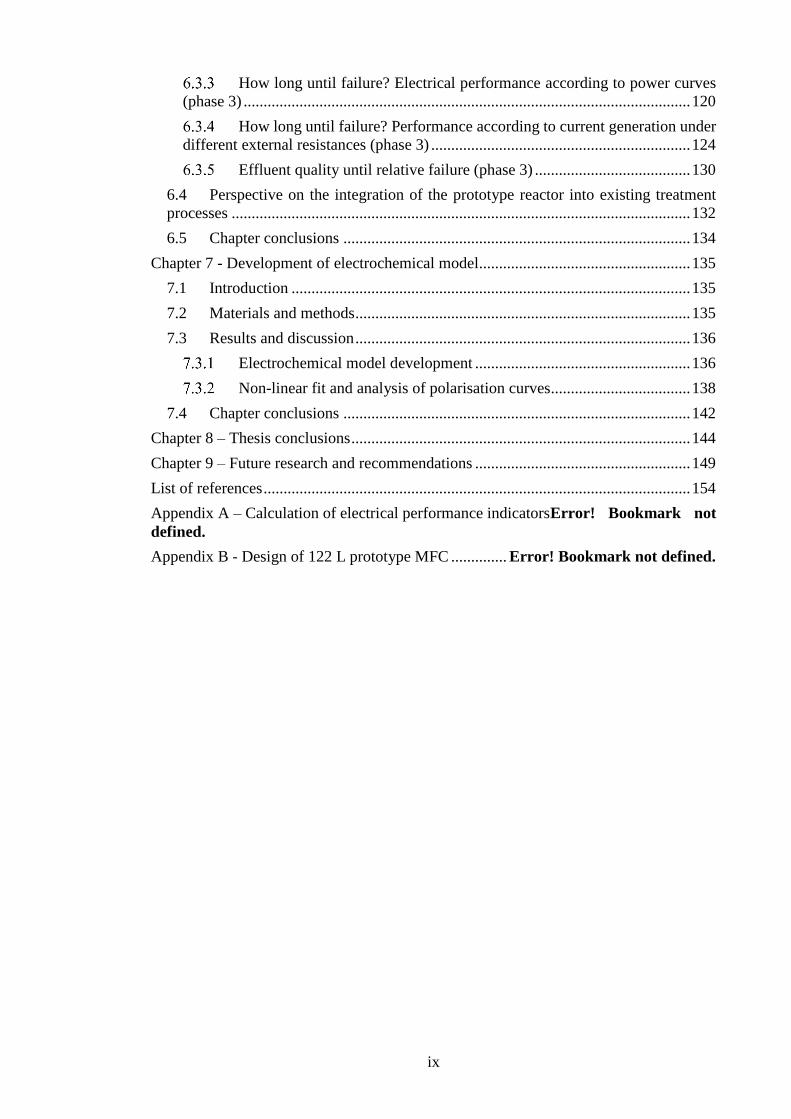
How long until failure? Electrical performance according to power curves
(phase 3) ................................................................................................................ 120
How long until failure? Performance according to current generation under
different external resistances (phase 3) ................................................................. 124
Effluent quality until relative failure (phase 3) ....................................... 130
6.4 Perspective on the integration of the prototype reactor into existing treatment
processes ................................................................................................................... 132
6.5 Chapter conclusions ....................................................................................... 134
Chapter 7 - Development of electrochemical model..................................................... 135
7.1 Introduction .................................................................................................... 135
7.2 Materials and methods .................................................................................... 135
7.3 Results and discussion .................................................................................... 136
Electrochemical model development ...................................................... 136
Non-linear fit and analysis of polarisation curves................................... 138
7.4 Chapter conclusions ....................................................................................... 142
Chapter 8 – Thesis conclusions ..................................................................................... 144
Chapter 9 – Future research and recommendations ...................................................... 149
List of references ........................................................................................................... 154
Appendix A – Calculation of electrical performance indicatorsError! Bookmark not
defined.
Appendix B - Design of 122 L prototype MFC .............. Error! Bookmark not defined.
x
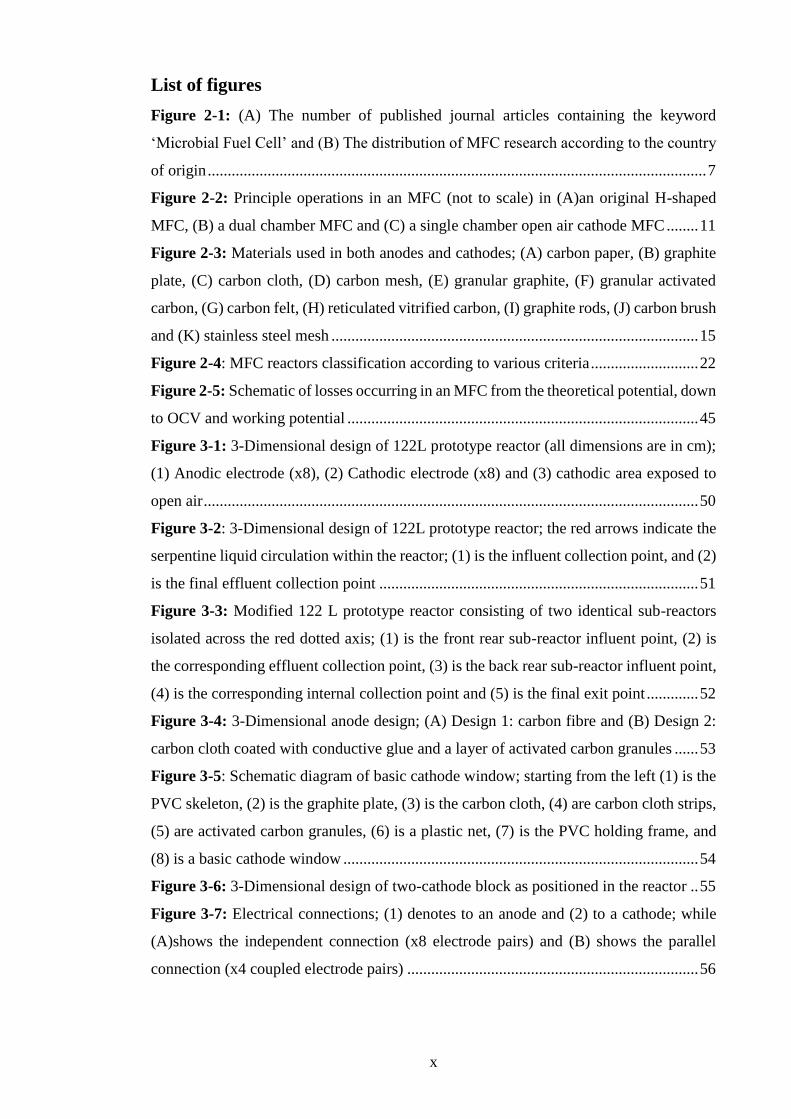
List of figures
Figure 2-1: (A) The number of published journal articles containing the keyword
‘Microbial Fuel Cell’ and (B) The distribution of MFC research according to the country
of origin ............................................................................................................................. 7
Figure 2-2: Principle operations in an MFC (not to scale) in (A)an original H-shaped
MFC, (B) a dual chamber MFC and (C) a single chamber open air cathode MFC ........ 11
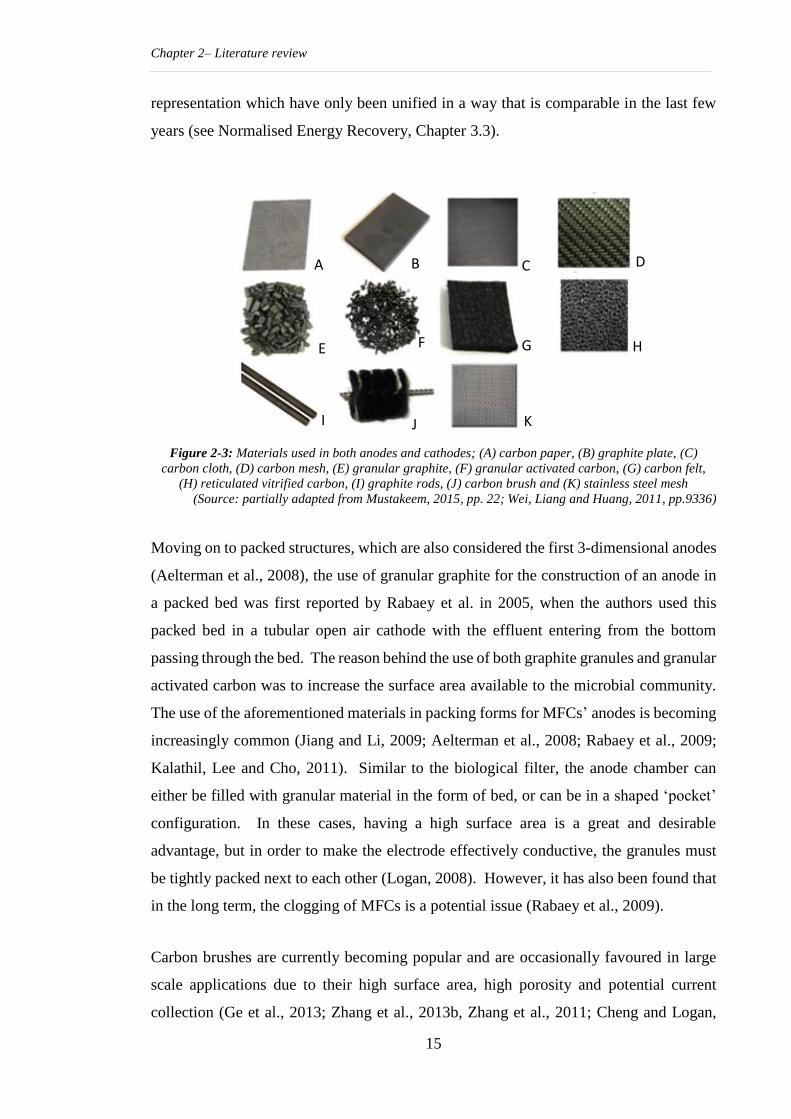
Figure 2-3: Materials used in both anodes and cathodes; (A) carbon paper, (B) graphite
plate, (C) carbon cloth, (D) carbon mesh, (E) granular graphite, (F) granular activated
carbon, (G) carbon felt, (H) reticulated vitrified carbon, (I) graphite rods, (J) carbon brush
and (K) stainless steel mesh ............................................................................................ 15
Figure 2-4: MFC reactors classification according to various criteria ........................... 22
Figure 2-5: Schematic of losses occurring in an MFC from the theoretical potential, down
to OCV and working potential ........................................................................................ 45
Figure 3-1: 3-Dimensional design of 122L prototype reactor (all dimensions are in cm);
(1) Anodic electrode (x8), (2) Cathodic electrode (x8) and (3) cathodic area exposed to
open air ............................................................................................................................ 50
Figure 3-2: 3-Dimensional design of 122L prototype reactor; the red arrows indicate the
serpentine liquid circulation within the reactor; (1) is the influent collection point, and (2)
is the final effluent collection point ................................................................................ 51
Figure 3-3: Modified 122 L prototype reactor consisting of two identical sub-reactors
isolated across the red dotted axis; (1) is the front rear sub-reactor influent point, (2) is
the corresponding effluent collection point, (3) is the back rear sub-reactor influent point,
(4) is the corresponding internal collection point and (5) is the final exit point ............. 52
Figure 3-4: 3-Dimensional anode design; (A) Design 1: carbon fibre and (B) Design 2:
carbon cloth coated with conductive glue and a layer of activated carbon granules ...... 53
Figure 3-5: Schematic diagram of basic cathode window; starting from the left (1) is the
PVC skeleton, (2) is the graphite plate, (3) is the carbon cloth, (4) are carbon cloth strips,
(5) are activated carbon granules, (6) is a plastic net, (7) is the PVC holding frame, and
(8) is a basic cathode window ......................................................................................... 54
Figure 3-6: 3-Dimensional design of two-cathode block as positioned in the reactor .. 55
Figure 3-7: Electrical connections; (1) denotes to an anode and (2) to a cathode; while
(A)shows the independent connection (x8 electrode pairs) and (B) shows the parallel
connection (x4 coupled electrode pairs) ......................................................................... 56
xi
Figure 3-8: Schematic diagram of equivalent electrical circuits; (A) independent
electrode circuits (x8 electrode pairs) and (B) in parallel connected circuits (x4 electrode
pairs) ................................................................................................................................ 56
Figure 3-9: Schematic diagram of the 122 L reactor experimental set-up..................... 58
Figure 4-1:Open circuit voltage during start-up of the 14L prototype reactor .............. 68
Figure 4-2: Polarisation curve for 14 L prototype reactor ............................................. 69
Figure 4-3: Current generation under various external resistances on parallel electrical
connection ....................................................................................................................... 69
Figure 4-4: Power generation under various external resistances on parallel electrical
connection ....................................................................................................................... 70
Figure 4-5: Polarisation curves for independent electrode connections of 14 L for (A)
electrode R(10)1 and (B)electrode R(10)2 ........................................................................... 71
Figure 4-6: Power generation of independent electrode connections R(10)1 and R(10)2 .. 71
Figure 4-7: Comparison of power generation between the independent and the parallel
electrode connection according to (A) the maximum values obtained by polarisation
curves and (B) the average operational values ................................................................ 72
Figure 4-8: tCOD influent and effluent values and percentage of removal efficiency of
14 L prototype ................................................................................................................. 74
Figure 5-1: Sampling points for phases 1A and 1B; (1) influent sample, (2) effluent
sample (both monitored for tCOD) and red bullet points for temperature and pH ......... 78
Figure 5-2: Open circuit voltage during start-up period of 122L reactor with independent
electrical connections ...................................................................................................... 80
Figure 5-3: Correlation between average open circuit voltage of 122L reactor and
temperature ...................................................................................................................... 81
Figure 5-4: Open circuit voltage of four electrodes of 122 L reactor after the introduction
of parallel connections .................................................................................................... 82
Figure 5-5: Closed circuit current generation of four independent electrodes of 122 L
reactor at Rext=1 Ω .......................................................................................................... 83
Figure 5-6: Operational NER against temperature in the 122 L reactor ........................ 86
Figure 5-7:tCOD performance throughout the overall period of examination .............. 87
Figure 5-8: Influent and effluent pH values throughout the overall examination period
......................................................................................................................................... 88
Figure 5-9: Example of cathode condition due to biofouling at the point of refurbishment;
(A) greatly affected membrane and (B) healthy membrane with minimum fouling ...... 90
xii
Figure 5-10: Open circuit voltage during re-start of sub-reactors after modifications and
refurbishment for (A) MFCR1+R2 and (B) MFCR3+R4 ....................................................... 91
Figure 5-11: Current generation under various external resistances (100, 50 and 25Ω)
and HRTs (4 days and 1 day) for (A) MFCR1+R2 and (B) MFCR3+R4 .............................. 93
Figure 5-12: Power production over time for various external resistances (100, 50 and
25Ω) and HRTs (4 days and 1 day) for (A) MFCR1+R2 and (B) MFCR3+R4 ..................... 94
Figure 5-13: tCOD profile for sub-reactors MFCR1+R2 and MFCR3+R4 (the dashed line
indicates the point of HRT change from 4 days to 1 day) .............................................. 99
Figure 6-1: Photograph of the pilot installation in situ at the North British Distillery
wastewater treatment plant ............................................................................................ 105
Figure 6-2: Schematic diagram of reactors integrated in the existing wastewater
treatment plant at North British Distillery .................................................................... 105
Figure 6-3: Open circuit voltages of 122 L MFCR1-R4 reactor over time (the dashed line
indicates the change from HRT of 4days to 1 day) ....................................................... 108
Figure 6-4: Closed circuit voltages of 122 L MFCR1-R4 at 500Ω external resistance reactor
over time (the dashed line indicates the change from HRT of 4 days to 1 day) ........... 109
Figure 6-5: Open circuit voltage of 122 L MFCR5-R8 reactor over time ....................... 110
Figure 6-6: Closed circuit voltage of 122 L MFCR5-R8 reactor at 500Ω over time ...... 111
Figure 6-7: tCOD performance for HRT=4 days for MFCR1-R4 .................................. 115
Figure 6-8: tCOD performance for HRT=4 days for MFCR5-R8 .................................. 116
Figure 6-9: tCOD performance at HRT=1 day MFCR1-R4 ........................................... 117
Figure 6-10: tCOD performance for HRT=1 day for MFCR5-R8 .................................. 117
Figure 6-11: Total suspended solids during (A) phase 1 and (B) phase 2 ................... 118
Figure 6-12: Comparison of anode potential over current of (A) R1 vs R3 and (B) R2 vs
R4 ................................................................................................................................... 121
Figure 6-13:0 and 6 months’ deterioration in performance according to power curves for
each electrode ................................................................................................................ 123
Figure 6-14:Power output of the two 122 L reactors presented at a sub-reactor level; (A)
sub-reactors MFCR1+R2 and MFCR3+R4 and (B) sub-reactors MFCR5+R6 and MFCR7+R8 125
Figure 6-15: Comparative power performance of the four MFC sub-reactors according
to polarisation data at 0 months and 6 months and performance under Rext=10 Ω and
Rext=22 Ω ...................................................................................................................... 127
Figure 6-16: Influent and effluent tCOD concentrations during phase 3 for (A) sub-
reactors MFCR1+R2 and MFCR3+R4 and (B) MFCR5+R6 and MFCR7+R8 ........................... 132

xiii
Figure 7-1: Anodic and cathodic potential profile over time when applying the current
interrupt method to determine ohmic resistance of the electrode ................................. 135
Figure 7-2: Non-linear fit of polarisation curve for electrodes (A): R3, (B): R4, (C): R5,
(D): R6, (E): R7 and (F): R8 as generated by OriginPro ................................................ 139
xiv
List of tables
Table 2-1: Example of various Microbial Electrochemical Technologies (METs) ......... 9
Table 2-2: Various real wastewater substrates used in MFC studies and the respective
reactor designs ................................................................................................................. 35
Table 2-3: Characteristics of untreated and anaerobically treated distillery effluent ..... 38
Table 2-4: Summary of volume, substrate and operational conditions for large scale
reactors operating on real wastewater as reported in the literature ................................. 42
Table 4-1: Summary of effluent quality parameters during the two operational regimes
......................................................................................................................................... 74
Table 5-1: Experimental parameters during phase 3 for sub-reactors MFCR1+R2 and
MFCR3+R4 ......................................................................................................................... 79
Table 5-2: Average electric performance of each electrode and of the 122 L reactor as an
overall .............................................................................................................................. 84
Table 5-3: Summary of electrical performance and energy balance for MFCR1+R2 and
MFCR3+R4 at various external resistances and HRT regimes .......................................... 96
Table 5-4: PH and electrical conductivity values on a 10-day basis throughout the period
of 60 days for MFCR1+R2 and MFCR3+R4 ....................................................................... 101
Table 5-5: MFC R1+R2 chemical analysis on a 10-day basis throughout the period of 60
days ............................................................................................................................... 102
Table 5-6: MFC R3+R4 chemical analysis on a 10-day basis throughout the period of 60
days ............................................................................................................................... 102
Table 6-1: Changes in the average values for conductivity and pH for both reactors . 114
Table 6-2: Summary of coulombic efficiency, tCOD removal efficiency, NER and
energy balance ............................................................................................................... 129
Table 6-3: Summary of effluent quality for the four sub-reactors (average values) until
relative failure ............................................................................................................... 130
Table 7-1: Ohmic resistance (Ω) for each electrode as generated by OriginPro .......... 138
Table 7-2: Average ohmic resistance (Ω) and respective standard deviation .............. 140
Table 7-3: Ratio between experimentally and model derived ohmic resistance .......... 140
1
Chapter 1 – Introduction
1.1 Background
The subject of increasing interest recently, a Microbial Fuel Cell can be defined as a
bioreactor which has the ability to harness chemical energy and convert it directly into
electrical. At its core an MFC is a fuel cell; however, its distinction lies the fact that, as
implied by its name, a Microbial Fuel Cell utilises the metabolic reactions of
electrochemically active microorganisms to harness the chemical energy contained in
organic compounds.
Timeline
The ability of microorganisms to directly convert chemical energy into electrical is not a
new concept in the scientific world. In 1911, M.C. Potter, a Professor of Botany at
Durham University, UK, was the first to report on the occurrence of a difference of
potential between electrodes immersed in bacterial or yeast cultures and in a sterile
medium in a battery-type setup. Potter concluded that electric energy in the form of
electrons can be liberated during the decomposition of organic compounds by
microorganisms (Potter, 1911). Almost twenty years later, B. Cohen verified Potter’s
results by adding to his work, delivering a stacked configuration that achieved a voltage
of 35 V at a 0.2 mA current; however, he also discussed the major disadvantage of a very
low current which was also rapidly discharged (Cohen, 1930).
It was only during the 1960s that the idea was revisited, this time by the National
Aeronautics and Space Administration (NASA) in the USA. The purpose of their
investigation was to explore the feasibility of using microbial fuel cells for the recycling
of human waste into electricity during the space flights and in space shuttles. The life of
the investigation was short, mostly due to the rapid development of competing
technologies, which were more efficient and better understood (Canfield, Goldner and
Lutwack, 1963). The relative failure of this attempt along with low oil prices,
underestimation of the issue of climate change, and the popularity of fossil fuels at the
time, led to the abandonment of this field of study.
Microbial fuel cells were revived and brought back into focus mostly due to the work of
R.M. Allen and H.P. Bennetto during the 1990s at King’s College, London, UK, who
developed a quite different, more socially-orientated approach to the topic. These authors
Chapter 1- Introduction
2
believed in the utilisation of MFC technology as a solution to sanitary issues in areas of
the globe then known as the ‘third world’ (Allen and Bennetto, 1993). It was around that
time that MFCs were also examined in the field of robotics, when Wilkinson introduced
the ‘Gastrobots’, a self-sustaining (self-powered) robot (Wilkinson, 2000).
The breakthrough moment in the field should be considered to be the discovery of
exoelectrogens, which are microorganisms that do not require the addition of a mediator
but can transfer electrons themselves through various mechanisms (Kim et al., 1999).
Until that discovery, MFC technology faced some major issues which minimised interest
in further research mostly with regard to power output and thus scalability, but most
importantly, a lack of applications; MFCs were considered an interesting feature of
science and engineering, but a ‘realistic’ application had not yet been considered for them.
With the turn of the new century, however, the picture has completely shifted. Microbial
fuel cells have gained considerably in interest, with possible applications varying from
the original concept of electricity generation and the production of speciality chemicals,
through to desalination and hydrogen generation. Most importantly in the context of the
the present study, in 1991 the idea of utilising wastewater streams as the fuel in MFCs
was first mentioned (Habermann and Pommer, 1991). The beginning of the 21st century
is a time to take stock, which brings us to the next point: the motivation of the current
study. Why are MFCs worth fighting for?
Motivation
At the turn of the 21st century, the world faces a general water scarcity and quality crisis
due to the cumulative effects of continuous population growth, urbanization, shifting land
use priorities, industrialization, food production intensification, increased living
standards, poor water use practices, and equally importantly, poor wastewater
management strategies (UN Water, 2015). Over the past decade, a general shift in views
on wastewater seems to have occurred, with a growing consensus that wastewater should
not be considered an issue; on the contrary, it should be considered a valuable resource
(Sutton et al., 2011). It is, therefore, essential that wastewater treatment and management
is considered an integrated part of water’s full life cycle. Currently, the systems available
for wastewater treatment are highly energy intensive, typically taking up to 3 % of the
overall electrical energy usage in developed countries, and are still considered by industry
Chapter 1- Introduction
3
as a regulatory obligation with increasing capital and operational costs (Mitchell and Gu,
2010).
At the same time, the energy crisis is one of the greatest issues faced in our time.
According to the United Nations World Water Assessment Programme more than 1.3
billion people around the world still have no access to electricity (WWAP, 2014). As a
general worldwide trend, energy and electricity consumption are likely to increase over
the next 25 years. At this point, it is important to understand the complex nexus and
mutual relationship which has developed between water and energy. It is to be expected
that changes in one will have both direct and indirect consequences for the other. By the
year 2035, energy consumption is projected to increase by 70 %, which in turn will
increase the energy sector's water consumption by 85 % (WWAP, 2014).
Having noted the interconnection of water and energy and the opportunity to use
industrial wastewaters as a source of potential gain rather than loss, it is the time to narrow
down the picture. Looking specifically at the case of Scotland, the whisky industry is one
of the most vital industries in the country which has a significant economic impact,
dominating the food and beverage exports of the UK (Goodwin, Finlayson and Low,
2001). This industry produces 8-15 litres of bio-rich liquid per litre of whisky, which
might contribute to pollution unless used as raw material for other processes, or otherwise
processed (Mohana, Acharya and Madamwar, 2009). Microbial fuel cells have been
identified as a natural solution to the complex nexus of energy, water scarcity and
sustainability which has been briefly described here. By utilising the metabolic reactions
of electrochemically active microorganisms, MFCs break down organic matter while
simultaneously generating direct electricity, converting its chemical energy into
electrical.
1.2 Aim and objectives
The primary aim of this research is to investigate the long-term performance of MFC
technology as a sustainable alternative to conventional wastewater treatment systems
through a multidisciplinary approach which combines both areas of technical interest, and
areas that are in need of further research.
Research on the topic of microbial fuel cells has gained exponential interest since the
present study has started. However, large scale systems that can respond to industrial and
Chapter 1- Introduction
4
real world requirements still require investigation in order for researchers to be able to
match innovations to suitable real-worlds applications in industrial environments. The
current study does not strive towards maximum power generation, but rather focuses on
achieving the following objectives to further its aim:
To address key performance parameters regarding electrical connectivity and
effluent quality in a prototype MFC reactor;
To develop an experimental pilot scale MFC reactor from start-up, through
acclimatisation and operation on real wastewater substrates and ambient
temperatures;
To integrate the pilot installation into an existing treatment process in order to
investigate the compatibility and potential of complementary and/or competitive
operation with existing treatment methods; and
To analyse and monitor performance over a long period, on a continuous
operational mode, in a realistic, industrial environment.
All the objectives above were examined through a multi-disciplinary approach combining
various operational optimisation methods while also developing a simplified
electrochemical model with the objective of describing the performance of the
multi-electrode MFC in greater depth.
1.3 Structure of the Thesis
This study is structured as follows:
Chapter 1 sets out the background motivations for the study and the timeline of
developments in the MFC field to date. The aims and objectives are also set, as the main
axis around which the following chapters develop.
Chapter 2 starts with a review of the progress made to date in the field of MFCs. The
main part of the chapter clarifies the principles of MFC operation, then the components
and materials making up an MFC are summarised, along with a discussion of the
microbial and architectural considerations. The key developments to date in utilising
Chapter 1- Introduction
5
MFCs for wastewater treatment are presented along with an outline of the current
industrial-scale experience. The chapter concludes with a critical review of these
developments and the potential for integrating the technology into existing treatment
systems.
Chapter 3 mainly describes the development of the pilot scale 122 litre prototype reactor
used in this study and the 14 litre bench scale replica. The general materials and methods
used both in relation to electrical performance and effluent quality assessment are also
presented in detail. Some of the methods and operational conditions employed in specific
parts of this study are explained separately in their respective chapters.
Chapter 4 investigates optimum electrical operations, in an experiment that should have
proceeded the development of the large-scale prototype, but chronologically succeeded
it. It focuses in on a 14 litre bench-scale MFC otherwise identical to the later developed
large scale pilot, on which two electrodes are operated either independently or in parallel
in order to establish the optimum electrical configuration which will then be implemented
in the 122 litre reactor. The examination of these configurations is also in correlation to
the quality of effluent treatment.
Chapter 5 establishes the potential for using the 122 L MFC prototype in the whisky
by-products industrial context. The preliminary studies outlined in this chapter include a
successful start-up, moving to the long-term examination of energy recovery and effluent
treatment, while the effect of temperature is examined throughout this phase. Latterly,
having established a proof of concept, a refurbishment protocol is also developed.
Chapter 6: Having established the treatability of whisky distillation process derivatives,
this chapter moves a further step forward to the integration of a pilot scale-up in a local
distillery and its existing treatment process. The long-term operation and performance of
the pilot set-up consisting of two 122L reactors with regards to energy recovery and
effluent treatment is examined in the main part of the chapter. During the last
experimental phase of this integrated study, the possibility of further optimisation is
examined through alternative anodic materials.
Chapter 7 takes this study a step further. A simplified electrochemical model is
discussed based on each electrode’s real voltage, as developed by subtracting the various

Chapter 1- Introduction
6
losses from the thermodynamically predicted voltage. Validation of the model is
attempted through ohmic resistance, and the potential for utilising this model to describe
the performance of the pilot scale prototype is examined.
Chapter 8 provides the detailed conclusions of this study.
Chapter 9 outlines possible directions and recommendations for future research based
both on the work conducted in this research, and on some general insights.
7
Chapter 2 – Literature review
2.1 Progression of microbial fuel cell research
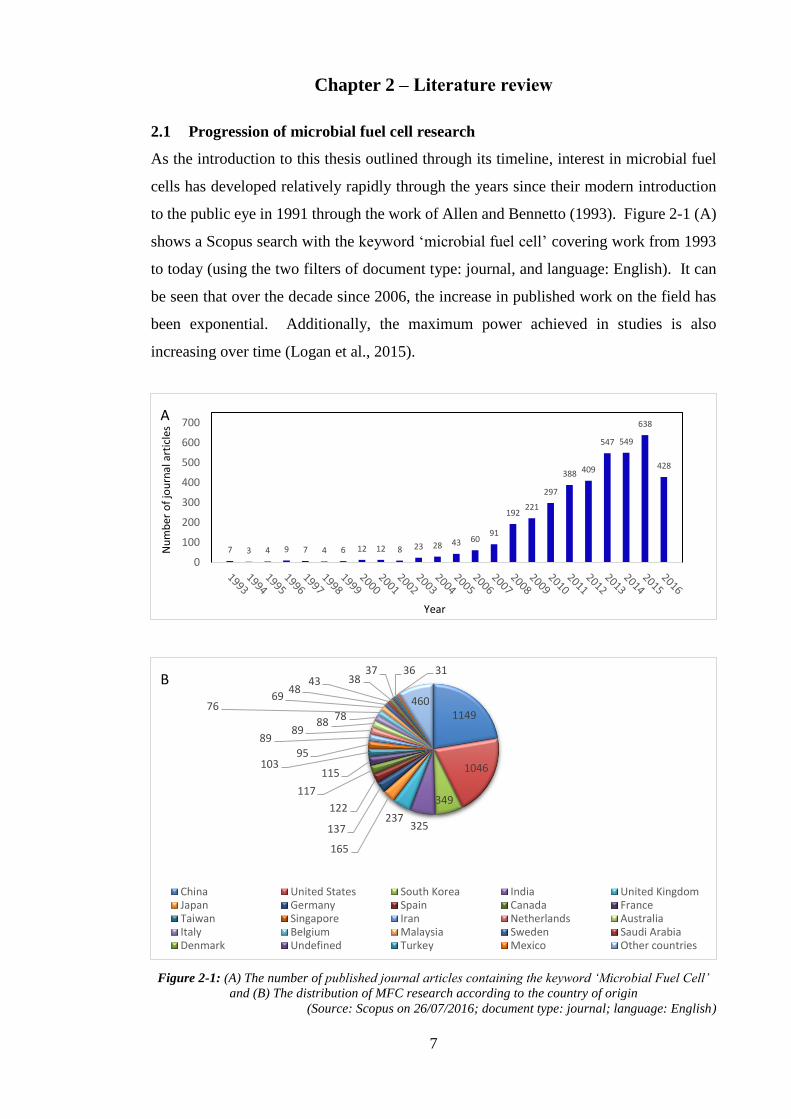
As the introduction to this thesis outlined through its timeline, interest in microbial fuel
cells has developed relatively rapidly through the years since their modern introduction
to the public eye in 1991 through the work of Allen and Bennetto (1993). Figure 2-1 (A)
shows a Scopus search with the keyword ‘microbial fuel cell’ covering work from 1993
to today (using the two filters of document type: journal, and language: English). It can
be seen that over the decade since 2006, the increase in published work on the field has
been exponential. Additionally, the maximum power achieved in studies is also
increasing over time (Logan et al., 2015).
Figure 2-1: (A) The number of published journal articles containing the keyword ‘Microbial Fuel Cell’
and (B) The distribution of MFC research according to the country of origin
(Source: Scopus on 26/07/2016; document type: journal; language: English)
7 3 4 9 7 4 6 12 12 8 23 28 43 6091
192221
297
388 409
547 549
638
428
0
100
200
300
400
500
600
700
Nu
mb
er o
f jo
urn
al a
rtic
les
Year
A
1149
1046
349
325237
165
137
122
117
115103
95
8989
8878
7669
4843 38
37 36 31
460
China United States South Korea India United KingdomJapan Germany Spain Canada FranceTaiwan Singapore Iran Netherlands AustraliaItaly Belgium Malaysia Sweden Saudi ArabiaDenmark Undefined Turkey Mexico Other countries
B
Chapter 2– Literature review
8
Figure 2-1 (B) shows the country-wise distribution of the relevant prior research in
Scopus. Almost 50 % of the research on the field is shared between China, the USA and
South Korea, with India and the UK following, meaning that these five countries are
leading the research field. As an overview, though, from Figure 2-1 (B) it is obvious that
interest is not dominated by the aforementioned countries, but is genuinely international
and truly global, with interdisciplinary and international collaborations.
Along with the recent increase in publications on, and interdisciplinary approaches to, the
subject came the diversification of MFCs by shifting them away from their original focus
and spreading the concept to a variety of applications. Originally, MFCs were made to
produce electricity, but the use of microorganisms on the anodes or cathodes or both has
allowed modifications of the original device leading to a variety of diverse applications.
All the other microbial electrochemical technologies (METs) will be described below in
this section. They are typically known to use the MxC theme, where x denotes the specific
application; for example, in the case of MFCs, the ‘x’ factor is ‘Fuel’ (Logan et al., 2015).
Table 2-1, below, summarises the main microbial electrochemical technologies, thus
demonstrating the current areas of interest in the field. It also describes each technology
by indicating their main areas of difference.
One of the first modifications of an MFC was the Microbial Electrolysis Cell in 2005, a
device in which additional voltage can be applied to drive the synthesis of hydrogen gas
thus requiring lower energy input in comparison with electrolysis. The produced
hydrogen can subsequently be used depending on its purity. This is an interesting feature
since the additional voltage necessary to drive the process is considerably less than that
needed for water electrolysis (Liu, Grot and Logan, 2005). Another particularly
interesting adaptation is the Microbial Desalination Cell, which integrates the original
MFC process and electrodialysis for wastewater treatment with simultaneous water
desalination. During this process, the electricity generated from the anode to the cathode
is used to drive the desalination process of water. MDCs can either be used as a stand-
alone process or can be combined with other desalination processes, such as reverse
osmosis, while at the same time treating wastewater streams (Saeed et al., 2015). The
various METs are gaining considerable interest over time, mostly due to the increasing
global needs for independent electricity generation and resource preservation, the
Chapter 2– Literature review
9
pressing need to eventually move away from fossil fuels, but most importantly due to
their adaptability, their ability to be easily modified, and their wide range of applications.
Table 2-1: Example of various Microbial Electrochemical Technologies (METs)
MxC Full name Description
MDC Microbial Desalination Cell
Can use electrodialysis stacks (MEDC,
microbial electrodialysis cell), or forward
osmosis (MOFC, microbial osmotic fuel cell)
membranes.
MEC Microbial Electrolysis Cell Typically used for hydrogen production from
the cathode, but also used for metal reduction.
MEDCC Microbial Electrolysis Desalination
Chemical production Cell
Includes bipolar membrane, so energy must be
input for chemical production.
MES Microbial Electrosynthesis Cell An MEC is designed to produce soluble
organics such as acetate.
MFC Microbial Fuel Cell Electrical power production.
MxB-MBR MFC with a cathode membrane
The cathode serves a dual function, reduction
and filtration of the water using either MFCs or
MECs.
MMC Microbial Methanogenesis Cell Methane production from the cathode.
MREC Microbial Reverse Electrodialysis Cell Reverse electrodialysis stack inserted into an
MEC.
MREEC
Microbial Reverse Electrodialysis
Electrolysis and Chemical production
Cell
An MEDCC that includes a RED stack and is
used for production of acid and bases; can be
used for carbon capture; can produce hydrogen
gas; can also be used for desalination.
MRFC Microbial Reverse Electrodialysis Fuel
Cell RED stack inserted into an MFC.
MSC Microbial Struvite production Cell Designed to precipitate struvite on the cathode.
sMFC Sediment Microbial Fuel Cell Also known as benthic MFC.
(Source: Logan et al., 2015, p.207)
2.2 Principles of microbial fuel cells
Logan et al. (2006) reopened and reshaped the current field of microbial fuel cells,
shifting their use towards real-life applications. As the group redefined, MFCs are devices
that use microorganisms as the catalysts to oxidize organic and inorganic compounds and
generate electricity. In the MFCs, the electrons produced by microorganisms during their
metabolic reactions in the substrates are transferred to the anode, the negatively charged
Chapter 2– Literature review
10
electrode terminal, and flow to the cathode, the positively charged electrode terminal,
linked by a conductive material containing a resistor to complete an electrical circuit. The
device should, therefore, operate on a substrate that is replenished in the anode after
oxidation, either continuously or intermittently. Electrons can be transferred from the
solution to the anodic electrode submerged in the anode through various processes, such
as chemical mediators or shuttles. The electrons that reach the cathode combine with the
protons that diffuse from the anode through a separator and with the oxygen provided
from the air, with water being the resulting product. This constitutes the founding concept
of the MFC device, with microbially catalysed electron liberation at the anode and
subsequent electron consumption at the cathode, when both processes are sustainable.
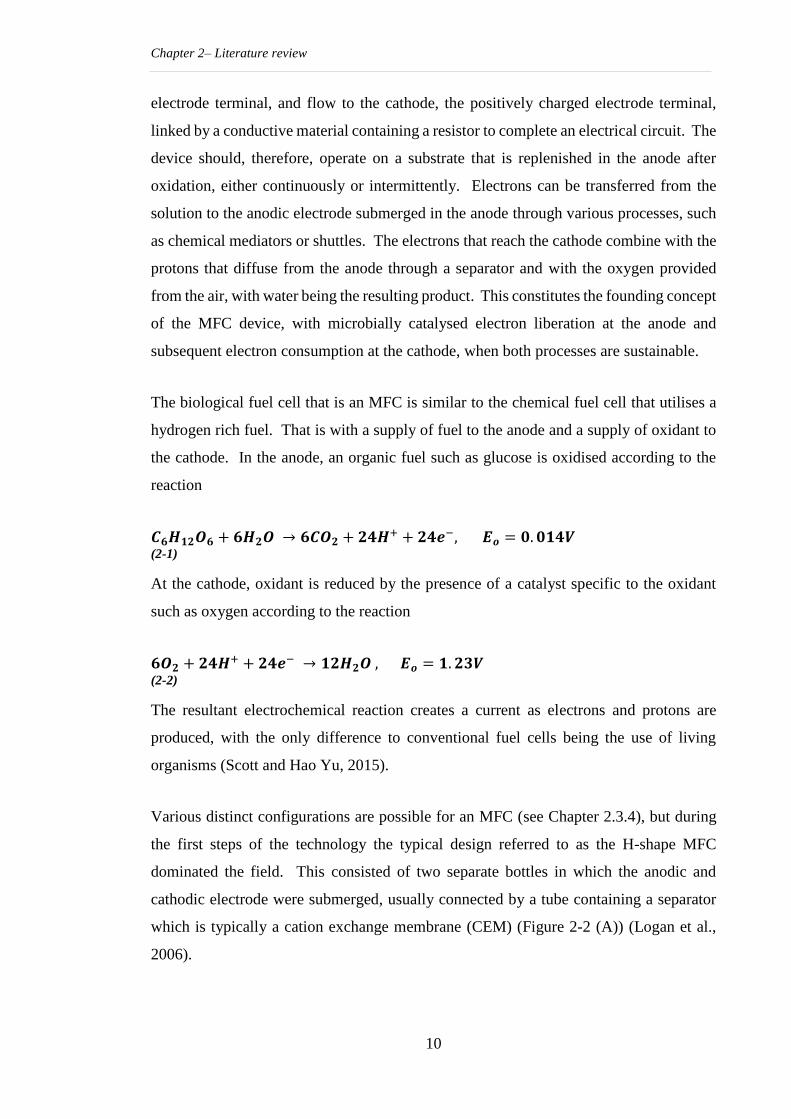
The biological fuel cell that is an MFC is similar to the chemical fuel cell that utilises a
hydrogen rich fuel. That is with a supply of fuel to the anode and a supply of oxidant to
the cathode. In the anode, an organic fuel such as glucose is oxidised according to the
reaction
𝑪𝟔𝑯𝟏𝟐𝑶𝟔 + 𝟔𝑯𝟐𝑶 → 𝟔𝑪𝑶𝟐 + 𝟐𝟒𝑯+ + 𝟐𝟒𝒆−, 𝑬𝒐 = 𝟎. 𝟎𝟏𝟒𝑽 (2-1)
At the cathode, oxidant is reduced by the presence of a catalyst specific to the oxidant
such as oxygen according to the reaction
𝟔𝑶𝟐 + 𝟐𝟒𝑯+ + 𝟐𝟒𝒆− → 𝟏𝟐𝑯𝟐𝑶 , 𝑬𝒐 = 𝟏. 𝟐𝟑𝑽
(2-2)
The resultant electrochemical reaction creates a current as electrons and protons are
produced, with the only difference to conventional fuel cells being the use of living
organisms (Scott and Hao Yu, 2015).
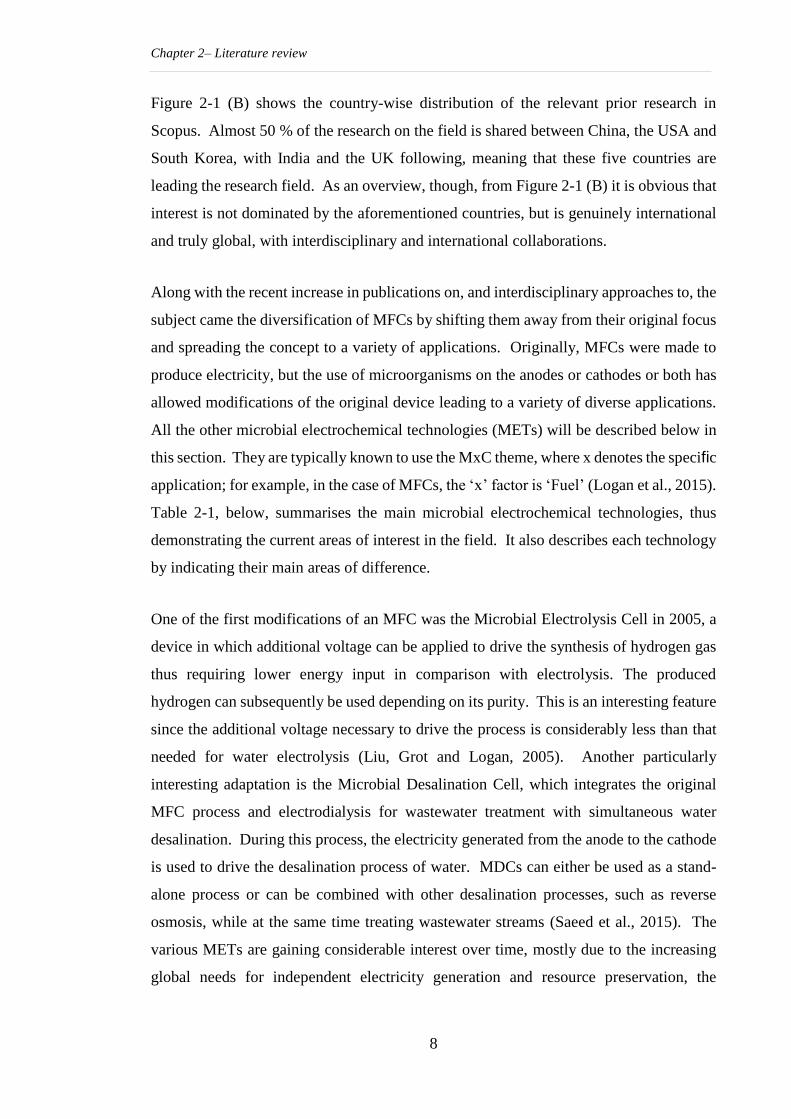
Various distinct configurations are possible for an MFC (see Chapter 2.3.4), but during
the first steps of the technology the typical design referred to as the H-shape MFC
dominated the field. This consisted of two separate bottles in which the anodic and
cathodic electrode were submerged, usually connected by a tube containing a separator
which is typically a cation exchange membrane (CEM) (Figure 2-2 (A)) (Logan et al.,
2006).
Chapter 2– Literature review
11
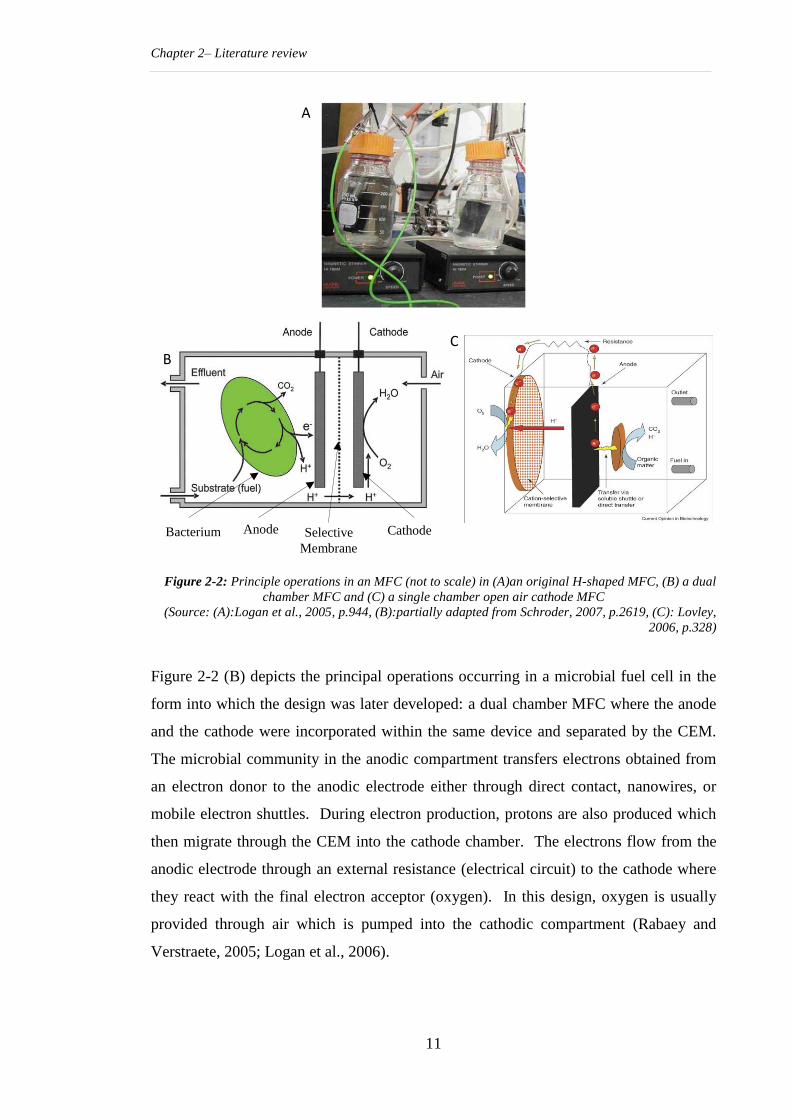
Figure 2-2: Principle operations in an MFC (not to scale) in (A)an original H-shaped MFC, (B) a dual
chamber MFC and (C) a single chamber open air cathode MFC
(Source: (A):Logan et al., 2005, p.944, (B):partially adapted from Schroder, 2007, p.2619, (C): Lovley,
2006, p.328)
Figure 2-2 (B) depicts the principal operations occurring in a microbial fuel cell in the
form into which the design was later developed: a dual chamber MFC where the anode
and the cathode were incorporated within the same device and separated by the CEM.
The microbial community in the anodic compartment transfers electrons obtained from
an electron donor to the anodic electrode either through direct contact, nanowires, or
mobile electron shuttles. During electron production, protons are also produced which
then migrate through the CEM into the cathode chamber. The electrons flow from the
anodic electrode through an external resistance (electrical circuit) to the cathode where
they react with the final electron acceptor (oxygen). In this design, oxygen is usually
provided through air which is pumped into the cathodic compartment (Rabaey and
Verstraete, 2005; Logan et al., 2006).
Bacterium Anode Selective
Membrane Cathode
A
B C
Chapter 2– Literature review
12
The process described above is the founding process of the MFC. However, a vital recent
moment has been the development of the single chamber open air cathode MFC. As can
be seen in Figure 2-2 (C), the principal operation remains the same, with the key
difference that no cathodic electrolyte is provided, and oxygen is not provided by artificial
pumping. Instead, the cathode is exposed to open air, and oxygen is provided by natural
circulation. Additionally, in this case, the membrane separator (if one is used) is coated
on the cathode side, facing the anodic compartment (Lovley, 2006; Scott and Hao Yu,
2015).
2.3 Microbial fuel cell materials, components and reactor designs
Several materials have been used and developed over the years, either for conventional
use in other treatment technologies or specifically developed for MFC applications. The
selection of the appropriate electrode material with regard to both the anode and the
cathode is critical for the performance of an MFC in terms of microbial adhesion, electron
transfer, and electrochemical efficiency, and greatly affects its power generation and
treatment efficiency (Wei, Liang and Huang, 2011).
Although the criteria in selecting materials for the anode and cathode are different on
specific operations, at the first level of selection both should always possess certain
specific properties. Firstly, the surface area and porosity of the electrode materials is of
great importance since power generation is greatly constrained by it. Ohmic losses are
directly proportional to the resistance of the electrode, and a method to decrease that is
increasing the surface area while keeping the volume the same. Additionally, a higher
surface area provides more sites for reactions and better adhesion of the microbial
community. However, porosity will decrease the electrical conductivity of the material
(Logan, 2008). The conductivity of the materials used is also of great importance. The
electrons released during the metabolic reactions of the microorganisms have to travel
through the anodic electrode to the external circuit in order to reach the cathodic electrode.
Therefore, materials with as low an internal resistance as possible will make the flow of
electrons easier (Scott and Hao Yu, 2015).
It is also necessary to ensure the biocompatibility, durability and stability of the
electrodes. Regarding the microbial community, it is obvious that since the process of
power generation is driven by microorganisms, the materials used should protect them
Chapter 2– Literature review
13
from poisoning, and should also be chemically stable in the bacterial culture, and
corrosion resistant (Wei, Liang and Huang, 2011). Additionally, the long term operation
and performance of reactors is of particular interest to the study and generally in the field
over the past few years. Therefore, ensuring the durability of materials over time is
necessary for successful applications.
Finally, the cost of materials is a factor, especially with regard to industrial-scale
applications, and because the ultimate goal is for MFCs to be commercially deployed. In
order for this to be achieved, the materials should be low cost, sustainable and easily
available. Currently, two elements are prohibitive regarding material costs: membranes,
and cathode catalysts. Some of the metals which are traditionally used as cathode
catalysts, such as platinum, are neither cheap, nor durable or sustainable. Rozendal et al.
(2008) studied the economics of MFCs as currently practised and according to their
findings, capital costs per kg of COD treated were approximately 8 €, 38 % of which they
attributed to the cathode, while 47 % of the cost was due to the membrane separator used
in the majority of the studies. They also predicted that according to current trends,
material costs would be reduced in the near future to approximately 0.4 € per kg of COD
treated, with respective contribution of the cathode and membranes reduced down to 10 %
and 20 %. This could be achieved in two-fold ways; firstly, membrane-less MFCs which
make the use of a membrane obsolete are increasingly gaining interest and further
research (You et al., 2007; Liu et al., 2008; Daud et al., 2015), and secondly, there has
been development and use of non-precious catalysts in cathodic electrodes such as
metal-based and carbon-based catalysts (Daud et al., 2015; HaoYu et al., 2007; Yuan et
al., 2016), which will certainly contribute towards more economically viable MFCs.
Anode materials
The materials commonly used in laboratory developments usually include a large variety
of carbon materials and several metal-based materials, whereas surface area is found to
vary greatly. According to the considerations discussed previously concerning
biocompatibility, chemical stability, high conductivity and relatively low cost,
carbonaceous materials have been identified from the first steps of the development of
MFCs as the most suitable for use, particularly with regard to the anode. In terms of
structure, the aforementioned carbon-based electrodes can be separated into a plane
structure, when a single material is used, a packed structure, when the electrode is a
Chapter 2– Literature review
14
‘pocket’ filled with a certain or a number of these materials, and a brush structure, where
the electrode is developed in a brush form (Wei, Liang and Huang, 2011).
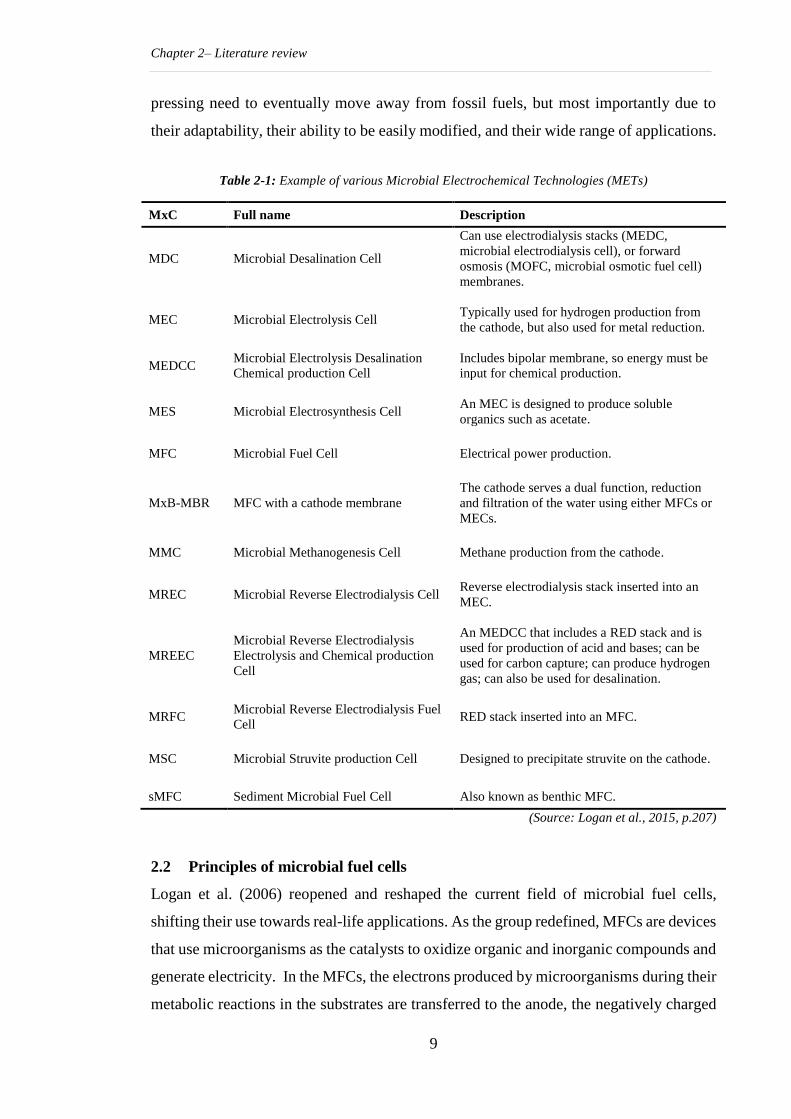
Figure 2-3, below, summarises the carbon-based materials most commonly used in both
laboratory and pilot-scale studies. One of the materials used in very early studies was
carbon paper, which is a very thin and relatively stiff material that has been found to be
easily damaged (Logan, 2008). Graphite plates have been found to be much smoother,
more robust, with a more compact structure, however, they have also been found to have
relatively smaller surface area. Additionally, when used as an anodic electrode,
roughened plates have been found to produce higher power outputs than the similar,
smoother ones (ter Heijne et al., 2008). Carbon cloth and carbon mesh have also been
used in the literature; the cloth is by nature more porous and could, therefore support a
better microbial structure, but it is also more expensive. In a comparative study by (Wang
et al., 2009a) between the two materials after going through a pre-treatment, the carbon
mesh anode was found to produce a slightly higher power output. Graphite rods are
another carbon material that has been used in literature; however, as with the graphite
plate, these have a rather smooth surface area and when used have been reported to have
been abraded with sand paper in order to enhance microbial attachment (Liu,
Ramnarayanan and Logan, 2004). In a comparative study conducted by Chaudhuri and
Lovley (2003) as cited by Wei, Liang and Huang (2011) a carbon felt and carbon rod
anode were found to produce similar power outputs. Some studies have been conducted
on reticulated vitrified carbon, a carbon-based material with a very high porosity of 97 %
and conductivity, which is very rigid but also easily damaged (Scott et al., 2008; He,
Minteer and Angenent, 2005). In a study by Ringeisen et al. in 2006 which made a
comparison between a reticulated vitrified carbon anode and an anode with carbon felt,
the first was found to have produced more than twice the power than the felt anode.
It is necessary to point out even at this early stage (as will also be discussed further later
on), that a direct comparison between studies of microbial fuel cells and, thus, of their
power outputs and COD removals, is particularly difficult, because an MFC by its nature
is a technology synthesised by, and depending on, many different disciplines such as
microbiology, chemistry and materials sciences. Therefore, many different parameters
are involved even in the most basic, laboratory experiment. Additionally, regarding
electrical units in particular, such as current and power, there are several ways of
Chapter 2– Literature review
15
representation which have only been unified in a way that is comparable in the last few
years (see Normalised Energy Recovery, Chapter 3.3).
Figure 2-3: Materials used in both anodes and cathodes; (A) carbon paper, (B) graphite plate, (C)
carbon cloth, (D) carbon mesh, (E) granular graphite, (F) granular activated carbon, (G) carbon felt,
(H) reticulated vitrified carbon, (I) graphite rods, (J) carbon brush and (K) stainless steel mesh
(Source: partially adapted from Mustakeem, 2015, pp. 22; Wei, Liang and Huang, 2011, pp.9336)
Moving on to packed structures, which are also considered the first 3-dimensional anodes
(Aelterman et al., 2008), the use of granular graphite for the construction of an anode in
a packed bed was first reported by Rabaey et al. in 2005, when the authors used this
packed bed in a tubular open air cathode with the effluent entering from the bottom
passing through the bed. The reason behind the use of both graphite granules and granular
activated carbon was to increase the surface area available to the microbial community.
The use of the aforementioned materials in packing forms for MFCs’ anodes is becoming
increasingly common (Jiang and Li, 2009; Aelterman et al., 2008; Rabaey et al., 2009;
Kalathil, Lee and Cho, 2011). Similar to the biological filter, the anode chamber can
either be filled with granular material in the form of bed, or can be in a shaped ‘pocket’
configuration. In these cases, having a high surface area is a great and desirable
advantage, but in order to make the electrode effectively conductive, the granules must
be tightly packed next to each other (Logan, 2008). However, it has also been found that
in the long term, the clogging of MFCs is a potential issue (Rabaey et al., 2009).
Carbon brushes are currently becoming popular and are occasionally favoured in large
scale applications due to their high surface area, high porosity and potential current
collection (Ge et al., 2013; Zhang et al., 2013b, Zhang et al., 2011; Cheng and Logan,
A B C D
E F G H
I J K
Chapter 2– Literature review
16
2011). The brush was first introduced by Logan et al. in 2007, who used it with
conductive and non-corrosive metal core in an open air single chamber laboratory scale
MFC, achieving the maximum power output reported for a single chamber MFC at the
time. Three studies further explored the concept of brushes in MFC anodes on a
laboratory scale, this time examining the load/density of the brush and its effect on
performance and electrical power output. Specifically, on the one hand, Lanas and Logan
in 2013, and Lanas, Ahn and Logan in 2014 explored the use and position of multiple
brushes within one anodic compartment, and found that multiple, smaller brushes could
lead to higher power outputs than a single, bigger one. On the other hand, Hutchinson,
Tokash and Logan in 2011 found that 65 % of the size of a single brush could be removed
without current collected and thus power output reduced. Finally, in addition to the
aforementioned indications of brushes being able of achieve higher power outputs, Feng
et al. in 2010 found that additional acid and heat treatment of the brush anode could lead
to up to a 34 % increase in its achievable power output. However, in order to make a
realistic comparison, treatments of materials with various chemicals, such as ammonia,
surface oxidation and heating, has been found to increase power outputs is almost every
material, from plates and sheets to brushes and rods (Wei, Liang and Huang, 2011).
Metal materials and materials with metal coatings are much more conductive than
carbon-based materials. However, their application in the MFC field remains relatively
questionable. Additionally to being conductive, materials used for anodes and cathodes
also need to be non-corrosive. Many metals have been ruled out because of the non-
corrosive requirement, and up-to-date stainless steel and titanium have therefore qualified
as relatively common metal materials for use in MFC anodes. It is also reasonable that
microbial adhesion on such smooth surfaced materials is not favoured, especially when
compared to carbon-based competitors. Dumas et al. (2007) found that the stainless steel
anode produced lower power outputs than carbon-based ones, however, a metal-based
cathode reported more promising results. Titanium was also examined in a comparative
study by ter Heijne et al. (2008), who examined the performance of flat graphite,
roughened graphite, Pt-coated titanium and uncoated titanium. According to their results,
the best performance in terms of power output was achieved by the roughened graphite,
followed by the Pt-coated titanium then the flat graphite, and the least power was
generated by the untreated titanium anode. Biomass interactions were also a very
important factor in the study. Ter Heijne et al. (2011) went on to use the titanium plate

Chapter 2– Literature review
17
and mesh with mixed metal oxide as an anode for the scale-up of a 5L prototype, and they
reported a promising performance. The same anode construction of a titanium plate
anode was also reported by Dekker et al. (2009 ), even though their work focused mostly
on cathode limitations.
The combination of different materials has given rise to 3-dimensional, complex anodes
and seems also to have enhanced electrical performance, particularly in comparison to
traditional 2-dimensional anodes made up of materials such as carbon cloth (Chen et al.,
2013; Yong et al., 2012). In this study, a 3-dimensional complex anode has been
constructed in line with the principles discussed in this section. Increases in active surface
area, conductivity, and biocompatibility, and the subsequent support of microbial
communities have been the drivers for the development of the anodic electrodes that will
be discussed in Chapter 3.2.2.
Cathode materials
As was discussed at the beginning of the section, and as will be explored in more detail
here, the materials used for the cathodes in principle have the same qualities, as they are
carbon-based, conductive and biocompatible, in the sense that they are not toxic towards
bacteria. However, the supporting microbial biofilm formation is a different issue, as it
could be argued that a smooth surface area as a cathode could lead to enhanced
performance given that it will not suffer from biofouling, an issue commonly faced in
cathodes.
Currently, the main limiting factor in MFCs is the cathode (Logan, 2008; Rismani-Yazdi
et al., 2008), the design and the materials used in cathodes are therefore a challenging
aspect of MFC research overall. The materials mentioned previously for anodes have
been used in the three major different cathode designs: aqueous air cathodes, open air
cathodes and bio-cathodes (Wei, Liang and Huang, 2011). Typically, in all cases, the
main difference of the cathodes compared to the anodes, given that they are based on the
same materials, is the use of a catalyst, even though it is not always necessary, to enhance
oxygen reduction, which is the main reaction occurring in a cathode.
The first design which was widely deployed in laboratory experiments is the aqueous air
cathode, in which the electrode is submerged in the cathodic compartment, and air is
pumped into it and dissolved in catholyte. However, this design, which is also called the
Chapter 2– Literature review
18
dual chamber MFC, was more or less abandoned when the open air cathode design was
deployed due to the fact that oxygen’s solubility in water is 4.6 x 10⁻⁶ at 25oC but in air,
it is 0.21 (Logan, 2008). Open air cathodes, either with or without catalysts (when they
are the design of choice the MFC is usually called single chamber open air cathode MFC)
are believed to be a more efficient design particularly in the context of wastewater
treatment, due to lack of aeration and associated costs and inefficiencies, and also due to
the higher power outputs achieved. The layout of an open air cathode typically comprises
the carbon-based material on which the catalyst is impregnated (if existing), and is in
contact with air, a conductive material, and a hydrophobic layer to avoid the diffusion of
liquid from the anode to the cathode (Logan, 2008). If a selective membrane is present,
as will be discussed further below, it is on that side of the cathode, facing the anode, as
can be seen in Figure 2-2 (C) (Wei, Liang and Huang, 2011). The catalyst extensively
used in early research was platinum (Pt), either impregnated on carbon-based materials
such as carbon cloth, or coated on metal based cathodes (Logan et al., 2006; Cheng, Liu
and Logan, 2006a; Cheng, Liu and Logan, 2006b). However, due to its high cost, toxicity
and relatively rare availability as a resource, platinum was prohibitive for large scale
applications. For this reason, non-precious metal catalysts were developed or otherwise
catalysts would become obsolete.
A cost effective transition was therefore made towards iron, nickel and cobalt or to
cathodes without any catalyst (Yuan et al., 2016). Zhao et al. in 2005 and then again in
2006 studied the application of iron phthalocyanin and other metal oxides as inexpensive
alternatives to platinum, and found that the power outputs achieved were very similar to
the respective outputs of cathodic materials catalysed with platinum. Iron phthalocyanin
was the catalyst used in the current study, and recently, results of this catalyst achieving
high power outputs in MFCs operating on real wastewater were verified (Burkitt, Whiffen
and Yu, 2016). In non-catalysed applications of cathodes, activated carbon and granular
carbon have been extensively used, and in studies comparing the two it has been found
that activated carbon produces higher power outputs (Freguia et al., 2007; Tran et al.,
2010).
Finally, bio-cathodes have gained considerable attention in the last few years due to their
stability and multiple functions in an MFC, such as wastewater and biosynthesis.
Currently, bio-cathode electrodes are mainly composed of, as like previous applications,
Chapter 2– Literature review
19
on carbon-based materials including graphite plate, carbon felt, granular graphite, and
graphite brush, as well as stainless steel mesh. The main difference, as their name implies,
is that bio-cathodes are also inoculated with either a single microorganism or a consortium
of microorganisms, different than those in the anodic compartment (Wei, Liang and
Huang, 2011). Algae in cathodes are currently gaining even more attention due to their
potential in integrating MFC technology with photo-bioreactors, i.e. the reactors in which
algae are traditionally grown (Wang et al., 2014; Gajda et al., 2015). However, as a field,
bio-cathodes are still a relatively new modification of MFCs, and thus the materials used
and their operation are still subject to ongoing research and development.
Separators and membranes
The third important factor concerning the materials used in MFCs is the ion exchange
membrane (IEM) or separator. In typical fuel cell applications such as the hydrogen fuel
cell, the membrane is a necessary component; however, that is not necessarily the case
with MFCs. The reasons membranes are used in MFC applications are to allow the
selective movement of ions from the anode to the cathode, and also to prevent the leaching
of the anodic fluid in the cathode, whether that is in a dual MFC or an open air cathode
(Logan et al., 2006).
The membranes and separators traditionally used in MFCs can be separated into three
main categories; cation exchange membranes (CEMs), anion exchange membranes
(AEMs) and uncharged porous membranes. The first two are the most expensive and
were typically used in wider fuel cell applications before being adopted by MFC
technology (Leong et al., 2013). Between the different kinds of membranes which are
commercially available, CEMs, which are selectively permeable to cations, are the most
commonly used. The structure of AEMs and CEMs is the same as the corresponding ion
type which is not transferred, thus preventing its move from the anode to the cathode and
back.
Perfluorosulfonic acid (PFSA) polymers are the most commonly used within the CEMs.
These have three regions: a polytetrafluoroethylene backbone, a side chain of vinyl ethers,
and a sulfonic acid group, and they have good proton conductivity precisely because the
negatively charged hydrophilic sulfonate group is attached to the hydrophobic
Chapter 2– Literature review
20
fluorocarbon backbone, promoting proton transport through it (Scott and Hao Yu, 2015;
Leong et al., 2013).
AEMs are solid polymer electrolyte membranes which usually contain positive ionic
groups and mobile negatively charged anions. They have been found to provide a better
management of liquid crossover, and tend to be a cheaper alternative (Scott and Hao Yu,
2015). A comparative study by Kim et al. (2007) utilising different membranes in an
acetate-fed open air cathode MFC found that the AEM yielded a higher power density
and had the lower oxygen and fuel permeability compared to the CEM.
Porous membranes, such as glass wools and microfiltration membranes, have gained
some interest over the last few years as a low-cost alternative to AEMs and CEMs in
MFCs. Single chamber MFCs with glass wool as separators instead of expensive
membranes have been argued to be more cost effective in wastewater treatment and power
generation. They have also been found to face similar issues to membrane-less MFCs,
such as oxygen and substrate diffusion. Obviously, diffusion rates for both are lower in
MFCs with no membrane separator, but higher than in the cases of AEMs and CEMs.
The crossover also facilitates faster biofouling, leading to a general reduction of
performance in the cell, and therefore, their use in MFC technology is not yet favourable
(Mohan, Raghavulu and Sarma, 2008; Sun et al., 2009; Leong et al., 2013).
The main disadvantage associated with membranes is the cost, which is possibly the
highest in terms of materials, attributing as it does 47 % to the total cost (Rozendal et al.,
2008). Additionally, they can add to the internal resistance and can be susceptible to
biofouling, reducing the overall performance of the cell (Logan, 2008). Relatively
recently, membrane-less MFCs have been examined in order to try to eliminate the
aforementioned disadvantages (Du et al., 2008; Ghangrekar and Shinde, 2007; Liu and
Logan, 2004). However, in the long term, particularly in long term operational MFCs, it
has been proven that oxygen and substrate diffusion pose a particular issue by reducing
the cells efficiency. Having a closer look at the large scale applications which have been
published to date, it can be seen that the majority utilised an ion exchange membrane
(Janicek, Fan and Liu, 2014). For the time being, the advantages of a membrane
particularly in such large scale applications have not yet been overturned, but as discussed
Chapter 2– Literature review
21
at the beginning of the chapter, with cost as the main driver, developments in
membrane-less MFCs are increasing.
Microbial fuel cell reactor configurations
Various configurations have been reviewed by Du, Li and Gu (2007) and Zhou et al.
(2013), who looked at different designs in the field of MFCs as well as microbial
electrolysis cells, and more recently configurations have been reviewed by Hernández-
Fernández et al. (2015) and Gude (2016). MFCs are a very dynamic technology, as has
become clear through this literature and research review, and there has been an almost
exponential increase in MFC studies in recent years. However, in this section, an
examination of the basic MFC architectures will be attempted. The descriptions of MFC
reactors that follow are far from exhaustive as different designs are configured almost
every year, but the major applications and better defined MFC reactors are described
presently.
One of the reasons why so much research is currently taking place with MFCs as the main
feature is their multi-disciplinary nature. Therefore, a categorisation of designs according
to one criterion would be too generic. Figure 2-4, below, gives a classification of designs,
some of which have been mentioned up to this point, based on five criteria: configuration,
structure, the separator or membrane used, flow type, and cathode type.
According to the relative position of the anode and cathode, MFCs can be divided into
dual chamber, single chamber (also usually referred to as open air cathode MFCs) and
multi-chamber. The dual chamber MFC was the design developed in the early years of
research; here, the anode was separated from the cathode (in two separate bottles in the
case of the H-shaped MFC) typically using a salt bridge or a membrane, as shown in
Figure 2-2 (A) (Logan et al., 2006). The electrons generated from in the anode from the
cathodes were transferred externally through a wire to the cathode and protons were
transferred to the cathode through the membrane. This design, however, was relatively
complex and impractical for further scale-up, mostly due to the costs associated with the
need for aeration to the cathode to provide oxygen. For this reason, it was abandoned
early on, particularly for scaling-up (Hernández-Fernández et al., 2015b).
Regarding different configurations of MFCs, single chamber open air MFCs have been
introduced as an answer to the mechanical aeration issue faced by dual chamber MFCs.
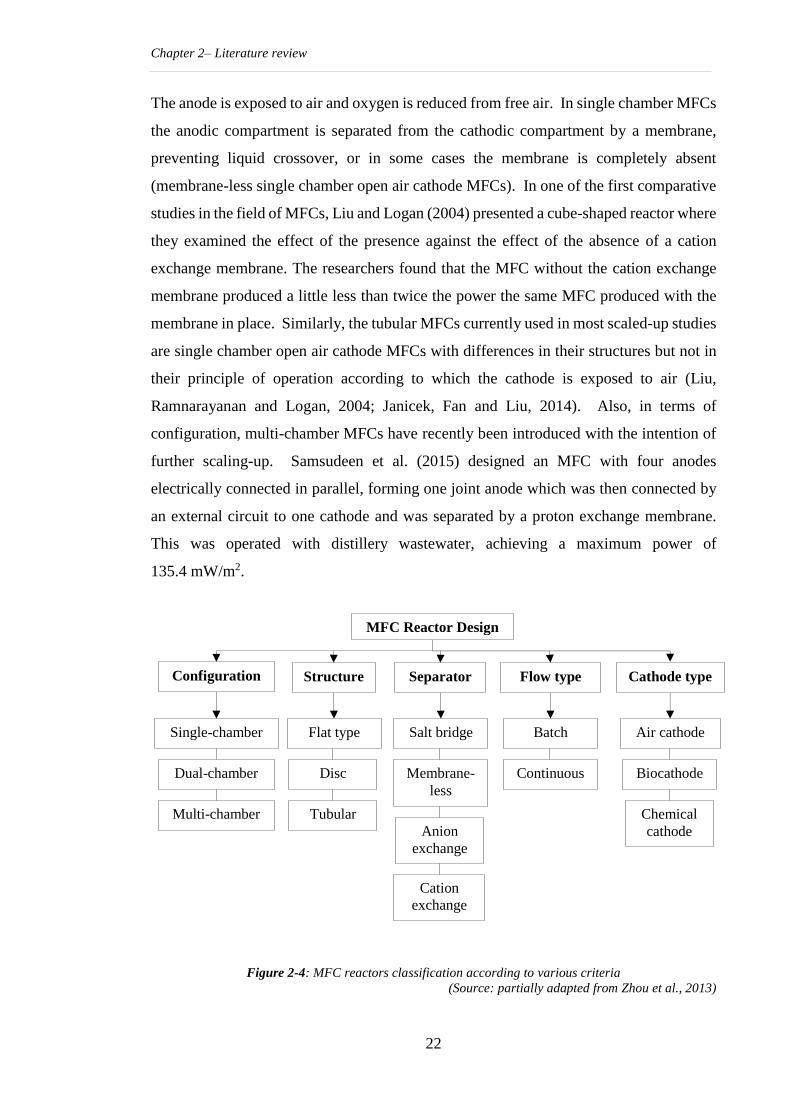
Chapter 2– Literature review
22
The anode is exposed to air and oxygen is reduced from free air. In single chamber MFCs
the anodic compartment is separated from the cathodic compartment by a membrane,
preventing liquid crossover, or in some cases the membrane is completely absent
(membrane-less single chamber open air cathode MFCs). In one of the first comparative
studies in the field of MFCs, Liu and Logan (2004) presented a cube-shaped reactor where
they examined the effect of the presence against the effect of the absence of a cation
exchange membrane. The researchers found that the MFC without the cation exchange
membrane produced a little less than twice the power the same MFC produced with the
membrane in place. Similarly, the tubular MFCs currently used in most scaled-up studies
are single chamber open air cathode MFCs with differences in their structures but not in
their principle of operation according to which the cathode is exposed to air (Liu,
Ramnarayanan and Logan, 2004; Janicek, Fan and Liu, 2014). Also, in terms of
configuration, multi-chamber MFCs have recently been introduced with the intention of
further scaling-up. Samsudeen et al. (2015) designed an MFC with four anodes
electrically connected in parallel, forming one joint anode which was then connected by
an external circuit to one cathode and was separated by a proton exchange membrane.
This was operated with distillery wastewater, achieving a maximum power of
135.4 mW/m2.
Figure 2-4: MFC reactors classification according to various criteria
(Source: partially adapted from Zhou et al., 2013)
MFC Reactor Design
Configuration Structure Separator Flow type Cathode type
Single-chamber
Dual-chamber
Multi-chamber
Flat type
Disc
Tubular
Salt bridge
Membrane-
less
Anion
exchange
Cation
exchange
Batch
Continuous
Air cathode
Biocathode
Chemical
cathode
Chapter 2– Literature review
23
Regarding structure, four main designs have been widely reported. Currently, the most
popular design as discussed in scaled-up studies is the tubular MFC, on which the cathode
either surrounds the anode and is exposed to air (Ge et al., 2013), or the cell is shaped as
a tube with the cathode in the middle creating a void space (exposed to air), and the anode
surrounding it (Liu, Ramnarayanan and Logan, 2004). Cheng, Ho and Cord-Ruwisch
(2012) designed a rotatable bio-electrochemical contactor in which the anodic and the
cathodic electrodes did not have a distinct function, but instead consisted of an array of
rotating electrode disks, each of which had its upper semi-circle exposed to air and its
lower side submerged in water. Continuous rotation allowed each half to act as an anode
and a cathode alternately, thus achieving a promising COD reduction, 40 % of which
contributed to the current generation and was not due to aeration. Finally, in terms of
structure, the flat plate MFC (which is the design used in this study) has also been used
in scaled-up studies, albeit less widely than the tubular design. The concept of a baffled
reactor is incorporated in this design. Li et al. (2008) designed a baffled reactor as early
as 2008 in which the cathodes were exposed to air and were able to achieve 88 % COD
removal with an HRT of 91h, and a maximum power output of 133 mW/m2. A similar
concept of a baffled reactor but which in this case was horizontally placed was more
recently developed by Dong et al. (2015) achieving a COD reduction of 87.6 % while
harvesting 0.034 kW/m3. The overall volume of this reactor was 90 L, and it can be
considered to have a serpentine circulation as the reactor developed in this study has.
The categorisation of MFCs according to the cathode design and the membrane separator
(or the absence of one) were developed earlier in Chapters 2.2 and 2.3.3 respectively.
Therefore, the last categorisation is according to flow type: more specifically, continuous
and in batch mode. During the first steps in the context of field effluents, either artificial
or real wastewater were examined in batch mode in order to examine the extent to which
the MFC can be powered by a single batch of organic matter, but as the field progressed,
the need to examine long term, continuous flows became obvious (Logan, 2008). There
has been a debate in the research community on the most effective method in relation to
the processing regime for effluent, and currently both types are being used in scale-up
studies (Janicek, Fan and Liu, 2014).

Chapter 2– Literature review
24
2.4 Biological aspect of microbial fuel cells
Microbial electron transfer and inocula
The microbial community in an MFC is clearly responsible for the transport of electrons
to the anode and through the cathode, and thus for the generation of electrical current.
The transfer process of electrons resulting from the metabolic reactions of the microbial
community can be classified into two categories. Firstly, there is the mediated electron
transfer during which a mediator, either produced by the microorganism itself or
mechanically added to the system, is used to move the electrons to the surface of the
electrode, and secondly, there is mediator-less electron transfer, during which electrons
are either transferred through direct contact with the anodic electrode or by nanowires
developed between the microorganisms and the electrode (Logan, 2008).
MFCs using mediators involve microorganisms that can transfer electrons only to soluble
compounds which are either natural, such as nitrate, sulphate, and sulphide, or synthetic
soluble mediators such as thionine, methylene blue and neutral red (Ieropoulos et al.,
2005; Park and Zeikus, 2000). Originally, mediators were used in order to enhance the
transport of electrons to the anode, and thus increase current generation. Ideal mediators
should be able to cross the cell membrane easily, have good solubility in the anolyte, and
be non-biodegradable and non-toxic to the microorganisms. If large scale applications
are targeted, then they should also be particularly low in cost. It was also found that in
some cases bacteria such as Shewanella oneidensis can generate their own mediators (Du,
Li and Gu, 2007; Park and Zeikus, 2000). When added in the anode, artificial mediators
had to be continuously replenished or they otherwise had to be impregnated into the anode
material using physicochemical methods. However, even in the case that they are
impregnated in the anode material, mediators can still be deactivated due to drop out, or
degraded during long-term operation (Wei, Liang and Huang, 2011).
The defining moment in the field though came when Kim et al. (1999) found that certain
bacteria are capable of directing electrons outside their cells by themselves. Mediator-
free MFCs utilise microorganisms such as Geobacter sulferreducens (Bond and Lovley,
2003), Geobacter metallireducens (Min, Cheng and Logan, 2005) and Rhodoferax
ferrireducens (Chaudhuri and Lovley, 2003), all of which are bioelectrochemically active
and able to form a biofilm on the anode surface, and to transfer electrons directly by
conductance through the membrane. When they are used, the anode acts as the final
Chapter 2– Literature review
25
electron acceptor in the dissimilatory respiratory chain of the microbes in the biofilm
(Bond and Lovley, 2003; Chaudhuri and Lovley, 2003). Certain microorganisms have
also been found to connect to the anodic electrode through extracellular appendages,
called nanowires (Logan, 2008).
The use of mediators carries both advantages and disadvantages. Their main advantage
is that they allow the microorganisms in the bulk liquid in an anode outside the biofilm
to be involved in the process. If the electron transfer is solely based on contact with the
anodic electrode, then microorganisms which are either incapable of the direct transfer,
such as many anaerobes, or are placed far from the electrode, especially in a large reactor,
would be unable to contribute to the generation of current. On the other hand, mediators
are expensive to produce in terms of carbon and energy requirements, and are
non-selective, which means that they can be used by competing microbes and upon
transport away from a suspended microbial cell toward the anodic electrode acceptor,
might not come back to the microorganism, thus creating a loss for the microorganism
(Scott and Hao Yu, 2015).
Regarding the specific microbial strain and communities used, MFCs have operated in
both mixed consortia and pure cultures, and it has generally been found in prior research
that MFCs operating using mixed cultures are capable of achieving substantially greater
power densities than those with pure isolated cultures (Logan et al., 2006). However, it
should be kept in mind that in order to accurately attribute electrical power output
performance solely to one parameter, in this case the microbial community, the remaining
experimental parameters should remain unchanged and a benchmark should be
established. In the majority of prior research studies it can be seen that, even in
comparative research, more than one parameter has been changed within the experiments,
rendering direct comparisons very difficult. Additionally, in most studies it could be
argued that the achievement of higher power outputs might possibly be attributed more
to the reactor’s architectural features, electrode spacing and material, rather than solely
to the bacterium used (Franks, Malvankar and Nevin, 2010).
In using the source of inoculum as a criterion for the classification of MFC studies, four
major, generic categories can be formed: pure cultures as inocula, mixed cultures,
Chapter 2– Literature review
26
pre-acclimated bacteria from already operating MFCs, and the utilisation of the bacteria
already existing in real wastewater effluent streams with no additional bacterial input.
Pure cultures used in the majority of MFC studies are typically microorganisms with
electrogenic potential, such as Geobacter and Shewanella (Min, Cheng and Logan, 2005;
Bond and Lovley, 2003; Dewan, Beyenal and Lewandowski, 2008), generating a power
output in the range of 0.005-0.05 mA/cm2. Dumas, Basséguy and Bergel (2008) used a
pure culture of Geobacter sulfurreducens in a stainless steel cathode half-cell and
achieved a considerably higher power output of 2.05 mA/cm2.
Studies using mixed consortia have achieved a much wider range of power outputs.
Given that MFCs are an anaerobic or anoxic biological treatment, the most commonly
used consortia referred to in the literature are the mixed anaerobic microorganisms
usually procured from wastewater treatment facilities (Ha, Tae and Chang, 2008; Kargi
and Eker, 2007; Wen et al., 2009; Sharma et al., 2014). For example, Aldrovandi et al.
(2009) used a granular anaerobic sludge inoculum from an upflow anaerobic sludge
blanket in a mediator-less and membrane-less MFC operating in synthetic wastewater.
The average COD removal ranged from 66 to 91 %, whereas the average power
production achieved was at 70 mW/m2 for ten months. The same inoculum was used in
the present study. Several studies have also used a combination of aerobic and anaerobic
inocula under MFC anaerobic conditions (Pant et al., 2010). Interestingly, in a
comparative study of aerobic and anaerobic mixed consortia Gao et al. (2014) used a
single chamber open air cathode MFC operated on an artificial medium and found that
the anaerobically pre-treated aerobic community produced a higher power output of
5.79 W/m3 compared to the anaerobic consortia, which generated 3.66 W/m3.
From a very early stage, the bacteria used in previous MFC studies have been used as
inocula in new studies. This method of serial transfusions has a few advantages, the most
important of which is the acclimatisation of the community. The biomass has adapted to
electrogenic metabolic processes, which subsequently leads to faster start-up periods and
higher power outputs (Catal et al., 2008; Logan et al., 2007; Cheng, Liu and Logan,
2006a). However, the additional inoculum used in an MFC, whether as a fresh inoculum
or serially transfused, could be attributed to the need for the microbial factor for the
catalysis and break-down of organic matter, and this was obviously necessary in early
Chapter 2– Literature review
27
laboratory research into artificial substrates. Over the last few years, it has been
recognised that in real wastewaters a plethora of microorganisms native to the effluents
are readily available, and there has therefore been a trend of utilising either different
effluents as the initial inoculum, or more importantly, no additional microbial inoculum
(Sharma et al., 2014).
It has been argued that if MFCs are to be utilised in wastewater treatment, mixed consortia
are capable of providing several advantages, such as robustness in the context of adverse
environments. Mixed bacterial communities are also capable of sustaining fluctuations
in influent organic load (Franks, Malvankar and Nevin, 2010). Additionally, it has been
found that bacteria enriched by an MFC operation demonstrating successful COD
removals and power outputs could not be grown as pure cultures. This is most likely due
to the syntrophic interaction between species in mixed consortia, the absence of which
inhibits the growth and optimum behaviour of the extracted bacteria (Kim et al., 2004;
Parameswaran et al., 2009), thus highlighting the need for better understanding of
microbial interactions in order to further scale-up the MFC technology. On the other
hand, genetic modification to create a ‘super bug’ has also been suggested as a necessary
breakthrough if MFCs are to generate the high electrical outputs that will allow their
further scale-up (Zhou et al., 2013).
Electrogenesis and methanogenesis
Methane is the natural end product in most anaerobic environments, and methanogenesis
is therefore an important biological process, particularly when anaerobic consortia are
used in MFCs as inocula. Methanogens have been found to compete with the
electrochemically active microorganisms for the organic compounds found in
wastewater. Therefore, unless the methane which is formed can be re-oxidized and
subsequently reused for electrical current generation, methanogenic activity is expected
to reduce electron recovery. Prior research using pure artificial mediums has shown that
although electrochemically active microorganisms at an anode can outcompete
methanogens for acetate as an electron donor, the use of glucose leads to notable amounts
of methane production (Rozendal et al., 2008; Lee et al., 2008).
Methane production in an MFC might not be the principally desirable output of the
process, however, if energy recovery is considered in a wider perspective then the
Chapter 2– Literature review
28
methane production in an MFC should not be regarded a loss. The focus of many MFC
studies, including the present one, is wastewater treatment. Methanogenesis undoubtedly
contributes towards COD reduction in the same way an anaerobic digester does.
However, methanogenesis possibly poses an issue with specific regard to power
generation. In case methane is generated in an MFC, an interesting experiment would be
to calculate energy recovery from both processes, and then supress methanogenesis and
examine if electrogenesis, thus electrical power output increases and if so, if the energy
recovered only from electrogenesis is higher than in the case of both electrogenesis and
methanogenesis being present. Ge et al. (2013) calculated the energy production from a
tubular MFC operating on sewage sludge both from direct electricity generation and from
the biogas produced from the MFC. According to their findings, the total energy
produced by the MFC was 22.79 kWh/m3 (operational value), whereas typical production
from an AD was estimated at the average of 10.73-38.06 kWh/m3. These findings
partially support the previous argument. Finally, Xiao et al. (2014a) found in a study
similar to the previously mentioned one on sewage sludge that methane production in the
anode chamber could enhance the electricity production from it, and the output voltage
of the MFC in methane production was higher than that of the MFC without it. The above
demonstrates that if methane generation occurs in an MFC, it should be further examined
in order to be able to optimise its operation, energy recovery and treatment efficiency.
Microbial fuel cells and temperature
Last but certainly not least, temperature should be considered in relation to the
performance of an MFC given that the core of its operation is based on microorganisms.
Since the field of biological fuel cells was re-opened, the majority of research has been
conducted in temperatures of around 30oC in controlled laboratory conditions (Logan,
2008). However, it is acknowledged that real field applications of MFCs would differ
from that environment, with the variations in conditions including temperatures. As
Figure 2-1 (B) indicates, MFC research is currently being conducted worldwide;
therefore, it is necessary for the influence of temperature to be examined in field
applications. In the present study, MFC deployment is examined for the case of Scotland,
an area of the UK with considerable adverse conditions regarding temperatures, which
can vary seasonally from -5oC to 22oC, often even with significant variations within a
single day (Met Office, 2016).
Chapter 2– Literature review
29
The majority of studies on temperature and its effect on biofilms seem to arrive at the
same conclusions. Temperature affects the growth of the microbial community, thus
MFCs operated at different temperatures but with the same original inoculum have
different biofilm formations, and the profile of the microbial community is also different
(Michie et al., 2011; Min, Román and Angelidaki, 2008; Catal et al., 2011). Results from
studies by Liu, Cheng and Logan (2005) and Min, Román and Angelidaki (2008) are in
accordance with this, and have demonstrated that beyond the start-up period, the power
densities achieved at 30oC and 32oC were reduced when the operational temperature was
reduced to 22oC, by a factor of 9 % and 12 % respectively. Ahn and Logan (2010)
conducted a temperature-phased experiment during which domestic wastewater was
passed first from a mesophilic single chamber open air cathode MFC to an ambient MFC,
and found that the maximum power density was achieved during the first stage of the
treatment. For temperatures lower than 20oC, which are realistic for field trials in many
areas around the globe including Scotland, a study by Larrosa-Guerrero et al. (2010)
involving the operation of an MFC using a mixture of domestic and brewery wastewater
from 4oC up to 35oC found a decline for both COD removal (from 94 % to 58 %
respectively), and power density.
Interestingly, in contrast to the research groups described above, Michie et al. (2011)
found that whilst start-up time was longer when the MFC was operated at 10oC than when
it was operated at 20oC and 35oC, less biomass accumulated in the reactor after the
biofilms were mature. Additionally, due to the low temperature, the level of
methanogenesis was lower at 20oC, whereas power outputs were highest at 10oC and
lowest at 35oC. It could therefore be argued that lower ambient temperatures might be
beneficial to the electrical performance of biofilms, especially since methanogenesis is
inhibited or at least is slowed at temperatures of around 10oC. This argument is also
supported by Jadhav and Ghangrekar (2009), who operated an MFC at two distinct
temperature ranges, 8-22oC and 20-35oC and found that coulombic efficiencies were
higher for the first range of temperatures, leading them to argue that the suppression of
methanogenesis, a competitive process, led to an increase in electrogenic activity, even
though a precise microbial analysis was not conducted.
It is therefore concluded that temperature can have contradictory effects on MFCs since
the technology is clearly based on bioelectrochemical principles. In bacterial systems,
Chapter 2– Literature review
30
the rates of reactions approximately double with every 10oC rise in operational
temperature (Rittmann and McCarty, 2001). However, the literature has shown that the
issue is more complicated, especially in the case of mixed consortia and complex
substrates such as real wastewater, and particularly when considering processes
competing with electrogenesis, such as methanogenesis. Therefore, examining the effects
of temperature changes, especially in ambient temperatures in field trials, is of key interest
in building better understanding which will support the commercial development of MFC
technology.
2.5 Microbial fuel cells for wastewater treatment
According to a UNEP report by Corcoran et al. (2010), two million tons of sewage,
industrial and agriculture waste is discharged into the world’s waterways every year.
Whether one looks at the situation in developing countries, where an estimated 90 % of
wastewater is discharged untreated directly back to the environment, or at the most
densely populated central cities of the world, half of which suffer from inadequate
infrastructure and lack the resources to deal with the wastewater generated, the message
is clear: unless urgent action is taken, the situation will only get worse by 2050, when the
global population will exceed nine billion.
Biological wastewater treatment is one of the most developed, established and efficient
methods of wastewater treatment practiced around the globe, and it utilises a broad range
of technologies which can in principle be categorised as aerobic or anaerobic (von
Sperling, 2007). The former is the most common biological method with which to treat
both municipal and industrial wastewaters, but it has an extremely intensive energy
demand since it requires a continuous feed of oxygen through the wastewater for it to be
used by the microbial community. Specifically, according to a report issued by the
Environmental Knowledge Transfer Network (2008) activated sludge aeration, one of the
most common aerobic technologies, contributes to almost up to 56 % of the energy cost
in sewage systems. The water and wastewater treatment market was projected to be worth
£10.30 billion by 2015 (Caffoor, 2008). Therefore, there is a clear market drive and
opportunity on the one hand for current technologies to be optimised, and on the other
hand for new innovative technologies to be developed that can also provide more
attractive options with regard to capital and operating costs (Caffoor, 2008).
Chapter 2– Literature review
31
Conventional wastewater treatment methods and the current situation
In the UK, wastewater treatment requires approximately 6.34 GWh of electricity on a
daily basis, which makes up almost for 1 % of the average daily electricity consumption
in England and Wales (Gude, 2016). Depending on the chosen process and the
composition of the wastewater, treatment requires about 0.5-2 kWh/m3 but at the same
time it contains about 3 to 10 times the energy required for its treatment which is locked
within it in various forms. Part of that energy is chemical, which is the form that physical,
chemical and microbial treatment utilises, in the form of carbon and nutrients, which
accounts for approximately 26 % of the overall energy available, the remaining being
thermal energy (Gude, Kokabian and Gadhamshetty, 2013; Gude, 2015).
Biological wastewater treatment methods are required to remove carbon and nutrients in
order to minimise impacts when returning the water back to the environment. These
impacts range from chronic ecosystem damage due to oxygen depletion of the receiving
waters from the biodegradation of organic matter to ecosystem damage via the
eutrophication of waters resulting from the excessive inputs of nutrients present in waste
water, and further, to potential health risks emanating from water-borne pathogens
(DEFRA, 2012). However, as mentioned earlier, conventional treatment systems,
especially aerobic treatments, are very energy-intensive; specifically, for 1 kg of COD to
be treated, 1.48 kWh are required, while for nitrogen the demand would be 13.44 kWh
and for phosphorus the energy need would be 6.44 kWh. However, if these chemicals
were recovered through the use of various other processes, the respective maximum
potential energy savings could be 3.86 kWh/kg COD, 19.3 kWh/kg N and 2.11 kWh/kg
P (McCarty, Bae and Kim, 2011).
Originally, the main purpose of those technologies in the field was to meet discharge
limits set by EU Directives and possibly stabilise the final effluent in order for it to be
further applied on land. Since compliance was the target and main drive, energy needs
were given on a secondary priority. However, from the very early stages, the shortage of
resources and the development of sustainability concepts indicated that there was a need
for a shift of focus. It became clear that there was a need to achieve the necessary
treatment quality with greater energy efficiency, or at least to achieve energy recovery at
the same time. Research in the field at the time demonstrated, as mentioned earlier, that
the energy potential locked in wastewaters was 3 to 10 times higher than the energy
Chapter 2– Literature review
32
required to treat them. For example, a study by Shizas and Bagley (2004), as quoted by
Gude (2016), found that the energy content in the methane produced by an anaerobic
digester operating on sludges of municipal primary and secondary wastewater treatment
generated 3.5 times the energy required for the operation of the plant, and this does not
even include the energy contained in agricultural and industrial wastewaters, as has been
demonstrated by another recent study of Heidrich, Curtis and Dolfing (2015).
Anaerobic digestion was soon identified as a potential way to address the issue of high
energy requirements, and through the years it became established as one of the most
efficient energy recovery systems, of particular interest to the waste treatment sector.
Anaerobic digestion involves a series of four processes leading to methane generation as
its last step. Complex organic compounds such as proteins, carbohydrates and fats are
converted to amino acids, fatty acids and sugars by the process of hydrolysis, which are
then converted to volatile fatty acids by acidogenesis. These are then further degraded
during acetogenesis to acetic acid, hydrogen and carbon dioxide. Finally, methanogenesis
takes place during which methane is produced (Appels et al., 2008). Research has shown
that AD with biogas utilisation can produce up to 350 kWh of electricity for each million
gallons of wastewater treated in a plant, depending on the type of specific technology
utilised (Gude, 2016).
Wastewater substrates in microbial fuel cells
The substrate consumed by any biological process is of vital importance since it serves
as carbon, nutrient and energy source. The chemical composition and the concentrations
of the substrate that can be converted in MFCs are therefore of key interest. Its influences
are not only integral, and possibly determinant of the composition of the bacterial
community in the anode biofilm, but it also affects the MFC performance including the
power density and coulombic efficiency, as was studied at an early stage by Chae et al.
(2009). In their research, the authors found that both coulombic efficiency and power
outputs varied with the different composition of substrates, but increased similarly in
response to the initial concentration of each substrate. Some substrates were found to be
preferable for electricity generation, whereas others seemed mostly to affect the
biodiversity of the biofilm, the diversity of which subsequently led to more efficient
substrate utilisation. Therefore, it was concluded that different substrates affect the
overall performance of an MFC in different ways.
Chapter 2– Literature review
33
Throughout the development of the field a variety of substrates has been used, the
majority of which, at the beginning at least, were acetate and glucose, pure compounds
or generally artificial substrates, because made-up substrates are well defined and their
composition can be strictly controlled (Pant et al., 2010). However, the suggestion of
using wastewater as a valuable substrate was then introduced in the early stages of
research (Allen and Bennetto, 1993). The direct conversion of waste into electricity or
high-value chemicals, which forms the basis of a bioelectrochemical system has since
been recognised as a better option and possibly as an answer to energy efficiency issues
by Logan (2008). Additionally, MFCs have considerable advantages over conventional
systems with regard to their use in wastewater treatment. They can indeed offer additional
energy savings due to anaerobic conditions and the elimination of technical aeration,
considering their open air cathode design (which will be further examined) and their
potential for both decentralised and centralised technology which is able to adjust to
specific needs. Since an MFC is an anaerobic or anoxic biological process, its bacterial
biomass production will be lower than that of an aerobic system. In its early stages, the
potential of reducing odours has also been considered as an advantage given that aeration
of wastewater is eliminated. With regard to the environment, MFCs can contribute to
water reclamation depending on the desired quality, have a low carbon footprint, and as
mentioned earlier, eliminate issues related to excess of sludge disposal. MFCs also
provide economic benefits with potential revenues through electricity generation, unlike
aerobic treatments which are solely targeting treatment, through the reclamation of high-
value chemicals such as in the case of struvite, and have low operational costs. However,
the main constraint still remains the use of expensive membranes, an issue in large scale
applications but currently being researched through investigations of membrane-less
MFCs. Finally, on an operational level, MFCs have been shown to be able to withstand
environmental stress through the robustness of their microbial communities, and they are
self-sustaining systems by conception (Rabaey and Verstraete, 2005; Scott, 2014; Pham
et al., 2006).
Pant et al. (2010) published a comprehensive review of the substrates used in MFCs,
including pure mediums, synthetic effluents, and real wastewaters. In the review,
glucose, acetate, lignocellulosic biomass, ethanol and a variety of real wastewaters
ranging from brewery and food wastewater to urban and domestic wastewaters was
presented, with the main outcome being that artificial mediums were preferred,
Chapter 2– Literature review
34
particularly at earlier days of the research field. Additionally, they found that brewery
wastewater has been a favourite context among researchers, due to its appropriate
strength, and the fact that the food-derived nature of the organic matter involved and the
lack of high concentrations of inhibitory substances, such as ammonia and ammonium
nitrogen, which is a common issue with animal-derived waste, made it a suitable
candidate for electricity generation. With the development of the field, an emerging trend
is that substrates are beginning to be more complex with higher organic load. The review,
however, had two more interesting outcomes. It managed to demonstrate the diversity of
inocula used as the microbial catalysts, which on the one hand shows the potential of the
MFC for diversification, and one the other hand shows the potential of taking different
approaches to the subject rather than there being a single right path. Finally, the study
pointed out an issue which only recently has begun to be addressed, which is that as a
technology in its development stage, a direct comparison between studies in the prior
literature is very difficult due to the use of different electrodes, substrates, inocula, etc.
Also, the reporting of power outputs can be done in several ways, which was why
normalised energy recovery was introduced, a concept which has been mentioned already
and will be further discussed in the experimental methods (He, 2013).
Regarding real wastewaters as substrates of MFCs, Table 2-2 below, as partially adapted
from Pant et al. (2010) and Scott and Hao Yu (2015), summarises the research to date
according to the category of wastewater and the reactor configuration, as will be discussed
in more detail below. It can be seen that over the last few years, the field of MFCs in
wastewater treatment has further diversified. The food and beverage industry still plays
a considerable role, since the effluents derived from that industry are rich in nutrients and
carbon sources yet not contaminated with heavy metals or potentially toxic elements
(Feng et al., 2008). Alcohol distillation process wastewater is similar in composition to
brewery, however, there has only been one study up to 2012 on this specific effluent. Ha
et al. (2012) studied the treatment of distillery wastewater with a thermophilic MFC and
were able to achieve higher power outputs than the levels recorded in literature at that
time, while achieving a coulombic efficiency of up to 89 %, maximum COD removal
efficiency of 76±3 % and maximum sulphate removal of 60.7±1.3 %.
It is noticeable that until 2010 when the review on MFC substrates by Pant et al. (2010)
was published, little research had been conducted in areas other than pure wastewater
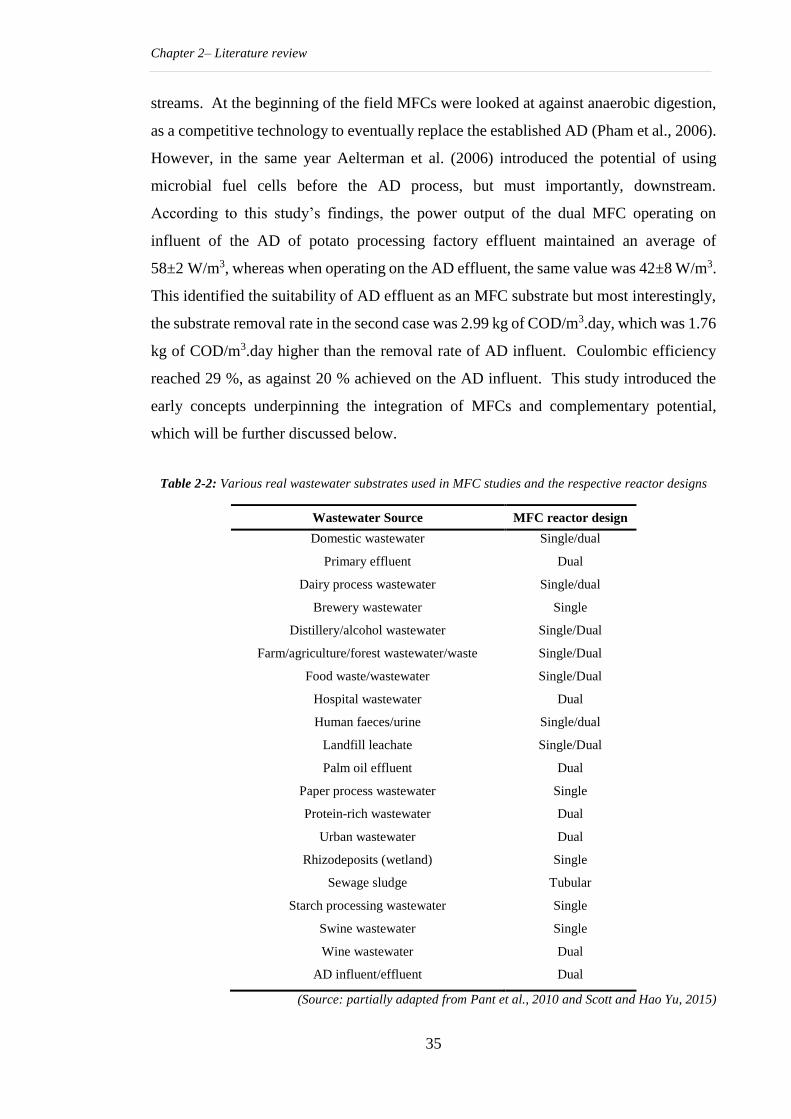
Chapter 2– Literature review
35
streams. At the beginning of the field MFCs were looked at against anaerobic digestion,
as a competitive technology to eventually replace the established AD (Pham et al., 2006).
However, in the same year Aelterman et al. (2006) introduced the potential of using
microbial fuel cells before the AD process, but must importantly, downstream.
According to this study’s findings, the power output of the dual MFC operating on
influent of the AD of potato processing factory effluent maintained an average of
58±2 W/m3, whereas when operating on the AD effluent, the same value was 42±8 W/m3.
This identified the suitability of AD effluent as an MFC substrate but most interestingly,
the substrate removal rate in the second case was 2.99 kg of COD/m3.day, which was 1.76
kg of COD/m3.day higher than the removal rate of AD influent. Coulombic efficiency
reached 29 %, as against 20 % achieved on the AD influent. This study introduced the
early concepts underpinning the integration of MFCs and complementary potential,
which will be further discussed below.
Table 2-2: Various real wastewater substrates used in MFC studies and the respective reactor designs
Wastewater Source MFC reactor design
Domestic wastewater Single/dual
Primary effluent Dual
Dairy process wastewater Single/dual
Brewery wastewater Single
Distillery/alcohol wastewater Single/Dual
Farm/agriculture/forest wastewater/waste Single/Dual
Food waste/wastewater Single/Dual
Hospital wastewater Dual
Human faeces/urine Single/dual
Landfill leachate Single/Dual
Palm oil effluent Dual
Paper process wastewater Single
Protein-rich wastewater Dual
Urban wastewater Dual
Rhizodeposits (wetland) Single
Sewage sludge Tubular
Starch processing wastewater Single
Swine wastewater Single
Wine wastewater Dual
AD influent/effluent Dual
(Source: partially adapted from Pant et al., 2010 and Scott and Hao Yu, 2015)
Chapter 2– Literature review
36
Whisky distillation process by-products
Distilling is practiced around the world and is one of the most profitable industry sectors.
For Scotland and the UK in general whisky distillation is a significant part of the food
and beverage industry. In Scotland, the whisky distillation industry provides almost
10,000 jobs, and in 2015, revenues from whisky exports generated £3.95 billion for the
UK balance of trade (Scotch Whisky Association, 2015). Heriot-Watt University is
highly involved in the sector and research to date has been targeted towards several
opportunities and applications of whisky by-products treatment. The industry in Scotland
is one of the country’s most vital, dominating the food and beverage exports of the UK
with 115 distilleries licenced to produce Scotch whisky located within the territory
(Scotch Whisky Association, 2015). The basic process has not changed for centuries, and
according to legislation water, yeast, malted barley and other cereals can only be used,
Scotch whisky must undergo a maturation process in oak casks for at least 3 years and
finally, it has to be produced and bottled in Scotland using traditional methods, and no
additives other than caramel are allowed (Piggott and Connor, 2003).
The main waste stream of the whisky distillation process consists of liquid residues. One
of these, spent wash, is the residual liquid produced by the grain distillation process. A
typical production rate is 8-15 litres of pot ale per litre of alcohol produced in the case of
malt whisky, and 16-21 litres of spent wash in the case of grain whisky (Mallick, Akunna
and Walker, 2010). The effluent generated from distillation without any treatment has a
temperature of around 70oC to 80oC, with a brown colour, high acidity and a
concentration of organic compounds and suspended solids. It is also very high in nutrients
such as phosphate, nitrogen compounds, and sulphate (Mohana, Acharya and Madamwar,
2009).
Various environmental issues are posed when effluent is discharged directly to the
environment, most of which are connected with direct de-oxygenation and eutrophication
(excess bloom, and an increase in phytoplankton in water bodies due to increased
nutrients), or that due to its caramel-dark colour it can block sunlight from water bodies,
thus reducing oxygen and inhibiting photosynthesis. Therefore, it is indisputable that
spent wash cannot be directly discharged, and must receive further treatment (Goodwin
and Stuart, 1994; Mallick, Akunna and Walker, 2010; Mohana, Acharya and Madamwar,
2009).
Chapter 2– Literature review
37
Anaerobic digestion and whisky distillation by-products
Several treatment methods have been identified over the years for treating distillery
derived effluents and, as described earlier, a moderate amount of research has been
performed on the utilisation of MFCs for this purpose. However, other biological
processes have become well established. Mohana, Acharya and Madamwar (2009)
published an extensive assessment of the potential treatment technologies suitable to deal
with spent wash. Physicochemical technologies have also been identified, such as
oxidation, adsorption, coagulation and flocculation; however, these are all associated with
the excessive use of chemicals, sludge production, and the further need for the disposal
of separated by-products. As with other industrial effluents, aerobic treatments have been
used; however, as well as high operational costs, there have been issues related to acidity,
high oxygen demand, and sludge bulking (Mallick, Akunna and Walker, 2010). In
contrast, anaerobic digestion has been identified and recognised from very early on as a
technology suitable for efficient and economic treatment (Goodwin, Finlayson and Low,
2001; Goodwin and Stuart, 1994; Mohana, Acharya and Madamwar, 2009).
The typical composition of whisky distillery effluent varies greatly and depends on the
process of distillation. COD, one of the key quality indicators of water and wastewater,
for distillery effluent, can vary from as high as between 30,000 mg/l to 50,000 mg/l, to as
low as between 1,000 mg/l to 2,000 mg/l. Due to this wide range of variance, the different
anaerobic technologies, with methane fermentation and subsequent energy recovery, are
suitable for the treatment of spent wash. Table 2-3 summarises and provides averages for
the key quality indicators of distillery effluent, both as a raw material and after anaerobic
digestion treatment. It can be seen that the values of both AD influent and effluent greatly
vary. According to the table, BOD is heavily reduced by more than 83 %, and COD is
considerably reduced during the process too by up to 72 %. TVS, sulphates and nitrogen
have the same fate, with reductions of more than 40 %, 60 % and 40 % respectively.
However, phosphate reduction is more moderate in AD, whereas the table also highlights
the issue of solids which is faced by most anaerobic processes.
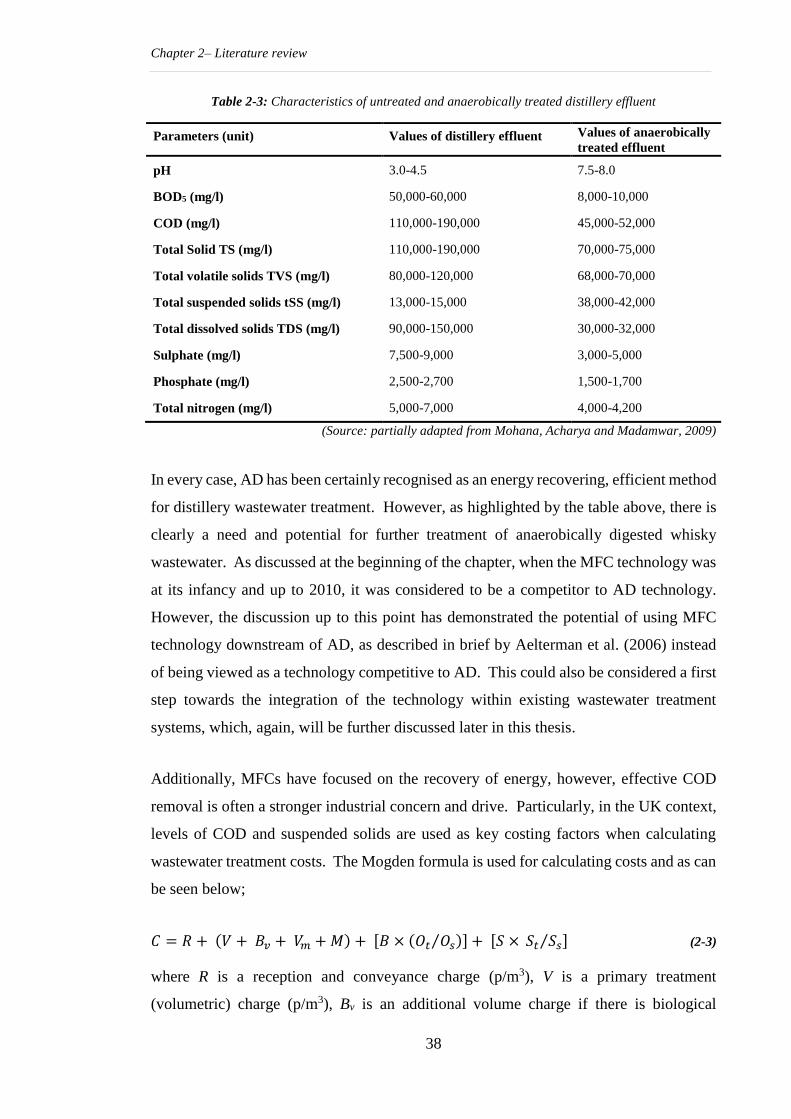
Chapter 2– Literature review
38
Table 2-3: Characteristics of untreated and anaerobically treated distillery effluent
Parameters (unit) Values of distillery effluent Values of anaerobically
treated effluent
pH 3.0-4.5 7.5-8.0
BOD5 (mg/l) 50,000-60,000 8,000-10,000
COD (mg/l) 110,000-190,000 45,000-52,000
Total Solid TS (mg/l) 110,000-190,000 70,000-75,000
Total volatile solids TVS (mg/l) 80,000-120,000 68,000-70,000
Total suspended solids tSS (mg/l) 13,000-15,000 38,000-42,000
Total dissolved solids TDS (mg/l) 90,000-150,000 30,000-32,000
Sulphate (mg/l) 7,500-9,000 3,000-5,000
Phosphate (mg/l) 2,500-2,700 1,500-1,700
Total nitrogen (mg/l) 5,000-7,000 4,000-4,200
(Source: partially adapted from Mohana, Acharya and Madamwar, 2009)
In every case, AD has been certainly recognised as an energy recovering, efficient method
for distillery wastewater treatment. However, as highlighted by the table above, there is
clearly a need and potential for further treatment of anaerobically digested whisky
wastewater. As discussed at the beginning of the chapter, when the MFC technology was
at its infancy and up to 2010, it was considered to be a competitor to AD technology.
However, the discussion up to this point has demonstrated the potential of using MFC
technology downstream of AD, as described in brief by Aelterman et al. (2006) instead
of being viewed as a technology competitive to AD. This could also be considered a first
step towards the integration of the technology within existing wastewater treatment
systems, which, again, will be further discussed later in this thesis.
Additionally, MFCs have focused on the recovery of energy, however, effective COD
removal is often a stronger industrial concern and drive. Particularly, in the UK context,
levels of COD and suspended solids are used as key costing factors when calculating
wastewater treatment costs. The Mogden formula is used for calculating costs and as can
be seen below;
𝐶 = 𝑅 + (𝑉 + 𝐵𝑣 + 𝑉𝑚 + 𝑀) + [𝐵 × (𝑂𝑡 𝑂𝑠⁄ )] + [𝑆 × 𝑆𝑡 𝑆𝑠⁄ ] (2-3)
where R is a reception and conveyance charge (p/m3), V is a primary treatment
(volumetric) charge (p/m3), Bv is an additional volume charge if there is biological
Chapter 2– Literature review
39
treatment (p/m3), M is a treatment and disposal charge where effluent goes to sea outfall
(p/m3), B is a biological oxidation of settled sewage charge (p/kg), Ot is the Chemical
Oxygen Demand (COD) of the effluent after one hour of quiescent settlement at pH 7, Os
is the Chemical Oxygen Demand (COD) of crude sewage after one hour of quiescent
settlement, S is a treatment and disposal of primary sewage sludge charge (p/kg), St
represents the Total Suspended Solids of the effluent at pH 7 (mg/l), and Ss is the amount
of Total Suspended Solids of crude sewage (mg/l) (Wrap, 2016). It is therefore suggested
that MFCs can work in a complementary way to existing technologies in polishing off
industrial wastewaters prior to their final discharge to a commercial wastewater treatment
plant, in order to achieve lower charges and guarantee compliance with local regulators.
2.6 Microbial fuel cell scale-up and pilot scale studies
Research on the topic of MFCs might be sharply increasing, especially in a laboratory
setting, but the need for more practical feedback from field applications has been
identified since the first large scale applications encountered difficulties (Logan, 2010).
The purpose of this study, as set out above, is to investigate the potential of an industrial
scale MFC in the Scottish whisky industry, thus a review of work on similar scale, along
with relevant field trials and key lessons learned, will provide insight into the current
status of pilot scale field trials.
Table 2-4 summarises the various studies carried out to date in which real wastewaters
have been used as substrates in pilot scale MFCs. The information presented provides a
holistic overview of scaling-up attempts to date, including reactor configurations, the
wastewater substrates used, the chosen operation temperature, and electrical and effluent
quality performance. The following table is a summary only of microbial fuel cell studies,
excluding microbial electrolysis cells or any other kind of MET, due to the sense that
these have very distinct functions, that have been conducted in reactors bigger that 1 L
and are thus considered large scale, and finally, studies that have been operated in real
wastewaters. Several other studies of similar scale have been carried out in artificial
substrates, or within the large scale classification and with real wastewaters, but which
were treated by hydrogen producing cells (microbial electrolysis cells) or by the recently
popular constructed wetland fuel cells. These will not be examined at this point, in order
to specifically define the area of interest and niche.
Chapter 2– Literature review
40
As can be seen in Table 2-4, the total reactor volume in scale-up field studies varies
considerably from a minimum of 1 L up to 250 L, with the majority being less than 20 L.
Currently, the largest reactor in terms of volume was reported by Feng et al. (2014), who
constructed a 250 L horizontal flat plate MFC that operated for 130 days on municipal
wastewater, however it had a very long hydraulic retention time (HRT) of 6 days. Even
though a variety of designs is reported in the literature as seen in Table 2-4 (Zhou et al.,
2013; Hernández-Fernández et al., 2015a), the majority of large scale field trials have
focused on mostly tubular MFCs or flat-plate trays, with the majority of MFCs bigger
than 20 L being stackable plug-flow flat-plate designs. As will be described in more
detail later, this was the chosen design for the development of the present study. To date,
different scaling-up scenarios in regards to reactor designs have been examined around
the world without any study conclusively proving the superiority of one design over the
others.
As was mentioned earlier, one of the interests of the current study is the temperature
during the period of operation, a factor which has therefore been included in the table
below. The majority of studies in Table 2-4 were conducted either at room temperature,
which by definition is around 20oC or higher, with 30oC being a common operational
temperature reported (at least ten out of the 18, with three not reporting their operational
temperature). These temperatures are usually very well suited to mesophilic
microorganisms, for which optimum temperatures are between 30oC to 35oC, as it is also
the typical temperature in mesophilic anaerobic digestion (Gerardi, 2003). In relation to
the studies referred to below, which are from exhaustive, very few were conducted in
ambient temperatures. However, those that did demonstrated a similarly successful
operational efficiency both with regard to wastewater treatment and to power output.
Even though MFCs are the sole focus in this section, it should be mentioned that other
fuel cells such as MECs have also shown successful results in ambient environments, but
they are out of the scope of the current study (Heidrich et al., 2014). Overall, the need
for further experience in ambient temperatures in field trials is highlighted in Table 2-4.
As in most cases in the field of MFCs, and was pointed out earlier in the review, direct
comparisons of the electrical performance of MFCs are impossible due to the fact that
power can be normalised either over surface area, of the anode or cathode (if not specified,
the convention is the anode surface area), or over the volume of the reactor. For this
Chapter 2– Literature review
41
reason, over the last few years Normalised Energy Recovery has been used as the standard
way to report energy recovery (see Chapter 3.3). In the studies discussed here, regarding
volumetric normalisation, Ge and He (2016) only very recently achieved the highest
power output of 1,000 mW/m3 operating a modularised stack consisting of 96 tubular
sub-reactors operating on primary effluent for almost 360 days at an HRT of 18 h and
ambient temperatures. This can be regarded as a particularly successful trial as it also
achieved an average of 76.8 % COD removal efficiency, therefore certainly expanding
the collective knowledge on the field.
Regarding effluent quality, an up to date assessment of past studies is certainly much
simpler. COD removal efficiency (which typically refers to total COD removal
efficiency, unless stated otherwise) is used as the major key performance indicator. Yu
et al. (2012) achieved a maximum of 95.7 % COD removal efficiency in domestic
wastewater treated in a baffled reactor operating at room temperature. However,
according to their findings, this removal was achieved at the lowest organic load rate and
further declined as the organic load increased. Most of the research studies presented
here follow this very closely regarding treatment efficiency, which clearly highlights the
potential of MFCs in the wastewater treatment field.
As an overview, it can be concluded that none of the above studies claimed to have
optimised performance. Additionally, different regimes have been attempted for all the
parameters included above, from substrates to reactor architecture. However, only
Hiegemann et al. (2016) have examined the potential of directly integrating a large scale
MFC into an existing treatment process. The need for further research and field
experience on flat plate MFCs is also highlighted, since they are considered a valid
candidate for the further scaling-up of the technology. Therefore, the examination of a
plug-flow, flat plate MFC downstream of an AD has the potential to shed more light into
the field of industrial MFC applications for wastewater treatment.
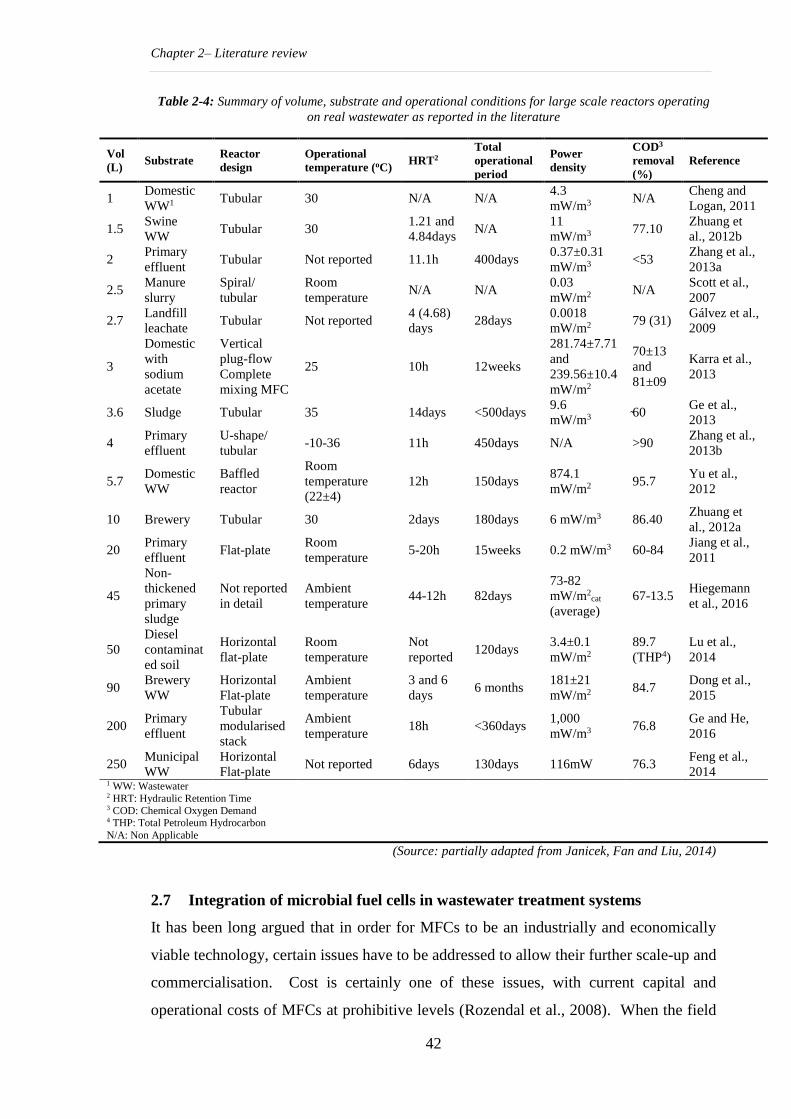
Chapter 2– Literature review
42
Table 2-4: Summary of volume, substrate and operational conditions for large scale reactors operating
on real wastewater as reported in the literature
Vol
(L) Substrate
Reactor
design
Operational
temperature (oC) HRT2
Total
operational
period
Power
density
COD3
removal
(%)
Reference
1 Domestic
WW1 Tubular 30 N/A N/A
4.3
mW/m3 N/A
Cheng and
Logan, 2011
1.5 Swine
WW Tubular 30
1.21 and
4.84days N/A
11
mW/m3 77.10
Zhuang et
al., 2012b
2 Primary
effluent Tubular Not reported 11.1h 400days
0.37±0.31
mW/m3 <53
Zhang et al.,
2013a
2.5 Manure
slurry
Spiral/
tubular
Room
temperature N/A N/A
0.03
mW/m2 N/A
Scott et al.,
2007
2.7 Landfill
leachate Tubular Not reported
4 (4.68)
days 28days
0.0018
mW/m2 79 (31)
Gálvez et al.,
2009
3
Domestic
with
sodium
acetate
Vertical
plug-flow
Complete
mixing MFC
25 10h 12weeks
281.74±7.71
and
239.56±10.4
mW/m2
70±13
and
81±09
Karra et al.,
2013
3.6 Sludge Tubular 35 14days <500days 9.6
mW/m3 60
Ge et al.,
2013
4 Primary
effluent
U-shape/
tubular -10-36 11h 450days N/A >90
Zhang et al.,
2013b
5.7 Domestic
WW
Baffled
reactor
Room
temperature
(22±4)
12h 150days 874.1
mW/m2 95.7
Yu et al.,
2012
10 Brewery Tubular 30 2days 180days 6 mW/m3 86.40 Zhuang et
al., 2012a
20 Primary
effluent Flat-plate
Room
temperature 5-20h 15weeks 0.2 mW/m3 60-84
Jiang et al.,
2011
45
Non-
thickened
primary
sludge
Not reported
in detail
Ambient
temperature 44-12h 82days
73-82
mW/m2cat
(average)
67-13.5 Hiegemann
et al., 2016
50
Diesel
contaminat
ed soil
Horizontal
flat-plate
Room
temperature
Not
reported 120days
3.4±0.1
mW/m2
89.7
(THP4)
Lu et al.,
2014
90 Brewery
WW
Horizontal
Flat-plate
Ambient
temperature
3 and 6
days 6 months
181±21
mW/m2 84.7
Dong et al.,
2015
200 Primary
effluent
Tubular
modularised
stack
Ambient
temperature 18h <360days
1,000
mW/m3 76.8
Ge and He,
2016
250 Municipal
WW
Horizontal
Flat-plate Not reported 6days 130days 116mW 76.3
Feng et al.,
2014 1 WW: Wastewater 2 HRT: Hydraulic Retention Time 3 COD: Chemical Oxygen Demand 4 THP: Total Petroleum Hydrocarbon
N/A: Non Applicable
(Source: partially adapted from Janicek, Fan and Liu, 2014)
2.7 Integration of microbial fuel cells in wastewater treatment systems
It has been long argued that in order for MFCs to be an industrially and economically
viable technology, certain issues have to be addressed to allow their further scale-up and
commercialisation. Cost is certainly one of these issues, with current capital and
operational costs of MFCs at prohibitive levels (Rozendal et al., 2008). When the field
Chapter 2– Literature review
43
was becoming established, MFCs were viewed as a technology which could be
competitive with anaerobic digestion. It has, however, been estimated that a unit price of
£2-£42 per 10 L of tubular reactor would be necessary in order to make the technology
competitive against AD in wastewater treatment (Scott and Hao Yu, 2015).
Current practice in the wastewater treatment field demonstrates that successful processing
plants do not utilise a single technology to achieve the full treatment of effluents
(McCarty, Bae and Kim, 2011). For this reason, it has been suggested that the integration
of MFC technology into biohydrogen and biomethane anaerobic treatment processes
could lead to improved energy recovery and sustainability of both the MFCs and the
processes which they are deployed with (Aelterman et al., 2006; Premier et al., 2013;
Kelly and He, 2014).
On a theoretical level, Sheets et al. (2015) examined the potential of reusing anaerobically
digested effluent derived from agricultural and food waste, which is currently used
primarily for land application and crop nutrition. The research raised the concern that as
AD has already stabilised the waste stream, there isn’t much readily biodegradable COD
available in an already digested effluent. Inconclusive research is cited with regard to
this topic but overall, the group suggests that the specific composition of the waste could
potentially allow MFCs to be used sequentially to AD; therefore, the concept of
integration should be further examined. Tugtas, Cavdar and Calli (2013) examined the
potential of further polishing-up anaerobically treated landfill leachate with a dual
chamber MFC. The young leachate underwent anaerobic digestion and was passed
through the MFC, achieving a maximum current density of 109 mW/m2, with 90 %
simultaneous total volatile fatty acids (VFAs) removal efficiency. A comparative study
involving raw and digested pig slurry showed that, as expected, higher COD efficiencies
were achieved when raw slurry was utilised in an MFC, due to COD influent values
representing readily biodegradable COD, but ammonium reduction was greater in the
AD-MFC model rather than when raw slurry was used (Cerrillo et al., 2016). Similar
results were obtained by Kim et al. (2015), who examined the treatment of COD and
ammonia in an MFC from digested swine waste, also highlighting the inefficiency of AD
in successfully managing nitrogen rich effluents, unlike the MFC anode-cathode system
that created a COD/total ammonia nitrogen ratio which was more useful for further COD
reduction. Finally, a more collective integration was attempted by Hou et al. (2016), who
Chapter 2– Literature review
44
utilised algae in the anode of a tubular MFC to treat anaerobically digested kitchen waste,
achieving the integration of a photobioreactor and MFC technology downstream of an
AD. The study achieved a maximum power density of 6255 mW/m3 although the ratio
of nitrogen and phosphorus due to the algal treatment seemed to affect COD removal,
leading to a low rate of COD reduction efficiency.
In this section, studies using AD as a clearly separate previous step were described, with
prototypes of AD-MFC integrated technology within one reactor excluded from the
discussion. Additionally, studies on AD and microbial electrolysis cells were not
included in the current examination due to the focus of this study being on microbial fuel
cells rather than on all microbial electrochemical technologies. All the research presented
up to this point demonstrates the clear potential of utilising MFCs downstream of AD,
rather than considering the former solely as a competitor of the latter. This study will
examine the potential of utilising both dilute spent wash and anaerobically digested spent
wash derived from the grain whisky distillation process, in order to demonstrate the
beneficial use of MFCs in this traditional Scottish industrial sector.
2.8 Modelling of microbial fuel cells and losses
Modelling is a powerful tool used across different disciplines, in order to study the
behaviour of processes and reactions in depth, for instance in both chemical and
biological terms. Specifically, in the case of MFCs, there have been several research
papers on experimental observation, but less research has been focused on developing a
model that would attempt to describe and predict the performance of an MFC based on
certain laws and equations that define MFC performance generally (Ortiz-Martínez et al.,
2015). The advantages of modelling followed by experimental verification are that a
deeper understanding can be gained of where the inefficiencies lie, and areas for potential
improvement can be identified in order to further optimise the system, bringing us a step
closer to scaling-up to an industrial-size system.
In order for a model to be developed, there is a need to identify the key losses occurring
in an MFC. The potential measured when no current is passing through the MFC’s
electrical circuit (point of infinite resistance), referred to as Open Circuit Voltage (OCV),
is in the order of 750–800 mV. When the circuit is connected to an external resistance,
the voltage measured, referred to as Closed Circuit Voltage (CCV), decreases
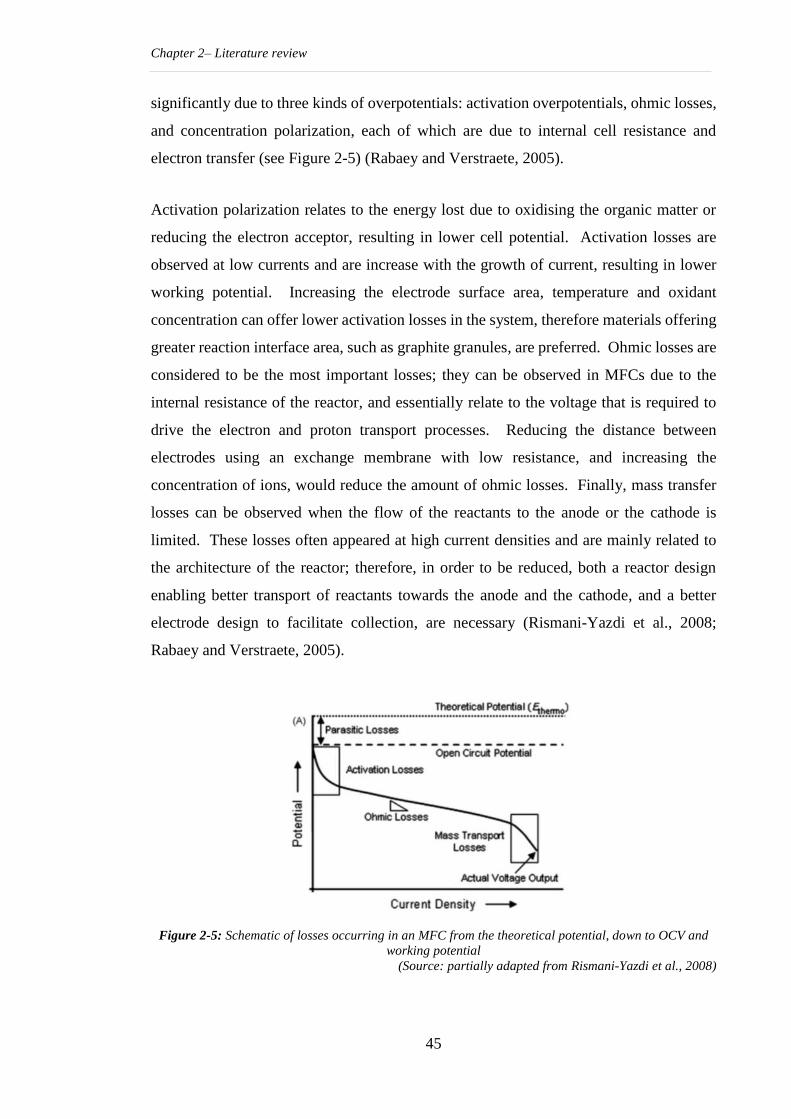
Chapter 2– Literature review
45
significantly due to three kinds of overpotentials: activation overpotentials, ohmic losses,
and concentration polarization, each of which are due to internal cell resistance and
electron transfer (see Figure 2-5) (Rabaey and Verstraete, 2005).
Activation polarization relates to the energy lost due to oxidising the organic matter or
reducing the electron acceptor, resulting in lower cell potential. Activation losses are
observed at low currents and are increase with the growth of current, resulting in lower
working potential. Increasing the electrode surface area, temperature and oxidant
concentration can offer lower activation losses in the system, therefore materials offering
greater reaction interface area, such as graphite granules, are preferred. Ohmic losses are
considered to be the most important losses; they can be observed in MFCs due to the
internal resistance of the reactor, and essentially relate to the voltage that is required to
drive the electron and proton transport processes. Reducing the distance between
electrodes using an exchange membrane with low resistance, and increasing the
concentration of ions, would reduce the amount of ohmic losses. Finally, mass transfer
losses can be observed when the flow of the reactants to the anode or the cathode is
limited. These losses often appeared at high current densities and are mainly related to
the architecture of the reactor; therefore, in order to be reduced, both a reactor design
enabling better transport of reactants towards the anode and the cathode, and a better
electrode design to facilitate collection, are necessary (Rismani-Yazdi et al., 2008;
Rabaey and Verstraete, 2005).
Figure 2-5: Schematic of losses occurring in an MFC from the theoretical potential, down to OCV and
working potential
(Source: partially adapted from Rismani-Yazdi et al., 2008)
Chapter 2– Literature review
46
How complicated the proposed model could be depends on a variety of factors including
the dimensions selected, certain assumptions made, and most importantly on the level of
detail used to describe the complexity of the process taking place in an MFC. By its
nature, an MFC is a cross-disciplinary subject which as a process includes mass transfer,
different phases of matter, microbial growth, and the electrochemical behaviour of the
overall system. In a recent review by Ortiz-Martínez et al. (2015), MFC models were
divided into two major categories depending on the approach they followed: (a) global
models studying the overall behaviour of MFCs, and (b) specific models describing key
components, variables and processes in MFCs. The majority of the first group specialise
in specific facets of the MFC process such as biochemical and biofilm study, based mostly
on the Monod equation and Nernst equation, with complicated modelling processes.
In the first case, the models attempting to describe the behaviour of the overall system
adopted two main directions. At first, research evolved around the anode, addressing the
interactions occurring solely on the half cell. The first model attempted by Zhang and
Halme (1995) was a one-dimensional model based on a dual chamber MFC operating on
fermented marine sediment, with a buffer solution and an electron mediator. The model
addressed mass balance and substrate oxidation in the anode, current generation in the
cell, and the basic electrochemical behaviour involved in the mediated electron transfer.
More complex models were later developed solely focusing on the biofilm interactions
on the anode of an MFC (Marcus, Torres and Rittmann, 2007; Picioreanu et al., 2007).
However, since the cathode has been identified as the limiting factor, the second direction
observed for global models included the reactions occurring both in the anode and the
cathode. These models were considerably more complicated yet also holistic, and thus
can possibly be regarded as more realistic in describing an MFC process (Zeng et al.,
2010; Oliveira et al., 2013).
With regard to the second category of specific models, a basic, simpler electrochemical
model that attempts to describe the overall performance of an MFC was described in the
early studies by Wen et al. (2009), chronologically the second to have attempted to
describe the MFC process. The model is based on the equation describing the real voltage
output of a fuel cell, as the thermodynamically predicted voltage minus the various
overvoltage losses that occur in all fuel cells; chemical and microbial (Larminie and
Dicks, 2003). The equation describing the principles of the electrochemical performance
Chapter 2– Literature review
47
of a fuel cell is used to quantify parameters that are then verified against experimental
results. The group found that this model is capable of describing the performance of a
180 mL single chamber open air cathode MFC operating on beer brewery wastewater. It
is the work based on this simple model that will be further adapted in the present study in
order to attempt to describe the performance of the multi-electrode plug-flow MFC
operating on AD liquid digestate derived from the whisky distillation process.
2.9 Chapter conclusions
This chapter, as the beginning of the present study’s detailed examination of MFC
technology, has presented the theoretical and technical background upon which the
current study is based. It started with a review of the progression of the field in recent
years, after the field was revived by Allen and Bennetto in 1993, moving on to give an
overview of the work performed to date. The principal operations were described, and
the basic components were examined, from the anode, cathode and membrane separator
to the architectural layouts formed by those components and various designs. Materials
are an integral part of this technology, so a review of the most typically used materials
was necessary for each component. Additionally, the microbial aspect is obviously a
central point of interest, and as such it was examined during this survey, from the
mechanisms of electron transfer and inocula to the effects of temperature.
Moving on from general principles and applications, the chapter further focused on the
use of microbial fuel cells for wastewater treatment through revisiting traditional
treatment technologies, and latterly it summarised the various wastewater substrates with
an industrial focus. At this point of the literature research, whisky distillation process
by-products were introduced both at a raw level and subsequent to anaerobic treatment.
The chapter then focused on pilot scale applications of microbial fuel cells for the
treatment of industrial wastewaters, thus setting out the main focus of the later
experimental work: the implementation and integration of MFC technology in the whisky
distillation by-products industry. The chapter finally introduced the basic theoretical
background of microbial fuel cell electrochemistry and modelling.
Due to their nature and as deduced from the above literature review, microbial fuel cells
are a multi-disciplinary technology combining various scientific areas, from materials to
electrochemistry, biology, and process deployment. Therefore, it is strongly believed that

Chapter 2– Literature review
48
this literature survey has examined every basic facet of the technology as thoroughly as
possible, focusing on the industrial deployment of MFCs in the wastewater treatment
sector and their integration with existing treatment technologies, which is the main focus
and objective of this study, as will be further developed in the following chapters.
49
Chapter 3- Materials, designs and general methods
3.1 Introduction
In this chapter, the different facets of the experimental design and process are presented.
The materials used in the development of a microbial fuel cell will be described in detail,
along with the methods of preparation of the different components of the system. A
detailed design will follow, demonstrating the set-up of the physical unit. The methods
used and the relevant calculations regarding the electrical performance of each electrode
and of the overall unit will be described. Finally, the methods and relevant calculations
used in the determination of the effluent quality will be set out.
3.2 Multi-electrode microbial fuel cell
The reactor constructed for the purposes of this study can be characterised as a plug-flow,
multi-electrode bioelectrochemical reactor based on the initial description and studies by
Fedorovich et al. (2009). In terms of liquid flow, the influent follows a serial serpentine
circulation, while different electrical connections are attempted during the study.
With regard to electrode design, the same cathode design was used throughout the study,
but for the anodic electrode, various designs were attempted, as will be further described.
From an overall perspective, the reactor comprises eight anodes and eight cathodes, so
regardless of the electrical connections between these, the system is considered a
multi-electrode reactor.
Reactor design
Independently of the anode design used in specific experimental stages, the eight anodes
and eight cathodes were placed in the cell as can be seen below in Figure 3-1. The overall
horizontal reactor had an external dimension of 98 cm x 98 cm x 16 cm, and was made
of polyvinyl chloride (PVC) panels which were soldered in place, with an overall volume
of 122 L. The cathodes (2) were fixed in place with an extra inactive adhesive layer for
leakage protection. The anodes (1) were fixed in an upright position in the reactor,
standing on the bottom, held in place by their tight fit and a metal pin connected to the
outer side of the cell wall, from where the electrical circuits were connected. A final
electrically inactive compartment (95 cm x 6.5 cm x 13.5 cm) was used as the effluent
collecting path. The aforementioned construction led to an active anodic volume of 57 L.
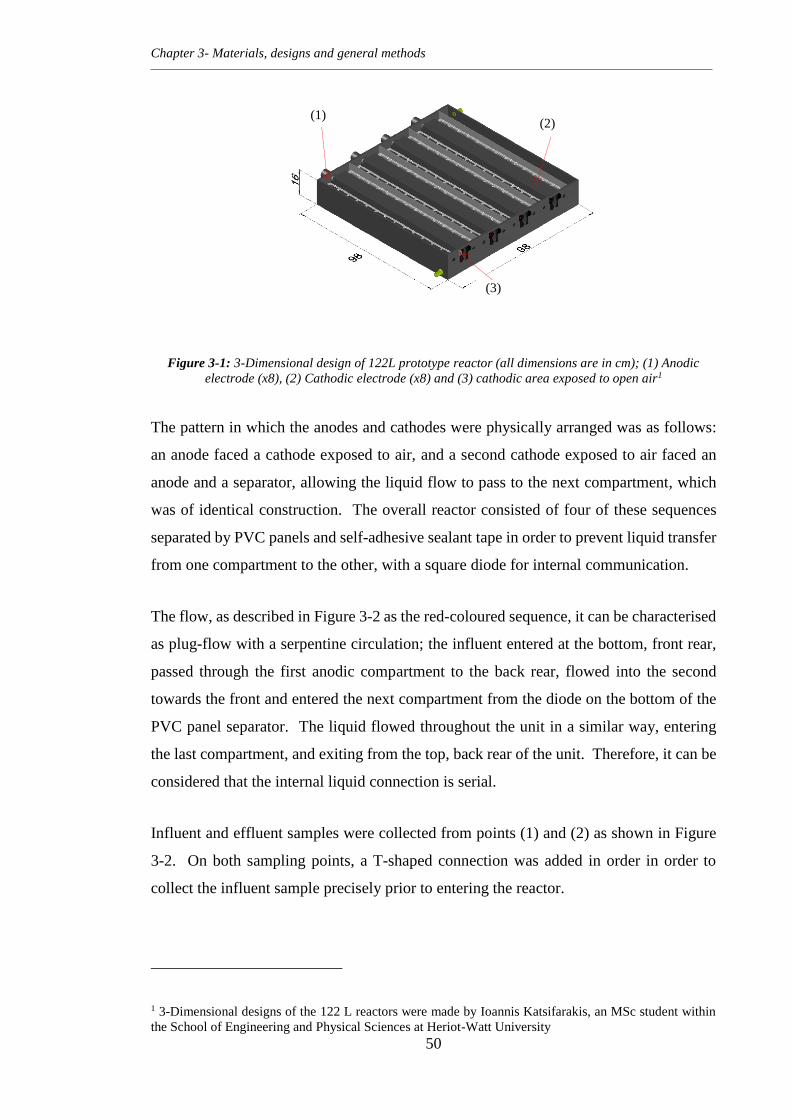
Chapter 3- Materials, designs and general methods
50
Figure 3-1: 3-Dimensional design of 122L prototype reactor (all dimensions are in cm); (1) Anodic
electrode (x8), (2) Cathodic electrode (x8) and (3) cathodic area exposed to open air1
The pattern in which the anodes and cathodes were physically arranged was as follows:
an anode faced a cathode exposed to air, and a second cathode exposed to air faced an
anode and a separator, allowing the liquid flow to pass to the next compartment, which
was of identical construction. The overall reactor consisted of four of these sequences
separated by PVC panels and self-adhesive sealant tape in order to prevent liquid transfer
from one compartment to the other, with a square diode for internal communication.
The flow, as described in Figure 3-2 as the red-coloured sequence, it can be characterised
as plug-flow with a serpentine circulation; the influent entered at the bottom, front rear,
passed through the first anodic compartment to the back rear, flowed into the second
towards the front and entered the next compartment from the diode on the bottom of the
PVC panel separator. The liquid flowed throughout the unit in a similar way, entering
the last compartment, and exiting from the top, back rear of the unit. Therefore, it can be
considered that the internal liquid connection is serial.
Influent and effluent samples were collected from points (1) and (2) as shown in Figure
3-2. On both sampling points, a T-shaped connection was added in order in order to
collect the influent sample precisely prior to entering the reactor.
1 3-Dimensional designs of the 122 L reactors were made by Ioannis Katsifarakis, an MSc student within
the School of Engineering and Physical Sciences at Heriot-Watt University
(2)
(3)
(1)
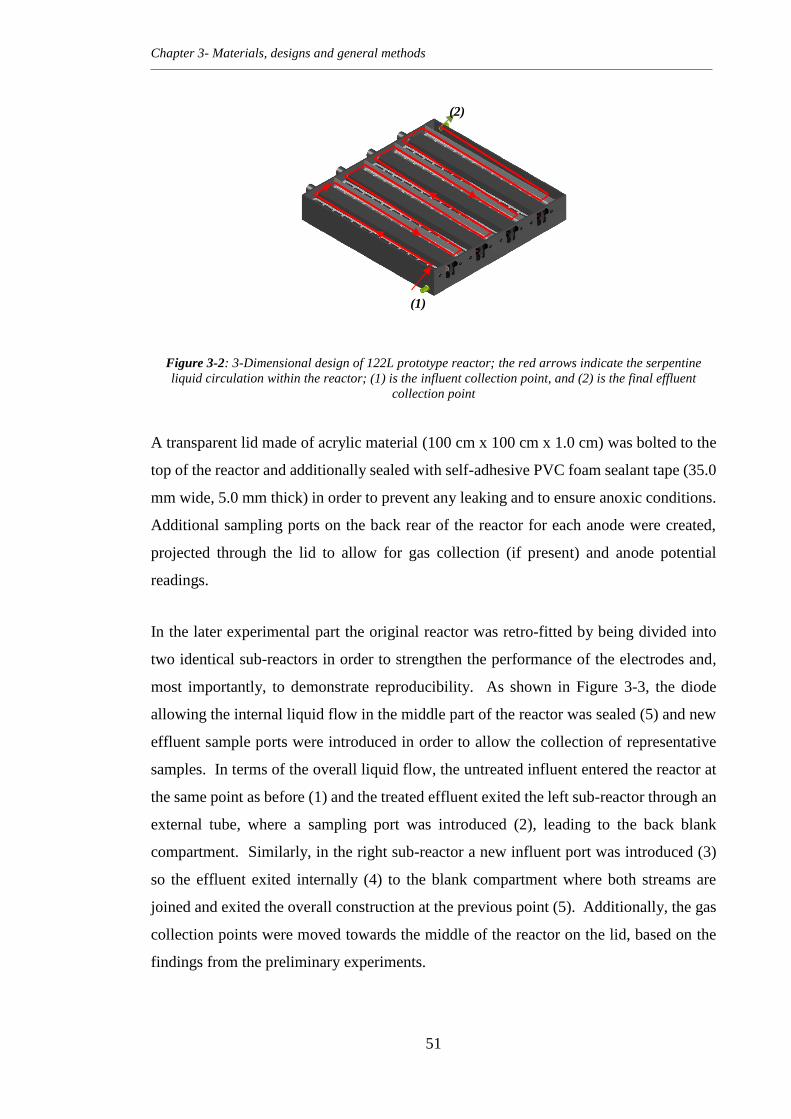
Chapter 3- Materials, designs and general methods
51
Figure 3-2: 3-Dimensional design of 122L prototype reactor; the red arrows indicate the serpentine
liquid circulation within the reactor; (1) is the influent collection point, and (2) is the final effluent
collection point
A transparent lid made of acrylic material (100 cm x 100 cm x 1.0 cm) was bolted to the
top of the reactor and additionally sealed with self-adhesive PVC foam sealant tape (35.0
mm wide, 5.0 mm thick) in order to prevent any leaking and to ensure anoxic conditions.
Additional sampling ports on the back rear of the reactor for each anode were created,
projected through the lid to allow for gas collection (if present) and anode potential
readings.
In the later experimental part the original reactor was retro-fitted by being divided into
two identical sub-reactors in order to strengthen the performance of the electrodes and,
most importantly, to demonstrate reproducibility. As shown in Figure 3-3, the diode
allowing the internal liquid flow in the middle part of the reactor was sealed (5) and new
effluent sample ports were introduced in order to allow the collection of representative
samples. In terms of the overall liquid flow, the untreated influent entered the reactor at
the same point as before (1) and the treated effluent exited the left sub-reactor through an
external tube, where a sampling port was introduced (2), leading to the back blank
compartment. Similarly, in the right sub-reactor a new influent port was introduced (3)
so the effluent exited internally (4) to the blank compartment where both streams are
joined and exited the overall construction at the previous point (5). Additionally, the gas
collection points were moved towards the middle of the reactor on the lid, based on the
findings from the preliminary experiments.
(1)
(2)
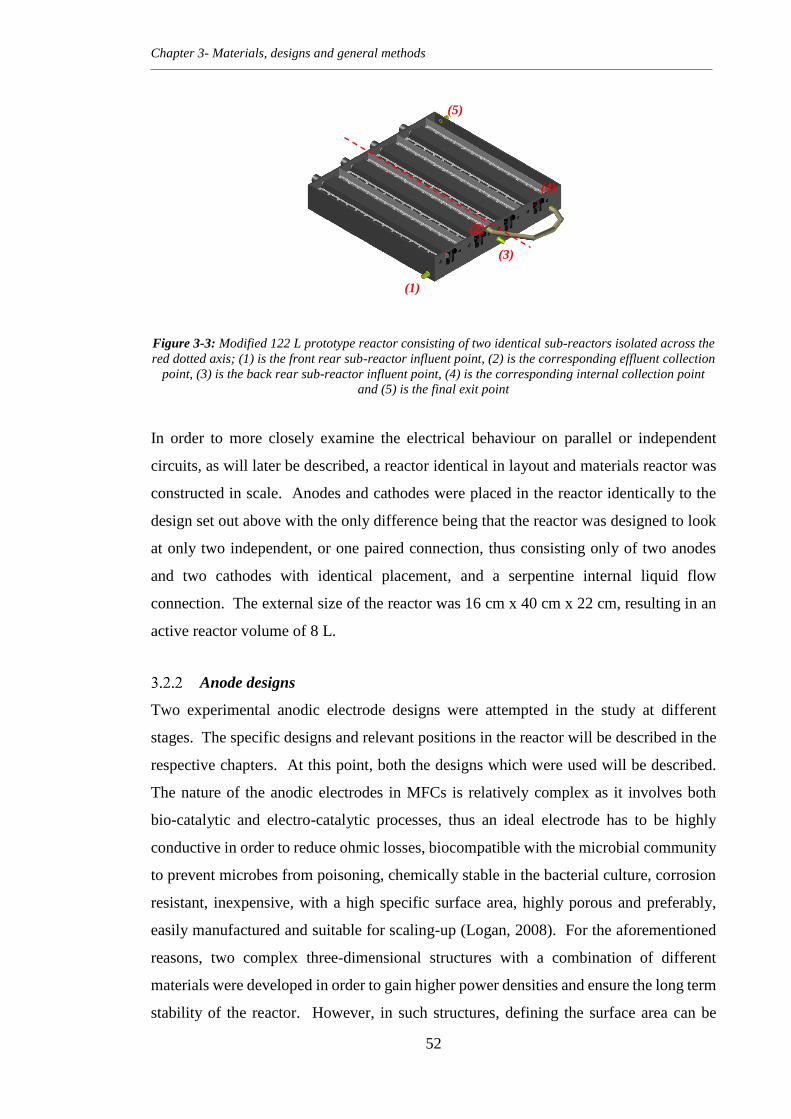
Chapter 3- Materials, designs and general methods
52
Figure 3-3: Modified 122 L prototype reactor consisting of two identical sub-reactors isolated across the
red dotted axis; (1) is the front rear sub-reactor influent point, (2) is the corresponding effluent collection
point, (3) is the back rear sub-reactor influent point, (4) is the corresponding internal collection point
and (5) is the final exit point
In order to more closely examine the electrical behaviour on parallel or independent
circuits, as will later be described, a reactor identical in layout and materials reactor was
constructed in scale. Anodes and cathodes were placed in the reactor identically to the
design set out above with the only difference being that the reactor was designed to look
at only two independent, or one paired connection, thus consisting only of two anodes
and two cathodes with identical placement, and a serpentine internal liquid flow
connection. The external size of the reactor was 16 cm x 40 cm x 22 cm, resulting in an
active reactor volume of 8 L.
Anode designs
Two experimental anodic electrode designs were attempted in the study at different
stages. The specific designs and relevant positions in the reactor will be described in the
respective chapters. At this point, both the designs which were used will be described.
The nature of the anodic electrodes in MFCs is relatively complex as it involves both
bio-catalytic and electro-catalytic processes, thus an ideal electrode has to be highly
conductive in order to reduce ohmic losses, biocompatible with the microbial community
to prevent microbes from poisoning, chemically stable in the bacterial culture, corrosion
resistant, inexpensive, with a high specific surface area, highly porous and preferably,
easily manufactured and suitable for scaling-up (Logan, 2008). For the aforementioned
reasons, two complex three-dimensional structures with a combination of different
materials were developed in order to gain higher power densities and ensure the long term
stability of the reactor. However, in such structures, defining the surface area can be
(3)
(2)
(1)
(5)
(4)
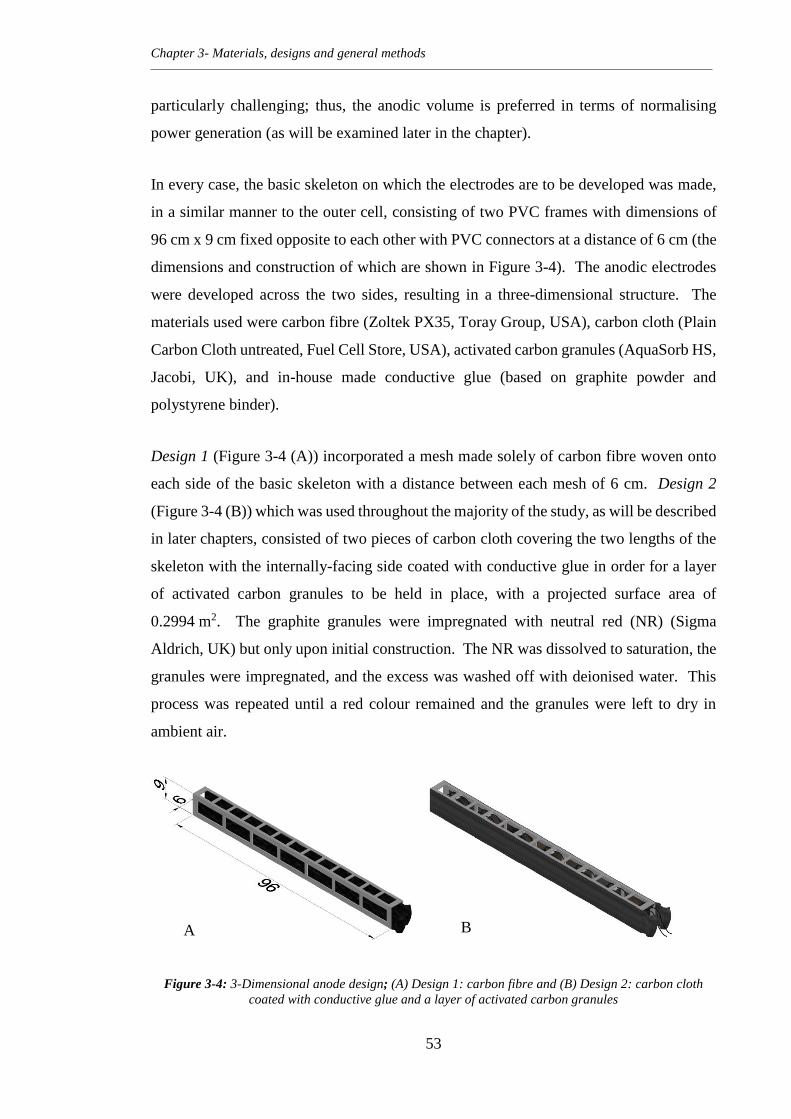
Chapter 3- Materials, designs and general methods
53
particularly challenging; thus, the anodic volume is preferred in terms of normalising
power generation (as will be examined later in the chapter).
In every case, the basic skeleton on which the electrodes are to be developed was made,
in a similar manner to the outer cell, consisting of two PVC frames with dimensions of
96 cm x 9 cm fixed opposite to each other with PVC connectors at a distance of 6 cm (the
dimensions and construction of which are shown in Figure 3-4). The anodic electrodes
were developed across the two sides, resulting in a three-dimensional structure. The
materials used were carbon fibre (Zoltek PX35, Toray Group, USA), carbon cloth (Plain
Carbon Cloth untreated, Fuel Cell Store, USA), activated carbon granules (AquaSorb HS,
Jacobi, UK), and in-house made conductive glue (based on graphite powder and
polystyrene binder).
Design 1 (Figure 3-4 (A)) incorporated a mesh made solely of carbon fibre woven onto
each side of the basic skeleton with a distance between each mesh of 6 cm. Design 2
(Figure 3-4 (B)) which was used throughout the majority of the study, as will be described
in later chapters, consisted of two pieces of carbon cloth covering the two lengths of the
skeleton with the internally-facing side coated with conductive glue in order for a layer
of activated carbon granules to be held in place, with a projected surface area of
0.2994 m2. The graphite granules were impregnated with neutral red (NR) (Sigma
Aldrich, UK) but only upon initial construction. The NR was dissolved to saturation, the
granules were impregnated, and the excess was washed off with deionised water. This
process was repeated until a red colour remained and the granules were left to dry in
ambient air.
Figure 3-4: 3-Dimensional anode design; (A) Design 1: carbon fibre and (B) Design 2: carbon cloth
coated with conductive glue and a layer of activated carbon granules
A B
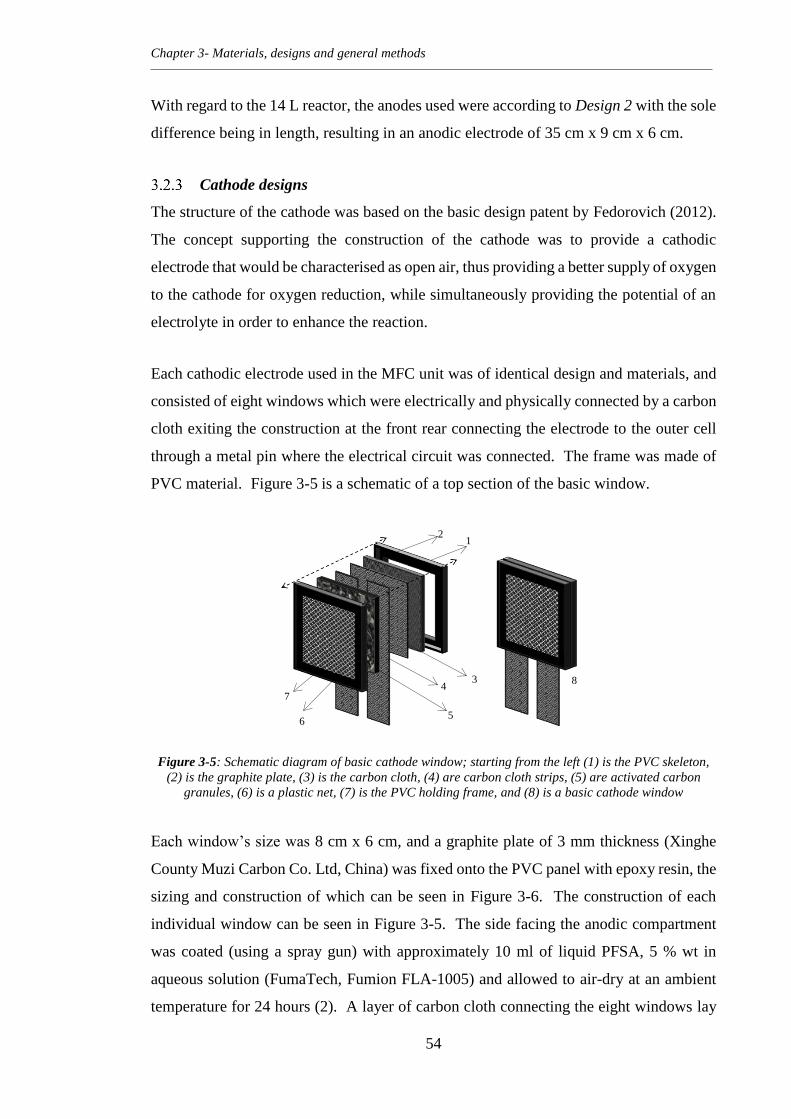
Chapter 3- Materials, designs and general methods
54
With regard to the 14 L reactor, the anodes used were according to Design 2 with the sole
difference being in length, resulting in an anodic electrode of 35 cm x 9 cm x 6 cm.
Cathode designs
The structure of the cathode was based on the basic design patent by Fedorovich (2012).
The concept supporting the construction of the cathode was to provide a cathodic
electrode that would be characterised as open air, thus providing a better supply of oxygen
to the cathode for oxygen reduction, while simultaneously providing the potential of an
electrolyte in order to enhance the reaction.
Each cathodic electrode used in the MFC unit was of identical design and materials, and
consisted of eight windows which were electrically and physically connected by a carbon
cloth exiting the construction at the front rear connecting the electrode to the outer cell
through a metal pin where the electrical circuit was connected. The frame was made of
PVC material. Figure 3-5 is a schematic of a top section of the basic window.
Figure 3-5: Schematic diagram of basic cathode window; starting from the left (1) is the PVC skeleton,
(2) is the graphite plate, (3) is the carbon cloth, (4) are carbon cloth strips, (5) are activated carbon
granules, (6) is a plastic net, (7) is the PVC holding frame, and (8) is a basic cathode window
Each window’s size was 8 cm x 6 cm, and a graphite plate of 3 mm thickness (Xinghe
County Muzi Carbon Co. Ltd, China) was fixed onto the PVC panel with epoxy resin, the
sizing and construction of which can be seen in Figure 3-6. The construction of each
individual window can be seen in Figure 3-5. The side facing the anodic compartment
was coated (using a spray gun) with approximately 10 ml of liquid PFSA, 5 % wt in
aqueous solution (FumaTech, Fumion FLA-1005) and allowed to air-dry at an ambient
temperature for 24 hours (2). A layer of carbon cloth connecting the eight windows lay
2 1
3 4
5 6
7
8
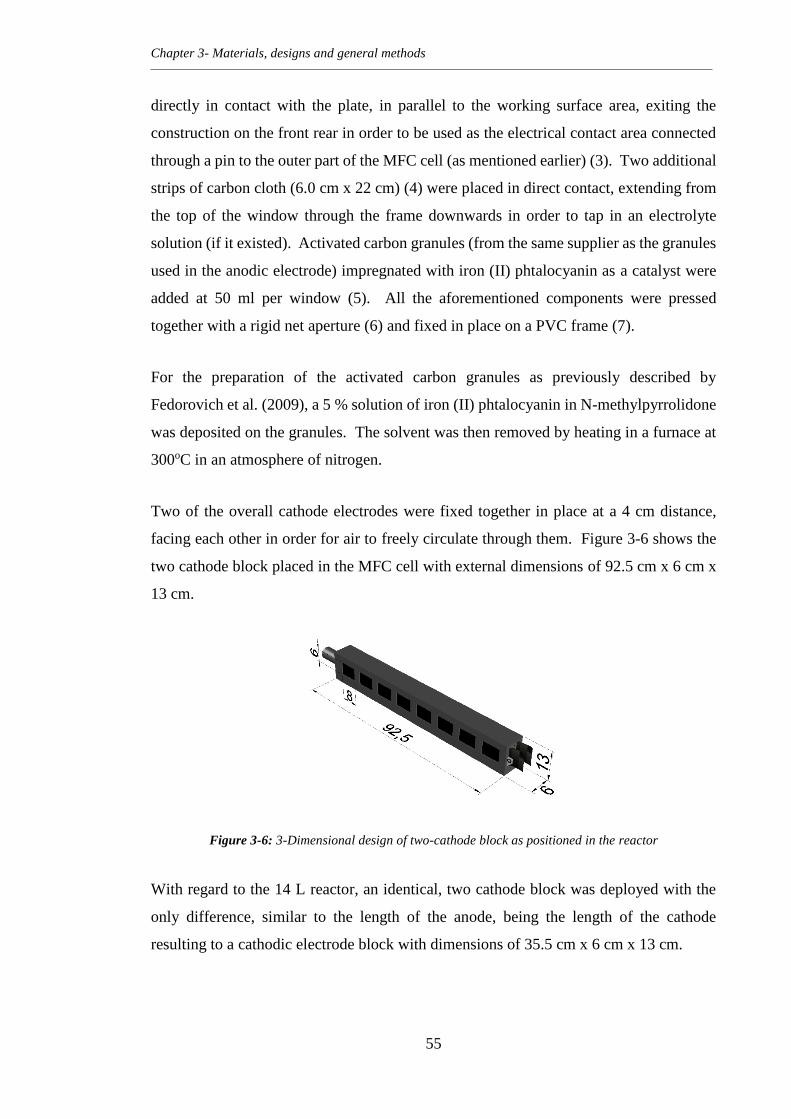
Chapter 3- Materials, designs and general methods
55
directly in contact with the plate, in parallel to the working surface area, exiting the
construction on the front rear in order to be used as the electrical contact area connected
through a pin to the outer part of the MFC cell (as mentioned earlier) (3). Two additional
strips of carbon cloth (6.0 cm x 22 cm) (4) were placed in direct contact, extending from
the top of the window through the frame downwards in order to tap in an electrolyte
solution (if it existed). Activated carbon granules (from the same supplier as the granules
used in the anodic electrode) impregnated with iron (II) phtalocyanin as a catalyst were
added at 50 ml per window (5). All the aforementioned components were pressed
together with a rigid net aperture (6) and fixed in place on a PVC frame (7).
For the preparation of the activated carbon granules as previously described by
Fedorovich et al. (2009), a 5 % solution of iron (II) phtalocyanin in N-methylpyrrolidone
was deposited on the granules. The solvent was then removed by heating in a furnace at
300oC in an atmosphere of nitrogen.
Two of the overall cathode electrodes were fixed together in place at a 4 cm distance,
facing each other in order for air to freely circulate through them. Figure 3-6 shows the
two cathode block placed in the MFC cell with external dimensions of 92.5 cm x 6 cm x
13 cm.
Figure 3-6: 3-Dimensional design of two-cathode block as positioned in the reactor
With regard to the 14 L reactor, an identical, two cathode block was deployed with the
only difference, similar to the length of the anode, being the length of the cathode
resulting to a cathodic electrode block with dimensions of 35.5 cm x 6 cm x 13 cm.
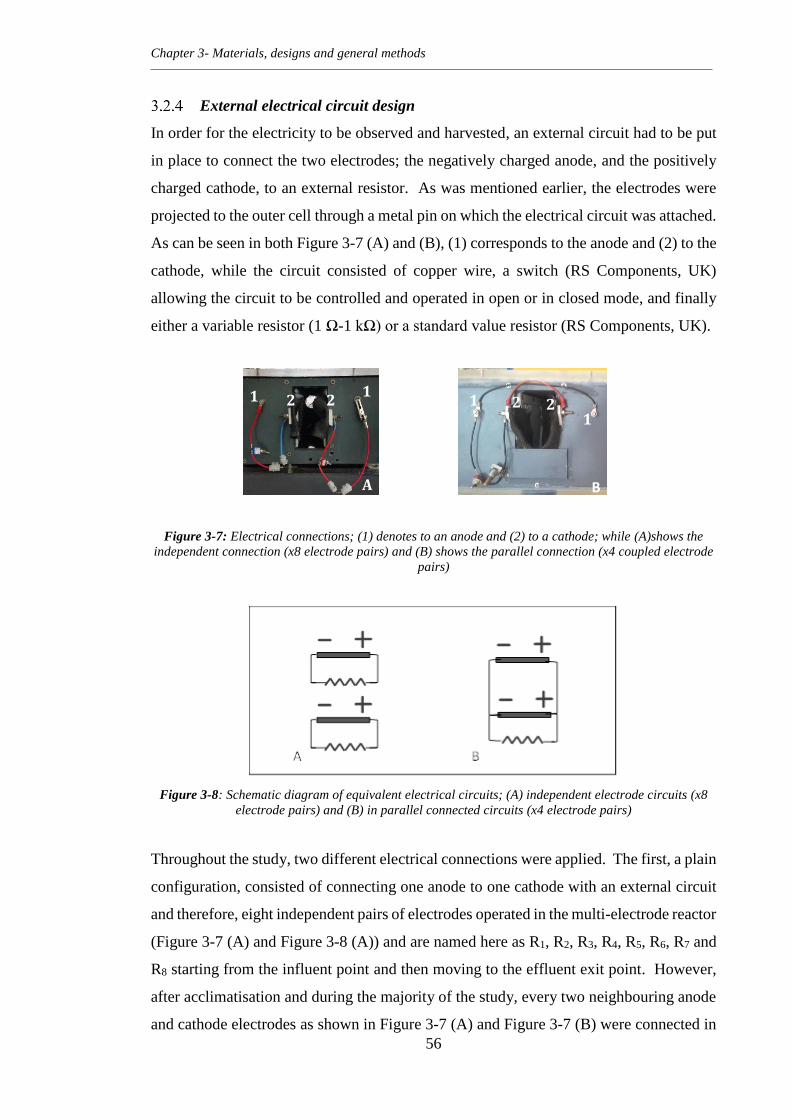
Chapter 3- Materials, designs and general methods
56
External electrical circuit design
In order for the electricity to be observed and harvested, an external circuit had to be put
in place to connect the two electrodes; the negatively charged anode, and the positively
charged cathode, to an external resistor. As was mentioned earlier, the electrodes were
projected to the outer cell through a metal pin on which the electrical circuit was attached.
As can be seen in both Figure 3-7 (A) and (B), (1) corresponds to the anode and (2) to the
cathode, while the circuit consisted of copper wire, a switch (RS Components, UK)
allowing the circuit to be controlled and operated in open or in closed mode, and finally
either a variable resistor (1 Ω-1 kΩ) or a standard value resistor (RS Components, UK).
Figure 3-7: Electrical connections; (1) denotes to an anode and (2) to a cathode; while (A)shows the
independent connection (x8 electrode pairs) and (B) shows the parallel connection (x4 coupled electrode
pairs)
Figure 3-8: Schematic diagram of equivalent electrical circuits; (A) independent electrode circuits (x8
electrode pairs) and (B) in parallel connected circuits (x4 electrode pairs)
Throughout the study, two different electrical connections were applied. The first, a plain
configuration, consisted of connecting one anode to one cathode with an external circuit
and therefore, eight independent pairs of electrodes operated in the multi-electrode reactor
(Figure 3-7 (A) and Figure 3-8 (A)) and are named here as R1, R2, R3, R4, R5, R6, R7 and
R8 starting from the influent point and then moving to the effluent exit point. However,
after acclimatisation and during the majority of the study, every two neighbouring anode
and cathode electrodes as shown in Figure 3-7 (A) and Figure 3-7 (B) were connected in
B A
1 2 2 1
1 2 2 1
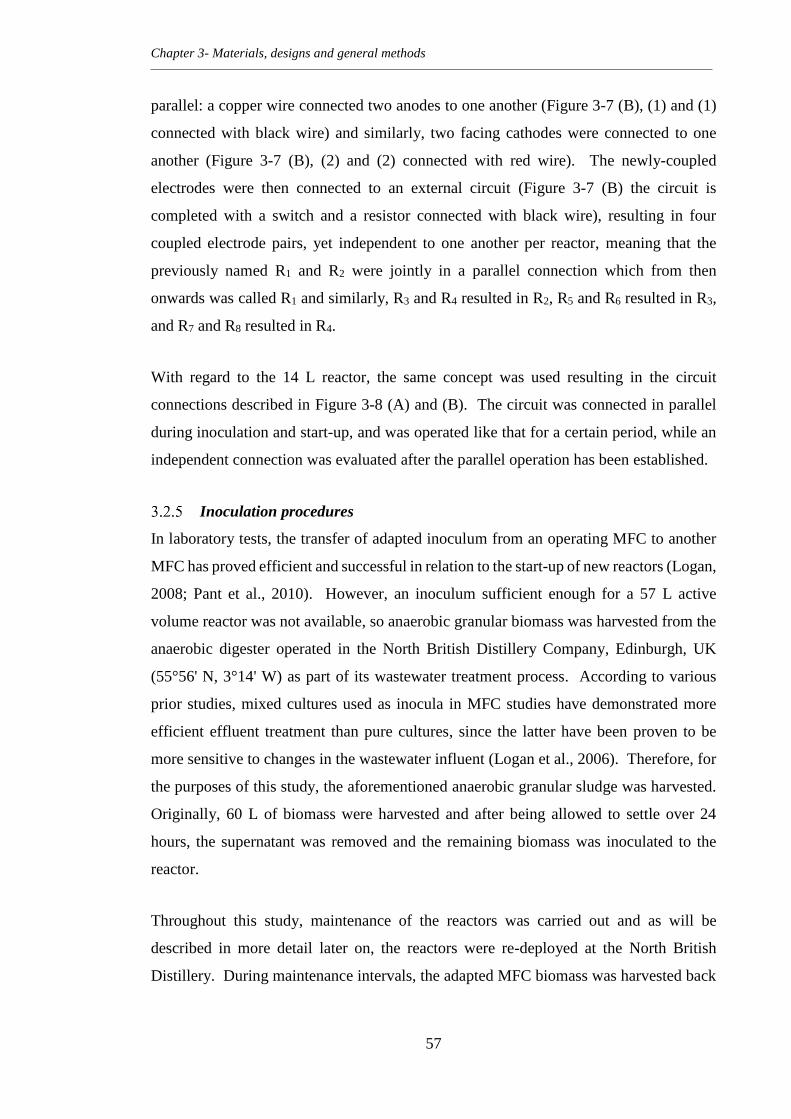
Chapter 3- Materials, designs and general methods
57
parallel: a copper wire connected two anodes to one another (Figure 3-7 (B), (1) and (1)
connected with black wire) and similarly, two facing cathodes were connected to one
another (Figure 3-7 (B), (2) and (2) connected with red wire). The newly-coupled
electrodes were then connected to an external circuit (Figure 3-7 (B) the circuit is
completed with a switch and a resistor connected with black wire), resulting in four
coupled electrode pairs, yet independent to one another per reactor, meaning that the
previously named R1 and R2 were jointly in a parallel connection which from then
onwards was called R1 and similarly, R3 and R4 resulted in R2, R5 and R6 resulted in R3,
and R7 and R8 resulted in R4.
With regard to the 14 L reactor, the same concept was used resulting in the circuit
connections described in Figure 3-8 (A) and (B). The circuit was connected in parallel
during inoculation and start-up, and was operated like that for a certain period, while an
independent connection was evaluated after the parallel operation has been established.
Inoculation procedures
In laboratory tests, the transfer of adapted inoculum from an operating MFC to another
MFC has proved efficient and successful in relation to the start-up of new reactors (Logan,
2008; Pant et al., 2010). However, an inoculum sufficient enough for a 57 L active
volume reactor was not available, so anaerobic granular biomass was harvested from the
anaerobic digester operated in the North British Distillery Company, Edinburgh, UK
(55°56' N, 3°14' W) as part of its wastewater treatment process. According to various
prior studies, mixed cultures used as inocula in MFC studies have demonstrated more
efficient effluent treatment than pure cultures, since the latter have been proven to be
more sensitive to changes in the wastewater influent (Logan et al., 2006). Therefore, for
the purposes of this study, the aforementioned anaerobic granular sludge was harvested.
Originally, 60 L of biomass were harvested and after being allowed to settle over 24
hours, the supernatant was removed and the remaining biomass was inoculated to the
reactor.
Throughout this study, maintenance of the reactors was carried out and as will be
described in more detail later on, the reactors were re-deployed at the North British
Distillery. During maintenance intervals, the adapted MFC biomass was harvested back
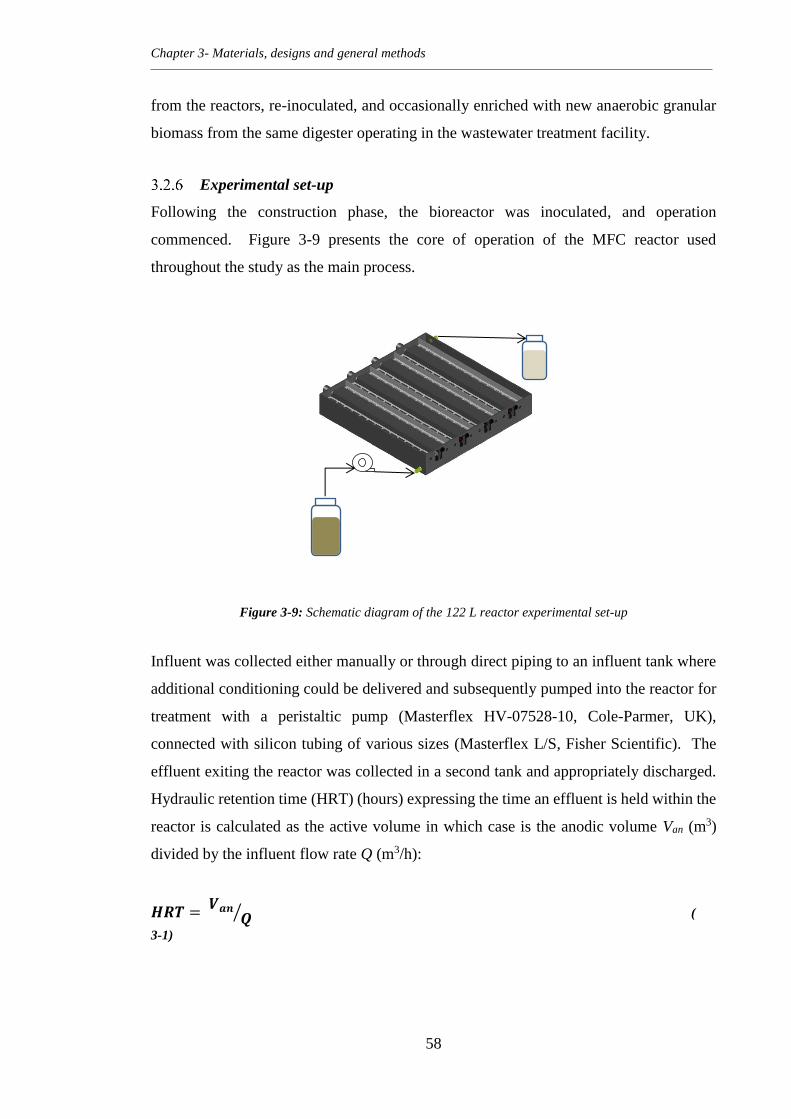
Chapter 3- Materials, designs and general methods
58
from the reactors, re-inoculated, and occasionally enriched with new anaerobic granular
biomass from the same digester operating in the wastewater treatment facility.
Experimental set-up
Following the construction phase, the bioreactor was inoculated, and operation
commenced. Figure 3-9 presents the core of operation of the MFC reactor used
throughout the study as the main process.
Figure 3-9: Schematic diagram of the 122 L reactor experimental set-up
Influent was collected either manually or through direct piping to an influent tank where
additional conditioning could be delivered and subsequently pumped into the reactor for
treatment with a peristaltic pump (Masterflex HV-07528-10, Cole-Parmer, UK),
connected with silicon tubing of various sizes (Masterflex L/S, Fisher Scientific). The
effluent exiting the reactor was collected in a second tank and appropriately discharged.
Hydraulic retention time (HRT) (hours) expressing the time an effluent is held within the
reactor is calculated as the active volume in which case is the anodic volume Van (m3)
divided by the influent flow rate Q (m3/h):
𝑯𝑹𝑻 = 𝑽𝒂𝒏
𝑸⁄ (
3-1)
Chapter 3- Materials, designs and general methods
59
3.3 Electrical methods and analytical procedures
The MFC reactor is a multi-electrode system; therefore, in terms of performance every
electrode pair can be considered independently, but the reactor will also be examined as
a whole. Throughout the study, the electrical circuit was operated on two different
electrical modes. The first electrical mode applied was a two-day transition cycle from
open circuit (no resistance applied to the electrode pair) to closed circuit (resistance
applied to the electrode pair) with a 24-hour interval to allow for the performance of each
electrode pair to reach a pseudo-steady state (Logan, 2008). During this period of
operation, the voltage across the resistor was recorded for each independent electrode
pair, either on the eight independent electrodes mode or the four coupled electrodes mode,
using a multimeter (UNI-T, UT30B, Maplin, UK) at a 24-hour intervals. During the
second electrical mode, the circuit connections used were the parallel ones, resulting in
four pairs, and each and every circuit was continuously operated under a load, with no
interruption of no load, while voltage was recorded on a data acquisition system
(Midilogger GL820, Graphtech Corporation, Japan) at 1-hour intervals. For every case
(Logan, 2008), current I (A-Amps) was calculated via Ohm’s Law as:
𝑰 = 𝑽𝑹𝒆𝒙𝒕
⁄
(3-2)
Where V is the measured voltage across the resistor (V-Volts), and Rext is the external
resistance (Ω-Ohms).
The electrochemical performance of the MFC was examined through various values, the
most elemental expression of which is the amount of power produced, which can be
expressed as:
𝑷 = 𝑰 𝑽 (3-3)
Where P is the power produced (W-Watts), I is the current calculated (A-Amps) and V is
the voltage (V-Volts) measured across the resistor. Power can therefore be alternatively
expressed as:
𝑷 = 𝑽𝟐
𝑹𝒆𝒙𝒕⁄ (3-4)
Chapter 3- Materials, designs and general methods
60
Knowing how much power is generated across an electrode is a first step in evaluating
performance; however, it is not sufficient on its own. Thus, it is common practice to
normalise power over the anodic electrode surface area, Aan (m2). Power density Pd
(W/m2), allows for different systems to be comparable.
𝑷𝒅 = 𝑷𝑨𝒂𝒏
⁄
(3-5)
Estimating the surface area can be a complicated process; therefore, power density Pd
(W/m3) can alternatively be derived by normalising power to the anodic volume Van (m3),
a practise also preferred in environmental engineering.
𝑷𝒅 = 𝑷𝑽𝒂𝒏
⁄
(3-6)
In a similar way to power, current can be normalised to the electrode surface area and
volume.
𝑰𝒅 = 𝑰𝑨𝒂𝒏
⁄ (3-7)
𝑰𝒅 = 𝑰𝑽𝒂𝒏
⁄
(3-8)
Where, Id is current density (A/m2) in equation 3-7 and (A/m3) in equation 3-8.
The three fundamental parameters, voltage, resistance and current, are measured and
calculated for each independent electrode pair for the multi-electrode MFC. However, in
relation to normalising power over anodic volume, the system will be examined as an
overall entity (see Appendix A).
Polarisation curves are an additional tool typically used in electrochemistry to evaluate
the performance of an electrode under different loads, and can therefore, also provide
information on the maximum performance of an electrode. Such tests were conducted
manually with the constant resistance discharge method on each electrode, as described
in a previous study by (Logan et al., 2006). In order to obtain the polarization data, each
electrode pair was initially kept in an open circuit mode (with an absence of external load)
and was allowed to acclimate. After the voltage was observed to reach its maximum
value and maintained in a pseudo-steady state without major deviations, the external
Chapter 3- Materials, designs and general methods
61
resistors were connected to each independent circuit allowing for a 20min interval to
reach a pseudo-steady state condition, where the voltage across the resistors remained
constant. A total number of 20 resistors were used for all electrodes, varying from 4.7 kΩ
to 12 Ω. In some cases, when the curve lacked accuracy or a particular phenomenon was
not observed, more resistors were used.
Current and power plots and polarisation curves are tools used to present the performance
of an anode and cathode pair, but they cannot provide information on the respective
contributions of the anode and the cathode to that performance. For this reason, and in
order to determine the performance of two different anodic electrode constructions under
various current loads, anode potential was measured against an Ag/AgCl reference
electrode (Radiometer Analytical XR300 Reference Electrode, HACH, USA).
Coulombic efficiency (CE) is also used as a value to describe the performance of an MFC,
as it can express the amount of substrate that is converted into electricity and is estimated
from the ratio of the output charge by a microbial fuel cell or other battery to the input of
charge and is obtained in percentage form. It can also be described as:
𝑪𝑬 =𝑪𝑻
𝑪𝑻𝒉×𝟏𝟎𝟎% (3-9)
where CT is estimated by integrating the calculated current over a period of a complete
cycle (t), expressed as:
𝑪𝑻 = ∫ 𝑰𝒅𝒕𝒕
𝟎
(3-10)
Thus, CTh is estimated in relation to the COD removed, and is expressed as:
𝑪𝑻𝒉 =𝑭𝒃𝑽𝒂𝒏𝜟𝑪𝑶𝑫
𝑴
(3-11)
Where F is Faraday’s constant, b represents the amount of electrons exchanged per mole
of electron acceptor, Van is the volumetric capacity of the anodic compartment, ΔCOD is
the concentration change of COD, and M is the molecular weight of the electron acceptor
(Logan et al., 2006; Logan, 2008). However, Equation 3-11 is only applicable to fed-
batch systems, so because the system developed in the current study operates on a
continuous flow, the volumetric flowrate, Q, must be considered. This can be done by
Chapter 3- Materials, designs and general methods
62
replacing the concentration change, ΔCOD, in Equation 3-12 with the COD consumption
rate, 𝐶𝑂𝐷𝑐𝑜𝑛𝑠𝑢𝑚𝑒𝑑.
𝑪𝑶𝑫𝒄𝒐𝒏𝒔𝒖𝒎𝒆𝒅 = 𝑸 ∙ (𝑪𝑶𝑫𝑰𝒏𝒇𝒍𝒖𝒆𝒏𝒕 − 𝑪𝑶𝑫𝑬𝒇𝒇𝒍𝒖𝒆𝒏𝒕) = 𝑸 ∙ 𝜟𝑪𝑶𝑫 (3-12)
Therefore, the Coulombic Efficiency (CE) for continuous flow systems can be expressed
as:
𝑪𝑬 =𝑴𝑰
𝑭𝒃𝑪𝑶𝑫𝒄𝒐𝒏𝒔𝒖𝒎𝒆𝒅 (3-13)
Where I represents the steady state current (A). For the calculation of coulombic
efficiency in the case of a multi-electrode, an assumption is made. The COD consumption
per electrode is necessary; however, the COD was measured in all cases at the end of the
reactor, thus the consumption value corresponds to the four coupled pairs of electrodes.
The assumption made is that reduction is equally distributed within the reactor; therefore,
in the previously mentioned case, the consumption considered for the calculation of the
one electrode pair coulombic efficiency is one quarter of the overall reactor consumption.
The relevant prior research suggests that the distribution of consumption within a
multi-electrode reactor is not uniform, so for a more accurate calculation of coulombic
efficiency per electrode pair, the COD should be measured for each compartment
(Fedorovich et al., 2009). However, doing so would create considerable cost, so for the
purposes of the present study the equal distribution assumption was used.
An important argument can be made at this point that neither power nor coulombic
efficiency are an energy parameter. Energy is expressed in the form of the kilowatt hour
(kWh), which can be calculated by introducing time into a fed-batch system, whereas for
a system operating continuously, volumetric flow rate should be taken into consideration,
so energy density in kWh/m3 can therefore be expressed as the energy per volume of
wastewater treated (He, 2013; Xiao et al., 2014b). By estimating this parameter we will
be a step closer to understanding the actual performance of an MFC, as it will allow for
an initial energy balance to be reached. However, this approach incorporates two basic
assumptions; firstly, that electrical power is the only energy produced in an MFC, and
secondly, in terms of the balance, it is assumed that all the energy which is generated can
be transferred at 100 % efficiency to the powering system (a pump in most cases).
Therefore, in cases where other energy forms are produced, such as methane (especially
Chapter 3- Materials, designs and general methods
63
in cases where anaerobic microorganisms are used as inoculum), the energy recovery
occurring through them should be estimated. Also, the conversion efficiency of the
electricity generated, when potentially channelled to a pump, should be considered. In
all cases, for the purposes of this study energy recovery is estimated and an energy
balance attempted by taking into account the only source of electricity demand, the
peristaltic pump used to pump the influent in the MFC, and the energy recovered through
the electricity generation. Therefore, according to Xiao et al., (2014b) and Ge et al.
(2014), normalised energy recovery (NER) can be expressed in kilowatt hours per cubic
meter, based on the volume treated or the power divided by the influent flow rate:
𝑵𝑬𝑹 = 𝒑𝒐𝒘𝒆𝒓×𝒕𝒊𝒎𝒆 𝒕 [𝒘𝒂𝒔𝒕𝒆𝒘𝒂𝒕𝒆𝒓 𝒗𝒐𝒍𝒖𝒎𝒆 (𝒕𝒓𝒆𝒂𝒕𝒆𝒅 𝒘𝒊𝒕𝒉𝒊𝒏 𝒕𝒊𝒎𝒆 𝒕)]⁄ = (𝒑𝒐𝒘𝒆𝒓) (𝒘𝒂𝒔𝒕𝒆𝒘𝒂𝒕𝒆𝒓 𝒇𝒍𝒐𝒘 𝒓𝒂𝒕𝒆)⁄ (3-14)
Similarly, in a reactor power density calculation, the value of power used for the
calculation of the NER is the sum of the independent electrode power normalised over
the reactor’s active volume.
In order to establish an energy balance for the system, its energy consumption and
production need to be evaluated. As was mentioned above, assuming that electricity is
the only form of energy generated, the generated energy can be calculated through NER,
and expressed in kilowatt hours. In the system developed for the current study, the main
energy consumption was accounted for by the pumping system feeding the reactor with
wastewater, thus its calculation should be included in balancing the MFC performance.
Equation 3-15 estimates the electrical consumption of the peristaltic pump used in this
study:
𝑷𝒑𝒖𝒎𝒑𝒊𝒏𝒈 = 𝑸×𝜸×𝑬
𝟏𝟎𝟎𝟎
(3-15)
Where P is the power requirement (kW), Q is the flow rate (m3/s), γ is 9800N/m3, and E
is the hydraulic pressure head (m). By dividing the value by the flow rate (in m3/h), the
pump’s energy consumption (kWh/m3) can be calculated (Dong et al., 2015).
3.4 Methods and calculations for determination of effluent quality
The influent and effluent samples collected through the sampling points mentioned earlier
were used in the evaluation of the wastewater treatment provided by the MFC reactor,
Chapter 3- Materials, designs and general methods
64
and were analysed as soon as possible or otherwise stored according to standard methods
(APHA, 1998). Influent and effluent quality was determined through a variety of
parameters, with those used throughout the study being total Chemical Oxygen Demand
(tCOD), total Suspended Solids (tSS), and pH. tCOD was measured with a
spectrophotometer (DR2800, HACH Company, UK) and according to the manufacturer’s
method (method 8000, HACH Company, UK). tSS were filtered with 1.2μm pore size
filter (Whatman Glass Microfibre Filters, GF/C 7.0cm, previously treated) and heated at
110oC for 1 hour (APHA, 1998). Meanwhile, pH values were established using a
multi-probe (HI 9812-5, HANNA Instruments, RS Components, UK) (APHA, 1998).
Conductivity (EC) was measured using a method similar to that employed for pH (HI
9812-5, HANNA Instruments, RS Components, UK). Nitrogen as nitrates (NO3--N),
phosphates (PO43-), and sulphates (SO4
2-) were estimated (when mentioned)
colorimetrically with a spectrophotometer (DR4000U, HACH Company, UK) according
to the manufacturer’s methods (method 8039, method 8048, and method 8051
respectively). Temperature was recorded manually throughout the study with a
thermometer (Mini-Digital Thermometer, Maplin, UK).
In addition to the absolute values of the aforementioned parameters, the removal
efficiency is defined for both tCOD and tSS as follows, in order to describe the efficiency
of the reactor:
𝑬𝒕𝑪𝑶𝑫 =𝑪𝑶𝑫𝒊𝒏−𝑪𝑶𝑫𝒐𝒖𝒕
𝑪𝑶𝑫𝒊𝒏×𝟏𝟎𝟎% (3-16)
𝑬𝒕𝑺𝑺 =𝑺𝑺𝒊𝒏−𝑺𝑺𝒐𝒖𝒕
𝑺𝑺𝒊𝒏×𝟏𝟎𝟎% (3-17)
Removal efficiencies for nitrates, phosphates and sulphates were similarly calculated.
3.5 Chapter conclusions
This chapter has described the design of the prototype 122 L reactor, which is
characterised as a plug-flow, multi-electrode MFC, with an internal serpentine
circulation. The materials and construction of two different anodes were presented in
detail, outlining their composition from granular graphite, carbon cloth, conductive glue
and carbon fibre, with the second design being the one used in the majority of the study,
unless stated otherwise. The construction of the cathode and a detailed schematic was
described, as had been set out by Fedorovich (2012). The chapter went on to explain the

Chapter 3- Materials, designs and general methods
65
electrical circuits, both independent and connected in parallel, which form an integral part
of the examination that follows in the next chapter, for the purposes of which a 14 L
scaled-down reactor was deployed, also described in this chapter.
In addition to the designs of the prototype reactors, the inoculation protocol was described
which, as will be seen in the following chapters, was used throughout this study. The
basic experimental set-up as used throughout this study (unless stated otherwise) was also
described.
The chapter concluded with a description of the electrical performance indicators as
established in the field of microbial fuel cells. It also provided the wastewater quality
parameters, set according to international standards. Overall, the chapter aimed to
establish the general designs and methods used throughout the study, with other specific
methods to be described in each following chapter when necessary.
66
Chapter 4- Independent or parallel?
4.1 Introduction
The main examination body of this study conceptually begins with this chapter. The
prototype MFC reactor studied throughout this project was a plug-flow, multi-electrode
configuration, and an initial approach to better understanding its optimum operational
parameters was therefore to examine whether an independent or a parallel electrical
connection in the otherwise internally hydraulically connected in series reactor, was more
beneficial in relation to various key performance parameters. For these purposes, in this
chapter, a scaled-down 14 L reactor identical to the prototype was examined. The effect
of the independent operation of the two electrodes against a parallel connection was
examined in this chapter, with power output used as the main comparative electrical
parameter. The tCOD and tSS removal efficiencies were also examined throughout the
various phases in order to establish an effective wastewater treatment.
4.2 Materials and experimental set-up
The 14 L reactor with an active volume of 8 L was set up according to the same principles
by which the 122L reactors were deployed, as a plug-flow multi-electrode reactor, as
previously described. It consisted of two anodes and two cathodes which were
constructed according to the standard design (Figure 3-4 (B) and Figure 3-6 respectively)
and materials. The reactor design and internal flow followed the path of circulation
described in Figure 3-2, so the only difference in the reactor was the length of the anode
and cathode and the overall reactor cell (as described in Chapter 3.2.1). In terms of
electrical performance, equivalent circuit connection, polarisation methods and constant
resistance discharge were used.
Anaerobic granular biomass was harvested from the AD reactors operating at the North
British Distillery, and was used as inoculum. The influent used in this study was
anaerobic digestion liquid digestate (ADLD) from the same reactors, and was fed
continuously into the reactor by a peristaltic pump. The influent feeding rate was set at
5.5 ml/min, resulting in an HRT of approximately 1 day, in order to simulate the
operational conditions to be achieved from the large-scale reactors. For the same purpose,
no electrolyte was used meaning that the reactor was operated solely as an open air
cathode.
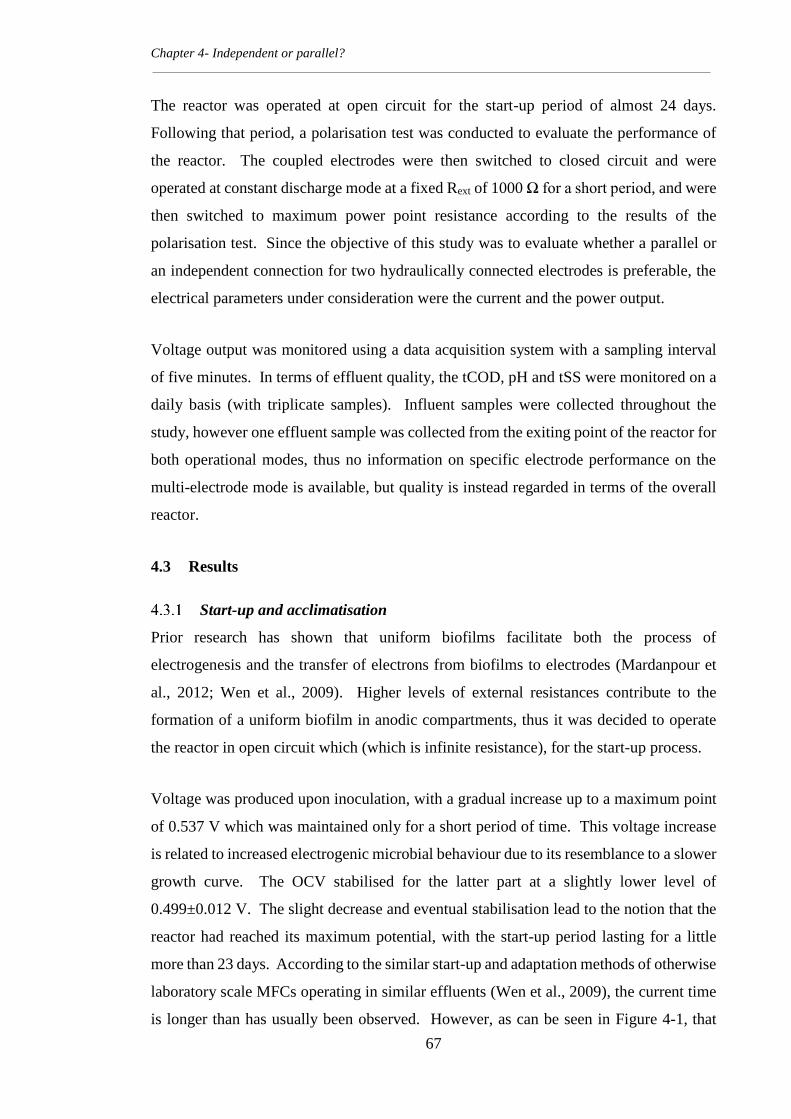
Chapter 4- Independent or parallel?
67
The reactor was operated at open circuit for the start-up period of almost 24 days.
Following that period, a polarisation test was conducted to evaluate the performance of
the reactor. The coupled electrodes were then switched to closed circuit and were
operated at constant discharge mode at a fixed Rext of 1000 Ω for a short period, and were
then switched to maximum power point resistance according to the results of the
polarisation test. Since the objective of this study was to evaluate whether a parallel or
an independent connection for two hydraulically connected electrodes is preferable, the
electrical parameters under consideration were the current and the power output.
Voltage output was monitored using a data acquisition system with a sampling interval
of five minutes. In terms of effluent quality, the tCOD, pH and tSS were monitored on a
daily basis (with triplicate samples). Influent samples were collected throughout the
study, however one effluent sample was collected from the exiting point of the reactor for
both operational modes, thus no information on specific electrode performance on the
multi-electrode mode is available, but quality is instead regarded in terms of the overall
reactor.
4.3 Results
Start-up and acclimatisation
Prior research has shown that uniform biofilms facilitate both the process of
electrogenesis and the transfer of electrons from biofilms to electrodes (Mardanpour et
al., 2012; Wen et al., 2009). Higher levels of external resistances contribute to the
formation of a uniform biofilm in anodic compartments, thus it was decided to operate
the reactor in open circuit which (which is infinite resistance), for the start-up process.
Voltage was produced upon inoculation, with a gradual increase up to a maximum point
of 0.537 V which was maintained only for a short period of time. This voltage increase
is related to increased electrogenic microbial behaviour due to its resemblance to a slower
growth curve. The OCV stabilised for the latter part at a slightly lower level of
0.499±0.012 V. The slight decrease and eventual stabilisation lead to the notion that the
reactor had reached its maximum potential, with the start-up period lasting for a little
more than 23 days. According to the similar start-up and adaptation methods of otherwise
laboratory scale MFCs operating in similar effluents (Wen et al., 2009), the current time
is longer than has usually been observed. However, as can be seen in Figure 4-1, that
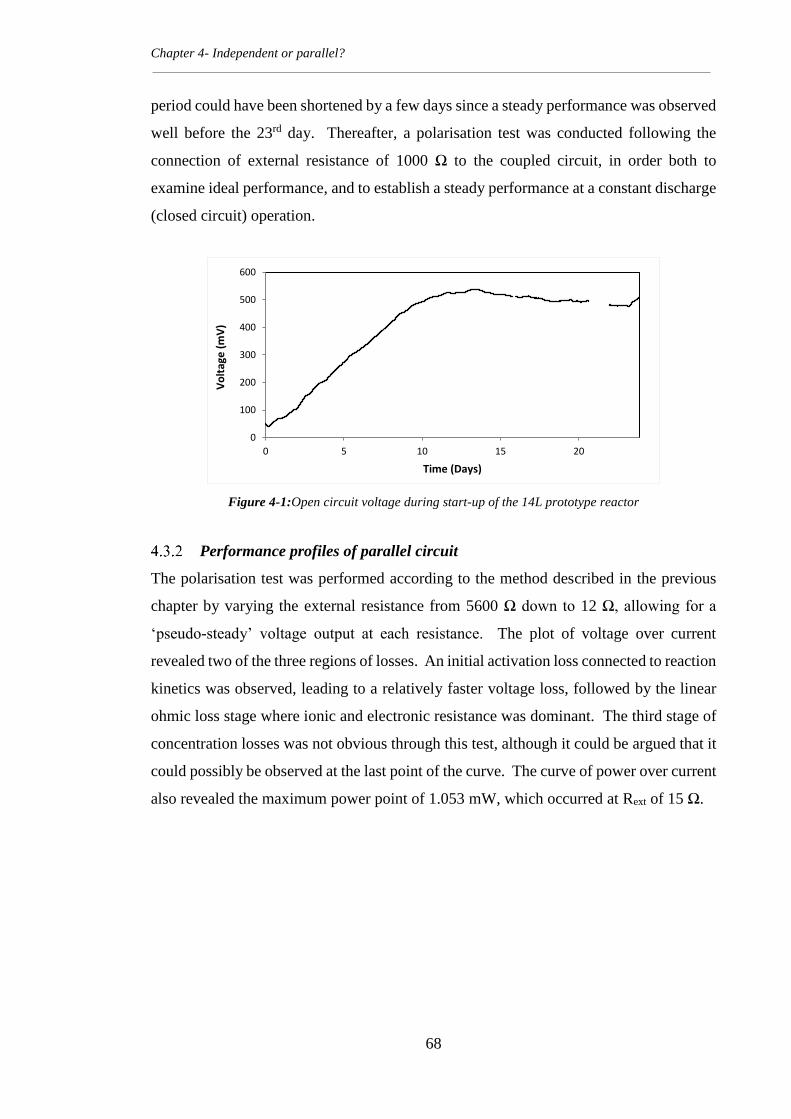
Chapter 4- Independent or parallel?
68
period could have been shortened by a few days since a steady performance was observed
well before the 23rd day. Thereafter, a polarisation test was conducted following the
connection of external resistance of 1000 Ω to the coupled circuit, in order both to
examine ideal performance, and to establish a steady performance at a constant discharge
(closed circuit) operation.
Figure 4-1:Open circuit voltage during start-up of the 14L prototype reactor
Performance profiles of parallel circuit
The polarisation test was performed according to the method described in the previous
chapter by varying the external resistance from 5600 Ω down to 12 Ω, allowing for a
‘pseudo-steady’ voltage output at each resistance. The plot of voltage over current
revealed two of the three regions of losses. An initial activation loss connected to reaction
kinetics was observed, leading to a relatively faster voltage loss, followed by the linear
ohmic loss stage where ionic and electronic resistance was dominant. The third stage of
concentration losses was not obvious through this test, although it could be argued that it
could possibly be observed at the last point of the curve. The curve of power over current
also revealed the maximum power point of 1.053 mW, which occurred at Rext of 15 Ω.
0
100
200
300
400
500
600
0 5 10 15 20
Vo
ltag
e (
mV
)
Time (Days)
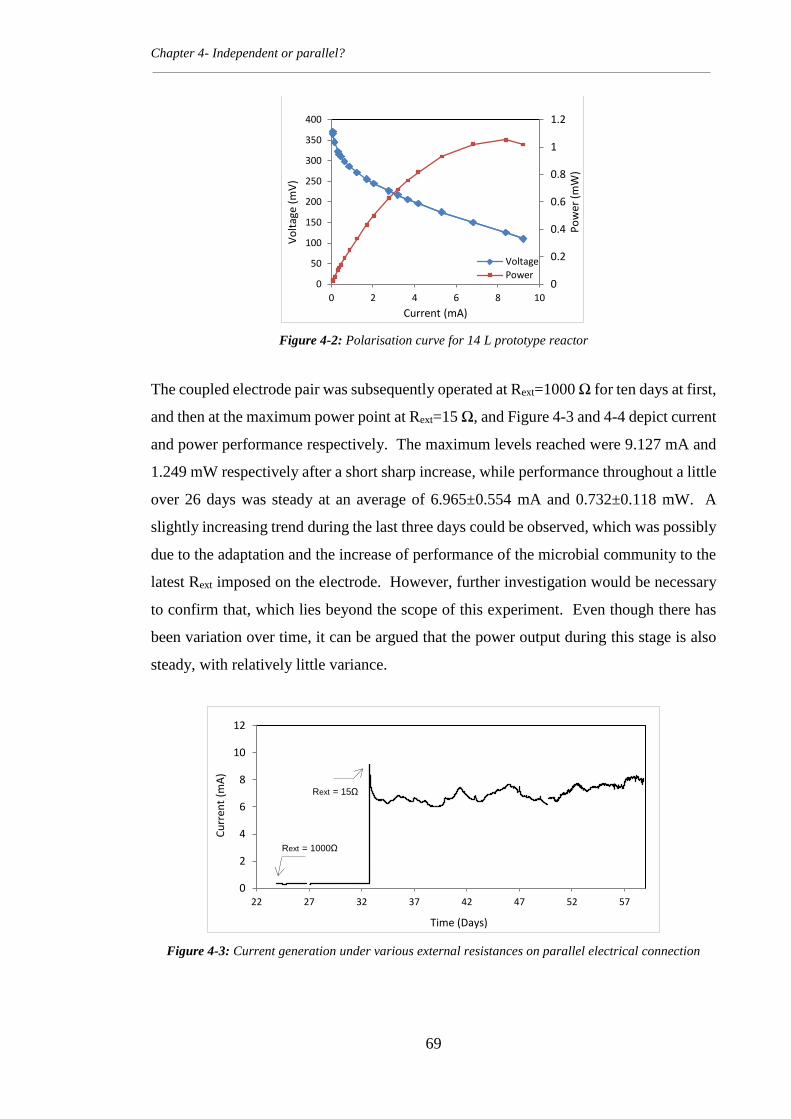
Chapter 4- Independent or parallel?
69
Figure 4-2: Polarisation curve for 14 L prototype reactor
The coupled electrode pair was subsequently operated at Rext=1000 Ω for ten days at first,
and then at the maximum power point at Rext=15 Ω, and Figure 4-3 and 4-4 depict current
and power performance respectively. The maximum levels reached were 9.127 mA and
1.249 mW respectively after a short sharp increase, while performance throughout a little
over 26 days was steady at an average of 6.965±0.554 mA and 0.732±0.118 mW. A
slightly increasing trend during the last three days could be observed, which was possibly
due to the adaptation and the increase of performance of the microbial community to the
latest Rext imposed on the electrode. However, further investigation would be necessary
to confirm that, which lies beyond the scope of this experiment. Even though there has
been variation over time, it can be argued that the power output during this stage is also
steady, with relatively little variance.
Figure 4-3: Current generation under various external resistances on parallel electrical connection
0
0.2
0.4
0.6
0.8
1
1.2
0
50
100
150
200
250
300
350
400
0 2 4 6 8 10
Po
wer
(m
W)
Vo
ltag
e (m
V)
Current (mA)
Voltage
Power
0
2
4
6
8
10
12
22 27 32 37 42 47 52 57
Cu
rren
t (m
A)
Time (Days)
Rext = 1000Ω
Rext = 15Ω
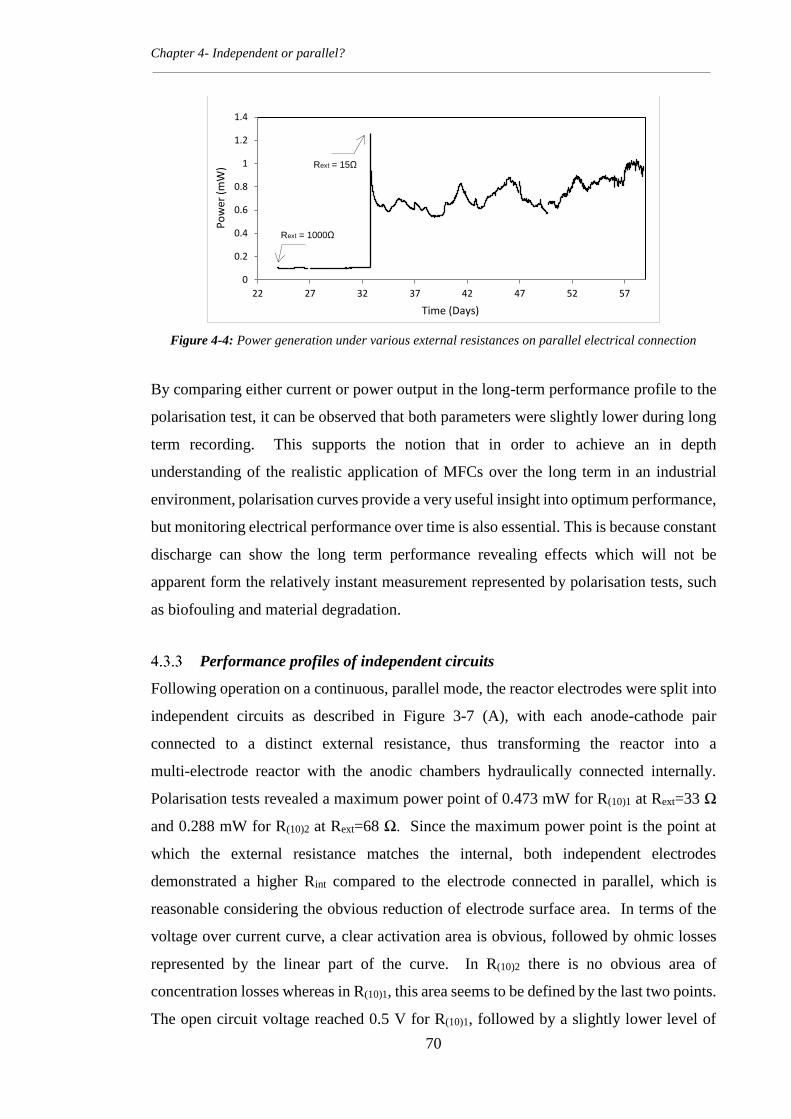
Chapter 4- Independent or parallel?
70
Figure 4-4: Power generation under various external resistances on parallel electrical connection
By comparing either current or power output in the long-term performance profile to the
polarisation test, it can be observed that both parameters were slightly lower during long
term recording. This supports the notion that in order to achieve an in depth
understanding of the realistic application of MFCs over the long term in an industrial
environment, polarisation curves provide a very useful insight into optimum performance,
but monitoring electrical performance over time is also essential. This is because constant
discharge can show the long term performance revealing effects which will not be
apparent form the relatively instant measurement represented by polarisation tests, such
as biofouling and material degradation.
Performance profiles of independent circuits
Following operation on a continuous, parallel mode, the reactor electrodes were split into
independent circuits as described in Figure 3-7 (A), with each anode-cathode pair
connected to a distinct external resistance, thus transforming the reactor into a
multi-electrode reactor with the anodic chambers hydraulically connected internally.
Polarisation tests revealed a maximum power point of 0.473 mW for R(10)1 at Rext=33 Ω
and 0.288 mW for R(10)2 at Rext=68 Ω. Since the maximum power point is the point at
which the external resistance matches the internal, both independent electrodes
demonstrated a higher Rint compared to the electrode connected in parallel, which is
reasonable considering the obvious reduction of electrode surface area. In terms of the
voltage over current curve, a clear activation area is obvious, followed by ohmic losses
represented by the linear part of the curve. In R(10)2 there is no obvious area of
concentration losses whereas in R(10)1, this area seems to be defined by the last two points.
The open circuit voltage reached 0.5 V for R(10)1, followed by a slightly lower level of
0
0.2
0.4
0.6
0.8
1
1.2
1.4
22 27 32 37 42 47 52 57
Po
wer
(m
W)
Time (Days)
Rext = 1000Ω
Rext = 15Ω
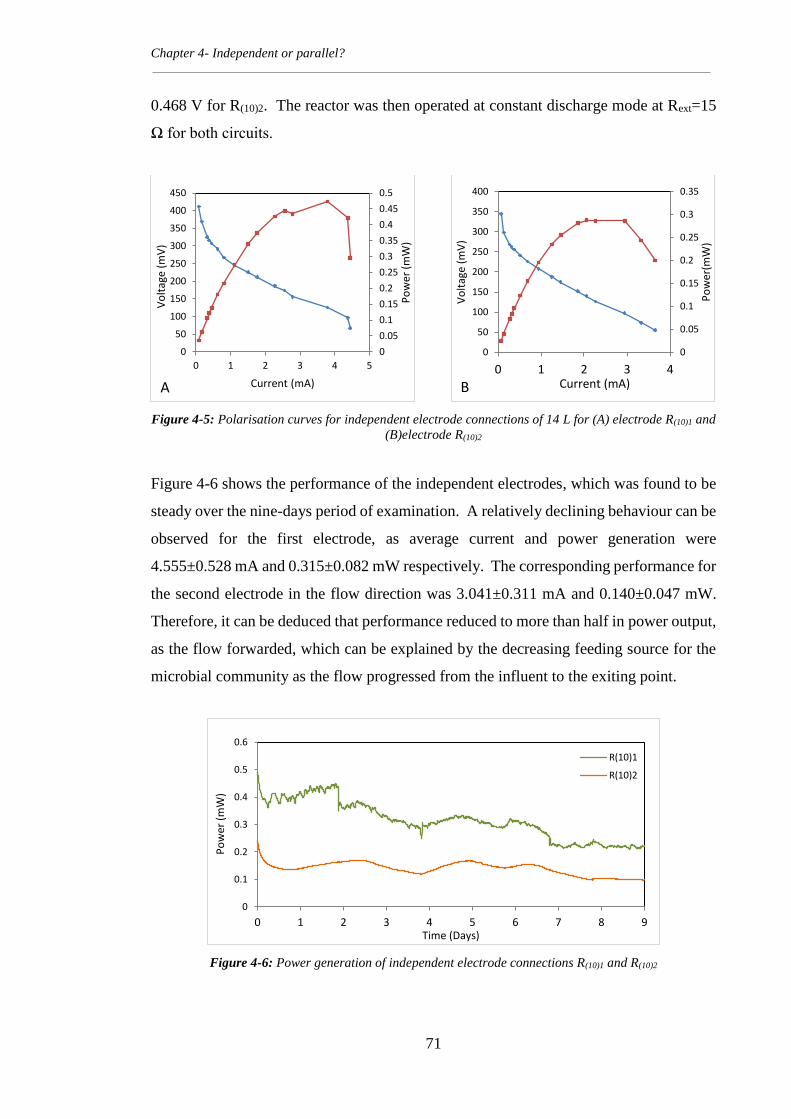
Chapter 4- Independent or parallel?
71
0.468 V for R(10)2. The reactor was then operated at constant discharge mode at Rext=15
Ω for both circuits.
Figure 4-5: Polarisation curves for independent electrode connections of 14 L for (A) electrode R(10)1 and
(B)electrode R(10)2
Figure 4-6 shows the performance of the independent electrodes, which was found to be
steady over the nine-days period of examination. A relatively declining behaviour can be
observed for the first electrode, as average current and power generation were
4.555±0.528 mA and 0.315±0.082 mW respectively. The corresponding performance for
the second electrode in the flow direction was 3.041±0.311 mA and 0.140±0.047 mW.
Therefore, it can be deduced that performance reduced to more than half in power output,
as the flow forwarded, which can be explained by the decreasing feeding source for the
microbial community as the flow progressed from the influent to the exiting point.
Figure 4-6: Power generation of independent electrode connections R(10)1 and R(10)2
0
0.05
0.1
0.15
0.2
0.25
0.3
0.35
0.4
0.45
0.5
0
50
100
150
200
250
300
350
400
450
0 1 2 3 4 5
Po
wer
(m
W)
Vo
ltag
e (m
V)
Current (mA)A
0
0.05
0.1
0.15
0.2
0.25
0.3
0.35
0
50
100
150
200
250
300
350
400
0 1 2 3 4
Po
wer
(mW
)
Vo
ltag
e (m
V)
Current (mA)
0
0.1
0.2
0.3
0.4
0.5
0.6
0 1 2 3 4 5 6 7 8 9
Po
wer
(m
W)
Time (Days)
R(10)1
R(10)2
B
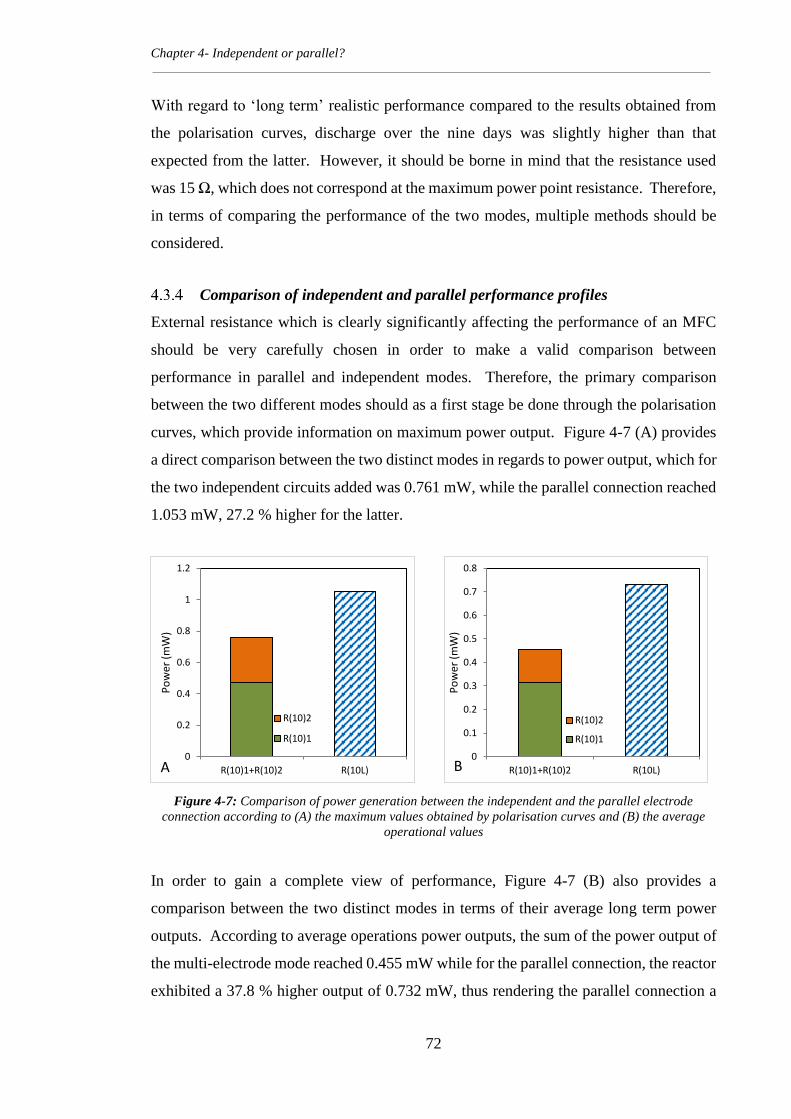
Chapter 4- Independent or parallel?
72
With regard to ‘long term’ realistic performance compared to the results obtained from
the polarisation curves, discharge over the nine days was slightly higher than that
expected from the latter. However, it should be borne in mind that the resistance used
was 15 Ω, which does not correspond at the maximum power point resistance. Therefore,
in terms of comparing the performance of the two modes, multiple methods should be
considered.
Comparison of independent and parallel performance profiles
External resistance which is clearly significantly affecting the performance of an MFC
should be very carefully chosen in order to make a valid comparison between
performance in parallel and independent modes. Therefore, the primary comparison
between the two different modes should as a first stage be done through the polarisation
curves, which provide information on maximum power output. Figure 4-7 (A) provides
a direct comparison between the two distinct modes in regards to power output, which for
the two independent circuits added was 0.761 mW, while the parallel connection reached
1.053 mW, 27.2 % higher for the latter.
Figure 4-7: Comparison of power generation between the independent and the parallel electrode
connection according to (A) the maximum values obtained by polarisation curves and (B) the average
operational values
In order to gain a complete view of performance, Figure 4-7 (B) also provides a
comparison between the two distinct modes in terms of their average long term power
outputs. According to average operations power outputs, the sum of the power output of
the multi-electrode mode reached 0.455 mW while for the parallel connection, the reactor
exhibited a 37.8 % higher output of 0.732 mW, thus rendering the parallel connection a
0
0.2
0.4
0.6
0.8
1
1.2
R(10)1+R(10)2 R(10L)
Po
wer
(m
W)
R(10)2
R(10)1
0
0.1
0.2
0.3
0.4
0.5
0.6
0.7
0.8
R(10)1+R(10)2 R(10L)
Po
wer
(m
W)
R(10)2
R(10)1
BA
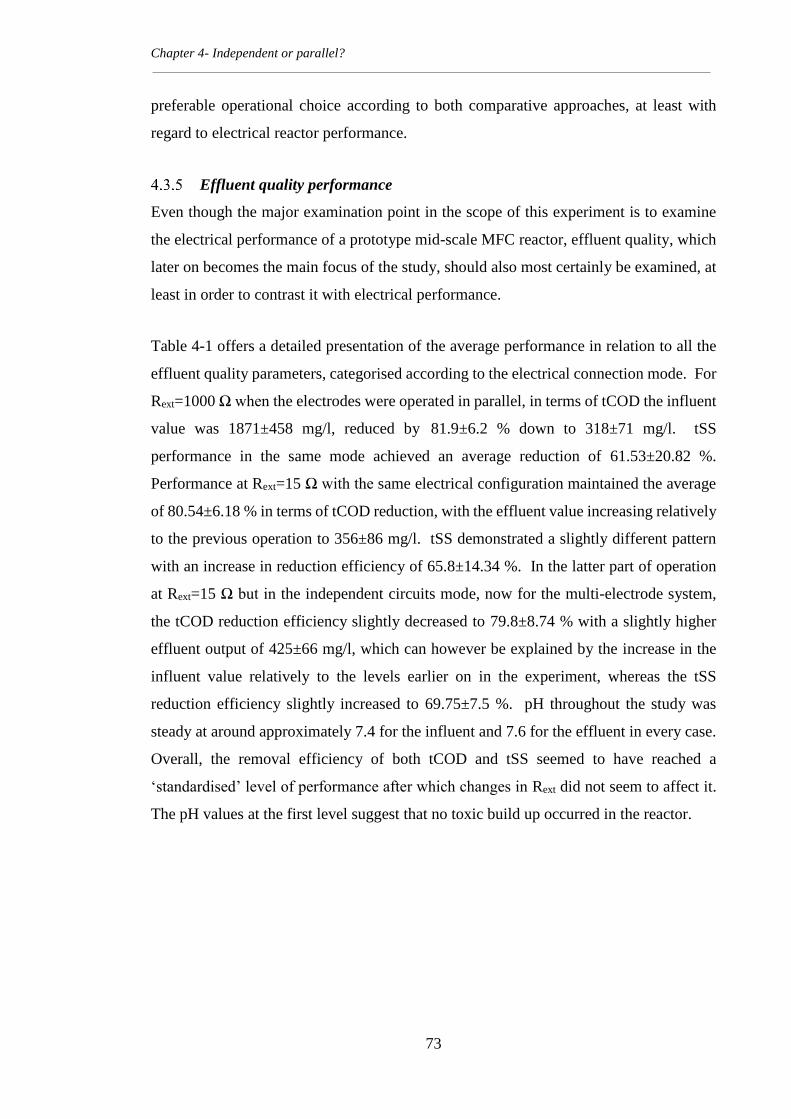
Chapter 4- Independent or parallel?
73
preferable operational choice according to both comparative approaches, at least with
regard to electrical reactor performance.
Effluent quality performance
Even though the major examination point in the scope of this experiment is to examine
the electrical performance of a prototype mid-scale MFC reactor, effluent quality, which
later on becomes the main focus of the study, should also most certainly be examined, at
least in order to contrast it with electrical performance.
Table 4-1 offers a detailed presentation of the average performance in relation to all the
effluent quality parameters, categorised according to the electrical connection mode. For
Rext=1000 Ω when the electrodes were operated in parallel, in terms of tCOD the influent
value was 1871±458 mg/l, reduced by 81.9±6.2 % down to 318±71 mg/l. tSS
performance in the same mode achieved an average reduction of 61.53±20.82 %.
Performance at Rext=15 Ω with the same electrical configuration maintained the average
of 80.54±6.18 % in terms of tCOD reduction, with the effluent value increasing relatively
to the previous operation to 356±86 mg/l. tSS demonstrated a slightly different pattern
with an increase in reduction efficiency of 65.8±14.34 %. In the latter part of operation
at Rext=15 Ω but in the independent circuits mode, now for the multi-electrode system,
the tCOD reduction efficiency slightly decreased to 79.8±8.74 % with a slightly higher
effluent output of 425±66 mg/l, which can however be explained by the increase in the
influent value relatively to the levels earlier on in the experiment, whereas the tSS
reduction efficiency slightly increased to 69.75±7.5 %. pH throughout the study was
steady at around approximately 7.4 for the influent and 7.6 for the effluent in every case.
Overall, the removal efficiency of both tCOD and tSS seemed to have reached a
‘standardised’ level of performance after which changes in Rext did not seem to affect it.
The pH values at the first level suggest that no toxic build up occurred in the reactor.
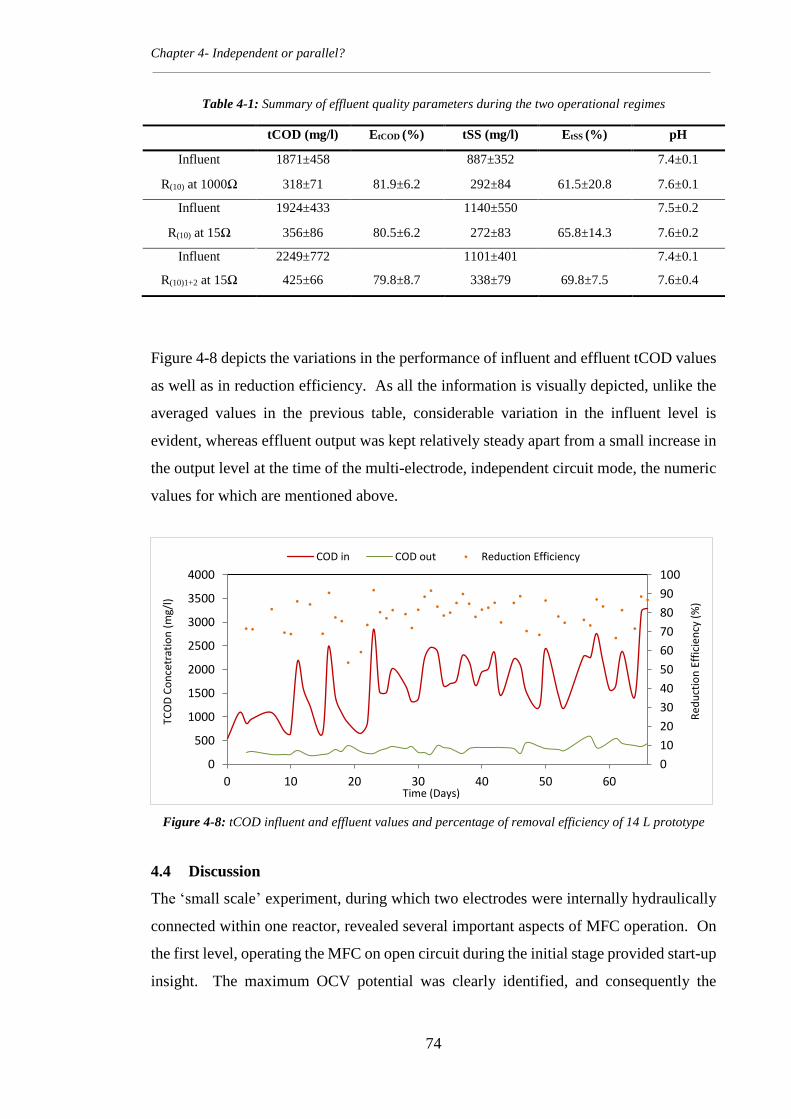
Chapter 4- Independent or parallel?
74
Table 4-1: Summary of effluent quality parameters during the two operational regimes
tCOD (mg/l) EtCOD (%) tSS (mg/l) EtSS (%) pH
Influent 1871±458 887±352 7.4±0.1
R(10) at 1000Ω 318±71 81.9±6.2 292±84 61.5±20.8 7.6±0.1
Influent 1924±433 1140±550 7.5±0.2
R(10) at 15Ω 356±86 80.5±6.2 272±83 65.8±14.3 7.6±0.2
Influent 2249±772 1101±401 7.4±0.1
R(10)1+2 at 15Ω 425±66 79.8±8.7 338±79 69.8±7.5 7.6±0.4
Figure 4-8 depicts the variations in the performance of influent and effluent tCOD values
as well as in reduction efficiency. As all the information is visually depicted, unlike the
averaged values in the previous table, considerable variation in the influent level is
evident, whereas effluent output was kept relatively steady apart from a small increase in
the output level at the time of the multi-electrode, independent circuit mode, the numeric
values for which are mentioned above.
Figure 4-8: tCOD influent and effluent values and percentage of removal efficiency of 14 L prototype
4.4 Discussion
The ‘small scale’ experiment, during which two electrodes were internally hydraulically
connected within one reactor, revealed several important aspects of MFC operation. On
the first level, operating the MFC on open circuit during the initial stage provided start-up
insight. The maximum OCV potential was clearly identified, and consequently the
0
10
20
30
40
50
60
70
80
90
100
0
500
1000
1500
2000
2500
3000
3500
4000
0 10 20 30 40 50 60
Red
uct
ion
Eff
icie
ncy
(%
)
TCO
D C
on
cetr
atio
n (
mg/
l)
Time (Days)
COD in COD out Reduction Efficiency
Chapter 4- Independent or parallel?
75
reactor demonstrated a steady state performance for the remainder of the experimental
period.
The use of different electrical methods such as polarisation tests and constant discharge
verified that the former is as important tool in electrode characterisation. Assuming that
the maximum power for the in parallel connected electrode occurred at Rext=15 Ω, the
same resistance was applied during long term operation at the two independent electrodes.
If that were the only test conducted, then the power output during independent operation
would have been considerably underestimated. A comparison between Figure 4-7 (A)
and 4-7 (B) reveals that during the aforementioned external resistance, the summed power
output of the combined independent electrodes only reached 0.455 mW. However, during
the polarisation test it was revealed that the maximum potential of the summed
independent electrodes was 0.761 mW, meaning that the previous result was an
underestimation of the electrodes’ potential. As the polarisation curves revealed, the
reduction of surface area by operating the electrodes independently led to higher internal
resistance, therefore, maximum output occurred at higher external resistances.
With regard to the main objective of this chapter, it has been proven that in the context of
the specific plug-flow multi-electrode MFC, a parallel connection between the two
adjacent anodes and cathodes results in a higher power output. As has been demonstrated,
regardless of whether the electrodes were examined at a specific level of external
resistance during long term operation, or via optimum performance through polarisation
curves, the parallel connection produced a considerably higher power output.
The final finding of this investigation is that during independent operation, the first
electrode (first in regards to the inlet point) demonstrated a considerably higher power
output than the second electrode, according to both polarisation curves and constant
discharge method. This could be attributed to the fact that the majority, or the more
complex, organic compounds were consumed closer to the influent point by the first
electrode. Therefore, less readily degradable matter was available for the microbial
community in the second compartment to consume, so less power was generated from it.
In a larger plug-flow multi-electrode reactor with an internally hydraulically connected
flow, it is expected that the power profile would demonstrate similar behaviour, with the
Chapter 4- Independent or parallel?
76
first electrode generating higher outputs which are then reduced as we move closer to the
exit point.
4.5 Chapter conclusions
The purpose of this chapter has been to examine and establish the optimum electrical
connection between two neighbouring electrodes in a multi-electrode reactor, with regard
both to electrical performance, for which power was used as the main parameter, and to
effluent treatment, for which various parameters have been examined.
From an overall perspective and in relation to the aims set as in the beginning of this
experiment, a parallel connection between two adjacent electrodes in a plug-flow
multi-electrode MFC appears to be preferable concerning optimum power output. The
parallel connected electrical circuit achieved a maximum power of 0.732 mW during
constant discharge as against the sum of the independent circuits, which achieved
0.455 mW. Additionally, it was demonstrated that the polarisation test overestimated the
maximum power achievable in comparison to the constant discharge method, confirming
the necessity of both tests in order to be able to accurately describe the electrical
performance of a reactor. In terms of effluent quality, this chapter has demonstrated the
fundamental ability of the reactors to treat whisky distillation by-products, considerably
reducing quality parameters, such as tCOD by an average of almost 82 % and tSS by an
average of almost 70 %.
This chapter and the bench scale experiment described within it has successfully defined
an optimum electrical connection for two neighbouring electrodes and the treatability of
anaerobic digestion liquid digestate. Finally, these results are adopted by, and further
implemented and examined in, the next part of this study, which concerns the
commissioning of a 122 L pilot scale multi-electrode MFC reactor.
77
Chapter 5 – Preliminary studies of prototype 122 L reactor
5.1 Introduction
The main focus of this chapter is the preliminary experiments which aimed to establish
the potential of the prototype 122 L reactor to sustainably treat whisky distillation
by-products and generate a positive energy balance in ambient temperature in a Scottish
environment. During this phase of development, a successful start-up period was
examined, followed by regular operation for an overall duration of almost 250 days. The
key characteristics of the large scale reactor were established, and its performance was
examined against various key performance indicators both in relation to its electrical
potential and its effluent quality, including its open circuit voltage, current and power as
well as the tCOD, tSS, pH and a variety of nutrients. The energy balance was also
examined under different phases and parameters.
5.2 Materials, methods and experimental set-up
A 122 L prototype MFC reactor was deployed according to the designs and specification
described in Chapter 3, using the standard cathode design shown in Figure 3-6 and Figure
3-4 (B) for the anode, consisting of activated carbon granules impregnated with NR upon
construction fixed upon carbon cloth with conductive glue. In terms of characteristics,
therefore, regardless of the electrical connections and influent/effluent sampling points
involved, the reactor, with an active volume of 57 L, consisted of eight anodes and eight
cathodes and is characterised as a plug-flow reactor with a serpentine circulation as
described in Figure 3-2. The inoculation of the reactor upon first deployment was carried
out according to the procedure described in Chapter 3. The experimental set-up also
follows the layout shown in Figure 3-10.
For the purposes of this chapter, it can be said that four distinct phases of experimentation
were implemented. During phase 1A, the liquid flow in the reactor was undivided as
described in Figure 3-1 and for electrode connection, eight independent circuits consisting
of one anode connected to one cathode through an external circuit as described in Figure
3-8 (A) were monitored for open circuit voltage. This operation was followed by phase
1B, during which the electrical connections were changed to four coupled anode-cathode
pairs as described in Figure 3-8 (B), and both open and closed circuit voltage were
recorded. The common ground during the two first phases is that the carbon cloth strips
in the cathode as described previously in Figure 3-5 (4), extended outside and under the
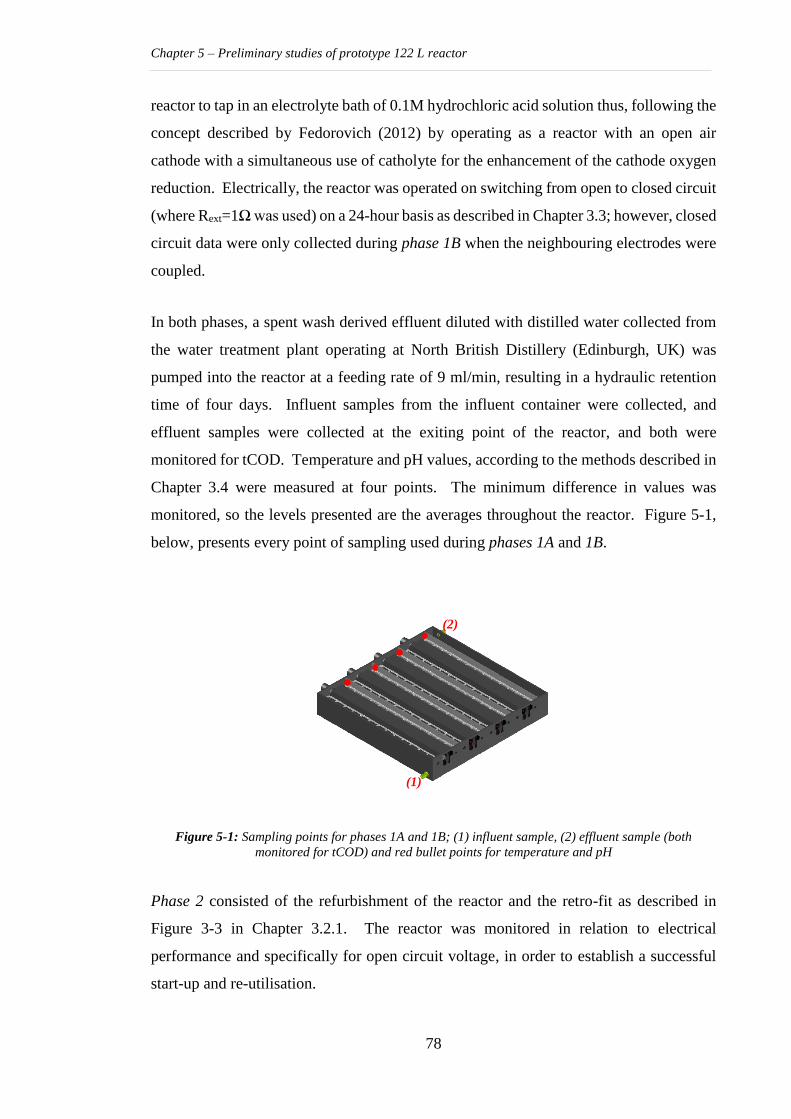
Chapter 5 – Preliminary studies of prototype 122 L reactor
78
reactor to tap in an electrolyte bath of 0.1M hydrochloric acid solution thus, following the
concept described by Fedorovich (2012) by operating as a reactor with an open air
cathode with a simultaneous use of catholyte for the enhancement of the cathode oxygen
reduction. Electrically, the reactor was operated on switching from open to closed circuit
(where Rext=1Ω was used) on a 24-hour basis as described in Chapter 3.3; however, closed
circuit data were only collected during phase 1B when the neighbouring electrodes were
coupled.
In both phases, a spent wash derived effluent diluted with distilled water collected from
the water treatment plant operating at North British Distillery (Edinburgh, UK) was
pumped into the reactor at a feeding rate of 9 ml/min, resulting in a hydraulic retention
time of four days. Influent samples from the influent container were collected, and
effluent samples were collected at the exiting point of the reactor, and both were
monitored for tCOD. Temperature and pH values, according to the methods described in
Chapter 3.4 were measured at four points. The minimum difference in values was
monitored, so the levels presented are the averages throughout the reactor. Figure 5-1,
below, presents every point of sampling used during phases 1A and 1B.
Figure 5-1: Sampling points for phases 1A and 1B; (1) influent sample, (2) effluent sample (both
monitored for tCOD) and red bullet points for temperature and pH
Phase 2 consisted of the refurbishment of the reactor and the retro-fit as described in
Figure 3-3 in Chapter 3.2.1. The reactor was monitored in relation to electrical
performance and specifically for open circuit voltage, in order to establish a successful
start-up and re-utilisation.
(1)
(2)
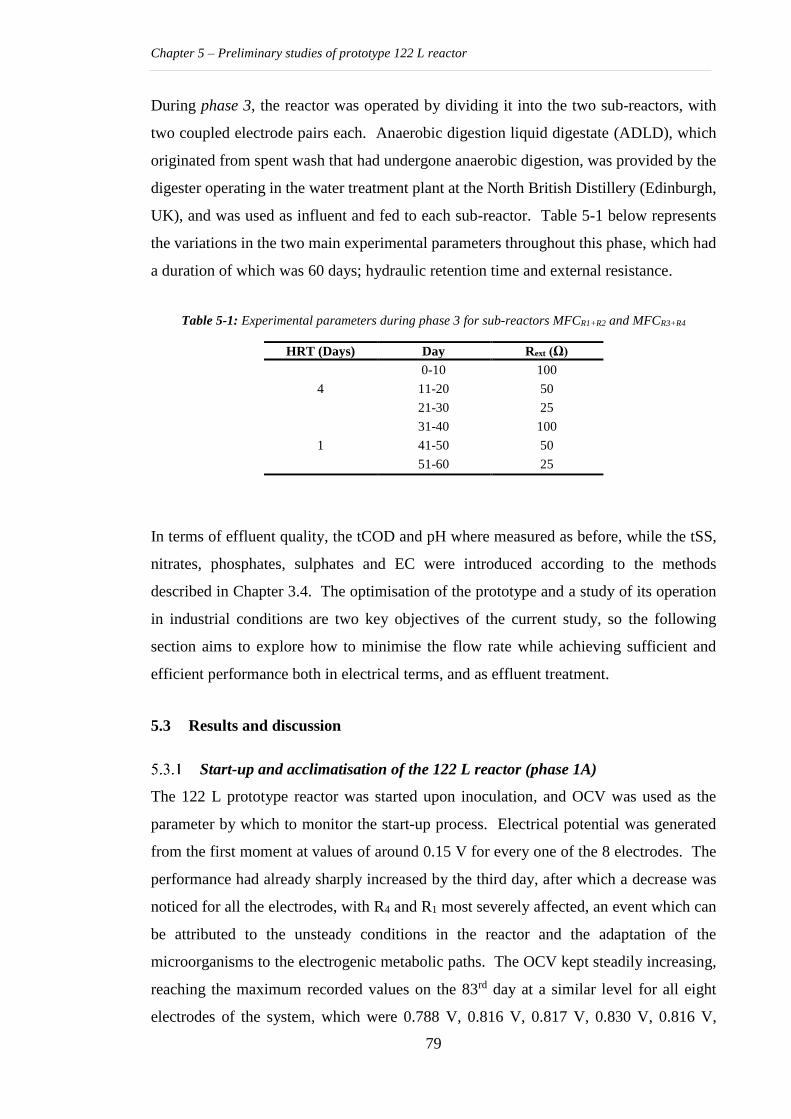
Chapter 5 – Preliminary studies of prototype 122 L reactor
79
During phase 3, the reactor was operated by dividing it into the two sub-reactors, with
two coupled electrode pairs each. Anaerobic digestion liquid digestate (ADLD), which
originated from spent wash that had undergone anaerobic digestion, was provided by the
digester operating in the water treatment plant at the North British Distillery (Edinburgh,
UK), and was used as influent and fed to each sub-reactor. Table 5-1 below represents
the variations in the two main experimental parameters throughout this phase, which had
a duration of which was 60 days; hydraulic retention time and external resistance.
Table 5-1: Experimental parameters during phase 3 for sub-reactors MFCR1+R2 and MFCR3+R4
HRT (Days) Day Rext (Ω)
4
0-10 100
11-20 50
21-30 25
1
31-40 100
41-50 50
51-60 25
In terms of effluent quality, the tCOD and pH where measured as before, while the tSS,
nitrates, phosphates, sulphates and EC were introduced according to the methods
described in Chapter 3.4. The optimisation of the prototype and a study of its operation
in industrial conditions are two key objectives of the current study, so the following
section aims to explore how to minimise the flow rate while achieving sufficient and
efficient performance both in electrical terms, and as effluent treatment.
5.3 Results and discussion
Start-up and acclimatisation of the 122 L reactor (phase 1A)
The 122 L prototype reactor was started upon inoculation, and OCV was used as the
parameter by which to monitor the start-up process. Electrical potential was generated
from the first moment at values of around 0.15 V for every one of the 8 electrodes. The
performance had already sharply increased by the third day, after which a decrease was
noticed for all the electrodes, with R4 and R1 most severely affected, an event which can
be attributed to the unsteady conditions in the reactor and the adaptation of the
microorganisms to the electrogenic metabolic paths. The OCV kept steadily increasing,
reaching the maximum recorded values on the 83rd day at a similar level for all eight
electrodes of the system, which were 0.788 V, 0.816 V, 0.817 V, 0.830 V, 0.816 V,
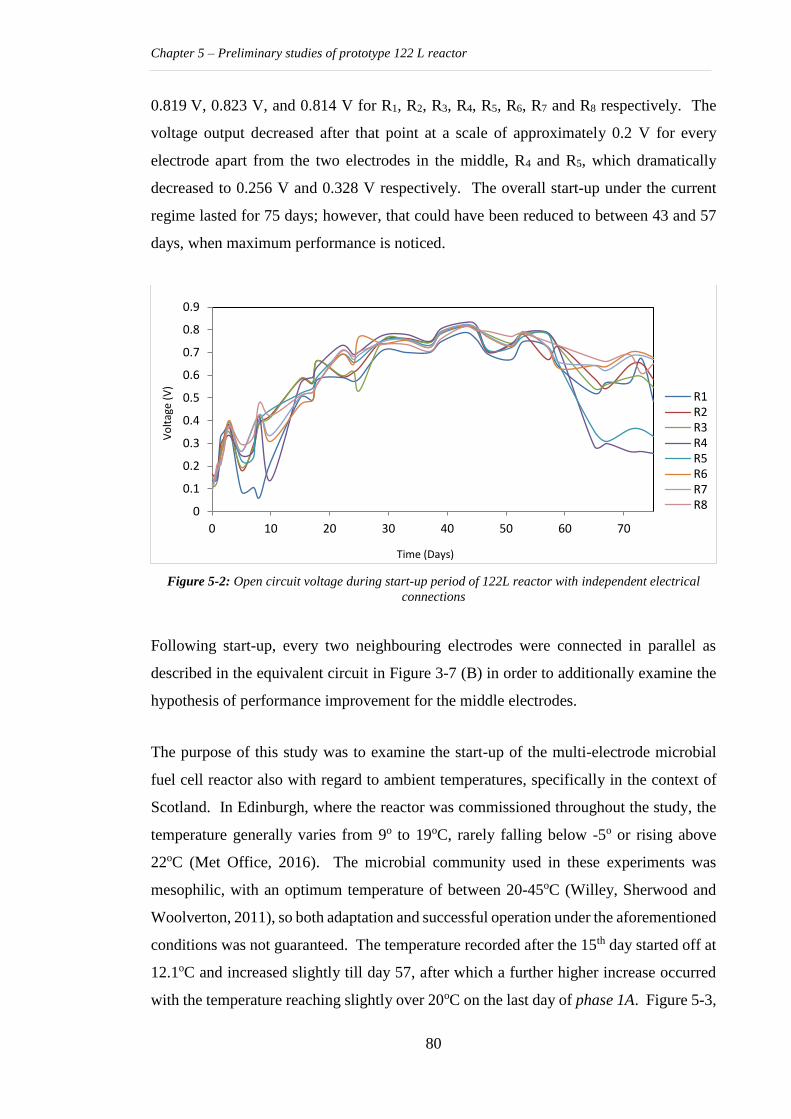
Chapter 5 – Preliminary studies of prototype 122 L reactor
80
0.819 V, 0.823 V, and 0.814 V for R1, R2, R3, R4, R5, R6, R7 and R8 respectively. The
voltage output decreased after that point at a scale of approximately 0.2 V for every
electrode apart from the two electrodes in the middle, R4 and R5, which dramatically
decreased to 0.256 V and 0.328 V respectively. The overall start-up under the current
regime lasted for 75 days; however, that could have been reduced to between 43 and 57
days, when maximum performance is noticed.
Figure 5-2: Open circuit voltage during start-up period of 122L reactor with independent electrical
connections
Following start-up, every two neighbouring electrodes were connected in parallel as
described in the equivalent circuit in Figure 3-7 (B) in order to additionally examine the
hypothesis of performance improvement for the middle electrodes.
The purpose of this study was to examine the start-up of the multi-electrode microbial
fuel cell reactor also with regard to ambient temperatures, specifically in the context of
Scotland. In Edinburgh, where the reactor was commissioned throughout the study, the
temperature generally varies from 9o to 19oC, rarely falling below -5o or rising above
22oC (Met Office, 2016). The microbial community used in these experiments was
mesophilic, with an optimum temperature of between 20-45oC (Willey, Sherwood and
Woolverton, 2011), so both adaptation and successful operation under the aforementioned
conditions was not guaranteed. The temperature recorded after the 15th day started off at
12.1oC and increased slightly till day 57, after which a further higher increase occurred
with the temperature reaching slightly over 20oC on the last day of phase 1A. Figure 5-3,
0
0.1
0.2
0.3
0.4
0.5
0.6
0.7
0.8
0.9
0 10 20 30 40 50 60 70
Vo
ltag
e (V
)
Time (Days)
R1R2R3R4R5R6R7R8
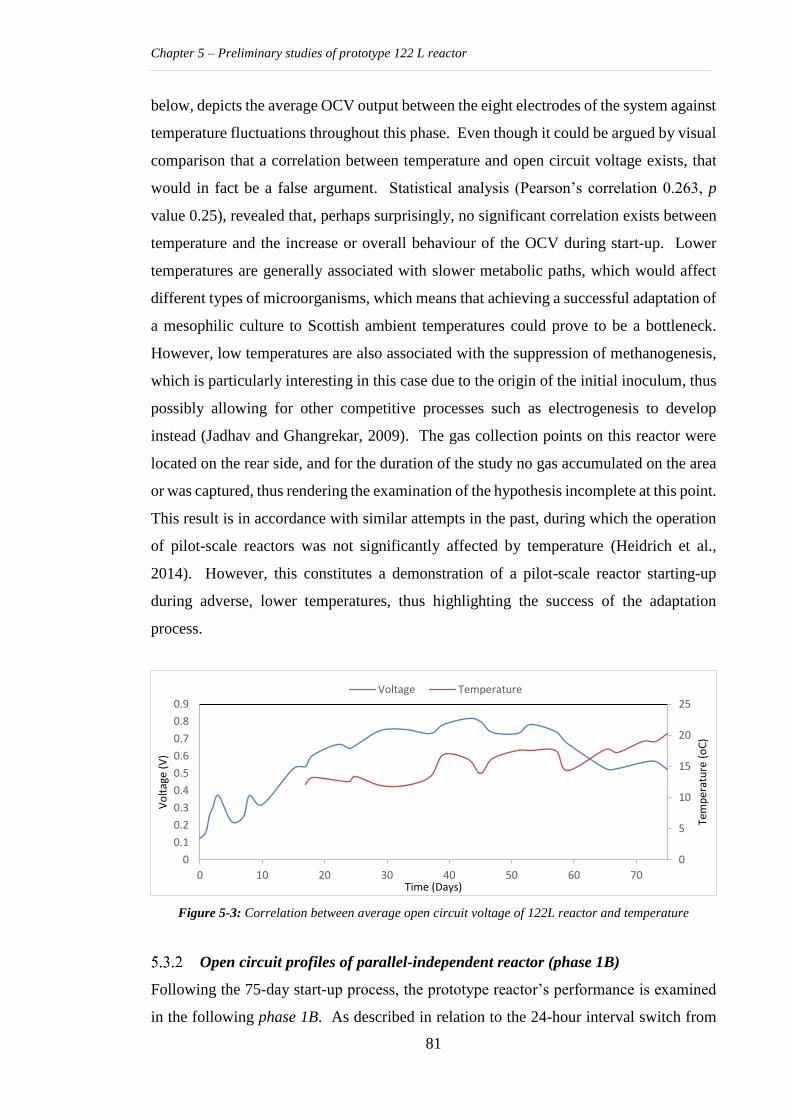
Chapter 5 – Preliminary studies of prototype 122 L reactor
81
below, depicts the average OCV output between the eight electrodes of the system against
temperature fluctuations throughout this phase. Even though it could be argued by visual
comparison that a correlation between temperature and open circuit voltage exists, that
would in fact be a false argument. Statistical analysis (Pearson’s correlation 0.263, p
value 0.25), revealed that, perhaps surprisingly, no significant correlation exists between
temperature and the increase or overall behaviour of the OCV during start-up. Lower
temperatures are generally associated with slower metabolic paths, which would affect
different types of microorganisms, which means that achieving a successful adaptation of
a mesophilic culture to Scottish ambient temperatures could prove to be a bottleneck.
However, low temperatures are also associated with the suppression of methanogenesis,
which is particularly interesting in this case due to the origin of the initial inoculum, thus
possibly allowing for other competitive processes such as electrogenesis to develop
instead (Jadhav and Ghangrekar, 2009). The gas collection points on this reactor were
located on the rear side, and for the duration of the study no gas accumulated on the area
or was captured, thus rendering the examination of the hypothesis incomplete at this point.
This result is in accordance with similar attempts in the past, during which the operation
of pilot-scale reactors was not significantly affected by temperature (Heidrich et al.,
2014). However, this constitutes a demonstration of a pilot-scale reactor starting-up
during adverse, lower temperatures, thus highlighting the success of the adaptation
process.
Figure 5-3: Correlation between average open circuit voltage of 122L reactor and temperature
Open circuit profiles of parallel-independent reactor (phase 1B)
Following the 75-day start-up process, the prototype reactor’s performance is examined
in the following phase 1B. As described in relation to the 24-hour interval switch from
0
5
10
15
20
25
0
0.1
0.2
0.3
0.4
0.5
0.6
0.7
0.8
0.9
0 10 20 30 40 50 60 70
Tem
per
atu
re (
oC
)
Vo
ltag
e (V
)
Time (Days)
Voltage Temperature
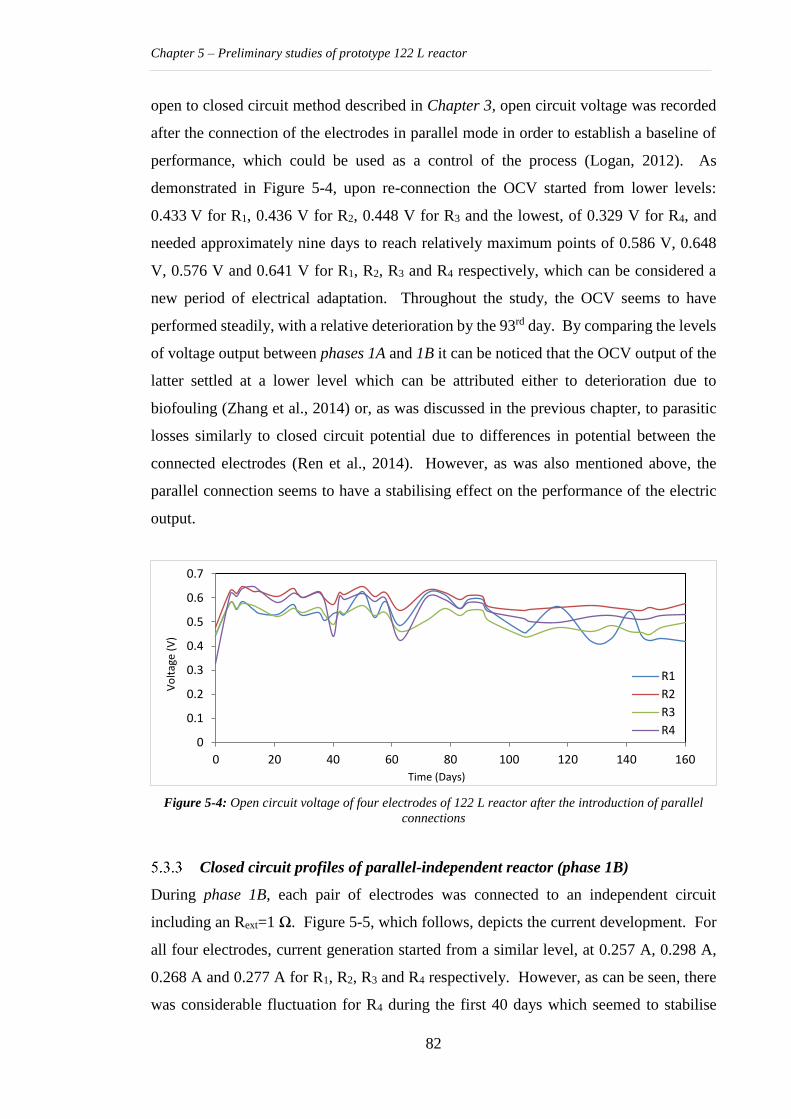
Chapter 5 – Preliminary studies of prototype 122 L reactor
82
open to closed circuit method described in Chapter 3, open circuit voltage was recorded
after the connection of the electrodes in parallel mode in order to establish a baseline of
performance, which could be used as a control of the process (Logan, 2012). As
demonstrated in Figure 5-4, upon re-connection the OCV started from lower levels:
0.433 V for R1, 0.436 V for R2, 0.448 V for R3 and the lowest, of 0.329 V for R4, and
needed approximately nine days to reach relatively maximum points of 0.586 V, 0.648
V, 0.576 V and 0.641 V for R1, R2, R3 and R4 respectively, which can be considered a
new period of electrical adaptation. Throughout the study, the OCV seems to have
performed steadily, with a relative deterioration by the 93rd day. By comparing the levels
of voltage output between phases 1A and 1B it can be noticed that the OCV output of the
latter settled at a lower level which can be attributed either to deterioration due to
biofouling (Zhang et al., 2014) or, as was discussed in the previous chapter, to parasitic
losses similarly to closed circuit potential due to differences in potential between the
connected electrodes (Ren et al., 2014). However, as was also mentioned above, the
parallel connection seems to have a stabilising effect on the performance of the electric
output.
Figure 5-4: Open circuit voltage of four electrodes of 122 L reactor after the introduction of parallel
connections
Closed circuit profiles of parallel-independent reactor (phase 1B)
During phase 1B, each pair of electrodes was connected to an independent circuit
including an Rext=1 Ω. Figure 5-5, which follows, depicts the current development. For
all four electrodes, current generation started from a similar level, at 0.257 A, 0.298 A,
0.268 A and 0.277 A for R1, R2, R3 and R4 respectively. However, as can be seen, there
was considerable fluctuation for R4 during the first 40 days which seemed to stabilise
0
0.1
0.2
0.3
0.4
0.5
0.6
0.7
0 20 40 60 80 100 120 140 160
Vo
ltag
e (V
)
Time (Days)
R1
R2
R3
R4
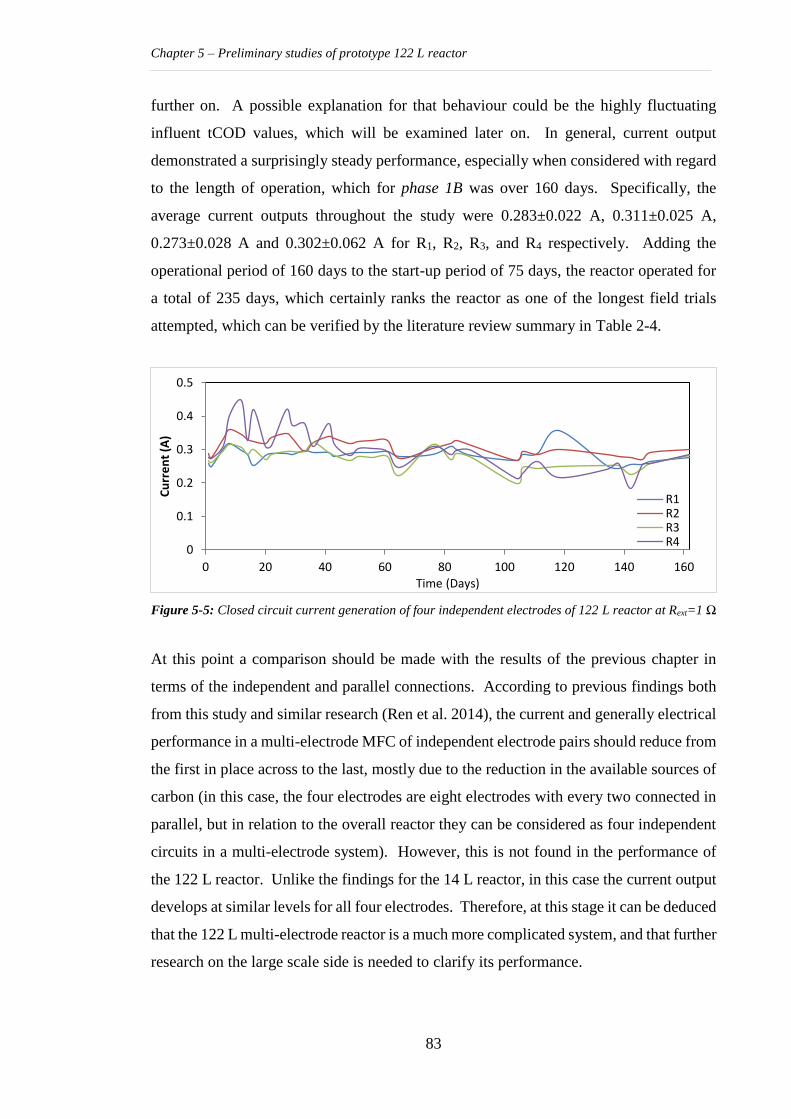
Chapter 5 – Preliminary studies of prototype 122 L reactor
83
further on. A possible explanation for that behaviour could be the highly fluctuating
influent tCOD values, which will be examined later on. In general, current output
demonstrated a surprisingly steady performance, especially when considered with regard
to the length of operation, which for phase 1B was over 160 days. Specifically, the
average current outputs throughout the study were 0.283±0.022 A, 0.311±0.025 A,
0.273±0.028 A and 0.302±0.062 A for R1, R2, R3, and R4 respectively. Adding the
operational period of 160 days to the start-up period of 75 days, the reactor operated for
a total of 235 days, which certainly ranks the reactor as one of the longest field trials
attempted, which can be verified by the literature review summary in Table 2-4.
Figure 5-5: Closed circuit current generation of four independent electrodes of 122 L reactor at Rext=1 Ω
At this point a comparison should be made with the results of the previous chapter in
terms of the independent and parallel connections. According to previous findings both
from this study and similar research (Ren et al. 2014), the current and generally electrical
performance in a multi-electrode MFC of independent electrode pairs should reduce from
the first in place across to the last, mostly due to the reduction in the available sources of
carbon (in this case, the four electrodes are eight electrodes with every two connected in
parallel, but in relation to the overall reactor they can be considered as four independent
circuits in a multi-electrode system). However, this is not found in the performance of
the 122 L reactor. Unlike the findings for the 14 L reactor, in this case the current output
develops at similar levels for all four electrodes. Therefore, at this stage it can be deduced
that the 122 L multi-electrode reactor is a much more complicated system, and that further
research on the large scale side is needed to clarify its performance.
0
0.1
0.2
0.3
0.4
0.5
0 20 40 60 80 100 120 140 160
Cu
rre
nt
(A)
Time (Days)
R1R2R3R4
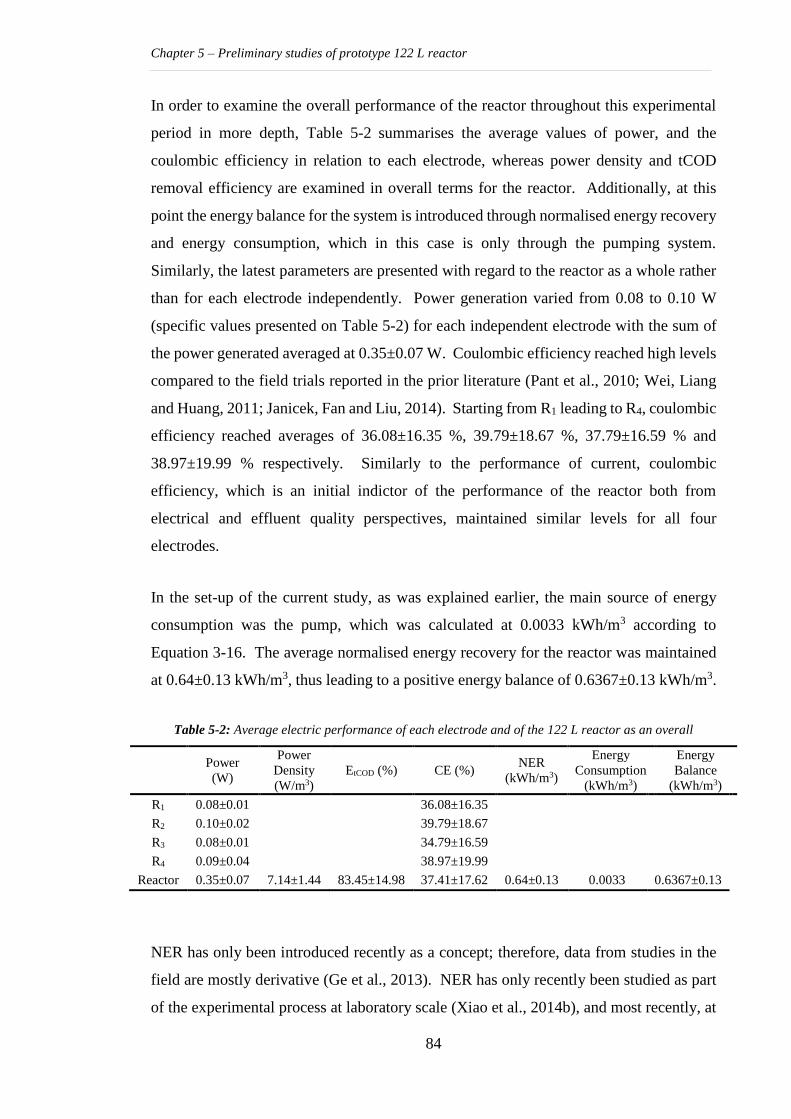
Chapter 5 – Preliminary studies of prototype 122 L reactor
84
In order to examine the overall performance of the reactor throughout this experimental
period in more depth, Table 5-2 summarises the average values of power, and the
coulombic efficiency in relation to each electrode, whereas power density and tCOD
removal efficiency are examined in overall terms for the reactor. Additionally, at this
point the energy balance for the system is introduced through normalised energy recovery
and energy consumption, which in this case is only through the pumping system.
Similarly, the latest parameters are presented with regard to the reactor as a whole rather
than for each electrode independently. Power generation varied from 0.08 to 0.10 W
(specific values presented on Table 5-2) for each independent electrode with the sum of
the power generated averaged at 0.35±0.07 W. Coulombic efficiency reached high levels
compared to the field trials reported in the prior literature (Pant et al., 2010; Wei, Liang
and Huang, 2011; Janicek, Fan and Liu, 2014). Starting from R1 leading to R4, coulombic
efficiency reached averages of 36.08±16.35 %, 39.79±18.67 %, 37.79±16.59 % and
38.97±19.99 % respectively. Similarly to the performance of current, coulombic
efficiency, which is an initial indictor of the performance of the reactor both from
electrical and effluent quality perspectives, maintained similar levels for all four
electrodes.
In the set-up of the current study, as was explained earlier, the main source of energy
consumption was the pump, which was calculated at 0.0033 kWh/m3 according to
Equation 3-16. The average normalised energy recovery for the reactor was maintained
at 0.64±0.13 kWh/m3, thus leading to a positive energy balance of 0.6367±0.13 kWh/m3.
Table 5-2: Average electric performance of each electrode and of the 122 L reactor as an overall
Power
(W)
Power
Density
(W/m3)
EtCOD (%) CE (%) NER
(kWh/m3)
Energy
Consumption
(kWh/m3)
Energy
Balance
(kWh/m3)
R1 0.08±0.01 36.08±16.35
R2 0.10±0.02 39.79±18.67
R3 0.08±0.01 34.79±16.59
R4 0.09±0.04 38.97±19.99
Reactor 0.35±0.07 7.14±1.44 83.45±14.98 37.41±17.62 0.64±0.13 0.0033 0.6367±0.13
NER has only been introduced recently as a concept; therefore, data from studies in the
field are mostly derivative (Ge et al., 2013). NER has only recently been studied as part
of the experimental process at laboratory scale (Xiao et al., 2014b), and most recently, at
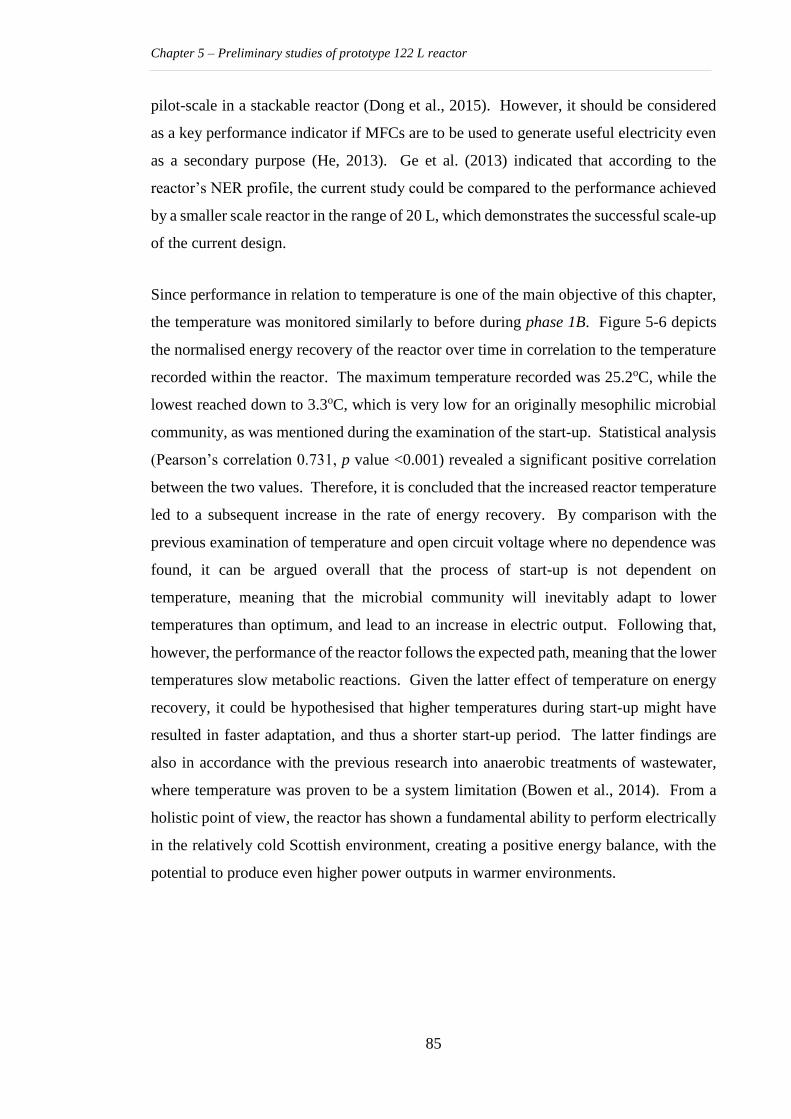
Chapter 5 – Preliminary studies of prototype 122 L reactor
85
pilot-scale in a stackable reactor (Dong et al., 2015). However, it should be considered
as a key performance indicator if MFCs are to be used to generate useful electricity even
as a secondary purpose (He, 2013). Ge et al. (2013) indicated that according to the
reactor’s NER profile, the current study could be compared to the performance achieved
by a smaller scale reactor in the range of 20 L, which demonstrates the successful scale-up
of the current design.
Since performance in relation to temperature is one of the main objective of this chapter,
the temperature was monitored similarly to before during phase 1B. Figure 5-6 depicts
the normalised energy recovery of the reactor over time in correlation to the temperature
recorded within the reactor. The maximum temperature recorded was 25.2oC, while the
lowest reached down to 3.3oC, which is very low for an originally mesophilic microbial
community, as was mentioned during the examination of the start-up. Statistical analysis
(Pearson’s correlation 0.731, p value <0.001) revealed a significant positive correlation
between the two values. Therefore, it is concluded that the increased reactor temperature
led to a subsequent increase in the rate of energy recovery. By comparison with the
previous examination of temperature and open circuit voltage where no dependence was
found, it can be argued overall that the process of start-up is not dependent on
temperature, meaning that the microbial community will inevitably adapt to lower
temperatures than optimum, and lead to an increase in electric output. Following that,
however, the performance of the reactor follows the expected path, meaning that the lower
temperatures slow metabolic reactions. Given the latter effect of temperature on energy
recovery, it could be hypothesised that higher temperatures during start-up might have
resulted in faster adaptation, and thus a shorter start-up period. The latter findings are
also in accordance with the previous research into anaerobic treatments of wastewater,
where temperature was proven to be a system limitation (Bowen et al., 2014). From a
holistic point of view, the reactor has shown a fundamental ability to perform electrically
in the relatively cold Scottish environment, creating a positive energy balance, with the
potential to produce even higher power outputs in warmer environments.
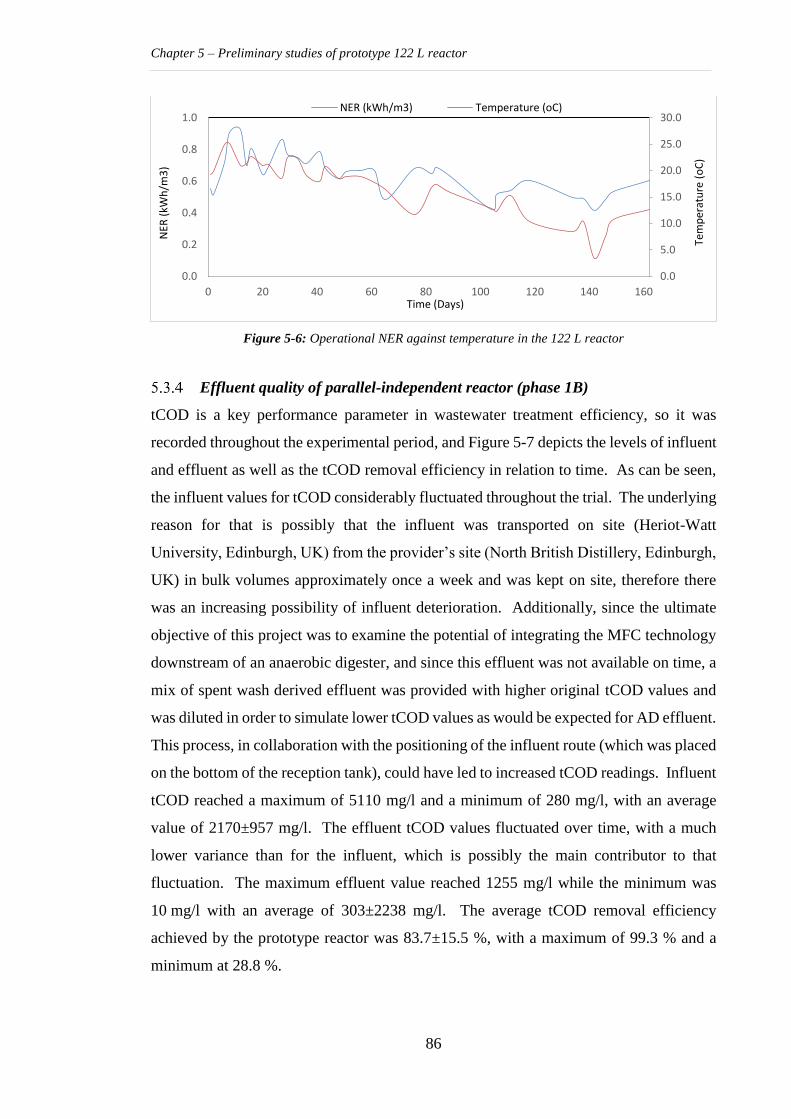
Chapter 5 – Preliminary studies of prototype 122 L reactor
86
Figure 5-6: Operational NER against temperature in the 122 L reactor
Effluent quality of parallel-independent reactor (phase 1B)
tCOD is a key performance parameter in wastewater treatment efficiency, so it was
recorded throughout the experimental period, and Figure 5-7 depicts the levels of influent
and effluent as well as the tCOD removal efficiency in relation to time. As can be seen,
the influent values for tCOD considerably fluctuated throughout the trial. The underlying
reason for that is possibly that the influent was transported on site (Heriot-Watt
University, Edinburgh, UK) from the provider’s site (North British Distillery, Edinburgh,
UK) in bulk volumes approximately once a week and was kept on site, therefore there
was an increasing possibility of influent deterioration. Additionally, since the ultimate
objective of this project was to examine the potential of integrating the MFC technology
downstream of an anaerobic digester, and since this effluent was not available on time, a
mix of spent wash derived effluent was provided with higher original tCOD values and
was diluted in order to simulate lower tCOD values as would be expected for AD effluent.
This process, in collaboration with the positioning of the influent route (which was placed
on the bottom of the reception tank), could have led to increased tCOD readings. Influent
tCOD reached a maximum of 5110 mg/l and a minimum of 280 mg/l, with an average
value of 2170±957 mg/l. The effluent tCOD values fluctuated over time, with a much
lower variance than for the influent, which is possibly the main contributor to that
fluctuation. The maximum effluent value reached 1255 mg/l while the minimum was
10 mg/l with an average of 303±2238 mg/l. The average tCOD removal efficiency
achieved by the prototype reactor was 83.7±15.5 %, with a maximum of 99.3 % and a
minimum at 28.8 %.
0.0
5.0
10.0
15.0
20.0
25.0
30.0
0.0
0.2
0.4
0.6
0.8
1.0
0 20 40 60 80 100 120 140 160
Tem
per
atu
re (
oC
)
NER
(kW
h/m
3)
Time (Days)
NER (kWh/m3) Temperature (oC)
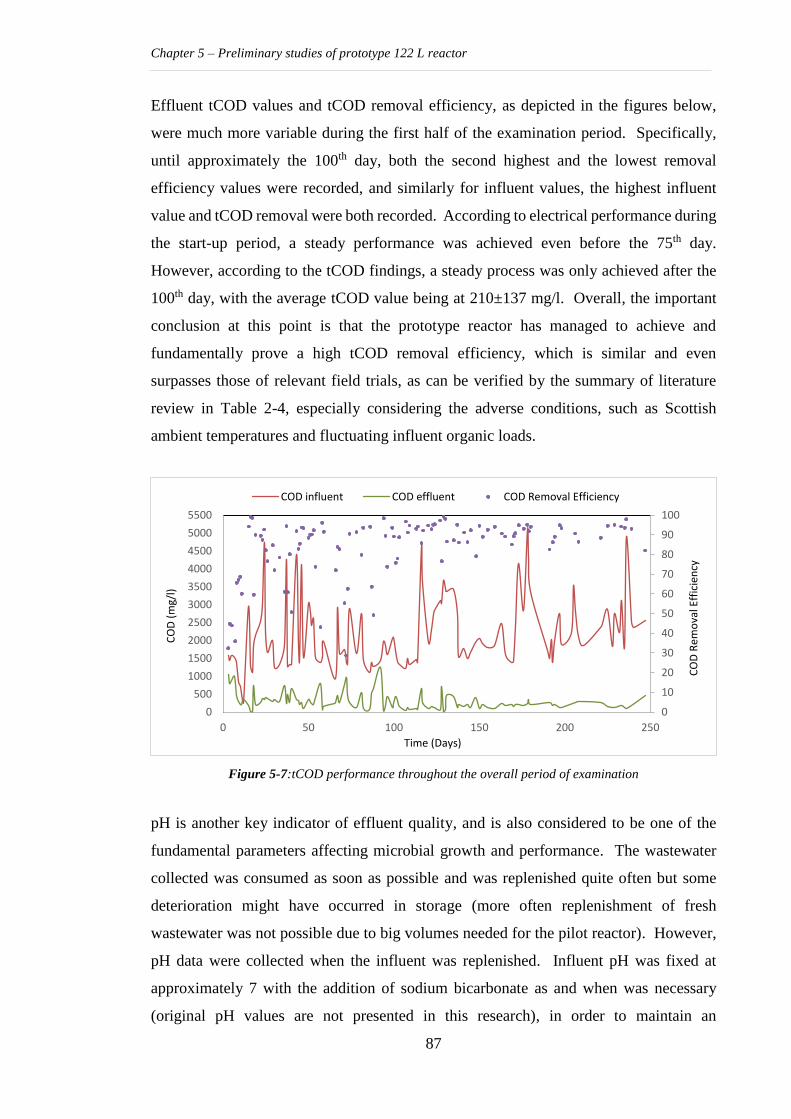
Chapter 5 – Preliminary studies of prototype 122 L reactor
87
Effluent tCOD values and tCOD removal efficiency, as depicted in the figures below,
were much more variable during the first half of the examination period. Specifically,
until approximately the 100th day, both the second highest and the lowest removal
efficiency values were recorded, and similarly for influent values, the highest influent
value and tCOD removal were both recorded. According to electrical performance during
the start-up period, a steady performance was achieved even before the 75th day.
However, according to the tCOD findings, a steady process was only achieved after the
100th day, with the average tCOD value being at 210±137 mg/l. Overall, the important
conclusion at this point is that the prototype reactor has managed to achieve and
fundamentally prove a high tCOD removal efficiency, which is similar and even
surpasses those of relevant field trials, as can be verified by the summary of literature
review in Table 2-4, especially considering the adverse conditions, such as Scottish
ambient temperatures and fluctuating influent organic loads.
Figure 5-7:tCOD performance throughout the overall period of examination
pH is another key indicator of effluent quality, and is also considered to be one of the
fundamental parameters affecting microbial growth and performance. The wastewater
collected was consumed as soon as possible and was replenished quite often but some
deterioration might have occurred in storage (more often replenishment of fresh
wastewater was not possible due to big volumes needed for the pilot reactor). However,
pH data were collected when the influent was replenished. Influent pH was fixed at
approximately 7 with the addition of sodium bicarbonate as and when was necessary
(original pH values are not presented in this research), in order to maintain an
0
10
20
30
40
50
60
70
80
90
100
0
500
1000
1500
2000
2500
3000
3500
4000
4500
5000
5500
0 50 100 150 200 250
CO
D R
emo
val E
ffic
ien
cy
CO
D (
mg/
l)
Time (Days)
COD influent COD effluent COD Removal Efficiency
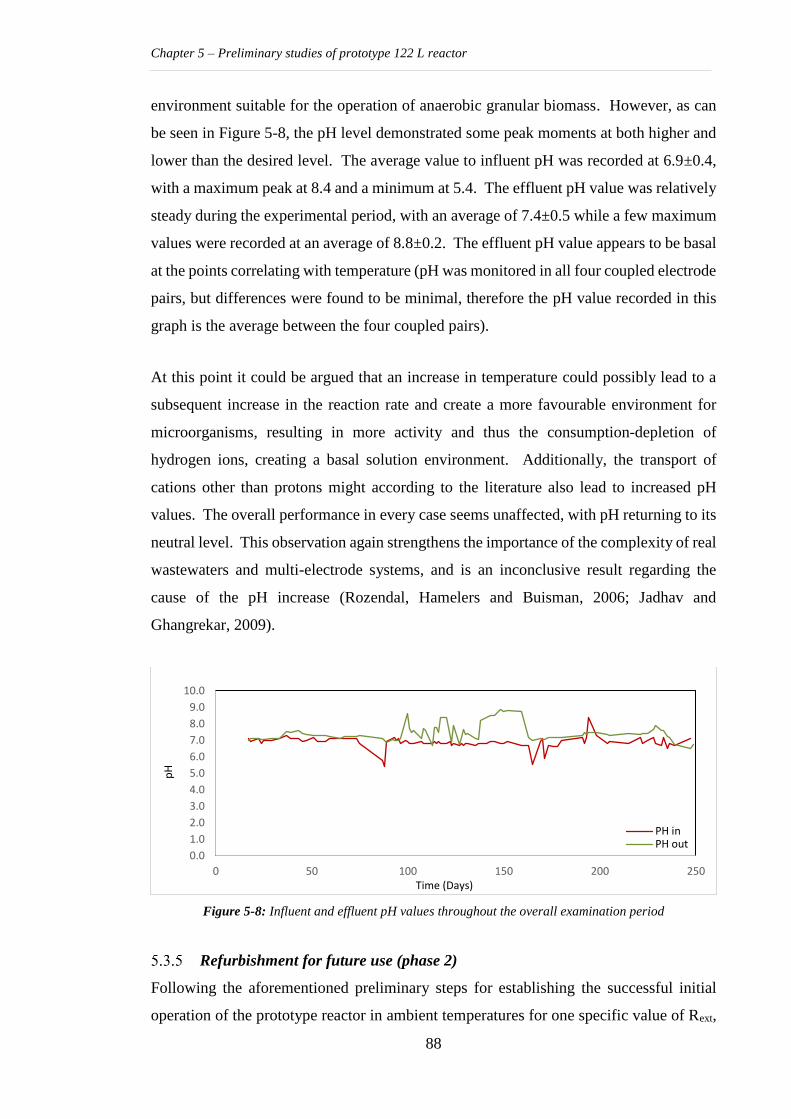
Chapter 5 – Preliminary studies of prototype 122 L reactor
88
environment suitable for the operation of anaerobic granular biomass. However, as can
be seen in Figure 5-8, the pH level demonstrated some peak moments at both higher and
lower than the desired level. The average value to influent pH was recorded at 6.9±0.4,
with a maximum peak at 8.4 and a minimum at 5.4. The effluent pH value was relatively
steady during the experimental period, with an average of 7.4±0.5 while a few maximum
values were recorded at an average of 8.8±0.2. The effluent pH value appears to be basal
at the points correlating with temperature (pH was monitored in all four coupled electrode
pairs, but differences were found to be minimal, therefore the pH value recorded in this
graph is the average between the four coupled pairs).
At this point it could be argued that an increase in temperature could possibly lead to a
subsequent increase in the reaction rate and create a more favourable environment for
microorganisms, resulting in more activity and thus the consumption-depletion of
hydrogen ions, creating a basal solution environment. Additionally, the transport of
cations other than protons might according to the literature also lead to increased pH
values. The overall performance in every case seems unaffected, with pH returning to its
neutral level. This observation again strengthens the importance of the complexity of real
wastewaters and multi-electrode systems, and is an inconclusive result regarding the
cause of the pH increase (Rozendal, Hamelers and Buisman, 2006; Jadhav and
Ghangrekar, 2009).
Figure 5-8: Influent and effluent pH values throughout the overall examination period
Refurbishment for future use (phase 2)
Following the aforementioned preliminary steps for establishing the successful initial
operation of the prototype reactor in ambient temperatures for one specific value of Rext,
0.0
1.0
2.0
3.0
4.0
5.0
6.0
7.0
8.0
9.0
10.0
0 50 100 150 200 250
pH
Time (Days)
PH inPH out
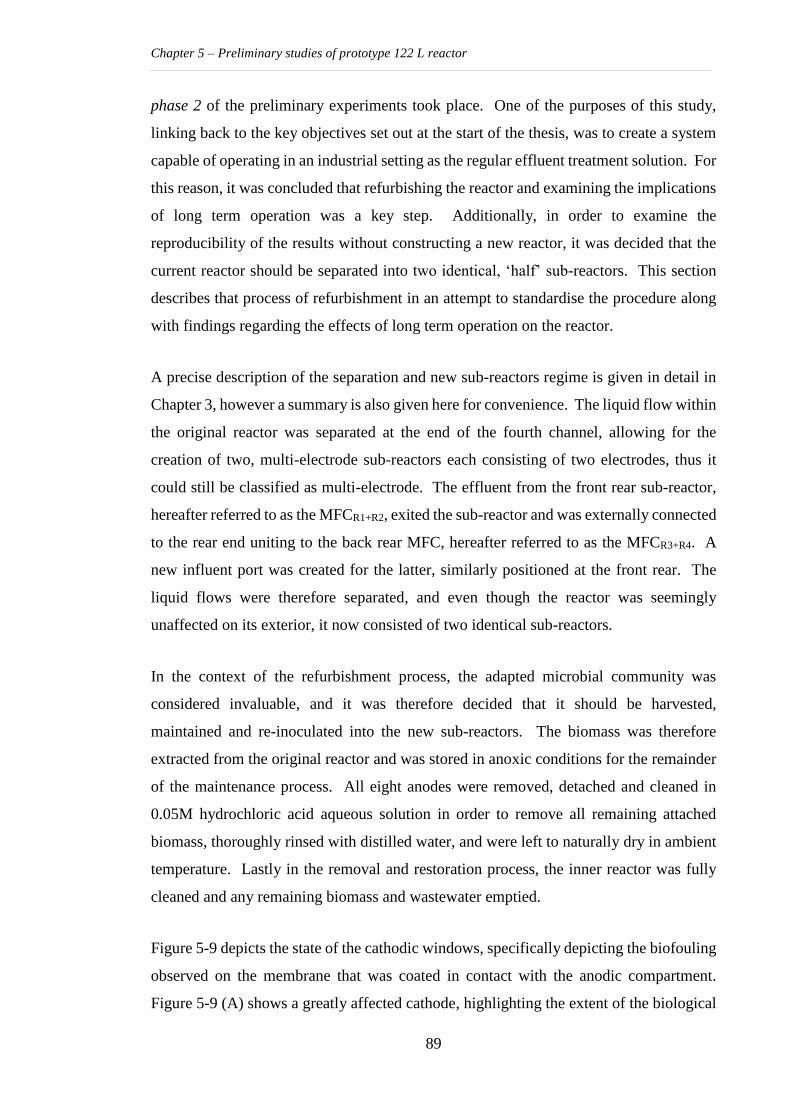
Chapter 5 – Preliminary studies of prototype 122 L reactor
89
phase 2 of the preliminary experiments took place. One of the purposes of this study,
linking back to the key objectives set out at the start of the thesis, was to create a system
capable of operating in an industrial setting as the regular effluent treatment solution. For
this reason, it was concluded that refurbishing the reactor and examining the implications
of long term operation was a key step. Additionally, in order to examine the
reproducibility of the results without constructing a new reactor, it was decided that the
current reactor should be separated into two identical, ‘half’ sub-reactors. This section
describes that process of refurbishment in an attempt to standardise the procedure along
with findings regarding the effects of long term operation on the reactor.
A precise description of the separation and new sub-reactors regime is given in detail in
Chapter 3, however a summary is also given here for convenience. The liquid flow within
the original reactor was separated at the end of the fourth channel, allowing for the
creation of two, multi-electrode sub-reactors each consisting of two electrodes, thus it
could still be classified as multi-electrode. The effluent from the front rear sub-reactor,
hereafter referred to as the MFCR1+R2, exited the sub-reactor and was externally connected
to the rear end uniting to the back rear MFC, hereafter referred to as the MFCR3+R4. A
new influent port was created for the latter, similarly positioned at the front rear. The
liquid flows were therefore separated, and even though the reactor was seemingly
unaffected on its exterior, it now consisted of two identical sub-reactors.
In the context of the refurbishment process, the adapted microbial community was
considered invaluable, and it was therefore decided that it should be harvested,
maintained and re-inoculated into the new sub-reactors. The biomass was therefore
extracted from the original reactor and was stored in anoxic conditions for the remainder
of the maintenance process. All eight anodes were removed, detached and cleaned in
0.05M hydrochloric acid aqueous solution in order to remove all remaining attached
biomass, thoroughly rinsed with distilled water, and were left to naturally dry in ambient
temperature. Lastly in the removal and restoration process, the inner reactor was fully
cleaned and any remaining biomass and wastewater emptied.
Figure 5-9 depicts the state of the cathodic windows, specifically depicting the biofouling
observed on the membrane that was coated in contact with the anodic compartment.
Figure 5-9 (A) shows a greatly affected cathode, highlighting the extent of the biological
Chapter 5 – Preliminary studies of prototype 122 L reactor
90
fouling, while Figure 5-9 (B) shows an example of a healthy membrane where minimal
to almost no biofouling has occurred. Biofouling has been reported in recent research
similarly attempting to address the issue of long term performance and effects on
microbial fuel cells. A steep deterioration of cathode potential has been attributed to this
phenomenon (Zhuang et al., 2012a; Zhang et al., 2014). However, due to the destructive
nature of the inspection process, no evidence could be extracted at an earlier stage. The
proportion of the cathodic windows affected was approximately at 75 % with windows
affected throughout the course of the influent, with one third of that greatly affected as
shown in Figure 5-9 (A). Even though the deterioration of the cathodic membrane quality
was obvious for a considerable part of the reactor, it was decided to proceed with the
refurbishment process due to the main objective of this project, which was to view the
realistic performance of a pilot-scale MFC in the long term, rather than to view this
system as a one off application.
Figure 5-9: Example of cathode condition due to biofouling at the point of refurbishment; (A) greatly
affected membrane and (B) healthy membrane with minimum fouling
Following the latter part, the anodes were connected back in place within the reactor in
an identical order to that previously used. The electrochemically active biomass was
re-inoculated into the reactor and the start-up process was initiated. It is important to note
at this point that the hydrochloric acid solution used as electrolyte in which the cathode
carbon cloth strips were tapping in order to absorb and transport it in the cathode element,
was not used from this point onwards, for two reasons: firstly, because mechanical
failures of the lower compartment where the solution was kept led to leakages of
electrolyte solution, and secondly because as weak as that solution was, it was decided to
address chemical leakages prior to further use. The latter also led towards a less
complicated system which would be closer to a realistic and practical industrial design.
A B
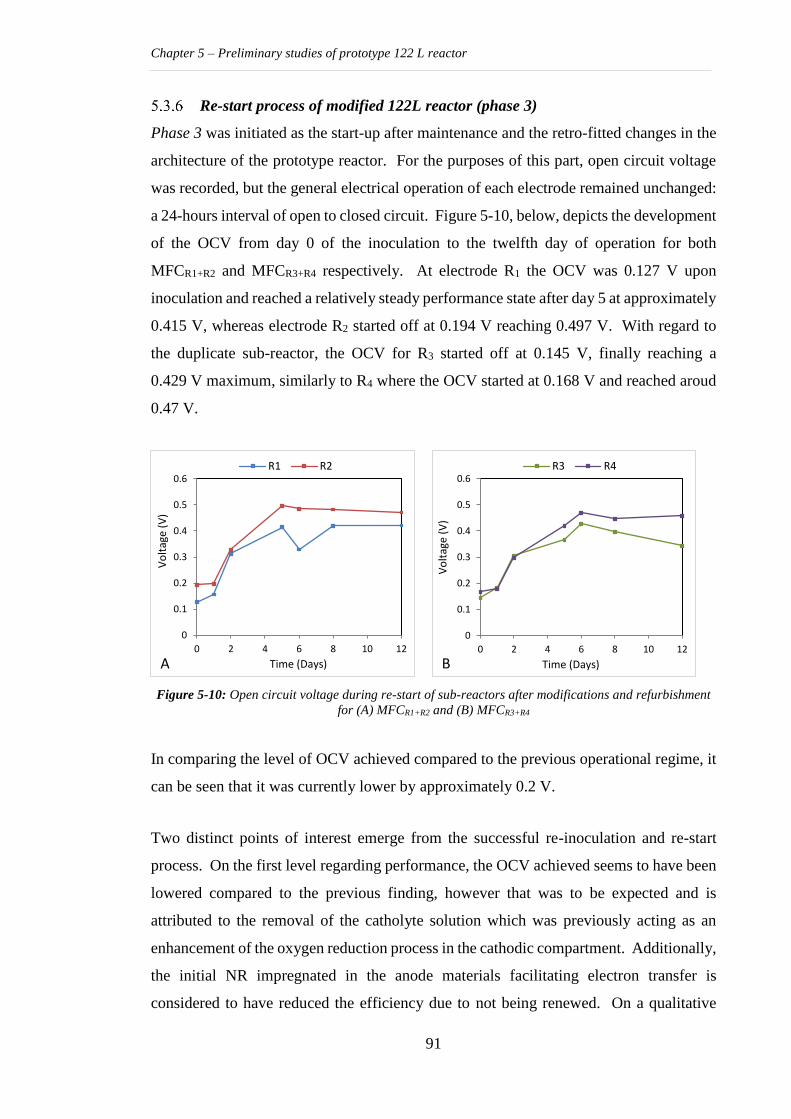
Chapter 5 – Preliminary studies of prototype 122 L reactor
91
Re-start process of modified 122L reactor (phase 3)
Phase 3 was initiated as the start-up after maintenance and the retro-fitted changes in the
architecture of the prototype reactor. For the purposes of this part, open circuit voltage
was recorded, but the general electrical operation of each electrode remained unchanged:
a 24-hours interval of open to closed circuit. Figure 5-10, below, depicts the development
of the OCV from day 0 of the inoculation to the twelfth day of operation for both
MFCR1+R2 and MFCR3+R4 respectively. At electrode R1 the OCV was 0.127 V upon
inoculation and reached a relatively steady performance state after day 5 at approximately
0.415 V, whereas electrode R2 started off at 0.194 V reaching 0.497 V. With regard to
the duplicate sub-reactor, the OCV for R3 started off at 0.145 V, finally reaching a
0.429 V maximum, similarly to R4 where the OCV started at 0.168 V and reached aroud
0.47 V.
Figure 5-10: Open circuit voltage during re-start of sub-reactors after modifications and refurbishment
for (A) MFCR1+R2 and (B) MFCR3+R4
In comparing the level of OCV achieved compared to the previous operational regime, it
can be seen that it was currently lower by approximately 0.2 V.
Two distinct points of interest emerge from the successful re-inoculation and re-start
process. On the first level regarding performance, the OCV achieved seems to have been
lowered compared to the previous finding, however that was to be expected and is
attributed to the removal of the catholyte solution which was previously acting as an
enhancement of the oxygen reduction process in the cathodic compartment. Additionally,
the initial NR impregnated in the anode materials facilitating electron transfer is
considered to have reduced the efficiency due to not being renewed. On a qualitative
0
0.1
0.2
0.3
0.4
0.5
0.6
0 2 4 6 8 10 12
Vo
ltag
e (V
)
Time (Days)
R1 R2
A
0
0.1
0.2
0.3
0.4
0.5
0.6
0 2 4 6 8 10 12
Vo
ltag
e (V
)
Time (Days)
R3 R4
B
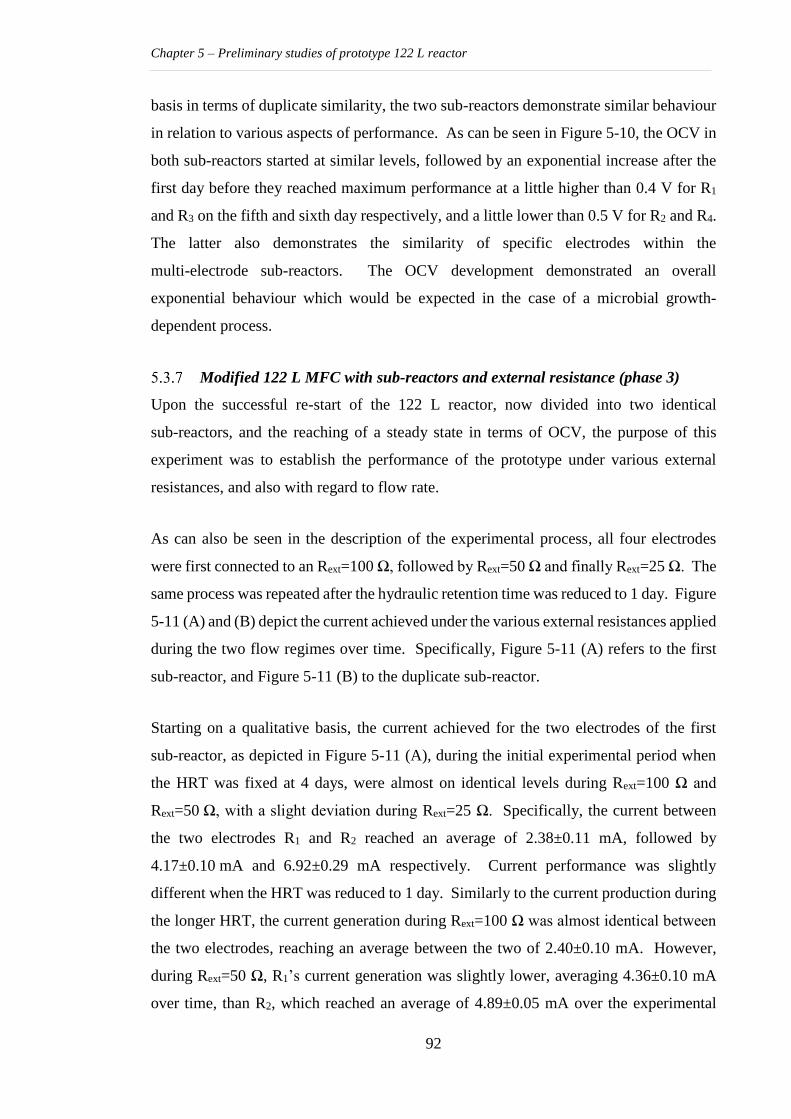
Chapter 5 – Preliminary studies of prototype 122 L reactor
92
basis in terms of duplicate similarity, the two sub-reactors demonstrate similar behaviour
in relation to various aspects of performance. As can be seen in Figure 5-10, the OCV in
both sub-reactors started at similar levels, followed by an exponential increase after the
first day before they reached maximum performance at a little higher than 0.4 V for R1
and R3 on the fifth and sixth day respectively, and a little lower than 0.5 V for R2 and R4.
The latter also demonstrates the similarity of specific electrodes within the
multi-electrode sub-reactors. The OCV development demonstrated an overall
exponential behaviour which would be expected in the case of a microbial growth-
dependent process.
Modified 122 L MFC with sub-reactors and external resistance (phase 3)
Upon the successful re-start of the 122 L reactor, now divided into two identical
sub-reactors, and the reaching of a steady state in terms of OCV, the purpose of this
experiment was to establish the performance of the prototype under various external
resistances, and also with regard to flow rate.
As can also be seen in the description of the experimental process, all four electrodes
were first connected to an Rext=100 Ω, followed by Rext=50 Ω and finally Rext=25 Ω. The
same process was repeated after the hydraulic retention time was reduced to 1 day. Figure
5-11 (A) and (B) depict the current achieved under the various external resistances applied
during the two flow regimes over time. Specifically, Figure 5-11 (A) refers to the first
sub-reactor, and Figure 5-11 (B) to the duplicate sub-reactor.
Starting on a qualitative basis, the current achieved for the two electrodes of the first
sub-reactor, as depicted in Figure 5-11 (A), during the initial experimental period when
the HRT was fixed at 4 days, were almost on identical levels during Rext=100 Ω and
Rext=50 Ω, with a slight deviation during Rext=25 Ω. Specifically, the current between
the two electrodes R1 and R2 reached an average of 2.38±0.11 mA, followed by
4.17±0.10 mA and 6.92±0.29 mA respectively. Current performance was slightly
different when the HRT was reduced to 1 day. Similarly to the current production during
the longer HRT, the current generation during Rext=100 Ω was almost identical between
the two electrodes, reaching an average between the two of 2.40±0.10 mA. However,
during Rext=50 Ω, R1’s current generation was slightly lower, averaging 4.36±0.10 mA
over time, than R2, which reached an average of 4.89±0.05 mA over the experimental
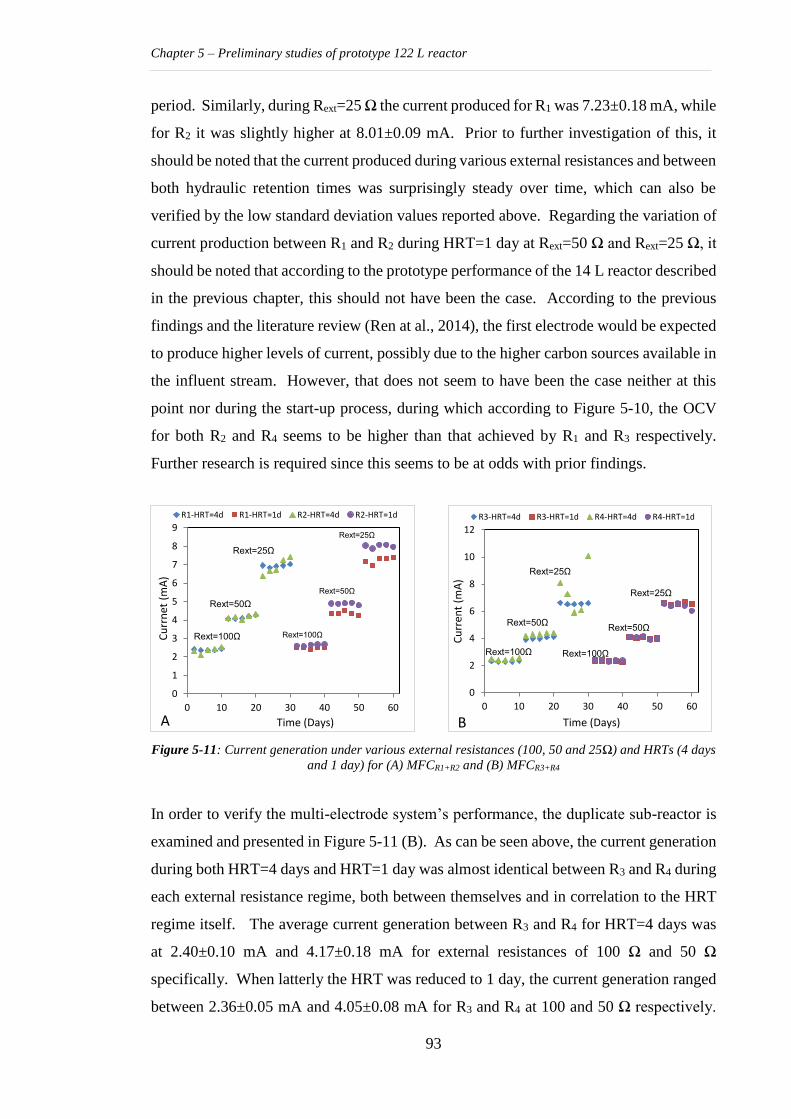
Chapter 5 – Preliminary studies of prototype 122 L reactor
93
period. Similarly, during Rext=25 Ω the current produced for R1 was 7.23±0.18 mA, while
for R2 it was slightly higher at 8.01±0.09 mA. Prior to further investigation of this, it
should be noted that the current produced during various external resistances and between
both hydraulic retention times was surprisingly steady over time, which can also be
verified by the low standard deviation values reported above. Regarding the variation of
current production between R1 and R2 during HRT=1 day at Rext=50 Ω and Rext=25 Ω, it
should be noted that according to the prototype performance of the 14 L reactor described
in the previous chapter, this should not have been the case. According to the previous
findings and the literature review (Ren at al., 2014), the first electrode would be expected
to produce higher levels of current, possibly due to the higher carbon sources available in
the influent stream. However, that does not seem to have been the case neither at this
point nor during the start-up process, during which according to Figure 5-10, the OCV
for both R2 and R4 seems to be higher than that achieved by R1 and R3 respectively.
Further research is required since this seems to be at odds with prior findings.
Figure 5-11: Current generation under various external resistances (100, 50 and 25Ω) and HRTs (4 days
and 1 day) for (A) MFCR1+R2 and (B) MFCR3+R4
In order to verify the multi-electrode system’s performance, the duplicate sub-reactor is
examined and presented in Figure 5-11 (B). As can be seen above, the current generation
during both HRT=4 days and HRT=1 day was almost identical between R3 and R4 during
each external resistance regime, both between themselves and in correlation to the HRT
regime itself. The average current generation between R3 and R4 for HRT=4 days was
at 2.40±0.10 mA and 4.17±0.18 mA for external resistances of 100 Ω and 50 Ω
specifically. When latterly the HRT was reduced to 1 day, the current generation ranged
between 2.36±0.05 mA and 4.05±0.08 mA for R3 and R4 at 100 and 50 Ω respectively.
0
1
2
3
4
5
6
7
8
9
0 10 20 30 40 50 60
Cu
rrn
et (
mA
)
Time (Days)
R1-HRT=4d R1-HRT=1d R2-HRT=4d R2-HRT=1d
Rext=25Ω
Rext=50Ω
Rext=100Ω
Rext=25Ω
Rext=50Ω
Rext=100Ω
0
2
4
6
8
10
12
0 10 20 30 40 50 60
Cu
rren
t (m
A)
Time (Days)
R3-HRT=4d R3-HRT=1d R4-HRT=4d R4-HRT=1d
Rext=25Ω
Rext=25Ω
Rext=50ΩRext=50Ω
Rext=100Ω Rext=100Ω
BA
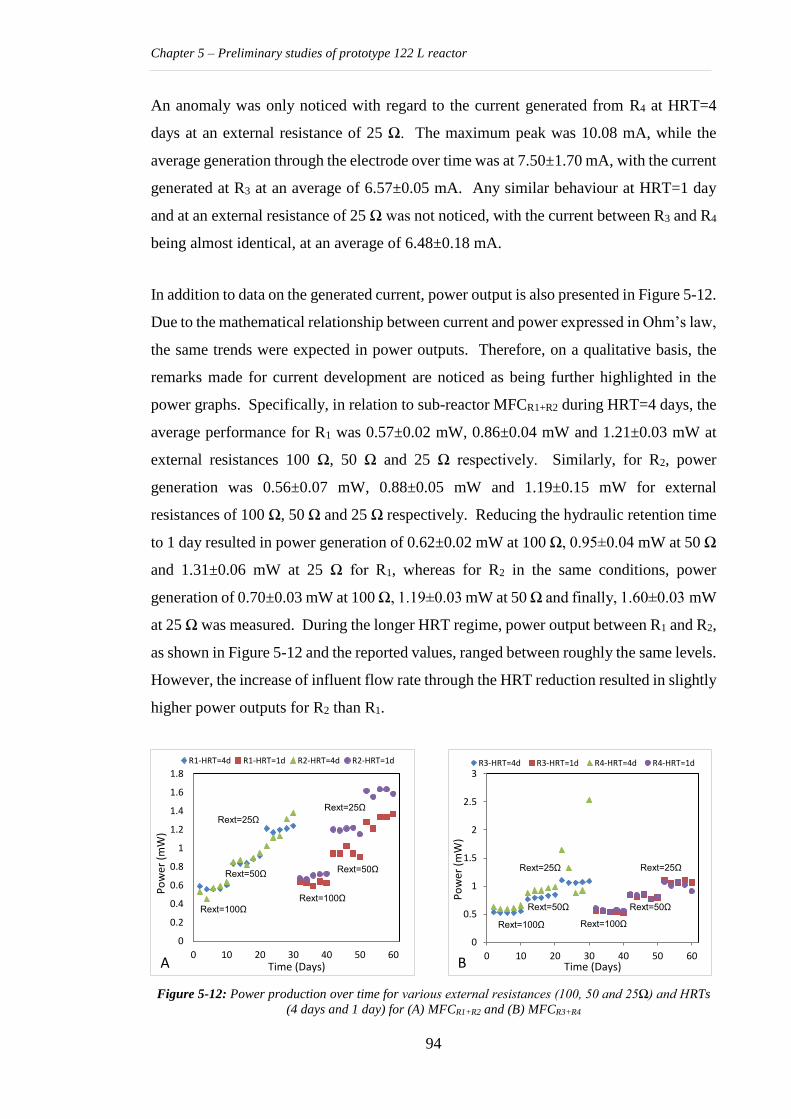
Chapter 5 – Preliminary studies of prototype 122 L reactor
94
An anomaly was only noticed with regard to the current generated from R4 at HRT=4
days at an external resistance of 25 Ω. The maximum peak was 10.08 mA, while the
average generation through the electrode over time was at 7.50±1.70 mA, with the current
generated at R3 at an average of 6.57±0.05 mA. Any similar behaviour at HRT=1 day
and at an external resistance of 25 Ω was not noticed, with the current between R3 and R4
being almost identical, at an average of 6.48±0.18 mA.
In addition to data on the generated current, power output is also presented in Figure 5-12.
Due to the mathematical relationship between current and power expressed in Ohm’s law,
the same trends were expected in power outputs. Therefore, on a qualitative basis, the
remarks made for current development are noticed as being further highlighted in the
power graphs. Specifically, in relation to sub-reactor MFCR1+R2 during HRT=4 days, the
average performance for R1 was 0.57±0.02 mW, 0.86±0.04 mW and 1.21±0.03 mW at
external resistances 100 Ω, 50 Ω and 25 Ω respectively. Similarly, for R2, power
generation was 0.56±0.07 mW, 0.88±0.05 mW and 1.19±0.15 mW for external
resistances of 100 Ω, 50 Ω and 25 Ω respectively. Reducing the hydraulic retention time
to 1 day resulted in power generation of 0.62±0.02 mW at 100 Ω, 0.95±0.04 mW at 50 Ω
and 1.31±0.06 mW at 25 Ω for R1, whereas for R2 in the same conditions, power
generation of 0.70±0.03 mW at 100 Ω, 1.19±0.03 mW at 50 Ω and finally, 1.60±0.03 mW
at 25 Ω was measured. During the longer HRT regime, power output between R1 and R2,
as shown in Figure 5-12 and the reported values, ranged between roughly the same levels.
However, the increase of influent flow rate through the HRT reduction resulted in slightly
higher power outputs for R2 than R1.
Figure 5-12: Power production over time for various external resistances (100, 50 and 25Ω) and HRTs
(4 days and 1 day) for (A) MFCR1+R2 and (B) MFCR3+R4
0
0.2
0.4
0.6
0.8
1
1.2
1.4
1.6
1.8
0 10 20 30 40 50 60
Po
wer
(m
W)
Time (Days)
R1-HRT=4d R1-HRT=1d R2-HRT=4d R2-HRT=1d
Rext=25Ω
Rext=25Ω
Rext=50ΩRext=50Ω
Rext=100Ω
Rext=100Ω
A
0
0.5
1
1.5
2
2.5
3
0 10 20 30 40 50 60
Po
wer
(m
W)
Time (Days)
R3-HRT=4d R3-HRT=1d R4-HRT=4d R4-HRT=1d
Rext=25Ω Rext=25Ω
Rext=50ΩRext=50Ω
Rext=100ΩRext=100Ω
B
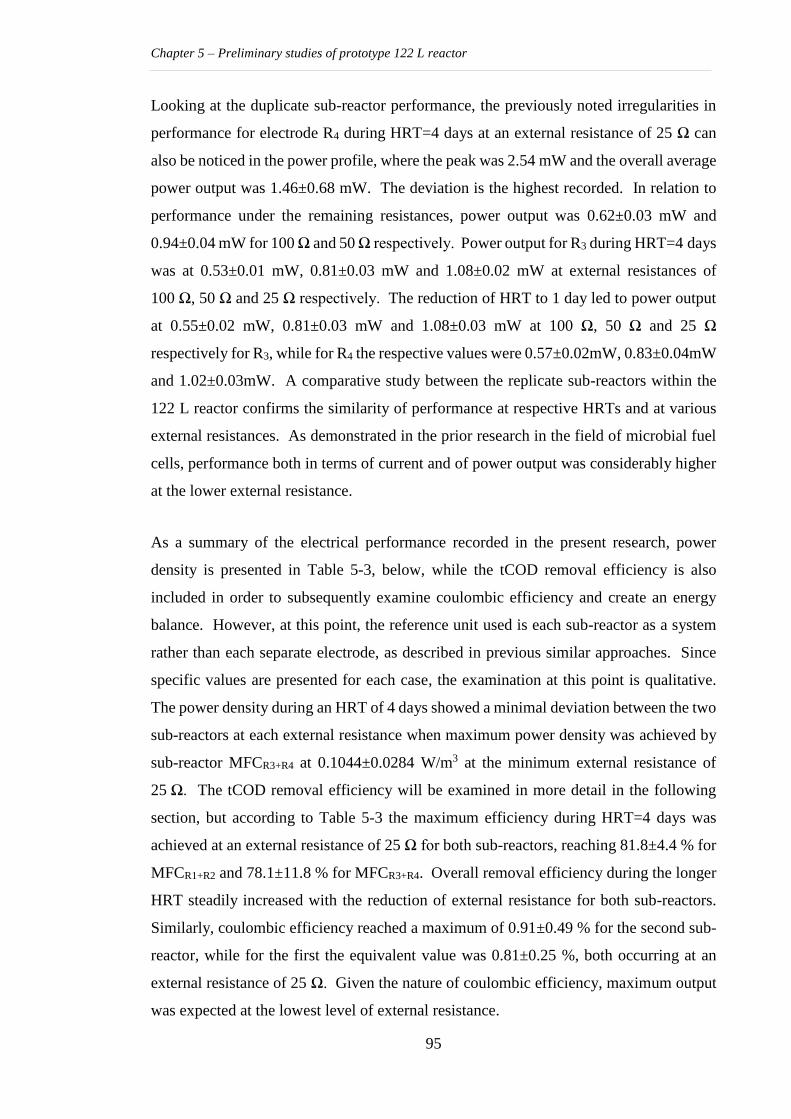
Chapter 5 – Preliminary studies of prototype 122 L reactor
95
Looking at the duplicate sub-reactor performance, the previously noted irregularities in
performance for electrode R4 during HRT=4 days at an external resistance of 25 Ω can
also be noticed in the power profile, where the peak was 2.54 mW and the overall average
power output was 1.46±0.68 mW. The deviation is the highest recorded. In relation to
performance under the remaining resistances, power output was 0.62±0.03 mW and
0.94±0.04 mW for 100 Ω and 50 Ω respectively. Power output for R3 during HRT=4 days
was at 0.53±0.01 mW, 0.81±0.03 mW and 1.08±0.02 mW at external resistances of
100 Ω, 50 Ω and 25 Ω respectively. The reduction of HRT to 1 day led to power output
at 0.55±0.02 mW, 0.81±0.03 mW and 1.08±0.03 mW at 100 Ω, 50 Ω and 25 Ω
respectively for R3, while for R4 the respective values were 0.57±0.02mW, 0.83±0.04mW
and 1.02±0.03mW. A comparative study between the replicate sub-reactors within the
122 L reactor confirms the similarity of performance at respective HRTs and at various
external resistances. As demonstrated in the prior research in the field of microbial fuel
cells, performance both in terms of current and of power output was considerably higher
at the lower external resistance.
As a summary of the electrical performance recorded in the present research, power
density is presented in Table 5-3, below, while the tCOD removal efficiency is also
included in order to subsequently examine coulombic efficiency and create an energy
balance. However, at this point, the reference unit used is each sub-reactor as a system
rather than each separate electrode, as described in previous similar approaches. Since
specific values are presented for each case, the examination at this point is qualitative.
The power density during an HRT of 4 days showed a minimal deviation between the two
sub-reactors at each external resistance when maximum power density was achieved by
sub-reactor MFCR3+R4 at 0.1044±0.0284 W/m3 at the minimum external resistance of
25 Ω. The tCOD removal efficiency will be examined in more detail in the following
section, but according to Table 5-3 the maximum efficiency during HRT=4 days was
achieved at an external resistance of 25 Ω for both sub-reactors, reaching 81.8±4.4 % for
MFCR1+R2 and 78.1±11.8 % for MFCR3+R4. Overall removal efficiency during the longer
HRT steadily increased with the reduction of external resistance for both sub-reactors.
Similarly, coulombic efficiency reached a maximum of 0.91±0.49 % for the second sub-
reactor, while for the first the equivalent value was 0.81±0.25 %, both occurring at an
external resistance of 25 Ω. Given the nature of coulombic efficiency, maximum output
was expected at the lowest level of external resistance.
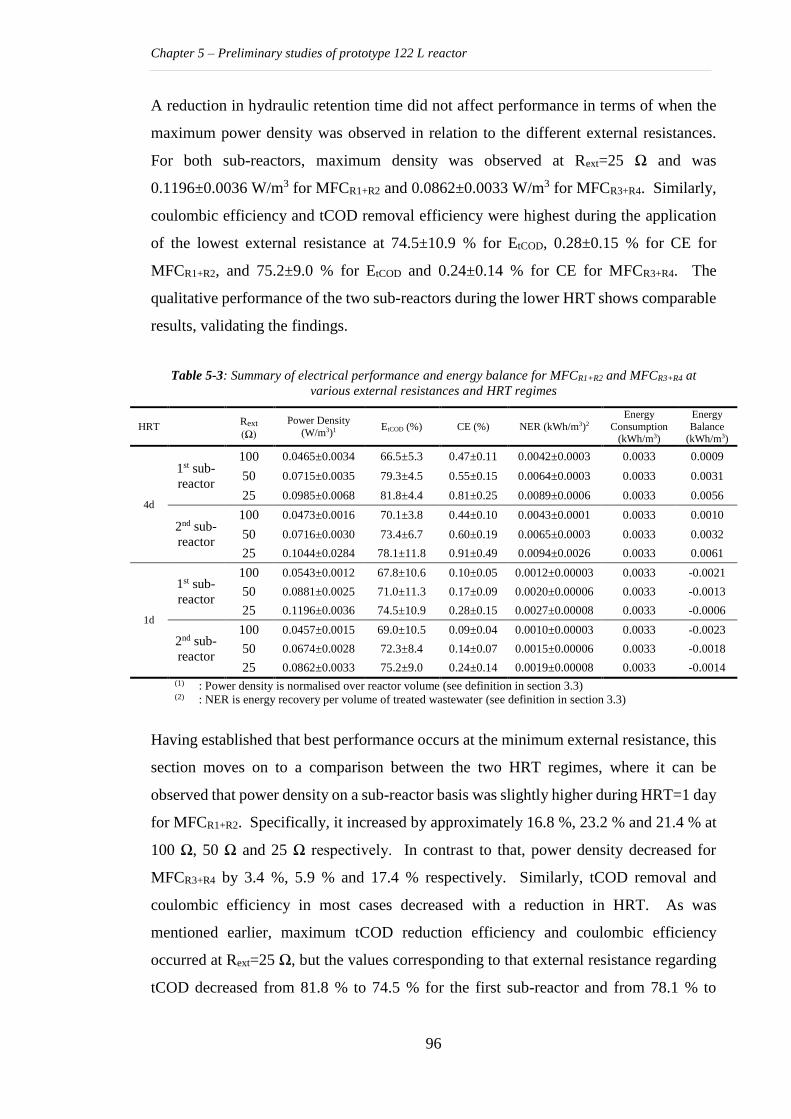
Chapter 5 – Preliminary studies of prototype 122 L reactor
96
A reduction in hydraulic retention time did not affect performance in terms of when the
maximum power density was observed in relation to the different external resistances.
For both sub-reactors, maximum density was observed at Rext=25 Ω and was
0.1196±0.0036 W/m3 for MFCR1+R2 and 0.0862±0.0033 W/m3 for MFCR3+R4. Similarly,
coulombic efficiency and tCOD removal efficiency were highest during the application
of the lowest external resistance at 74.5±10.9 % for EtCOD, 0.28±0.15 % for CE for
MFCR1+R2, and 75.2±9.0 % for EtCOD and 0.24±0.14 % for CE for MFCR3+R4. The
qualitative performance of the two sub-reactors during the lower HRT shows comparable
results, validating the findings.
Table 5-3: Summary of electrical performance and energy balance for MFCR1+R2 and MFCR3+R4 at
various external resistances and HRT regimes
HRT Rext (Ω)
Power Density
(W/m3)1 EtCOD (%) CE (%) NER (kWh/m3)2
Energy
Consumption (kWh/m3)
Energy
Balance (kWh/m3)
4d
1st sub-
reactor
100 0.0465±0.0034 66.5±5.3 0.47±0.11 0.0042±0.0003 0.0033 0.0009
50 0.0715±0.0035 79.3±4.5 0.55±0.15 0.0064±0.0003 0.0033 0.0031
25 0.0985±0.0068 81.8±4.4 0.81±0.25 0.0089±0.0006 0.0033 0.0056
2nd sub-
reactor
100 0.0473±0.0016 70.1±3.8 0.44±0.10 0.0043±0.0001 0.0033 0.0010
50 0.0716±0.0030 73.4±6.7 0.60±0.19 0.0065±0.0003 0.0033 0.0032
25 0.1044±0.0284 78.1±11.8 0.91±0.49 0.0094±0.0026 0.0033 0.0061
1d
1st sub-
reactor
100 0.0543±0.0012 67.8±10.6 0.10±0.05 0.0012±0.00003 0.0033 -0.0021
50 0.0881±0.0025 71.0±11.3 0.17±0.09 0.0020±0.00006 0.0033 -0.0013
25 0.1196±0.0036 74.5±10.9 0.28±0.15 0.0027±0.00008 0.0033 -0.0006
2nd sub-
reactor
100 0.0457±0.0015 69.0±10.5 0.09±0.04 0.0010±0.00003 0.0033 -0.0023
50 0.0674±0.0028 72.3±8.4 0.14±0.07 0.0015±0.00006 0.0033 -0.0018
25 0.0862±0.0033 75.2±9.0 0.24±0.14 0.0019±0.00008 0.0033 -0.0014
(1) : Power density is normalised over reactor volume (see definition in section 3.3) (2) : NER is energy recovery per volume of treated wastewater (see definition in section 3.3)
Having established that best performance occurs at the minimum external resistance, this
section moves on to a comparison between the two HRT regimes, where it can be
observed that power density on a sub-reactor basis was slightly higher during HRT=1 day
for MFCR1+R2. Specifically, it increased by approximately 16.8 %, 23.2 % and 21.4 % at
100 Ω, 50 Ω and 25 Ω respectively. In contrast to that, power density decreased for
MFCR3+R4 by 3.4 %, 5.9 % and 17.4 % respectively. Similarly, tCOD removal and
coulombic efficiency in most cases decreased with a reduction in HRT. As was
mentioned earlier, maximum tCOD reduction efficiency and coulombic efficiency
occurred at Rext=25 Ω, but the values corresponding to that external resistance regarding
tCOD decreased from 81.8 % to 74.5 % for the first sub-reactor and from 78.1 % to
Chapter 5 – Preliminary studies of prototype 122 L reactor
97
75.2 % for the second, and similarly regarding coulombic efficiency decreased from
0.81 % to 0.28 % for the first sub-reactor and from 0.91 % to 0.24 % for the second.
On a first level of examination, the outcome of the comparative study is in favour of the
longer retention time since it resulted in higher values in the majority of cases, especially
for the highest performance achieved at Rext=25 Ω in relation to the three parameters
examined. However, a full consideration not only involves the absolute value but also
the impact of the reduction of HRT from 4 days to 1 day on a qualitative basis. The
reduction in reference allowed for a four times higher volume of influent to be treated
within the reactor. By examining the volume of influent treated and the optimum
performance independently of each other, the achievement of the passing through the
reactor of a higher volume for argument’s sake regardless of the tCOD removal efficiency
and electrical performance is neither sustainable nor the purpose of this experiment.
However, the four times higher volume achieved here was treated at the cost of only
slightly lower treatment efficiency and power density output. Therefore, for the purposes
of a robust industrial system for a possible first level of wastewater treatment, a reduction
of HRT to 1 day should be considered possible, and to have been successful on this
occasion.
Normalised energy recovery was also examined during the various external resistances
and influent flow regimes. Looking back to the definition of NER, it can be seen that it
depends on both power and influent flow rate. Given the earlier findings relating to
power, it is only reasonable that NER increased along similar lines with the reduction of
external resistance. Indeed, maximum NER was achieved at Rext=25 Ω specifically at
0.0089±0.0006 kWh/m3 for MFCR1+R2 and at 0.0094±0.0026 kWh/m3 for MFCR1+R2.
However, since the power output slightly increased in the case of the first sub-reactor and
similarly decreased for the second while the influent flow rate increased four times, it is
only to be expected that the NER dramatically decreased with the reduction of HRT.
Indeed, NER decreased to 0.0027±0.0008 kWh/m3 for the first sub-reactor and at
0.0019±0.0008 kWh/m3 for the second.
Energy consumption, as is the overall case in this study, is solely due to the pumping
system and was calculated as before at 0.0033 kWh/m3. Essentially, it is only dependent
on the hydraulic pressure head, and since that remained unchanged over time, energy
Chapter 5 – Preliminary studies of prototype 122 L reactor
98
consumption therefore remained at the same level even after an increase in the influent
flow rate. A balance was subsequently calculated for each case with regard to the three
different external resistances for the two separate cases of hydraulic retention times, of 1
day and 4 days, and the results are presented in Table 5-3. Maximum recovery was
achieved at an external resistance of 25 Ω for both sub-reactors at HRT=4 days, at
0.0056 kWh/m3 and 0.0061 kWh/m3 respectively. However, as can clearly be noticed,
the reduction in HRT lead to a negative energy balance for both sub-reactors, though with
a most efficient balance created at an external resistance of 25 Ω at -0.0006 kWh/m3 for
MFCR1+R2 and -0.0014 kWh/m3 for MFCR3+R4. Therefore, the balance for the latter
indicates that more energy is put into the system that could possibly be recovered based
on the system’s power production.
Since the rationale of NER is the measurement of the energy recovered in relation to the
volume of the effluent treated in a reactor, the subsequent decrease here shows that
because power output did not considerably increase with an increase in the influent flow
rate, thus lower energy is recovered per volume of treated effluent at the lower HRT.
Therefore, on a decision matrix of optimum performance, decisions would have to be
prioritised according to the above findings, by asking: is it more important to have higher
energy harvested by an MFC, or is it more preferable to maintain a desirable treatment
efficiency while being able to increase the volume of treatment given that industrial scale
wastewater treatment is the scope of this MFC? Which, then, is the point of trade off?
Modified 122 L MFC with sub-reactors and effluent quality (phase 3)
During the previous section, tCOD removal efficiency was examined in relation to
electrical performance and, specifically coulombic efficiency. In this section, tCOD
development is focused upon. The unit used is the sub-reactor as a system, thus Figure
5-13, below, includes the tCOD values of the influent, a comparison between tCOD
effluent values for MFCR1+R2 and MFCR3+R4, and tCOD removal efficiency values
throughout the overall duration of the experiment.
Throughout the current study period under examination, as verified by Figure 5-13, the
level of influent tCOD fluctuated, reaching a minimum value of 1145 mg/l and a
maximum of 3050 mg/l during the higher HRT phase, and 1300 mg/l to 3790 mg/l during
the reduced HRT respectively, while average values were 2071±566 mg/l and
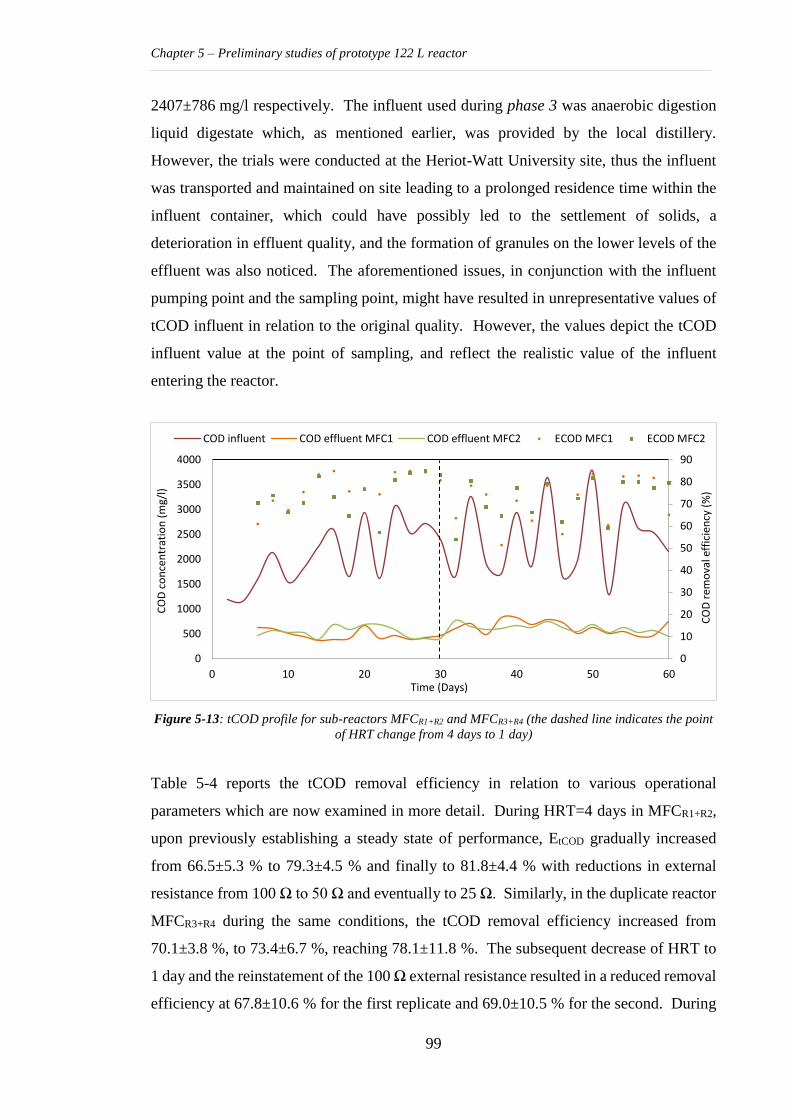
Chapter 5 – Preliminary studies of prototype 122 L reactor
99
2407±786 mg/l respectively. The influent used during phase 3 was anaerobic digestion
liquid digestate which, as mentioned earlier, was provided by the local distillery.
However, the trials were conducted at the Heriot-Watt University site, thus the influent
was transported and maintained on site leading to a prolonged residence time within the
influent container, which could have possibly led to the settlement of solids, a
deterioration in effluent quality, and the formation of granules on the lower levels of the
effluent was also noticed. The aforementioned issues, in conjunction with the influent
pumping point and the sampling point, might have resulted in unrepresentative values of
tCOD influent in relation to the original quality. However, the values depict the tCOD
influent value at the point of sampling, and reflect the realistic value of the influent
entering the reactor.
Figure 5-13: tCOD profile for sub-reactors MFCR1+R2 and MFCR3+R4 (the dashed line indicates the point
of HRT change from 4 days to 1 day)
Table 5-4 reports the tCOD removal efficiency in relation to various operational
parameters which are now examined in more detail. During HRT=4 days in MFCR1+R2,
upon previously establishing a steady state of performance, EtCOD gradually increased
from 66.5±5.3 % to 79.3±4.5 % and finally to 81.8±4.4 % with reductions in external
resistance from 100 Ω to 50 Ω and eventually to 25 Ω. Similarly, in the duplicate reactor
MFCR3+R4 during the same conditions, the tCOD removal efficiency increased from
70.1±3.8 %, to 73.4±6.7 %, reaching 78.1±11.8 %. The subsequent decrease of HRT to
1 day and the reinstatement of the 100 Ω external resistance resulted in a reduced removal
efficiency at 67.8±10.6 % for the first replicate and 69.0±10.5 % for the second. During
0
10
20
30
40
50
60
70
80
90
0
500
1000
1500
2000
2500
3000
3500
4000
0 10 20 30 40 50 60
CO
D r
emo
val e
ffic
ien
cy (
%)
CO
D c
on
cen
trat
ion
(m
g/l)
Time (Days)
COD influent COD effluent MFC1 COD effluent MFC2 ECOD MFC1 ECOD MFC2
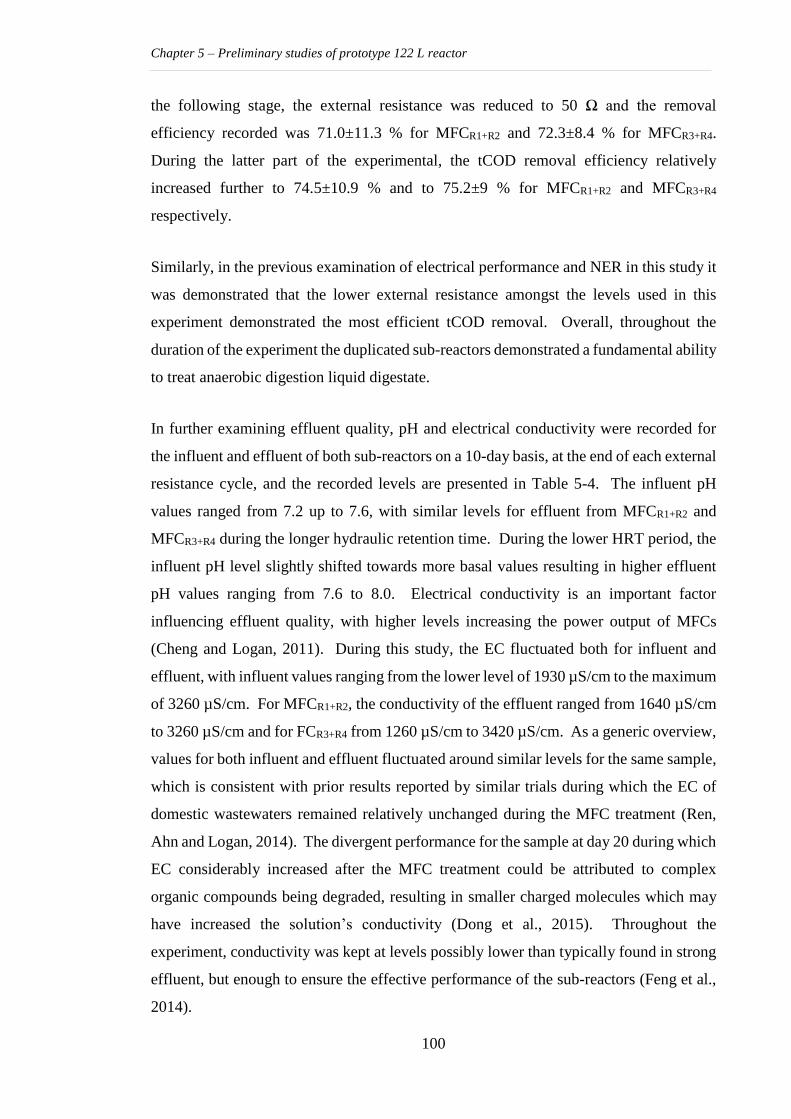
Chapter 5 – Preliminary studies of prototype 122 L reactor
100
the following stage, the external resistance was reduced to 50 Ω and the removal
efficiency recorded was 71.0±11.3 % for MFCR1+R2 and 72.3±8.4 % for MFCR3+R4.
During the latter part of the experimental, the tCOD removal efficiency relatively
increased further to 74.5±10.9 % and to 75.2±9 % for MFCR1+R2 and MFCR3+R4
respectively.
Similarly, in the previous examination of electrical performance and NER in this study it
was demonstrated that the lower external resistance amongst the levels used in this
experiment demonstrated the most efficient tCOD removal. Overall, throughout the
duration of the experiment the duplicated sub-reactors demonstrated a fundamental ability
to treat anaerobic digestion liquid digestate.
In further examining effluent quality, pH and electrical conductivity were recorded for
the influent and effluent of both sub-reactors on a 10-day basis, at the end of each external
resistance cycle, and the recorded levels are presented in Table 5-4. The influent pH
values ranged from 7.2 up to 7.6, with similar levels for effluent from MFCR1+R2 and
MFCR3+R4 during the longer hydraulic retention time. During the lower HRT period, the
influent pH level slightly shifted towards more basal values resulting in higher effluent
pH values ranging from 7.6 to 8.0. Electrical conductivity is an important factor
influencing effluent quality, with higher levels increasing the power output of MFCs
(Cheng and Logan, 2011). During this study, the EC fluctuated both for influent and
effluent, with influent values ranging from the lower level of 1930 µS/cm to the maximum
of 3260 µS/cm. For MFCR1+R2, the conductivity of the effluent ranged from 1640 µS/cm
to 3260 µS/cm and for FCR3+R4 from 1260 µS/cm to 3420 µS/cm. As a generic overview,
values for both influent and effluent fluctuated around similar levels for the same sample,
which is consistent with prior results reported by similar trials during which the EC of
domestic wastewaters remained relatively unchanged during the MFC treatment (Ren,
Ahn and Logan, 2014). The divergent performance for the sample at day 20 during which
EC considerably increased after the MFC treatment could be attributed to complex
organic compounds being degraded, resulting in smaller charged molecules which may
have increased the solution’s conductivity (Dong et al., 2015). Throughout the
experiment, conductivity was kept at levels possibly lower than typically found in strong
effluent, but enough to ensure the effective performance of the sub-reactors (Feng et al.,
2014).
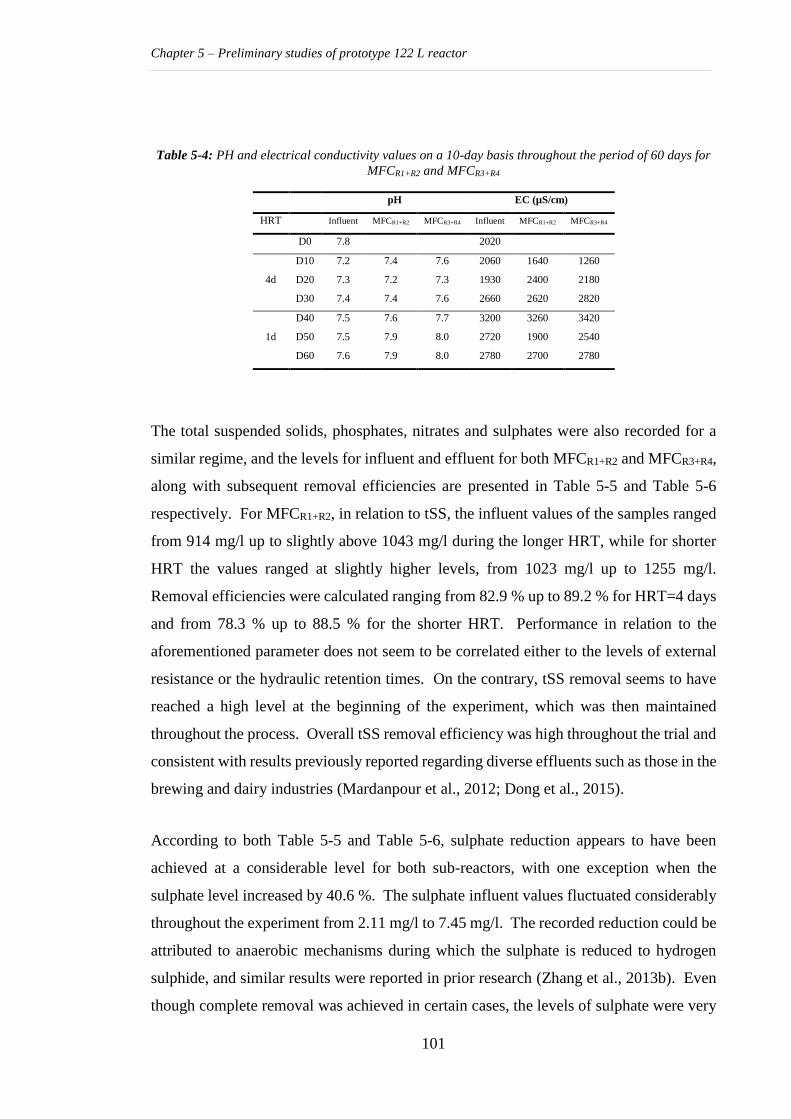
Chapter 5 – Preliminary studies of prototype 122 L reactor
101
Table 5-4: PH and electrical conductivity values on a 10-day basis throughout the period of 60 days for
MFCR1+R2 and MFCR3+R4
pH EC (µS/cm)
HRT Influent MFCR1+R2 MFCR3+R4 Influent MFCR1+R2 MFCR3+R4
D0 7.8 2020
4d
D10 7.2 7.4 7.6 2060 1640 1260
D20 7.3 7.2 7.3 1930 2400 2180
D30 7.4 7.4 7.6 2660 2620 2820
1d
D40 7.5 7.6 7.7 3200 3260 3420
D50 7.5 7.9 8.0 2720 1900 2540
D60 7.6 7.9 8.0 2780 2700 2780
The total suspended solids, phosphates, nitrates and sulphates were also recorded for a
similar regime, and the levels for influent and effluent for both MFCR1+R2 and MFCR3+R4,
along with subsequent removal efficiencies are presented in Table 5-5 and Table 5-6
respectively. For MFCR1+R2, in relation to tSS, the influent values of the samples ranged
from 914 mg/l up to slightly above 1043 mg/l during the longer HRT, while for shorter
HRT the values ranged at slightly higher levels, from 1023 mg/l up to 1255 mg/l.
Removal efficiencies were calculated ranging from 82.9 % up to 89.2 % for HRT=4 days
and from 78.3 % up to 88.5 % for the shorter HRT. Performance in relation to the
aforementioned parameter does not seem to be correlated either to the levels of external
resistance or the hydraulic retention times. On the contrary, tSS removal seems to have
reached a high level at the beginning of the experiment, which was then maintained
throughout the process. Overall tSS removal efficiency was high throughout the trial and
consistent with results previously reported regarding diverse effluents such as those in the
brewing and dairy industries (Mardanpour et al., 2012; Dong et al., 2015).
According to both Table 5-5 and Table 5-6, sulphate reduction appears to have been
achieved at a considerable level for both sub-reactors, with one exception when the
sulphate level increased by 40.6 %. The sulphate influent values fluctuated considerably
throughout the experiment from 2.11 mg/l to 7.45 mg/l. The recorded reduction could be
attributed to anaerobic mechanisms during which the sulphate is reduced to hydrogen
sulphide, and similar results were reported in prior research (Zhang et al., 2013b). Even
though complete removal was achieved in certain cases, the levels of sulphate were very
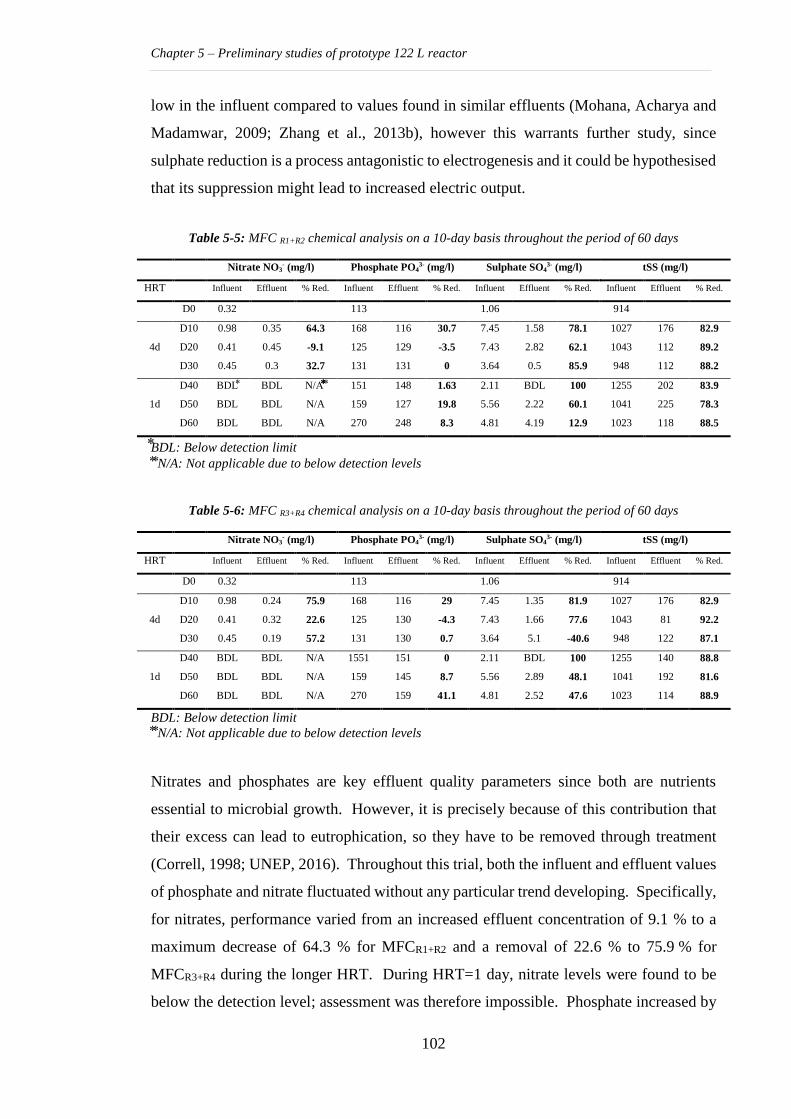
Chapter 5 – Preliminary studies of prototype 122 L reactor
102
low in the influent compared to values found in similar effluents (Mohana, Acharya and
Madamwar, 2009; Zhang et al., 2013b), however this warrants further study, since
sulphate reduction is a process antagonistic to electrogenesis and it could be hypothesised
that its suppression might lead to increased electric output.
Table 5-5: MFC R1+R2 chemical analysis on a 10-day basis throughout the period of 60 days
Nitrate NO3- (mg/l) Phosphate PO4
3- (mg/l) Sulphate SO43- (mg/l) tSS (mg/l)
HRT Influent Effluent % Red. Influent Effluent % Red. Influent Effluent % Red. Influent Effluent % Red.
D0 0.32 113 1.06 914
4d
D10 0.98 0.35 64.3 168 116 30.7 7.45 1.58 78.1 1027 176 82.9
D20 0.41 0.45 -9.1 125 129 -3.5 7.43 2.82 62.1 1043 112 89.2
D30 0.45 0.3 32.7 131 131 0 3.64 0.5 85.9 948 112 88.2
1d
D40 BDL BDL N/A 151 148 1.63 2.11 BDL 100 1255 202 83.9
D50 BDL BDL N/A 159 127 19.8 5.56 2.22 60.1 1041 225 78.3
D60 BDL BDL N/A 270 248 8.3 4.81 4.19 12.9 1023 118 88.5
BDL: Below detection limit
N/A: Not applicable due to below detection levels
Table 5-6: MFC R3+R4 chemical analysis on a 10-day basis throughout the period of 60 days
Nitrate NO3- (mg/l) Phosphate PO4
3- (mg/l) Sulphate SO43- (mg/l) tSS (mg/l)
HRT Influent Effluent % Red. Influent Effluent % Red. Influent Effluent % Red. Influent Effluent % Red.
D0 0.32 113 1.06 914
4d
D10 0.98 0.24 75.9 168 116 29 7.45 1.35 81.9 1027 176 82.9
D20 0.41 0.32 22.6 125 130 -4.3 7.43 1.66 77.6 1043 81 92.2
D30 0.45 0.19 57.2 131 130 0.7 3.64 5.1 -40.6 948 122 87.1
1d
D40 BDL BDL N/A 1551 151 0 2.11 BDL 100 1255 140 88.8
D50 BDL BDL N/A 159 145 8.7 5.56 2.89 48.1 1041 192 81.6
D60 BDL BDL N/A 270 159 41.1 4.81 2.52 47.6 1023 114 88.9
BDL: Below detection limit
N/A: Not applicable due to below detection levels
Nitrates and phosphates are key effluent quality parameters since both are nutrients
essential to microbial growth. However, it is precisely because of this contribution that
their excess can lead to eutrophication, so they have to be removed through treatment
(Correll, 1998; UNEP, 2016). Throughout this trial, both the influent and effluent values
of phosphate and nitrate fluctuated without any particular trend developing. Specifically,
for nitrates, performance varied from an increased effluent concentration of 9.1 % to a
maximum decrease of 64.3 % for MFCR1+R2 and a removal of 22.6 % to 75.9 % for
MFCR3+R4 during the longer HRT. During HRT=1 day, nitrate levels were found to be
below the detection level; assessment was therefore impossible. Phosphate increased by
Chapter 5 – Preliminary studies of prototype 122 L reactor
103
a maximum of 3.5 % for MFCR1+R2 while the maximum removal reached 30.7 %.
Similarly, in MFCR3+R4, in one instance phosphate increased during the MFC treatment
by 4.3 % while the reduction in concentration reached a maximum of 41.1 %. The
outcome of this analysis is therefore inconclusive. The behaviour of nitrates and
phosphates due to treatment with an MFC should be examined in more depth and possibly
with a sampling regime in order to identify more specific trends. A suggestion could be
made to look at total nitrogen and total phosphorus instead, especially since the ratios
between the aforementioned and carbon considerably affect microbial growth and the
treatment of effluents, as previously recorded in relevant prior research (Ammary, 2004).
5.4 Chapter conclusions
In this chapter, a pilot scale 122 L reactor was deployed in Heriot-Watt University
operating on diluted spent wash, the main whisky distillation process liquid residue. A
successful reduced start-up period was achieved and the pilot was demonstrated to be
capable of sustainably treating the wastewater stream as a stand-alone technology, while
maintaining a positive energy balance. Temperature was a main focus of the chapter, and
the correlation between that and start-up and performance during constant discharge was
examined. As a result, the reactor was proven to achieve treatment in the ambient Scottish
environment.
The chapter went on to establish a refurbishment protocol which was further successfully
implemented for the re-deployment of the reactor on anaerobic liquid digestate. The
initial results demonstrated a successful re-start, and the further optimisation of
performance was examined in relation to external resistance. The conclusion of this
chapter demonstrated the potential of the reactor to be similarly used as a complementary
technology to anaerobic digestion, setting the ground for the next chapter which follows
a pilot plant integrated in the existing processes in a local distillery.
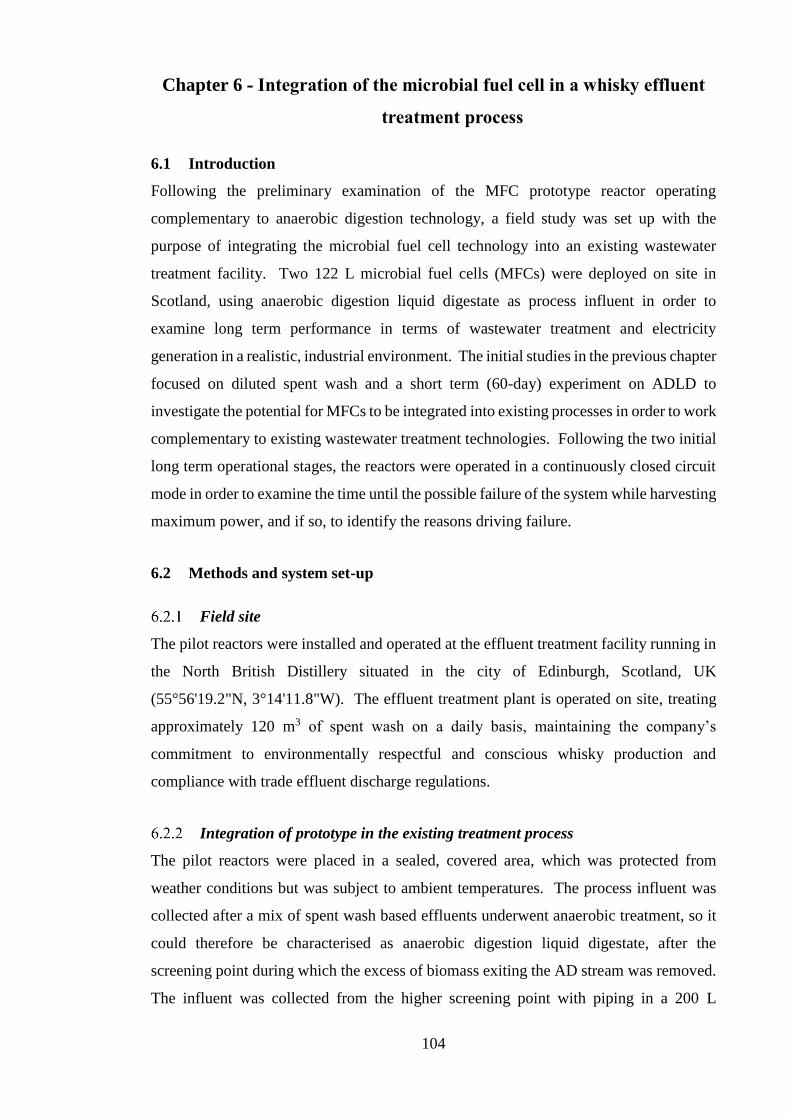
104
Chapter 6 - Integration of the microbial fuel cell in a whisky effluent
treatment process
6.1 Introduction
Following the preliminary examination of the MFC prototype reactor operating
complementary to anaerobic digestion technology, a field study was set up with the
purpose of integrating the microbial fuel cell technology into an existing wastewater
treatment facility. Two 122 L microbial fuel cells (MFCs) were deployed on site in
Scotland, using anaerobic digestion liquid digestate as process influent in order to
examine long term performance in terms of wastewater treatment and electricity
generation in a realistic, industrial environment. The initial studies in the previous chapter
focused on diluted spent wash and a short term (60-day) experiment on ADLD to
investigate the potential for MFCs to be integrated into existing processes in order to work
complementary to existing wastewater treatment technologies. Following the two initial
long term operational stages, the reactors were operated in a continuously closed circuit
mode in order to examine the time until the possible failure of the system while harvesting
maximum power, and if so, to identify the reasons driving failure.
6.2 Methods and system set-up
Field site
The pilot reactors were installed and operated at the effluent treatment facility running in
the North British Distillery situated in the city of Edinburgh, Scotland, UK
(55°56'19.2"N, 3°14'11.8"W). The effluent treatment plant is operated on site, treating
approximately 120 m3 of spent wash on a daily basis, maintaining the company’s
commitment to environmentally respectful and conscious whisky production and
compliance with trade effluent discharge regulations.
Integration of prototype in the existing treatment process
The pilot reactors were placed in a sealed, covered area, which was protected from
weather conditions but was subject to ambient temperatures. The process influent was
collected after a mix of spent wash based effluents underwent anaerobic treatment, so it
could therefore be characterised as anaerobic digestion liquid digestate, after the
screening point during which the excess of biomass exiting the AD stream was removed.
The influent was collected from the higher screening point with piping in a 200 L
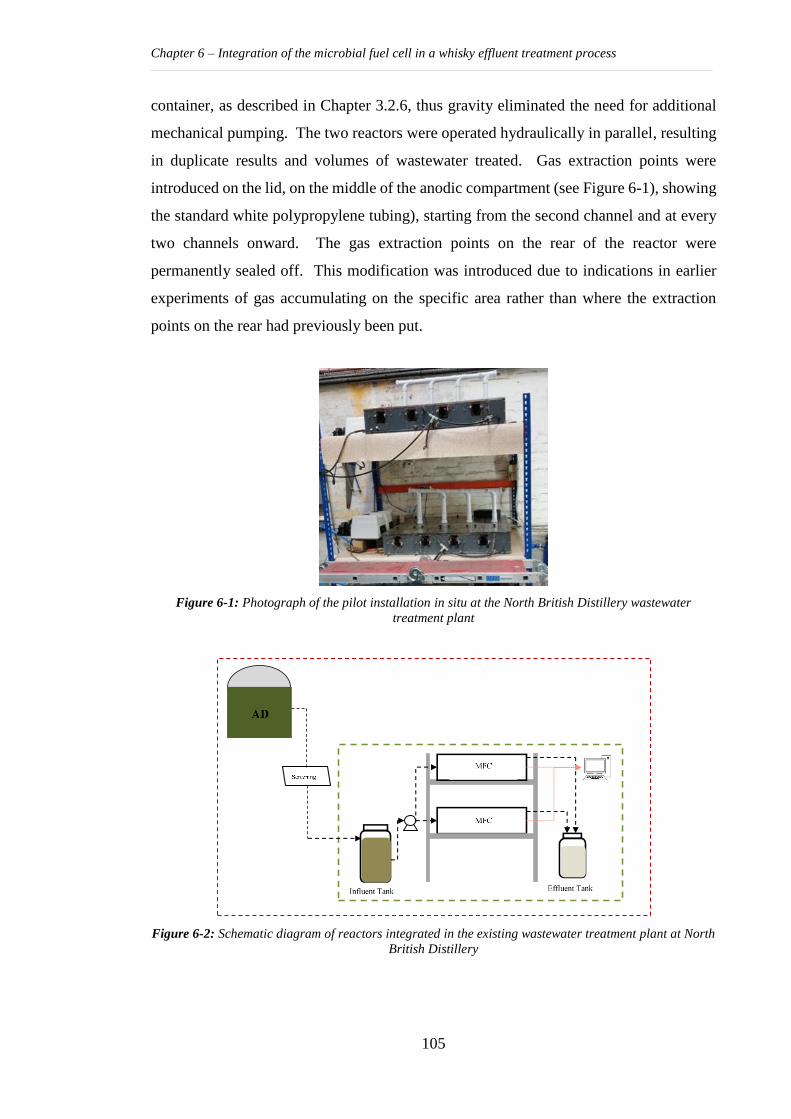
Chapter 6 – Integration of the microbial fuel cell in a whisky effluent treatment process
105
container, as described in Chapter 3.2.6, thus gravity eliminated the need for additional
mechanical pumping. The two reactors were operated hydraulically in parallel, resulting
in duplicate results and volumes of wastewater treated. Gas extraction points were
introduced on the lid, on the middle of the anodic compartment (see Figure 6-1), showing
the standard white polypropylene tubing), starting from the second channel and at every
two channels onward. The gas extraction points on the rear of the reactor were
permanently sealed off. This modification was introduced due to indications in earlier
experiments of gas accumulating on the specific area rather than where the extraction
points on the rear had previously been put.
Figure 6-1: Photograph of the pilot installation in situ at the North British Distillery wastewater
treatment plant
Figure 6-2: Schematic diagram of reactors integrated in the existing wastewater treatment plant at North
British Distillery

Chapter 6 – Integration of the microbial fuel cell in a whisky effluent treatment process
106
Reactor configuration
Concerning the set-up of the reactor, the internal effluent circulation, and the electrode
connections, each one of the duplicate reactors was operated in the same way as adopted
during the latter part of the previous experimental period. Each MFC reactor was
internally divided into two sub-reactors with separate influent feeds in serpentine internal
circulation, each with two independent electrode pairs, thus characterised as a
multi-electrode MFC. Each electrode pair consisted of two anodes and two cathodes
connected in parallel between themselves as described in Figure 3-8 (B).
The reactors and sub-reactors will be referred to as follows. The two 122 L reactors are
referred to as MFCR1-R4, consisting of two sub-reactors, MFCR1+R2 and MFCR3+R4, and
MFCR5-R8, consisting of two sub-reactors MFCR5+R6 and MFCR7+R8. Therefore, all four
sub-reactors can be regarded as identical.
Operational conditions
During phase 1 and phase 2, the reactors were electrically operated on a two-day
transition cycle from open to closed circuit. During phase 1 (with a duration of 4 months),
the organic load rate was fixed at 0.6 kg tCOD/(m3d) (according to the average values
during overall operation), resulting in a hydraulic retention time of 4 days. During phase
2 (with a duration of 3 months), the organic load rate increased to 2.4 kg tCOD/(m3d),
resulting in a hydraulic retention time of 1 day. Throughout these two phases, Rext for
each coupled electrode pair was fixed and regularly reviewed at 500 Ω.
Following these two phases, during phase 3, a further reduction in hydraulic retention
time through an increased organic load rate was unsuccessfully attempted. This was not
successful due to mechanical failures, and therefore, HRT was maintained at 1 day.
However, the difference represented by phase 3 lay in the operation of the reactor in terms
of monitoring of electrical performance. As described in Chapter 3.3, all four electrode
pairs, thus eight in total in the duplicated reactors, were operated on a continuously closed
circuit mode under various external resistances, while connected to a data acquisition
system recording with at hourly time intervals. For the latter part of phase 3 the coupled
electrode pairs were operated at Rext=22 Ω as according to the polarisation curves, this
was the resistance at which maximum power was observed at the majority of electrodes.
As was described in the literature review conducted continuously since the beginning of
Chapter 6 – Integration of the microbial fuel cell in a whisky effluent treatment process
107
the project, the field of microbial fuel cells is rapidly developing in several directions,
reflecting its nature as a multidisciplinary field. Research on a basic laboratory scale is
undoubtedly necessary, but industrial pilot scale trials and long term studies will also shed
more light in the field. The purpose of the final experimental phase 3 in the current study
was to further study the performance of the reactor, now successfully integrated into the
existing treatment process, while at the same time examining a different anode material.
Its performance until relative failure, or more precisely, its performance development
throughout time in an integrated wastewater treatment system is examined both through
power curves and continuous discharge.
6.3 Results and discussion
Integration into the existing process and initial operation (phases 1 and 2)
Upon inoculation, the start-up period of the reactors was initiated during which the MFCs
were operated in open circuit until they reached a steady maximum potential. Following
the establishment of microbial operation and as described earlier, each electrode pair was
operated in a 24-hour open to 24-hour closed circuit mode. The open circuit voltage
output throughout phase 1 and phase 2 of the experimental process was used as a control
of the process, and is presented as follows in Figure 6-3, below, for MFCR1-R4, for both
sub-reactors MFCR1+R2 and MFCR3+R4 and in Figure 6-5 for MFCR5-R8, similarly for both
sub-reactors MFCR5+R6 and MFCR7+R8.
With regard to the first 122 L reactor, it can be seen that the OCV started at 0.054 V for
R1 and at 0.032 V for R2, while for the second sub-reactor it began at 0.092 V for R3 and
0.074 V for R4 upon inoculation. The OCV sharply increased within the first four days
when a maximum point was reached at 0.374 V, 0.430 V, 0.406 V and 0.403 V for R1,
R2, R3 and R4 respectively. This period is thus acknowledged as a successful start-up and
the introduction to phase 1, during which HRT was set at 4 days and closed circuit mode
was implemented. The OCV went through a period of slight decrease until approximately
the 22nd day, after which it stabilised at averages of 0.299±0.009 V and 0.349±0.018 V
for R1 and R2 of the MFCR1+R2 sub-reactor, and 0.300±0.012 V and 0.318±0.013 V for R3
and R4 of MFCR3+R4.
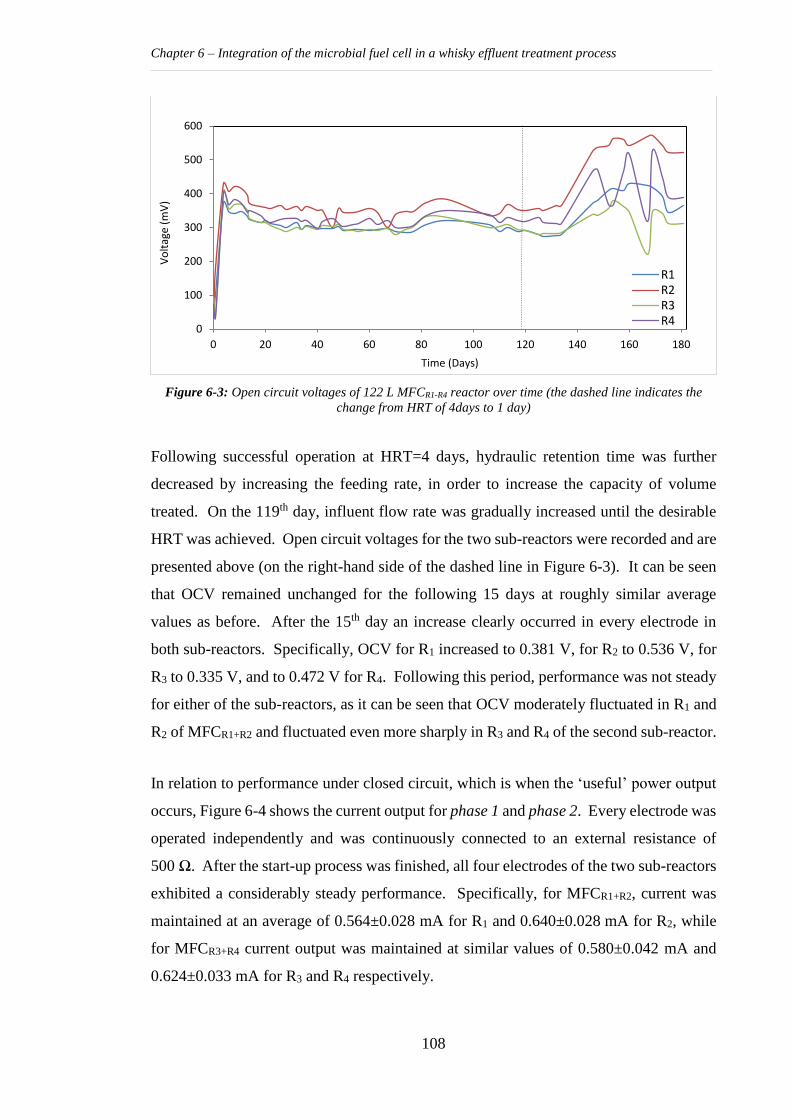
Chapter 6 – Integration of the microbial fuel cell in a whisky effluent treatment process
108
Figure 6-3: Open circuit voltages of 122 L MFCR1-R4 reactor over time (the dashed line indicates the
change from HRT of 4days to 1 day)
Following successful operation at HRT=4 days, hydraulic retention time was further
decreased by increasing the feeding rate, in order to increase the capacity of volume
treated. On the 119th day, influent flow rate was gradually increased until the desirable
HRT was achieved. Open circuit voltages for the two sub-reactors were recorded and are
presented above (on the right-hand side of the dashed line in Figure 6-3). It can be seen
that OCV remained unchanged for the following 15 days at roughly similar average
values as before. After the 15th day an increase clearly occurred in every electrode in
both sub-reactors. Specifically, OCV for R1 increased to 0.381 V, for R2 to 0.536 V, for
R3 to 0.335 V, and to 0.472 V for R4. Following this period, performance was not steady
for either of the sub-reactors, as it can be seen that OCV moderately fluctuated in R1 and
R2 of MFCR1+R2 and fluctuated even more sharply in R3 and R4 of the second sub-reactor.
In relation to performance under closed circuit, which is when the ‘useful’ power output
occurs, Figure 6-4 shows the current output for phase 1 and phase 2. Every electrode was
operated independently and was continuously connected to an external resistance of
500 Ω. After the start-up process was finished, all four electrodes of the two sub-reactors
exhibited a considerably steady performance. Specifically, for MFCR1+R2, current was
maintained at an average of 0.564±0.028 mA for R1 and 0.640±0.028 mA for R2, while
for MFCR3+R4 current output was maintained at similar values of 0.580±0.042 mA and
0.624±0.033 mA for R3 and R4 respectively.
0
100
200
300
400
500
600
0 20 40 60 80 100 120 140 160 180
Vo
ltag
e (m
V)
Time (Days)
R1R2R3R4
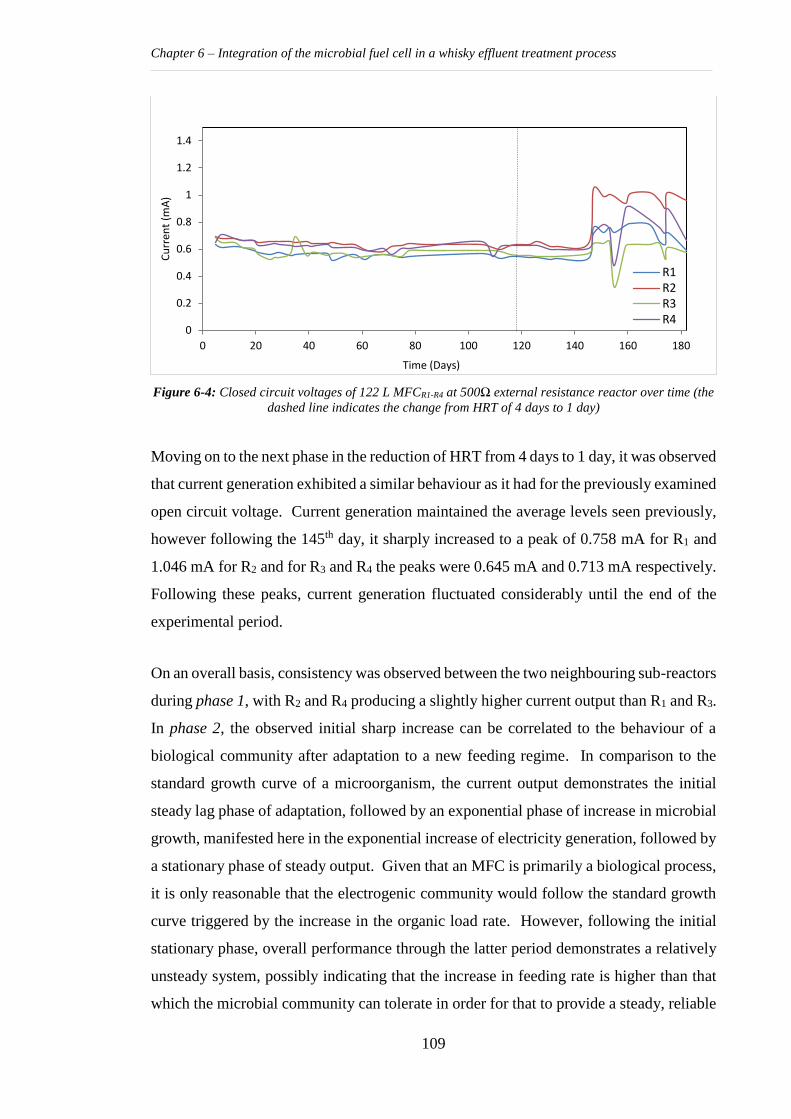
Chapter 6 – Integration of the microbial fuel cell in a whisky effluent treatment process
109
Figure 6-4: Closed circuit voltages of 122 L MFCR1-R4 at 500Ω external resistance reactor over time (the
dashed line indicates the change from HRT of 4 days to 1 day)
Moving on to the next phase in the reduction of HRT from 4 days to 1 day, it was observed
that current generation exhibited a similar behaviour as it had for the previously examined
open circuit voltage. Current generation maintained the average levels seen previously,
however following the 145th day, it sharply increased to a peak of 0.758 mA for R1 and
1.046 mA for R2 and for R3 and R4 the peaks were 0.645 mA and 0.713 mA respectively.
Following these peaks, current generation fluctuated considerably until the end of the
experimental period.
On an overall basis, consistency was observed between the two neighbouring sub-reactors
during phase 1, with R2 and R4 producing a slightly higher current output than R1 and R3.
In phase 2, the observed initial sharp increase can be correlated to the behaviour of a
biological community after adaptation to a new feeding regime. In comparison to the
standard growth curve of a microorganism, the current output demonstrates the initial
steady lag phase of adaptation, followed by an exponential phase of increase in microbial
growth, manifested here in the exponential increase of electricity generation, followed by
a stationary phase of steady output. Given that an MFC is primarily a biological process,
it is only reasonable that the electrogenic community would follow the standard growth
curve triggered by the increase in the organic load rate. However, following the initial
stationary phase, overall performance through the latter period demonstrates a relatively
unsteady system, possibly indicating that the increase in feeding rate is higher than that
which the microbial community can tolerate in order for that to provide a steady, reliable
0
0.2
0.4
0.6
0.8
1
1.2
1.4
0 20 40 60 80 100 120 140 160 180
Cu
rren
t (m
A)
Time (Days)
R1R2R3R4
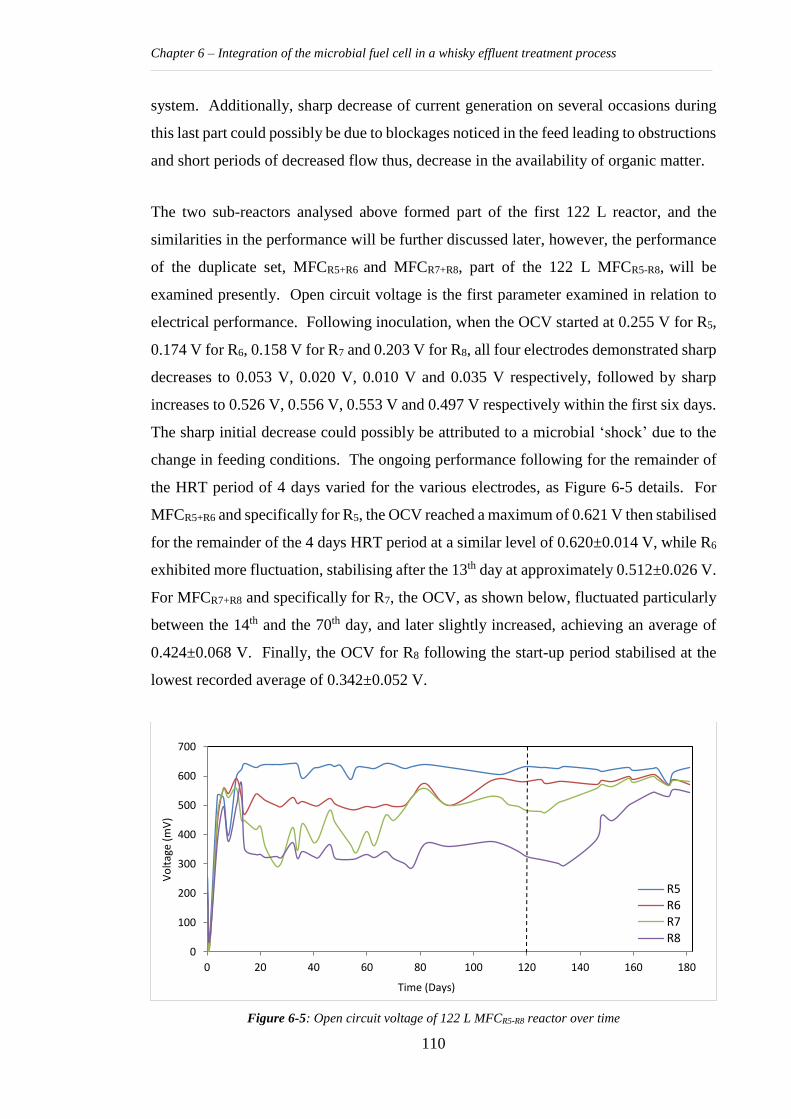
Chapter 6 – Integration of the microbial fuel cell in a whisky effluent treatment process
110
system. Additionally, sharp decrease of current generation on several occasions during
this last part could possibly be due to blockages noticed in the feed leading to obstructions
and short periods of decreased flow thus, decrease in the availability of organic matter.
The two sub-reactors analysed above formed part of the first 122 L reactor, and the
similarities in the performance will be further discussed later, however, the performance
of the duplicate set, MFCR5+R6 and MFCR7+R8, part of the 122 L MFCR5-R8, will be
examined presently. Open circuit voltage is the first parameter examined in relation to
electrical performance. Following inoculation, when the OCV started at 0.255 V for R5,
0.174 V for R6, 0.158 V for R7 and 0.203 V for R8, all four electrodes demonstrated sharp
decreases to 0.053 V, 0.020 V, 0.010 V and 0.035 V respectively, followed by sharp
increases to 0.526 V, 0.556 V, 0.553 V and 0.497 V respectively within the first six days.
The sharp initial decrease could possibly be attributed to a microbial ‘shock’ due to the
change in feeding conditions. The ongoing performance following for the remainder of
the HRT period of 4 days varied for the various electrodes, as Figure 6-5 details. For
MFCR5+R6 and specifically for R5, the OCV reached a maximum of 0.621 V then stabilised
for the remainder of the 4 days HRT period at a similar level of 0.620±0.014 V, while R6
exhibited more fluctuation, stabilising after the 13th day at approximately 0.512±0.026 V.
For MFCR7+R8 and specifically for R7, the OCV, as shown below, fluctuated particularly
between the 14th and the 70th day, and later slightly increased, achieving an average of
0.424±0.068 V. Finally, the OCV for R8 following the start-up period stabilised at the
lowest recorded average of 0.342±0.052 V.
Figure 6-5: Open circuit voltage of 122 L MFCR5-R8 reactor over time
0
100
200
300
400
500
600
700
0 20 40 60 80 100 120 140 160 180
Vo
ltag
e (m
V)
Time (Days)
R5R6R7R8
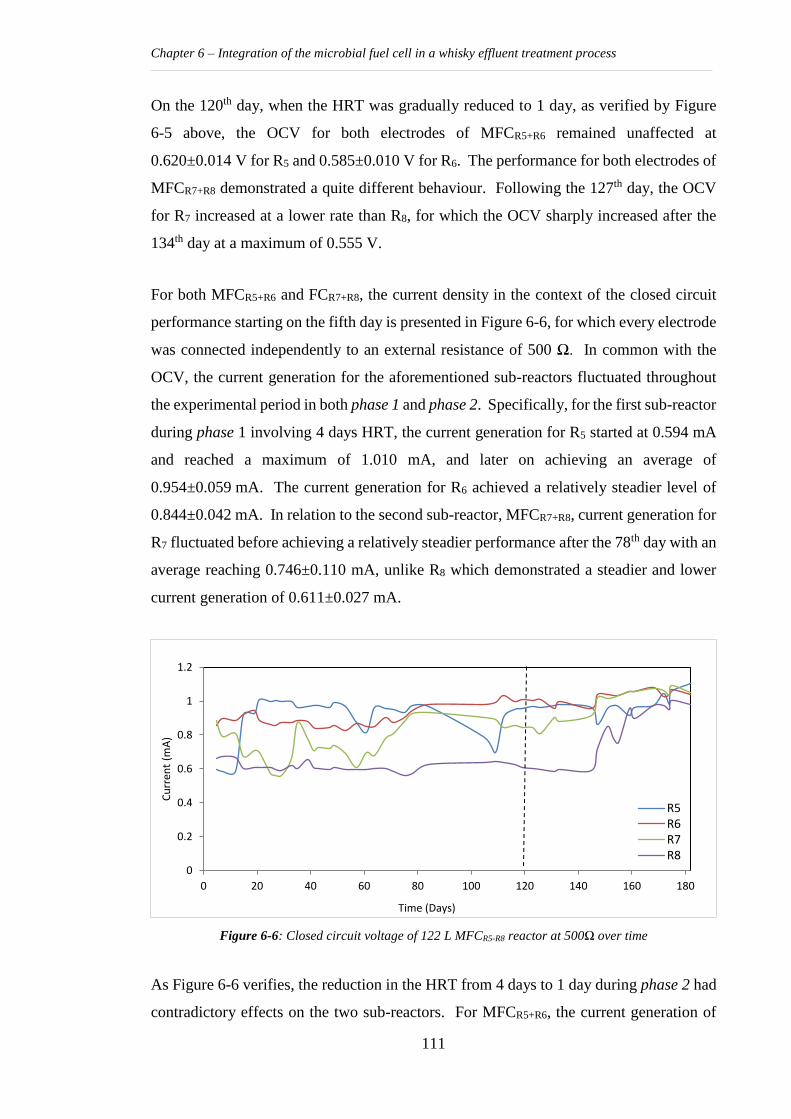
Chapter 6 – Integration of the microbial fuel cell in a whisky effluent treatment process
111
On the 120th day, when the HRT was gradually reduced to 1 day, as verified by Figure
6-5 above, the OCV for both electrodes of MFCR5+R6 remained unaffected at
0.620±0.014 V for R5 and 0.585±0.010 V for R6. The performance for both electrodes of
MFCR7+R8 demonstrated a quite different behaviour. Following the 127th day, the OCV
for R7 increased at a lower rate than R8, for which the OCV sharply increased after the
134th day at a maximum of 0.555 V.
For both MFCR5+R6 and FCR7+R8, the current density in the context of the closed circuit
performance starting on the fifth day is presented in Figure 6-6, for which every electrode
was connected independently to an external resistance of 500 Ω. In common with the
OCV, the current generation for the aforementioned sub-reactors fluctuated throughout
the experimental period in both phase 1 and phase 2. Specifically, for the first sub-reactor
during phase 1 involving 4 days HRT, the current generation for R5 started at 0.594 mA
and reached a maximum of 1.010 mA, and later on achieving an average of
0.954±0.059 mA. The current generation for R6 achieved a relatively steadier level of
0.844±0.042 mA. In relation to the second sub-reactor, MFCR7+R8, current generation for
R7 fluctuated before achieving a relatively steadier performance after the 78th day with an
average reaching 0.746±0.110 mA, unlike R8 which demonstrated a steadier and lower
current generation of 0.611±0.027 mA.
Figure 6-6: Closed circuit voltage of 122 L MFCR5-R8 reactor at 500Ω over time
As Figure 6-6 verifies, the reduction in the HRT from 4 days to 1 day during phase 2 had
contradictory effects on the two sub-reactors. For MFCR5+R6, the current generation of
0
0.2
0.4
0.6
0.8
1
1.2
0 20 40 60 80 100 120 140 160 180
Cu
rren
t (m
A)
Time (Days)
R5R6R7R8
Chapter 6 – Integration of the microbial fuel cell in a whisky effluent treatment process
112
both R5 and R6 remained relatively unchanged throughout the increase in influent flow
rate with average generations of 0.957±0.081 mA and 1.024±0.033 mA for R5 and R6
respectively. Comparison of the two average values for R5 and R6 between phase 1 and
phase 2 only reveals a slight increase for the latter electrode. Different behaviour is
noticeable with regard to MFCR7+R8. For R7, current generation slightly increased after
the 145th day, increasing from an average of 0.865±0.035 mA to 1.046±0.023 mA for the
remainder of phase 2. The current generation of R8 increased at a higher rate after the
same day until the 159th day from an average of 0.609±0.021 mA to 0.962±0.033 mA,
which was maintained for the remaining period.
As described above, the current generation in the MFCR5+R6 sub-reactor seems to have
been relatively unaffected by the change in organic load caused by the HRT reduction. If
examined in detail, only R5 seems to generate an increased current and even then only
slightly, especially compared to the R7. A hypothesis requiring further investigation
could be made at this point: it is possible that the performance recorded is the maximum
current that could be generated by the specific microbial community with regards to the
electrogenic microorganisms. In addition, as will later be examined in more detail, tCOD
removal efficiency remained at relatively steady levels, so a reasonable deduction would
be that the excess of organic matter present in the stream due to increased OLR was
consumed by microbial activities other than electrogenesis. Given that the original
microorganisms are anaerobic, that process would be expected to be methanogenesis.
However, gas generation was checked for through liquid displacement, with none found,
suggesting that the gas either escaped through pathways other than the gas collection
points or dissolved in the liquid stream, or that the above hypothesis itself is wrong.
Therefore, further research could address the phenomenon of relatively unchanged
current generation by the MFCR5+R6 electrodes.
In correlating the current performance of both MFCR5+R6 and MFCR7+R8 to the
performance of the 14 L MFC reactor previously described, an overall consistency is
noticeable between the output of the first electrodes in relation to the influent points; R5
and R7. Using the average values mentioned earlier, during phase 1, both R5 and R7
demonstrated higher current production relative to R6, and R8 respectively;
0.954±0.059 mA and 0.746±0.110 mA compared to 0.844±0.042 mA and 0.611±0.027
mA respectively. This performance, as described in relevant research and as has been
Chapter 6 – Integration of the microbial fuel cell in a whisky effluent treatment process
113
shown here, is indicative of a greater organic load being available when entering the
reactor, which subsequently decreases in moving towards the back of the reactor (Ren et
al., 2014). However, the higher rate of increase in current generation for R8 in relation to
R7 during phase 2 might indicate a higher organic load being introduced in the reactor
than the electrogenic community of R7 could consume in the time provided, thus allowing
for higher organic content to reach R8, subsequently increasing the rate and value of the
current produced. Similar contradictory behaviour was monitored by Winfield et al.
(2011) where, in a series of hydraulically connected MFCs, the reactors in the middle
recorded higher voltage outputs when fed with higher concentrations of acetate than in a
first case using lower concentrations. The quantitative data which would be needed for
the hypothesis to be verified is not available; therefore, the argument requires further
examination during which the collection of values and/or effluent analysis in each
chamber would be necessary.
Finally, in relation to this part of the experiment, a short comparison between all four
sub-reactors should be made. By combining and summarising the results and conclusion
made above, it can be deduced that the sub-reactors within the MFCR1-R4 122 L reactor
demonstrated similar trends, whereas the sub-reactors within the MFCR5-R8 had different
trends, both in regards to the amount of current generated and the response to the
reduction of HRT. Therefore, amongst all four sub-reactors, reproducibility cannot be
verified. In order to address this issue and for future applications analysis of the microbial
community is necessary. Such an analysis will provide an insight on potential differences
in the microbial communities of each anode and each reactor and a correlation between
the microbial content and electrical performance will be possible.
After the start-up period which lasted for only 5 days for both sub-reactors of the 122 L
reactor MFCR1-R4 and for approximately 14 days for MFCR5-R8, the effluent quality
performance was measured and is presented below. Even though the start-up times were
slightly different for the four sub-reactors, sampling for effluent quality started on the 5th
day for all of them and pH and electrical conductivity data were recorded according to
the methods discussed in Chapter 3.4. In Table 6-1, the two parameters are presented and
compared in relation to the relative hydraulic retention time for the two 122 L reactors
since the samples for both were collected at the very rear end of the reactors where the
streams of the two sub-reactors were merged and exited together. As could be verified
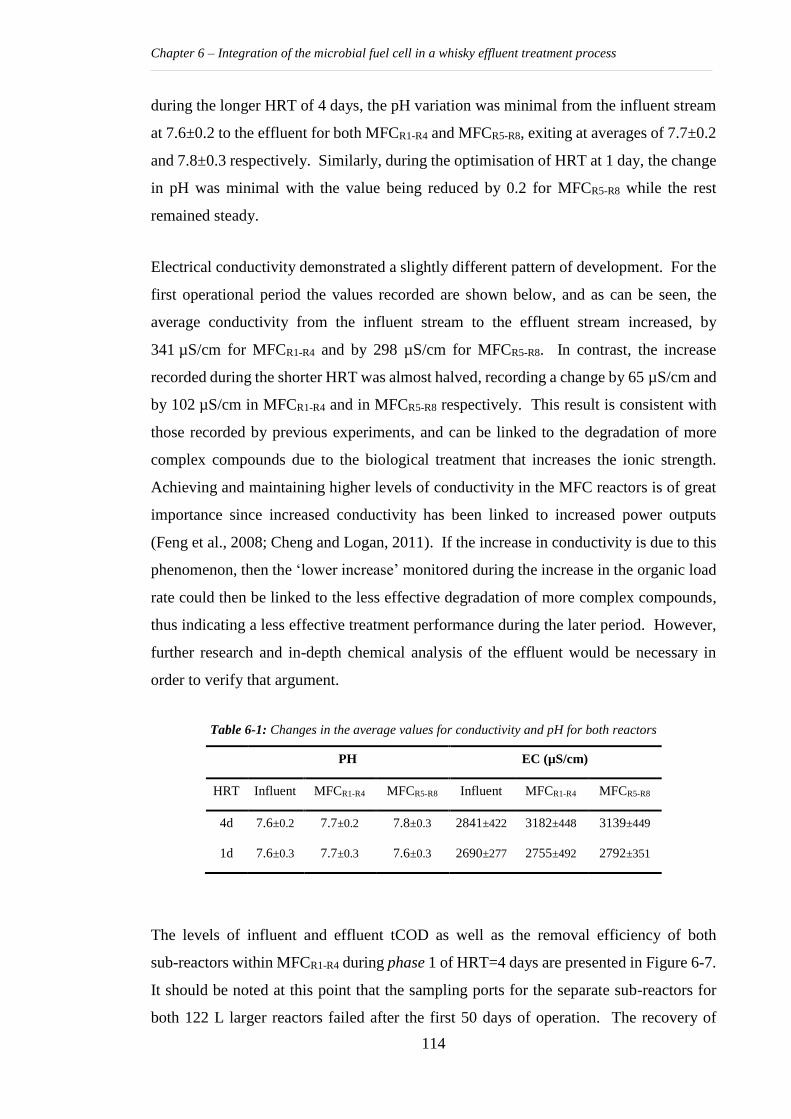
Chapter 6 – Integration of the microbial fuel cell in a whisky effluent treatment process
114
during the longer HRT of 4 days, the pH variation was minimal from the influent stream
at 7.6±0.2 to the effluent for both MFCR1-R4 and MFCR5-R8, exiting at averages of 7.7±0.2
and 7.8±0.3 respectively. Similarly, during the optimisation of HRT at 1 day, the change
in pH was minimal with the value being reduced by 0.2 for MFCR5-R8 while the rest
remained steady.
Electrical conductivity demonstrated a slightly different pattern of development. For the
first operational period the values recorded are shown below, and as can be seen, the
average conductivity from the influent stream to the effluent stream increased, by
341 µS/cm for MFCR1-R4 and by 298 µS/cm for MFCR5-R8. In contrast, the increase
recorded during the shorter HRT was almost halved, recording a change by 65 µS/cm and
by 102 µS/cm in MFCR1-R4 and in MFCR5-R8 respectively. This result is consistent with
those recorded by previous experiments, and can be linked to the degradation of more
complex compounds due to the biological treatment that increases the ionic strength.
Achieving and maintaining higher levels of conductivity in the MFC reactors is of great
importance since increased conductivity has been linked to increased power outputs
(Feng et al., 2008; Cheng and Logan, 2011). If the increase in conductivity is due to this
phenomenon, then the ‘lower increase’ monitored during the increase in the organic load
rate could then be linked to the less effective degradation of more complex compounds,
thus indicating a less effective treatment performance during the later period. However,
further research and in-depth chemical analysis of the effluent would be necessary in
order to verify that argument.
Table 6-1: Changes in the average values for conductivity and pH for both reactors
PH EC (µS/cm)
HRT Influent MFCR1-R4 MFCR5-R8 Influent MFCR1-R4 MFCR5-R8
4d 7.6±0.2 7.7±0.2 7.8±0.3 2841±422 3182±448 3139±449
1d 7.6±0.3 7.7±0.3 7.6±0.3 2690±277 2755±492 2792±351
The levels of influent and effluent tCOD as well as the removal efficiency of both
sub-reactors within MFCR1-R4 during phase 1 of HRT=4 days are presented in Figure 6-7.
It should be noted at this point that the sampling ports for the separate sub-reactors for
both 122 L larger reactors failed after the first 50 days of operation. The recovery of
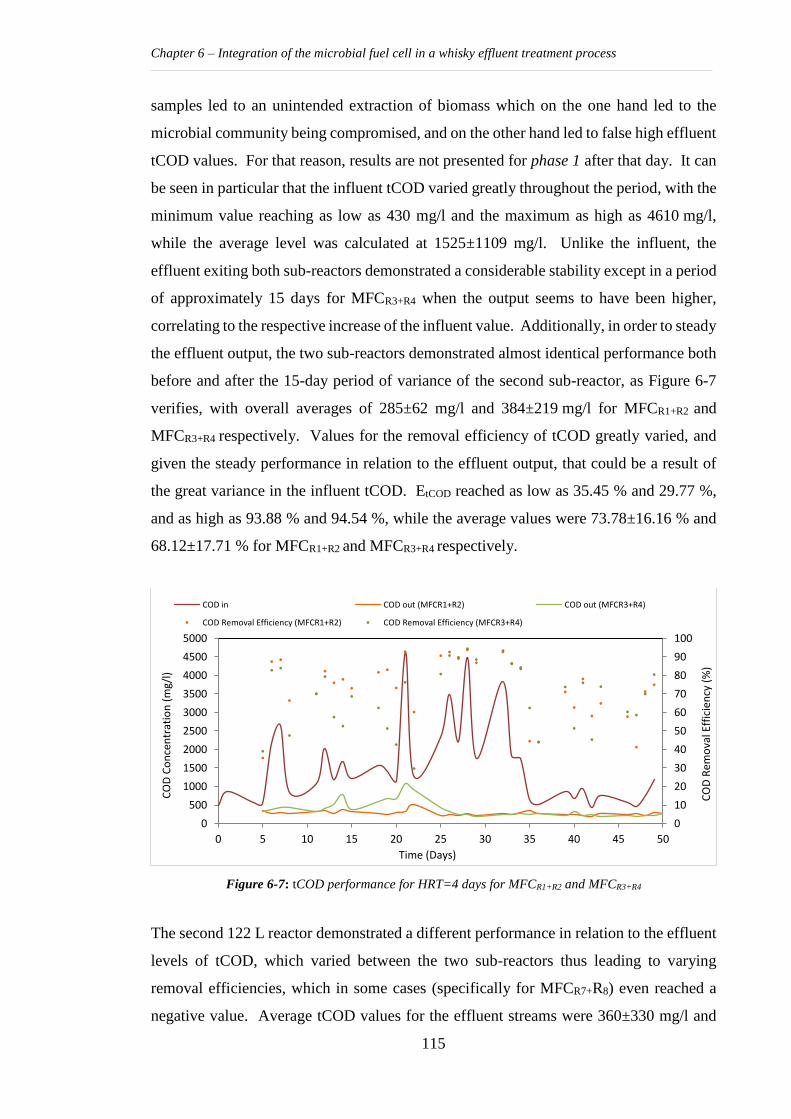
Chapter 6 – Integration of the microbial fuel cell in a whisky effluent treatment process
115
samples led to an unintended extraction of biomass which on the one hand led to the
microbial community being compromised, and on the other hand led to false high effluent
tCOD values. For that reason, results are not presented for phase 1 after that day. It can
be seen in particular that the influent tCOD varied greatly throughout the period, with the
minimum value reaching as low as 430 mg/l and the maximum as high as 4610 mg/l,
while the average level was calculated at 1525±1109 mg/l. Unlike the influent, the
effluent exiting both sub-reactors demonstrated a considerable stability except in a period
of approximately 15 days for MFCR3+R4 when the output seems to have been higher,
correlating to the respective increase of the influent value. Additionally, in order to steady
the effluent output, the two sub-reactors demonstrated almost identical performance both
before and after the 15-day period of variance of the second sub-reactor, as Figure 6-7
verifies, with overall averages of 285±62 mg/l and 384±219 mg/l for MFCR1+R2 and
MFCR3+R4 respectively. Values for the removal efficiency of tCOD greatly varied, and
given the steady performance in relation to the effluent output, that could be a result of
the great variance in the influent tCOD. EtCOD reached as low as 35.45 % and 29.77 %,
and as high as 93.88 % and 94.54 %, while the average values were 73.78±16.16 % and
68.12±17.71 % for MFCR1+R2 and MFCR3+R4 respectively.
Figure 6-7: tCOD performance for HRT=4 days for MFCR1+R2 and MFCR3+R4
The second 122 L reactor demonstrated a different performance in relation to the effluent
levels of tCOD, which varied between the two sub-reactors thus leading to varying
removal efficiencies, which in some cases (specifically for MFCR7+R8) even reached a
negative value. Average tCOD values for the effluent streams were 360±330 mg/l and
0
10
20
30
40
50
60
70
80
90
100
0
500
1000
1500
2000
2500
3000
3500
4000
4500
5000
0 5 10 15 20 25 30 35 40 45 50
CO
D R
emo
val E
ffic
ien
cy (
%)
CO
D C
on
cen
trat
ion
(m
g/l)
Time (Days)
COD in COD out (MFCR1+R2) COD out (MFCR3+R4)
COD Removal Efficiency (MFCR1+R2) COD Removal Efficiency (MFCR3+R4)
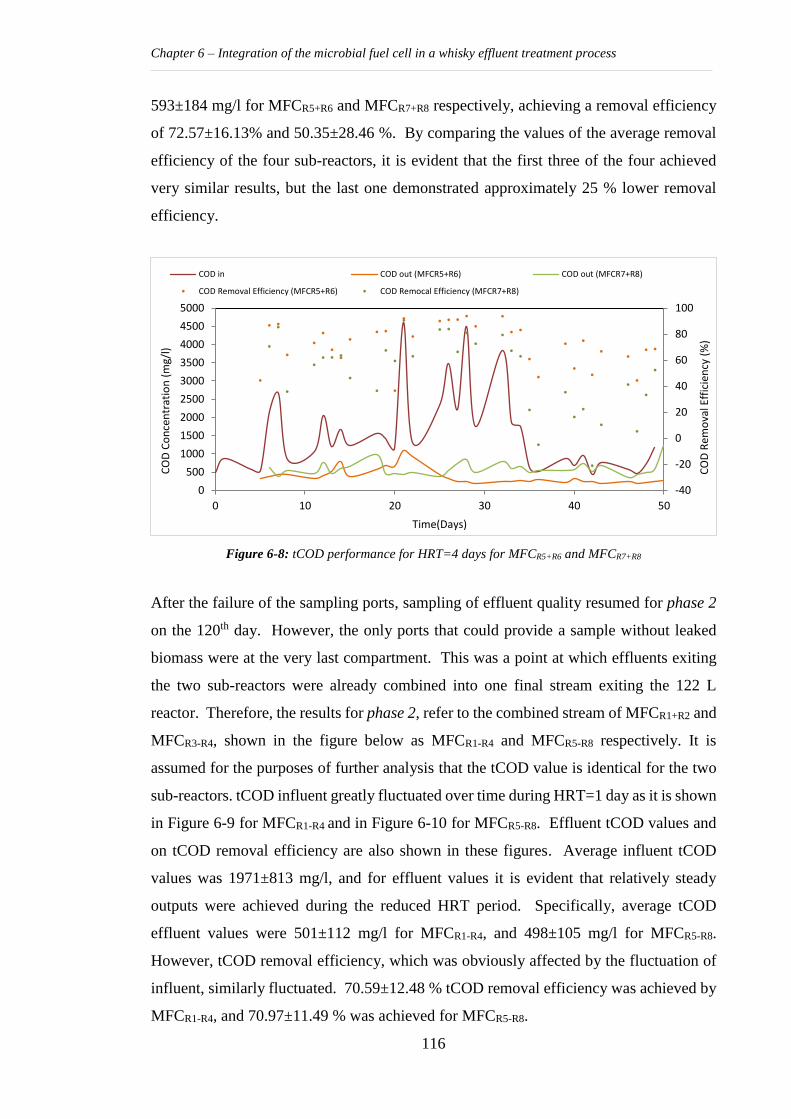
Chapter 6 – Integration of the microbial fuel cell in a whisky effluent treatment process
116
593±184 mg/l for MFCR5+R6 and MFCR7+R8 respectively, achieving a removal efficiency
of 72.57±16.13% and 50.35±28.46 %. By comparing the values of the average removal
efficiency of the four sub-reactors, it is evident that the first three of the four achieved
very similar results, but the last one demonstrated approximately 25 % lower removal
efficiency.
Figure 6-8: tCOD performance for HRT=4 days for MFCR5+R6 and MFCR7+R8
After the failure of the sampling ports, sampling of effluent quality resumed for phase 2
on the 120th day. However, the only ports that could provide a sample without leaked
biomass were at the very last compartment. This was a point at which effluents exiting
the two sub-reactors were already combined into one final stream exiting the 122 L
reactor. Therefore, the results for phase 2, refer to the combined stream of MFCR1+R2 and
MFCR3-R4, shown in the figure below as MFCR1-R4 and MFCR5-R8 respectively. It is
assumed for the purposes of further analysis that the tCOD value is identical for the two
sub-reactors. tCOD influent greatly fluctuated over time during HRT=1 day as it is shown
in Figure 6-9 for MFCR1-R4 and in Figure 6-10 for MFCR5-R8. Effluent tCOD values and
on tCOD removal efficiency are also shown in these figures. Average influent tCOD
values was 1971±813 mg/l, and for effluent values it is evident that relatively steady
outputs were achieved during the reduced HRT period. Specifically, average tCOD
effluent values were 501±112 mg/l for MFCR1-R4, and 498±105 mg/l for MFCR5-R8.
However, tCOD removal efficiency, which was obviously affected by the fluctuation of
influent, similarly fluctuated. 70.59±12.48 % tCOD removal efficiency was achieved by
MFCR1-R4, and 70.97±11.49 % was achieved for MFCR5-R8.
-40
-20
0
20
40
60
80
100
0
500
1000
1500
2000
2500
3000
3500
4000
4500
5000
0 10 20 30 40 50
CO
D R
emo
val E
ffic
ien
cy (
%)
CO
D C
on
cen
trat
ion
(m
g/l)
Time(Days)
COD in COD out (MFCR5+R6) COD out (MFCR7+R8)
COD Removal Efficiency (MFCR5+R6) COD Remocal Efficiency (MFCR7+R8)
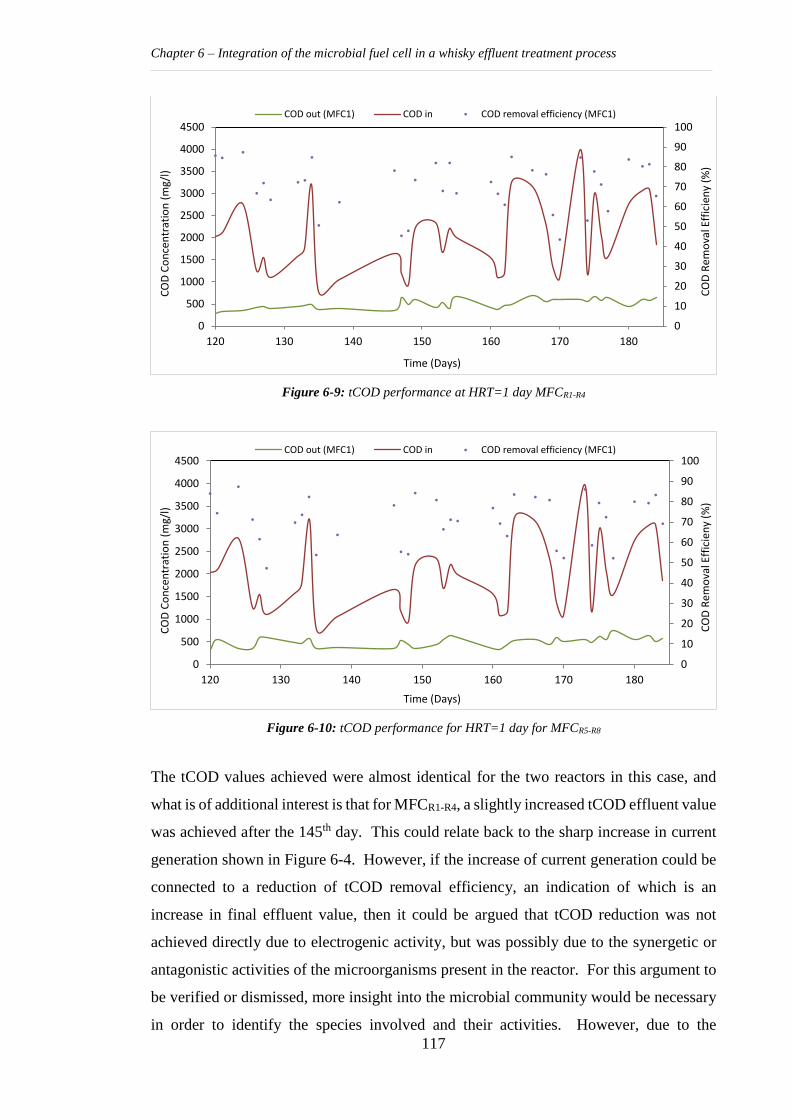
Chapter 6 – Integration of the microbial fuel cell in a whisky effluent treatment process
117
Figure 6-9: tCOD performance at HRT=1 day MFCR1-R4
Figure 6-10: tCOD performance for HRT=1 day for MFCR5-R8
The tCOD values achieved were almost identical for the two reactors in this case, and
what is of additional interest is that for MFCR1-R4, a slightly increased tCOD effluent value
was achieved after the 145th day. This could relate back to the sharp increase in current
generation shown in Figure 6-4. However, if the increase of current generation could be
connected to a reduction of tCOD removal efficiency, an indication of which is an
increase in final effluent value, then it could be argued that tCOD reduction was not
achieved directly due to electrogenic activity, but was possibly due to the synergetic or
antagonistic activities of the microorganisms present in the reactor. For this argument to
be verified or dismissed, more insight into the microbial community would be necessary
in order to identify the species involved and their activities. However, due to the
0
10
20
30
40
50
60
70
80
90
100
0
500
1000
1500
2000
2500
3000
3500
4000
4500
120 130 140 150 160 170 180
CO
D R
emo
val E
ffic
ien
y (%
)
CO
D C
on
cen
trat
ion
(m
g/l)
Time (Days)
COD out (MFC1) COD in COD removal efficiency (MFC1)
0
10
20
30
40
50
60
70
80
90
100
0
500
1000
1500
2000
2500
3000
3500
4000
4500
120 130 140 150 160 170 180
CO
D R
emo
val E
ffic
ien
y (%
)
CO
D C
on
cen
trat
ion
(m
g/l)
Time (Days)
COD out (MFC1) COD in COD removal efficiency (MFC1)
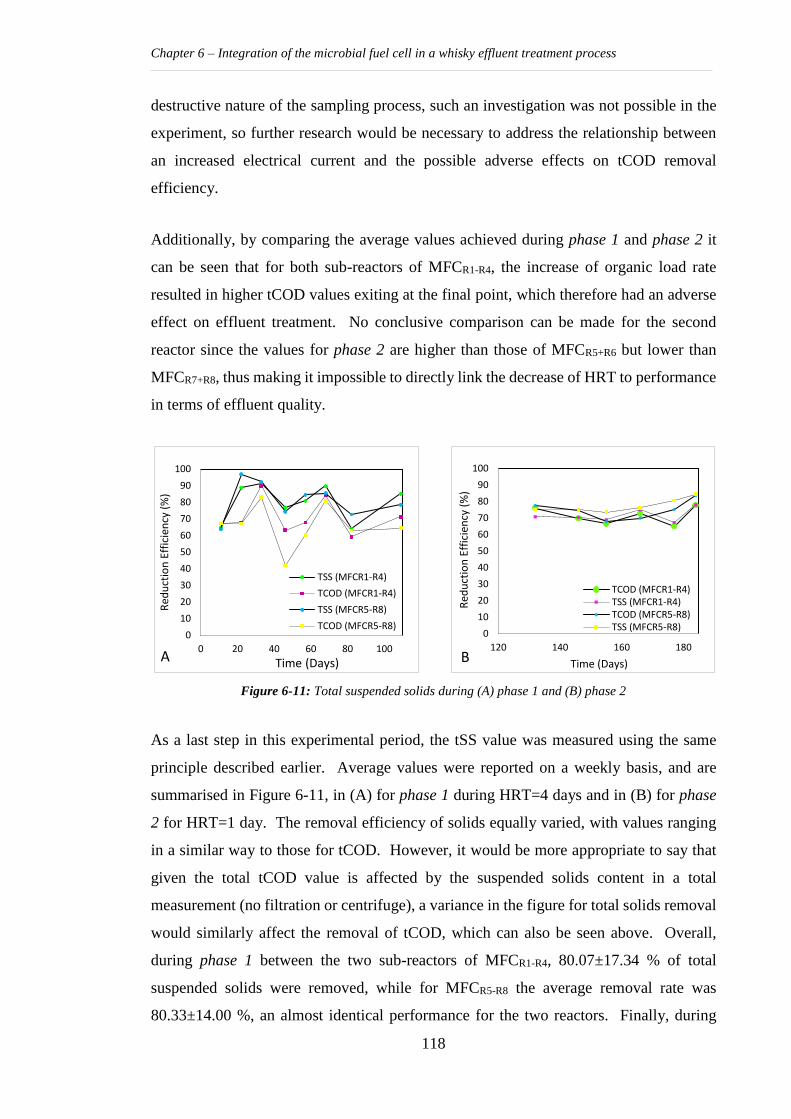
Chapter 6 – Integration of the microbial fuel cell in a whisky effluent treatment process
118
destructive nature of the sampling process, such an investigation was not possible in the
experiment, so further research would be necessary to address the relationship between
an increased electrical current and the possible adverse effects on tCOD removal
efficiency.
Additionally, by comparing the average values achieved during phase 1 and phase 2 it
can be seen that for both sub-reactors of MFCR1-R4, the increase of organic load rate
resulted in higher tCOD values exiting at the final point, which therefore had an adverse
effect on effluent treatment. No conclusive comparison can be made for the second
reactor since the values for phase 2 are higher than those of MFCR5+R6 but lower than
MFCR7+R8, thus making it impossible to directly link the decrease of HRT to performance
in terms of effluent quality.
Figure 6-11: Total suspended solids during (A) phase 1 and (B) phase 2
As a last step in this experimental period, the tSS value was measured using the same
principle described earlier. Average values were reported on a weekly basis, and are
summarised in Figure 6-11, in (A) for phase 1 during HRT=4 days and in (B) for phase
2 for HRT=1 day. The removal efficiency of solids equally varied, with values ranging
in a similar way to those for tCOD. However, it would be more appropriate to say that
given the total tCOD value is affected by the suspended solids content in a total
measurement (no filtration or centrifuge), a variance in the figure for total solids removal
would similarly affect the removal of tCOD, which can also be seen above. Overall,
during phase 1 between the two sub-reactors of MFCR1-R4, 80.07±17.34 % of total
suspended solids were removed, while for MFCR5-R8 the average removal rate was
80.33±14.00 %, an almost identical performance for the two reactors. Finally, during
0
10
20
30
40
50
60
70
80
90
100
0 20 40 60 80 100
Red
uct
ion
Eff
icie
ncy
(%
)
Time (Days)
TSS (MFCR1-R4)
TCOD (MFCR1-R4)
TSS (MFCR5-R8)
TCOD (MFCR5-R8)0
10
20
30
40
50
60
70
80
90
100
120 140 160 180
Red
uct
ion
Eff
icie
ncy
(%
)
Time (Days)
TCOD (MFCR1-R4)TSS (MFCR1-R4)TCOD (MFCR5-R8)TSS (MFCR5-R8)
A B
Chapter 6 – Integration of the microbial fuel cell in a whisky effluent treatment process
119
phase 2 the respective totals of suspended solids removed were 74.32±13.77 % and
76.95±11.97 % which was marking a reduction in efficiency. This is in accordance with
the previously made argument that effluent quality is adversely affected by the reductions
in the treatment cycle and can more clearly be seen here in the context of total suspended
solids.
In situ refurbishment process of modified 122L MFC with sub-reactors
Upon the completion of phase 1 and 2, the first experimental cycle aimed at integrating
an MFC into an existing whisky co-products treatment plant was carried out. In order to
further examine the MFC’s operation under a different electrical regime (continuous
discharge method) and until the relative failure of the system, the two MFC reactors were
refurbished in situ according to the previously established procedure. The anodes were
removed and the adapted microbial community was harvested. The anodes were then
rinsed with distilled water, according to the maintenance process followed in section 5.3.5
for the retro-fit of the prototype reactor. Following the first cleaning process, the anodes
were then placed in a weak hydrochloric acid solution (0.05M HCl) for two hours in order
to remove the remaining organic matter prior to their re-use, before being thoroughly
rinsed for the second time with distilled water. The cathodes were cleaned with distilled
water. Biofilm, similar to that observed during the first refurbishment of the Heriot-Watt
reactor was observed on the surface which had been in contact with the anodic
compartment, and was fully removed with fine cloth while exercising caution in order to
avoid damaging the coated cathode surface; a process also described in an earlier study
by Zhang et al. (2014). Finally, the two reactors were filled with fresh water, in order to
assess potential leakages, and fix any which were found. No leakages were observed and
therefore, re-inoculation was carried out.
The harvested adapted biomass was re-inoculated into the reactors, enriched with fresh
anaerobic granular biomass collected from the anaerobic digester operating in the
distillery at a 1:1 ratio. Serial transfusions of adapted microbial communities have been
found by researchers to be an effective way of utilising adapted microorganisms to
strengthen the performance of electrogenic communities, while minimising the time
needed for start-up (Logan, 2008; Cusick et al., 2011).
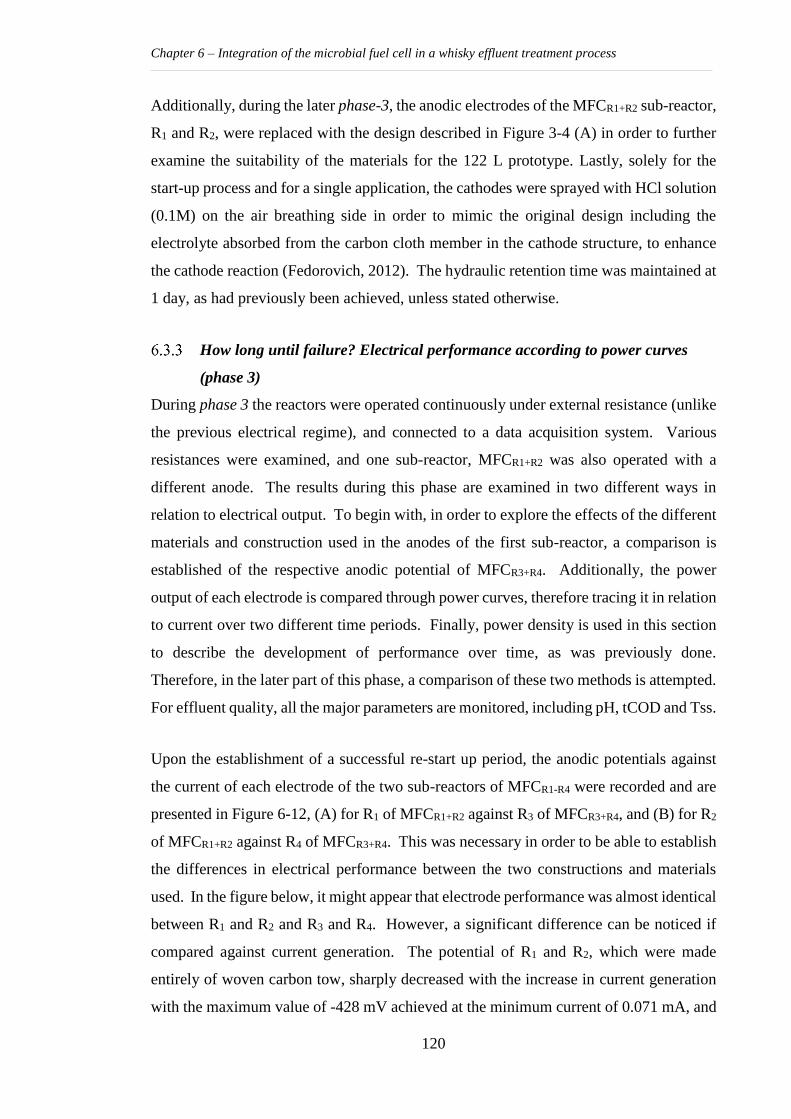
Chapter 6 – Integration of the microbial fuel cell in a whisky effluent treatment process
120
Additionally, during the later phase-3, the anodic electrodes of the MFCR1+R2 sub-reactor,
R1 and R2, were replaced with the design described in Figure 3-4 (A) in order to further
examine the suitability of the materials for the 122 L prototype. Lastly, solely for the
start-up process and for a single application, the cathodes were sprayed with HCl solution
(0.1M) on the air breathing side in order to mimic the original design including the
electrolyte absorbed from the carbon cloth member in the cathode structure, to enhance
the cathode reaction (Fedorovich, 2012). The hydraulic retention time was maintained at
1 day, as had previously been achieved, unless stated otherwise.
How long until failure? Electrical performance according to power curves
(phase 3)
During phase 3 the reactors were operated continuously under external resistance (unlike
the previous electrical regime), and connected to a data acquisition system. Various
resistances were examined, and one sub-reactor, MFCR1+R2 was also operated with a
different anode. The results during this phase are examined in two different ways in
relation to electrical output. To begin with, in order to explore the effects of the different
materials and construction used in the anodes of the first sub-reactor, a comparison is
established of the respective anodic potential of MFCR3+R4. Additionally, the power
output of each electrode is compared through power curves, therefore tracing it in relation
to current over two different time periods. Finally, power density is used in this section
to describe the development of performance over time, as was previously done.
Therefore, in the later part of this phase, a comparison of these two methods is attempted.
For effluent quality, all the major parameters are monitored, including pH, tCOD and Tss.
Upon the establishment of a successful re-start up period, the anodic potentials against
the current of each electrode of the two sub-reactors of MFCR1-R4 were recorded and are
presented in Figure 6-12, (A) for R1 of MFCR1+R2 against R3 of MFCR3+R4, and (B) for R2
of MFCR1+R2 against R4 of MFCR3+R4. This was necessary in order to be able to establish
the differences in electrical performance between the two constructions and materials
used. In the figure below, it might appear that electrode performance was almost identical
between R1 and R2 and R3 and R4. However, a significant difference can be noticed if
compared against current generation. The potential of R1 and R2, which were made
entirely of woven carbon tow, sharply decreased with the increase in current generation
with the maximum value of -428 mV achieved at the minimum current of 0.071 mA, and
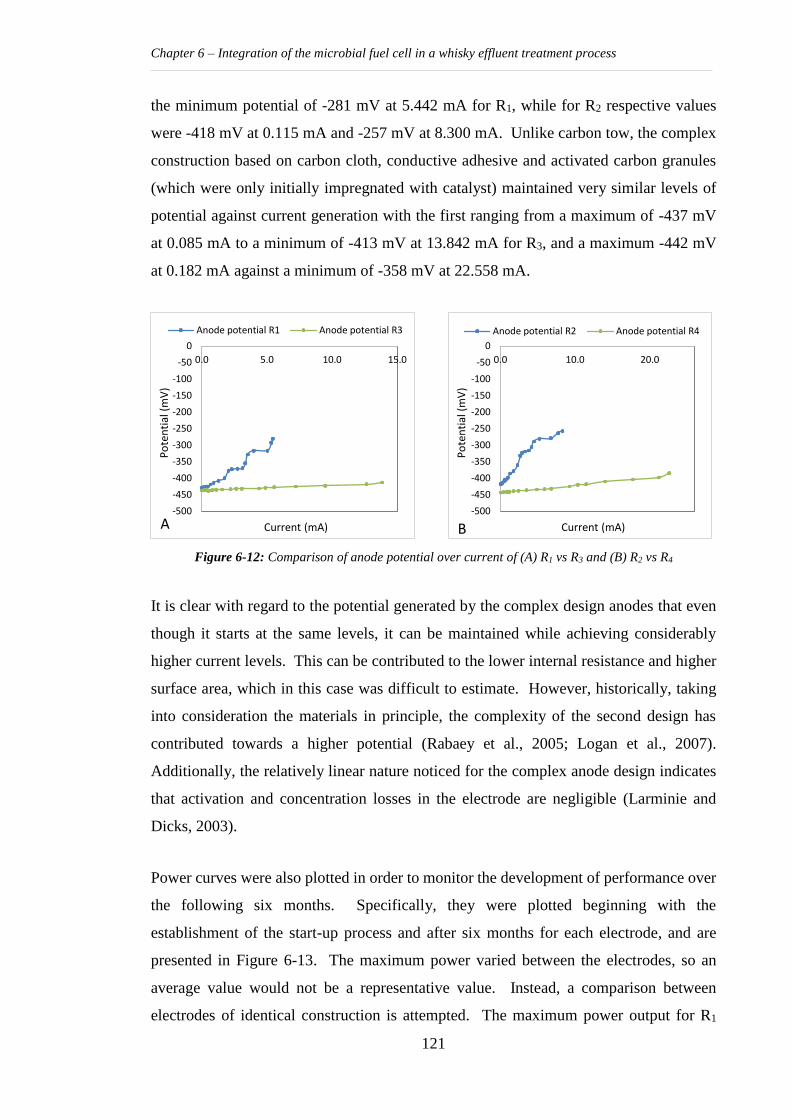
Chapter 6 – Integration of the microbial fuel cell in a whisky effluent treatment process
121
the minimum potential of -281 mV at 5.442 mA for R1, while for R2 respective values
were -418 mV at 0.115 mA and -257 mV at 8.300 mA. Unlike carbon tow, the complex
construction based on carbon cloth, conductive adhesive and activated carbon granules
(which were only initially impregnated with catalyst) maintained very similar levels of
potential against current generation with the first ranging from a maximum of -437 mV
at 0.085 mA to a minimum of -413 mV at 13.842 mA for R3, and a maximum -442 mV
at 0.182 mA against a minimum of -358 mV at 22.558 mA.
Figure 6-12: Comparison of anode potential over current of (A) R1 vs R3 and (B) R2 vs R4
It is clear with regard to the potential generated by the complex design anodes that even
though it starts at the same levels, it can be maintained while achieving considerably
higher current levels. This can be contributed to the lower internal resistance and higher
surface area, which in this case was difficult to estimate. However, historically, taking
into consideration the materials in principle, the complexity of the second design has
contributed towards a higher potential (Rabaey et al., 2005; Logan et al., 2007).
Additionally, the relatively linear nature noticed for the complex anode design indicates
that activation and concentration losses in the electrode are negligible (Larminie and
Dicks, 2003).
Power curves were also plotted in order to monitor the development of performance over
the following six months. Specifically, they were plotted beginning with the
establishment of the start-up process and after six months for each electrode, and are
presented in Figure 6-13. The maximum power varied between the electrodes, so an
average value would not be a representative value. Instead, a comparison between
electrodes of identical construction is attempted. The maximum power output for R1
-500
-450
-400
-350
-300
-250
-200
-150
-100
-50
0
0.0 5.0 10.0 15.0
Po
ten
tial
(m
V)
Current (mA)
Anode potential R1 Anode potential R3
A-500
-450
-400
-350
-300
-250
-200
-150
-100
-50
0
0.0 10.0 20.0
Po
ten
tial
(m
V)
Current (mA)
Anode potential R2 Anode potential R4
B
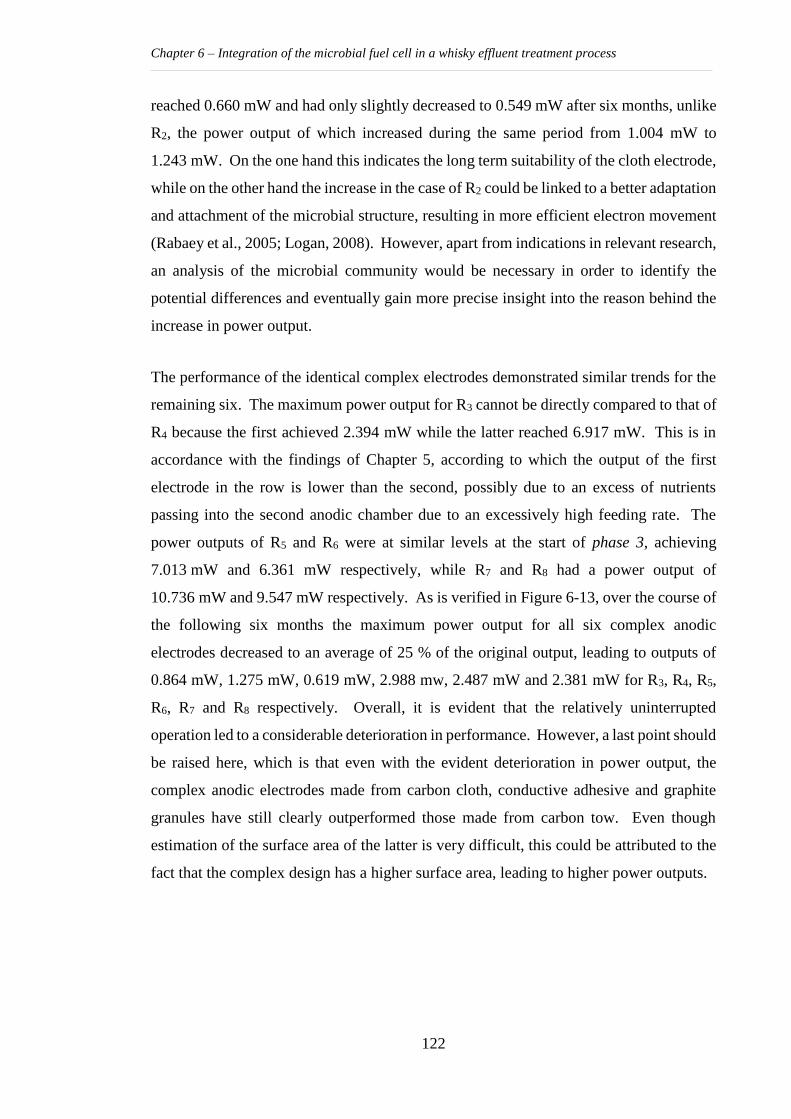
Chapter 6 – Integration of the microbial fuel cell in a whisky effluent treatment process
122
reached 0.660 mW and had only slightly decreased to 0.549 mW after six months, unlike
R2, the power output of which increased during the same period from 1.004 mW to
1.243 mW. On the one hand this indicates the long term suitability of the cloth electrode,
while on the other hand the increase in the case of R2 could be linked to a better adaptation
and attachment of the microbial structure, resulting in more efficient electron movement
(Rabaey et al., 2005; Logan, 2008). However, apart from indications in relevant research,
an analysis of the microbial community would be necessary in order to identify the
potential differences and eventually gain more precise insight into the reason behind the
increase in power output.
The performance of the identical complex electrodes demonstrated similar trends for the
remaining six. The maximum power output for R3 cannot be directly compared to that of
R4 because the first achieved 2.394 mW while the latter reached 6.917 mW. This is in
accordance with the findings of Chapter 5, according to which the output of the first
electrode in the row is lower than the second, possibly due to an excess of nutrients
passing into the second anodic chamber due to an excessively high feeding rate. The
power outputs of R5 and R6 were at similar levels at the start of phase 3, achieving
7.013 mW and 6.361 mW respectively, while R7 and R8 had a power output of
10.736 mW and 9.547 mW respectively. As is verified in Figure 6-13, over the course of
the following six months the maximum power output for all six complex anodic
electrodes decreased to an average of 25 % of the original output, leading to outputs of
0.864 mW, 1.275 mW, 0.619 mW, 2.988 mw, 2.487 mW and 2.381 mW for R3, R4, R5,
R6, R7 and R8 respectively. Overall, it is evident that the relatively uninterrupted
operation led to a considerable deterioration in performance. However, a last point should
be raised here, which is that even with the evident deterioration in power output, the
complex anodic electrodes made from carbon cloth, conductive adhesive and graphite
granules have still clearly outperformed those made from carbon tow. Even though
estimation of the surface area of the latter is very difficult, this could be attributed to the
fact that the complex design has a higher surface area, leading to higher power outputs.
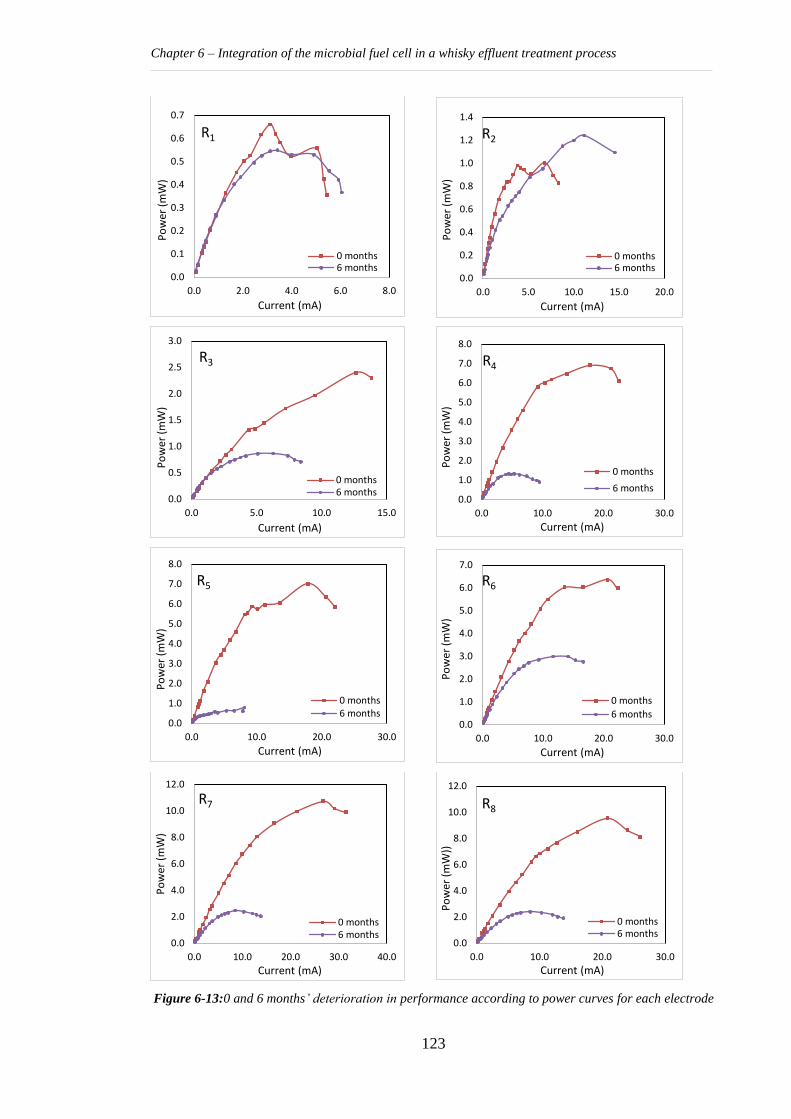
Chapter 6 – Integration of the microbial fuel cell in a whisky effluent treatment process
123
Figure 6-13:0 and 6 months’ deterioration in performance according to power curves for each electrode
0.0
0.1
0.2
0.3
0.4
0.5
0.6
0.7
0.0 2.0 4.0 6.0 8.0
Po
wer
(m
W)
Current (mA)
R1
0 months6 months
0.0
0.2
0.4
0.6
0.8
1.0
1.2
1.4
0.0 5.0 10.0 15.0 20.0
Po
wer
(m
W)
Current (mA)
R2
0 months6 months
0.0
0.5
1.0
1.5
2.0
2.5
3.0
0.0 5.0 10.0 15.0
Po
wer
(m
W)
Current (mA)
R3
0 months6 months
0.0
1.0
2.0
3.0
4.0
5.0
6.0
7.0
8.0
0.0 10.0 20.0 30.0
Po
wer
(m
W)
Current (mA)
R4
0 months
6 months
0.0
1.0
2.0
3.0
4.0
5.0
6.0
7.0
8.0
0.0 10.0 20.0 30.0
Po
wer
(m
W)
Current (mA)
R5
0 months6 months
0.0
1.0
2.0
3.0
4.0
5.0
6.0
7.0
0.0 10.0 20.0 30.0
Po
wer
(m
W)
Current (mA)
R6
0 months
6 months
0.0
2.0
4.0
6.0
8.0
10.0
12.0
0.0 10.0 20.0 30.0 40.0
Po
wer
(m
W)
Current (mA)
R7
0 months6 months
0.0
2.0
4.0
6.0
8.0
10.0
12.0
0.0 10.0 20.0 30.0
Po
wer
(m
W))
Current (mA)
R8
0 months6 months
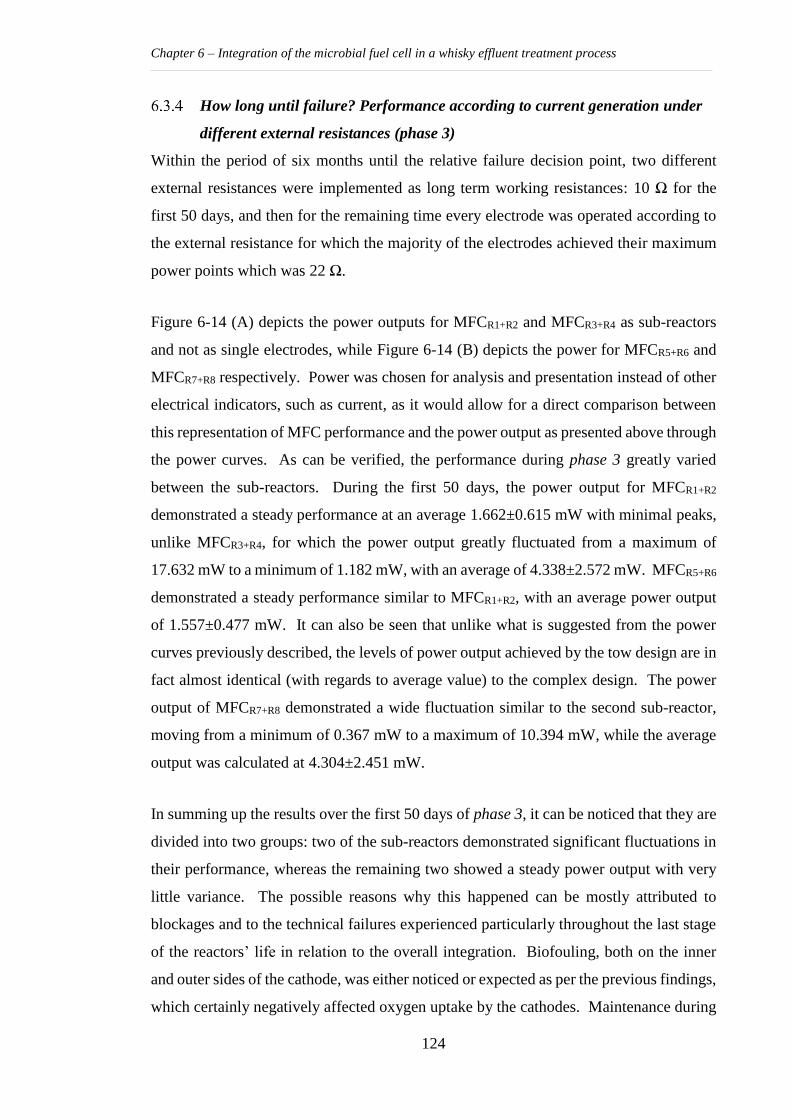
Chapter 6 – Integration of the microbial fuel cell in a whisky effluent treatment process
124
How long until failure? Performance according to current generation under
different external resistances (phase 3)
Within the period of six months until the relative failure decision point, two different
external resistances were implemented as long term working resistances: 10 Ω for the
first 50 days, and then for the remaining time every electrode was operated according to
the external resistance for which the majority of the electrodes achieved their maximum
power points which was 22 Ω.
Figure 6-14 (A) depicts the power outputs for MFCR1+R2 and MFCR3+R4 as sub-reactors
and not as single electrodes, while Figure 6-14 (B) depicts the power for MFCR5+R6 and
MFCR7+R8 respectively. Power was chosen for analysis and presentation instead of other
electrical indicators, such as current, as it would allow for a direct comparison between
this representation of MFC performance and the power output as presented above through
the power curves. As can be verified, the performance during phase 3 greatly varied
between the sub-reactors. During the first 50 days, the power output for MFCR1+R2
demonstrated a steady performance at an average 1.662±0.615 mW with minimal peaks,
unlike MFCR3+R4, for which the power output greatly fluctuated from a maximum of
17.632 mW to a minimum of 1.182 mW, with an average of 4.338±2.572 mW. MFCR5+R6
demonstrated a steady performance similar to MFCR1+R2, with an average power output
of 1.557±0.477 mW. It can also be seen that unlike what is suggested from the power
curves previously described, the levels of power output achieved by the tow design are in
fact almost identical (with regards to average value) to the complex design. The power
output of MFCR7+R8 demonstrated a wide fluctuation similar to the second sub-reactor,
moving from a minimum of 0.367 mW to a maximum of 10.394 mW, while the average
output was calculated at 4.304±2.451 mW.
In summing up the results over the first 50 days of phase 3, it can be noticed that they are
divided into two groups: two of the sub-reactors demonstrated significant fluctuations in
their performance, whereas the remaining two showed a steady power output with very
little variance. The possible reasons why this happened can be mostly attributed to
blockages and to the technical failures experienced particularly throughout the last stage
of the reactors’ life in relation to the overall integration. Biofouling, both on the inner
and outer sides of the cathode, was either noticed or expected as per the previous findings,
which certainly negatively affected oxygen uptake by the cathodes. Maintenance during
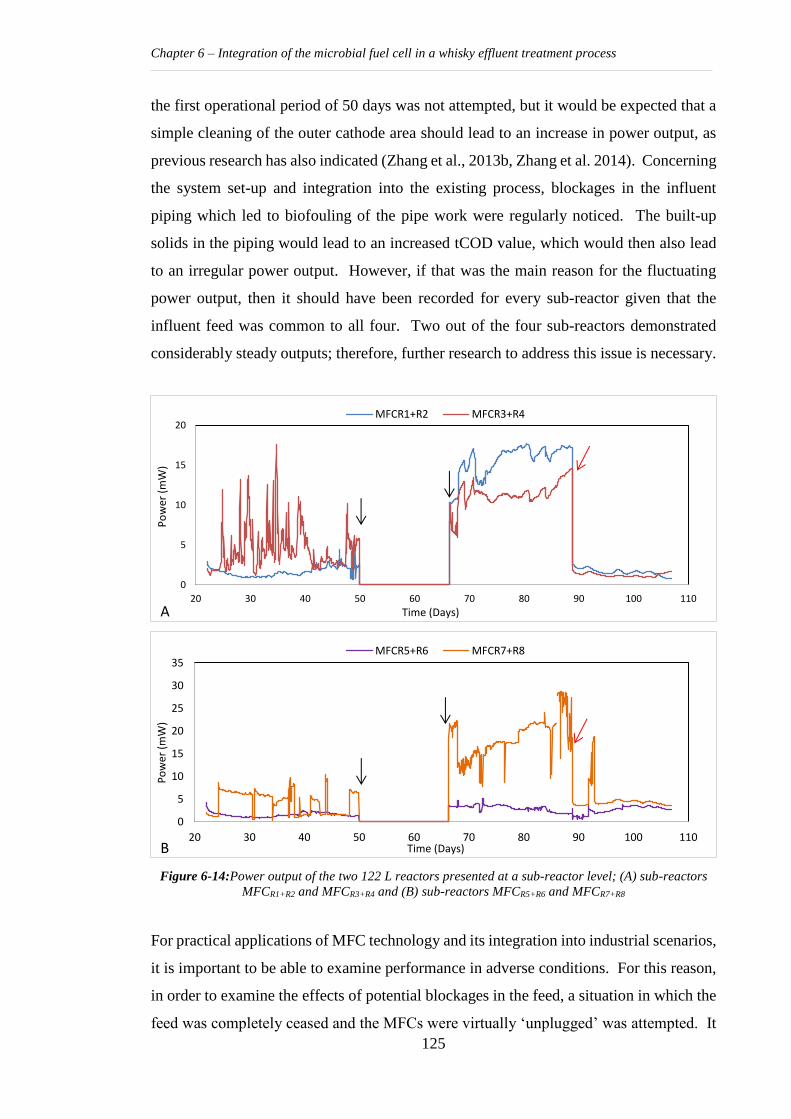
Chapter 6 – Integration of the microbial fuel cell in a whisky effluent treatment process
125
the first operational period of 50 days was not attempted, but it would be expected that a
simple cleaning of the outer cathode area should lead to an increase in power output, as
previous research has also indicated (Zhang et al., 2013b, Zhang et al. 2014). Concerning
the system set-up and integration into the existing process, blockages in the influent
piping which led to biofouling of the pipe work were regularly noticed. The built-up
solids in the piping would lead to an increased tCOD value, which would then also lead
to an irregular power output. However, if that was the main reason for the fluctuating
power output, then it should have been recorded for every sub-reactor given that the
influent feed was common to all four. Two out of the four sub-reactors demonstrated
considerably steady outputs; therefore, further research to address this issue is necessary.
Figure 6-14:Power output of the two 122 L reactors presented at a sub-reactor level; (A) sub-reactors
MFCR1+R2 and MFCR3+R4 and (B) sub-reactors MFCR5+R6 and MFCR7+R8
For practical applications of MFC technology and its integration into industrial scenarios,
it is important to be able to examine performance in adverse conditions. For this reason,
in order to examine the effects of potential blockages in the feed, a situation in which the
feed was completely ceased and the MFCs were virtually ‘unplugged’ was attempted. It
0
5
10
15
20
20 30 40 50 60 70 80 90 100 110
Po
wer
(m
W)
Time (Days)
MFCR1+R2 MFCR3+R4
A
0
5
10
15
20
25
30
35
20 30 40 50 60 70 80 90 100 110
Po
wer
(m
W)
Time (Days)
MFCR5+R6 MFCR7+R8
B
Chapter 6 – Integration of the microbial fuel cell in a whisky effluent treatment process
126
is often the case that industrial effluent treatment establishments do not operate
continuously but rather according to demand, or their processes are paused for a specific
period for maintenance. For a period of approximately 15 days, the feed was therefore
stopped, and the sub-reactors were switched to open circuit mode and the microbial
community was left in suspension. The two black arrows in Figure 6-14 indicate the
shut-down and re-start of the four sub-reactors respectively, during which they were left
in ‘sleep mode’.
Open circuit voltage during ‘sleep mode’ was reached within the first day and
demonstrated surprising stability, which can be also verified, but there was some
variance, with average values at 274±11 mV, 467±18 mV, 377±23 mV and 695±6 mV
for R1, R2, R3 and R4 respectively in the first reactor, while for the second 122 L reactor
the average values were 605±26 mV, 608±16 mV, 634±7 mV and 613±7 mV for R5, R6,
R7 and R8. Following this period of ‘sleep mode’, when all sub-reactors successfully
recovered and maintained their maximum potential, every electrode was connected back
to an external resistance of 22 Ω, which corresponded to the maximum power point
resistance for the majority of the working electrodes.
Figure 6-14 shows that upon reconnecting the electrodes under the external resistance,
the power generation sharply recovered within the first few hours. Additionally, an
increasing trend, which was steadier than previously seen was noticeable, with average
power output of 15.610±1.924 mW and 11.334±1.568 mW for MFCR1+R2 and MFCR3+R4
respectively, while for MFCR5+R6 and MFCR7+R8 average values were at 3.020±0.681 mW
and 18.514±4.331 mW, up until the 88th day. This performance contrasted with previous
results, especially for the MFCR1+R2 and MFCR5+R6 sub-reactors which had previously
demonstrated steady yet considerably lower power output.
In order to determine that the increase in power was due to increased microbial function
and not due to corrosive current, it was decided to clean the working electrodes and
implement maintenance on the external electrical connections, without interrupting the
anodic electrodes and microbial community (see the red arrow point in Figure 6-14). The
power output recorded after the cleaning process demonstrated a steady performance but
at much lower levels than before, thus verifying that the performance has been
overestimated due to a galvanic current attributed to failing, corroded electrical
Chapter 6 – Integration of the microbial fuel cell in a whisky effluent treatment process
127
connections. It was established that the true external resistance was considerably higher,
resulting in wrongly estimated power outputs; this can be considered a point of failing
performance. For the remaining period of approximately 18 days, the power outputs were
steady apart from a peak noticed at MFCR7+R8, which was possibly due to electrical
connection failure as had happened previously, with average values of 1.630±0.391 mW,
1.262±0.236 mW, 2.624±0.819 mW and 4.709 mW achieved for MFCR1+R2, MFCR3+R4,
MFCR5+R6 and MFCR7+R8 respectively. Therefore, if it is accepted that the performance
prior to the cleaning of the electrical connections was due to the galvanic current, that this
was therefore not the ‘true’ power, the latest power values should be considered
representative of performance under Rext=22 Ω.
Figure 6-15: Comparative power performance of the four MFC sub-reactors according to polarisation
data at 0 months and 6 months and performance under Rext=10 Ω and Rext=22 Ω
In order to summarise the power performance under the different working conditions over
time and to emphasise the necessity of both polarisation curves and continuous
performance under an external resistance, Figure 6-15 is presented above. The power
according to the polarisation data at 0 and 6 months is represented as well as the average
long term performance under external resistance values of 10 Ω and 22 Ω. The original
arguments can be verified, as for MFCR1+R2, power was maintained over time except at
relatively lowest levels. On the other hand, the performance of the complex electrodes
clearly sharply deteriorated with time, keeping in mind that a single spray of HCl solution
was applied to the cathodes upon start-up. Therefore, even though the carbon tow can be
said to demonstrate long term sustainability and credibility, it is still outperformed by the
complex anodes. Finally, as was suggested before, polarisation curves tend to
0
3
6
9
12
15
18
21
MFCR1+R2 MFCR3+R4 MFCR5+R6 MFCR7+R8
Po
wer
(m
W)
Polarisation (0 months) Rext=10Ω Rext=22Ω Polarisation (6 months)
Chapter 6 – Integration of the microbial fuel cell in a whisky effluent treatment process
128
overestimate the power output potential of an MFC, highlighting the necessity of a long
term examination to gain a more ‘realistic’ insight into an MFC’s working performance.
That said, the value which truly brings together treatment and electrical efficiency and
which might have shown a different pattern of development throughout time is coulombic
efficiency. Therefore, the Table 6-2, below, summarises EtCOD and coulombic efficiency
at different Rext for the two reactors with different anodes. Even though the maximum
power point was observed to be at an external resistance of 22 Ω for the majority of the
electrodes, it is noticed that coulombic efficiency was greater at the external resistance of
10 Ω, with the maximum value achieved by electrode R4 at the average of 7.61±2.63 %,
followed by R1 and R2. These results in regards to their quality can be verified by Figure
6-15, where it can also be seen that R1 had the poorest performance. This performance
can be attributed to the different material used in these two electrodes which was carbon
tow, and as it was also verified by the specific polarisation curves, it was outperformed
by the complex anode construction. However, tCOD removal efficiency demonstrated a
different behaviour for the sub-reactor with the carbon tow. The tCOD removal
efficiency for MFCR1+R2 was the second highest reported during Rext=10 Ω at an average
of 67.14±9.64 % and the third highest for Rext=22 Ω at an average of 84.88±5.98 %. This
could be attributed to the fact that the carbon tow anode possibly acted as a filter,
removing compounds contributing to the tCOD value. In both cases, in relation to tCOD
removal efficiency, greater results were monitored during the external resistance of 22 Ω.
An energy balance was also performed for all four MFC sub-reactors for this last period
of examination. The consumption of the pumps was calculated according to Equation
3-16 at 0.0033 kWh/m3 for the pump feeding MFCR1+R2 and MFCR3+R4, while for the
pump feeding MFCR5+R6 and MFR7+R8, energy consumption was calculated at
0.0003 kWh/m3. The normalised energy recovery was also calculated according to the
methods previously presented and the energy balance for the sub-reactors is presented
below, in Table 6-2. After the sub-reactors were cleaned it was concluded that the
increased power outputs were due to galvanic current because of considerable
deterioration of the electrical connections. Therefore, an energy balance was produced
for the second half of the operation under Rext=22 Ω, the period for which it was
concluded that the electricity production of the electrodes was solely due to the microbial
community’s function and not due to additional galvanic current. Energy recovery
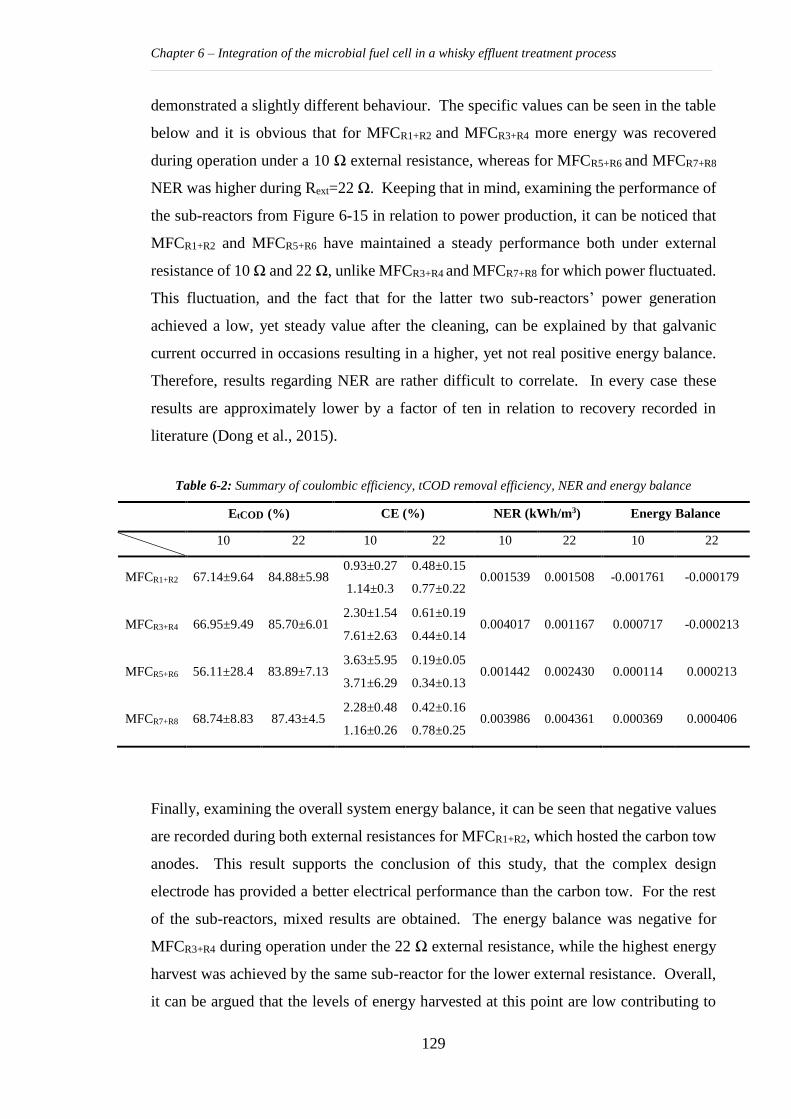
Chapter 6 – Integration of the microbial fuel cell in a whisky effluent treatment process
129
demonstrated a slightly different behaviour. The specific values can be seen in the table
below and it is obvious that for MFCR1+R2 and MFCR3+R4 more energy was recovered
during operation under a 10 Ω external resistance, whereas for MFCR5+R6 and MFCR7+R8
NER was higher during Rext=22 Ω. Keeping that in mind, examining the performance of
the sub-reactors from Figure 6-15 in relation to power production, it can be noticed that
MFCR1+R2 and MFCR5+R6 have maintained a steady performance both under external
resistance of 10 Ω and 22 Ω, unlike MFCR3+R4 and MFCR7+R8 for which power fluctuated.
This fluctuation, and the fact that for the latter two sub-reactors’ power generation
achieved a low, yet steady value after the cleaning, can be explained by that galvanic
current occurred in occasions resulting in a higher, yet not real positive energy balance.
Therefore, results regarding NER are rather difficult to correlate. In every case these
results are approximately lower by a factor of ten in relation to recovery recorded in
literature (Dong et al., 2015).
Table 6-2: Summary of coulombic efficiency, tCOD removal efficiency, NER and energy balance
EtCOD (%) CE (%) NER (kWh/m3) Energy Balance
10 22 10 22 10 22 10 22
MFCR1+R2 67.14±9.64 84.88±5.98 0.93±0.27
1.14±0.3
0.48±0.15
0.77±0.22 0.001539 0.001508 -0.001761 -0.000179
MFCR3+R4 66.95±9.49 85.70±6.01 2.30±1.54
7.61±2.63
0.61±0.19
0.44±0.14 0.004017 0.001167 0.000717 -0.000213
MFCR5+R6 56.11±28.4 83.89±7.13 3.63±5.95
3.71±6.29
0.19±0.05
0.34±0.13 0.001442 0.002430 0.000114 0.000213
MFCR7+R8 68.74±8.83 87.43±4.5 2.28±0.48
1.16±0.26
0.42±0.16
0.78±0.25 0.003986 0.004361 0.000369 0.000406
Finally, examining the overall system energy balance, it can be seen that negative values
are recorded during both external resistances for MFCR1+R2, which hosted the carbon tow
anodes. This result supports the conclusion of this study, that the complex design
electrode has provided a better electrical performance than the carbon tow. For the rest
of the sub-reactors, mixed results are obtained. The energy balance was negative for
MFCR3+R4 during operation under the 22 Ω external resistance, while the highest energy
harvest was achieved by the same sub-reactor for the lower external resistance. Overall,
it can be argued that the levels of energy harvested at this point are low contributing to
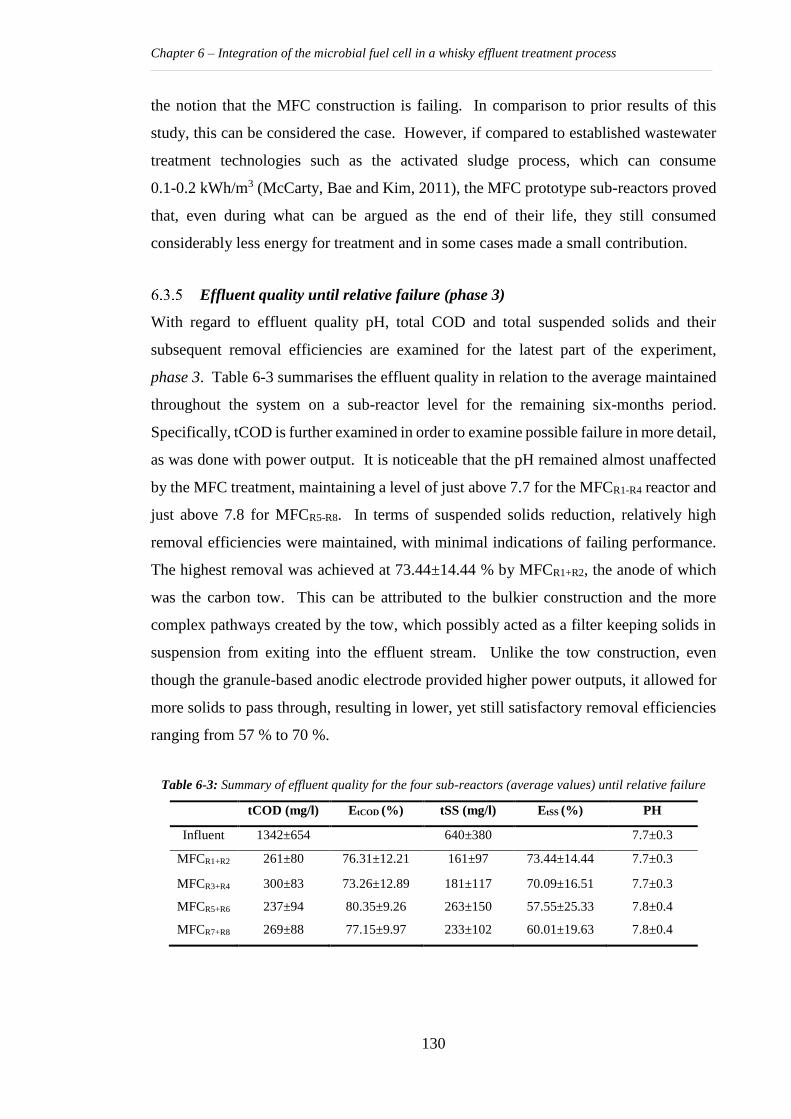
Chapter 6 – Integration of the microbial fuel cell in a whisky effluent treatment process
130
the notion that the MFC construction is failing. In comparison to prior results of this
study, this can be considered the case. However, if compared to established wastewater
treatment technologies such as the activated sludge process, which can consume
0.1-0.2 kWh/m3 (McCarty, Bae and Kim, 2011), the MFC prototype sub-reactors proved
that, even during what can be argued as the end of their life, they still consumed
considerably less energy for treatment and in some cases made a small contribution.
Effluent quality until relative failure (phase 3)
With regard to effluent quality pH, total COD and total suspended solids and their
subsequent removal efficiencies are examined for the latest part of the experiment,
phase 3. Table 6-3 summarises the effluent quality in relation to the average maintained
throughout the system on a sub-reactor level for the remaining six-months period.
Specifically, tCOD is further examined in order to examine possible failure in more detail,
as was done with power output. It is noticeable that the pH remained almost unaffected
by the MFC treatment, maintaining a level of just above 7.7 for the MFCR1-R4 reactor and
just above 7.8 for MFCR5-R8. In terms of suspended solids reduction, relatively high
removal efficiencies were maintained, with minimal indications of failing performance.
The highest removal was achieved at 73.44±14.44 % by MFCR1+R2, the anode of which
was the carbon tow. This can be attributed to the bulkier construction and the more
complex pathways created by the tow, which possibly acted as a filter keeping solids in
suspension from exiting into the effluent stream. Unlike the tow construction, even
though the granule-based anodic electrode provided higher power outputs, it allowed for
more solids to pass through, resulting in lower, yet still satisfactory removal efficiencies
ranging from 57 % to 70 %.
Table 6-3: Summary of effluent quality for the four sub-reactors (average values) until relative failure
tCOD (mg/l) EtCOD (%) tSS (mg/l) EtSS (%) PH
Influent 1342±654 640±380 7.7±0.3
MFCR1+R2 261±80 76.31±12.21 161±97 73.44±14.44 7.7±0.3
MFCR3+R4 300±83 73.26±12.89 181±117 70.09±16.51 7.7±0.3
MFCR5+R6 237±94 80.35±9.26 263±150 57.55±25.33 7.8±0.4
MFCR7+R8 269±88 77.15±9.97 233±102 60.01±19.63 7.8±0.4
Chapter 6 – Integration of the microbial fuel cell in a whisky effluent treatment process
131
Specifically looking at tCOD development during phase 3, as can also be verified by
Figure 6-16 (and as monitored throughout the integration of the pilot construction in the
wastewater treatment process), the influent tCOD values fluctuated considerably from
540 mg/l to 3237 mg/l while the average value was 1342±654 mg/l. Removal efficiencies
developed at the same levels, with the average removal of the carbon tow based anode
achieving the third highest rate, as can be seen in the table above. However, it is evident
that the tCOD effluent values achieved throughout phase 3, during which the failure of
the reactors was examined, were relatively steady and remained as such throughout the
six months. Therefore, in effluent quality terms, the reactors remained in good working
condition even though the electricity generation considerably declined after six months
to a minimal level, as described previously. At this point it could therefore be argued that
removal efficiency was correlated to activities other than electricity generation.
Prior research in the field has found that possible antagonistic microbial activities were
responsible for COD removal, rather than electricity. According to Zhang et al. (2013b),
a carbon balance revealed that the sulphate reduction process consumed considerably
more carbon than electricity production did. For this reason, sulphates were examined
throughout the latter part of phase 3 and, in a departure from the findings reported by
prior research, it was revealed that the values for the ADLD used as influent in this study
were notably low. This could be attributed to the fact that the whisky distillation
co-product has undergone anaerobic digestion as one of the initial steps of its treatment.
Related research has shown that sulphates are converted to hydrogen sulphide by
sulphate-reducing bacteria during anaerobic processes, inhibiting the process, and giving
the characteristic smell to AD, but reducing the sulphates in the effluent stream.
Therefore, for the purposes of this application, sulphate reduction probably does not act
antagonistically to electricity generation due to its limited availability. Therefore, in order
to address the mismatch of electricity production and its declining trend to a successful
effluent treatment, further chemical analysis is necessary along with an analysis of the
microbial community and its development until the point of relative electrical failure.
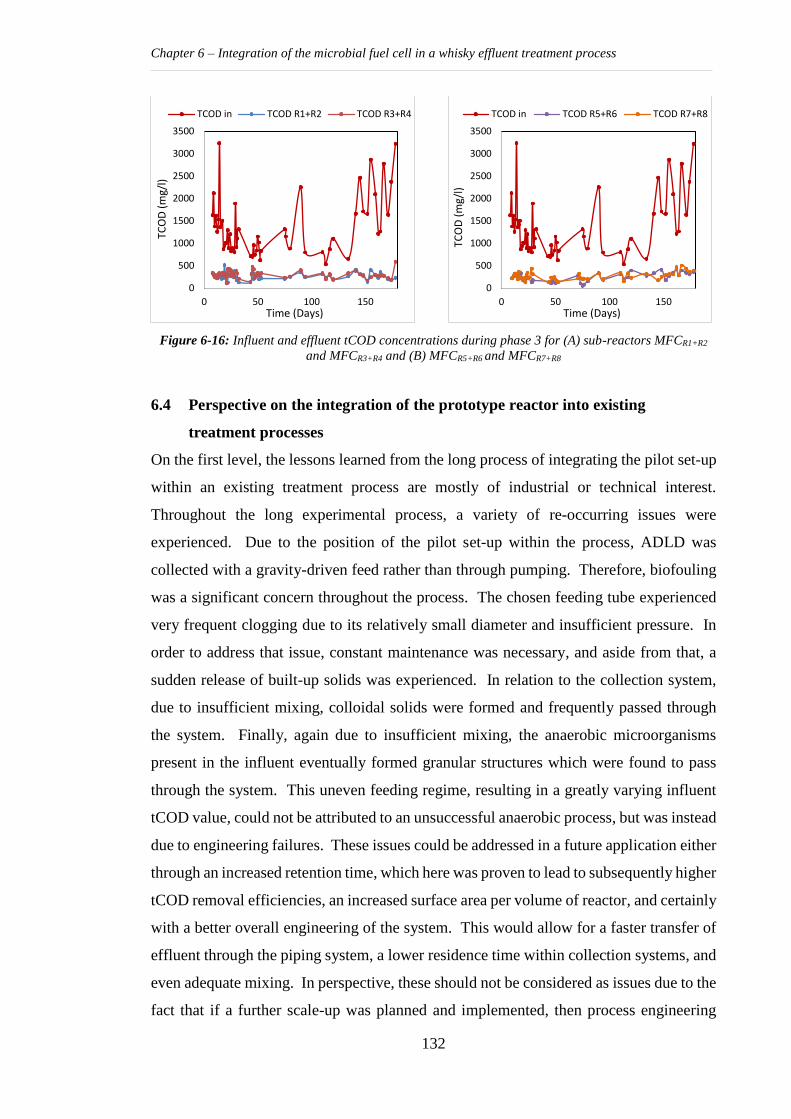
Chapter 6 – Integration of the microbial fuel cell in a whisky effluent treatment process
132
Figure 6-16: Influent and effluent tCOD concentrations during phase 3 for (A) sub-reactors MFCR1+R2
and MFCR3+R4 and (B) MFCR5+R6 and MFCR7+R8
6.4 Perspective on the integration of the prototype reactor into existing
treatment processes
On the first level, the lessons learned from the long process of integrating the pilot set-up
within an existing treatment process are mostly of industrial or technical interest.
Throughout the long experimental process, a variety of re-occurring issues were
experienced. Due to the position of the pilot set-up within the process, ADLD was
collected with a gravity-driven feed rather than through pumping. Therefore, biofouling
was a significant concern throughout the process. The chosen feeding tube experienced
very frequent clogging due to its relatively small diameter and insufficient pressure. In
order to address that issue, constant maintenance was necessary, and aside from that, a
sudden release of built-up solids was experienced. In relation to the collection system,
due to insufficient mixing, colloidal solids were formed and frequently passed through
the system. Finally, again due to insufficient mixing, the anaerobic microorganisms
present in the influent eventually formed granular structures which were found to pass
through the system. This uneven feeding regime, resulting in a greatly varying influent
tCOD value, could not be attributed to an unsuccessful anaerobic process, but was instead
due to engineering failures. These issues could be addressed in a future application either
through an increased retention time, which here was proven to lead to subsequently higher
tCOD removal efficiencies, an increased surface area per volume of reactor, and certainly
with a better overall engineering of the system. This would allow for a faster transfer of
effluent through the piping system, a lower residence time within collection systems, and
even adequate mixing. In perspective, these should not be considered as issues due to the
fact that if a further scale-up was planned and implemented, then process engineering
0
500
1000
1500
2000
2500
3000
3500
0 50 100 150
TCO
D (
mg/
l)
Time (Days)
TCOD in TCOD R1+R2 TCOD R3+R4
0
500
1000
1500
2000
2500
3000
3500
0 50 100 150
TCO
D (
mg/
l)
Time (Days)
TCOD in TCOD R5+R6 TCOD R7+R8
Chapter 6 – Integration of the microbial fuel cell in a whisky effluent treatment process
133
would ensure secure, adequate and necessary flows of effluent throughout the treatment
process.
As could possibly be expected and as suggested in previous pilot studies (Logan, 2012;
Janicek, Fan and Liu, 2014), albeit with regard to considerably shorter periods, the chosen
materials became an issue towards the end of the reactors’ life. Even though stainless
steel was chosen for the external connections, they eventually degraded leading to
corrosion issues and galvanic current. Subsequently, the electrical potential of the
reactors was falsely overestimated. Maintenance can address that issue in the short-term,
however, in the long term (which is the main goal), realistic applications should be
reconsidered in terms of the selection of materials on an industrial scale. Given that
materials are one of the main constraints to MFC commercialisation, it is necessary that
this issue is addressed, possibly by following the example of already-commercialised
industrial applications such as chemical treatment-based methods.
Additionally, for the purposes of this study, specific effluent parameters were monitored,
including the basic ones of effluent quality determination, pH, tCOD, tSS and in some
cases conductivity and a variety of micronutrients. However, in order to better determine
these, to examine reasons for the failure of the MFC process in more depth, and to detect
possible inhibiting processes, a full effluent characterisation is necessary as has also been
previously suggested by Greenman et al. (2009) and Janicek, Fan and Liu (2014).
Even though these technical and engineering factors have adversely affected the overall
output of the present study, it still managed to demonstrate a relatively successful
integration of MFC technology into an existing treatment process for whisky distillation
by-products. In the current model, the spent wash undergoes anaerobic digestion and
subsequently regularly goes into an aerobic polishing step in order to meet the standards
necessary for final discharge to the sewers. What has been suggested through the present
investigation of this process is that the MFC prototype can work complementary to
anaerobic digestion, unlike much prior research that has suggested that MFCs are
competitors to AD technology (Pham et al., 2006). With some years still to go until full
scale commercialisation, MFCs could prove a successful alternative to aerobic processes,
that unlike MFC technology, consume large amounts of energy for their operation.
Chapter 6 – Integration of the microbial fuel cell in a whisky effluent treatment process
134
In many respects, this study has not confirmed the great power outputs reported in similar
prior studies of laboratory scale experiments, in controlled environments, usually using
artificial substrates. It is also certainly still some distance away from full scale
commercialisation at its current outputs. However, if used along with other attempts of a
similar kind, of MFCs in industrial environments, in realistic conditions, at ambient
temperatures, with little maintenance and on real wastewater substrates, it is anticipated
that the experience gained will lead to a fully successful application
6.5 Chapter conclusions
This chapter discusses the last of the field experiments carried out in this study. During
this last part of the examination, a pilot set-up was integrated into an existing treatment
facility. The set-up, consisting of two 122 L multi-electrode reactors, was successfully
operated in the industrial environment for over a year, treating anaerobic digestion liquid
digestate. This proved the MFC’s potential to be used in the future after AD treatment,
possibly instead of established but energy intensive technologies. The pilot demonstrated
a long term, robust treatment potential since failure regarding electrical performance was
found to be only due to technical issues, which are believed to be relatively easy to address
in future applications. In terms of the wastewater treatment process, no failure was
detected.
The chapter went on to examine two different experimental anode designs and concluded
with the preferred design between the two. Experimental data collected during this later
part are used in the following chapter in order to investigate the potential for using a
simple electrochemical model to describe the performance of the pilot-scale prototype
developed in this study. The present chapter, as part of the overall study, has shed some
light on the field applications and integration in a real industrial environment of MFCs in
the wastewater treatment sector.
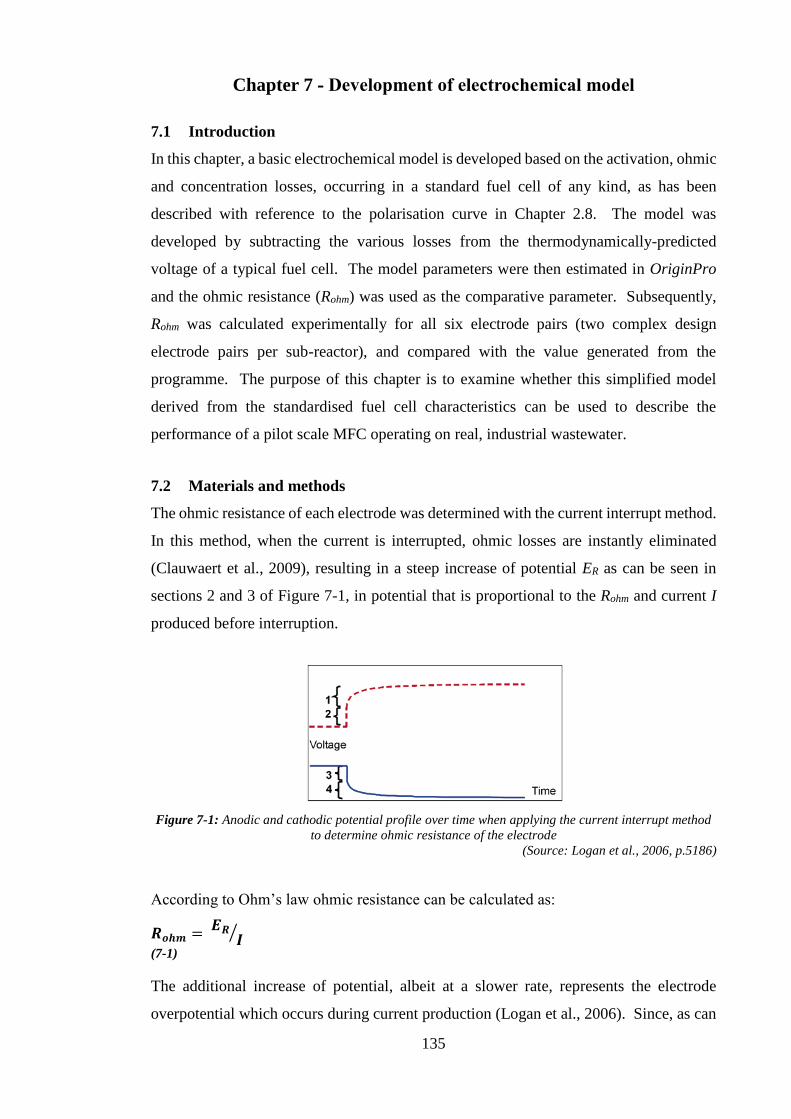
135
Chapter 7 - Development of electrochemical model
7.1 Introduction
In this chapter, a basic electrochemical model is developed based on the activation, ohmic
and concentration losses, occurring in a standard fuel cell of any kind, as has been
described with reference to the polarisation curve in Chapter 2.8. The model was
developed by subtracting the various losses from the thermodynamically-predicted
voltage of a typical fuel cell. The model parameters were then estimated in OriginPro
and the ohmic resistance (Rohm) was used as the comparative parameter. Subsequently,
Rohm was calculated experimentally for all six electrode pairs (two complex design
electrode pairs per sub-reactor), and compared with the value generated from the
programme. The purpose of this chapter is to examine whether this simplified model
derived from the standardised fuel cell characteristics can be used to describe the
performance of a pilot scale MFC operating on real, industrial wastewater.
7.2 Materials and methods
The ohmic resistance of each electrode was determined with the current interrupt method.
In this method, when the current is interrupted, ohmic losses are instantly eliminated
(Clauwaert et al., 2009), resulting in a steep increase of potential ER as can be seen in
sections 2 and 3 of Figure 7-1, in potential that is proportional to the Rohm and current I
produced before interruption.
Figure 7-1: Anodic and cathodic potential profile over time when applying the current interrupt method
to determine ohmic resistance of the electrode
(Source: Logan et al., 2006, p.5186)
According to Ohm’s law ohmic resistance can be calculated as:
𝑹𝒐𝒉𝒎 = 𝑬𝑹
𝑰⁄
(7-1)
The additional increase of potential, albeit at a slower rate, represents the electrode
overpotential which occurs during current production (Logan et al., 2006). Since, as can
Chapter 7- Development of electrochemical model
136
be seen, the ohmic losses disappear instantly, it is very important for the equipment used
to be able to receive electrical samples down to fractions of a second. For this reason, the
data acquisition system used during the latest part of the operation of the 122 L reactors
collected voltage samples at a rate of 100 msec. Therefore, the experiment aiming to
validate the model was carried out in the latter part of the previous operation, just before
the end of life of the 122 L reactors, a fact which should be taken into consideration when
examining and evaluating the results. Eight different external resistances on the ohmic
spectrum were used (680, 470, 330, 220, 150, 120, 82 and 65Ω), and the experimental
Rohm refers to the average of the values calculated by them. As was mentioned earlier,
the OriginPro data analysis software was used for the theoretical calculation of Rohm based
on the values obtained in the polarisation curves.
7.3 Results and discussion
Electrochemical model development
For all electrochemical systems, the real voltage output under a specific external load can
be described by subtracting the various losses from the thermodynamically predicted
voltage (Larminie and Dicks, 2003), as follows:
𝑽 = 𝑬𝒕𝒉𝒆𝒓𝒎𝒐 − 𝜼𝒂𝒄𝒕 − 𝜼𝒐𝒉𝒎𝒊𝒄 − 𝜼𝒄𝒐𝒏𝒄 (7-2)
Where essentially, the real voltage (V) is the predicted potential difference between the
two electrodes (Ethermo) minus the voltage losses due to kinetics (ηact), ohmic polarisation
(ηohmic) and losses due to mass transport (ηconc) respectively. For the following equations,
‘a cell’ will be regarded as one anode and cathode pair; thus, the following can be applied
separately to each electrode in the multi-electrode reactor. Specifically, for each electrode
the Tafel equation describes the activation overpotential as:
𝑬 = 𝑬𝒒 +𝑹𝑻
(𝟏−𝒂)𝒏𝑭𝒍𝒏
𝑰𝒅
𝒊𝒐 (7-3)
Where E refers to the electrode potential; Eq is the equilibrium potential of the electrode;
R is the universal gas constant; T is the temperature; a is the charge transfer coefficient;
n is the number of electrons involved in the electrode reaction; F is the Faraday constant;
Id is the current density and io is the exchange current density. In order to simplify the
aforementioned equation constant B is introduced:

Chapter 7- Development of electrochemical model
137
𝑬 = 𝑬𝒒 + 𝑩 𝒍𝒏𝒊
𝒊𝒐= 𝑬𝒒 + 𝑩(𝒍𝒏 𝒊 − 𝒍𝒏 𝒊𝒐) = 𝑬𝒒 − 𝑩 𝒍𝒏 𝒊𝒐 + 𝑩 𝒍𝒏 𝒊
(7-4)
The first part of the equation can therefore be considered as a constant value Aan for the
anodic electrode, and Acat for the cathodic one along with Ban and Bcat respectively,
resulting in:
𝑬𝒂𝒏 = 𝑨𝒂𝒏 + 𝑩𝒂𝒏 𝒍𝒏 𝒊 (7-5)
𝑬𝒄𝒂𝒕 = 𝑨𝒄𝒂𝒕 + 𝑩𝒄𝒂𝒕 𝒍𝒏 𝒊 (7-6)
Returning to Equation 7-2, ohmic resistance for each electrode can be described as:
𝜼𝒐𝒉𝒎𝒊𝒄 = 𝑰𝑹𝒐𝒉𝒎
(7-7)
But in order to be consistent with the equation for voltage loss, the equation has to be
expressed in terms of current density. To do so, the equation can be expressed as:
𝜼𝒐𝒉𝒎𝒊𝒄 = 𝒊𝑺𝑹𝒐𝒉𝒎
(7-8)
Where i is the current density in mA/m2, S is the cross sectional surface area of the
electrode and in m2 and Rohm is ohmic resistance.
Moving the last component of equation 7-2, concentration losses are expressed as:
𝜼𝒄𝒐𝒏𝒄 = 𝒄 𝒍𝒏 (𝒊𝑳
𝒊𝑳−𝒊)
(7-9)
Which occur both for the anode and the cathode, where c is a constant depending on the
operational conditions of every fuel cell and 𝑖𝐿 is the limiting current density. An
alternative approach that has no theoretical basis but was empirically established, has
been used in the early stages of fuel cell description (Larminie and Dicks, 2003):
𝜼𝒄𝒐𝒏𝒄 = 𝒎𝒆𝒙𝒑(𝒏𝒊)
(7-10)
This last equation has been shown to provide a good fit with the experimental results
produced previously, and will therefore be used for the purposes of this study. However,
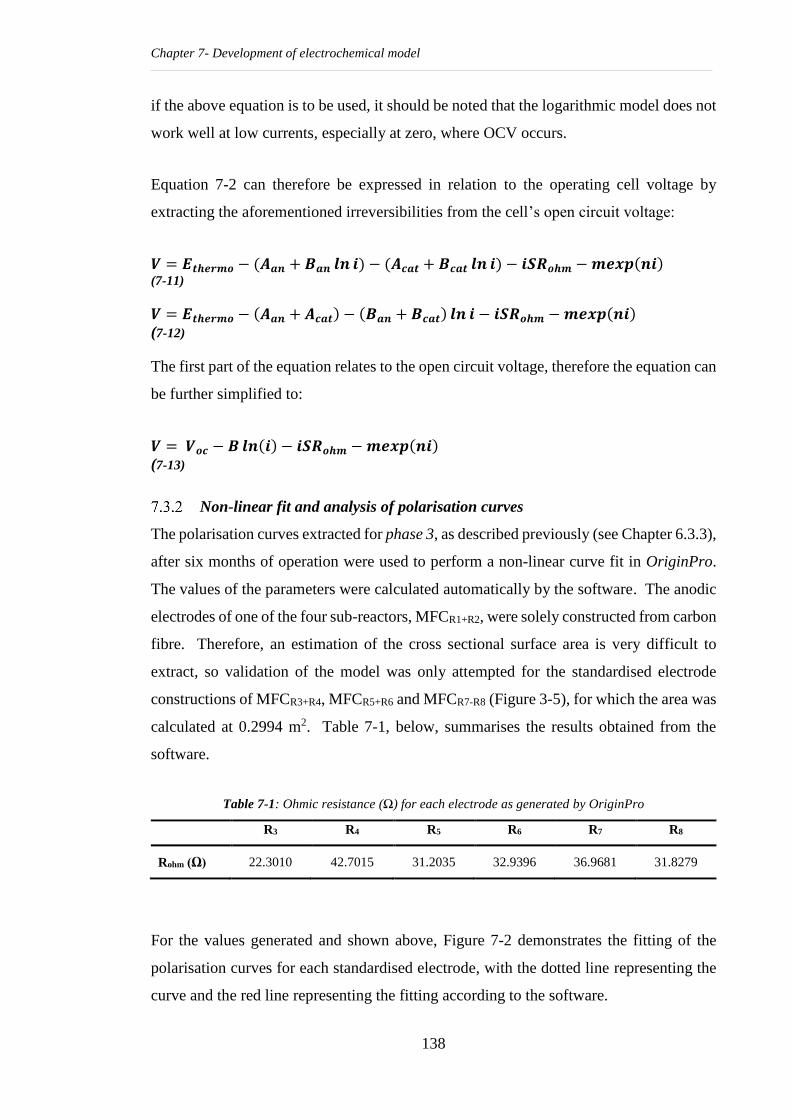
Chapter 7- Development of electrochemical model
138
if the above equation is to be used, it should be noted that the logarithmic model does not
work well at low currents, especially at zero, where OCV occurs.
Equation 7-2 can therefore be expressed in relation to the operating cell voltage by
extracting the aforementioned irreversibilities from the cell’s open circuit voltage:
𝑽 = 𝑬𝒕𝒉𝒆𝒓𝒎𝒐 − (𝑨𝒂𝒏 + 𝑩𝒂𝒏 𝒍𝒏 𝒊) − (𝑨𝒄𝒂𝒕 + 𝑩𝒄𝒂𝒕 𝒍𝒏 𝒊) − 𝒊𝑺𝑹𝒐𝒉𝒎 − 𝒎𝒆𝒙𝒑(𝒏𝒊) (7-11)
𝑽 = 𝑬𝒕𝒉𝒆𝒓𝒎𝒐 − (𝑨𝒂𝒏 + 𝑨𝒄𝒂𝒕) − (𝑩𝒂𝒏 + 𝑩𝒄𝒂𝒕) 𝒍𝒏 𝒊 − 𝒊𝑺𝑹𝒐𝒉𝒎 − 𝒎𝒆𝒙𝒑(𝒏𝒊)
(7-12)
The first part of the equation relates to the open circuit voltage, therefore the equation can
be further simplified to:
𝑽 = 𝑽𝒐𝒄 − 𝑩 𝒍𝒏(𝒊) − 𝒊𝑺𝑹𝒐𝒉𝒎 − 𝒎𝒆𝒙𝒑(𝒏𝒊)
(7-13)
Non-linear fit and analysis of polarisation curves
The polarisation curves extracted for phase 3, as described previously (see Chapter 6.3.3),
after six months of operation were used to perform a non-linear curve fit in OriginPro.
The values of the parameters were calculated automatically by the software. The anodic
electrodes of one of the four sub-reactors, MFCR1+R2, were solely constructed from carbon
fibre. Therefore, an estimation of the cross sectional surface area is very difficult to
extract, so validation of the model was only attempted for the standardised electrode
constructions of MFCR3+R4, MFCR5+R6 and MFCR7-R8 (Figure 3-5), for which the area was
calculated at 0.2994 m2. Table 7-1, below, summarises the results obtained from the
software.
Table 7-1: Ohmic resistance (Ω) for each electrode as generated by OriginPro
R3 R4 R5 R6 R7 R8
Rohm (Ω) 22.3010 42.7015 31.2035 32.9396 36.9681 31.8279
For the values generated and shown above, Figure 7-2 demonstrates the fitting of the
polarisation curves for each standardised electrode, with the dotted line representing the
curve and the red line representing the fitting according to the software.
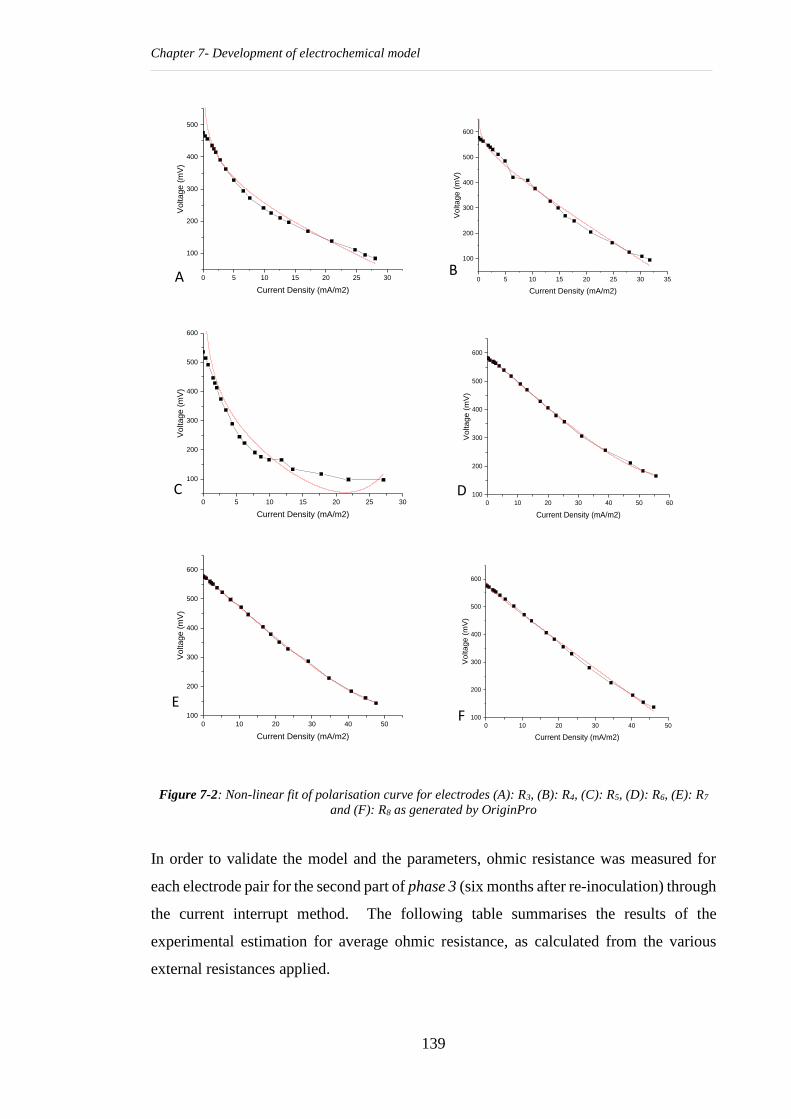
Chapter 7- Development of electrochemical model
139
Figure 7-2: Non-linear fit of polarisation curve for electrodes (A): R3, (B): R4, (C): R5, (D): R6, (E): R7
and (F): R8 as generated by OriginPro
In order to validate the model and the parameters, ohmic resistance was measured for
each electrode pair for the second part of phase 3 (six months after re-inoculation) through
the current interrupt method. The following table summarises the results of the
experimental estimation for average ohmic resistance, as calculated from the various
external resistances applied.
0 5 10 15 20 25 30
100
200
300
400
500
Voltage (
mV
)
Current Density (mA/m2)
0 5 10 15 20 25 30 35
100
200
300
400
500
600
Vo
lta
ge
(m
V)
Current Density (mA/m2)
0 5 10 15 20 25 30
100
200
300
400
500
600
Vo
lta
ge
(m
V)
Current Density (mA/m2)
0 10 20 30 40 50 60
100
200
300
400
500
600
Vo
lta
ge
(m
V)
Current Density (mA/m2)
0 10 20 30 40 50
100
200
300
400
500
600
Voltage (
mV
)
Current Density (mA/m2)
0 10 20 30 40 50
100
200
300
400
500
600
Voltage (
mV
)
Current Density (mA/m2)
A B
C D
E F
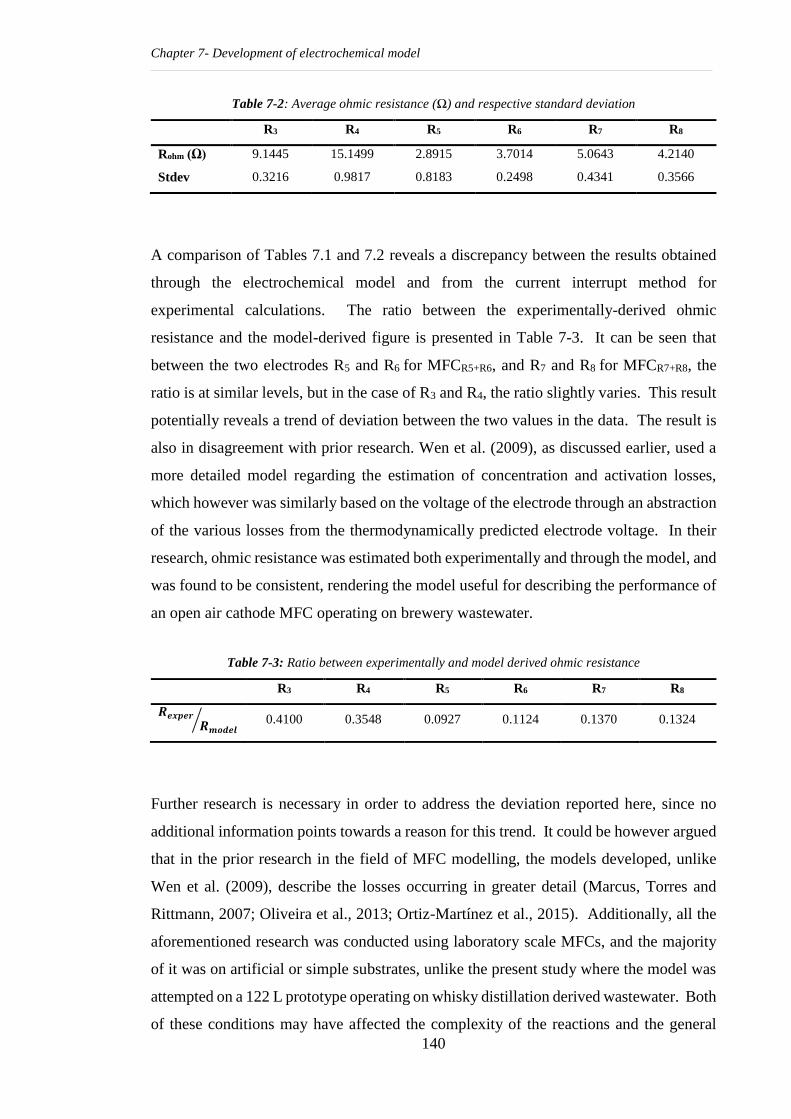
Chapter 7- Development of electrochemical model
140
Table 7-2: Average ohmic resistance (Ω) and respective standard deviation
R3 R4 R5 R6 R7 R8
Rohm (Ω) 9.1445 15.1499 2.8915 3.7014 5.0643 4.2140
Stdev 0.3216 0.9817 0.8183 0.2498 0.4341 0.3566
A comparison of Tables 7.1 and 7.2 reveals a discrepancy between the results obtained
through the electrochemical model and from the current interrupt method for
experimental calculations. The ratio between the experimentally-derived ohmic
resistance and the model-derived figure is presented in Table 7-3. It can be seen that
between the two electrodes R5 and R6 for MFCR5+R6, and R7 and R8 for MFCR7+R8, the
ratio is at similar levels, but in the case of R3 and R4, the ratio slightly varies. This result
potentially reveals a trend of deviation between the two values in the data. The result is
also in disagreement with prior research. Wen et al. (2009), as discussed earlier, used a
more detailed model regarding the estimation of concentration and activation losses,
which however was similarly based on the voltage of the electrode through an abstraction
of the various losses from the thermodynamically predicted electrode voltage. In their
research, ohmic resistance was estimated both experimentally and through the model, and
was found to be consistent, rendering the model useful for describing the performance of
an open air cathode MFC operating on brewery wastewater.
Table 7-3: Ratio between experimentally and model derived ohmic resistance
R3 R4 R5 R6 R7 R8
𝑹𝒆𝒙𝒑𝒆𝒓
𝑹𝒎𝒐𝒅𝒆𝒍⁄ 0.4100 0.3548 0.0927 0.1124 0.1370 0.1324
Further research is necessary in order to address the deviation reported here, since no
additional information points towards a reason for this trend. It could be however argued
that in the prior research in the field of MFC modelling, the models developed, unlike
Wen et al. (2009), describe the losses occurring in greater detail (Marcus, Torres and
Rittmann, 2007; Oliveira et al., 2013; Ortiz-Martínez et al., 2015). Additionally, all the
aforementioned research was conducted using laboratory scale MFCs, and the majority
of it was on artificial or simple substrates, unlike the present study where the model was
attempted on a 122 L prototype operating on whisky distillation derived wastewater. Both
of these conditions may have affected the complexity of the reactions and the general
Chapter 7- Development of electrochemical model
141
interactions occurring in the device, thus rendering the electrochemical model
oversimplified and incapable of describing such a complex system. It is therefore
suggested that the simplicity of the model against the complexity and size of the
application resulted in the deviation identified between the experimental and theoretical
results, indicating that the model was possibly not fit for this purpose.
However, through a further analysis of the part of the polarisation curve used in this
chapter, i.e. the curve of voltage over current density, it can be observed that for electrodes
R4, R6, R7 and R8 the loss observed is ohmic, while there is clearly no evidence of
activation and concentration losses. As discussed in Chapter 2-7 and specifically depicted
in Figure 2-5, ohmic losses occur in medium level current generation and are linear, thus
it is recognised that for these electrodes, it is the only kind of loss present. This kind of
loss is a voltage drop due to the resistance components of the cell, involving both of the
anodic and the cathodic electrodes and their interconnections as well as the resistance to
the flow of ions in the electrolyte and through the exchange membrane (Scott and Hao
Yu, 2015; Larminie and Dicks, 2003).
There are several ways to further reduce ohmic losses and subsequently contribute to the
optimisation of cell performance. Both from the anodic and the cathodic perspective, the
reduction of electrode spacing can lead to lower ohmic losses as this way, protons have a
shorter distance to travel to the cathode, while the orientation of the electrodes has been
investigated as an additional way to achieve ohmic resistance reduction. Additionally,
since ohmic resistance is also related to the interconnections between the electrodes, the
choice of appropriate connecting materials can further contribute to a reduction in internal
resistance (Rismani-Yazdi et al., 2008). Also, with regard to the components of the cell,
optimising the physical properties of the membrane used in order to reduce its inherent
resistance or possibly even working with membrane-less MFCs, could decrease ohmic
losses (Rismani-Yazdi et al., 2008; Larminie and Dicks, 2003). Finally, increasing the
conductivity of both the electrodes and the electrolytes (in the anode and cathode) could
contribute to decreased ohmic losses since the flow of ions would be less hindered
(Rismani-Yazdi et al., 2008; Larminie and Dicks, 2003; Logan et al., 2006).
The picture is slightly different for electrodes R3 and R5. Even though ohmic losses
appear to be similar with the other electrodes, Figure 7-2 shows that this occurs only after
Chapter 7- Development of electrochemical model
142
approximately 10 mA/m2 for both electrodes. Activation losses can be observed up to
that current. These are caused by the slowed reactions taking place on both electrodes,
therefore possible steps for remediation need to be taken for both electrodes. During
lower currents, when activation losses occur, electron transfer is slower (Scott and Hao
Yu, 2015), so the addition of a mediator in the anode and a catalyst in the cathode could
lead to reduction of activation losses. This is because catalysts have been found to
exponentially effect the kinetics of oxygen reduction by decreasing the activation energy
barriers (Rismani-Yazdi et al., 2008b; Wen et al., 2009). In the 122 L prototype, a
mediator had already been impregnated in the anodic electrode. Additionally, in the
122 L prototype the HCl solution used as catholyte during the early stages of this study
was likely to have contributed by enhancing the cathodic reaction. It was used only
during the early stages, but according to these findings, it is suggested that using it again
could lead to reduction of activation losses.
Additionally, an increase of operational temperature of the cell would lead to an increase
of the available thermal energy in the system, thus the reactants would be able to obtain
sufficient energy to reach an activated state. Increasing the concentration of reactants
could lead to a decrease in activation losses (Wen et al., 2009). In the case of the current
study, increasing the concentration of the AD liquid digestate in the anodic compartment
would affect the performance of the cell in a more complicated way, and would therefore
require a more in-depth examination. With regard to the cathode, since the MFC has an
open air construction, increasing the air supply could lead to enhanced cathodic reactions
but additional energy consumption would also be introduced, therefore sustainability and
energy balance considerations would be required. Finally, increasing the possible
reaction sites, which can be achieved by increasing both electrodes’ surface areas, could
optimise activation losses (Wen et al., 2009; Scott and Hao Yu, 2015; Larminie and
Dicks, 2003).
7.4 Chapter conclusions
This chapter represents a further step in analysing the performance of the pilot scale
multi-electrode system developed in this study. A simple electrochemical model
applicable to every fuel cell system has been adapted in order to investigate whether or
not it can be used to describe the performance of the current system. The relevant prior
research during the last few years in the field of MFC modelling (Ortiz-Martínez et al.,
Chapter 7- Development of electrochemical model
143
2015) has demonstrated that the real measurable voltage of an electrode pair can indeed
be calculated by subtracting the various losses from the thermodynamically predicted
voltage. This study has found a deviation between the theoretical and experimental values
of ohmic resistance, while the latter was used as the validation parameter. Therefore, the
conclusion has been reached that the electrochemical model developed in this stage is
unable to accurately describe the performance of the electrodes. The most probable
reason for that lies in the complexity of the developed device against the simplicity of the
model, and further research has therefore been suggested in order to develop a more
detailed, accurate theoretical model that could be used as a cheaper and faster alternative
to experiments in large scale MFCs. The examination of the polarisation curves has
provided an insight into the predominant losses occurring in the electrodes of the multi-
electrode device, and suggestions were made at this final stage of the current research on
how to further optimise the performance of the MFC.
144
Chapter 8 – Thesis conclusions
The overall aim of this study has been to examine the potential of utilising a microbial
fuel cell within the whisky distillation process by integrating a pilot-scale MFC into
existing treatment processes to examine its operation complementary and/or alternatively
to established processes.
The initial approach in the study focused on optimising the performance of a pilot 14 L
plug-flow multi-electrode MFC in relation to electrical connections. The reactor was
constructed in scale to the future 122 L prototype, consisting of two anodes and two
cathodes. Two different electrical connections were implemented: an independent
operation during which the MFC was operated as a multi-electrode construction, and a
parallel connection in which the two anodes were connected between themselves, as were
the cathodes, to construct one united single electrode. The reason for this experiment was
to determine the optimum electrical connection. It was concluded that, either using
polarisation curves or the constant current discharge method, the united electrode (in
parallel connection) led to a higher power output than when the electrodes were operated
as two independent circuits: specifically, the power output during parallel connection was
approximately 37.8 % higher than the recorded power output in independent operation.
Additionally, the MFC was operated on anaerobic digestion liquid digestate, and
demonstrated both a start-up period of 14 to 20 days, which can be considered as an
accelerated start-up given that this stage can last up to 103 days (Wang et al., 2009b), and
a successful maximum tCOD reduction of 81.9±6.2 %, demonstrating the fundamental
ability of an MFC to work in a complementary manner to anaerobic digestion. Finally,
during these first pilot trials, according to the constant discharge method it was found that
the first electrode (in terms of its relative position to the feed) produced higher power
outputs with power being reduced while moving towards the flow of wastewater, which
can be linked to the greater availability of organic matter at the beginning of the feed, in
accordance with prior results presented for a laboratory scale MFC by Ren et al. (2014).
This can be considered as a great step towards more in-depth understanding of large scale
multi-electrode MFCs.
The study then continued with the deployment of the 122 L plug-flow multi-electrode
MFC reactor. The MFC, consisting of 8 independent anode-electrode pairs, was operated
on diluted spent wash, initially achieving a start-up period of 45 days. A rather
Chapter 8 – Thesis conclusions
145
unexpected outcome was observed at this point. As part of the main objective, which was
the realistic deployment of a pilot-scale MFC, one of the key parameters observed was
temperature, and its effect on the start-up and further operation of the reactor were
therefore monitored. During the start-up stage, the ambient temperatures ranged from
approximately 12oC up to a little higher than 16oC, and no correlation was found with an
increase of OCV, a result in line with the recent research suggesting that temperature is
not necessarily a limiting factor for bioelectrochemical systems (Heidrich et al., 2014).
After establishing a successful start-up, the MFC was operated according to the optimised
parallel electrical connection suggested in this study’s previous findings. Current and
power generation were observed to be constant and at high levels throughout the overall
duration of the preliminary studies, similar to the tCOD removal efficiencies achieved.
In order to express energy recovery for the prototype MFC, which is one of the key
aspects of the technology, the normalised energy recovery was calculated and the
prototype reactor was found to produce a positive energy balance. Therefore, it is
concluded that the prototype reactor is capable of sustainably treating whisky distillation
by-products, thus not only achieving energy savings but also contributing towards an
additional energy output. At this point, a positive correlation was observed between the
level of energy recovered and temperature, meaning that an increase in operational
temperature can lead to an increase in energy recovery. Overall, it appears that
temperature does not affect the principle of electricity generation in an MFC allowing for
start-up, regardless of the environmental conditions, possibly it instead slows down its
development, but upon achievement of a steady state, the MFC is concluded to have a
behaviour similar to biological technologies affected by operational temperature (Gerardi,
2003; Jadhav and Ghangrekar, 2009).
As part of the industrial deployment of the technology, a refurbishment protocol was
established which includes the harvesting of biomass, the addressing of bio fouling on the
cathode surface, electrodes maintenance, and the retro-fit of the 122 L reactor into two
sub-reactors to examine reproducibility. The protocol was deployed successfully, moving
to the next stage of operation when the serial transfusions of microbial inoculum
(previously adapted in the MFC similarly fed with anaerobic digestion liquid digestate
for more than 60 days) led to an enhanced start-up process which was now minimized to
last only 5 days. Further optimization of the operational parameters was attempted and
the hydraulic retention time was proven to be capable in principle of further reduction,
Chapter 8 – Thesis conclusions
146
form 4 days down to 24 hours. Interestingly, this study finds that similar levels of power
were reported during the reduced HRT as during the longer HRT, so the inability of the
reactor to utilize the additional organic input into the system for electricity generation led
to negative energy balances, suggesting that additional energy input is required for the
treatment of the waste. However, due to the high costs associated with aeration, the
technology studied here is still capable of energy savings. Finally, the outcomes
regarding the nutrients in the system such as sulphates, phosphates and nitrates were
inconclusive.
Up to this point, the plug-flow MFC achieved promising performance when operating
both on effluent before the AD and after the AD process. The research went on to
examine the integration of MFC technology within an existing treatment process in a local
whisky distillery. The pilot layout consisting of two duplicate 122 L reactors, each of
which was further equally divided into two sub-reactors, was deployed to operate in a
complementary way to anaerobic digestion. The utilization of the adapted biomass, as
previously linked to the lower start-up period, was similarly achieved. Interestingly at
this point, two major observations were drawn: firstly, that MFCR1+R2 and MFCR3+R4
within the first 122 L reactor demonstrated almost identical results regarding electrical
performance, with similar results found between them regarding tCOD removal
efficiency, as did MFCR5+R6 and MFCR7+R8 within the second 122 L reactor. However,
the second major observation was that when compared on a reactor level, the performance
was not similar as expected. Additionally, only MFCR5+R6 and MFCR7+R8 seemed to
follow the pattern dictated by the findings in the 14 L reactor at the beginning of this
study, according to which the first electrode (in terms of its relative position to the influent
feed) produced a higher power output than the following electrodes due to having access
to a greater amount of organic feed. When the hydraulic retention time was further
reduced down to 24 hours, two additional major outcomes were drawn; on the one hand,
the adaptation to the new organic load exhibited an increase similar to a microbial growth
curve, possibly linked to the increase of electrogens. On the other hand, beyond this
initial increase, the system’s stability was compromised for the remainder of the
experimental period in terms of electrical performance and tCOD reduction.
During the latter phase of this study, further optimization regarding the anodic materials
was examined. Additionally, having established the fundamental ability of the prototype
Chapter 8 – Thesis conclusions
147
to be used in a complementary manner to AD, the final issue addressed here was how
long the performance of the pilot installation would remain sustainable before being
prohibitively impaired by time and physical deterioration. A comparative study between
an anodic electrode made entirely of carbon fiber against the standard graphite granule-
based construction highlighted the greater potential of the second type with regard to
voltage output, concluding that the complex construction graphite granule-based
electrode is more suitable for the current development. The long term performance and
relative failure of the reactors was examined using two different approaches during this
last phase; power curves traced power output over current generated, and the constant
discharge method over time was also employed. Interestingly, the fiber anodes exhibited
minimal deterioration after six months, and in another case even achieved an increased
maximum power after six months, prompting a question regarding more favorable
microbial adhesion. However, even in the case of an increase in the maximum power
output after six months, the newly achieved level was still at least 50 % lower than the
maximum power output achievable through the complex graphite granule construction.
The comparative study based on the power curves of the complex electrodes revealed a
considerable deterioration of the power output for every electrode, in the most extreme
case from 7.01 mW down to 0.79 mW, an approximate 88.7 % reduction within six
months.
According to the constant discharge monitoring, the power over time profile revealed a
considerably fluctuating performance, which has been linked to the galvanic current
generated due to the significant deterioration of the materials involved, which can be
addressed in the future with a more appropriate materials selection and maintenance
intervention, as was used in this study. Further, concerning electrical performance, apart
from the relative failure over the last six months of operation, the prototype reactors
interestingly exhibited an ability to maintain their electrogenic potential even in adverse
conditions of starvation. An approximately 15-day long starvation of the MFCs was
found not to have affected the electrical power output of the reactors, highlighting their
potential for use in remote access areas, and as ancillary electricity producing equipment
in adverse environments.
Finally, concerning wastewater treatment both in relation to total suspended solids and
total COD, the prototype reactors were shown to be able to maintain their efficiency over
Chapter 8 – Thesis conclusions
148
time with no notable system failures. The final tCOD effluent concentrations might not
have thrived as much as they did in other studies, but the current study has certainly
demonstrated the ability of a pilot scale MFC to be integrated into an industrial
wastewater treatment process, and its potential to be used as an integral part of a total
treatment solution.
The above comments conclude the experimental work carried out for this study, which in
its latter phase went on a step further than integration into the development and
application of a simple electrochemical model. It was concluded that there is a deviation
between the theoretical and experimental values chosen as the validation parameter, and
therefore the electrochemical model which has been developed to this stage is not
currently able to accurately describe the performance of the electrodes.
From an overall perspective, this study has shed light onto the application and integration
of microbial fuel cells in real industrial environments. In the majority of the research
performed to date, MFCs have been considered as a stand-alone technology for
wastewater treatment. In contrast to that perspective, the present study has provided proof
on a larger scale that MFC technology operating in a complementary manner to anaerobic
digestion should be considered as an energy efficient, if not energy producing, alternative
to energy-intense treatment options such as aerobic treatments. As hopeful as that finding
might be for the field of MFCs, the technology has still a long way to go before it can be
deployed on a level comparable to these technologies; therefore, future research has a
very important role to play in making that happen.
149
Chapter 9 – Future research and recommendations
This study set out to examine the performance of a pilot scale multi-electrode MFC in the
context of the treatment of whisky distillation process by-products. Various aspects of
its electrical performance and effluent treatment capabilities were examined and several
outcomes were drawn throughout this journey. However, the current study has also raised
some new questions, which are set out at this point as a continuation of the current work
in order to conclusively outline the issues discovered here regarding the performance of
MFCs.
Chapter 4: During the preliminary experiments involving the 14 L reactor it was found
that the parallel connection of two electrodes is capable of producing higher power
outputs. However, the effect of this electrical connection on tCOD removal efficiency
was inconclusive. The parameter was only examined at the rear of the reactor, but in
order to study the effect of connections on the MFC in more depth, a sampling point at
the end of each electrode would be necessary.
Chapter 5: Due to the conclusions drawn from the previous chapter, every two
neighbouring anodes and cathodes in the 122 L reactor were connected in parallel,
resulting into the reactor having four coupled electrodes. One main question rose at this
point from that decision. Would connecting all eight originally independent sets of
anodes and cathodes result in an overall higher power output, or not? A comparative
study between a multi-electrode MFC in which all electrodes are connected in parallel,
and a multi-electrode MFC in which only some electrodes are connected in parallel could
possibly provide an optimised system that could be further scaled-up. Regarding the
outcomes of this chapter, it was found that unlike previous suggestions made by this
research and by a relevant recent study of Ren et al. (2014), in the 122 L multi-electrode
reactor, power outputs from every electrode, both in independent and parallel
connections, were found to be at similar levels. Electrodes were not found to follow the
rationale according to which a poorer availability of organics moving from the front rear
to the back is expected to lead to lower power outputs. Therefore, examination of the
carbon content levels in every compartment with an electrode and characterisation of the
microbial composition again inn every anodic compartment could possibly provide a
better understanding of why the gradual decrease in power outputs was observed in the
14 L reactor, but not for the 122 L reactor.
Chapter 9 – Future research and recommendations
150
The effect of temperature on the overall performance of the reactor could be described as
contradictory, in that temperature was not found to affect the start-up process but instead
to positively affect energy recovery during regular operation. Therefore, a closer
examination of temperature would be expected to provide further insight on optimisation.
Prior research has produced similarly contradictory results regarding the correlation
between these two parameters (Jadhav and Ghangrekar, 2009; Catal et al., 2011; Heidrich
et al., 2014). It is therefore suggested that an additional heating element should be
examined. The MFC system up to this point was found to produce a positive energy
balance, thus it is also suggested for the additional heating element’s energy consumption
to be included in balance calculations in order to also examine whether higher power
outputs possibly offset the energy required by the heating element.
A further reduction in hydraulic retention time through an increased influent flow rate
seemed to create a negative energy balance, essentially meaning that more energy is put
into the system for treatment than the amount of energy recovered through electricity
generation. Given that tCOD removal efficiency was found to be unaffected by this
decrease in HRT, further research is necessary in order to identify the microbial metabolic
pathways that contribute to activities other than electrogenesis.
Chapter 6: During this stage actual integration of the pilot was carried out in an industrial
environment. Issues associated with blockages, connectivity and other practical
hindrances should be resolved in future application. However, this is believed to be an
issue relatively easy to overcome due to industrial knowledge available.
Regarding the first stage of integration, it has been noted that the reduction of HRT from
four days to 24 hours resulted on the one hand in an electrical behaviour similar to a
standard microbial growth curve, and on the other hand, to a relatively unsteady reactor.
It is therefore proposed that future similar experiments should include a process of
identification of the microbial species responsible for electrogenic activity and their
enumeration in order to directly correlate electrical trends to microbial growth. In relation
to fluctuating performance, the need for more time for adaptation is a possible corrective
action. However, closer investigation regarding the correlation between influent organic
loading rate, detailed chemical characterisation of the influent wastewater stream and
electrical outputs could provide a clearer image of the fluctuation pattern.
Chapter 9 – Future research and recommendations
151
Regarding the latter phase of experimentation, suggestions for future research relating to
materials and the structural approach to be adopted arise. The graphite brush has been
found to be effective mostly due to its increased surface area that allows better microbial
adhesion and more points of reaction (Logan et al., 2007; Lanas and Logan, 2013). It is
therefore, suggested that it is examined in a comparative study with the existing complex
graphite granule-based electrode, which could reveal a further point of optimisation. The
cathode used in this study was an optimised construction developed to combine the
advantages of the open air cathode while maintaining the input of an electrolyte to
enhance oxygen reduction. However, alternative materials can be examined also for the
cathode while keeping cost low. Regarding the design of the overall unit and keeping in
mind the open air cathode element, optimisation through design alterations is suggested.
This reactor in the present study was developed as a plug-flow multi-electrode MFC with
a serpentine internal liquid flow. However, incorporating the cathode and an optimised
anode into different designs, such as tubular or spiral design, could produce an even better
performing design which may possibly be more suitable for scaling-up.
This chapter intended to achieve the potential of integration of MFC technology into an
existing treatment process. During this phase the MFC was operated in a complementary
manner to an anaerobic digester, and the feasibility of this was demonstrated, but
additional treatment was found to be necessary in order to provide holistic treatment
options. Therefore, it is suggested that additional treatment options are examined
downstream of an MFC to achieve discharge adhering to the environment limits set on a
UK and EU level, if not solely to reduce costs from discharge to sewer.
Chapter 7: In this chapter the simple electrochemical model used was not conclusively
validated through experimental work. The reason behind that was hypothesised to have
been its oversimplified nature. The development of a more detailed set of equations is
necessary to accurately describe the performance of a multi-electrode reactor. Research
should include the identification and accurate estimation of the parameters in greater
detail. Additionally, the inclusion of microbial kinetics in the model and thus, the
development of a holistic model taking that aspect also into consideration, would lead to
a better defined model able to more accurately demonstrate an MFC’s functions.
Chapter 9 – Future research and recommendations
152
Further recommendations: From an overall perspective, due to economic constraints, a
full chemical characterisation of waste streams was not possible over the long term in this
study. However, this is highly recommended in any future studies performed on the
prototype. A complete chemical characterisation would provide a holistic overview of
the components present and would possibly identify those elements which might be
inhibitory to electrogenesis and/or treatment. Within this frame, throughout this study
some parameters of effluent quality were closely and continuously monitored, but some
secondary parameters, such as phosphates, nitrates and sulphates, were only examined
sporadically. It is therefore suggested that future applications of this prototype monitor
the cycle of nitrogen, phosphorus and sulphur from the point of waste generation to the
final discharge point. Even though such parameters are not strictly regulated, their
examination could provide a more detailed picture of the processes occurring in an MFC,
and might identify the metabolic pathways which are antagonistic to electrogenesis. For
instance, much more carbon was found to be consumed for sulphate reduction than is
utilised in electricity generation in a study by Zhang et al. (2013b). Therefore, it would
be worthwhile examining whether the suppression of this pathway would lead to higher
power outputs.
Possibly one of the greatest inefficiencies in the current flat plate reactor was identified
as the collection, characterisation and utilisation of the possible gas produced in the
anodic compartment. According to recent relevant research by Ge et al. (2013), and given
that an originally anaerobic granular biomass was used as inoculum in this study, any gas
generated would mostly be expected to be methane. Therefore, two main experimental
suggestions are made here: firstly, the consideration of an alternative MFC design, such
as a tubular reactor, and its relative position could help with the gas potentially produced
in future experiments. The second suggestion relates to temperature and its effect on
methanogenesis and electrogenesis in the MFC reactor. As was described in the literature
review, lower temperatures are associated with the suppression of methanogenesis. It
would therefore be interesting to examine how the addition of a heating element would
affect electrogenesis, but also the production of methane. Optimum energy recovery from
the current and any future designs might lie in a combination of the two processes rather
than the absolute suppression of the latter in order to promote the former.

Chapter 9 – Future research and recommendations
153
Regarding operational parameters, some further improvements to the system might lead
to higher levels of energy recovery while maintaining treatment efficiency. Introducing
the recirculation of the treated effluent and/or hydraulically connecting two reactors has
been found to affect energy recovery and tCOD removal efficiency (Winfield et al., 2011;
Jacobson, Kelly and He, 2015). Additionally, the examination of continuous, batch and
semi-batch operational modes would be beneficial in determining the optimum
operational conditions, especially for the current design of the multi-electrode reactor.
154
List of references
Aelterman, P., Rabaey, K., Clauwaert, P. and Verstraete, W., 2006. Microbial fuel cells
for wastewater treatment. Water Science & Technology, 54(8), pp.9–15.
Aelterman, P., Versichele, M., Marzorati, M., Boon, N. and Verstraete, W., 2008.
Loading rate and external resistance control the electricity generation of microbial fuel
cells with different three-dimensional anodes. Bioresource Technology, 99, pp.8895–
8902.
Ahn, Y. and Logan, B.E., 2010. Effectiveness of domestic wastewater treatment using
microbial fuel cells at ambient and mesophilic temperatures. Bioresource Technology,
101, pp.469–475.
Aldrovandi, A., Marsili, E., Paganin, P., Tabacchioni, S. and Giordano, A., 2009.
Sustainable power production in a memrane-less and mediator-less syntetic wastewater
microbial fuel cell. Bioresource Technology, 100, pp.3252–3260.
Allen, R.M. and Bennetto, H.P., 1993. Microbial fuel-cells. Applied Biochemistry and
Biotechnology, 39(1), pp.27–40.
Ammary, B.Y., 2004. Nutrients requirements in biological industrial wastewater
treatment. African Journal of Biotechnology, 3(4), pp.236–238.
APHA, 1998. Standard Methods for the Examination of Water and Wastewater. Standard
Methods. Washington DC.: APHA.
Appels, L., Baeyens, J., Degrève, J. and Dewil, R., 2008. Principles and potential of the
anaerobic digestion of waste-activated sludge. Progress in Energy and Combustion
Science, 34, pp.755–781.
Bond, D.R. and Lovley, D.R., 2003. Electricity Production by Geobacter sulfurreducens
Attached to Electrodes Electricity Production by Geobacter sulfurreducens Attached to
Electrodes. Applied and Environmental Microbiology, 69(3), pp.1548–1555.
Bowen, E.J., Dolfing, J., Davenport, R.J., Read, F.L. and Curtis, T.P., 2014. Low-
temperature limitation of bioreactor sludge in anaerobic treatment of domestic
wastewater. Water Science and Technology, 69(5), pp.1004–1013.
Burkitt, R., Whiffen, T.R. and Yu, E.H., 2016. Iron phthalocyanine and MnOx composite
catalysts for microbial fuel cell applications. Applied Catalysis B: Environmental, 181,
pp.279–288.
Caffoor, I., 2008. Energy Efficient Water and Wastewater Treatment. Environmental
Knowledge Transfer Networks.
Canfield, J.H., Goldner, B.H. and Lutwack, R., 1963. NASA Technical report. Magna
Corporation, Anaheim, CA.
Catal, T., Kavanagh, P., O’Flaherty, V. and Leech, D., 2011. Generation of electricity in
microbial fuel cells at sub-ambient temperatures. Journal of Power Sources, 196,
pp.2676–2681.
Catal, T., Xu, S., Li, K., Bermek, H. and Liu, H., 2008. Electricity generation from
polyalcohols in single-chamber microbial fuel cells. Biosensors and Bioelectronics,
24(4), pp.849–854.
Cerrillo, M., Oliveras, J., Viñas, M. and Bonmatí, A., 2016. Comparative assessment of
raw and digested pig slurry treatment in bioelectrochemical systems.
Bioelectrochemistry, 110, pp.69–78.
155
Chae, K.J., Choi, M.J., Lee, J.W., Kim, K.Y. and Kim, I.S., 2009. Effect of different
substrates on the performance, bacterial diversity, and bacterial viability in microbial fuel
cells. Bioresource Technology, 100, pp.3518–3525.
Chaudhuri, S.K. and Lovley, D.R., 2003. Electricity generation by direct oxidation of
glucose in mediatorless microbial fuel cells. Nature Biotechnology, 21, pp.1229–1232.
Chen, Y.M., Wang, C.T., Yang, Y.C. and Chen, W.J., 2013. Application of aluminum-
alloy mesh composite carbon cloth for the design of anode/cathode electrodes in
Escherichia coli microbial fuel cell. International Journal of Hydrogen Energy, 38,
pp.11131–11137.
Cheng, K.Y., Ho, G. and Cord-Ruwisch, R., 2012. Energy-efficient treatment of organic
wastewater streams using a rotatable bioelectrochemical contactor (RBEC). Bioresource
Technology, 126, pp.431–436.
Cheng, S., Liu, H. and Logan, B.E., 2006a. Increased performance of single-chamber
microbial fuel cells using an improved cathode structure. Electrochemistry
Communications, 8, pp.489–494.
Cheng, S., Liu, H. and Logan, B.E., 2006b. Power densities using different cathode
catalysts (Pt and CoTMPP) and polymer binders (Nafion and PTFE) in single chamber
microbial fuel cells. Environmental Science and Technology, 40, pp.364–369.
Cheng, S. and Logan, B.E., 2011. Increasing power generation for scaling up single-
chamber air cathode microbial fuel cells. Bioresource Technology, 102, pp.4468–4473.
Clauwaert, P., Mulenga, S., Aelterman, P. and Verstraete, W., 2009. Litre-scale microbial
fuel cells operated in a complete loop. Applied Microbiology and Biotechnology, 83,
pp.241–247.
Cohen, B., 1930. The bacterial culture as an electrical half-cell. Journal of Bacteriology,
21(1), pp.18–19.
Corcoran, E., Nellemann, C., Baker, E., Bos, R., Osborn, D., Savelli, H., 2010. Sick
Water ? the Central Role of Wastewater Management in Sustainable Development.
United Nations Environment Programme.
Correll, D.L., 1998. The Role of Phosphorus in the Eutrophication of Receiving Waters:
A Review. Journal of Environment Quality, 27, pp.261–266.
Cusick, R.D., Bryan, B., Parker, D.S., Merrill, M.D., Mehanna, M., Kiely, P.D., Liu, G.
and Logan, B.E., 2011. Performance of a pilot-scale continuous flow microbial
electrolysis cell fed winery wastewater. Applied Microbiology and Biotechnology, 89,
pp.2053–2063.
Daud, S.M., Kim, B.H., Ghasemi, M. and Daud, W.R.W., 2015. Separators used in
microbial electrochemical technologies: Current status and future prospects. Bioresource
Technology, 195, pp.170–179.
DEFRA, 2012. Waste water treatment in the United Kingdom. London.
Dekker, A., Heijne, A. Ter, Saakes, M., Hamelers, H.V.M. and Buisman, C.J.N., 2009.
Analysis and Improvement of a Scaled-Up and Stacked Microbial Fuel Cell.
Environmental Science & Technology, 43(23), pp.9038–9042.
Dewan, A., Beyenal, H. and Lewandowski, Z., 2008. Scaling up Microbial Fuel Cells.
Environmental Science & Technology, 42(20), pp.7643–7648.
156
Dong, Y., Qu, Y., He, W., Du, Y., Liu, J., Han, X. and Feng, Y., 2015. A 90-liter stackable
baffled microbial fuel cell for brewery wastewater treatment based on energy self-
sufficient mode. Bioresource Technology, 195, pp.66–72.
Du, Z., Li, H. and Gu, T., 2007. A state of the art review on microbial fuel cells: A
promising technology for wastewater treatment and bioenergy. Biotechnology Advances,
25, pp.464–482.
Du, Z., Li, Q., Tong, M., Li, S. and Li, H., 2008. Electricity Generation Using Membrane-
less Microbial Fuel Cell during Wastewater Treatment. Chinese Journal of Chemical
Engineering, 16(5), pp.772–777.
Dumas, C., Basséguy, R. and Bergel, A., 2008. Microbial electrocatalysis with Geobacter
sulfurreducens biofilm on stainless steel cathodes. Electrochimica Acta, 53, pp.2494–
2500.
Dumas, C., Mollica, A., Féron, D., Basséguy, R., Etcheverry, L. and Bergel, A., 2007.
Marine microbial fuel cell: Use of stainless steel electrodes as anode and cathode
materials. Electrochimica Acta, 53, pp.468–473.
Fedorovich, V., Varfolomeev, S.D., Sizov, A. and Goryanin, I., 2009. Multi-electrode
microbial fuel cell with horizontal liquid flow. Water Science and Technology, 60(2),
pp.347–355.
Fedorovich, V., 2012. Microbial fuel cell assembly. EP 2225790 B1.
Feng, Y., He, W., Liu, J., Wang, X., Qu, Y. and Ren, N., 2014. A horizontal plug flow
and stackable pilot microbial fuel cell for municipal wastewater treatment. Bioresource
Technology, 156, pp.132–138.
Feng, Y., Wang, X., Logan, B.E. and Lee, H., 2008. Brewery wastewater treatment using
air-cathode microbial fuel cells. Applied Microbiology and Biotechnology, 78, pp.873–
880.
Feng, Y., Yang, Q., Wang, X. and Logan, B.E., 2010. Treatment of carbon fiber brush
anodes for improving power generation in air-cathode microbial fuel cells. Journal of
Power Sources, 195, pp.1841–1844.
Franks, A.E., Malvankar, N. and Nevin, K.P., 2010. Bacterial biofilms: the powerhouse
of a microbial fuel cell. Biofuels, 1(4), pp.589–604.
Freguia, S., Rabaey, K., Yuan, Z. and Keller, J., 2007. Non-catalyzed cathodic oxygen
reduction at graphite granules in microbial fuel cells. Electrochimica Acta, 53, pp.598–
603.
Gajda, I., Greenman, J., Melhuish, C. and Ieropoulos, I., 2015. Self-sustainable electricity
production from algae grown in a microbial fuel cell system. Biomass and Bioenergy, 82,
pp.87–93.
Gálvez, A., Greenman, J. and Ieropoulos, I., 2009. Landfill leachate treatment with
microbial fuel cells; scale-up through plurality. Bioresource Technology, 100, pp.5085–
5091.
Gao, C., Wang, A., Wu, W.M., Yin, Y. and Zhao, Y.G., 2014. Enrichment of anodic
biofilm inoculated with anaerobic or aerobic sludge in single chambered air-cathode
microbial fuel cells. Bioresource Technology, 167, pp.124–132.
Ge, Z. and He, Z., 2016. Long-term Performance of a 200-Liter Modularized Microbial
Fuel Cell System Treating Municipal Wastewater: Treatment, Energy, and Cost.
Environmental Science: Water Research and Technology, 2, pp.274–281.
157
Ge, Z., Li, J., Xiao, L., Tong, Y. and He, Z., 2014. Recovery of Electrical Energy in
Microbial Fuel Cells. Environmental Science & Technology Letters, 1, pp.137–141.
Ge, Z., Zhang, F., Grimaud, J., Hurst, J. and He, Z., 2013. Long-term investigation of
microbial fuel cells treating primary sludge or digested sludge. Bioresource Technology,
136, pp.509–514.
Gerardi, M.H., 2003. The Microbiology of Anaerobic Digesters. Vasa. Willey.
Ghangrekar, M.M. and Shinde, V.B., 2007. Performance of membrane-less microbial fuel
cell treating wastewater and effect of electrode distance and area on electricity production.
Bioresource Technology, 98(15), pp.2879–2885.
Goodwin, J.A.S., Finlayson, J.M. and Low, E.W., 2001. A further study of the anaerobic
biotreatment of malt whisky distillery pot ale using an UASB system. Bioresource
Technology, 78(2), pp.155–160.
Goodwin, J.A.S. and Stuart, J.B., 1994. Anaerobic digestion of malt whisky distillery pot
ale using upflow anaerobic sludge blanket reactors. Bioresource Technology, 49, pp.75–
81.
Greenman, J., Gálvez, A., Giusti, L. and Ieropoulos, I., 2009. Electricity from landfill
leachate using microbial fuel cells: Comparison with a biological aerated filter. Enzyme
and Microbial Technology, 44(2), pp.112–119.
Gude, V.G., Kokabian, B. and Gadhamshetty, V., 2013. Beneficial bioelectrochemical
systems for energy, water, and biomass production. Journal of Microbial & Biochemical
Technology, S6(005), pp.1–14.
Gude, V.G., 2015. Energy and water autarky of wastewater treatment and power
generation systems. Renewable and Sustainable Energy Reviews, 45, pp.52–68.
Gude, V.G., 2016. Wastewater treatment in microbial fuel cells - An overview. Journal
of Cleaner Production, pp.1–21.
Ha, P.T., Lee, T.K., Rittmann, B.E., Park, J. and Chang, I.S., 2012. Treatment of Alcohol
Distillery Wastewater Using a Bacteroidetes-Dominant Thermophilic Microbial Fuel
Cell. Environmental science & technology, 45(5), pp.3022–3030.
Ha, P.T., Tae, B. and Chang, I.S., 2008. Performance and bacterial consortium of
microbial fuel cell fed with formate. Energy and Fuels, 22, pp.164–168.
Habermann, W. and Pommer, E.H., 1991. Biological fuel cells with sulphide storage
capacity. Applied Microbiology and Biotechnology, 35(1), pp.128–133.
HaoYu, E., Cheng, S., Scott, K. and Logan, B., 2007. Microbial fuel cell performance
with non-Pt cathode catalysts. Journal of Power Sources, 171, pp.275–281.
He, Z., Minteer, S.D. and Angenent, L.T., 2005. Electricity generation from artificial
wastewater using an upflow microbial fuel cell. Environmental Science and Technology,
39, pp.5262–5267.
He, Z., 2013. Microbial Fuel Cells: Now Let us Talk about Energy. Environmental
science & technology, 47, pp.332–333.
Heidrich, E., Curtis, T. and Dolfing, J., 2015. Determination of the Internal Chemical
Energy of Wastewater Determination of the Internal Chemical Energy of Wastewater. 45,
pp.827–832.
158
Heidrich, E.S., Edwards, S.R., Dolfing, J., Cotterill, S.E. and Curtis, T.P., 2014.
Performance of a pilot scale microbial electrolysis cell fed on domestic wastewater at
ambient temperatures for a 12month period. Bioresource Technology, 173, pp.87–95.
ter Heijne, A., Hamelers, H.V.M., Saakes, M. and Buisman, C.J.N., 2008. Performance
of non-porous graphite and titanium-based anodes in microbial fuel cells. Electrochimica
Acta, 53, pp.5697–5703.
ter Heijne, A., Liu, F., Van Rijnsoever, L.S., Saakes, M., Hamelers, H.V.M. and Buisman,
C.J.N., 2011. Performance of a scaled-up Microbial Fuel Cell with iron reduction as the
cathode reaction. Journal of Power Sources, 196, pp.7572–7577.
Hernández-Fernández, F.J., Pérez De Los Ríos, A., Salar-García, M.J., Ortiz-Martínez,
V.M., Lozano-Blanco, L.J., Godínez, C., Tomás-Alonso, F. and Quesada-Medina, J.,
2015a. Recent progress and perspectives in microbial fuel cells for bioenergy generation
and wastewater treatment. Fuel Processing Technology, 138, pp.284–297.
Hernández-Fernández, F.J., Pérez De Los Ríos, A., Salar-García, M.J., Ortiz-Martínez,
V.M., Lozano-Blanco, L.J., Godínez, C., Tomás-Alonso, F. and Quesada-Medina, J.,
2015b. Recent progress and perspectives in microbial fuel cells for bioenergy generation
and wastewater treatment. Fuel Processing Technology, 138, pp.284–297.
Hiegemann, H., Herzer, D., Nettmann, E., Lübken, M., Schulte, P., Schmelz, K.-G.,
Gredigk-Hoffmann, S. and Wichern, M., 2016. An integrated 45L pilot microbial fuel
cell system at a full-scale wastewater treatment plant. Bioresource Technology, 218,
pp.115–122.
Hou, Q., Nie, C., Pei, H., Hu, W., Jiang, L. and Yang, Z., 2016. The effect of algae species
on the bioelectricity and biodiesel generation through open-air cathode microbial fuel cell
with kitchen waste anaerobically digested effluent as substrate. Bioresource Technology,
218, pp.902–908.
Hutchinson, A.J., Tokash, J.C. and Logan, B.E., 2011. Analysis of carbon fiber brush
loading in anodes on startup and performance of microbial fuel cells. Journal of Power
Sources, 196, pp.9213–9219.
Ieropoulos, I., Greenman, J., Melhuish, C. and Hart, J., 2005. Energy accumulation and
improved performance in microbial fuel cells. Journal of Power Sources, 145, pp.253–
256.
Jacobson, K.S., Kelly, P.T. and He, Z., 2015. Energy Balance Affected by Electrolyte
Recirculation and Operating Modes in Microbial Fuel Cells. Water Environment
Research, 87(3), pp.252–257.
Jadhav, G.S. and Ghangrekar, M.M., 2009. Performance of microbial fuel cell subjected
to variation in pH, temperature, external load and substrate concentration. Bioresource
Technology, 100, pp.717–723.
Janicek, A., Fan, Y. and Liu, H., 2014. Design of microbial fuel cells for practical
application: a review and analysis of scale-up studies. Biofuels, 5(1), pp.79–92.
Jiang, D., Curtis, M., Troop, E., Scheible, K., McGrath, J., Hu, B., Suib, S., Raymond, D.
and Li, B., 2011. A pilot-scale study on utilizing multi-anode/cathode microbial fuel cells
(MAC MFCs) to enhance the power production in wastewater treatment. International
Journal of Hydrogen Energy, 36, pp.876–884.
Jiang, D. and Li, B., 2009. Granular activated carbon single-chamber microbial fuel cells
(GAC-SCMFCs): A design suitable for large-scale wastewater treatment processes.
Biochemical Engineering Journal, 47, pp.31–37.
159
Kalathil, S., Lee, J. and Cho, M.H., 2011. Granular activated carbon based microbial fuel
cell for simultaneous decolorization of real dye wastewater and electricity generation.
New Biotechnology, 29(1), pp.32–37.
Kargi, F. and Eker, S., 2007. Electricity generation with simultaneous wastewater
treatment by a microbial fuel cell (MFC) with Cu and Cu-Au electrodes. Journal of
Chemical Technology and Biotechnology, 82, pp.658–662.
Karra, U., Troop, E., Curtis, M., Scheible, K., Tenaglier, C., Patel, N. and Li, B., 2013.
Performance of plug flow microbial fuel cell (PF-MFC) and complete mixing microbial
fuel cell (CM-MFC) for wastewater treatment and power generation. International
Journal of Hydrogen Energy, 38, pp.5383–5388.
Kelly, P.T. and He, Z., 2014. Understanding the application niche of microbial fuel cells
in a cheese wastewater treatment process. Bioresource Technology, 157, pp.154–160.
Kim, B.H., Park, H.S., Kim, H.J., Kim, G.T., Chang, I.S., Lee, J. and Phung, N.T., 2004.
Enrichment of microbial community generating electricity using a fuel-cell-type
electrochemical cell. Applied Microbiology and Biotechnology, 63, pp.672–681.
Kim, H.J., Hyun, M.S., Chang, I.S. and Kim, B.H., 1999. A microbial fuel cell type lactate
biosensor using a metal-reducing bacterium, Shewanella putrefaciens. Journal of
Microbiology and Biotechnology, 9(3), pp.365–367.
Kim, J.R., Kim, J.R., Cheng, S., Cheng, S., Oh, S.-E., Oh, S.-E., Logan, B.E. and Logan,
B.E., 2007. Power generation using different cation, anion, and ultrafiltration membranes
in microbial fuel cells. Environmental Science and Technology, 41(3), pp.1004–9.
Kim, T., An, J., Jang, J.K. and Chang, I.S., 2015. Coupling of anaerobic digester and
microbial fuel cell for COD removal and ammonia recovery. Bioresource Technology,
195, pp.217–222.
Lanas, V., Ahn, Y. and Logan, B.E., 2014. Effects of carbon brush anode size and loading
on microbial fuel cell performance in batch and continuous mode. Journal of Power
Sources, 247, pp.228–234.
Lanas, V. and Logan, B.E., 2013. Evaluation of multi-brush anode systems in microbial
fuel cells. Bioresource Technology, 148, pp.379–385.
Larminie, J. and Dicks, A., 2003. Fuel cells systems explained. 2nd ed. ed. Chichester:
John Wiley & Sons Ltd.
Larrosa-Guerrero, A., Scott, K., Head, I.M., Mateo, F., Ginesta, A. and Godinez, C., 2010.
Effect of temperature on the performance of microbial fuel cells. Fuel, 89, pp.3985–3994.
Lee, H.S., Parameswaran, P., Kato-Marcus, A., Torres, C.I. and Rittmann, B.E., 2008.
Evaluation of energy-conversion efficiencies in microbial fuel cells (MFCs) utilizing
fermentable and non-fermentable substrates. Water Research, 42, pp.1501–1510.
Leong, J.X., Daud, W.R.W., Ghasemi, M., Liew, K. Ben and Ismail, M., 2013. Ion
exchange membranes as separators in microbial fuel cells for bioenergy conversion: A
comprehensive review. Renewable and Sustainable Energy Reviews, 28, pp.575–587.
Li, Z., Yao, L., Kong, L. and Liu, H., 2008. Electricity generation using a baffled
microbial fuel cell convenient for stacking. Bioresource Technology, 99(6), pp.1650–
1655.
Liu, H., Cheng, S., Huang, L. and Logan, B.E., 2008. Scale-up of membrane-free single-
chamber microbial fuel cells. Journal of Power Sources, 179, pp.274–279.
160
Liu, H., Cheng, S. and Logan, B.E., 2005. Power generation in fed-batch microbial fuel
cells as a function of ionic strength, temperature, and reactor configuration.
Environmental Science and Technology, 39, pp.5488–5493.
Liu, H., Grot, S. and Logan, B.E., 2005. Electrochemically assisted microbial production
of hydrogen from acetate. Environmental Science and Technology, 39(11), pp.4317–
4320.
Liu, H. and Logan, B.E., 2004. Electricity generation using an air-cathode single chamber
microbial fuel cell in the presence and absence of a proton exchange membrane.
Environmental science & technology, 38, pp.4040–4046.
Liu, H., Ramnarayanan, R. and Logan, B.E., 2004. Production of electricity during
wastewater treatment using a single chamber microbial fuel cell. Environmental science
& technology, 38, pp.2281–2285.
Logan, B.E., Cheng, S., Watson, V. and Estadt, G., 2007. Graphite Fiber Brush Anodes
for Increased Power Production in Air-Cathode Microbial Fuel Cells. Journal of Power
Sources, 41(9), pp.3341–3346.
Logan, B.E., Hamelers, B., Rozendal, R., Schr??der, U., Keller, J., Freguia, S.,
Aelterman, P., Verstraete, W. and Rabaey, K., 2006. Microbial fuel cells: Methodology
and technology. Environmental Science and Technology, 40, pp.5181–5192.
Logan, B.E., Murano, C., Scott, K., Gray, N.D. and Head, I.M., 2005. Electricity
generation from cysteine in a microbial fuel cell. Water Research, 39, pp.942–952.
Logan, B.E., Wallack, M.J., Kim, K., He, W., Feng, Y. and Saikaly, P.E., 2015.
Assessment of Microbial Fuel Cell Connfigurations and Power Densities. Environmental
Science & Technology Letters, 2, pp.206–214.
Logan, B.E., 2008. Microbial Fuel Cells. 1st ed. ed. New Jersey: Wiley & Sons, Inc.
Logan, B.E., 2010. Scaling up microbial fuel cells and other bioelectrochemical systems.
Applied Microbiology and Biotechnology, 85, pp.1665–1671.
Logan, B.E., 2012. Essential data and techniques for conducting microbial fuel cell and
other types of bioelectrochemical system experiments. ChemSusChem, 5(6), pp.988–994.
Lovley, D.R., 2006. Microbial fuel cells: novel microbial physiologies and engineering
approaches. Current Opinion in Biotechnology, 17, pp.327–332.
Lu, L., Yazdi, H., Jin, S., Zuo, Y., Fallgren, P.H. and Ren, Z.J., 2014. Enhanced
bioremediation of hydrocarbon-contaminated soil using pilot-scale bioelectrochemical
systems. Journal of Hazardous Materials, 274, pp.8–15.
Mallick, P., Akunna, J.C. and Walker, G.M., 2010. Anaerobic digestion of distillery spent
wash: Influence of enzymatic pre-treatment of intact yeast cells. Bioresource Technology,
101, pp.1681–1685.
Marcus, A.K., Torres, C.I. and Rittmann, B.., 2007. Conduction-based modelling of the
biofilm anode of a microbial fuel cell. Biotechnology and Bioengineering, 98, pp.1171–
1182.
Mardanpour, M.M., Esfahany, M.N., Behzad, T. and Sedaqatvand, R., 2012. Single
chamber microbial fuel cell with spiral anode for dairy wastewater treatment. Biosensors
and Bioelectronics, 38, pp.264–269.
McCarty, P.L., Bae, J. and Kim, J., 2011. Domestic wastewater treatment as a net energy
producer - can this be achieved? Environmental science & technology, 45(17), pp.7100–
7106.
161
Met Office, 2016. Climate Summaries. [online] Regional Values. Available at:
<http://www.metoffice.gov.uk/climate/uk/summaries>.
Michie, I.S., Kim, J.R., Dinsdale, R.M., Guwy, A.J. and Premier, G.C., 2011. Operational
temperature regulates anodic biofilm growth and the development of electrogenic
activity. Applied Microbiology and Biotechnology, 92, pp.419–430.
Min, B., Cheng, S. and Logan, B.E., 2005. Electricity generation using membrane and
salt bridge microbial fuel cells. Water Research, 39, pp.1675–1686.
Min, B., Román, Ó.B. and Angelidaki, I., 2008. Importance of temperature and anodic
medium composition on microbial fuel cell (MFC) performance. Biotechnology Letters,
30, pp.1213–1218.
Mitchell, R. and Gu, J.D., 2010. Low-energy wastewater treatment: strategies and
technologies. 2nd ed. Environmental Microbiology. New Jersey: Wiley-Blackwell.
Mohan, S.V., Raghavulu, S.V. and Sarma, P.N., 2008. Biochemical evaluation of
bioelectricity production process from anaerobic wastewater treatment in a single
chambered microbial fuel cell (MFC) employing glass wool membrane. Biosensors and
Bioelectronics, 23(9), pp.1326–1332.
Mohana, S., Acharya, B.K. and Madamwar, D., 2009. Distillery spent wash: Treatment
technologies and potential applications. Journal of Hazardous Materials, 163, pp.12–25.
Mustakeem, 2015. Electrode materials for microbial fuel cells: Nanomaterial approach.
Materials for Renewable and Sustainable Energy, 4, pp.1–11.
Oliveira, V.B., Simoes, M., Melo, L.F. and Pinto, A.M.F.., 2013. A 1D mathematical
model for a microbial fuel cell. Energy, 61, pp.463–471.
Ortiz-Martínez, V.M., Salar-García, M.J., de los Ríos, A.P., Hernández-Fernández, F.J.,
Egea, J.A. and Lozano, L.J., 2015. Developments in microbial fuel cell modeling.
Chemical Engineering Journal, 271, pp.50–60.
Pant, D., Van Bogaert, G., Diels, L. and Vanbroekhoven, K., 2010. A review of the
substrates used in microbial fuel cells (MFCs) for sustainable energy production.
Bioresource Technology, 101, pp.1533–1543.
Parameswaran, P., Torres, C.I., Lee, H.S., Krajmalnik-Brown, R. and Rittmann, B.E.,
2009. Syntrophic interactions among anode respiring bacteria (ARB) and Non-ARB in a
biofilm anode: electron balances. Biotechnology and Bioengineering, 103(3), pp.513–
523.
Park, D.H. and Zeikus, J.G., 2000. Electricity Generation in Microbial Fuel Cells Using
Neutral Red as an Electronophore. Applied and Environmental microbiology, 66(4),
pp.1292–1297.
Pham, T.H., Rabaey, K., Aelterman, P., Clauwaert, P., De Schamphelaire, L., Boon, N.
and Verstraete, W., 2006. Microbial fuel cells in relation to conventional anaerobic
digestion technology. Engineering in Life Sciences, 6(3), pp.285–292.
Picioreanu, C., Head, I.M., Katuri, K.P., van Loosdrecht, M.C.M. and Scott, K., 2007. A
computational model for biofilm-based microbial fuel cells. Water Research, 41,
pp.2921–2940.
Piggott, J.R. and Connor, J.M., 2003. Whisky, Whiskey and Bourbon: Products and
Manufacture. In: B. Caballero, L.C. Trugo and P.. Finglas, eds., Encyclopedia of Food
Science and Nutrition, 2nd editio. London: Academic Press, pp.6171–6177.
162
Potter, M.C., 1911. Electrical Effects Accompanying the Decomposition of Organic
Compounds. Proceedings of the Royal Society of London B: Biological Sciences, 84(571),
pp.260–276.
Premier, G.C., Kim, J.R., Massanet-Nicolau, J., Kyazze, G., Esteves, S.R.R., Penumathsa,
B.K. V, Rodríguez, J., Maddy, J., Dinsdale, R.M. and Guwy, A.J., 2013. Integration of
biohydrogen, biomethane and bioelectrochemical systems. Renewable Energy, 49,
pp.188–192.
Rabaey, K., Angenent, L., Schroder, U. and Keller, J., 2009. Bioelectrochemical Systems:
From Extracellular Electron Transfer to Biotechnological Application. 1st ed. ed.
London: IWA Publishing.
Rabaey, K., Clauwaert, P., Aelterman, P. and Verstraete, W., 2005. Tubular microbial
fuel cells for efficient electricity generation. Environmental Science and Technology, 39,
pp.8077–8082.
Rabaey, K. and Verstraete, W., 2005. Microbial fuel cells: Novel biotechnology for
energy generation. Trends in Biotechnology, 23, pp.291–298.
Ren, L., Ahn, Y., Hou, H., Zhang, F. and Logan, B.E., 2014. Electrochemical study of
multi-electrode microbial fuel cells under fed-batch and continuous flow conditions.
Journal of Power Sources, 257, pp.454–460.
Ren, L., Ahn, Y. and Logan, B.E., 2014. A Two-Stage Microbial Fuel Cell and Anaerobic
Fluidized Bed Membrane Bioreactor (MFC-AFMBR) System for E ff ective Domestic
Wastewater Treatment. Environmental science & technology, 48, pp.4199–4206.
Ringeisen, B.R., Henderson, E., Wu, P.K., Pietron, J., Ray, R., Little, B., Biffinger, J.C.
and Jones-Meehan, J.M., 2006. High power density from a miniature microbial fuel cell
using Shewanella oneidensis DSP10. Environmental Science and Technology, 40,
pp.2629–2634.
Rismani-Yazdi, H., Carver, S.M., Christy, A.D. and Tuovinen, O.H., 2008. Cathodic
limitations in microbial fuel cells: An overview. Journal of Power Sources, 180(2),
pp.683–694.
Rittmann, B.E. and McCarty, P.L., 2001. Environmental Biotechnology: Principles and
Applications. Boston: McGraw-Hill.
Rozendal, R. a., Hamelers, H.V.M. and Buisman, C.J.N., 2006. Effects of Membrane
Cation Transport on pH and Microbial Fuel. Environmental science & technology, 40,
pp.5206–5211.
Rozendal, R.A., Hamelers, H.V.M., Rabaey, K., Keller, J. and Buisman, C.J.N., 2008.
Towards practical implementation of bioelectrochemical wastewater treatment. Trends in
Biotechnology, 26(8), pp.450–459.
Saeed, H.M., Husseini, G.A., Yousef, S., Saif, J., Al-Asheh, S., Fara, A.A., Azzam, S.,
Khawaga, R. and Aidan, A., 2015. Microbial desalination cell technology: A review and
a case study. Desalination, 359, pp.1–13.
Samsudeen, N., Sharma, A., Radhakrishnan, T.K. and Matheswaran, M., 2015.
Performance investigation of multi-chamber microbial fuel cell: An alternative approach
for scale up system. Journal of Renewable and Sustainable Energy, 7, pp.1–9.
Schroder, U., 2007. Anodic electron transfer mechanisms in microbial fuel cells and their
energy efficiency. Physical Chemistry Chemical Physics, 9, pp.2619–2629.
163
Scotch Whisky Association, 2015. Facts & figures. [online] Available at:
<http://www.scotch-whisky.org.uk/what-we-do/facts-figures/> [Accessed 4 Aug. 2016].
Scott, K., Cotlarciuc, I., Hall, D., Lakeman, J.B. and Browning, D., 2008. Power from
marine sediment fuel cells: the influence of anode material. Journal of Applied
Electrochemistry, 38, pp.1313–1319.
Scott, K. and Hao Yu, E., 2015. Microbial Electrochemical and Fuel Cells; Fundamental
and Applications. 1st ed. WP Woodhead Publishing.
Scott, K., Murano, C. and Rimbu, G., 2007. A tubular microbial fuel cell. Journal of
Applied Electrochemistry, 37, pp.1063–1068.
Scott, K., 2014. 10 - Microbial fuel cells: transformation of wastes into clean energy. In:
Membranes for Clean and Renewable Power Applications. Woodhead Publishing
Limited, pp.266–300.
Sharma, M., Bajracharya, S., Gildemyn, S., Patil, S.A., Alvarez-Gallego, Y., Pant, D.,
Rabaey, K. and Dominguez-Benetton, X., 2014. A critical revisit of the key parameters
used to describe microbial electrochemical systems. Electrochimica Acta, 140, pp.191–
208.
Sheets, J.P., Yang, L., Ge, X., Wang, Z. and Li, Y., 2015. Beyond land application:
Emerging technologies for the treatment and reuse of anaerobically digested agricultural
and food waste. Waste Management, 44, pp.94–115.
Shizas, I. and Bagley, D.M., 2004. Experimental Determination of Energy Content of
Unknown Organics in Municipal Wastewater Streams. Journal of Energy Engineering,
130(2), pp.45–53.
von Sperling, M., 2007. Biological Wastewater Treatment Vol.2: Basic principles of
wastewater treatment. 1st ed. London: IWA.
Sun, J., Hu, Y., Bi, Z. and Cao, Y., 2009. Improved performance of air-cathode single-
chamber microbial fuel cell for wastewater treatment using microfiltration membranes
and multiple sludge inoculation. Journal of Power Sources, 187(2), pp.471–479.
Sutton, P.M., Rittmann, B.E., Schraa, O.J., Banaszak, J.E. and Togna, A.P., 2011.
Wastewater as a resource: a unique approach to achieving energy sustainability. Water
Science and Technology, 63(9), pp.2004–2009.
Tran, H.T., Ryu, J.H., Jia, Y.H., Oh, S.J., Choi, J.Y., Park, D.H. and Ahn, D.H., 2010.
Continuous bioelectricity production and sustainable wastewater treatment in a microbial
fuel cell constructed with non-catalyzed granular graphite electrodes and permeable
membrane. Water Science & Technology, 61(7), pp.1819–1827.
Tugtas, A.E., Cavdar, P. and Calli, B., 2013. Bio-electrochemical post-treatment of
anaerobically treated landfill leachate. Bioresource Technology, 128, pp.266–272.
UN Water, 2015. Wastewater management: A UN-Water Analytical Brief. UN Water.
UNEP, 2016. UNEP Frontiers 2016 Report: Emerging Issues of Environmental Concern.
Nairobi: United Nations Environment Programme.
Wang, D. Bin, Song, T.S., Guo, T., Zeng, Q. and Xie, J., 2014. Electricity generation
from sediment microbial fuel cells with algae-assisted cathodes. International Journal of
Hydrogen Energy, 39, pp.13224–13230.
Wang, X., Cheng, S., Feng, Y., Merrill, M.D., Saito, T. and Logan, B.E., 2009a. Use of
carbon mesh anodes and the effect of different pretreatment methods on power production
in microbial fuel cells. Environmental Science and Technology, 43, pp.6870–6874.
164
Wang, X., Feng, Y., Ren, N., Wang, H., Lee, H., Li, N. and Zhao, Q., 2009b. Accelerated
start-up of two-chambered microbial fuel cells: Effect of anodic positive poised potential.
Electrochimica Acta, 54, pp.1109–1114.
Wei, J., Liang, P. and Huang, X., 2011. Recent progress in electrodes for microbial fuel
cells. Bioresource Technology, 102, pp.9335–9344.
Wen, Q., Wu, Y., Cao, D., Zhao, L. and Sun, Q., 2009. Electricity generation and
modeling of microbial fuel cell from continuous beer brewery wastewater. Bioresource
Technology, 100, pp.4171–4175.
Wilkinson, S., 2000. ``Gastrobots’'---Benefits and Challenges of Microbial Fuel Cells in
FoodPowered Robot Applications. Autonomous Robots, 9(2), pp.99–111.
Willey, J.M., Sherwood, L. and Woolverton, C.J., 2011. Prescott’s Microbiology. 8th
edit. ed. McGraw-Hill.
Winfield, J., Ieropoulos, I., Greenman, J. and Dennis, J., 2011. Investigating the effects
of fluidic connection between microbial fuel cells. Bioprocess and Biosystems
Engineering, 34, pp.477–484.
Wrap, 2016. Mogden Formula Tool. [online] Available at:
<http://www.wrap.org.uk/content/mogden-formula-tool-0> [Accessed 5 Aug. 2016].
WWAP, 2014. The United Nations World Water Development Report 2014: Water and
Energy.
Xiao, B., Han, Y., Liu, X. and Liu, J., 2014a. Relationship of methane and electricity
production in two-chamber microbial fuel cell using sewage sludge as substrate.
International Journal of Hydrogen Energy, 39, pp.16419–16425.
Xiao, L., Ge, Z., Kelly, P., Zhang, F. and He, Z., 2014b. Evaluation of normalized energy
recovery (NER) in microbial fuel cells affected by reactor dimensions and substrates.
Bioresource Technology, 157, pp.77–83.
Yong, Y.C., Dong, X.C., Chan-Park, M.B., Song, H. and Chen, P., 2012. Macroporous
and monolithic anode based on polyaniline hybridized three-dimensional Graphene for
high-performance microbial fuel cells. ACS Nano, 6(3), pp.2394–2400.
You, S., Zhao, Q., Zhang, J., Jiang, J., Wan, C., Du, M. and Zhao, S., 2007. A graphite-
granule membrane-less tubular air-cathode microbial fuel cell for power generation under
continuously operational conditions. Journal of Power Sources, 173, pp.172–177.
Yu, J., Seon, J., Park, Y., Cho, S. and Lee, T., 2012. Electricity generation and microbial
community in a submerged-exchangeable microbial fuel cell system for low-strength
domestic wastewater treatment. Bioresource Technology, 117, pp.172–179.
Yuan, H., Hou, Y., Abu-Reesh, I.M., Chen, J. and He, Z., 2016. Oxygen reduction
reaction catalysts in microbial fuel cells for energy-efficient wastewater treatment : A
review Materials Horizons. Materials Horizon.
Zeng, Y., Choo, Y.F., Kim, B.-H. and Wu, P., 2010. Modelling and simulation of two-
chamber microbial fuel cell. Journal of Power Sources, 195, pp.79–89.
Zhang, F., Ge, Z., Grimaud, J., Hurst, J. and He, Z., 2013a. In situ investigation of tubular
microbial fuel cells deployed in an aeration tank at a municipal wastewater treatment
plant. Bioresource Technology, 136, pp.316–321.
165
Zhang, F., Ge, Z., Grimaud, J., Hurst, J. and He, Z., 2013b. Long-Term Performance of
Liter-Scale Microbial Fuel Cells Treating Primary Effluent Installed in a Municipal
Wastewater Treatment Facility. Environmental Science & Technology, 47, pp.4941–
4948.
Zhang, X., Cheng, S., Liang, P., Huang, X. and Logan, B.E., 2011. Scalable air cathode
microbial fuel cells using glass fiber separators, plastic mesh supporters, and graphite
fiber brush anodes. Bioresource Technology, 102, pp.372–375.
Zhang, X., Pant, D., Zhang, F., Liu, J., He, W. and Logan, B.E., 2014. Long-Term
Performance of Chemically and Physically Modified Activated Carbons in Air Cathodes
of Microbial Fuel Cells. ChemElectroChem, 1, pp.1859–1866.
Zhang, X.C. and Halme, A., 1995. Modelling of a microbial fuel cell process.
Biotechnology Letters, 17, pp.809–814.
Zhao, F., Harnisch, F., Schröder, U., Scholz, F., Bogdanoff, P. and Herrmann, I., 2005.
Application of pyrolysed iron(II) phthalocyanine and CoTMPP based oxygen reduction
catalysts as cathode materials in microbial fuel cells. Electrochemistry Communications,
7, pp.1405–1410.
Zhao, F., Harnisch, F., Schröder, U., Scholz, F., Bogdanoff, P. and Herrmann, I., 2006.
Challenges and constraints of using oxygen cathodes in microbial fuel cells.
Environmental Science and Technology, 40(17), pp.5193–5199.
Zhou, M., Wang, H., Hassett, D.J. and Gu, T., 2013. Recent advances in microbial fuel
cells (MFCs) and microbial electrolysis cells (MECs) for wastewater treatment,
bioenergy and bioproducts. Journal of Chemical Technology and Biotechnology, 88,
pp.508–518.
Zhuang, L., Yuan, Y., Wang, Y. and Zhou, S., 2012a. Long-term evaluation of a 10-liter
serpentine-type microbial fuel cell stack treating brewery wastewater. Bioresource
Technology, 123, pp.406–412.
Zhuang, L., Zheng, Y., Zhou, S., Yuan, Y., Yuan, H. and Chen, Y., 2012b. Scalable
microbial fuel cell (MFC) stack for continuous real wastewater treatment. Bioresource
Technology, 106, pp.82–88.
Copyright © 2022 FDOKUMEN