Performance of columns packed with the new shell particles, Kinetex-C18
15
Journal of Chromatography A, 1217 (2010) 1589–1603 Contents lists available at ScienceDirect Journal of Chromatography A journal homepage: www.elsevier.com/locate/chroma Performance of columns packed with the new shell particles, Kinetex-C 18 Fabrice Gritti a , Irene Leonardis a , David Shock b , Paul Stevenson b , Andrew Shalliker b , Georges Guiochon a,∗ a Department of Chemistry, University of Tennessee, Knoxville, TN 37996-1600, USA b Australian Centre for Research on Separation Science, University of Western Sydney, NSW, Australia article info Article history: Received 20 October 2009 Received in revised form 2 December 2009 Accepted 24 December 2009 Available online 7 January 2010 Keywords: Column packing technology Shell particles Van Deemter plot HETP Kinetex-C18 Halo-C18 Anthracene Naphtho[2,3-a]pyrene Bradykinin Insulin Lyzozyme Acetonitrile abstract The performance of the new Kinetex-C 18 column was investigated. Packed with a new brand of porous shell particles, this column has an outstanding efficiency. Once corrected for the contribution of the instrument extra column volume, the minimum values of the reduced plate heights for a number of low molecular weight compounds (e.g., anthracene and naphtho[2,3-a]pyrene) were between 1.0 and 1.3, breaking the legendary record set 3 years ago by Halo-C 18 packed columns. The liquid-solid mass transfer of proteins (e.g., insulin and lyzozyme) is exceptionally fast on Kinetex-C 18 much faster than on the Halo-C 18 column. The different contributions of dispersion and mass transfer resistances to the column efficiency were determined and discussed. The possible reasons for this extremely high column efficiency are discussed. © 2010 Elsevier B.V. All rights reserved. 1. Introduction After more than 20 years of near stagnation, packed column technology has begun rapidly to evolve in the last 10 years. The first, monolithic columns appeared at the turning of the last century, threatening the monopoly of columns packed with particles but slowly losing momentum. Then, the average particle size routinely used in commercial columns began progressively to decrease, first from 5 to 3 m and lately to sub-2 m particles [1]. Columns packed with the latter particles allowed to reach high resolution power with reduced plate heights as low as 3.2 m (i.e., ca. 300,000 plates per meter) for small molecules [2] and to reduce analysis times by ca. one order of magnitude. The main disadvantage of such columns is the need for suitable instruments that are capable of operating at pressure as high as 15,000 psi (1000 bar) and to record without sig- nificant distortion the very narrow peaks eluted from the columns ∗ Corresponding author at: Department of Chemistry, University of Tennessee, 413 Buehler Hall, Knoxville, TN 37996-1600, USA. Tel.: +1 865 974 0733; fax: +1 865 974 2667. E-mail addresses: [email protected], [email protected] (G. Guiochon). [3]. In about the same time when sub-2 m particles were com- mercialized, other scientists search to prepare particles that are large enough to be used at velocities somewhat larger than their optimum velocity for maximum efficiency and exhibit low mass transfer resistance. This combination can provide columns that can be operated with conventional pumps but have efficiency compara- ble to that of columns packed with sub-2 m particles. Three years ago, Kirkland obtained the superficially porous or shell Halo-C 18 particles [4–8]. This exceptionally performing material was made of 1.7 m solid silica core covered by a 0.5 m porous silica shell. It provided minimum reduced HETPs of ca. 1.5 for small molecular weight compounds [9], a significant improvement in packed col- umn technology since the minimum reduced HETP of totally porous particle is usually of the order of 2.0. The mass transfer mechanism in Halo-C 18 packed columns was investigated from a theoretical [10,11] and an experimental point of view [9,12]. Inverse size exclusion chromatography (ISEC) data show that the external porosity of these columns is slightly larger than that of totally porous particles (0.42 vs. 0.37) [9]. It was sug- gested that this high porosity is due to the external roughness of the surface of the shell and a high friction forces between the par- ticles, hence to the formation of a chromatographic bed with a relatively low density but a high degree of radial homogeneity. The 0021-9673/$ – see front matter © 2010 Elsevier B.V. All rights reserved. doi:10.1016/j.chroma.2009.12.079
-
Upload
independent -
Category
Documents
-
view
1 -
download
0
Transcript of Performance of columns packed with the new shell particles, Kinetex-C18
P
F
a
b
a
ARRAA
KCSVHKHANBILA
1
tmtsufwwpcipn
4f
(
0d
Journal of Chromatography A, 1217 (2010) 1589–1603
Contents lists available at ScienceDirect
Journal of Chromatography A
journa l homepage: www.e lsev ier .com/ locate /chroma
erformance of columns packed with the new shell particles, Kinetex-C18
abrice Gritti a, Irene Leonardisa, David Shockb, Paul Stevensonb, Andrew Shallikerb, Georges Guiochona,∗
Department of Chemistry, University of Tennessee, Knoxville, TN 37996-1600, USAAustralian Centre for Research on Separation Science, University of Western Sydney, NSW, Australia
r t i c l e i n f o
rticle history:eceived 20 October 2009eceived in revised form 2 December 2009ccepted 24 December 2009vailable online 7 January 2010
eywords:olumn packing technologyhell particlesan Deemter plotETP
a b s t r a c t
The performance of the new Kinetex-C18 column was investigated. Packed with a new brand of porousshell particles, this column has an outstanding efficiency. Once corrected for the contribution of theinstrument extra column volume, the minimum values of the reduced plate heights for a number oflow molecular weight compounds (e.g., anthracene and naphtho[2,3-a]pyrene) were between 1.0 and1.3, breaking the legendary record set 3 years ago by Halo-C18 packed columns. The liquid-solid masstransfer of proteins (e.g., insulin and lyzozyme) is exceptionally fast on Kinetex-C18 much faster thanon the Halo-C18 column. The different contributions of dispersion and mass transfer resistances to thecolumn efficiency were determined and discussed. The possible reasons for this extremely high columnefficiency are discussed.
© 2010 Elsevier B.V. All rights reserved.
inetex-C18alo-C18
nthraceneaphtho[2,3-a]pyreneradykinin
nsulin
yzozymecetonitrile. Introduction
After more than 20 years of near stagnation, packed columnechnology has begun rapidly to evolve in the last 10 years. The first,
onolithic columns appeared at the turning of the last century,hreatening the monopoly of columns packed with particles butlowly losing momentum. Then, the average particle size routinelysed in commercial columns began progressively to decrease, firstrom 5 to 3 �m and lately to sub-2 �m particles [1]. Columns packedith the latter particles allowed to reach high resolution powerith reduced plate heights as low as 3.2 �m (i.e., ca. 300,000 plateser meter) for small molecules [2] and to reduce analysis times by
a. one order of magnitude. The main disadvantage of such columnss the need for suitable instruments that are capable of operating atressure as high as 15,000 psi (1000 bar) and to record without sig-ificant distortion the very narrow peaks eluted from the columns∗ Corresponding author at: Department of Chemistry, University of Tennessee,13 Buehler Hall, Knoxville, TN 37996-1600, USA. Tel.: +1 865 974 0733;ax: +1 865 974 2667.
E-mail addresses: [email protected], [email protected]. Guiochon).
021-9673/$ – see front matter © 2010 Elsevier B.V. All rights reserved.oi:10.1016/j.chroma.2009.12.079
[3]. In about the same time when sub-2 �m particles were com-mercialized, other scientists search to prepare particles that arelarge enough to be used at velocities somewhat larger than theiroptimum velocity for maximum efficiency and exhibit low masstransfer resistance. This combination can provide columns that canbe operated with conventional pumps but have efficiency compara-ble to that of columns packed with sub-2 �m particles. Three yearsago, Kirkland obtained the superficially porous or shell Halo-C18particles [4–8]. This exceptionally performing material was madeof 1.7 �m solid silica core covered by a 0.5 �m porous silica shell.It provided minimum reduced HETPs of ca. 1.5 for small molecularweight compounds [9], a significant improvement in packed col-umn technology since the minimum reduced HETP of totally porousparticle is usually of the order of 2.0.
The mass transfer mechanism in Halo-C18 packed columns wasinvestigated from a theoretical [10,11] and an experimental pointof view [9,12]. Inverse size exclusion chromatography (ISEC) datashow that the external porosity of these columns is slightly larger
than that of totally porous particles (0.42 vs. 0.37) [9]. It was sug-gested that this high porosity is due to the external roughness ofthe surface of the shell and a high friction forces between the par-ticles, hence to the formation of a chromatographic bed with arelatively low density but a high degree of radial homogeneity. The
1 togr. A
rsew[seCtsfpss2hritTdaepcvac
cKpgmttseaa
ctoaaatasTdetdoflti
psctg
590 F. Gritti et al. / J. Chroma
educed B term in the van Deemter equation of Halo columns ismaller than that of conventional porous particles (� −25%) and isasily explained by the smaller internal porosity of the particles,hich provides a smaller volume accessible for sample diffusion
9]. Finally, the reduced C term measured for Halo-C18 particles formall molecular weight compounds was not significantly differ-nt from that of the totally porous particles, probably because theterm depends mostly on the external film mass transfer resis-
ance and the eddy dispersion term [13]. The effective intraparticleample diffusivity of small molecules is so fast that the mass trans-er resistance through either conventional or superficially porousarticles is negligible [14]. Finally, the low reduced A term mea-ured on the Halo columns is in part due to the very narrow particleize distribution, with a relative standard deviation around 5% vs.0% for most totally porous particles, and probably in part by theigh friction coefficient between particles caused to their surfaceoughness, which decreases the amount of strain taking place dur-ng consolidation of the packed bed. It does not seem to be relatedo unusually small transcolumn mobile phase velocity gradients.he measurement of the local flow velocity across the columniameter by electrochemical detection [12] demonstrated that themplitude of the flow velocity gradient across the column diam-ter of columns packed with either totally or superficially porousarticles was comparable. Overall, the commercially available Haloolumns packed with 2.7 �m superficially porous particles has pro-ided under the best conditions minimum reduced HETPs as smalls 1.4, a level of separation power never approached earlier by anyonventional packing material.
A first goal of this work was to assess the performance ofolumns packed with particles of a new brand of shell particles,inetex-C18 by Phenomenex, in which a solid core is wrapped in aorous layer or shell of a silica adsorbent. Nearly 3 years ago, a firsteneration of shell particles established a landmark record for theinimum reduced HETP. Columns packed with Halo-C18 particles
hat have characteristics similar to those of the Kinetex-C18 par-icles were the most suitable term of comparison in the presenttudy. In a first part, we report on measurements of the heightquivalent to a theoretical plate (HETP) of conventional chemicals,peptide and two proteins in a wide range of mobile phase velocitynd discuss the different contributions to mass transfer resistance.
For the last 40 years, HPLC has been a vast battlefield on whicholumn producers faced instrument manufacturers. The specifica-ions of the first group were often met late, rarely completely, andften grudgingly by the latter. Analysts want faster separationsnd better resolutions. Physical chemists explain that this can bechieved only with shorter columns, packed with finer particles,nd fed by more powerful pumps. Instrument designers struggleo meet the new specifications. Then, column producers developnew generation of particles, finer, more performing, and a new
et of instrument specifications is written and the fights resume.he most difficult source of problems was always the recurrentifficulty at reducing the extra column contributions to band broad-ning, the most important of which are the dispersion caused byhe extra column volumes and the deformation of the band profilesue to the response time of detectors and by the limited frequencyf acquisition of digital data. Other major battles in this war wereought around issues of accuracy, precision, reliability. They wereess sharp and progress there came more often through incremen-al but steady improvements rather than through major changes innstrument design.
The advent of the first generation of fine shell particles exem-
lified by the Halo column gave a warning that a new battle washaping up. The advent of the second generation of shell parti-les opens the new war and sends a new generation of engineerso the drawing-board or rather the computer assisted design pro-rams. The second goal of this paper is to attempt first to assess the1217 (2010) 1589–1603
impact of the currently available instruments on the overall, prac-tical performance of the new generation of columns and finally tosketch what could be the specifications for a new generation ofinstruments for HPLC.
2. Theory
2.1. Reduced linear velocity
In all this work, we report on measurements of efficiency data ofa Kinetex-C18 column. We express these data as the reduced plateheight h = H/dp of the column (with H column HETP and dp averageparticle size) and we discuss the variations of h as a function of thereduced interstitial velocity �. By definition,
� = udp
Dm(1)
where Dm is the bulk molecular diffusivity, and u is the interstitiallinear velocity, which is given by:
u = Fv
�e�R2c
(2)
where Fv is the volume flow rate of the mobile phase, �e is theinterstitial porosity, and Rc is the inner radius of the column tube.
The molecular diffusivities of the low-molecular-weight com-pounds used here (anthracene and naphtho[2,3-a]pyrene) wereestimated using the classical Wilke and Chang equation [15]:
Dm = 7.4 × 10⁻⁸ (�MS)0.5T
�V0.6A
(3)
where � is the solvent association factor (� = 1 for pure acetoni-trile [16]), MS the molecular weight of the mobile phase (g/mol),� its viscosity (� = 0.37 cP for pure acetonitrile at 295 K), T is thetemperature, and VA is the molar volume of the solute at its boilingpoint (cm3/mol). VA was estimated according to the group methodof Schroder and Lebas [16].
The molecular diffusivity of the peptide (bradykinin) was esti-mated using the correlation of Young et al. [17]:
Dm = 8.34 × 10⁻⁸ T
�M(1/3)(4)
The two correlations in Eqs. (3) and (4) give reasonable valuesof Dm for the compounds used in this work. The diffusion coeffi-cients of anthracene, naphtho[2,3-a]pyrene, and bradykinin wereestimated at 1.6 × 10⁻⁵, 1.2 × 10⁻⁵, and 2.32 × 10⁻⁶ cm2/s, respec-tively. The molecular diffusivities of the proteins insulin (1.63 ×10⁻⁶ cm2/s) and lyzozyme (1.20 × 10⁻⁶ cm2/s) were directly takenfrom experimental data available in the literature [18,19].
2.2. The Mass transfer resistances
The overall reduced HETP of a chromatographic column is thesum of three main contributions due to longitudinal diffusion (theB term), eddy dispersion (the A term), and overall solid-liquid masstransfer resistance (the C term), as described in the general empir-ical van Deemter plate height equation [20].
h = B
�+ A + C� (5)
More elaborate kinetic models account for the actual struc-ture of the packed chromatographic bed, including the moving
eluent in the interparticle space, the stagnant eluent in the meso-pore network inside the porous particles, and the solid stationaryphase. First Giddings [21], later Horvath and Lin [22,23], and finallyGuiochon et al. [24] elaborated different sophisticated plate heightequations. These equations have been reviewed and compared
ogr. A
ec
h
2
pi
h
wvp(fot
2
oss(flea
h
mcai
sF5Qf
wtω
2
g
h
wt
The new Kinetex-C18 column (100 mm × 4.6 mm) was a gener-
F. Gritti et al. / J. Chromat
lsewhere [25,26]. They are written as the sum of four differentontributions:
= hLong. + hEddy + hFilm + hParticle (6)
.2.1. First, the reduced longitudinal diffusion termIn the term (hLong.), the role actually played by the stationary
hase is not negligible, due to the important role of surface diffusionn the adsorbed state [27]. The contribution hLong. is written:
Long. = 2�e + ((1 − �e)(1 − �3)/�e)˝
�(7)
here �e is the obstruction factor for diffusion in the interparticleolume (�e is of the order of 0.60 [28]), ˝ is the ratio of the intra-article diffusivity of the sample through the porous silica-C18 shellDshell) to the bulk diffusion coefficient (˝ is of the order of unityor small molecules [29]), and � = Ri/Re is the ratio of the diameterf the solid core to that of the particle, with � = 0.73 and 0.63 forhe Kinetex-C18 and Halo-C18 particles, respectively.
.2.2. Second, the eddy dispersion termThis term, hEddy, results from the combination of various sources
f flow heterogeneity inside the packed column. This includesources of four different origins, differing in the length scale con-idered, e.g., the transchannel (i = 1), the short-range interchanneli = 2), the long-range interchannel (i = 3), and the transcolumnow heterogeneities (i = 4). At high reduced interstitial velocity,ddy dispersion is essentially controlled by a flow mechanism andgeneral expression is given by [21,30]:
Eddy =i=4∑i=1
1(1/2i) + (1/ωi�)
� 2i=4∑i=1
i (8)
The values of 1, 2, and 3 in Eq. (8) were estimated by Giddingsore than 50 years ago. These estimates are still valid today for
olumns packed with modern very fine particles [21]. Their valuesre based on quantitative estimates made for the different velocitynequalities ωˇ,i and for the axial convection lengths ω,i:
i =ω2
ˇ,iω,i
2(9)
For the transchannel mechanism, ωˇ,1 = 1 and ω,1 = 1. For thehort-range interchannel mechanism, ωˇ,2 = 0.8 and ω,2 = 1.5.or the long-range interchannel mechanism, ωˇ,3 = 0.2 and ω,3 =. So, as a first guess, 1 = 0.5, 2 = 0.5, and 3 = 0.1. The value of4 is derived from the flow distribution across the column diameter.uartic flow profile distributions have been observed [50] and the
ollowing expression of the parameter 4 was recently derived [30]:
4 = 245
L
dpω2
ˇ,c (10)
here ωˇ,c is the relative flow velocity difference between the cen-er and the wall of the column and L is the column length. Assuming
ˇ,c = 1%, L = 15 cm, and dp = 3 �m then 4 = 0.22.
.2.3. Third, the external film mass transfer termThis term, hFilm, was derived from the Laplace transform of the
eneral rate model equations [24]. It is written:
Film = �e
1 − �e
k21
(1 + k1)2
13Sh
� (11)
here Sh = (kf dp/Dm) is the Sherwood number, kf is the film massransfer coefficient, and k1 is given for superficially porous particles
1217 (2010) 1589–1603 1591
by [10]:
k1 = 1 − �e
�e
(�p + 1 − �p(1 − �3)
1 − �3Ka
)(1 − �3) (12)
where �p is the porosity of the porous shell of the particle and Ka
is the Henry’s constant of adsorption on the walls of the porousshells. The relationship between the measurable retention factor k
′
and the Henry’s constant Ka is:
k′ = 1 − �t
�tKa (13)
where �t is the total porosity of the column. The Sherwood numbercan be estimated from the Wilson and Geankoplis correlation [31]:
Sh = 1.09
�(2/3)e
�(1/3) (14)
2.2.4. Fourth, the contribution of the transparticle mass transferresistance
Finally, in Eq. (6), the term hParticle is given by the followingequation, previously derived for shell particles [10]:
hParticle = �e
1 − �e
k21
(1 + k1)2
130˝
1 + 2� + 3�2 − �3 − 5�4
(1 + � + �2)2� (15)
This equation is consistent with the one derived previously fortotally porous particles when � = 0. As � increases (e.g., as thediameter of the solid core increases), the apparent intraparticlediffusivity of the probe studied increases and the mass transferkinetics becomes faster through the shell particles than it is throughtotally porous particles. In theory, for large Henry’s constant Ka,the intraparticle diffusivity of the Kinetex-C18 (� = 0.73) and theHalo-C18 particles (� = 0.63) should be 2.3 and 1.7 times larger,respectively, than the apparent diffusivity in fully porous particlesof the same size.
3. Experimental
3.1. Chemicals
The mobile phase used in this work was made of either pure ace-tonitrile or a mixture of water and acetonitrile. Dichloromethane(�CH2Cl2 = 1.306 g/cm3) and isopropanol (�iPrOH = 0.782 g/cm3)were used in markedly smaller amounts, to measure the columnhold-up volumes by pycnometry. These four solvents were HPLCgrade from Fisher Scientific (Fair Lawn, NJ, USA). The mobile phasewas filtered before use on a surfactant-free cellulose acetate fil-ter membrane, 0.2 �m pore size (Suwannee, GA, USA). Trifluoroacetic acid, anthracene, naphtho[2,3-a]pyrene, and lyzozyme werepurchased from Aldrich (Milwaukee, WI, USA). Bradykinin wasordered from American Peptides Company Inc. (Sunnyvale, CA).Insulin was a generous gift from Ely Lilly (Indianapolis, IN, USA).Eleven polystyrene standards (MW = 590, 1100, 3680, 6400, 13,200,31,600, 90,000, 171,000, 560,900, 900,000, and 1,877,000) wereused to acquire inverse size exclusion chromatography data (ISEC).They were purchased from Phenomenex (Torrance, CA, USA).
3.2. Columns
ous gift from the column manufacturer (Phenomenex, Torrance,CA, USA). The Halo-C18 column (150 mm × 4.6 mm) was purchasedfrom Advanced Material Technology (Wilmington, DE, USA). Themain characteristics of the bare porous silica and those of the finalderivatized packing material are summarized in Table 1.
1592 F. Gritti et al. / J. Chromatogr. A
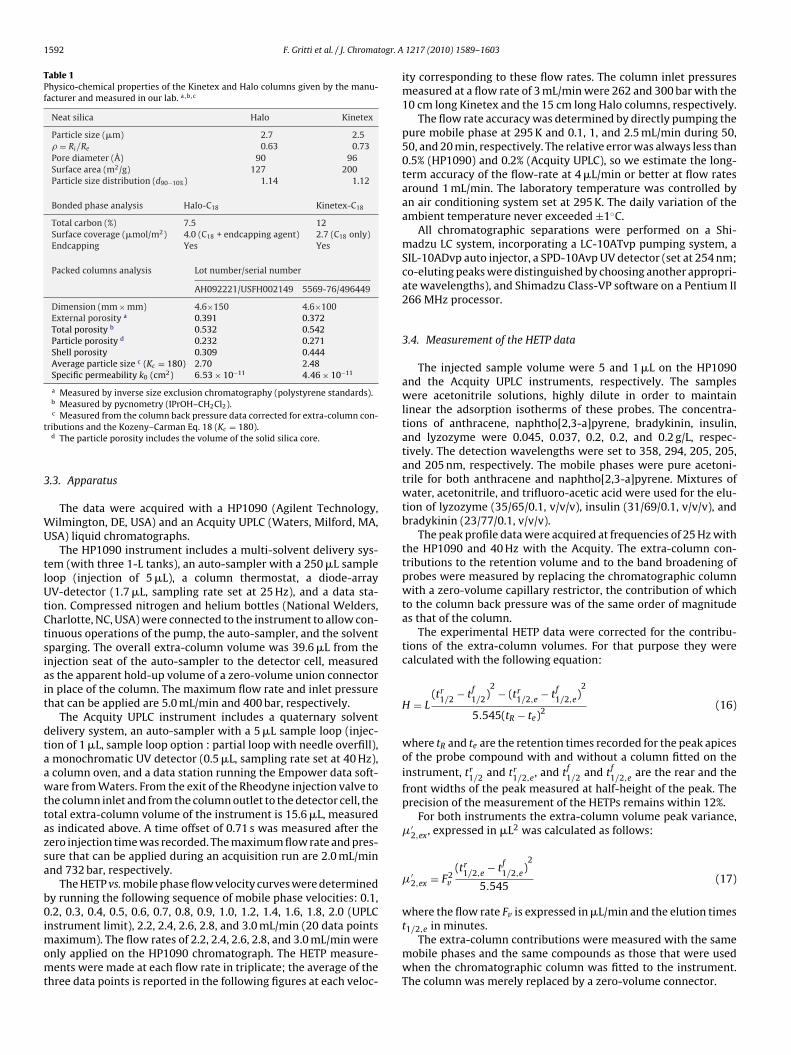
Table 1Physico-chemical properties of the Kinetex and Halo columns given by the manu-facturer and measured in our lab. a,b ,c
Neat silica Halo Kinetex
Particle size (�m) 2.7 2.5� = Ri/Re 0.63 0.73Pore diameter (Å) 90 96Surface area (m2/g) 127 200Particle size distribution (d90−10%) 1.14 1.12
Bonded phase analysis Halo-C18 Kinetex-C18
Total carbon (%) 7.5 12Surface coverage (�mol/m2) 4.0 (C18 + endcapping agent) 2.7 (C18 only)Endcapping Yes Yes
Packed columns analysis Lot number/serial number
AH092221/USFH002149 5569-76/496449
Dimension (mm × mm) 4.6×150 4.6×100External porosity a 0.391 0.372Total porosity b 0.532 0.542Particle porosity d 0.232 0.271Shell porosity 0.309 0.444Average particle size c (Kc = 180) 2.70 2.48Specific permeability k0 (cm2) 6.53 × 10⁻¹¹ 4.46 × 10⁻¹¹
a Measured by inverse size exclusion chromatography (polystyrene standards).b Measured by pycnometry (IPrOH–CH2Cl2).
t
3
WU
tlUtCtsiait
dtaawttazsa
b0imomt
�′2,ex = F2
v 5.545(17)
where the flow rate Fv is expressed in �L/min and the elution timest1/2,e in minutes.
c Measured from the column back pressure data corrected for extra-column con-ributions and the Kozeny–Carman Eq. 18 (Kc = 180).
d The particle porosity includes the volume of the solid silica core.
.3. Apparatus
The data were acquired with a HP1090 (Agilent Technology,ilmington, DE, USA) and an Acquity UPLC (Waters, Milford, MA,
SA) liquid chromatographs.The HP1090 instrument includes a multi-solvent delivery sys-
em (with three 1-L tanks), an auto-sampler with a 250 �L sampleoop (injection of 5 �L), a column thermostat, a diode-arrayV-detector (1.7 �L, sampling rate set at 25 Hz), and a data sta-
ion. Compressed nitrogen and helium bottles (National Welders,harlotte, NC, USA) were connected to the instrument to allow con-inuous operations of the pump, the auto-sampler, and the solventparging. The overall extra-column volume was 39.6 �L from thenjection seat of the auto-sampler to the detector cell, measureds the apparent hold-up volume of a zero-volume union connectorn place of the column. The maximum flow rate and inlet pressurehat can be applied are 5.0 mL/min and 400 bar, respectively.
The Acquity UPLC instrument includes a quaternary solventelivery system, an auto-sampler with a 5 �L sample loop (injec-ion of 1 �L, sample loop option : partial loop with needle overfill),monochromatic UV detector (0.5 �L, sampling rate set at 40 Hz),column oven, and a data station running the Empower data soft-are from Waters. From the exit of the Rheodyne injection valve to
he column inlet and from the column outlet to the detector cell, theotal extra-column volume of the instrument is 15.6 �L, measureds indicated above. A time offset of 0.71 s was measured after theero injection time was recorded. The maximum flow rate and pres-ure that can be applied during an acquisition run are 2.0 mL/minnd 732 bar, respectively.
The HETP vs. mobile phase flow velocity curves were determinedy running the following sequence of mobile phase velocities: 0.1,.2, 0.3, 0.4, 0.5, 0.6, 0.7, 0.8, 0.9, 1.0, 1.2, 1.4, 1.6, 1.8, 2.0 (UPLC
nstrument limit), 2.2, 2.4, 2.6, 2.8, and 3.0 mL/min (20 data points
aximum). The flow rates of 2.2, 2.4, 2.6, 2.8, and 3.0 mL/min werenly applied on the HP1090 chromatograph. The HETP measure-ents were made at each flow rate in triplicate; the average of the
hree data points is reported in the following figures at each veloc-
1217 (2010) 1589–1603
ity corresponding to these flow rates. The column inlet pressuresmeasured at a flow rate of 3 mL/min were 262 and 300 bar with the10 cm long Kinetex and the 15 cm long Halo columns, respectively.
The flow rate accuracy was determined by directly pumping thepure mobile phase at 295 K and 0.1, 1, and 2.5 mL/min during 50,50, and 20 min, respectively. The relative error was always less than0.5% (HP1090) and 0.2% (Acquity UPLC), so we estimate the long-term accuracy of the flow-rate at 4 �L/min or better at flow ratesaround 1 mL/min. The laboratory temperature was controlled byan air conditioning system set at 295 K. The daily variation of theambient temperature never exceeded ±1◦C.
All chromatographic separations were performed on a Shi-madzu LC system, incorporating a LC-10ATvp pumping system, aSIL-10ADvp auto injector, a SPD-10Avp UV detector (set at 254 nm;co-eluting peaks were distinguished by choosing another appropri-ate wavelengths), and Shimadzu Class-VP software on a Pentium II266 MHz processor.
3.4. Measurement of the HETP data
The injected sample volume were 5 and 1 �L on the HP1090and the Acquity UPLC instruments, respectively. The sampleswere acetonitrile solutions, highly dilute in order to maintainlinear the adsorption isotherms of these probes. The concentra-tions of anthracene, naphtho[2,3-a]pyrene, bradykinin, insulin,and lyzozyme were 0.045, 0.037, 0.2, 0.2, and 0.2 g/L, respec-tively. The detection wavelengths were set to 358, 294, 205, 205,and 205 nm, respectively. The mobile phases were pure acetoni-trile for both anthracene and naphtho[2,3-a]pyrene. Mixtures ofwater, acetonitrile, and trifluoro-acetic acid were used for the elu-tion of lyzozyme (35/65/0.1, v/v/v), insulin (31/69/0.1, v/v/v), andbradykinin (23/77/0.1, v/v/v).
The peak profile data were acquired at frequencies of 25 Hz withthe HP1090 and 40 Hz with the Acquity. The extra-column con-tributions to the retention volume and to the band broadening ofprobes were measured by replacing the chromatographic columnwith a zero-volume capillary restrictor, the contribution of whichto the column back pressure was of the same order of magnitudeas that of the column.
The experimental HETP data were corrected for the contribu-tions of the extra-column volumes. For that purpose they werecalculated with the following equation:
H = L(tr
1/2 − tf1/2)
2 − (tr1/2,e
− tf1/2,e
)2
5.545(tR − te)2(16)
where tR and te are the retention times recorded for the peak apicesof the probe compound with and without a column fitted on theinstrument, tr
1/2 and tr1/2,e
, and tf1/2 and tf
1/2,eare the rear and the
front widths of the peak measured at half-height of the peak. Theprecision of the measurement of the HETPs remains within 12%.
For both instruments the extra-column volume peak variance,�′
2,ex, expressed in �L2 was calculated as follows:
(tr1/2,e
− tf1/2,e
)2
The extra-column contributions were measured with the samemobile phases and the same compounds as those that were usedwhen the chromatographic column was fitted to the instrument.The column was merely replaced by a zero-volume connector.
ogr. A 1217 (2010) 1589–1603 1593
4
pTot
4H
mtocfw0ci
FTobTbb
F. Gritti et al. / J. Chromat
. Results and discussion
We first discuss some important characteristics (external, inter-article porosity and permeability) of the two columns studied.hen, we report on the HETP plots of a series of samples measuredn these columns under the very same conditions and we compareheir performance.
.1. External porosity and permeability of the Kinetex-C18 andalo-C18 columns
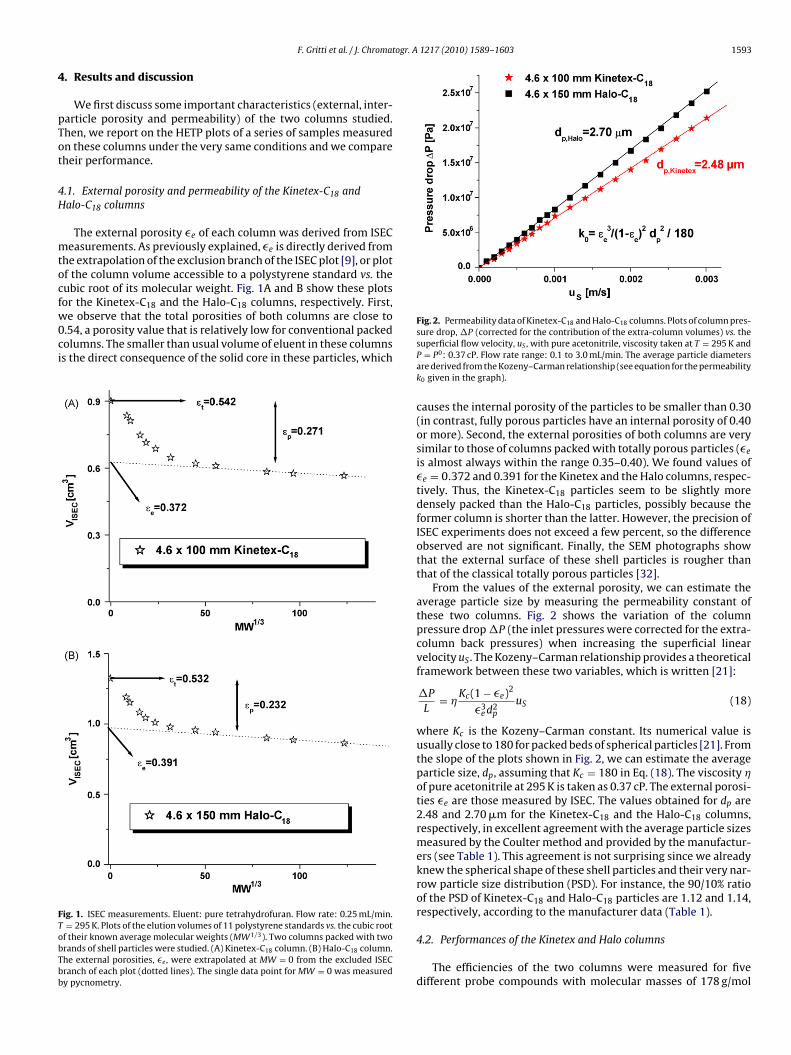
The external porosity �e of each column was derived from ISECeasurements. As previously explained, �e is directly derived from
he extrapolation of the exclusion branch of the ISEC plot [9], or plotf the column volume accessible to a polystyrene standard vs. theubic root of its molecular weight. Fig. 1A and B show these plots
or the Kinetex-C18 and the Halo-C18 columns, respectively. First,e observe that the total porosities of both columns are close to.54, a porosity value that is relatively low for conventional packedolumns. The smaller than usual volume of eluent in these columnss the direct consequence of the solid core in these particles, which
ig. 1. ISEC measurements. Eluent: pure tetrahydrofuran. Flow rate: 0.25 mL/min.= 295 K. Plots of the elution volumes of 11 polystyrene standards vs. the cubic root
f their known average molecular weights (MW1/3). Two columns packed with tworands of shell particles were studied. (A) Kinetex-C18 column. (B) Halo-C18 column.he external porosities, �e , were extrapolated at MW = 0 from the excluded ISECranch of each plot (dotted lines). The single data point for MW = 0 was measuredy pycnometry.
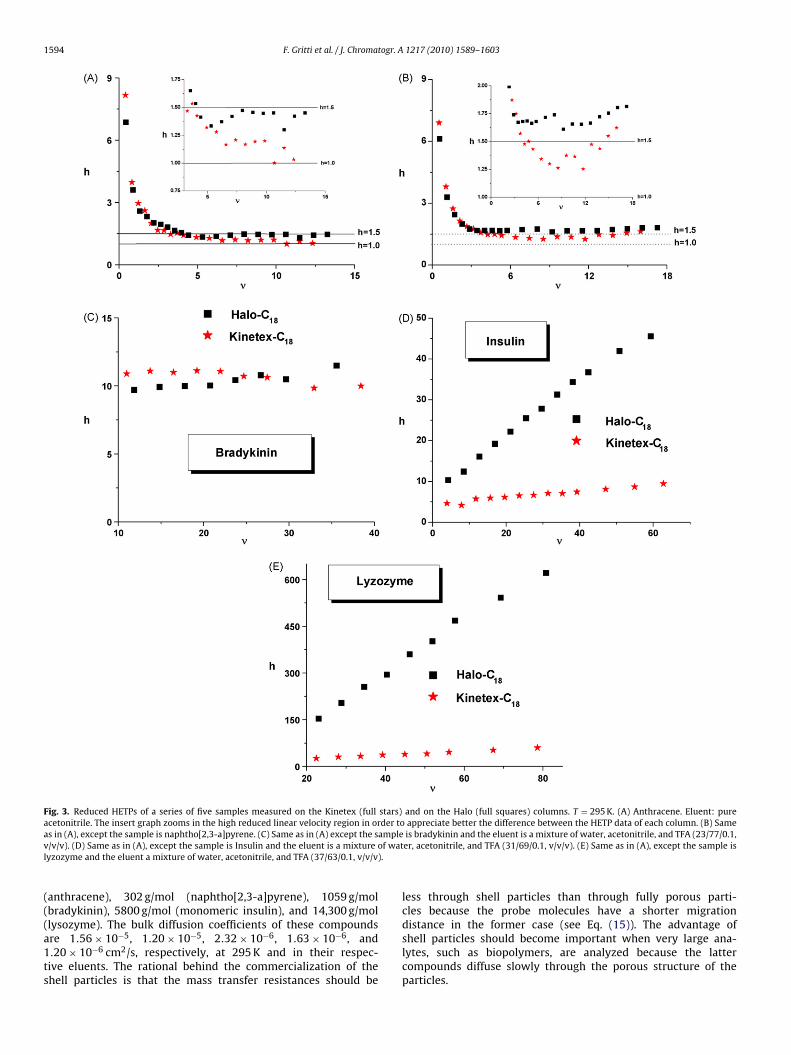
Fig. 2. Permeability data of Kinetex-C18 and Halo-C18 columns. Plots of column pres-sure drop, �P (corrected for the contribution of the extra-column volumes) vs. the
superficial flow velocity, uS , with pure acetonitrile, viscosity taken at T = 295 K andP = P0: 0.37 cP. Flow rate range: 0.1 to 3.0 mL/min. The average particle diametersare derived from the Kozeny–Carman relationship (see equation for the permeabilityk0 given in the graph).causes the internal porosity of the particles to be smaller than 0.30(in contrast, fully porous particles have an internal porosity of 0.40or more). Second, the external porosities of both columns are verysimilar to those of columns packed with totally porous particles (�e
is almost always within the range 0.35–0.40). We found values of�e = 0.372 and 0.391 for the Kinetex and the Halo columns, respec-tively. Thus, the Kinetex-C18 particles seem to be slightly moredensely packed than the Halo-C18 particles, possibly because theformer column is shorter than the latter. However, the precision ofISEC experiments does not exceed a few percent, so the differenceobserved are not significant. Finally, the SEM photographs showthat the external surface of these shell particles is rougher thanthat of the classical totally porous particles [32].
From the values of the external porosity, we can estimate theaverage particle size by measuring the permeability constant ofthese two columns. Fig. 2 shows the variation of the columnpressure drop �P (the inlet pressures were corrected for the extra-column back pressures) when increasing the superficial linearvelocity uS . The Kozeny–Carman relationship provides a theoreticalframework between these two variables, which is written [21]:
�P
L= �
Kc(1 − �e)2
�3e d2
p
uS (18)
where Kc is the Kozeny–Carman constant. Its numerical value isusually close to 180 for packed beds of spherical particles [21]. Fromthe slope of the plots shown in Fig. 2, we can estimate the averageparticle size, dp, assuming that Kc = 180 in Eq. (18). The viscosity �of pure acetonitrile at 295 K is taken as 0.37 cP. The external porosi-ties �e are those measured by ISEC. The values obtained for dp are2.48 and 2.70 �m for the Kinetex-C18 and the Halo-C18 columns,respectively, in excellent agreement with the average particle sizesmeasured by the Coulter method and provided by the manufactur-ers (see Table 1). This agreement is not surprising since we alreadyknew the spherical shape of these shell particles and their very nar-row particle size distribution (PSD). For instance, the 90/10% ratioof the PSD of Kinetex-C18 and Halo-C18 particles are 1.12 and 1.14,respectively, according to the manufacturer data (Table 1).
4.2. Performances of the Kinetex and Halo columns
The efficiencies of the two columns were measured for fivedifferent probe compounds with molecular masses of 178 g/mol
1594 F. Gritti et al. / J. Chromatogr. A 1217 (2010) 1589–1603
Fig. 3. Reduced HETPs of a series of five samples measured on the Kinetex (full stars) and on the Halo (full squares) columns. T = 295 K. (A) Anthracene. Eluent: pureacetonitrile. The insert graph zooms in the high reduced linear velocity region in order to appreciate better the difference between the HETP data of each column. (B) Samea amplev f watl ).
(((a1ts
s in (A), except the sample is naphtho[2,3-a]pyrene. (C) Same as in (A) except the s/v/v). (D) Same as in (A), except the sample is Insulin and the eluent is a mixture oyzozyme and the eluent a mixture of water, acetonitrile, and TFA (37/63/0.1, v/v/v
anthracene), 302 g/mol (naphtho[2,3-a]pyrene), 1059 g/molbradykinin), 5800 g/mol (monomeric insulin), and 14,300 g/mol
lysozyme). The bulk diffusion coefficients of these compoundsre 1.56 × 10⁻⁵, 1.20 × 10⁻⁵, 2.32 × 10⁻⁶, 1.63 × 10⁻⁶, and.20 × 10−6 cm2/s, respectively, at 295 K and in their respec-ive eluents. The rational behind the commercialization of thehell particles is that the mass transfer resistances should beis bradykinin and the eluent is a mixture of water, acetonitrile, and TFA (23/77/0.1,er, acetonitrile, and TFA (31/69/0.1, v/v/v). (E) Same as in (A), except the sample is
less through shell particles than through fully porous parti-cles because the probe molecules have a shorter migration
distance in the former case (see Eq. (15)). The advantage ofshell particles should become important when very large ana-lytes, such as biopolymers, are analyzed because the lattercompounds diffuse slowly through the porous structure of theparticles.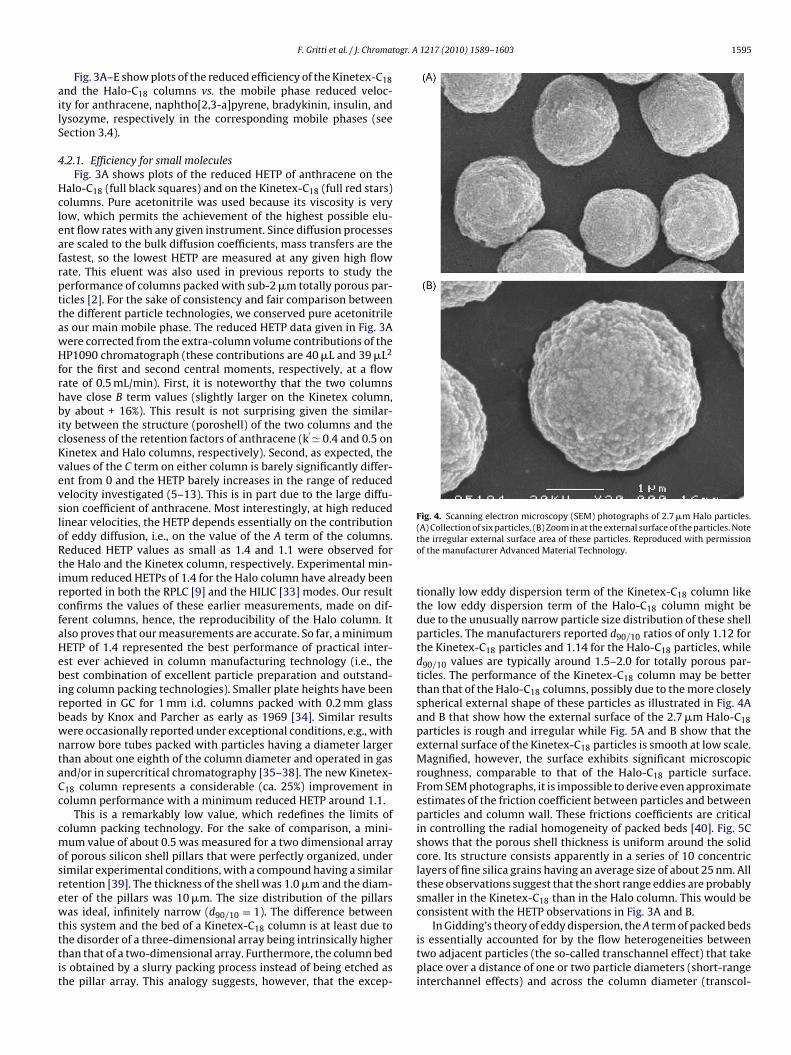
ogr. A 1217 (2010) 1589–1603 1595
ailS
4
HcleafrpttawHfrhbicKvevsloRtircfaHebirbwntaCc
cmosrewtttit
Fig. 4. Scanning electron microscopy (SEM) photographs of 2.7 �m Halo particles.
F. Gritti et al. / J. Chromat
Fig. 3A–E show plots of the reduced efficiency of the Kinetex-C18nd the Halo-C18 columns vs. the mobile phase reduced veloc-ty for anthracene, naphtho[2,3-a]pyrene, bradykinin, insulin, andysozyme, respectively in the corresponding mobile phases (seeection 3.4).
.2.1. Efficiency for small moleculesFig. 3A shows plots of the reduced HETP of anthracene on the
alo-C18 (full black squares) and on the Kinetex-C18 (full red stars)olumns. Pure acetonitrile was used because its viscosity is veryow, which permits the achievement of the highest possible elu-nt flow rates with any given instrument. Since diffusion processesre scaled to the bulk diffusion coefficients, mass transfers are theastest, so the lowest HETP are measured at any given high flowate. This eluent was also used in previous reports to study theerformance of columns packed with sub-2 �m totally porous par-icles [2]. For the sake of consistency and fair comparison betweenhe different particle technologies, we conserved pure acetonitriles our main mobile phase. The reduced HETP data given in Fig. 3Aere corrected from the extra-column volume contributions of theP1090 chromatograph (these contributions are 40 �L and 39 �L2
or the first and second central moments, respectively, at a flowate of 0.5 mL/min). First, it is noteworthy that the two columnsave close B term values (slightly larger on the Kinetex column,y about + 16%). This result is not surprising given the similar-
ty between the structure (poroshell) of the two columns and theloseness of the retention factors of anthracene (k
′� 0.4 and 0.5 oninetex and Halo columns, respectively). Second, as expected, thealues of the C term on either column is barely significantly differ-nt from 0 and the HETP barely increases in the range of reducedelocity investigated (5–13). This is in part due to the large diffu-ion coefficient of anthracene. Most interestingly, at high reducedinear velocities, the HETP depends essentially on the contributionf eddy diffusion, i.e., on the value of the A term of the columns.educed HETP values as small as 1.4 and 1.1 were observed forhe Halo and the Kinetex column, respectively. Experimental min-mum reduced HETPs of 1.4 for the Halo column have already beeneported in both the RPLC [9] and the HILIC [33] modes. Our resultonfirms the values of these earlier measurements, made on dif-erent columns, hence, the reproducibility of the Halo column. Itlso proves that our measurements are accurate. So far, a minimumETP of 1.4 represented the best performance of practical inter-st ever achieved in column manufacturing technology (i.e., theest combination of excellent particle preparation and outstand-
ng column packing technologies). Smaller plate heights have beeneported in GC for 1 mm i.d. columns packed with 0.2 mm glasseads by Knox and Parcher as early as 1969 [34]. Similar resultsere occasionally reported under exceptional conditions, e.g., witharrow bore tubes packed with particles having a diameter largerhan about one eighth of the column diameter and operated in gasnd/or in supercritical chromatography [35–38]. The new Kinetex-18 column represents a considerable (ca. 25%) improvement inolumn performance with a minimum reduced HETP around 1.1.
This is a remarkably low value, which redefines the limits ofolumn packing technology. For the sake of comparison, a mini-um value of about 0.5 was measured for a two dimensional array
f porous silicon shell pillars that were perfectly organized, underimilar experimental conditions, with a compound having a similaretention [39]. The thickness of the shell was 1.0 �m and the diam-ter of the pillars was 10 �m. The size distribution of the pillarsas ideal, infinitely narrow (d90/10 = 1). The difference between
his system and the bed of a Kinetex-C18 column is at least due tohe disorder of a three-dimensional array being intrinsically higherhan that of a two-dimensional array. Furthermore, the column beds obtained by a slurry packing process instead of being etched ashe pillar array. This analogy suggests, however, that the excep-
(A) Collection of six particles. (B) Zoom in at the external surface of the particles. Notethe irregular external surface area of these particles. Reproduced with permissionof the manufacturer Advanced Material Technology.
tionally low eddy dispersion term of the Kinetex-C18 column likethe low eddy dispersion term of the Halo-C18 column might bedue to the unusually narrow particle size distribution of these shellparticles. The manufacturers reported d90/10 ratios of only 1.12 forthe Kinetex-C18 particles and 1.14 for the Halo-C18 particles, whiled90/10 values are typically around 1.5–2.0 for totally porous par-ticles. The performance of the Kinetex-C18 column may be betterthan that of the Halo-C18 columns, possibly due to the more closelyspherical external shape of these particles as illustrated in Fig. 4Aand B that show how the external surface of the 2.7 �m Halo-C18particles is rough and irregular while Fig. 5A and B show that theexternal surface of the Kinetex-C18 particles is smooth at low scale.Magnified, however, the surface exhibits significant microscopicroughness, comparable to that of the Halo-C18 particle surface.From SEM photographs, it is impossible to derive even approximateestimates of the friction coefficient between particles and betweenparticles and column wall. These frictions coefficients are criticalin controlling the radial homogeneity of packed beds [40]. Fig. 5Cshows that the porous shell thickness is uniform around the solidcore. Its structure consists apparently in a series of 10 concentriclayers of fine silica grains having an average size of about 25 nm. Allthese observations suggest that the short range eddies are probablysmaller in the Kinetex-C18 than in the Halo column. This would beconsistent with the HETP observations in Fig. 3A and B.
In Gidding’s theory of eddy dispersion, the A term of packed beds
is essentially accounted for by the flow heterogeneities betweentwo adjacent particles (the so-called transchannel effect) that takeplace over a distance of one or two particle diameters (short-rangeinterchannel effects) and across the column diameter (transcol-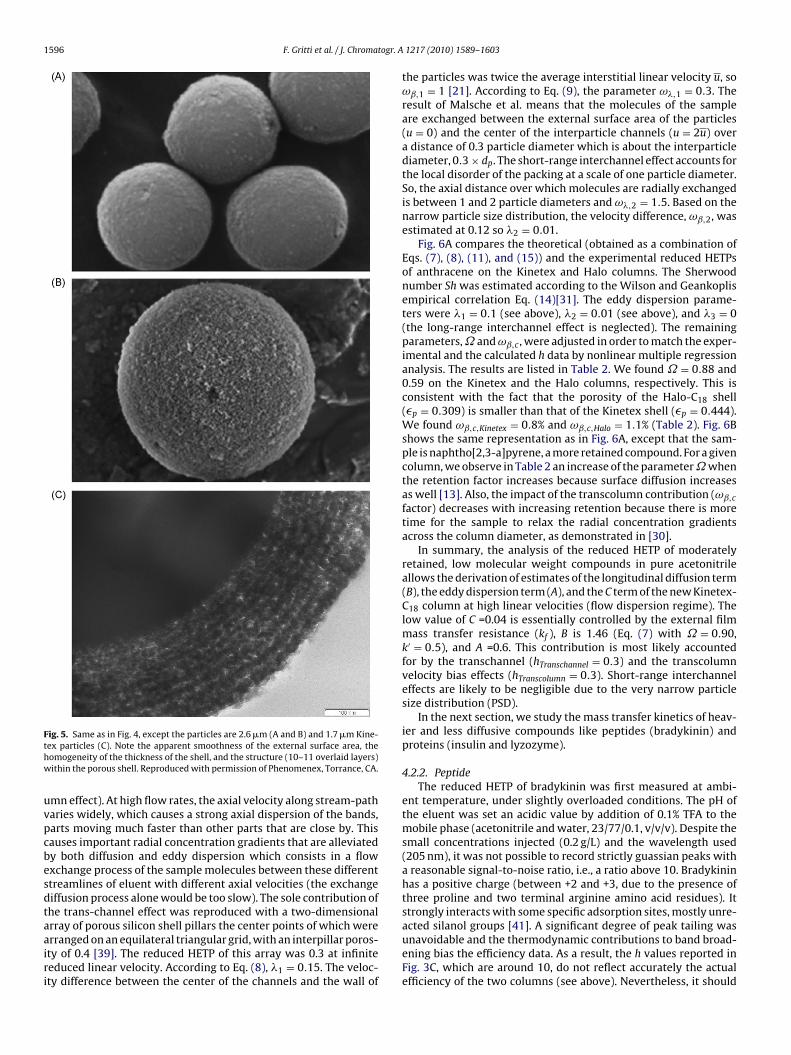
1596 F. Gritti et al. / J. Chromatogr. A
Fthw
uvpcbesdtaairi
ig. 5. Same as in Fig. 4, except the particles are 2.6 �m (A and B) and 1.7 �m Kine-ex particles (C). Note the apparent smoothness of the external surface area, theomogeneity of the thickness of the shell, and the structure (10–11 overlaid layers)ithin the porous shell. Reproduced with permission of Phenomenex, Torrance, CA.
mn effect). At high flow rates, the axial velocity along stream-patharies widely, which causes a strong axial dispersion of the bands,arts moving much faster than other parts that are close by. Thisauses important radial concentration gradients that are alleviatedy both diffusion and eddy dispersion which consists in a flowxchange process of the sample molecules between these differenttreamlines of eluent with different axial velocities (the exchangeiffusion process alone would be too slow). The sole contribution ofhe trans-channel effect was reproduced with a two-dimensional
rray of porous silicon shell pillars the center points of which wererranged on an equilateral triangular grid, with an interpillar poros-ty of 0.4 [39]. The reduced HETP of this array was 0.3 at infiniteeduced linear velocity. According to Eq. (8), 1 = 0.15. The veloc-ty difference between the center of the channels and the wall of1217 (2010) 1589–1603
the particles was twice the average interstitial linear velocity u, soωˇ,1 = 1 [21]. According to Eq. (9), the parameter ω,1 = 0.3. Theresult of Malsche et al. means that the molecules of the sampleare exchanged between the external surface area of the particles(u = 0) and the center of the interparticle channels (u = 2u) overa distance of 0.3 particle diameter which is about the interparticlediameter, 0.3 × dp. The short-range interchannel effect accounts forthe local disorder of the packing at a scale of one particle diameter.So, the axial distance over which molecules are radially exchangedis between 1 and 2 particle diameters and ω,2 = 1.5. Based on thenarrow particle size distribution, the velocity difference, ωˇ,2, wasestimated at 0.12 so 2 = 0.01.
Fig. 6A compares the theoretical (obtained as a combination ofEqs. (7), (8), (11), and (15)) and the experimental reduced HETPsof anthracene on the Kinetex and Halo columns. The Sherwoodnumber Sh was estimated according to the Wilson and Geankoplisempirical correlation Eq. (14)[31]. The eddy dispersion parame-ters were 1 = 0.1 (see above), 2 = 0.01 (see above), and 3 = 0(the long-range interchannel effect is neglected). The remainingparameters, ˝ and ωˇ,c , were adjusted in order to match the exper-imental and the calculated h data by nonlinear multiple regressionanalysis. The results are listed in Table 2. We found ˝ = 0.88 and0.59 on the Kinetex and the Halo columns, respectively. This isconsistent with the fact that the porosity of the Halo-C18 shell(�p = 0.309) is smaller than that of the Kinetex shell (�p = 0.444).We found ωˇ,c,Kinetex = 0.8% and ωˇ,c,Halo = 1.1% (Table 2). Fig. 6Bshows the same representation as in Fig. 6A, except that the sam-ple is naphtho[2,3-a]pyrene, a more retained compound. For a givencolumn, we observe in Table 2 an increase of the parameter ˝ whenthe retention factor increases because surface diffusion increasesas well [13]. Also, the impact of the transcolumn contribution (ωˇ,c
factor) decreases with increasing retention because there is moretime for the sample to relax the radial concentration gradientsacross the column diameter, as demonstrated in [30].
In summary, the analysis of the reduced HETP of moderatelyretained, low molecular weight compounds in pure acetonitrileallows the derivation of estimates of the longitudinal diffusion term(B), the eddy dispersion term (A), and the C term of the new Kinetex-C18 column at high linear velocities (flow dispersion regime). Thelow value of C =0.04 is essentially controlled by the external filmmass transfer resistance (kf ), B is 1.46 (Eq. (7) with ˝ = 0.90,k′ = 0.5), and A =0.6. This contribution is most likely accountedfor by the transchannel (hTranschannel = 0.3) and the transcolumnvelocity bias effects (hTranscolumn = 0.3). Short-range interchanneleffects are likely to be negligible due to the very narrow particlesize distribution (PSD).
In the next section, we study the mass transfer kinetics of heav-ier and less diffusive compounds like peptides (bradykinin) andproteins (insulin and lyzozyme).
4.2.2. PeptideThe reduced HETP of bradykinin was first measured at ambi-
ent temperature, under slightly overloaded conditions. The pH ofthe eluent was set an acidic value by addition of 0.1% TFA to themobile phase (acetonitrile and water, 23/77/0.1, v/v/v). Despite thesmall concentrations injected (0.2 g/L) and the wavelength used(205 nm), it was not possible to record strictly guassian peaks witha reasonable signal-to-noise ratio, i.e., a ratio above 10. Bradykininhas a positive charge (between +2 and +3, due to the presence ofthree proline and two terminal arginine amino acid residues). Itstrongly interacts with some specific adsorption sites, mostly unre-
acted silanol groups [41]. A significant degree of peak tailing wasunavoidable and the thermodynamic contributions to band broad-ening bias the efficiency data. As a result, the h values reported inFig. 3C, which are around 10, do not reflect accurately the actualefficiency of the two columns (see above). Nevertheless, it should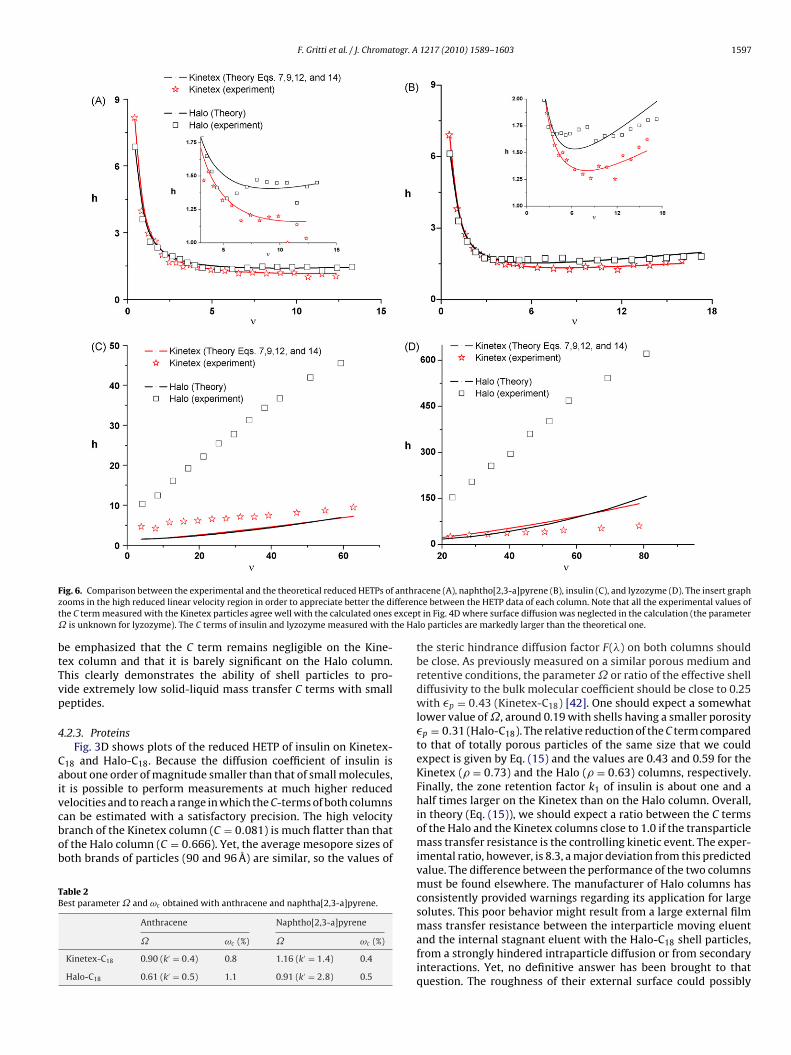
F. Gritti et al. / J. Chromatogr. A 1217 (2010) 1589–1603 1597
F anthrz fferent excep˝ he Ha
btTvp
4
Caivcbob
TB
ig. 6. Comparison between the experimental and the theoretical reduced HETPs ofooms in the high reduced linear velocity region in order to appreciate better the dihe C term measured with the Kinetex particles agree well with the calculated ones
is unknown for lyzozyme). The C terms of insulin and lyzozyme measured with t
e emphasized that the C term remains negligible on the Kine-ex column and that it is barely significant on the Halo column.his clearly demonstrates the ability of shell particles to pro-ide extremely low solid-liquid mass transfer C terms with smalleptides.
.2.3. ProteinsFig. 3D shows plots of the reduced HETP of insulin on Kinetex-
18 and Halo-C18. Because the diffusion coefficient of insulin isbout one order of magnitude smaller than that of small molecules,t is possible to perform measurements at much higher reduced
elocities and to reach a range in which the C-terms of both columnsan be estimated with a satisfactory precision. The high velocityranch of the Kinetex column (C = 0.081) is much flatter than thatf the Halo column (C = 0.666). Yet, the average mesopore sizes ofoth brands of particles (90 and 96 Å) are similar, so the values ofable 2est parameter ˝ and ωc obtained with anthracene and naphtha[2,3-a]pyrene.
Anthracene Naphtho[2,3-a]pyrene
˝ ωc (%) ˝ ωc (%)
Kinetex-C18 0.90 (k′ = 0.4) 0.8 1.16 (k′ = 1.4) 0.4
Halo-C18 0.61 (k′ = 0.5) 1.1 0.91 (k′ = 2.8) 0.5
acene (A), naphtho[2,3-a]pyrene (B), insulin (C), and lyzozyme (D). The insert graphce between the HETP data of each column. Note that all the experimental values oft in Fig. 4D where surface diffusion was neglected in the calculation (the parameterlo particles are markedly larger than the theoretical one.
the steric hindrance diffusion factor F() on both columns shouldbe close. As previously measured on a similar porous medium andretentive conditions, the parameter ˝ or ratio of the effective shelldiffusivity to the bulk molecular coefficient should be close to 0.25with �p = 0.43 (Kinetex-C18) [42]. One should expect a somewhatlower value of ˝, around 0.19 with shells having a smaller porosity�p = 0.31 (Halo-C18). The relative reduction of the C term comparedto that of totally porous particles of the same size that we couldexpect is given by Eq. (15) and the values are 0.43 and 0.59 for theKinetex (� = 0.73) and the Halo (� = 0.63) columns, respectively.Finally, the zone retention factor k1 of insulin is about one and ahalf times larger on the Kinetex than on the Halo column. Overall,in theory (Eq. (15)), we should expect a ratio between the C termsof the Halo and the Kinetex columns close to 1.0 if the transparticlemass transfer resistance is the controlling kinetic event. The exper-imental ratio, however, is 8.3, a major deviation from this predictedvalue. The difference between the performance of the two columnsmust be found elsewhere. The manufacturer of Halo columns hasconsistently provided warnings regarding its application for largesolutes. This poor behavior might result from a large external film
mass transfer resistance between the interparticle moving eluentand the internal stagnant eluent with the Halo-C18 shell particles,from a strongly hindered intraparticle diffusion or from secondaryinteractions. Yet, no definitive answer has been brought to thatquestion. The roughness of their external surface could possibly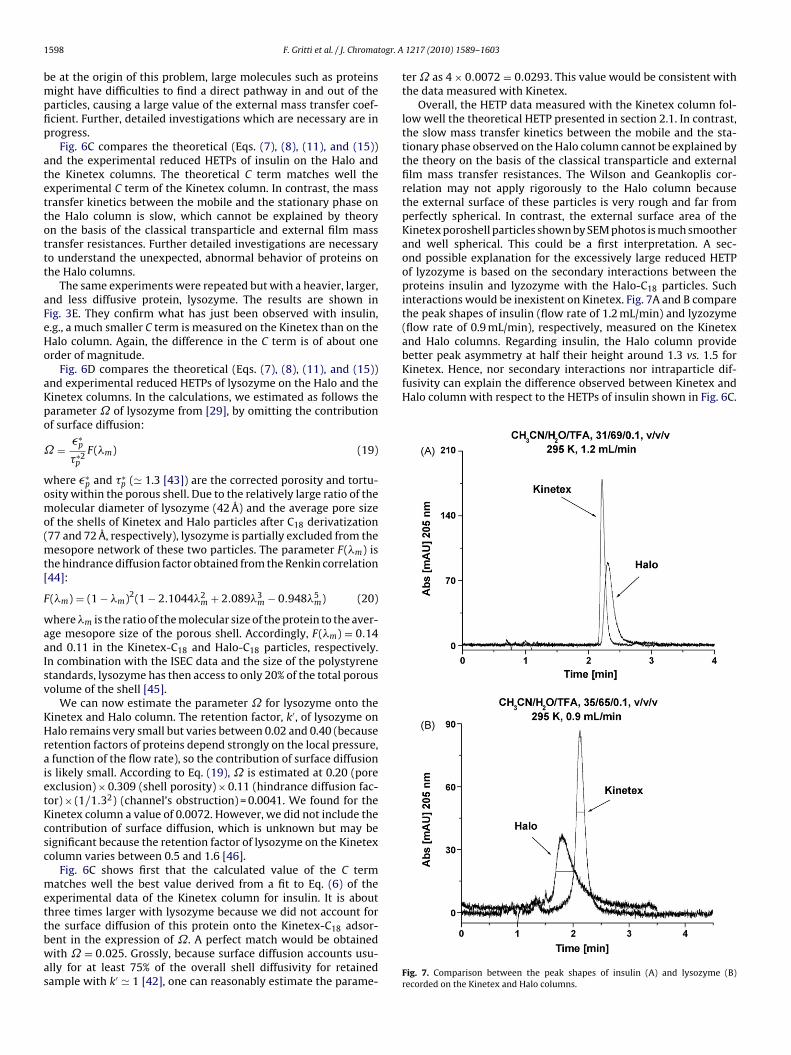
1 togr. A
bmpfip
atettottt
aFeHo
aKpo
˝
womo(mt[
F
waaIsv
KHraietKcsc
mettbwas
better peak asymmetry at half their height around 1.3 vs. 1.5 forKinetex. Hence, nor secondary interactions nor intraparticle dif-fusivity can explain the difference observed between Kinetex andHalo column with respect to the HETPs of insulin shown in Fig. 6C.
598 F. Gritti et al. / J. Chroma
e at the origin of this problem, large molecules such as proteinsight have difficulties to find a direct pathway in and out of the
articles, causing a large value of the external mass transfer coef-cient. Further, detailed investigations which are necessary are inrogress.
Fig. 6C compares the theoretical (Eqs. (7), (8), (11), and (15))nd the experimental reduced HETPs of insulin on the Halo andhe Kinetex columns. The theoretical C term matches well thexperimental C term of the Kinetex column. In contrast, the massransfer kinetics between the mobile and the stationary phase onhe Halo column is slow, which cannot be explained by theoryn the basis of the classical transparticle and external film massransfer resistances. Further detailed investigations are necessaryo understand the unexpected, abnormal behavior of proteins onhe Halo columns.
The same experiments were repeated but with a heavier, larger,nd less diffusive protein, lysozyme. The results are shown inig. 3E. They confirm what has just been observed with insulin,.g., a much smaller C term is measured on the Kinetex than on thealo column. Again, the difference in the C term is of about onerder of magnitude.
Fig. 6D compares the theoretical (Eqs. (7), (8), (11), and (15))nd experimental reduced HETPs of lysozyme on the Halo and theinetex columns. In the calculations, we estimated as follows thearameter ˝ of lysozyme from [29], by omitting the contributionf surface diffusion:
= �∗p
∗2p
F(m) (19)
here �∗p and ∗
p (� 1.3 [43]) are the corrected porosity and tortu-sity within the porous shell. Due to the relatively large ratio of theolecular diameter of lysozyme (42 Å) and the average pore size
f the shells of Kinetex and Halo particles after C18 derivatization77 and 72 Å, respectively), lysozyme is partially excluded from the
esopore network of these two particles. The parameter F(m) ishe hindrance diffusion factor obtained from the Renkin correlation44]:
(m) = (1 − m)2(1 − 2.10442m + 2.0893
m − 0.9485m) (20)
here m is the ratio of the molecular size of the protein to the aver-ge mesopore size of the porous shell. Accordingly, F(m) = 0.14nd 0.11 in the Kinetex-C18 and Halo-C18 particles, respectively.n combination with the ISEC data and the size of the polystyrenetandards, lysozyme has then access to only 20% of the total porousolume of the shell [45].
We can now estimate the parameter ˝ for lysozyme onto theinetex and Halo column. The retention factor, k′, of lysozyme onalo remains very small but varies between 0.02 and 0.40 (because
etention factors of proteins depend strongly on the local pressure,function of the flow rate), so the contribution of surface diffusion
s likely small. According to Eq. (19), ˝ is estimated at 0.20 (porexclusion) × 0.309 (shell porosity) × 0.11 (hindrance diffusion fac-or) × (1/1.32) (channel’s obstruction) = 0.0041. We found for theinetex column a value of 0.0072. However, we did not include theontribution of surface diffusion, which is unknown but may beignificant because the retention factor of lysozyme on the Kinetexolumn varies between 0.5 and 1.6 [46].
Fig. 6C shows first that the calculated value of the C termatches well the best value derived from a fit to Eq. (6) of the
xperimental data of the Kinetex column for insulin. It is abouthree times larger with lysozyme because we did not account for
he surface diffusion of this protein onto the Kinetex-C18 adsor-ent in the expression of ˝. A perfect match would be obtainedith ˝ = 0.025. Grossly, because surface diffusion accounts usu-lly for at least 75% of the overall shell diffusivity for retainedample with k′ � 1 [42], one can reasonably estimate the parame-
1217 (2010) 1589–1603
ter ˝ as 4 × 0.0072 = 0.0293. This value would be consistent withthe data measured with Kinetex.
Overall, the HETP data measured with the Kinetex column fol-low well the theoretical HETP presented in section 2.1. In contrast,the slow mass transfer kinetics between the mobile and the sta-tionary phase observed on the Halo column cannot be explained bythe theory on the basis of the classical transparticle and externalfilm mass transfer resistances. The Wilson and Geankoplis cor-relation may not apply rigorously to the Halo column becausethe external surface of these particles is very rough and far fromperfectly spherical. In contrast, the external surface area of theKinetex poroshell particles shown by SEM photos is much smootherand well spherical. This could be a first interpretation. A sec-ond possible explanation for the excessively large reduced HETPof lyzozyme is based on the secondary interactions between theproteins insulin and lyzozyme with the Halo-C18 particles. Suchinteractions would be inexistent on Kinetex. Fig. 7A and B comparethe peak shapes of insulin (flow rate of 1.2 mL/min) and lyzozyme(flow rate of 0.9 mL/min), respectively, measured on the Kinetexand Halo columns. Regarding insulin, the Halo column provide
Fig. 7. Comparison between the peak shapes of insulin (A) and lysozyme (B)recorded on the Kinetex and Halo columns.
F. Gritti et al. / J. Chromatogr. A
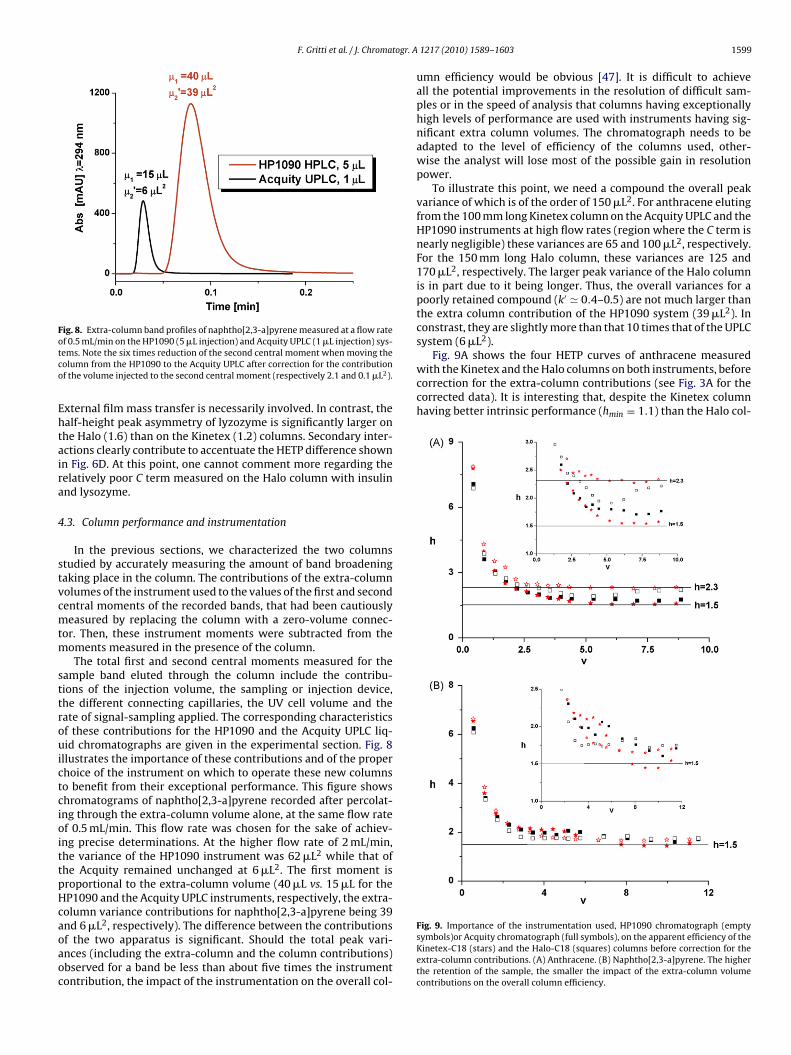
Fig. 8. Extra-column band profiles of naphtho[2,3-a]pyrene measured at a flow rateotco
Ehtaira
4
stvcmtm
sttrouictcioittpHcaoaoc
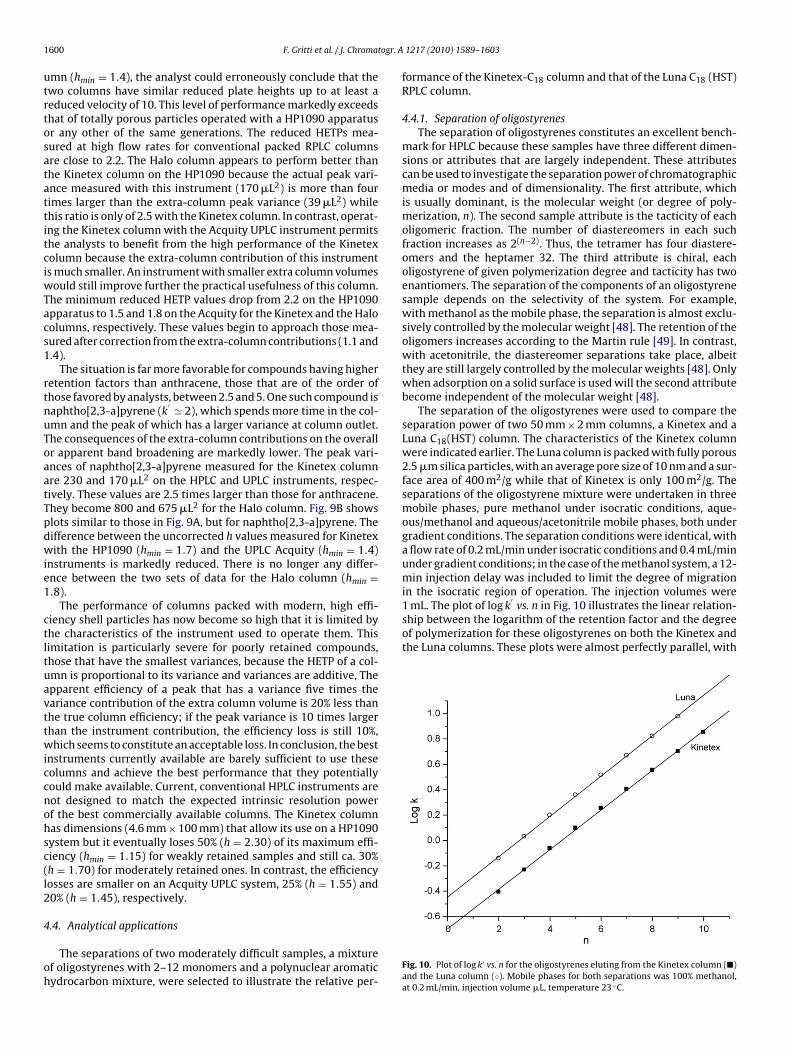
Fig. 9A shows the four HETP curves of anthracene measuredwith the Kinetex and the Halo columns on both instruments, beforecorrection for the extra-column contributions (see Fig. 3A for thecorrected data). It is interesting that, despite the Kinetex columnhaving better intrinsic performance (hmin = 1.1) than the Halo col-
f 0.5 mL/min on the HP1090 (5 �L injection) and Acquity UPLC (1 �L injection) sys-ems. Note the six times reduction of the second central moment when moving theolumn from the HP1090 to the Acquity UPLC after correction for the contributionf the volume injected to the second central moment (respectively 2.1 and 0.1 �L2).
xternal film mass transfer is necessarily involved. In contrast, thealf-height peak asymmetry of lyzozyme is significantly larger onhe Halo (1.6) than on the Kinetex (1.2) columns. Secondary inter-ctions clearly contribute to accentuate the HETP difference shownn Fig. 6D. At this point, one cannot comment more regarding theelatively poor C term measured on the Halo column with insulinnd lysozyme.
.3. Column performance and instrumentation
In the previous sections, we characterized the two columnstudied by accurately measuring the amount of band broadeningaking place in the column. The contributions of the extra-columnolumes of the instrument used to the values of the first and secondentral moments of the recorded bands, that had been cautiouslyeasured by replacing the column with a zero-volume connec-
or. Then, these instrument moments were subtracted from theoments measured in the presence of the column.The total first and second central moments measured for the
ample band eluted through the column include the contribu-ions of the injection volume, the sampling or injection device,he different connecting capillaries, the UV cell volume and theate of signal-sampling applied. The corresponding characteristicsf these contributions for the HP1090 and the Acquity UPLC liq-id chromatographs are given in the experimental section. Fig. 8
llustrates the importance of these contributions and of the properhoice of the instrument on which to operate these new columnso benefit from their exceptional performance. This figure showshromatograms of naphtho[2,3-a]pyrene recorded after percolat-ng through the extra-column volume alone, at the same flow ratef 0.5 mL/min. This flow rate was chosen for the sake of achiev-ng precise determinations. At the higher flow rate of 2 mL/min,he variance of the HP1090 instrument was 62 �L2 while that ofhe Acquity remained unchanged at 6 �L2. The first moment isroportional to the extra-column volume (40 �L vs. 15 �L for theP1090 and the Acquity UPLC instruments, respectively, the extra-olumn variance contributions for naphtho[2,3-a]pyrene being 39
2
nd 6 �L , respectively). The difference between the contributionsf the two apparatus is significant. Should the total peak vari-nces (including the extra-column and the column contributions)bserved for a band be less than about five times the instrumentontribution, the impact of the instrumentation on the overall col-1217 (2010) 1589–1603 1599
umn efficiency would be obvious [47]. It is difficult to achieveall the potential improvements in the resolution of difficult sam-ples or in the speed of analysis that columns having exceptionallyhigh levels of performance are used with instruments having sig-nificant extra column volumes. The chromatograph needs to beadapted to the level of efficiency of the columns used, other-wise the analyst will lose most of the possible gain in resolutionpower.
To illustrate this point, we need a compound the overall peakvariance of which is of the order of 150 �L2. For anthracene elutingfrom the 100 mm long Kinetex column on the Acquity UPLC and theHP1090 instruments at high flow rates (region where the C term isnearly negligible) these variances are 65 and 100 �L2, respectively.For the 150 mm long Halo column, these variances are 125 and170 �L2, respectively. The larger peak variance of the Halo columnis in part due to it being longer. Thus, the overall variances for apoorly retained compound (k′ � 0.4–0.5) are not much larger thanthe extra column contribution of the HP1090 system (39 �L2). Inconstrast, they are slightly more than that 10 times that of the UPLCsystem (6 �L2).
Fig. 9. Importance of the instrumentation used, HP1090 chromatograph (emptysymbols)or Acquity chromatograph (full symbols), on the apparent efficiency of theKinetex-C18 (stars) and the Halo-C18 (squares) columns before correction for theextra-column contributions. (A) Anthracene. (B) Naphtho[2,3-a]pyrene. The higherthe retention of the sample, the smaller the impact of the extra-column volumecontributions on the overall column efficiency.
1 togr. A
utrtosatattitciwTacs1
rtnuToaatTpdwie1
ctltuavttwiccnohsc(l2
4
oh
in the isocratic region of operation. The injection volumes were1 mL. The plot of log k
′vs. n in Fig. 10 illustrates the linear relation-
ship between the logarithm of the retention factor and the degreeof polymerization for these oligostyrenes on both the Kinetex andthe Luna columns. These plots were almost perfectly parallel, with
600 F. Gritti et al. / J. Chroma
mn (hmin = 1.4), the analyst could erroneously conclude that thewo columns have similar reduced plate heights up to at least aeduced velocity of 10. This level of performance markedly exceedshat of totally porous particles operated with a HP1090 apparatusr any other of the same generations. The reduced HETPs mea-ured at high flow rates for conventional packed RPLC columnsre close to 2.2. The Halo column appears to perform better thanhe Kinetex column on the HP1090 because the actual peak vari-nce measured with this instrument (170 �L2) is more than fourimes larger than the extra-column peak variance (39 �L2) whilehis ratio is only of 2.5 with the Kinetex column. In contrast, operat-ng the Kinetex column with the Acquity UPLC instrument permitshe analysts to benefit from the high performance of the Kinetexolumn because the extra-column contribution of this instruments much smaller. An instrument with smaller extra column volumes
ould still improve further the practical usefulness of this column.he minimum reduced HETP values drop from 2.2 on the HP1090pparatus to 1.5 and 1.8 on the Acquity for the Kinetex and the Haloolumns, respectively. These values begin to approach those mea-ured after correction from the extra-column contributions (1.1 and.4).
The situation is far more favorable for compounds having higheretention factors than anthracene, those that are of the order ofhose favored by analysts, between 2.5 and 5. One such compound isaphtho[2,3-a]pyrene (k
′ � 2), which spends more time in the col-mn and the peak of which has a larger variance at column outlet.he consequences of the extra-column contributions on the overallr apparent band broadening are markedly lower. The peak vari-nces of naphtho[2,3-a]pyrene measured for the Kinetex columnre 230 and 170 �L2 on the HPLC and UPLC instruments, respec-ively. These values are 2.5 times larger than those for anthracene.hey become 800 and 675 �L2 for the Halo column. Fig. 9B showslots similar to those in Fig. 9A, but for naphtho[2,3-a]pyrene. Theifference between the uncorrected h values measured for Kinetexith the HP1090 (hmin = 1.7) and the UPLC Acquity (hmin = 1.4)
nstruments is markedly reduced. There is no longer any differ-nce between the two sets of data for the Halo column (hmin =.8).
The performance of columns packed with modern, high effi-iency shell particles has now become so high that it is limited byhe characteristics of the instrument used to operate them. Thisimitation is particularly severe for poorly retained compounds,hose that have the smallest variances, because the HETP of a col-mn is proportional to its variance and variances are additive, Thepparent efficiency of a peak that has a variance five times theariance contribution of the extra column volume is 20% less thanhe true column efficiency; if the peak variance is 10 times largerhan the instrument contribution, the efficiency loss is still 10%,hich seems to constitute an acceptable loss. In conclusion, the best
nstruments currently available are barely sufficient to use theseolumns and achieve the best performance that they potentiallyould make available. Current, conventional HPLC instruments areot designed to match the expected intrinsic resolution powerf the best commercially available columns. The Kinetex columnas dimensions (4.6 mm × 100 mm) that allow its use on a HP1090ystem but it eventually loses 50% (h = 2.30) of its maximum effi-iency (hmin = 1.15) for weakly retained samples and still ca. 30%h = 1.70) for moderately retained ones. In contrast, the efficiencyosses are smaller on an Acquity UPLC system, 25% (h = 1.55) and0% (h = 1.45), respectively.
.4. Analytical applications
The separations of two moderately difficult samples, a mixturef oligostyrenes with 2–12 monomers and a polynuclear aromaticydrocarbon mixture, were selected to illustrate the relative per-
1217 (2010) 1589–1603
formance of the Kinetex-C18 column and that of the Luna C18 (HST)RPLC column.
4.4.1. Separation of oligostyrenesThe separation of oligostyrenes constitutes an excellent bench-
mark for HPLC because these samples have three different dimen-sions or attributes that are largely independent. These attributescan be used to investigate the separation power of chromatographicmedia or modes and of dimensionality. The first attribute, whichis usually dominant, is the molecular weight (or degree of poly-merization, n). The second sample attribute is the tacticity of eacholigomeric fraction. The number of diastereomers in each suchfraction increases as 2(n−2). Thus, the tetramer has four diastere-omers and the heptamer 32. The third attribute is chiral, eacholigostyrene of given polymerization degree and tacticity has twoenantiomers. The separation of the components of an oligostyrenesample depends on the selectivity of the system. For example,with methanol as the mobile phase, the separation is almost exclu-sively controlled by the molecular weight [48]. The retention of theoligomers increases according to the Martin rule [49]. In contrast,with acetonitrile, the diastereomer separations take place, albeitthey are still largely controlled by the molecular weights [48]. Onlywhen adsorption on a solid surface is used will the second attributebecome independent of the molecular weight [48].
The separation of the oligostyrenes were used to compare theseparation power of two 50 mm × 2 mm columns, a Kinetex and aLuna C18(HST) column. The characteristics of the Kinetex columnwere indicated earlier. The Luna column is packed with fully porous2.5 �m silica particles, with an average pore size of 10 nm and a sur-face area of 400 m2/g while that of Kinetex is only 100 m2/g. Theseparations of the oligostyrene mixture were undertaken in threemobile phases, pure methanol under isocratic conditions, aque-ous/methanol and aqueous/acetonitrile mobile phases, both undergradient conditions. The separation conditions were identical, witha flow rate of 0.2 mL/min under isocratic conditions and 0.4 mL/minunder gradient conditions; in the case of the methanol system, a 12-min injection delay was included to limit the degree of migration
Fig. 10. Plot of log k′ vs. n for the oligostyrenes eluting from the Kinetex column (�)and the Luna column (◦). Mobile phases for both separations was 100% methanol,at 0.2 mL/min, injection volume �L, temperature 23 ◦C.
F. Gritti et al. / J. Chromatogr. A 1217 (2010) 1589–1603 1601
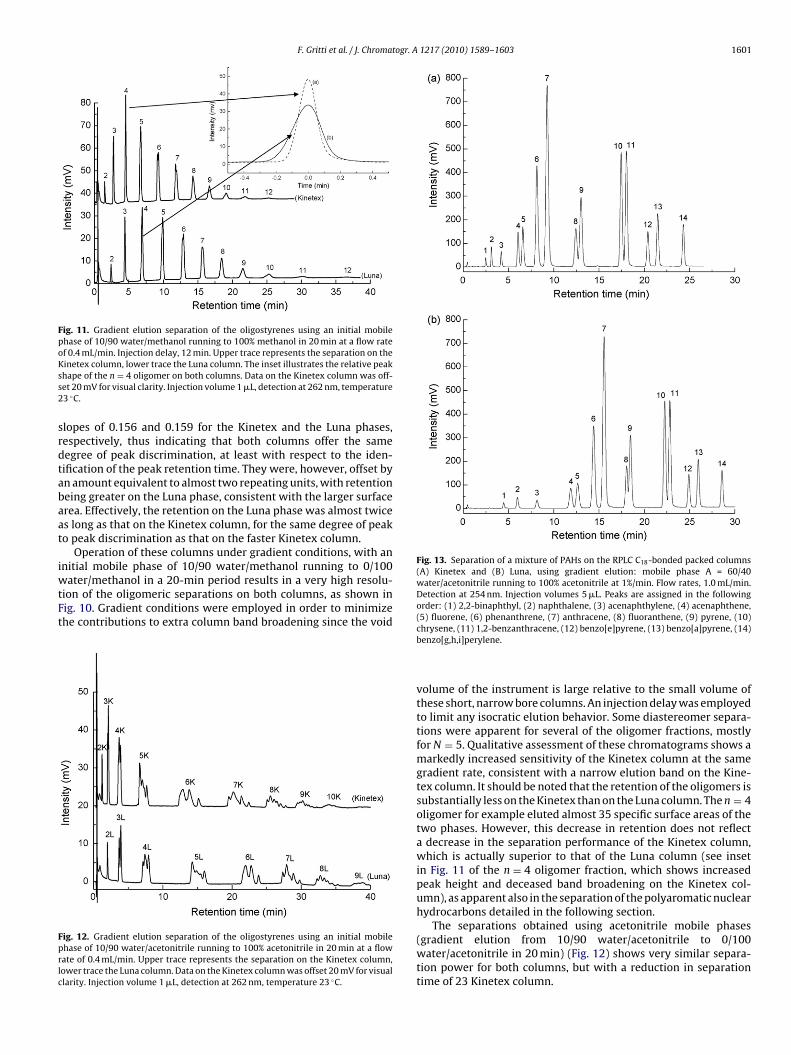
Fig. 11. Gradient elution separation of the oligostyrenes using an initial mobilephase of 10/90 water/methanol running to 100% methanol in 20 min at a flow rateof 0.4 mL/min. Injection delay, 12 min. Upper trace represents the separation on theKss2
srdtabaat
iwtFt
Fprlc
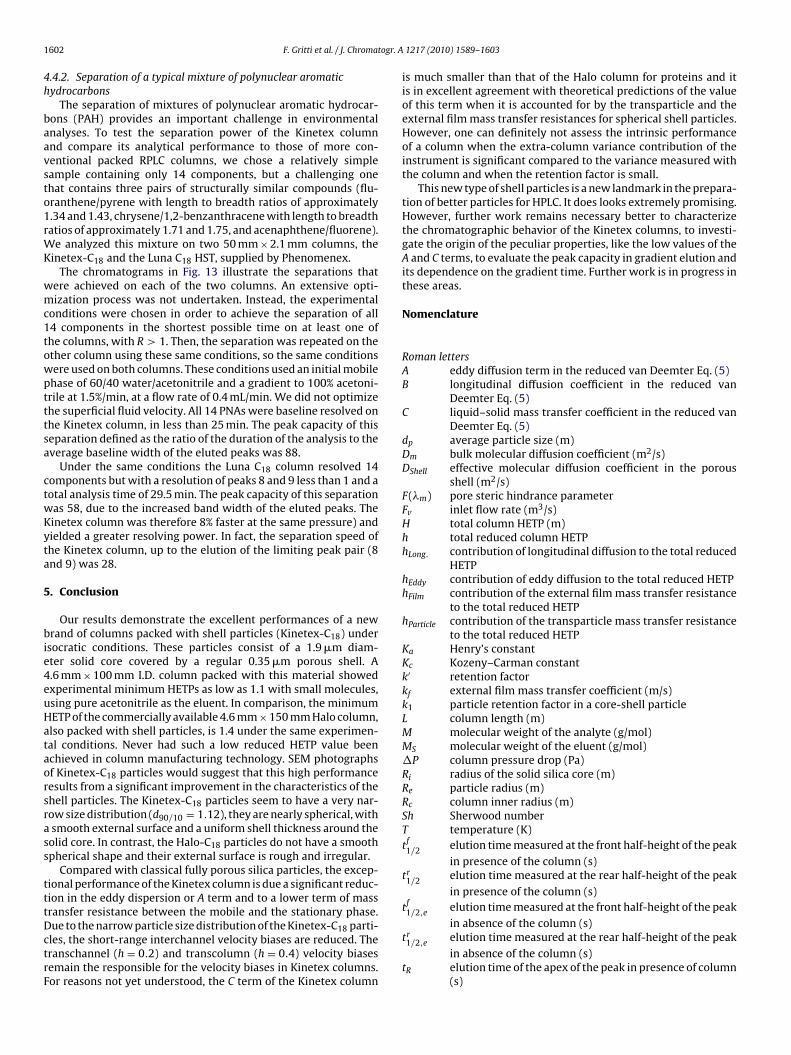
Fig. 13. Separation of a mixture of PAHs on the RPLC C18-bonded packed columns
inetex column, lower trace the Luna column. The inset illustrates the relative peakhape of the n = 4 oligomer on both columns. Data on the Kinetex column was off-et 20 mV for visual clarity. Injection volume 1 �L, detection at 262 nm, temperature3 ◦C.
lopes of 0.156 and 0.159 for the Kinetex and the Luna phases,espectively, thus indicating that both columns offer the sameegree of peak discrimination, at least with respect to the iden-ification of the peak retention time. They were, however, offset byn amount equivalent to almost two repeating units, with retentioneing greater on the Luna phase, consistent with the larger surfacerea. Effectively, the retention on the Luna phase was almost twices long as that on the Kinetex column, for the same degree of peako peak discrimination as that on the faster Kinetex column.
Operation of these columns under gradient conditions, with an
nitial mobile phase of 10/90 water/methanol running to 0/100ater/methanol in a 20-min period results in a very high resolu-ion of the oligomeric separations on both columns, as shown inig. 10. Gradient conditions were employed in order to minimizehe contributions to extra column band broadening since the void
ig. 12. Gradient elution separation of the oligostyrenes using an initial mobilehase of 10/90 water/acetonitrile running to 100% acetonitrile in 20 min at a flowate of 0.4 mL/min. Upper trace represents the separation on the Kinetex column,ower trace the Luna column. Data on the Kinetex column was offset 20 mV for visuallarity. Injection volume 1 �L, detection at 262 nm, temperature 23 ◦C.
(A) Kinetex and (B) Luna, using gradient elution: mobile phase A = 60/40water/acetonitrile running to 100% acetonitrile at 1%/min. Flow rates, 1.0 mL/min.Detection at 254 nm. Injection volumes 5 �L. Peaks are assigned in the followingorder: (1) 2,2-binaphthyl, (2) naphthalene, (3) acenaphthylene, (4) acenaphthene,(5) fluorene, (6) phenanthrene, (7) anthracene, (8) fluoranthene, (9) pyrene, (10)
chrysene, (11) 1,2-benzanthracene, (12) benzo[e]pyrene, (13) benzo[a]pyrene, (14)benzo[g,h,i]perylene.volume of the instrument is large relative to the small volume ofthese short, narrow bore columns. An injection delay was employedto limit any isocratic elution behavior. Some diastereomer separa-tions were apparent for several of the oligomer fractions, mostlyfor N = 5. Qualitative assessment of these chromatograms shows amarkedly increased sensitivity of the Kinetex column at the samegradient rate, consistent with a narrow elution band on the Kine-tex column. It should be noted that the retention of the oligomers issubstantially less on the Kinetex than on the Luna column. The n = 4oligomer for example eluted almost 35 specific surface areas of thetwo phases. However, this decrease in retention does not reflecta decrease in the separation performance of the Kinetex column,which is actually superior to that of the Luna column (see insetin Fig. 11 of the n = 4 oligomer fraction, which shows increasedpeak height and deceased band broadening on the Kinetex col-umn), as apparent also in the separation of the polyaromatic nuclearhydrocarbons detailed in the following section.
The separations obtained using acetonitrile mobile phases(gradient elution from 10/90 water/acetonitrile to 0/100water/acetonitrile in 20 min) (Fig. 12) shows very similar separa-tion power for both columns, but with a reduction in separationtime of 23 Kinetex column.
1 togr. A
4h
baavsto1rWK
wmc1towptttsa
ctwKyta
5
bie4euHataorsrass
tttDctrF
602 F. Gritti et al. / J. Chroma
.4.2. Separation of a typical mixture of polynuclear aromaticydrocarbons
The separation of mixtures of polynuclear aromatic hydrocar-ons (PAH) provides an important challenge in environmentalnalyses. To test the separation power of the Kinetex columnnd compare its analytical performance to those of more con-entional packed RPLC columns, we chose a relatively simpleample containing only 14 components, but a challenging onehat contains three pairs of structurally similar compounds (flu-ranthene/pyrene with length to breadth ratios of approximately.34 and 1.43, chrysene/1,2-benzanthracene with length to breadthatios of approximately 1.71 and 1.75, and acenaphthene/fluorene).
e analyzed this mixture on two 50 mm × 2.1 mm columns, theinetex-C18 and the Luna C18 HST, supplied by Phenomenex.
The chromatograms in Fig. 13 illustrate the separations thatere achieved on each of the two columns. An extensive opti-ization process was not undertaken. Instead, the experimental
onditions were chosen in order to achieve the separation of all4 components in the shortest possible time on at least one ofhe columns, with R > 1. Then, the separation was repeated on thether column using these same conditions, so the same conditionsere used on both columns. These conditions used an initial mobilehase of 60/40 water/acetonitrile and a gradient to 100% acetoni-rile at 1.5%/min, at a flow rate of 0.4 mL/min. We did not optimizehe superficial fluid velocity. All 14 PNAs were baseline resolved onhe Kinetex column, in less than 25 min. The peak capacity of thiseparation defined as the ratio of the duration of the analysis to theverage baseline width of the eluted peaks was 88.
Under the same conditions the Luna C18 column resolved 14omponents but with a resolution of peaks 8 and 9 less than 1 and aotal analysis time of 29.5 min. The peak capacity of this separationas 58, due to the increased band width of the eluted peaks. Theinetex column was therefore 8% faster at the same pressure) andielded a greater resolving power. In fact, the separation speed ofhe Kinetex column, up to the elution of the limiting peak pair (8nd 9) was 28.
. Conclusion
Our results demonstrate the excellent performances of a newrand of columns packed with shell particles (Kinetex-C18) under
socratic conditions. These particles consist of a 1.9 �m diam-ter solid core covered by a regular 0.35 �m porous shell. A.6 mm × 100 mm I.D. column packed with this material showedxperimental minimum HETPs as low as 1.1 with small molecules,sing pure acetonitrile as the eluent. In comparison, the minimumETP of the commercially available 4.6 mm × 150 mm Halo column,lso packed with shell particles, is 1.4 under the same experimen-al conditions. Never had such a low reduced HETP value beenchieved in column manufacturing technology. SEM photographsf Kinetex-C18 particles would suggest that this high performanceesults from a significant improvement in the characteristics of thehell particles. The Kinetex-C18 particles seem to have a very nar-ow size distribution (d90/10 = 1.12), they are nearly spherical, withsmooth external surface and a uniform shell thickness around theolid core. In contrast, the Halo-C18 particles do not have a smoothpherical shape and their external surface is rough and irregular.
Compared with classical fully porous silica particles, the excep-ional performance of the Kinetex column is due a significant reduc-ion in the eddy dispersion or A term and to a lower term of massransfer resistance between the mobile and the stationary phase.
ue to the narrow particle size distribution of the Kinetex-C18 parti-les, the short-range interchannel velocity biases are reduced. Theranschannel (h = 0.2) and transcolumn (h = 0.4) velocity biasesemain the responsible for the velocity biases in Kinetex columns.or reasons not yet understood, the C term of the Kinetex column1217 (2010) 1589–1603
is much smaller than that of the Halo column for proteins and itis in excellent agreement with theoretical predictions of the valueof this term when it is accounted for by the transparticle and theexternal film mass transfer resistances for spherical shell particles.However, one can definitely not assess the intrinsic performanceof a column when the extra-column variance contribution of theinstrument is significant compared to the variance measured withthe column and when the retention factor is small.
This new type of shell particles is a new landmark in the prepara-tion of better particles for HPLC. It does looks extremely promising.However, further work remains necessary better to characterizethe chromatographic behavior of the Kinetex columns, to investi-gate the origin of the peculiar properties, like the low values of theA and C terms, to evaluate the peak capacity in gradient elution andits dependence on the gradient time. Further work is in progress inthese areas.
Nomenclature
Roman lettersA eddy diffusion term in the reduced van Deemter Eq. (5)B longitudinal diffusion coefficient in the reduced van
Deemter Eq. (5)C liquid–solid mass transfer coefficient in the reduced van
Deemter Eq. (5)dp average particle size (m)Dm bulk molecular diffusion coefficient (m2/s)DShell effective molecular diffusion coefficient in the porous
shell (m2/s)F(m) pore steric hindrance parameterFv inlet flow rate (m3/s)H total column HETP (m)h total reduced column HETPhLong. contribution of longitudinal diffusion to the total reduced
HETPhEddy contribution of eddy diffusion to the total reduced HETPhFilm contribution of the external film mass transfer resistance
to the total reduced HETPhParticle contribution of the transparticle mass transfer resistance
to the total reduced HETPKa Henry’s constantKc Kozeny–Carman constantk′ retention factorkf external film mass transfer coefficient (m/s)k1 particle retention factor in a core-shell particleL column length (m)M molecular weight of the analyte (g/mol)MS molecular weight of the eluent (g/mol)�P column pressure drop (Pa)Ri radius of the solid silica core (m)Re particle radius (m)Rc column inner radius (m)Sh Sherwood numberT temperature (K)tf1/2 elution time measured at the front half-height of the peak
in presence of the column (s)tr1/2 elution time measured at the rear half-height of the peak
in presence of the column (s)tf1/2,e
elution time measured at the front half-height of the peak
in absence of the column (s)tr1/2,e
elution time measured at the rear half-height of the peakin absence of the column (s)
tR elution time of the apex of the peak in presence of column(s)
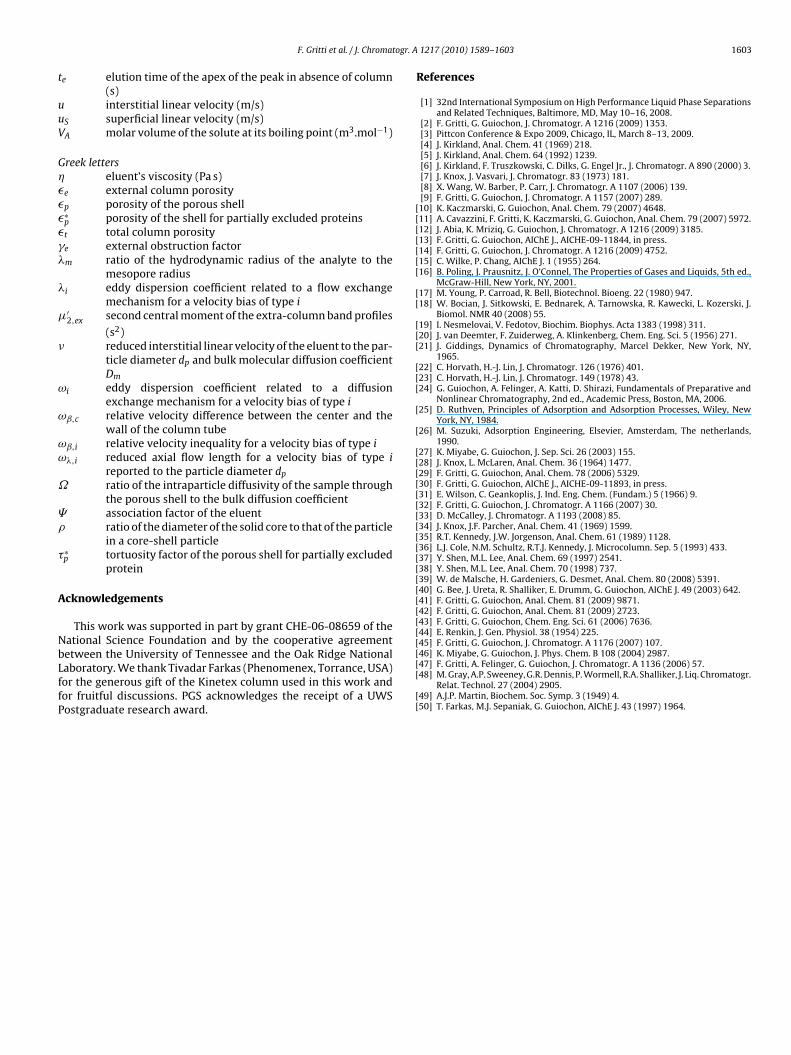
ogr. A
t
uuV
G������
�
�
ω
ω
ωω
˝
��
A
NbLffP
[[[[[[[
[[
[[[
[[[
[
[
[[[[[[[[[[[[[[[[[[[
F. Gritti et al. / J. Chromat
e elution time of the apex of the peak in absence of column(s)interstitial linear velocity (m/s)
S superficial linear velocity (m/s)A molar volume of the solute at its boiling point (m3.mol−1)
reek letterseluent’s viscosity (Pa s)
e external column porosityp porosity of the porous shell∗p porosity of the shell for partially excluded proteinst total column porositye external obstruction factorm ratio of the hydrodynamic radius of the analyte to the
mesopore radiusi eddy dispersion coefficient related to a flow exchange
mechanism for a velocity bias of type i′2,ex second central moment of the extra-column band profiles
(s2)reduced interstitial linear velocity of the eluent to the par-ticle diameter dp and bulk molecular diffusion coefficientDm
i eddy dispersion coefficient related to a diffusionexchange mechanism for a velocity bias of type i
ˇ,c relative velocity difference between the center and thewall of the column tube
ˇ,i relative velocity inequality for a velocity bias of type i
,i reduced axial flow length for a velocity bias of type ireported to the particle diameter dp
ratio of the intraparticle diffusivity of the sample throughthe porous shell to the bulk diffusion coefficientassociation factor of the eluentratio of the diameter of the solid core to that of the particlein a core-shell particle
∗p tortuosity factor of the porous shell for partially excluded
protein
cknowledgements
This work was supported in part by grant CHE-06-08659 of theational Science Foundation and by the cooperative agreement
etween the University of Tennessee and the Oak Ridge Nationalaboratory. We thank Tivadar Farkas (Phenomenex, Torrance, USA)or the generous gift of the Kinetex column used in this work andor fruitful discussions. PGS acknowledges the receipt of a UWSostgraduate research award.[[[
[[
1217 (2010) 1589–1603 1603
References
[1] 32nd International Symposium on High Performance Liquid Phase Separationsand Related Techniques, Baltimore, MD, May 10–16, 2008.
[2] F. Gritti, G. Guiochon, J. Chromatogr. A 1216 (2009) 1353.[3] Pittcon Conference & Expo 2009, Chicago, IL, March 8–13, 2009.[4] J. Kirkland, Anal. Chem. 41 (1969) 218.[5] J. Kirkland, Anal. Chem. 64 (1992) 1239.[6] J. Kirkland, F. Truszkowski, C. Dilks, G. Engel Jr., J. Chromatogr. A 890 (2000) 3.[7] J. Knox, J. Vasvari, J. Chromatogr. 83 (1973) 181.[8] X. Wang, W. Barber, P. Carr, J. Chromatogr. A 1107 (2006) 139.[9] F. Gritti, G. Guiochon, J. Chromatogr. A 1157 (2007) 289.10] K. Kaczmarski, G. Guiochon, Anal. Chem. 79 (2007) 4648.11] A. Cavazzini, F. Gritti, K. Kaczmarski, G. Guiochon, Anal. Chem. 79 (2007) 5972.12] J. Abia, K. Mriziq, G. Guiochon, J. Chromatogr. A 1216 (2009) 3185.13] F. Gritti, G. Guiochon, AIChE J., AICHE-09-11844, in press.14] F. Gritti, G. Guiochon, J. Chromatogr. A 1216 (2009) 4752.15] C. Wilke, P. Chang, AIChE J. 1 (1955) 264.16] B. Poling, J. Prausnitz, J. O’Connel, The Properties of Gases and Liquids, 5th ed.,
McGraw-Hill, New York, NY, 2001.17] M. Young, P. Carroad, R. Bell, Biotechnol. Bioeng. 22 (1980) 947.18] W. Bocian, J. Sitkowski, E. Bednarek, A. Tarnowska, R. Kawecki, L. Kozerski, J.
Biomol. NMR 40 (2008) 55.19] I. Nesmelovai, V. Fedotov, Biochim. Biophys. Acta 1383 (1998) 311.20] J. van Deemter, F. Zuiderweg, A. Klinkenberg, Chem. Eng. Sci. 5 (1956) 271.21] J. Giddings, Dynamics of Chromatography, Marcel Dekker, New York, NY,
1965.22] C. Horvath, H.-J. Lin, J. Chromatogr. 126 (1976) 401.23] C. Horvath, H.-J. Lin, J. Chromatogr. 149 (1978) 43.24] G. Guiochon, A. Felinger, A. Katti, D. Shirazi, Fundamentals of Preparative and
Nonlinear Chromatography, 2nd ed., Academic Press, Boston, MA, 2006.25] D. Ruthven, Principles of Adsorption and Adsorption Processes, Wiley, New
York, NY, 1984.26] M. Suzuki, Adsorption Engineering, Elsevier, Amsterdam, The netherlands,
1990.27] K. Miyabe, G. Guiochon, J. Sep. Sci. 26 (2003) 155.28] J. Knox, L. McLaren, Anal. Chem. 36 (1964) 1477.29] F. Gritti, G. Guiochon, Anal. Chem. 78 (2006) 5329.30] F. Gritti, G. Guiochon, AIChE J., AICHE-09-11893, in press.31] E. Wilson, C. Geankoplis, J. Ind. Eng. Chem. (Fundam.) 5 (1966) 9.32] F. Gritti, G. Guiochon, J. Chromatogr. A 1166 (2007) 30.33] D. McCalley, J. Chromatogr. A 1193 (2008) 85.34] J. Knox, J.F. Parcher, Anal. Chem. 41 (1969) 1599.35] R.T. Kennedy, J.W. Jorgenson, Anal. Chem. 61 (1989) 1128.36] L.J. Cole, N.M. Schultz, R.T.J. Kennedy, J. Microcolumn. Sep. 5 (1993) 433.37] Y. Shen, M.L. Lee, Anal. Chem. 69 (1997) 2541.38] Y. Shen, M.L. Lee, Anal. Chem. 70 (1998) 737.39] W. de Malsche, H. Gardeniers, G. Desmet, Anal. Chem. 80 (2008) 5391.40] G. Bee, J. Ureta, R. Shalliker, E. Drumm, G. Guiochon, AIChE J. 49 (2003) 642.41] F. Gritti, G. Guiochon, Anal. Chem. 81 (2009) 9871.42] F. Gritti, G. Guiochon, Anal. Chem. 81 (2009) 2723.43] F. Gritti, G. Guiochon, Chem. Eng. Sci. 61 (2006) 7636.44] E. Renkin, J. Gen. Physiol. 38 (1954) 225.45] F. Gritti, G. Guiochon, J. Chromatogr. A 1176 (2007) 107.
46] K. Miyabe, G. Guiochon, J. Phys. Chem. B 108 (2004) 2987.47] F. Gritti, A. Felinger, G. Guiochon, J. Chromatogr. A 1136 (2006) 57.48] M. Gray, A.P. Sweeney, G.R. Dennis, P. Wormell, R.A. Shalliker, J. Liq. Chromatogr.Relat. Technol. 27 (2004) 2905.49] A.J.P. Martin, Biochem. Soc. Symp. 3 (1949) 4.50] T. Farkas, M.J. Sepaniak, G. Guiochon, AIChE J. 43 (1997) 1964.