Performance evaluation of the fully engineered YAP(S)PET scanner for small animal imaging
6
1078 IEEE TRANSACTIONS ON NUCLEAR SCIENCE, VOL. 53, NO. 3, JUNE 2006 Performance Evaluation of the Fully Engineered YAP-(S)PET Scanner for Small Animal Imaging Alberto Del Guerra, Senior Member, IEEE, Antonietta Bartoli, Nicola Belcari, Deborah Herbert, Alfonso Motta, Angela Vaiano, Giovanni Di Domenico, Nicola Sabba, Elena Moretti, Guido Zavattini, Marco Lazzarotti, Luca Sensi, Michele Larobina, and Licia Uccelli Abstract—At the Department of Physics of the University of Pisa, Italy, a new and fully engineered version of the YAP-(S)PET small animal scanner has been recently installed. The new YAP-(S)PET is able to perform both PET and SPECT studies on small animals. The scanner is made up of four heads: each one is composed of a4 4 cm YAlO :Ce (or YAP:Ce) matrix of 20 20 elements, 2 2 25 mm each, coupled to a Position Sensitive Photomulti- plier (PS-PMT) (Hamamatsu R2486). The four modules are posi- tioned on a rotating gantry. The switching to the SPECT modality is easily made by mounting a high resolution parallel hole (0.6 mm , 0.15 mm septum) lead collimator in front of each crystal. This paper reports the performance of the system in terms of absolute sensitivity and spatial resolution for both PET and SPECT modal- ities. The scatter fraction and noise-equivalent count rate (NEC) for a mouse phantom for different energy windows have been mea- sured in PET modality. Images of phantoms and animals are also presented. Index Terms—Molecular imaging, positron emission tomog- raphy (PET), single photon emission tomography, small animal imaging. I. INTRODUCTION F UNCTIONAL imaging of small animals, such as mice and rats, using high performance positron emission to- mography (PET) and single-photon emission tomography (SPECT), is becoming a valuable tool for studying animal models of human disease. The possibility to use either PET or SPECT allows the scientist to be able to exploit the advantages of both techniques, e.g., the wide range of easily accessible single photon radiotracers for SPECT and the exquisite perfor- mance of PET. The combination of PET and SPECT techniques for small animal studies could offer the unique possibility of developing new and interesting protocols for the investigation of many biological phenomena more effectively than with PET or SPECT modality alone. Manuscript received November 15, 2004; revised November 4, 2005. A. Del Guerra, A. Bartoli, N. Belcari, D. Herbert, A. Motta, and A. Vaiano are with the Department of Physics and Center of Excellence AmbiSEN and INFN Pisa, University of Pisa, I-56127 Pisa, Italy. G. Di Domenico, N. Sabba, E. Moretti, and G. Zavattini are with the Depart- ment of Physics and INFN Ferrara, University of Ferrara, I-44100 Ferrara, Italy. M. Lazzarotti and L. Sensi are with the I.S.E. Ingegneria dei Sistemi Elet- tronici s.r.l., I-56010 Vecchiano (PI), Italy. M. Larobina is with the CNR—Istituto di Biostrutture e Bioimmagini, I-80100 Napoli, Italy. L. Uccelli is with the Laboratory of Nuclear Medicine and Molecular Imaging, Department of Radiological Sciences, University of Ferrara, I-44100 Ferrara, Italy. Digital Object Identifier 10.1109/TNS.2006.871900 Fig. 1. Photograph of the YAP-(S)PET scanner (left) and of the four rotating heads (right). In this paper, we present the performance evaluation of the fully engineered version of the YAP-(S)PET scanner (Fig. 1). The scanner was originally developed [1], [2] at the Depart- ments of Physics of the University of Ferrara, Italy, and the Uni- versity of Pisa, Italy, and is now commercially available from I.S.E. Ingegneria dei Sistemi Elettronici s.r.l., Pisa, Italy. The YAP-(S)PET scanner allows one to perform both PET or SPECT and also simultaneous PET/SPECT acquisitions [3]. II. YAP-(S)PET SCANNER DESIGN At the Department of Physics of the University of Pisa, a new and fully engineered version of the YAP-(S)PET small animal scanner has been recently installed. The scanner is made up of four detector heads: each one is composed of a 4 4 cm YAlO :Ce (or YAP:Ce) matrix of 20 20 elements, 2 2 25 mm each. The thickness of the scintillator has been reduced with respect to that (30 mm) of the prototype detectors in order to reduce the parallax effect. The matrix is directly coupled to a Position Sensitive Photo- multiplier (PS-PMT) (Hamamatsu R2486). The anode wires were reduced into four position-encoded signals by a resistive readout network. The readout electronics follow the scheme of the prototype (that was based on standard NIM- CAMAC modules) but new, dedicated and compact electronic boards have been designed here for the signal amplification and digitization. Each of the two acquisition boards is dedicated to a pair of opposite detectors both in PET and SPECT modali- ties. The energy discrimination and timing are performed via constant fraction discriminators (CFDs). The digitization of the four position signals from each PS-PMT is performed by on board peak sensing ADCs. The digital data are then transferred to the local PC server via USB2 connection. The new board also include a random counts estimation using the delayed window 0018-9499/$20.00 © 2006 IEEE Authorized licensed use limited to: UNIVERSITA PISA S ANNA. Downloaded on November 21, 2008 at 03:44 from IEEE Xplore. Restrictions apply.
-
Upload
independent -
Category
Documents
-
view
2 -
download
0
Transcript of Performance evaluation of the fully engineered YAP(S)PET scanner for small animal imaging
1078 IEEE TRANSACTIONS ON NUCLEAR SCIENCE, VOL. 53, NO. 3, JUNE 2006
Performance Evaluation of the Fully EngineeredYAP-(S)PET Scanner for Small Animal Imaging
Alberto Del Guerra, Senior Member, IEEE, Antonietta Bartoli, Nicola Belcari, Deborah Herbert, Alfonso Motta,Angela Vaiano, Giovanni Di Domenico, Nicola Sabba, Elena Moretti, Guido Zavattini, Marco Lazzarotti,
Luca Sensi, Michele Larobina, and Licia Uccelli
Abstract—At the Department of Physics of the University of Pisa,Italy, a new and fully engineered version of the YAP-(S)PET smallanimal scanner has been recently installed. The new YAP-(S)PETis able to perform both PET and SPECT studies on small animals.The scanner is made up of four heads: each one is composed ofa 4 4 cm2 YAlO3:Ce (or YAP:Ce) matrix of 20 20 elements,2 2 25 mm3 each, coupled to a Position Sensitive Photomulti-plier (PS-PMT) (Hamamatsu R2486). The four modules are posi-tioned on a rotating gantry. The switching to the SPECT modalityis easily made by mounting a high resolution parallel hole (0.6 mm
, 0.15 mm septum) lead collimator in front of each crystal. Thispaper reports the performance of the system in terms of absolutesensitivity and spatial resolution for both PET and SPECT modal-ities. The scatter fraction and noise-equivalent count rate (NEC)for a mouse phantom for different energy windows have been mea-sured in PET modality. Images of phantoms and animals are alsopresented.
Index Terms—Molecular imaging, positron emission tomog-raphy (PET), single photon emission tomography, small animalimaging.
I. INTRODUCTION
FUNCTIONAL imaging of small animals, such as miceand rats, using high performance positron emission to-
mography (PET) and single-photon emission tomography(SPECT), is becoming a valuable tool for studying animalmodels of human disease. The possibility to use either PET orSPECT allows the scientist to be able to exploit the advantagesof both techniques, e.g., the wide range of easily accessiblesingle photon radiotracers for SPECT and the exquisite perfor-mance of PET. The combination of PET and SPECT techniquesfor small animal studies could offer the unique possibility ofdeveloping new and interesting protocols for the investigationof many biological phenomena more effectively than with PETor SPECT modality alone.
Manuscript received November 15, 2004; revised November 4, 2005.A. Del Guerra, A. Bartoli, N. Belcari, D. Herbert, A. Motta, and A. Vaiano
are with the Department of Physics and Center of Excellence AmbiSEN andINFN Pisa, University of Pisa, I-56127 Pisa, Italy.
G. Di Domenico, N. Sabba, E. Moretti, and G. Zavattini are with the Depart-ment of Physics and INFN Ferrara, University of Ferrara, I-44100 Ferrara, Italy.
M. Lazzarotti and L. Sensi are with the I.S.E. Ingegneria dei Sistemi Elet-tronici s.r.l., I-56010 Vecchiano (PI), Italy.
M. Larobina is with the CNR—Istituto di Biostrutture e Bioimmagini,I-80100 Napoli, Italy.
L. Uccelli is with the Laboratory of Nuclear Medicine and MolecularImaging, Department of Radiological Sciences, University of Ferrara, I-44100Ferrara, Italy.
Digital Object Identifier 10.1109/TNS.2006.871900
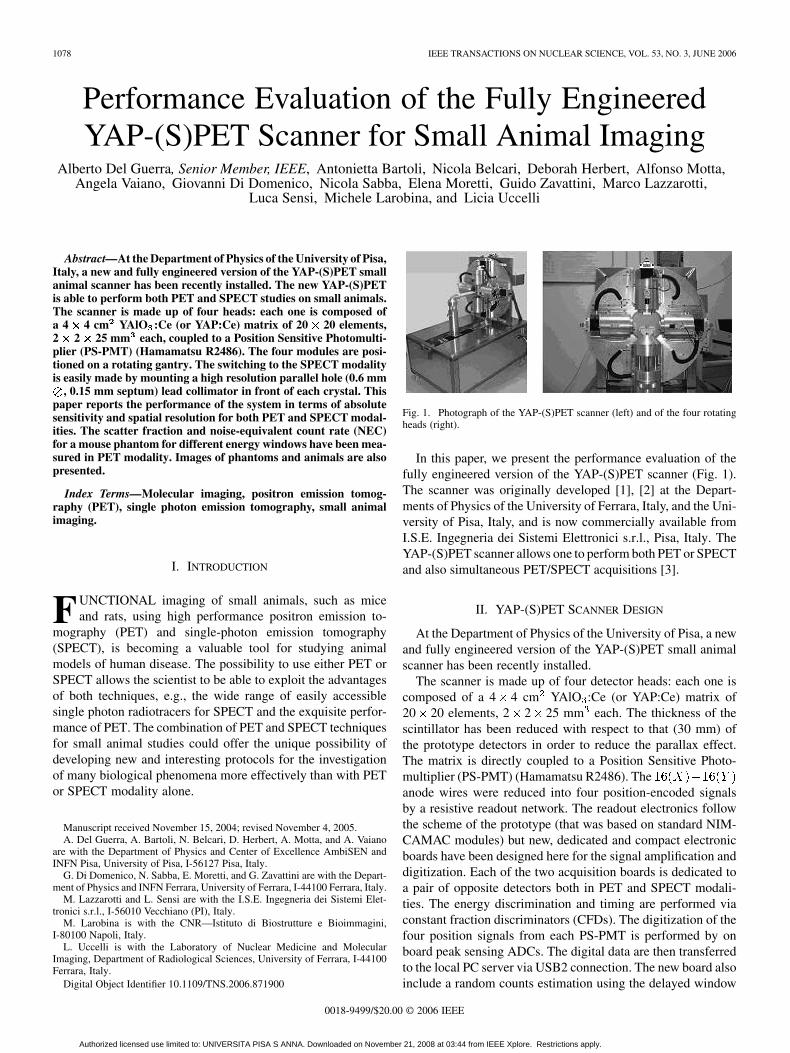
Fig. 1. Photograph of the YAP-(S)PET scanner (left) and of the four rotatingheads (right).
In this paper, we present the performance evaluation of thefully engineered version of the YAP-(S)PET scanner (Fig. 1).The scanner was originally developed [1], [2] at the Depart-ments of Physics of the University of Ferrara, Italy, and the Uni-versity of Pisa, Italy, and is now commercially available fromI.S.E. Ingegneria dei Sistemi Elettronici s.r.l., Pisa, Italy. TheYAP-(S)PET scanner allows one to perform both PET or SPECTand also simultaneous PET/SPECT acquisitions [3].
II. YAP-(S)PET SCANNER DESIGN
At the Department of Physics of the University of Pisa, a newand fully engineered version of the YAP-(S)PET small animalscanner has been recently installed.
The scanner is made up of four detector heads: each one iscomposed of a 4 4 cm YAlO :Ce (or YAP:Ce) matrix of20 20 elements, 2 2 25 mm each. The thickness of thescintillator has been reduced with respect to that (30 mm) ofthe prototype detectors in order to reduce the parallax effect.The matrix is directly coupled to a Position Sensitive Photo-multiplier (PS-PMT) (Hamamatsu R2486). Theanode wires were reduced into four position-encoded signalsby a resistive readout network. The readout electronics followthe scheme of the prototype (that was based on standard NIM-CAMAC modules) but new, dedicated and compact electronicboards have been designed here for the signal amplification anddigitization. Each of the two acquisition boards is dedicated toa pair of opposite detectors both in PET and SPECT modali-ties. The energy discrimination and timing are performed viaconstant fraction discriminators (CFDs). The digitization of thefour position signals from each PS-PMT is performed by onboard peak sensing ADCs. The digital data are then transferredto the local PC server via USB2 connection. The new board alsoinclude a random counts estimation using the delayed window
0018-9499/$20.00 © 2006 IEEE
Authorized licensed use limited to: UNIVERSITA PISA S ANNA. Downloaded on November 21, 2008 at 03:44 from IEEE Xplore. Restrictions apply.
DEL GUERRA et al.: FULLY ENGINEERED YAP-(S)PET SCANNER FOR SMALL ANIMAL IMAGING 1079
technique: the artificially generated random counts are then ac-quired, hence offering the possibility of random counts correc-tion. A dedicated counter displays and records the number ofactual coincidences occurring in each pair for dead time eval-uation and correction. Using the new electronics the measuredenergy resolution is about 19% and 24% full-width at half-max-imum (FWHM) at 511 keV and 140 keV, respectively [4], whilethe timing resolution (in PET mode) is 3 ns FWHM. The fourmodules are positioned on a rotating gantry; the opposite detec-tors are in time coincidence when used in PET mode. The rota-tion is controlled via PC thus permitting the acquisition of thetomographic views. The scanner is equipped with a laser systemand motorized bed for the animal positioning and motion withinthe field-of-view (FOV). The system is managed by an on-sitePC (server) performing the data acquisition and the motion con-trol and can be controlled by a remote PC (client) connected to alocal network. The axial motion of the bed can be controlled bythe client while the vertical position of the bed can be adjustedmanually.
In PET modality the system operates in three-dimensional(3-D) data acquisition mode. The switching to the SPECTmodality can be easily made by replacing the tungsten septum(used in PET for shielding the scintillators from the backgroundoutside the FOV) with a high resolution parallel-hole, lead col-limator (0.6 mm , 0.15 mm septum) in front of each crystal.For both PET and SPECT modalities the scanner has an axialFOV of 4 cm and a transaxial FOV of 4 cm.
Data analysis and image reconstruction are performed by agraphic user-friendly interface, that also includes the data ac-quisition tools. Both filtered back projection (FBP) and expec-tation maximization (EM) algorithms can be used for image re-construction [5].
The system is able to evaluate the acquisition dead time bydirectly measuring the true number of detected coincidences:the acquisition board that counts the number of coincidencesregardless of the fact that the corresponding event had beenrecorded or not (being the dead time due to the 14 ns timingwindow negligible). The raw data are then corrected for deadtime before image reconstruction, i.e., multiplied by the appro-priate correction factor.
III. PERFORMANCE EVALUATION: METHODS
We have characterized the performance of the YAP-(S)PETscanner in both PET and SPECT modalities in terms of absolutesensitivity, spatial resolution (using both FBP and EM recon-struction methods), and image quality (Derenzo phantom). ForPET, scatter fraction and count rate performance (noise-equiva-lent count rate, or NEC) have been also evaluated using a mouse-sized phantom.
A. PET
1) Spatial Resolution: The spatial resolution has been eval-uated using EM and conventional FBP (ramp filter cutoff at theNyquist frequency) algorithms; both are provided with the com-mercial version of the scanner. For both reconstruction tech-niques, the 3-D sinograms can be rebinned into two-dimensional(2-D) sinograms via single-slice rebinning (3-D-MS) or simply
reduced to 2-D with “virtual septa.” The image matrix voxelsize is 0.25 0.25 1 mm . For EM the number of iterationwere determined from an empirical parameter [5] that automat-ically stops the iterations. Two different energy windows wereevaluated: a wide open energy window (50–850 keV) offeringthe maximum sensitivity, and a high resolution window (50–450keV). In fact, the selection of the Compton part of the energyspectrum (50–450 keV) increases the fraction of single inter-actions occurring in the YAP:Ce matrix [1] with respect to thewide-open energy window.
For the resolution measurements in PET mode we have useda Na point-like source (nominal size 1 mm ) positioned atdifferent radial distance from the scanner axis with a 5 mm stepsize. The axial, radial, and tangential resolutions (FWHM ofthe image peak) have been evaluated for various radial offsetswith a 5 mm step size. We have also measured the axial resolu-tion obtained from 2-D sinograms and FBP reconstruction, thatrepresent the “intrinsic” spatial resolution capability along theaxial direction. For the EM algorithm, the reconstruction of thepoint-like source automatically stopped at seven iterations forany position of the FOV.
2) Sensitivity: The absolute sensitivity is defined as the ratiobetween recorded true coincidence counts and positron-emittingdecays from the source during the acquisition time. The absolutesensitivity measurement on the fully engineered YAP-(S)PEThas been previously reported by Del Guerra et al. [4] using acalibrated Na point source (5.4 Ci) and moved along thescanner axial axis. Although Na has an additional 1275 keVgamma ray emission, the effect on the sensitivity measurementis negligible. In fact, e.g., at the center of the FOV, even con-sidering that the detection efficiency of a 1275 keV gamma rayis the same as for the 511 keV, and using no energy discrimi-nation, the relative probability of such a false coincidence (i.e.,
1.5%). In this condition, the deadtime loss, estimated with the dedicated counter, is 5%. Thedetector heads were positioned 15 cm apart. A timing windowof 14 ns was applied. True coincidence counts are obtained fromthe measured prompt after the subtraction of the random counts.Two different results were produced for different energy win-dows: 50–850 keV (high sensitivity) and 50–450 keV (high res-olution). The branching ratio of Na ( 0.9055%) was con-sidered and no dead time correction was applied in the calcula-tion. No normalization for crystal detection efficiency was ap-plied.
3) Scatter Fraction: The exact methodology for measuringthe scatter fraction in small animal scanners is still an open ques-tion. Here we have used a methodology based on a rescaled ver-sion of the NEMA NU2-2001 [6]. A phantom that mimics thebody of a small mouse was scanned to estimate the amount ofmeasured scattered radiation. The phantom consists in a Lucitecylinder with 2.5 cm diameter, 6.0 cm long, with a 1 mm diam-eter hole drilled parallel to the central axis at a radial distance of1 cm and filled with a low activity F-FDG solution (randomrate 0.2%, dead time loss 5%). This phantom and its size havebeen suggested by Yang et al. [7]. Coincidences detected outsidethe cylindrical phantoms were assumed to come from scattering(both in the object and within the scintillator) only. The mea-surement was performed with a wide-open energy window of 50
Authorized licensed use limited to: UNIVERSITA PISA S ANNA. Downloaded on November 21, 2008 at 03:44 from IEEE Xplore. Restrictions apply.
1080 IEEE TRANSACTIONS ON NUCLEAR SCIENCE, VOL. 53, NO. 3, JUNE 2006
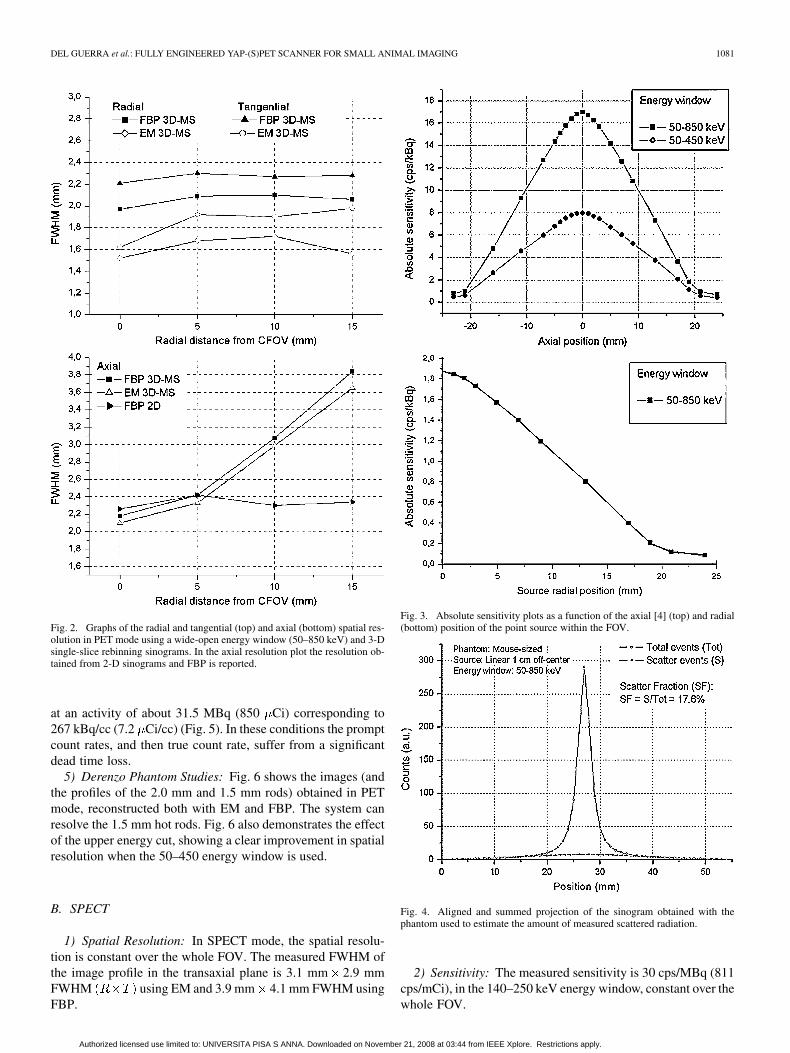
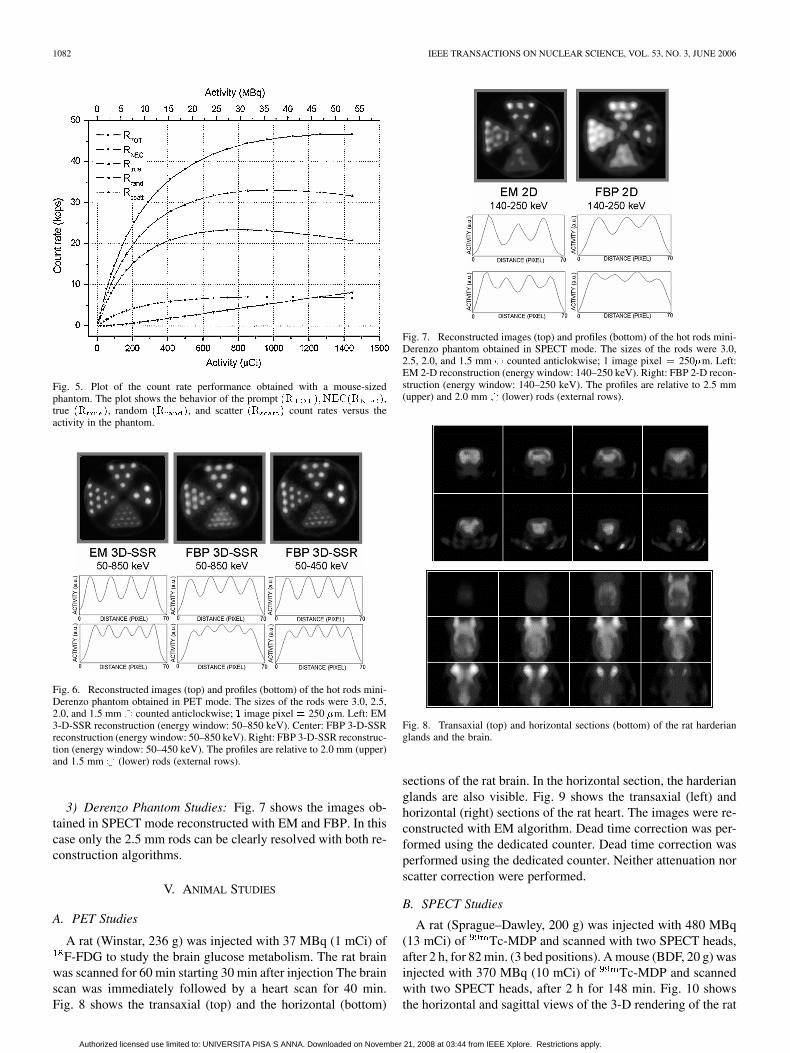
to 850 keV. The measured data were sorted into 3-D-MS sino-grams and the profiles of each projection angle were aligned andsummed. The tail of the profile obtained in that way (Fig. 5) andfarther than 1.0 cm from the center were fitted with a Gaussianprofile to estimate the scattered counts.
4) Count Rate Performance: Similarly to scatter fractionmeasurement, NEMA still has not specified yet a standardmethod for the evaluation of the count rate performance insmall animal scanners. Here we have used a method similarto the one described in NEMA NU2-1994 [8]. The count rateperformance in PET mode was estimated in terms of NEC.The measurements were performed using a hollow cylindricalphantom of the same size of the previous one [7]. The phantomwas filled with a solution containing F-FDG and scannedover five half-lives. The true ( ) and scattered ( ) countingrates were calculated from the measured prompt andrandom counting rates, and scatter fraction (SF) using thefollowing formulas:
where the random counting rate has been measured usingdelayed coincidence window technique.
The NEC counting rates was then calculated using the equa-tion
NEC
where is the fraction of the transverse FOV occupied by theobject ( in this case). For this phantom, a wide-openenergy window of 50 to 850 keV, combined with a 14 ns timingwindow, was used.
5) Derenzo Phantom Studies: A mini-Derenzo phantom wasscanned in both PET and SPECT mode. The sizes of the rodswere 3.0, 2.5, 2.0, and 1.5 mm . The center-to-center distancebetween adjacent rods is twice the rod diameter. The rods ofthe Derenzo phantom were filled with 300 Ci of a F-FDGsolution, and scanned for 75 min. A wide-open energy window(50–850 keV) was used for the generation of the sinograms, andboth EM and FBP (ramp filter) were used for image reconstruc-tion.
B. SPECT
1) Spatial Resolution: As for PET, the spatial resolution hasbeen evaluated using EM and conventional FBP (ramp filtercutoff at the Nyquist frequency) algorithms; in this case, bothreconstruction techniques are applied to 2-D sinograms. Theimage matrix voxel size is 0.25 0.25 2 mm . For EM thenumber of iteration was determined from an empirical param-eter [5] that automatically stops the iterations. For the evalua-tion of the spatial resolution we have used a capillary glass tubefilled with Tc positioned parallel to the FOV axis with 1 cmradial offset. The nominal size of the tube is 0.8 mm inner and1.2 mm outer diameter. The radial and tangential FWHM havebeen measured with an energy window of 140–250 keV. Wehave chosen this energy window because it eliminates scatter
contribution due to the animal and improves the tracer quantifi-cation [9].
2) Sensitivity: In SPECT mode the sensitivity has been mea-sured using a syringe filled with a calibrated activity of Tc.The activity in the syringe is positioned so that all activity iswithin the FOV. The energy window is 140–250 keV.
3) Derenzo Phantom Studies: The same Derenzo phantomused for PET image quality study has been filled with 110 MBq(3 mCi) of Tc, scanned for 5 h. in SPECT mode. Both EMand FBP (ramp filter) have been used for the reconstruction. Theused energy window is 140–250 keV.
IV. PERFORMANCE EVALUATION: RESULTS
A. PET
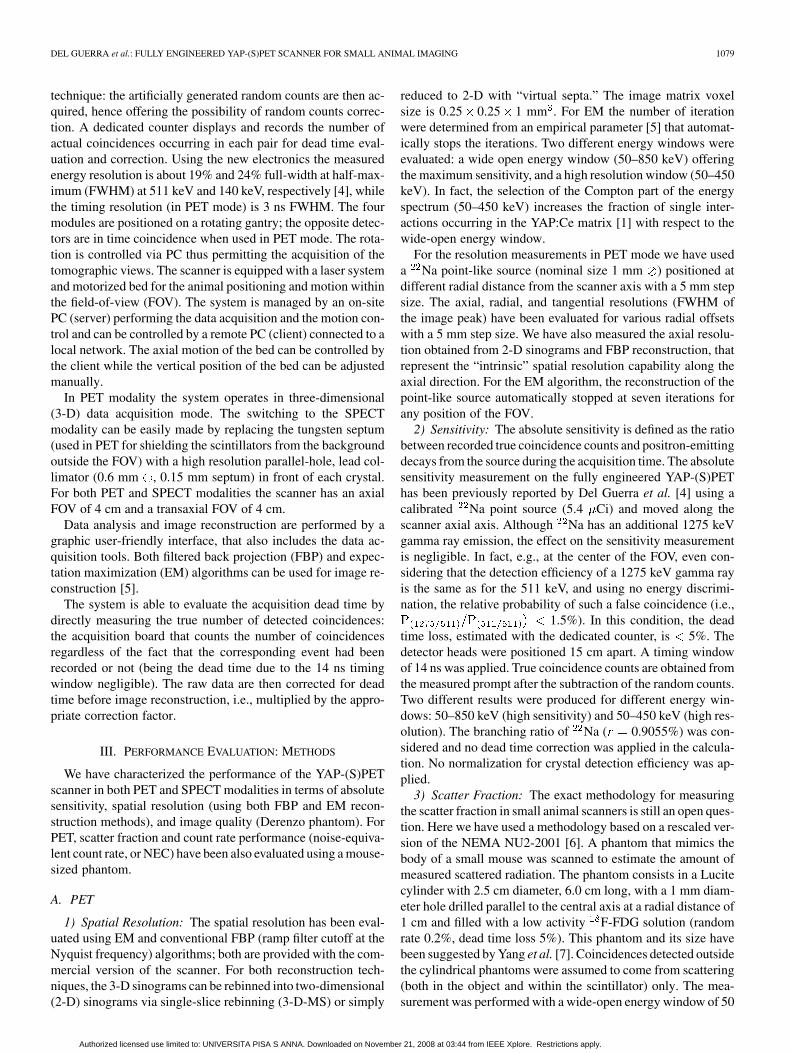
1) Spatial Resolution: The highest volume resolution ismeasured at the center of the field of view (CFOV) usingEM reconstruction and is Radial Tangential Axial1.52 mm 1.62 mm 2.10 mm FWHM (5.2 mm ) with anenergy window of 50–850 keV. No source dimension sub-traction was made. With the high resolution energy window(50–450 keV) the volume resolution at CFOV is improveddown to 4.4 mm . Using FBP the measured volume resolutionat CFOV is Radial Tangential Axial 1.97 mm 2.21mm 2.18 mm FWHM (9.5 mm ) for the 50–850 keV energywindow while the volume resolution for the 50–450 keV energywindow is 8.5 mm . Fig. 2 shows the curves relative to theradial, tangential (Fig. 2, top) and axial resolution (Fig. 2,bottom) calculated as the FWHM of the image peak of the pointsource, reconstructed with both EM and FBP (50–850 keVenergy window), at various radial offset from the scanner axis.The measured axial resolution, obtained from 2-D sinogramsand FBP, also reported in Fig. 2 (bottom) is nearly constantover the whole FOV and is about 2.3 mm FWHM. This valueis compatible with the axial intrinsic resolution of 2.6 mm asmeasured by Del Guerra et al. [4].
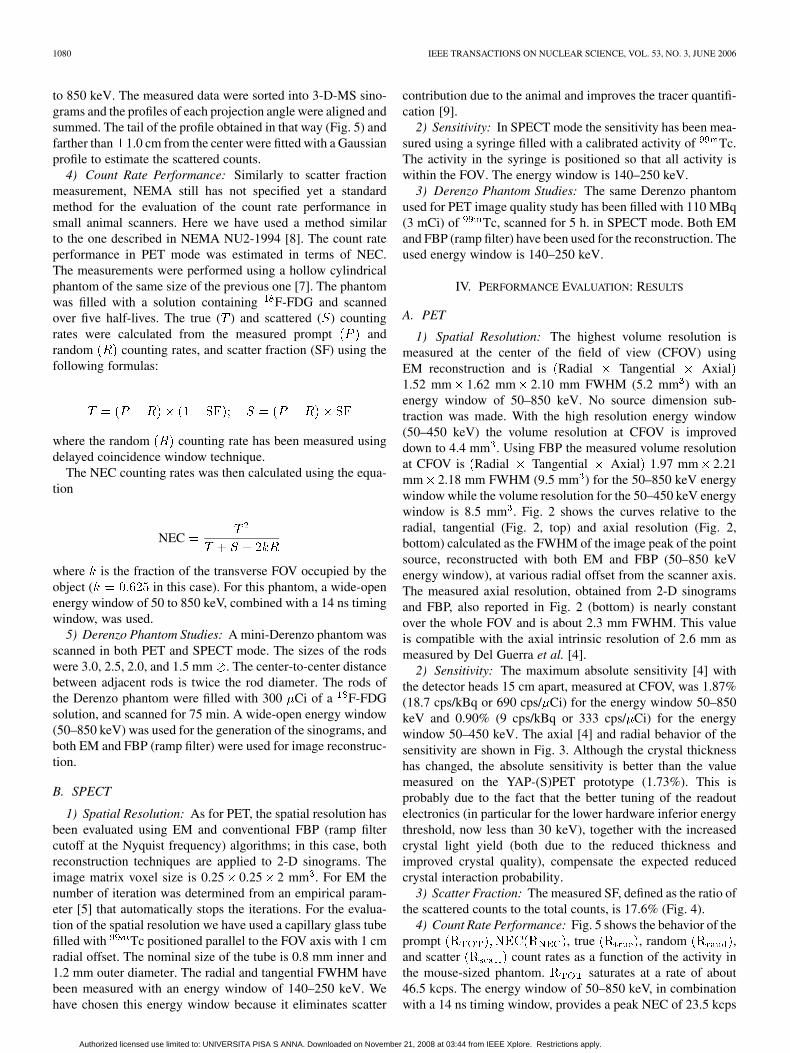
2) Sensitivity: The maximum absolute sensitivity [4] withthe detector heads 15 cm apart, measured at CFOV, was 1.87%(18.7 cps/kBq or 690 cps/ Ci) for the energy window 50–850keV and 0.90% (9 cps/kBq or 333 cps/ Ci) for the energywindow 50–450 keV. The axial [4] and radial behavior of thesensitivity are shown in Fig. 3. Although the crystal thicknesshas changed, the absolute sensitivity is better than the valuemeasured on the YAP-(S)PET prototype (1.73%). This isprobably due to the fact that the better tuning of the readoutelectronics (in particular for the lower hardware inferior energythreshold, now less than 30 keV), together with the increasedcrystal light yield (both due to the reduced thickness andimproved crystal quality), compensate the expected reducedcrystal interaction probability.
3) Scatter Fraction: The measured SF, defined as the ratio ofthe scattered counts to the total counts, is 17.6% (Fig. 4).
4) Count Rate Performance: Fig. 5 shows the behavior of theprompt , true , random ,and scatter count rates as a function of the activity inthe mouse-sized phantom. saturates at a rate of about46.5 kcps. The energy window of 50–850 keV, in combinationwith a 14 ns timing window, provides a peak NEC of 23.5 kcps
Authorized licensed use limited to: UNIVERSITA PISA S ANNA. Downloaded on November 21, 2008 at 03:44 from IEEE Xplore. Restrictions apply.
DEL GUERRA et al.: FULLY ENGINEERED YAP-(S)PET SCANNER FOR SMALL ANIMAL IMAGING 1081
Fig. 2. Graphs of the radial and tangential (top) and axial (bottom) spatial res-olution in PET mode using a wide-open energy window (50–850 keV) and 3-Dsingle-slice rebinning sinograms. In the axial resolution plot the resolution ob-tained from 2-D sinograms and FBP is reported.
at an activity of about 31.5 MBq (850 Ci) corresponding to267 kBq/cc (7.2 Ci/cc) (Fig. 5). In these conditions the promptcount rates, and then true count rate, suffer from a significantdead time loss.
5) Derenzo Phantom Studies: Fig. 6 shows the images (andthe profiles of the 2.0 mm and 1.5 mm rods) obtained in PETmode, reconstructed both with EM and FBP. The system canresolve the 1.5 mm hot rods. Fig. 6 also demonstrates the effectof the upper energy cut, showing a clear improvement in spatialresolution when the 50–450 energy window is used.
B. SPECT
1) Spatial Resolution: In SPECT mode, the spatial resolu-tion is constant over the whole FOV. The measured FWHM ofthe image profile in the transaxial plane is 3.1 mm 2.9 mmFWHM using EM and 3.9 mm 4.1 mm FWHM usingFBP.
Fig. 3. Absolute sensitivity plots as a function of the axial [4] (top) and radial(bottom) position of the point source within the FOV.
Fig. 4. Aligned and summed projection of the sinogram obtained with thephantom used to estimate the amount of measured scattered radiation.
2) Sensitivity: The measured sensitivity is 30 cps/MBq (811cps/mCi), in the 140–250 keV energy window, constant over thewhole FOV.
Authorized licensed use limited to: UNIVERSITA PISA S ANNA. Downloaded on November 21, 2008 at 03:44 from IEEE Xplore. Restrictions apply.
1082 IEEE TRANSACTIONS ON NUCLEAR SCIENCE, VOL. 53, NO. 3, JUNE 2006
Fig. 5. Plot of the count rate performance obtained with a mouse-sizedphantom. The plot shows the behavior of the prompt (R );NEC(R ),true (R ), random (R ), and scatter (R ) count rates versus theactivity in the phantom.
Fig. 6. Reconstructed images (top) and profiles (bottom) of the hot rods mini-Derenzo phantom obtained in PET mode. The sizes of the rods were 3.0, 2.5,2.0, and 1.5 mm� counted anticlockwise; 1 image pixel = 250 �m. Left: EM3-D-SSR reconstruction (energy window: 50–850 keV). Center: FBP 3-D-SSRreconstruction (energy window: 50–850 keV). Right: FBP 3-D-SSR reconstruc-tion (energy window: 50–450 keV). The profiles are relative to 2.0 mm (upper)and 1.5 mm � (lower) rods (external rows).
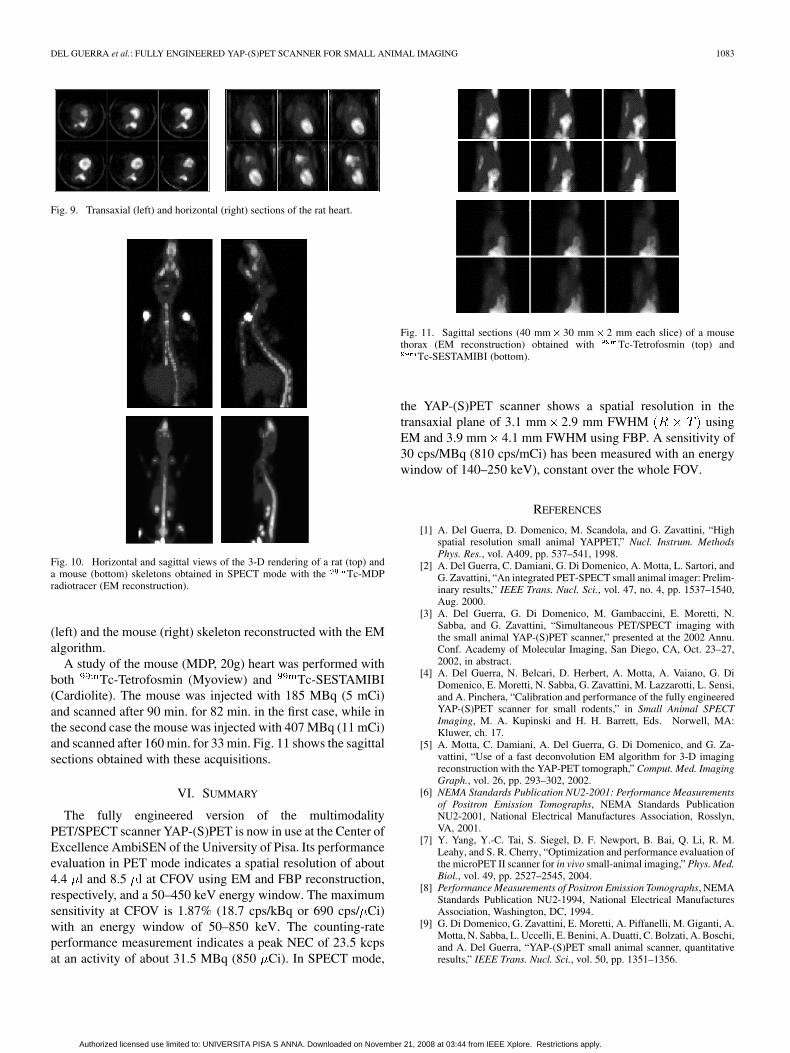
3) Derenzo Phantom Studies: Fig. 7 shows the images ob-tained in SPECT mode reconstructed with EM and FBP. In thiscase only the 2.5 mm rods can be clearly resolved with both re-construction algorithms.
V. ANIMAL STUDIES
A. PET Studies
A rat (Winstar, 236 g) was injected with 37 MBq (1 mCi) ofF-FDG to study the brain glucose metabolism. The rat brain
was scanned for 60 min starting 30 min after injection The brainscan was immediately followed by a heart scan for 40 min.Fig. 8 shows the transaxial (top) and the horizontal (bottom)
Fig. 7. Reconstructed images (top) and profiles (bottom) of the hot rods mini-Derenzo phantom obtained in SPECT mode. The sizes of the rods were 3.0,2.5, 2.0, and 1.5 mm � counted anticlokwise; 1 image pixel = 250�m. Left:EM 2-D reconstruction (energy window: 140–250 keV). Right: FBP 2-D recon-struction (energy window: 140–250 keV). The profiles are relative to 2.5 mm(upper) and 2.0 mm � (lower) rods (external rows).
Fig. 8. Transaxial (top) and horizontal sections (bottom) of the rat harderianglands and the brain.
sections of the rat brain. In the horizontal section, the harderianglands are also visible. Fig. 9 shows the transaxial (left) andhorizontal (right) sections of the rat heart. The images were re-constructed with EM algorithm. Dead time correction was per-formed using the dedicated counter. Dead time correction wasperformed using the dedicated counter. Neither attenuation norscatter correction were performed.
B. SPECT Studies
A rat (Sprague–Dawley, 200 g) was injected with 480 MBq(13 mCi) of Tc-MDP and scanned with two SPECT heads,after 2 h, for 82 min. (3 bed positions). A mouse (BDF, 20 g) wasinjected with 370 MBq (10 mCi) of Tc-MDP and scannedwith two SPECT heads, after 2 h for 148 min. Fig. 10 showsthe horizontal and sagittal views of the 3-D rendering of the rat
Authorized licensed use limited to: UNIVERSITA PISA S ANNA. Downloaded on November 21, 2008 at 03:44 from IEEE Xplore. Restrictions apply.
DEL GUERRA et al.: FULLY ENGINEERED YAP-(S)PET SCANNER FOR SMALL ANIMAL IMAGING 1083
Fig. 9. Transaxial (left) and horizontal (right) sections of the rat heart.
Fig. 10. Horizontal and sagittal views of the 3-D rendering of a rat (top) anda mouse (bottom) skeletons obtained in SPECT mode with the Tc-MDPradiotracer (EM reconstruction).
(left) and the mouse (right) skeleton reconstructed with the EMalgorithm.
A study of the mouse (MDP, 20g) heart was performed withboth Tc-Tetrofosmin (Myoview) and Tc-SESTAMIBI(Cardiolite). The mouse was injected with 185 MBq (5 mCi)and scanned after 90 min. for 82 min. in the first case, while inthe second case the mouse was injected with 407 MBq (11 mCi)and scanned after 160 min. for 33 min. Fig. 11 shows the sagittalsections obtained with these acquisitions.
VI. SUMMARY
The fully engineered version of the multimodalityPET/SPECT scanner YAP-(S)PET is now in use at the Center ofExcellence AmbiSEN of the University of Pisa. Its performanceevaluation in PET mode indicates a spatial resolution of about4.4 l and 8.5 l at CFOV using EM and FBP reconstruction,respectively, and a 50–450 keV energy window. The maximumsensitivity at CFOV is 1.87% (18.7 cps/kBq or 690 cps/ Ci)with an energy window of 50–850 keV. The counting-rateperformance measurement indicates a peak NEC of 23.5 kcpsat an activity of about 31.5 MBq (850 Ci). In SPECT mode,
Fig. 11. Sagittal sections (40 mm� 30 mm� 2 mm each slice) of a mousethorax (EM reconstruction) obtained with Tc-Tetrofosmin (top) and
Tc-SESTAMIBI (bottom).
the YAP-(S)PET scanner shows a spatial resolution in thetransaxial plane of 3.1 mm 2.9 mm FWHM usingEM and 3.9 mm 4.1 mm FWHM using FBP. A sensitivity of30 cps/MBq (810 cps/mCi) has been measured with an energywindow of 140–250 keV), constant over the whole FOV.
REFERENCES
[1] A. Del Guerra, D. Domenico, M. Scandola, and G. Zavattini, “Highspatial resolution small animal YAPPET,” Nucl. Instrum. MethodsPhys. Res., vol. A409, pp. 537–541, 1998.
[2] A. Del Guerra, C. Damiani, G. Di Domenico, A. Motta, L. Sartori, andG. Zavattini, “An integrated PET-SPECT small animal imager: Prelim-inary results,” IEEE Trans. Nucl. Sci., vol. 47, no. 4, pp. 1537–1540,Aug. 2000.
[3] A. Del Guerra, G. Di Domenico, M. Gambaccini, E. Moretti, N.Sabba, and G. Zavattini, “Simultaneous PET/SPECT imaging withthe small animal YAP-(S)PET scanner,” presented at the 2002 Annu.Conf. Academy of Molecular Imaging, San Diego, CA, Oct. 23–27,2002, in abstract.
[4] A. Del Guerra, N. Belcari, D. Herbert, A. Motta, A. Vaiano, G. DiDomenico, E. Moretti, N. Sabba, G. Zavattini, M. Lazzarotti, L. Sensi,and A. Pinchera, “Calibration and performance of the fully engineeredYAP-(S)PET scanner for small rodents,” in Small Animal SPECTImaging, M. A. Kupinski and H. H. Barrett, Eds. Norwell, MA:Kluwer, ch. 17.
[5] A. Motta, C. Damiani, A. Del Guerra, G. Di Domenico, and G. Za-vattini, “Use of a fast deconvolution EM algorithm for 3-D imagingreconstruction with the YAP-PET tomograph,” Comput. Med. ImagingGraph., vol. 26, pp. 293–302, 2002.
[6] NEMA Standards Publication NU2-2001: Performance Measurementsof Positron Emission Tomographs, NEMA Standards PublicationNU2-2001, National Electrical Manufactures Association, Rosslyn,VA, 2001.
[7] Y. Yang, Y.-C. Tai, S. Siegel, D. F. Newport, B. Bai, Q. Li, R. M.Leahy, and S. R. Cherry, “Optimization and performance evaluation ofthe microPET II scanner for in vivo small-animal imaging,” Phys. Med.Biol., vol. 49, pp. 2527–2545, 2004.
[8] Performance Measurements of Positron Emission Tomographs, NEMAStandards Publication NU2-1994, National Electrical ManufacturesAssociation, Washington, DC, 1994.
[9] G. Di Domenico, G. Zavattini, E. Moretti, A. Piffanelli, M. Giganti, A.Motta, N. Sabba, L. Uccelli, E. Benini, A. Duatti, C. Bolzati, A. Boschi,and A. Del Guerra, “YAP-(S)PET small animal scanner, quantitativeresults,” IEEE Trans. Nucl. Sci., vol. 50, pp. 1351–1356.
Authorized licensed use limited to: UNIVERSITA PISA S ANNA. Downloaded on November 21, 2008 at 03:44 from IEEE Xplore. Restrictions apply.


![Yap - Shelter for All - An Enabling or Empowering Strategy [1995]](https://static.fdokumen.com/doc/165x107/631a1dc720bd5bb1740c2432/yap-shelter-for-all-an-enabling-or-empowering-strategy-1995.jpg)