
PERFORMANCE ASSESSMENT IN AIR TRANSPORT: BUILDING A PORTUGUESE CASE STUDY
17
Sitraer 7 (2008) 49-65 – Tr. 85 49 PERFORMANCE ASSESSMENT IN AIR TRANSPORT: BUILDING A PORTUGUESE CASE STUDY Jorge Silva Beira Interior University, Aerospatial Sciences Department Covilhã, Portugal Rosário Macário Lisbon Technical University, Instituto Superior Técnico, CESUR TIS.PT – Consultores em Transportes, Inovação e Sistemas, S.A. Lisbon, Portugal RESUMO Com base em dados publicados pela ICAO estima-se que em 2002, em todo o mundo, mais de 800 transportadoras aéreas tenham assegurado serviços regulares de transporte de passageiros, e que mais de 90 transportadoras aéreas tenham assegurado serviços regulares de transporte de mercadorias. Em 2002 o transporte regular das companhias aéreas pertencentes aos 188 Estados contratantes da ICAO foi estimado em 1.620 milhões de passageiros e em 30 milhões de toneladas de mercadorias. Os principais 25 aeroportos mundiais registaram em 2002 uma capacidade total de 1.020 milhões de passageiros. Muito embora este volume de tráfego represente apenas 33% do total de passageiros transportados em todo o mundo, ele traduz uma assinalável média diária de 110.000 passageiros por aeroporto. No seu conjunto, estes aeroportos asseguraram cerca de 10.8 milhões de movimentos de aeronaves, isto é, uma descolagem/aterragem a cada 73 segundos por aeroporto. Entre 1991 e 2001 o transporte regular de passageiros assegurado pelas companhias aéreas europeias aumentou a um ritmo de 3,5% ao ano. Em 2002 as companhias aéreas europeias registaram 643.840 milhões de passageiro- quilómetro e 32.900 milhões de tonelada-quilómetro (mercadorias e correio). As transportadoras aéreas e os aeroportos são dois elementos essenciais na cadeia de valor do negócio do Transporte Aéreo. Este trabalho apresenta e analisa o desempenho dos principais aeroportos portugueses, e identifica as eventuais lacunas e as possíveis soluções para as ultrapassar de forma, quer a melhorar a competitividade desses aeroportos quer a reforçar a sua posição nas redes europeias de transporte aéreo. ABSTRACT Based on figures published by ICAO, it is estimated that in 2002 more than 800 air carriers worldwide will provide domestic and/or international scheduled passenger services, and more than 90 air carriers will operate scheduled freight services. The total scheduled traffic carried by airlines of all (188) ICAO Contracting States in 2002 is estimated at about 390 billion tonne-kilometres. These airlines carried a total of about 1.620 million passengers and 30 million tonnes of freight. The top 25 worldwide airports, in terms of total passenger’s throughput, reported at about 1.020 million passengers in 2002. Their passenger traffic represents 33% of the world total passenger throughput – an average of 110.00 passengers daily per airport. These airports combined handled about 10.8 million aircraft movements – an average of one take-off/landing every 73 seconds per airport. Over the 1991-2001 period, only scheduled passenger traffic (PKPs) of the European region airlines increased at an average annual rate of 3.5%. During 2002, European airlines carried 263.720 thousands of passengers, while PKPs performed 643.840 millions and freight/mail tonne-kilometres performed 32.900 millions. Air carriers and airports are two key elements in the Air Transport Business value chain. Therefore, this work presents and analysis of the performance of the main Portuguese airports and identifies the performance gaps and possible solutions to overcome these problems improving the competitiveness of Portuguese airports and their position in the European Networks. 1. POSITIVE EFFECTS OF TRANSPORT 1.1. Introduction Any approach chosen to define its concept, the respective researchers reveals unanimous in affirming that the infrastructures are potentially influent in the economic performance of the regions, mainly because “(…) expanding the use of existing resources (labour, capital, etc.), attracting additional resources (…), and making (…) economies more productive”, (Fox and Porca, 2001:104). But such enthusiasm does not let us loose the well sense concerning the matter. Izquierdo (1997:49) defends, even without to take in account the positives effects that indirectly impose in the national economy, that “(…) las infraestruturas (…) no generan
Transcript of PERFORMANCE ASSESSMENT IN AIR TRANSPORT: BUILDING A PORTUGUESE CASE STUDY

Sitraer 7 (2008) 49-65 – Tr. 85
49
PERFORMANCE ASSESSMENT IN AIR TRANSPORT:
BUILDING A PORTUGUESE CASE STUDY
Jorge Silva Beira Interior University, Aerospatial Sciences Department
Covilhã, Portugal
Rosário Macário Lisbon Technical University, Instituto Superior Técnico, CESUR
TIS.PT – Consultores em Transportes, Inovação e Sistemas, S.A.
Lisbon, Portugal
RESUMO Com base em dados publicados pela ICAO estima-se que em 2002, em todo o mundo, mais de 800
transportadoras aéreas tenham assegurado serviços regulares de transporte de passageiros, e que mais de 90
transportadoras aéreas tenham assegurado serviços regulares de transporte de mercadorias. Em 2002 o transporte
regular das companhias aéreas pertencentes aos 188 Estados contratantes da ICAO foi estimado em 1.620
milhões de passageiros e em 30 milhões de toneladas de mercadorias. Os principais 25 aeroportos mundiais
registaram em 2002 uma capacidade total de 1.020 milhões de passageiros. Muito embora este volume de tráfego
represente apenas 33% do total de passageiros transportados em todo o mundo, ele traduz uma assinalável média
diária de 110.000 passageiros por aeroporto. No seu conjunto, estes aeroportos asseguraram cerca de 10.8
milhões de movimentos de aeronaves, isto é, uma descolagem/aterragem a cada 73 segundos por aeroporto.
Entre 1991 e 2001 o transporte regular de passageiros assegurado pelas companhias aéreas europeias aumentou a
um ritmo de 3,5% ao ano. Em 2002 as companhias aéreas europeias registaram 643.840 milhões de passageiro-
quilómetro e 32.900 milhões de tonelada-quilómetro (mercadorias e correio). As transportadoras aéreas e os
aeroportos são dois elementos essenciais na cadeia de valor do negócio do Transporte Aéreo. Este trabalho
apresenta e analisa o desempenho dos principais aeroportos portugueses, e identifica as eventuais lacunas e as
possíveis soluções para as ultrapassar de forma, quer a melhorar a competitividade desses aeroportos quer a
reforçar a sua posição nas redes europeias de transporte aéreo.
ABSTRACT Based on figures published by ICAO, it is estimated that in 2002 more than 800 air carriers worldwide will
provide domestic and/or international scheduled passenger services, and more than 90 air carriers will operate
scheduled freight services. The total scheduled traffic carried by airlines of all (188) ICAO Contracting States in
2002 is estimated at about 390 billion tonne-kilometres. These airlines carried a total of about 1.620 million
passengers and 30 million tonnes of freight. The top 25 worldwide airports, in terms of total passenger’s
throughput, reported at about 1.020 million passengers in 2002. Their passenger traffic represents 33% of the
world total passenger throughput – an average of 110.00 passengers daily per airport. These airports combined
handled about 10.8 million aircraft movements – an average of one take-off/landing every 73 seconds per
airport. Over the 1991-2001 period, only scheduled passenger traffic (PKPs) of the European region airlines
increased at an average annual rate of 3.5%. During 2002, European airlines carried 263.720 thousands of
passengers, while PKPs performed 643.840 millions and freight/mail tonne-kilometres performed 32.900
millions. Air carriers and airports are two key elements in the Air Transport Business value chain. Therefore, this
work presents and analysis of the performance of the main Portuguese airports and identifies the performance
gaps and possible solutions to overcome these problems improving the competitiveness of Portuguese airports
and their position in the European Networks.
1. POSITIVE EFFECTS OF TRANSPORT
1.1. Introduction Any approach chosen to define its concept, the respective researchers reveals unanimous in
affirming that the infrastructures are potentially influent in the economic performance of the
regions, mainly because “(…) expanding the use of existing resources (labour, capital, etc.),
attracting additional resources (…), and making (…) economies more productive”, (Fox and
Porca, 2001:104). But such enthusiasm does not let us loose the well sense concerning the
matter. Izquierdo (1997:49) defends, even without to take in account the positives effects that
indirectly impose in the national economy, that “(…) las infraestruturas (…) no generan

Sitraer 7 (2008) 49-65 – Tr. 85
50
directamente, por sí mismas, desarrollo económico – y en concreto desarrollo regional –
siendo necesario para ello contemplarlas como un elemento del sistema territorial, dentro del
contexto más amplio de la ordenación del territorio”.
This position is also corroborated by the EIB - European Investment Bank, when it underlies
that the objective of the politics of regional development is to create the conditions for an
autonomous and supported growth of the per capita income of the less favoured regions,
allowing it to approach the one of the European average; adding that the infrastructure “(…)
contributes only indirectly to this aim: in itself, it has only a marginal multiplier effect, as
infrastructure use does not contribute significantly either towards increasing the national
product, the creation of permanent jobs or the transfer of technology, nor does it have an
impact as a purchaser on the other regional industries or services. (…) [I]nfrastructure may,
though, act as a catalyst in promoting development”, (EIB, 1998:9). The debate around the
relationship between regional development and, specifically, the infrastructures of transport is
not recent and has been one of all the preferred themes, either among the specialists in this
matter, or among the public in general. For some of them, such link became so obvious that
already does not deserve a special reference allowing, this way, not only to create the illusion
that the transport is simply a consequence of the demand, but also to minimize the impact of
any empirical evidence to this respect. In fact, it is possible to evidence, empirically, the
remarkable regularity verified in the last years, in a lot of countries, in the relationship
between the growth of the transport and the economic growth, which it is as relevant as we
know the successive changes – mainly technical ones, that the several modes have imposed to
the sector. In this context, in the possibility that the transport were only one way to reach
certain purpose, “(…) if it can be economised then we should expect to see a reduction in the
amount of transport necessary to achieve a given level of welfare”, (Vickerman, 2000:2).
In the opinion of Vickerman (2000:2) “(…) it appears that transport faces both a strong
positive income elasticity of demand and an overall price elasticity not far from unity. There
is a suggestion that in terms of both money and time budgets there are a given (proportional)
allocation to transport”. In fact, as it became more accessible and proportionally cheaper, now
it is possible to go even more far away in the same space of time and - also proportionally,
with the same budget. As society evolves it is more common to inhabit in a place far away
from that of work; “(…) even the telecommuter spends about the same time in the week
travelling as the daily commuter, taking the benefits of the telecommuting freedom to live in a
better area”, (Vickerman, 2000:2). Similarly, while in a recent past the vacation and leisure
places were restricted to a set of options, necessarily delightful but also relatively close to
those of residence, nowadays the destinations not rare are offered / choosed outside the
respective countries, inclusively in other continents. Simultaneously, also the transport of
goods faces remarkable changes on account of the companies which look for to wide the
markets, not only those for the supply of the raw materials but also those for the transaction of
the manufactured items.
In this context - and even weighing all the arguments, it is not easy to establish the true
essence of the relationship between the infrastructures of transport and the regional
development, mainly because we are facing two types of impacts, which Vickerman (1996)
thus classifies: non-spatial impacts - those occurring as an imposition in the economic activity
- in general, by the investment in infrastructures; spatial impacts – those occurring as a
consequence of different performances, in different places too, by the infrastructures itselves.

Sitraer 7 (2008) 49-65 – Tr. 85
51
1.2. Non-Spatial Effects 1.2.1. Investment and Productivity
The approach to the relationship between the infrastructures and the development on the basis
of the analysis of the effects imposed for such investments in the economic activity is,
perhaps, the most generalized and the most argued during the last years, mainly since the
arguments presented about this matter for Aschauer (1989, 1990). In the opinion of this
author, the impact of the infrastructures - acting in this particular as public goods, reflects
itself directly into the economy, raising the level of the economic activity and stimulating the
productivity of the private capital; and so, it must be modelled as an additional factor in the
general function of production. However, several critics emerge on account of the role played,
in this particular, by the public infrastructures, mainly because the respective initial impacts
“(…) would be to crowd out private investment by raising either or both the level of taxation
and the interest rate”, (Vickerman, 2000:7). For the same author this was, precisely, the main
reason of the softening of the public investment in infrastructures verified in many countries
in the decades of 70 and 80 of the XX century, which consequences re-echo itselves, still
today, in the quality of the services given for many of them.
However, when Aschauer (1989) used the function of production of Cobb-Douglas to esteem
the elasticity of the infrastructure - “(…) as an additional input to labour and private capital
(…)”, he found figures between 0.4 and 0.5, so high “(…) that the social rate of return would
be in excess of 100% on such investment”, (Vickerman, 2000:7); results that - even arguables,
seem to show how an investment of this nature can be itself an important source of economic
growth, exceeding in the long run any difficulty which, in the moment, can persist. In this
context, the attempts of restriction of the investment in infrastructures justified simply as
measures of budgetary control of the public sector can be, not only unproductives, but also
inconsequents in the attempt to mitigate eventual difficulties; in alternative, a wise forecast in
the public investment can induce the economic growth and the productivity of the private
sector “(…) and more than pay for itself in higher long run growth levels”, (Vickerman,
2000:8). But an approach like this one is not without critiques (Holtz-Eakin, 1993; Holtz-
Eakin and Schwartz, 1995; Holtz-Eakin and Lovely, 1996; Lau and Sin, 1997; Izquierdo,
2003) and at several levels: on the formulation of the model structure, variables and
parameters, on the significance of the correlations, on the evaluation of the real value of the
public infrastructure, etc..
For Izquierdo (2003:13) the results obtained in Spain - and, according to this author,
confirmed in other countries, not only show that the elasticities estimated by Aschauer (1989)
are too much high, but also that “(…) although significant, the impact of infrastructure
investment on productivity and economic growth is therefore not as high as previously
thought”. Therefore, “(…) the best that can be said with any confidence is that infrastructure
investment will have a modest positive contribution on economic growth, but that the more
accurately the opportunity costs are measured, the less attractive return infrastructure
investment offers than other types of public investment expenditure, especially education and
training to enhance human capital”, (Vickerman, 2000:8). This means that economic
estimation of benefits either are the result or impact stage will always be dependent on which
strategic objectives we are targeting and the opportunity costs of that choice. Quantitative cost
benefits approaches despite their rigour seem to fall short to support political decisions,
although they can be thought as sufficient to support the engagement of private investors.
Sitraer 7 (2008) 49-65 – Tr. 85
52
1.2.2. Transport and Market Integration
For an evaluation of the global impact of the transport in the market integration, we assume
that a reduction of the transport costs means, not only the incentive to exportation - and,
necessarily, the perspective of an increase of the income, but also the other face of the same
coin, e.g. the threat of more competitive imports, as accessibility is indeed a two way road -
imposing thus to the (local) industry a reorganization, an increase of efficiency, and a
reduction of the production costs. So the process described is absolutely similar to the one
verified when reduction - or elimination, of certains barriers between economic spaces occurs.
In both cases, the most optimistics forecasts collide with the reality: a reduction of the
transport costs transforms each territory in a positive way but leaving it eventually more
vulnerable to the exterior. To this respect Vickerman (2000:9) underlines some “(…)
important feedback effects in the system”: first, it is necessary to take in mind the impact of
the increase of the production in the markets - in case that these evidence bottlenecks; and
second, the increment of the economic activity by the reduction of the transport costs can lead
precisely to contrary effects of those initially desired - the inherent increase of the demand of
transport can lead to the congestion of some parts of the network justifying, in turn, the
increase of such costs (the effect of traffic inducement (Viegas, 2002) comes in support of this
argument).
1.2.3. Transport and Endogenous Growth
Many of the authors who mention the endogenous growth (Lopes, 1984; Paelinck and Kuiper,
1995; Reigado, 1998; Matos, 2000) admit that certain changes into this level can contribute
for the growth of the economy, “(…) rather than a shock to the system which shifts the level
upwards but ultimately leads to a return to an exogenously given underlying rate of growth”,
(Vickerman, 2000:9). So, the investment in infrastructures of transport will have a rebound
effect into: the processes of industrial reorganization - through, either the entrance and the exit
of companies, or the search of widened markets; the rhythm of transference of the innovation
and the technology - following up that of the exchange of information flows; the increment of
the factors which, in its set, concur for the competitiveness index.
However, a word of caution is also required here since underlying this rational is the
presumption that sectors using transport as productive factors are perfectly competitive and
thus almost immediately incorporate in price the variation of transport costs, which does not
happen always. The real value for the economy of any investment in transport infrastructures
can be directly measured “(…) by the willingness to pay for use of the transport system. Thus
appraisal of any transport improvement has only to measure accurately the transport demand
function and these transport benefits will be a complete and accurate measure of the full
economic value”, (Vickerman, 2000:10). However, there is more to it. In each industry the
willingness to pay for transport varies among the segments and cross subsidization of
transportation costs or of other productive factors by transportation costs exists. Calculation of
real effects of transport infrastructure is not as straightforward as presented by some authors.
1.3. Spatial Effects 1.3.1. Companies Competitiveness
Rietveld and Bruinsma (1998:360) argue that “(…) in the regional economic dynamics,
transport infrastructure improvements can have different impacts in firms. First, existing firms
might grow or decline; second, new firms may emerge; third, infrastructure improvements
may influence the relocation decision of existing firms”. Other authors (Forkenbrock and

Sitraer 7 (2008) 49-65 – Tr. 85
53
Foster, 1996; Cairncross, 1997; Banister and Berechman, 2000) argue that transport
infrastructures do not represent anymore a so important factor of localization as in the past,
due to in one hand the low costs of transport and, on in the other hand, the increasing
participation of information flows to the detriment of physical flows. Still others (Leitham,
McQuaid and Nelson, 2000; Preston, 2001; Holl, 2001), underline that the current industrial
reorganization - based in a competitiveness where the time factor is of capital importance,
made the distribution and the production systems more dependent of the transports and,
therefore, of the access to such infrastructures, mainly those of high quality standard. For
example, Smith and Florida show in 1994 that the Japanese companies of the automobile
sector which fixed itselves in the USA elected, as main factor of localization, precisely the
access to the highway.
To understand the rational at the core of this debate it is necessary to take in account the set of
effects through which the transport infrastructures impose themselves the organization of the
companies and in the respective space distribution and, therefore, in the standards of
development of the regions where they are implemented (Holl, 2004):
• of the location decision - the choice of the localization is one of the strategic decisions
of the companies. The economic approach based on the demand argues that, in
general, companies choose a localization from which they can reach the widest
possible market. Weber (1929), thinking about imperatives of minimization of the
costs, defends that the companies choose a localization according to the relative cost
to carry raw materials and manufactured items to a certain (central) market. There are
of course other influencing factors, such as the acquisition and the storage of stocks, or
taxes and lower costs of installation, cheaper or specialized man power;
• of the area of market and the level of competitiveness - “(…) a reduction in transport
costs can enable firms to increase their competitiveness and to expand their markets,
by lowering prices or profitably serving markets at greater distance where they were
formerly excluded on cost grounds”, (Holl, 2004:538). This can also induce
companies to widen the area where they traditionally operate. The emergent reactions
being dependent on the company and market maturity degree. Very dynamic and
specialised firms and those with potential to exploit economies of scale may be the
most likely to benefit from transport improvements by increasing their ability to sell
over a larger market area, (Holl, 2004);
• of the organization of the production and the structure of the supply - not rarely
transport is considered as “(…) an input factor in the production process (…)”,(Holl,
2004:539); in this particular, a reduction of the transport costs can reflect itself,
directly, in the planning of the production. As an example of the substitution effect,
Holl (2004:539) underlines the “(…) outsourcing, where lower transport costs can
make it economical for the firm to buy-in intermediate inputs that were formerly
produced “in house”;
• of the logistic – in general, the studies directly related with economic impacts of the
infrastructures of transport pay a special attention to the costs. Diamond and Spence developed
in the UK, in the year of 1989, a research in the theme of industrial location, concluding that for
some companies of this sector the transport costs represented, only, a small ratio of the total
devaluating costs. However, “(…) traditional cost estimates do not take into account attributes
like flexibility and reliability, nor indirect effects of how increased speed, flexibility and
reliability affect the scheduling and organisation of activities (…)”, (Holl, 2004:539).

Sitraer 7 (2008) 49-65 – Tr. 85
54
1.3.2. Transport and Labour Market
Holl (2004:540) underlines that “(…) there are potentially important effects from transport
improvements regarding the size of the regional labour market area and firm’s access to
specialised labour skills (…)”; an interaction that Vickerman (2000:15) verifies in two distinct
levels: “(…) first, labour is a major input to all activities and is, in most cases, locationally
specific in that it has to be physically present for the activity to take place. Secondly, transport
affects labour both as an input to production (commuting), and as an input to other activities
(social, leisure, etc.) which constitute the final demand for activities”. In a first reaction, the
area of work market increases: with the reduction of such costs, the workers can now move
themselves more far, at the same (total) cost. This mechanism induces, in general, a bigger
competitiveness in the local work market by the forces of other regions making - not rarely, a
reduction of the wages and/or an increase of the unemployment. But also it allows the local
workers the possibility to reach other markets, in other regions, “(…) which could have the
effect of bidding up wages as firms seek to retain staff”, (Vickerman, 2000:15). Besides, the
negative impacts of such mechanism into the job levels and wages are ambiguous and depend
on the specific characteristics of the job and of the man power in each region. In a second
reaction, it is expected the appearance of migration (residence speaking) phenomenons: a
decreasing of the costs of the commuting movements can transform the region in appraisal
more attractive for all of those who, even working outside it, look now to install themselves
there. In this particular, also the unexpected increment of the supply of man power can imply,
locally, some problems at the level of the wages and/or of the job; counterbalanced however -
and eventually, by emigration movements.
1.3.3. Transport and Real Estate Market
The impacts which a reduction of the costs of the transports, in general, and of the commuting
movements, in particular, can entail, allows the evidence on the complexity of the underlying
phenomenons: any action in that direction origins a set of reactions; which, in turn, interact
with the original actions generating new reactions; and thus successively - as in any dynamic
system (Rietveld, 1994). This justifies the answers given - and almost in simultaneous, for the
work and the housing markets, as a result of the implementation of a new infrastructure,
despite its dependency “(…) on the degree of slack in both of these markets which will
determine whether prices change rapidly or slowly”, (Vickerman, 2000:16). It is largely
recognized that the work market cannot be dealt independently from any others mainly that of
the housing - besides it appears, nowadays, each time more overlap with the increasing
importance imputed to the families where more than one of its elements works externally. On
the other hand, it is recognized the close relationship between the housing market and the
infrastructures of transport - evidencing the direct advantages which this market gathers from
there, perhaps even more than from that one of work. In this context, it is not difficult to
understand the correlation between both markets, neither the advantages / disadvantages that
balance / unbalance situations that can be produced between both.
According to Vickerman (2000), even it may happen that in the long run the restrictions to the
housing market, more than the migratory movements, transform itselves into the main drivers
for the commuting movements. In the opinion of Vickerman (2000) the UK study by
Cameron and Muellbauer, in 1998, underlines the influence that housing market has in the
migratory movements between regions and provides evidence that “(…) differential labour
market effects in contiguous regions lead to commuting being substituted for migration, and
for nearby regions there is a stronger labour market effect on commuting decisions and a

Sitraer 7 (2008) 49-65 – Tr. 85
55
stronger housing market effect on migration decisions”, (Vickerman, 2000:16). Furthermore,
this author (Vickerman, 2000:17) suggests that “(…) from the early work of von Thünen
(1826) this “trade-off” approach shows how the increased costs of access as one moves
further from a market centre lead to a reduction in the price which potential users will bid for
the use of land at a particular location. In equilibrium the total value of land rents in a market
will equal the sum of all the transport costs such that there is a clear link between the quality
of an area’s transport and the local price land”, which represents an important insight for the
valuation of soils.
2. NATIONAL AIRPORTS PERFORMANCE AND REGIONAL DEVELOPMENT
2.1. Introduction The Principal Network of Portuguese Airports consists of those international aeronautical
infrastructures which most contribute to air transport figures: Lisbon (Portela), Oporto
(Francisco Sá Caneiro), Faro, Madeira, Porto Santo, Ponta Delgada (John Paul II), Santa
Maria and Lajes. In turn, the Secondary Network consists of those airports and aerodromes,
smaller and therefore which less contribute to those figures.
To characterize the Air Transport in Portugal we divided our research into the following three
steps: first, we analyzed data gathered by INAC, between 1950 and 2000, on aircraft
movements (landings and take-offs) passengers (embarking and disembarking) cargo and mail
(embarking and disembarking) in all the aeronautical infrastructures under the jurisdiction of
ANA (Lisbon, Faro, Oporto, Ponta Delgada, Santa Maria, Horta and Flores) and ANAM
(Madeira and Porto Santo); second, we analyzed the same data gathered simultaneously by
INAC and NAV, between 2001 and 2005, not only in all those mentioned aeronautical
infrastructures but also in Municipal Aerodromes of Cascais and Bragança, Aerodromes of
Corvo, Graciosa and São Jorge, and Airport of Pico; third, and with such data collected from
1950 to 2005, we forecasted the total of aircraft movements, passengers, cargo and mail for a
10 years period, e.g. from 2006 till 2015.
2.2. Air Transport between 1950 – 2000 As mentioned above we started to analyse data collected by INAC between 1950 and 2000,
concerning the total of aircraft movements (landings, followed by take offs) passengers
(individuals transported - excluding crew members and passengers in transit) cargo (goods
transported - including express freight and diplomatic bags, but excluding equipment for
flight completion, supplies, mail in general and luggage) and mail (all sealed bags sent by
CTT or any other authorized dealer, whatever its content) on all the aeronautical
infrastructures under the jurisdiction of ANA and ANAM, (Miguel and Silva, 2005).
Figure 1 shows that the total of aircraft movements increased from 15,655 in 1950 to 227,137
in 2000, e.g. 14.5 times; figure 2 shows that the total of passengers in the same period
increased 208.8 times, e.g. from 94,135 to 19,650,520; figure 3 shows that the total of cargo
increased from 607 tons in 1950 to 163,404 tons in 2000, e.g. 269.2 times; and figure 4 shows
that the total of mail increased 63.6 times in the same period, e.g. from 297 tons to 18,873
tons. For each item the most remarkable increase appeared in 1953 - 30.7% for the total (tons)
of mail, in 1954 - 23.1% for the total of aircraft movements, and in 1964 - 31.9% for the total
of passengers and 45.0% for the total (tons) of cargo.

Sitraer 7 (2008) 49-65 – Tr. 85
56
Figure 1: Total of Aircraft Movements, 1950-2000
Figure 2: Total of Passengers, 1950-2000
Figure 3: Total (Tons) of Cargo, 1950-2000
Figure 4: Total (Tons) of Mail, 1950-2000
During this period (1950 to 2000) there were some values which particularity we want to
underline. Thus, so figure 1 shows that in the beginning of the 60s there was a slight decline
of the aircraft movements due to the start of the Colonial War (in 1961); however, the same
conflict probably gave an important contribution to the increase of air transport figures in later
years. Both figures 1 and 2 show the increase of aircraft movements and passengers until
Sitraer 7 (2008) 49-65 – Tr. 85
57
1974 - the year of April Revolution, date from which those indicators dropped again. Since
1975 air transport figures grew again due to the ongoing process of decolonization too. Surely
in the 80s air transport benefited from the exploitation of new markets offered by the
accession of Portugal to the European Union (1986). In the 90s it should be noted that the
fruition of the Expo'98 in Lisbon led to increases of 14.3% of the total of aircraft movements
and 12.4% of the total of passengers.
It’s also necessary to emphasize that the development of the tourism industry is assuming
each year a growing importance for the improvement of air transport performance. In fact this
is one of the strongest sectors of the Portuguese economy in general, and of some regional
economies too. Really, Portugal has enjoyed either from the abundance of natural resources or
the excellence of it geographical location to attract even more tourists - as Faro and Funchal
Airports are (just) two examples. In turn, cargo and mail transported by air have not been
growing so regularly, as evidenced by some oscillations in both figures 3 and 4 - mainly
concerning the cargo case. In fact, air transport is not the main responsible in Portugal for
either imports or exports of goods. One expects that not only the perception of air mode
competitive advantages but also the synergies resulting from the inclusion in multimodal
networks may contribute to consolidate the image and importance of air freight transport in
the global economy markets.
2.3. The Case for 2001 – 2005 Period Afterwards we analysed data collected simultaneously by INAC and NAV, between 2001 and
2005, concerning the total of aircraft movements, passengers and cargo not only on all the
aeronautical infrastructures under the jurisdiction of ANA and ANAM mentioned above, but
also in Municipal Aerodromes of Cascais and Bragança, Aerodromes of Corvo, Graciosa and
São Jorge, and Airport of Pico, (Miguel and Silva, 2005).
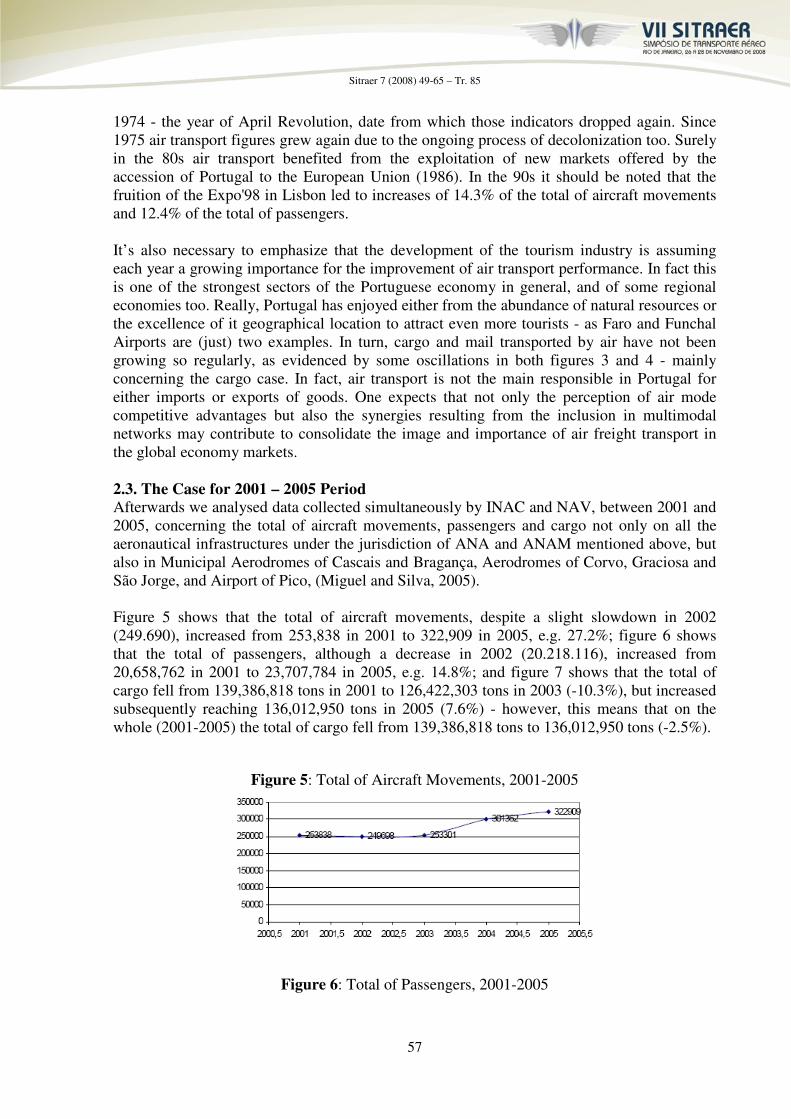
Figure 5 shows that the total of aircraft movements, despite a slight slowdown in 2002
(249.690), increased from 253,838 in 2001 to 322,909 in 2005, e.g. 27.2%; figure 6 shows
that the total of passengers, although a decrease in 2002 (20.218.116), increased from
20,658,762 in 2001 to 23,707,784 in 2005, e.g. 14.8%; and figure 7 shows that the total of
cargo fell from 139,386,818 tons in 2001 to 126,422,303 tons in 2003 (-10.3%), but increased
subsequently reaching 136,012,950 tons in 2005 (7.6%) - however, this means that on the
whole (2001-2005) the total of cargo fell from 139,386,818 tons to 136,012,950 tons (-2.5%).
Figure 5: Total of Aircraft Movements, 2001-2005
Figure 6: Total of Passengers, 2001-2005

Sitraer 7 (2008) 49-65 – Tr. 85
58
Figura 7: Total (Tons) of Cargo, 2001-2005
2.4. Possible Scenarios between 2006 – 2015 Finally, and using data available from 1950 till 2005, we forecasted the total of aircraft
movements, passengers, cargo and mail for a 10 years period, e.g. from 2006 till 2015,
(Miguel and Silva, 2005).
There are several techniques for data forecast. However, but mainly because of the simplicity
of the method, we used the Analysis Tools Application for Microsoft Office Excel under
Windows XP to submit data concerning the total of aircraft movements, passengers, cargo and
mail, between 1950 and 2005, to several trend lines: linear, 2nd order polynomial and
exponential. To validate the line or the curve with the best fit thus obtained, we used the
variance explained proportion, e.g. the (highest) value of R2
(table 1).
� Table 1: Values of R
2
� Aircraft Movements � Passengers � Cargo � Mail
� Linear � 0,8516 � 0,8780 � 0,9432 � 0,9501
� 2nd Degree Polynomial � 0,9669 � 0,9896 � 0,9551 � 0,9763
� Exponential � 0,9769 � 0,9258 � 0,8681 � 0,9159
According with the values of R2 shown in table 1, the trend lines we got for the total of
aircraft movements, passengers, cargo and mail, between 1950 and 2005, are those
represented in figures 8, 9, 10 and 11.
� Figure 8: Exponential Trend Line for the Evolution
� of the Total of Aircraft Movements, 1950-2005

Sitraer 7 (2008) 49-65 – Tr. 85
59
� Figure 9: 2nd Degree Polynomial Trend Line for the
� Evolution of the Total of Passengers, 1950-2005
� Figure 10: 2nd Degree Polynomial Trend Line for the
� Evolution of the Total (tons) of Cargo, 1950-2005
� Figure 11: 2nd Degree Polynomial Trend Line for the
� Evolution of the Total (tons) of Mail, 1950-2005
However, we verified experimentally that some values forecasted through equations
previously indicated – the cases of the Evolution of the Total of Passengers (trend line 2nd
degree polynomial) and of the Evolution of the Total (tons) of Mail (trend line 2nd
degree
polynomial), were not compatible with the reality; for example, in 2006 the figures so
forecasted were - 612,903,086 (negative) and 4,300,280 tons (very high) - respectively.
Sitraer 7 (2008) 49-65 – Tr. 85
60
In the case of the Total of Passengers, and according to the (decreasing) values of R2 in table
1, we tried one after another firstly the exponential and secondly the linear trend lines -
without any improvement too. Therefore, in this particular we decided to use the FORECAST
function of the Analysis Tools Application for Microsoft Office Excel under Windows XP,
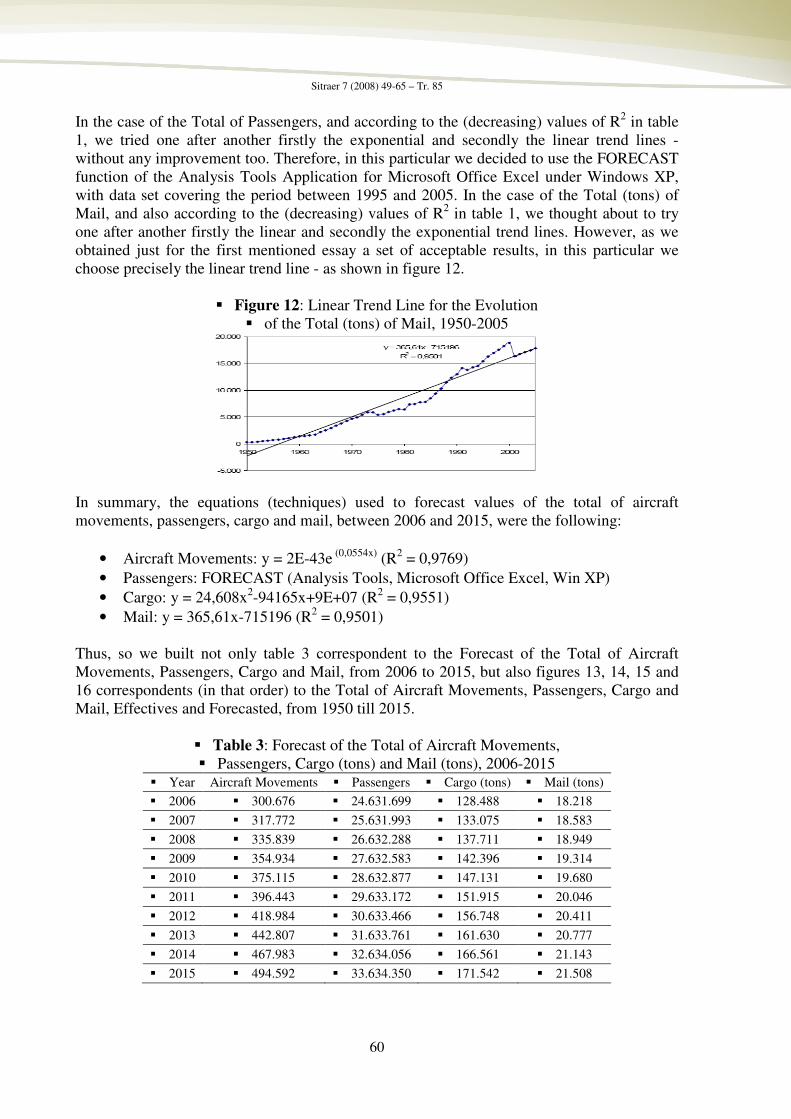
with data set covering the period between 1995 and 2005. In the case of the Total (tons) of
Mail, and also according to the (decreasing) values of R2 in table 1, we thought about to try
one after another firstly the linear and secondly the exponential trend lines. However, as we
obtained just for the first mentioned essay a set of acceptable results, in this particular we
choose precisely the linear trend line - as shown in figure 12.
� Figure 12: Linear Trend Line for the Evolution
� of the Total (tons) of Mail, 1950-2005
In summary, the equations (techniques) used to forecast values of the total of aircraft
movements, passengers, cargo and mail, between 2006 and 2015, were the following:
• Aircraft Movements: y = 2E-43e (0,0554x)
(R2 = 0,9769)
• Passengers: FORECAST (Analysis Tools, Microsoft Office Excel, Win XP)
• Cargo: y = 24,608x2-94165x+9E+07 (R
2 = 0,9551)
• Mail: y = 365,61x-715196 (R2 = 0,9501)
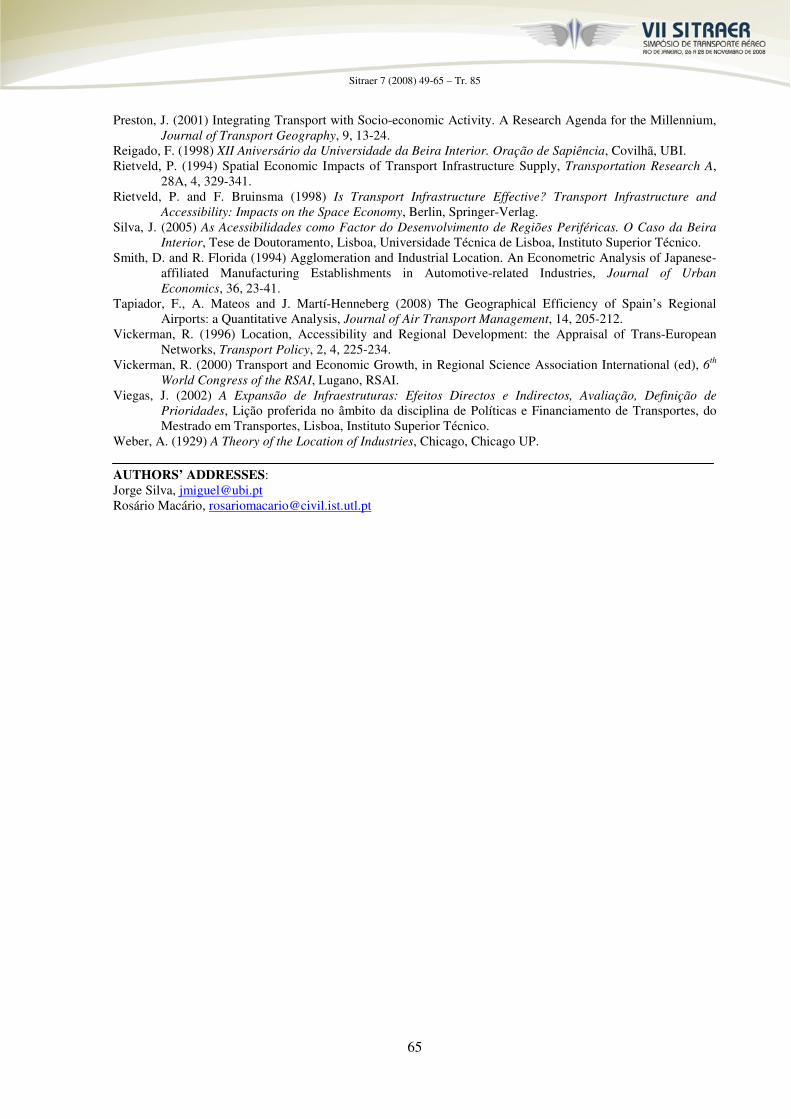
Thus, so we built not only table 3 correspondent to the Forecast of the Total of Aircraft
Movements, Passengers, Cargo and Mail, from 2006 to 2015, but also figures 13, 14, 15 and
16 correspondents (in that order) to the Total of Aircraft Movements, Passengers, Cargo and
Mail, Effectives and Forecasted, from 1950 till 2015.
� Table 3: Forecast of the Total of Aircraft Movements,
� Passengers, Cargo (tons) and Mail (tons), 2006-2015 � Year Aircraft Movements � Passengers � Cargo (tons) � Mail (tons)
� 2006 � 300.676 � 24.631.699 � 128.488 � 18.218
� 2007 � 317.772 � 25.631.993 � 133.075 � 18.583
� 2008 � 335.839 � 26.632.288 � 137.711 � 18.949
� 2009 � 354.934 � 27.632.583 � 142.396 � 19.314
� 2010 � 375.115 � 28.632.877 � 147.131 � 19.680
� 2011 � 396.443 � 29.633.172 � 151.915 � 20.046
� 2012 � 418.984 � 30.633.466 � 156.748 � 20.411
� 2013 � 442.807 � 31.633.761 � 161.630 � 20.777
� 2014 � 467.983 � 32.634.056 � 166.561 � 21.143
� 2015 � 494.592 � 33.634.350 � 171.542 � 21.508

Sitraer 7 (2008) 49-65 – Tr. 85
61
Figure 13: Total of Aircraft Movements,
Efectives and Forecasted, 1950-2015
Figure 14: Total of Passengers, Effectives
and Forecasted, 1950-2015
Figure 15: Total (Tons) of Cargo, Effectives
and Forecasted, 1950-2015
Figure 16: Total (Tons) of Mail, Effectives
and Forecasted, 1950-2015
3. AIR TRANSPORT SERVICES AND NEW ECONOMY ACTIVITIES
3.1. Introduction Perhaps a good criterion for measuring the success of an air transport system should be the
ability to use air travel as a competitive advantage in a global economy, (Button and Taylor,
2000).

Sitraer 7 (2008) 49-65 – Tr. 85
62
On one hand, air transport is an important issue for the success of tourism in a lot of regions,
mainly for two reasons: changes in technology affect both size and speed of aircrafts, and the
real cost of travel fell through low cost packages and tourist discounts. Thus, so “(…) as
market demand is highly elastic at the lower price level, this has led to a large increase in
demand (…)”, (Cole, 1998:430). On the other hand, air transport is also an important input for
the development of non-leisure-based industries all over the world, mainly for those which
promote interpersonal linkages. In fact, not only passenger air transport is crucial to some of
those industries, but also many of “(…) such firms also rely on a range of air freight services
to provide quality service to customers and to operate just-in-time production management”,
(Button and Taylor, 2000:209).
3.2. New Economy and Air Services Air transport is commonly used by all categories of business, but it became particularly
important for those categories engaged in what Button and Taylor (2000) call new economy
activities, e.g., business categories requiring for those companies involved easy inter-personal
contacts only possible with high-quality transport services. Thus, so these authors listed 125
new activities in the following 11 groups: IT Software, IT Services, Telecom Services,
Advanced Materials, Aerospace, Biotechnology, Energy and Environment, Electronics,
Transportation, Management and Services, and Technology Industrial Manufacturing.
The impact evaluation of these new services over the territories is not an easy task, (Barros,
2008; Halpern and Pagliary, 2008; Tapiador et al, 2008) mainly for two reasons: services
themselves may interact in several combinations, and territories themselves may react in
several ways too accordingly to its own endogenous characteristics, (Cole, 1998). However,
Button and Taylor (2000) consider these spatial and non-spatial impacts in terms of four
mainly effects:
• Primary effects: these are the direct and immediate benefits to a region for the creation
of new services and / or the expansion of others still existing. They may include the
need for some physical improvements over the local air infrastructure but they may
bring some local benefits too on account of the wages and incomes the workers and
companies consequently spend in the region. Although these are gains to the local
economy, they are of short term and usually limited in their order of magnitude;
• Secondary effects: these are the longer term effects. Usually they are linked with the
local economic benefits of the air service operations mainly due to the employment
involved directly with handling the aircraft, passengers and cargo. There are also very
important indirect secondary effects over the local economy concerning the on-going
income flow of air service operations in terms of employment and income in general
and taxation revenue for local authorities in particular. The secondary effects size over
the territories depends upon airport operations volume and nature;
• Tertiary effects: these are the effects over the local economy resultant of air transport
services at the disposal of both, individuals and companies. Usually, the development
of business activities require the use of transportation in general, but those engaged
with the new economy are surely involved with the air mode in particular, because
they need easy inter-personal contacts only possible with high-quality transport
services. Usually, these companies sets act as the basis for local economic
development, mainly for two reasons: they present a considerable geographical

Sitraer 7 (2008) 49-65 – Tr. 85
63
mobility, and they belong to an important growth sector;
• Perpetuity effects: as Aschauer (1989, 1990) underlines there are empirical evidences
that infrastructure investment reflects itself into the regional economy, by raising the
activity level and stimulating the productivity, thus acting as a catalyst for higher
economic growth in the appraisal area. Also some growth theories, like the
endogenous one, sustain that the regional economic growth, once started, becomes
self-sustaining and may inclusively accelerate. Thus, so the air transport services
development acting as a kick-start mechanism may set in progress larger and longer
term crossed regional economic development processes of wide scope and density,
leading no doubt to profitable scale economies.
Button and Taylor (2000) mention that a few empirical works has been conducted on the
linkages between the new economy activities and air transport services, much of them
involving interviews with local business agents In general, the associated results underline the
eventual existence of those services in the vicinity as an important decision factor in the
localization of the companies. However, that approach based on interviews may experiment
some practical difficulties, mainly because many respondents often fell themselves free to
prior support the idea of a positive link between the new economy activities and air transport
services as they have no direct costs to bear if these services appear or are expanded, but only
benefits. “An alternative is to use numerical methods and to focus purely on the more direct
effects of air services on a local economy, namely those associated with the airline service per
se and the multiplier implications of this for the local economy”, (Button and Taylor,
2000:215).
In conclusion, some authors reveals unanimous in stating that infrastructures are potentially
influent in the economic performance of the regions, mainly because the opportunities for
“(…) expanding the use of existing resources (labour, capital, etc.), attracting additional
resources (…), and making (…) economies more productive”, (Fox and Porca, 2001:104).
However, Izquierdo (1997:49) underlines that “(…) las infraestruturas (…) no generan
directamente, por sí mismas, desarrollo económico – y en concreto desarrollo regional –
siendo necesario para ello contemplarlas como un elemento del sistema territorial, dentro del
contexto más amplio de la ordenación del territorio”. Also the EIB (European Investment
Bank) argues that “(…) itself, it has only a marginal multiplier effect, as infrastructure use
does not contribute significantly either towards increasing the national product, the creation of
permanent jobs or the transfer of technology, nor does it have an impact as a purchaser on the
other regional industries or services. (…) [I]nfrastructure may, though, act as a catalyst in
promoting development”, (EIB, 1998:9).
4. CONCLUSIONS For a long time that attention is paid to the economic impact of transport systems over the
regional development, air infrastructures in particular. In general, the regional impacts
generated by the existence of an infrastructure, such as an airport, will be greater the more
services it offers and the wider the range of destinations it allows. However, this relationship
may be non-linear, mainly because from a commercial point of view airlines will provide
prior flights to the most attractive destinations than to the ones less important, (Silva, 2005).
The size and the endogenous characteristics are important too, as new economy activities will
be attracted easier to larger regions with a significant population amount and an important

Sitraer 7 (2008) 49-65 – Tr. 85
64
market area than to smaller ones sparsely populated and with a weak entrepreneurship
dynamic. Indeed, those territories not only offer a wider potentially suitable labor market but
also provide a larger one for goods and services produced. So the overall conclusion is that,
within limits, air transport stimulates further growth in the economy but it is also fostered by
the dimension of the hinterland itself, which adds to airport management a requirement of
strategic marketing, (Silva, 2005).
REFERENCES Aschauer, D. (1989) Is Public Expenditure Productive?, Journal of Monetary Economics, 23, 177-200.
Aschauer, D. (1990) Why Infrastructure is Important?, in A. Munnell (ed), Is there a Shortfall in Public Capital
Investment?, Conference Series No 34, Boston, Federal Reserve Bank of Boston.
Barros, C. (2008) Technical Efficiency of UK Airports, Journal of Air Transport Management, 14, 175-178.
Banister, D. and J. Berechman (2000) Transport Investment and Economic Development, London, UCL Press.
Button, K. and S. Taylor (2000) International Air Transportation and Economic Development, Journal of Air
Transport Management, 6, 209-222.
Cairncross, F. (1997) The Death of the Distance. How the Communications Revolution Will Change Our Lives,
Harvard, Harvard Business School Press.
Cole, S. (1998) Applied Transport Economics. Policy, Management and Decision Making (2nd
Edition), London,
Kogan Page Limited.
Diamond, D. and N. Spence (1989) Infrastructure and Industrial Costs in British Industry, London, HMSO.
EIB (1998) Contribution of Major Road and Rail Infrastructure Projects to Regional Development,
Luxembourg, EIB.
Forkenbrock, D. and N. Foster (1996) Highway and Business Location Decisions, Economic Development
Quaterly, 10, 3, 239-248.
Fox, W. and S. Porca (2001) Investing in Rural Infrastructure, International Regional Science Review, 24, 1,
103-133.
Halpern, N. and R. Pagliary (2007) Governance Structures and the Market Orientation of Airports in Europe’s
Peripheral Areas, Journal of Air Transport Management, 13, 376-382.
Holl, A. (2001) Transport Infrastructure in Lagging European Regions, Ph.D. Dissertation, Sheffield, University
of Sheffield.
Holl, A. (2004) The Role in Firm’s Spatial Organization: Evidence from the Spanish Food Processing Industry,
European Planning Studies, 12, 4, 537-550.
Holtz-Eakin, D. (1993) State Specific Estimates of State and Local Government Capital, Regional Science and
Urban Economics, 23, 185-210.
Holtz-Eakin, D. and A. Schwartz (1995) Infrastructure in a Structural Model of Economic Growth, Regional
Science and Urban Economics, 25, 131-151.
Holtz-Eakin, D. and M. Lovely (1996) Scale Economies, Returns to Variety, and the Productivity of Public
Infrastructure, Regional Science and Urban Economics, 26, 105-123.
Izquierdo, R. (1997) Gestión y Financiación de las Infraestruturas del Transporte Terrestre, Madrid, Asociación
Española de la Carretera.
Izquierdo, R. (2003) Economic Impacts of Infrastructure Investment: the Spanish Infrastructure Plan 2000-2001,
in ECMT (ed), 16th
International Symposium on Theory and Practice in Transport Economics,
Budapest, ECMT.
Lau, S. and C. Sin (1997) Public Infrastructure and Economic Growth: Time Series Properties and Evidence,
Economic Record, 73, 125-135.
Leitham, S., R. McQuaid and J. Nelson (2000) The Influence of Transport on Industrial Location Choice: a
Stated Preference Experiment, Transportation Research A, 34, 515-535.
Lopes, A. (1984) Desenvolvimento Regional. Problemática, Teoria, Modelos, Segunda Edição, Lisboa,
Fundação Calouste Gulbenkian.
Matos, F. (2000) Ordenamento do Território e Desenvolvimento Regional, Tese de Doutoramento, Covilhã,
Universidade da Beira Interior.
Miguel, R. and J. Silva (2006) Transporte Aéreo em Portugal, Trabalho Final de Licenciatura em Engenharia
Aeronáutica, Covilhã, Universidade da Beira Interior, Departamento de Ciências Aeroespaciais.
Paelinck, J. and J. Kuiper (1995) Regional Development in Portugal, in Universidade da Beira Interior e Centro
de Estudos e Desenvolvimento Regional (eds), Seminário Investigação, Inovação e Desenvolvimento
Transfronteiriço III, Covilhã, UBI.
Sitraer 7 (2008) 49-65 – Tr. 85
65
Preston, J. (2001) Integrating Transport with Socio-economic Activity. A Research Agenda for the Millennium,
Journal of Transport Geography, 9, 13-24.
Reigado, F. (1998) XII Aniversário da Universidade da Beira Interior. Oração de Sapiência, Covilhã, UBI.
Rietveld, P. (1994) Spatial Economic Impacts of Transport Infrastructure Supply, Transportation Research A,
28A, 4, 329-341.
Rietveld, P. and F. Bruinsma (1998) Is Transport Infrastructure Effective? Transport Infrastructure and
Accessibility: Impacts on the Space Economy, Berlin, Springer-Verlag.
Silva, J. (2005) As Acessibilidades como Factor do Desenvolvimento de Regiões Periféricas. O Caso da Beira
Interior, Tese de Doutoramento, Lisboa, Universidade Técnica de Lisboa, Instituto Superior Técnico.
Smith, D. and R. Florida (1994) Agglomeration and Industrial Location. An Econometric Analysis of Japanese-
affiliated Manufacturing Establishments in Automotive-related Industries, Journal of Urban
Economics, 36, 23-41.
Tapiador, F., A. Mateos and J. Martí-Henneberg (2008) The Geographical Efficiency of Spain’s Regional
Airports: a Quantitative Analysis, Journal of Air Transport Management, 14, 205-212.
Vickerman, R. (1996) Location, Accessibility and Regional Development: the Appraisal of Trans-European
Networks, Transport Policy, 2, 4, 225-234.
Vickerman, R. (2000) Transport and Economic Growth, in Regional Science Association International (ed), 6th
World Congress of the RSAI, Lugano, RSAI.
Viegas, J. (2002) A Expansão de Infraestruturas: Efeitos Directos e Indirectos, Avaliação, Definição de
Prioridades, Lição proferida no âmbito da disciplina de Políticas e Financiamento de Transportes, do
Mestrado em Transportes, Lisboa, Instituto Superior Técnico.
Weber, A. (1929) A Theory of the Location of Industries, Chicago, Chicago UP.
AUTHORS’ ADDRESSES:
Jorge Silva, [email protected]
Rosário Macário, [email protected]