Vehicle Radiators' Performance Calculation and Improvement ...
1 Copyright © 2009 by A. F. El-Sayed and G. B. Salem. Published by
American Institute of Aeronautics and Astronautics, Inc., with permission
ISABE- 2009-1142
Performance Analysis of Hypersonic Vehicle Ahmed F. El-Sayed Dep. of Mechanical Eng. Zagazig University
Galal B. Salem Dep. of Aerospace Eng. Cairo University
Ahmed Z. Alm-elDein Inst. of Aviation Eng. & Tech. M.Sc. Cairo University
Abstract Optimizing the propulsion system for a
hypersonic aircraft is examined. A combined cycle engine is selected; where the thrust is to be delivered by a turbine based combined cycle engine (TBCC).The engine cycle is analyzed and optimized to give the required thrust over the entire Mach envelope with minimum fuel consumption. The variation of cycle parameters versus the Mach number is the output of that study. It is to be used further in selecting the design point of each cycle.
Introduction A hypersonic research airplane model ;
figure-1,having a 70 deg swept double delta wing that was tested in wind tunnels of NASA Langley research center in the 70’s of the last century [1-3] is selected for this study as its full data is available. This model is to be resized based on the weight to match the HYCAT-1; figure-2 [4], and will work as an alternative for it. This resized model will be called hereafter as our aircraft; HS-1. HYCAT-1 was the most promising conceptual design for a Mach 6 civil transport that is capable of carrying 200 passengers for 9260 km (5000 nm). The design of HYCAT-1 was carried out by Lockheed-California Company under contract NAS1-15057 with NASA [4-5]. The mission and weight ratios of HS-1 is assumed the same as in HYCAT-1 as a first estimation. The available aero derivatives for the model are employed to evaluate the drag polar of the model over Mach number ranging from zero to 6. An illustration for this process is given in figure-3.
The engine type, installation and position are the same in both the model and the HYCAT-1A. The propulsion system is a combination between turbine based cycle selected here as a turbojet which operates in low speed flight regimes (take off – climb - descent – landing) and ram based cycle operates in supersonic acceleration and cruise. This combination generates Turbine based combined cycle engine (TBCC) which is capable of driving the aircraft
through the whole mission. Each engine has its separate intake. The propulsion system will be integrated with the fuselage to avoid excessive wave and friction drag. The turbojet is completely buried inside the fuselage and in high speeds it is turned off while its intake retracts and the ramjet uses the lower surface of fuselage as a part of its intake. The complete propulsion system needs to be optimized to give a precalculated thrust with minimum fuel consumption. Thus optimization process leads to the perfect values of engine parameters and their variation with Mach number. The design point and operation limits are selected based on the variation of engine parameters with Mach number.
Aircraft analysis The selected model; figure-1, was the
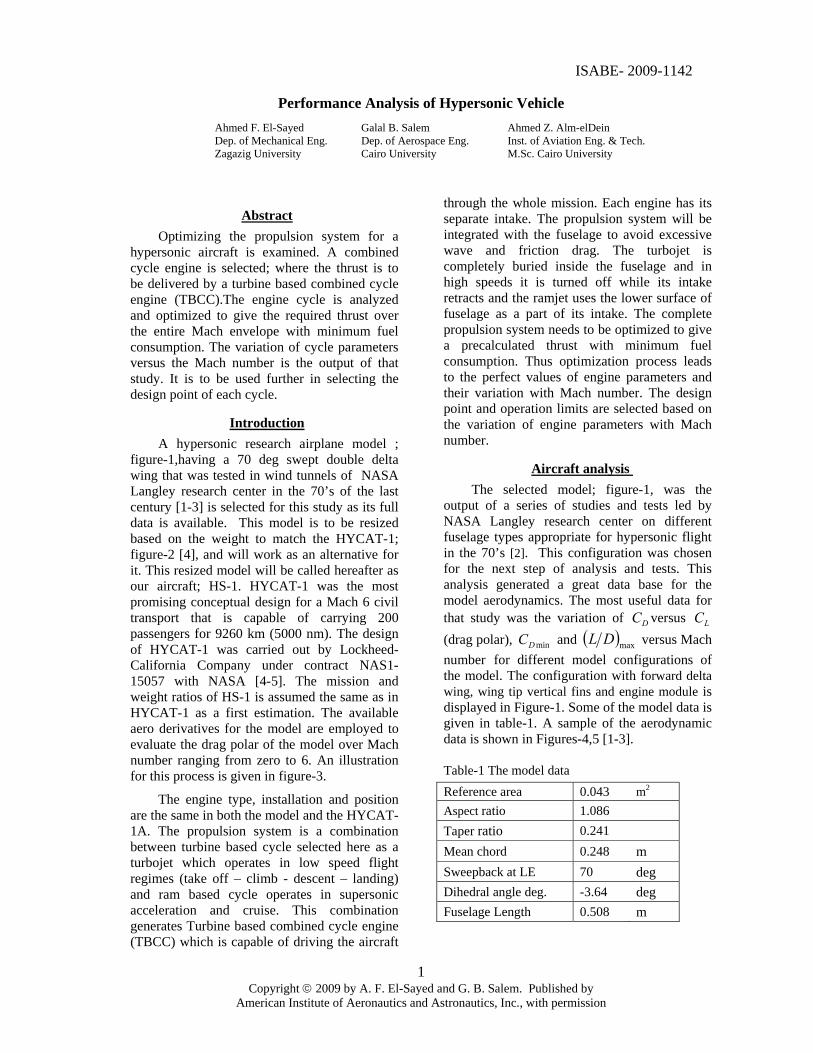
output of a series of studies and tests led by NASA Langley research center on different fuselage types appropriate for hypersonic flight in the 70’s [2]. This configuration was chosen for the next step of analysis and tests. This analysis generated a great data base for the model aerodynamics. The most useful data for that study was the variation of DC versus LC (drag polar), minDC and ( )maxDL versus Mach number for different model configurations of the model. The configuration with forward delta wing, wing tip vertical fins and engine module is displayed in Figure-1. Some of the model data is given in table-1. A sample of the aerodynamic data is shown in Figures-4,5 [1-3].
Table-1 The model dataReference area 0.043 m2 Aspect ratio 1.086 Taper ratio 0.241 Mean chord 0.248 m Sweepback at LE 70 deg Dihedral angle deg. -3.64 deg Fuselage Length 0.508 m

2 Copyright © 2009 by A. F. El-Sayed and G. B. Salem. Published by
American Institute of Aeronautics and Astronautics, Inc., with permission
Figure-1. Configuration of the hypersonic research model
Figure-2. The configuration of the HYCAT-1.
The model is to be resized to match the weight of HYCAT-1 Figure-2, which data is stated in table-2. The case study is to have the same mission as HYCAT-1. The maximum
LC at minimum speed (stall speed) is 1.07 Figure-5. The Reference area is calculated using the stall speed at sea level
( )2
2min
8252 mCVρ
WSL Max
==∞∞
The weight variation during the climb due to fuel consumption is assumed linear with speed and the fuel consumed is 0.14 of the growth weight as a first estimation [4-5]. At start of Cruise the aircraft weight is to be 0.86 from the gross weight, the altitude is 29.3 km, LC is 0.1237
Then the reference area is
22 6502 mCMP
WSL
==∞∞γ
So the model will be scaled 140 times to have a Reference area 843 m2. The case study data is stated in table-3. It will follow the mission of HYCAT-1 table-4.
Figure-3. Proposal for Work
Table-2 HYCAT-1 data [5] Reference area 822.97 m2 gross weight 307382 kg Fuel weight 108453 kg Aspect ratio 1.357 Taper ratio 0.241 Mean chord 31.437 m Sweepback angles LE 65 deg Dihedral angle deg. -3.64 deg Fuselage Length 101.803 m
Figure-4. Variation of minDC , ( )maxDL versus Mach number for model airplane.
3 Copyright © 2009 by A. F. El-Sayed and G. B. Salem. Published by
American Institute of Aeronautics and Astronautics, Inc., with permission
Figure-5. A sample of the Drag polar of the model airplane at different Mach numbers.
Table-3 The case study Reference area 843 m2 gross weight 307382 kg Mean chord 34.72 m Fuselage Length 71.12 m Aspect ratio 1.086 Taper ratio 0.241 Sweepback at LE 70 deg
Table-4 : The mission of HYCAT-1 and
proposed HS-1 aircraft Passengers 200 Range 9260 Km Cruise altitude 29.302 Km Cruise Mach number 6 Take off field length 3016 m Landing field length 3203 m Minimum Speed 73.62 m/s
Take off
The take off field length as stated in the mission is 3016 m. The take off field length will be analyzed as in [6] to estimate the thrust required for takeoff.
From [1]
at o5.8=α ( ) 4.3max =DL
34.=LC ; 11.0=DC
then
055.0=DoC ; 0.459=k
at o32=α ( ) 07.1=MaxLC ; ( ) 6.0=
LMaxCDC
the take off calculations steps and output table-5. The thrust required is
N kTR 243.2=
Table-5 : take off calculations
growth weight 307382 kg stall speed 73.62 m/s Take off field length 3016 m Height in the end of Take off 15 m
Airborne distance 339.49 m
ground roll distance 2676.5 m The thrust required 243.2 kN
Climb
Climb is an accelerated flight path with assumed maximum climb angle of 15 deg and acceleration of 0.2 g since the aircraft is commercial. Also assumed that the aircraft is fling at maximum ( )DL , and Appling Newton’s 2nd law on the aircraft in accelerated climb maneuver we find.
LSCWq θcos
=∞
⎟⎟⎠
⎞⎜⎜⎝
⎛++=
++=
ga
DLW
WgaWDTR
θθ
θ
sincos
sin
Using gao 2.0 ,15 ==θ , ( )DL from Figure-4 and assuming a linear variation of W with Mach number, then the thrust required for climb is obtained and plotted in Figure-6.
Cruise
At the cruse the aircraft weight is reducing due to fuel consumption so the thrust required for cruise is smaller than the thrust required from climb at Mach 6.

4 Copyright © 2009 by A. F. El-Sayed and G. B. Salem. Published by
American Institute of Aeronautics and Astronautics, Inc., with permission
Propulsion System [7-8] The Propulsion system must be able of
driving the aircraft over the entire Mach envelop so Combined Cycle Engine is selected to drive the aircraft. The engine selected is over-under turbojet ramjet turbine based combined cycle engine illustrated in Figure-7 and each engine has its separate variable area intake and nozzle. The turbojet completely buried inside the fuselage and having a retractable intake that retract at high speeds and leave the fuselage lower surface streamlined Figure-7 to reduce the drag in high speeds.
Figure-6. The thrust required for climb versus Mach number.
The turbojet is a single spool turbojet with an afterburner. The parameters affecting the engine performance are components efficiencies and cycle variables. Accepted values are assumed for the efficiencies table-6. T-S Diagram of turbojet is plotted in Figure-8. The variables affecting the turbojet performance are (Compressor pressure ratio cπ - fuel mass flow
rate in combustion chamber ofCm and
afterburner ofABm
- air mass flow rate o
aTm ). The same done in the ramjet engine Accepted values are assumed for the efficiencies are also given in table-6. The ramjet performance are (fuel mass flow rate in ramjet engine o
fRm - air
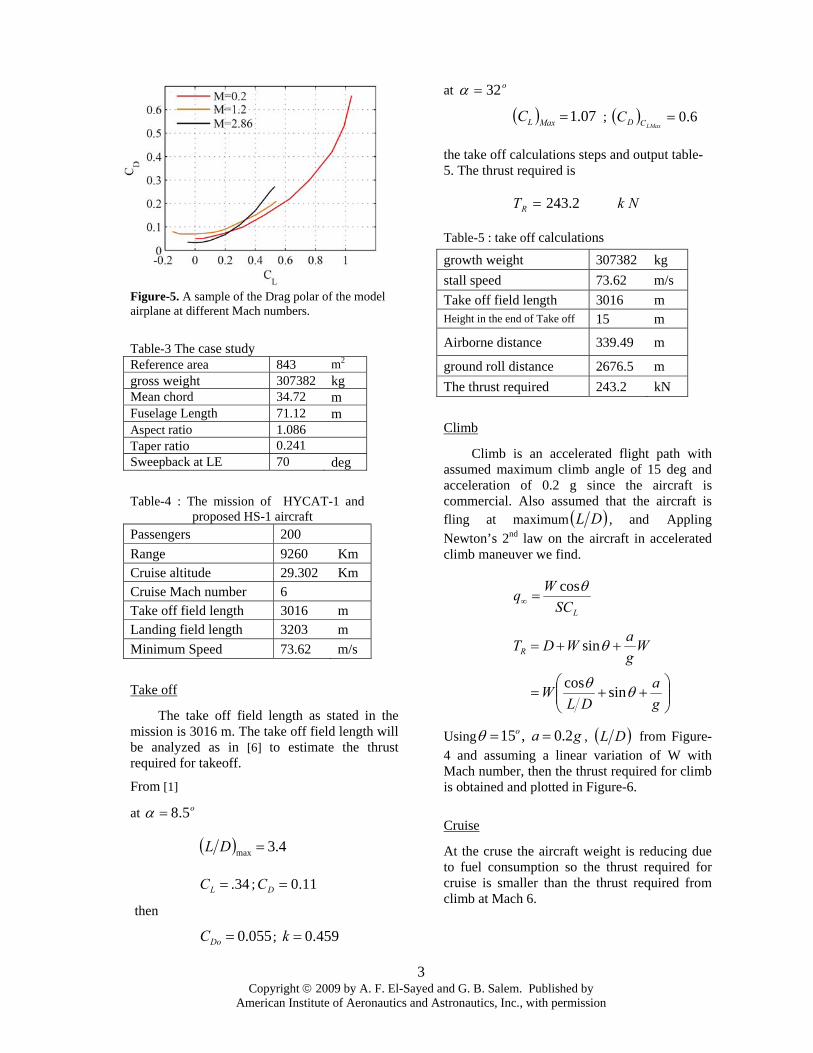
mass flow rate oaRm ) T-S Diagram of ramjet is
plotted in Figure-9.
Figure-7. Over-under turbojet ramjet turbine based combined cycle engine.
Figure-8. T-S Diagram of turbojet with afterburner.
Table-6 Components efficiencies of the engine
turb
ojet
Intake dη 0.9
Compressor Cη 0.9 Combustion chamber
CC.η 0.98 CCP .Δ 0.025
Turbine Tη 0.91
mη 0.95
Afterburner ABη 0.95
ABPΔ 0.02
Nozzle Nη 0.9
ram
jet
Intake dRη 0.93 Combustion chamber
RCC ..η 0.98
RCCP ..Δ 0.02 Nozzle RN η 0.93
ther
mod
ynam
ic
Cold air cγ 1.4
PcC 1005 J/kg
Hot gas hγ 1.333
PhC 1148 J/kg
5 Copyright © 2009 by A. F. El-Sayed and G. B. Salem. Published by
American Institute of Aeronautics and Astronautics, Inc., with permission
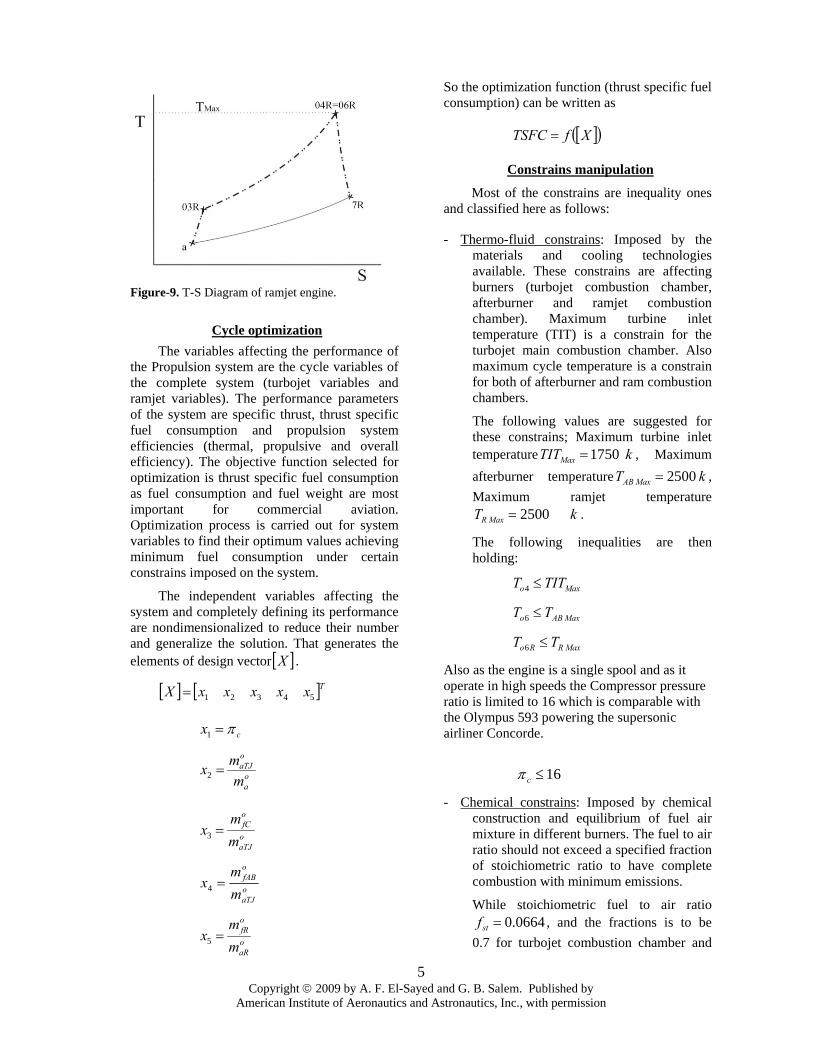
Figure-9. T-S Diagram of ramjet engine.
Cycle optimization The variables affecting the performance of
the Propulsion system are the cycle variables of the complete system (turbojet variables and ramjet variables). The performance parameters of the system are specific thrust, thrust specific fuel consumption and propulsion system efficiencies (thermal, propulsive and overall efficiency). The objective function selected for optimization is thrust specific fuel consumption as fuel consumption and fuel weight are most important for commercial aviation. Optimization process is carried out for system variables to find their optimum values achieving minimum fuel consumption under certain constrains imposed on the system.
The independent variables affecting the system and completely defining its performance are nondimensionalized to reduce their number and generalize the solution. That generates the elements of design vector [ ]X .
[ ] [ ]TxxxxxX 54321=
cx π=1
oa
oaTJ
mmx =2
oaTJ
ofC
mm
x =3
oaTJ
ofAB
mm
x =4
oaR
ofR
mm
x =5
So the optimization function (thrust specific fuel consumption) can be written as
[ ]( )XfTSFC =
Constrains manipulation
Most of the constrains are inequality ones and classified here as follows:
- Thermo-fluid constrains: Imposed by the materials and cooling technologies available. These constrains are affecting burners (turbojet combustion chamber, afterburner and ramjet combustion chamber). Maximum turbine inlet temperature (TIT) is a constrain for the turbojet main combustion chamber. Also maximum cycle temperature is a constrain for both of afterburner and ram combustion chambers.
The following values are suggested for these constrains; Maximum turbine inlet temperature kTITMax 1750= , Maximum afterburner temperature kT MaxAB 2500 = , Maximum ramjet temperature
kT MaxR 2500 = .
The following inequalities are then holding:
Maxo TITT ≤4 MaxABo TT 6 ≤ MaxRRo TT 6 ≤
Also as the engine is a single spool and as it operate in high speeds the Compressor pressure ratio is limited to 16 which is comparable with the Olympus 593 powering the supersonic airliner Concorde.
16≤cπ - Chemical constrains: Imposed by chemical
construction and equilibrium of fuel air mixture in different burners. The fuel to air ratio should not exceed a specified fraction of stoichiometric ratio to have complete combustion with minimum emissions.
While stoichiometric fuel to air ratio 0664.0=stf , and the fractions is to be
0.7 for turbojet combustion chamber and
6 Copyright © 2009 by A. F. El-Sayed and G. B. Salem. Published by
American Institute of Aeronautics and Astronautics, Inc., with permission
0.9 for afterburner and ram combustion chamber as the main burner is more complicated and need cooling air.
stoaTJ
ofC
C fmm
f 7.0≤=
st
st
oaTJco
aTJ
ofAB f
fmfm
m9.0≤
−
stoaRJ
ofR
R fmm
f 9.0≤=
- Performance constrains: Imposed by vehicle mission as the propulsion system should deliver thrust equivalent to the precalculated required thrust over the Mach envelop.
oaA
Roa mT
Tm =
While oaA mT is the specific thrust and is
calculated independent of oam
- Size constrains: The size of the propulsion system has to be small as possible to reduce weight, volume and drag of the system. The turbojet is to be completely contained inside the fuselage that will impose a constrain concerning maximum air flow through the turbojet. Maximum air flow through the turbojet engines is assumed 2000 kgair/s that mass air mass flow is passing through eight engines each have 250 kgair/s.
s 2000 kgmoaTJ ≤
The final form of the constrains is to be
0141 ≤−=
Max
o
TITTg
01
62 ≤−=
MaxAB
o
TTg
01
63 ≤−=
MaxR
Ro
TTg
017.04 ≤−=
st
C
ffg
( ) 019.05 ≤−
−=
cst
AB
fffg
019.06 ≤−=
st
R
ffg
0120007 ≤−=
oaTJmg
Constrained function is generated using
exterior penalty function technique[9]. This technique depend on defining a new objective function that is equal to the unconstrained objective function (thrust specific fuel consumption) when all constrains is satisfied, a positive added is added to unconstrained objective function when a constrain is braked and that to force the point move in the region inside the constrains.
( ) [ ]( ) [ ]( )∑+= 2, XgrXfrXF i Where
[ ]( ) [ ]( ) [ ]( )[ ]( )⎩
⎨⎧
≤>
=000
XgwhenXgwhenXg
Xgi
iii
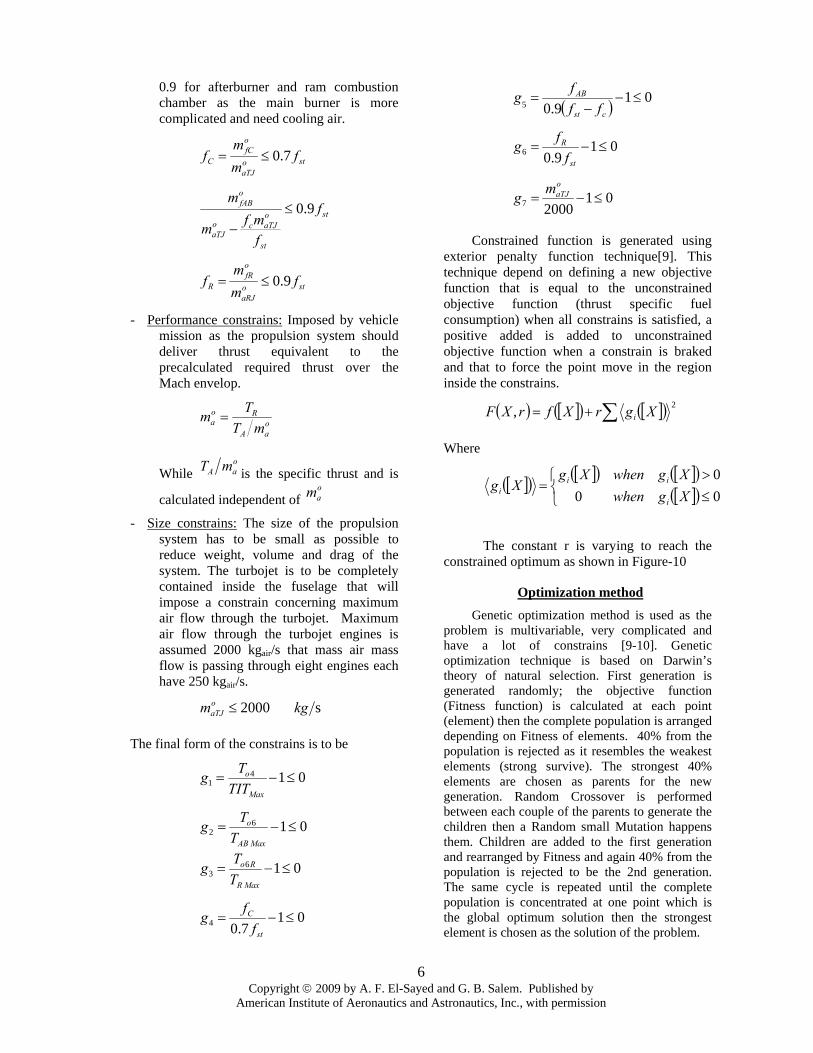
The constant r is varying to reach the
constrained optimum as shown in Figure-10
Optimization method
Genetic optimization method is used as the problem is multivariable, very complicated and have a lot of constrains [9-10]. Genetic optimization technique is based on Darwin’s theory of natural selection. First generation is generated randomly; the objective function (Fitness function) is calculated at each point (element) then the complete population is arranged depending on Fitness of elements. 40% from the population is rejected as it resembles the weakest elements (strong survive). The strongest 40% elements are chosen as parents for the new generation. Random Crossover is performed between each couple of the parents to generate the children then a Random small Mutation happens them. Children are added to the first generation and rearranged by Fitness and again 40% from the population is rejected to be the 2nd generation. The same cycle is repeated until the complete population is concentrated at one point which is the global optimum solution then the strongest element is chosen as the solution of the problem.
7 Copyright © 2009 by A. F. El-Sayed and G. B. Salem. Published by
American Institute of Aeronautics and Astronautics, Inc., with permission
Figure-10. The effect of the constant r on the constrained function.
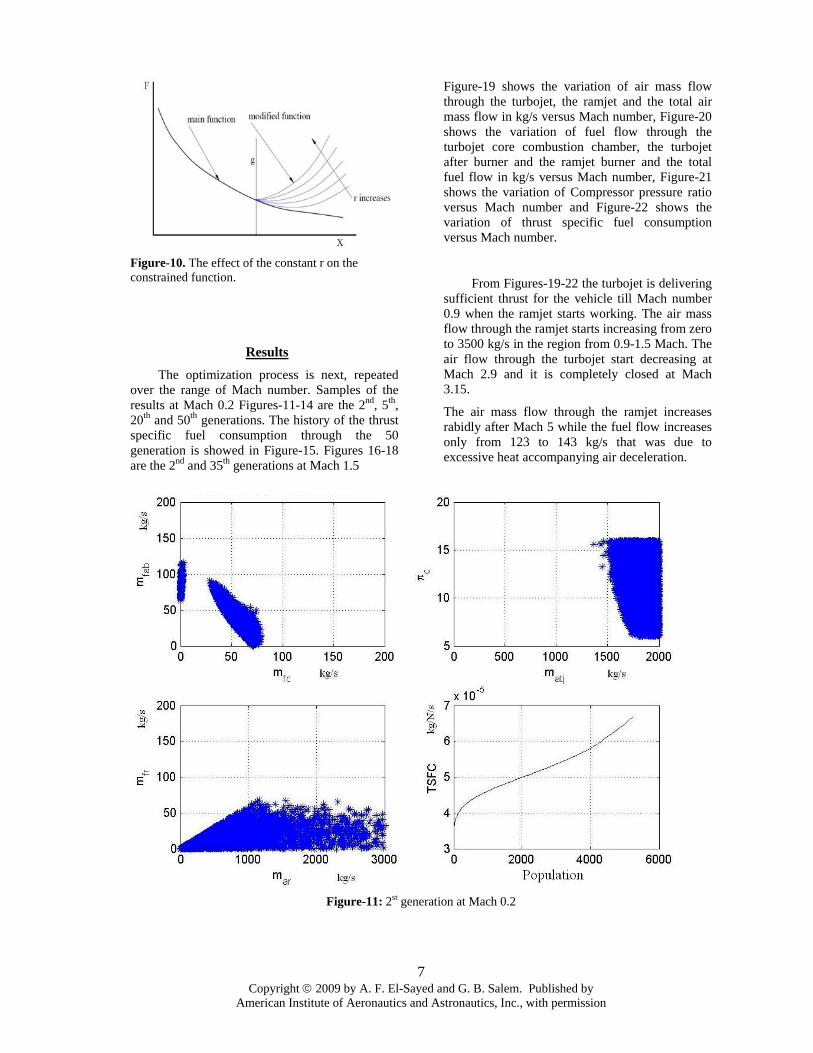
Results The optimization process is next, repeated
over the range of Mach number. Samples of the results at Mach 0.2 Figures-11-14 are the 2nd, 5th, 20th and 50th generations. The history of the thrust specific fuel consumption through the 50 generation is showed in Figure-15. Figures 16-18 are the 2nd and 35th generations at Mach 1.5
Figure-19 shows the variation of air mass flow through the turbojet, the ramjet and the total air mass flow in kg/s versus Mach number, Figure-20 shows the variation of fuel flow through the turbojet core combustion chamber, the turbojet after burner and the ramjet burner and the total fuel flow in kg/s versus Mach number, Figure-21 shows the variation of Compressor pressure ratio versus Mach number and Figure-22 shows the variation of thrust specific fuel consumption versus Mach number.
From Figures-19-22 the turbojet is delivering
sufficient thrust for the vehicle till Mach number 0.9 when the ramjet starts working. The air mass flow through the ramjet starts increasing from zero to 3500 kg/s in the region from 0.9-1.5 Mach. The air flow through the turbojet start decreasing at Mach 2.9 and it is completely closed at Mach 3.15.
The air mass flow through the ramjet increases rabidly after Mach 5 while the fuel flow increases only from 123 to 143 kg/s that was due to excessive heat accompanying air deceleration.
Figure-11: 2st generation at Mach 0.2
8 Copyright © 2009 by A. F. El-Sayed and G. B. Salem. Published by
American Institute of Aeronautics and Astronautics, Inc., with permission
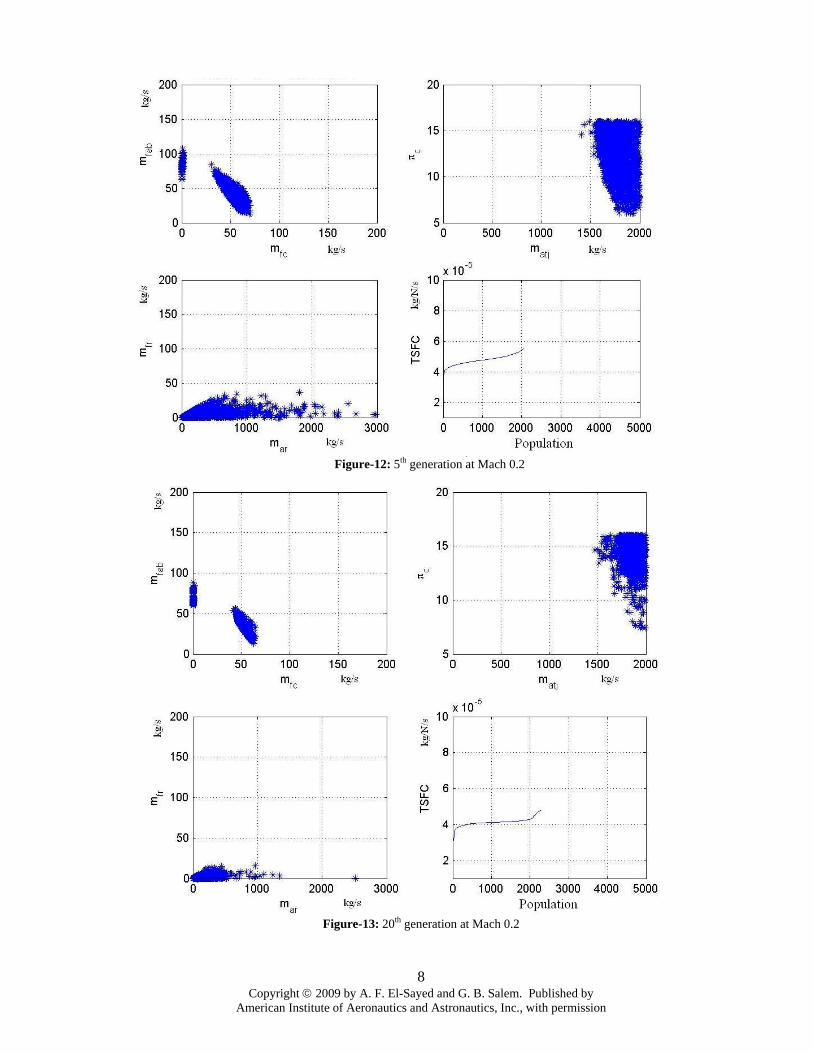
Figure-12: 5th generation at Mach 0.2
Figure-13: 20th generation at Mach 0.2
9 Copyright © 2009 by A. F. El-Sayed and G. B. Salem. Published by
American Institute of Aeronautics and Astronautics, Inc., with permission
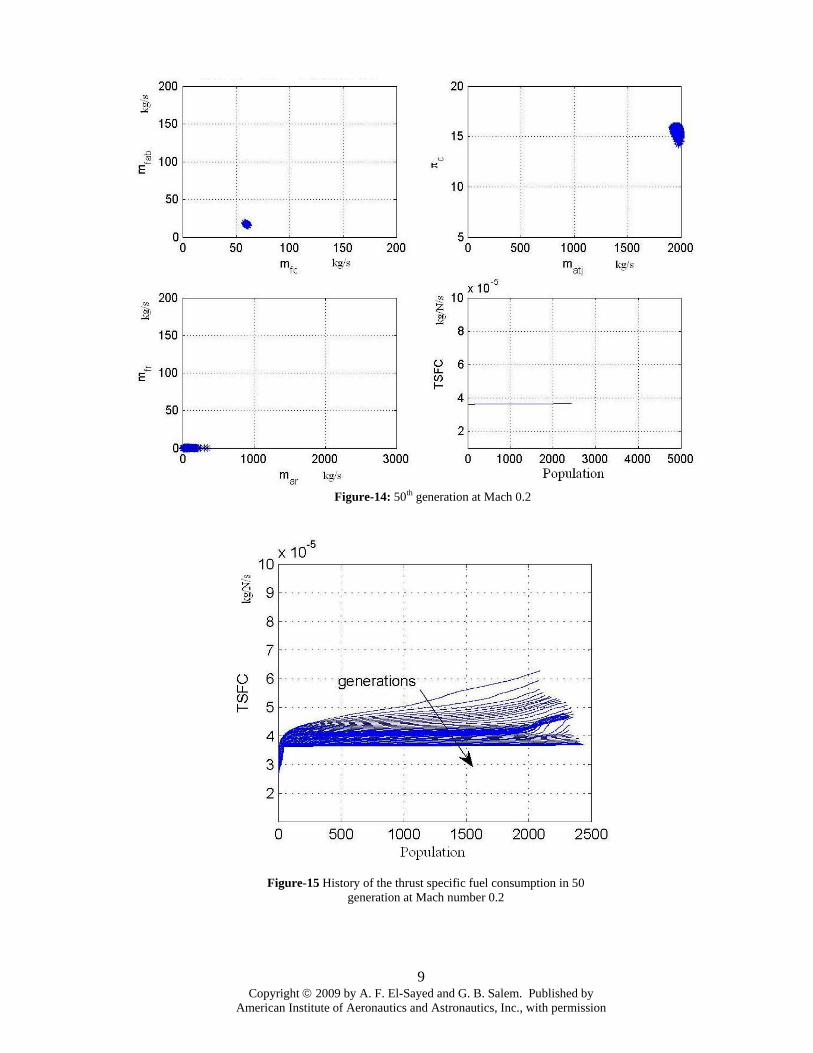
Figure-14: 50th generation at Mach 0.2
Figure-15 History of the thrust specific fuel consumption in 50
generation at Mach number 0.2

10 Copyright © 2009 by A. F. El-Sayed and G. B. Salem. Published by
American Institute of Aeronautics and Astronautics, Inc., with permission
Figure-16: 1st generation at Mach 1.5
Figure-17: 35th generation at Mach 1.5

11 Copyright © 2009 by A. F. El-Sayed and G. B. Salem. Published by
American Institute of Aeronautics and Astronautics, Inc., with permission
Figure-18. History of the thrust specific fuel consumption in 35 generation at Mach number 1.5
Figure-19. The air mass flow in kg/s versus Mach number.
Figure-20. The fuel mass flow in kg/s versus Mach number
Figure-21. Compressor pressure ratio versus Mach number
Figure-22. Thrust specific fuel consumption versus Mach number
Conclusions
1- A hypersonic aircraft HS-1 is proposed combining the features of both NASA model and HYCAT-1 aircraft.
2- A genetic optimization method is employed for predicting appropriate flight regimes for each of the turbojet, ramjet and combined engine
3- A 50 generations of optimization method resulted in accurate values for the design values of the propulsion system
4- Turbine based combined cycle engine that burn hydrocarbon is capable of driving up to Mach 6 hypersonic aircraft.
5- Afterburner is critical at subsonic speeds and in breaking sonic barrier.

12 Copyright © 2009 by A. F. El-Sayed and G. B. Salem. Published by
American Institute of Aeronautics and Astronautics, Inc., with permission
6- The ramjet is supporting the turbojet from Mach 0.9-3 then it is working alone.
7- Maximum air mass flow through the ramjet is 6000 kg/s.
8- Thrust specific fuel consumption is varying from )./( 107106.3 55 sNkg−− ×−× .
9- As a result for this work, further investigation of the following points are planned:
- Optimization of the intake system.
- Usage of hydrogen as a propellant.
- Heat transfer and cooling in ramjet components.
- Dual combustion ramjet (subsonic-supersonic).
References [1] Penland, J. A.; Creel, T. R., Jr. and Dillon, J. L. 1978: Aerodynamic characteristics of a hypersonic research airplane concept having a 70 deg swept double-delta wing at Mach number 0.2, NASA-TP-1252
[2] Penland, J. A.;Hallissy, J. B. and Dillon, J. L. 1979: Aerodynamic characteristics of a hypersonic research airplane concept having a 70 deg swept double-delta wing at Mach numbers from 0.80 to 1.20, with summary of data from 0.20 to 6.0, NASA-TP-1552
[3] Penland, J. A.; Fournier, R. H. and Marcum, D. C., Jr. 1979: Aerodynamic characteristics of a hypersonic research airplane concept having a 70 degree swept double delta wing at Mach numbers from 1.50 to 2.86, NASA-TN-D-8065
[4] Morris, R.E. and Brewer G.D. 1979: Hypersonic Cruise Aircraft Propulsion Integration Study Volume I, NASA-CR-158926-1.
[5] Morris, R.E. and Brewer G.D. 1979: Hypersonic Cruise Aircraft Propulsion Integration Study Volume II, NASA-CR-158926-2.
[6] Anderson, J. D., JR 1999: Aircraft Performance and Design, McGraw-Hill
[7] El-Sayed, A. F. 2008: Aircraft Propulsion and Gas Turbine Engines CRC
[8] Mattingly, J. D. 2006: Elements of Propulsion: Gas Turbines and Rockets, McGraw-Hill
[9] Arora, J. S. 2004: Introduction to Optimum Design, Elsevier
[10]Haupt, R. L. and Haupt, S. E. 2004: Practical genetic algorithms, WILEY
[11] Heiser, W. H. and Partt, D. T. 1994: Hypersonic Airbreathing Propulsion, AIAA Education Series
[12]Georgiadis, N. J.,Walker, J. F. and Trefny, C. J. 1999: Parametric Studies of the Ejector Process within a Turbine-Based Combined-Cycle Propulsion System, AIAA-1998-0936
[13] Chang, I. and Hunter, L. G. 1996: CFD Study of Turbo-Ramjet Interactions in Hypersonic Airbreathing Propulsion System, NASA-CR-202418
[14] Cikanek, H. A., Bartolotta, P. A., Klem, M. D. and Rausch, V. L. 2007: NASA Hypersonic Propulsion: Overview of Progress from 1995 to 2005, ISABE 2007
[15] Sobieczky, H., Stroeve,J. C., 1991: Generic Supersonic and Hypersonic Configurations, AIAA-1991-3301
[16] Andrews, E. H., Mackley, E. A., 1993: REVIEW OF NASA's HYPERSONIC RESEARCH ENGINE PROJECT, AIAA-1993-2323
[17] Stewart, M.E.M., Messitt, D.G., Suresh, A., Liou, M. S., Owen, A. K., 2002: MULTIDI-SCIPLINARY ANALYSIS OF A HYPERSONIC ENGINE, AIAA-2002-5127
[18] Marc Bouchez, M., Falempin, M., Levine, V., Avrashkov, V., 2002:French-Russian Partnership on Hypersonic Wide Range Ramjets : status in 2002, AIAA-2002-5254
[19] Biltgen, P., Lafleur, J., Loughman, J., Martin, R., Flaherty, K., Cho, M.,Becker, K., Ong, C., Olds, J.R., 2004:StarRunner: A Single-Stage-to-Orbit, Airbreathing, Hypersonic Propulsion System, AIAA-2004-3729
[20] Kazmar, R. R., 2005: Airbreathing Hypersonic Propulsion at Pratt & Whitney – Overview, AIAA-2005-3256
[21] Gregory, T. J., Wrss, J. A., Petersen, R. H., 1965: Performance tradeoffs and research problems for hypersonic transports, Journal of Aircraft, Vol.2, No.4, page,266-271
[22] Chang, I., Hunter, L. G. 1996:CFD study of turbo-ramjet interaction in hypersonic airbreathing propulsion system, NASA-CP-202418
Copyright © 2022 FDOKUMEN