Roster-36th INFANTRY DIVISION - The Texas Military Force ...

Applied Energy 88 (2011) 2641–2652
Contents lists available at ScienceDirect
Applied Energy
journal homepage: www.elsevier .com/locate /apenergy
Infantry mobility hybrid electric vehicle performance analysis and design
Francisco José Jimenez-Espadafor ⇑, Juan José Ruiz Marín, José A. Becerra Villanueva, Miguel Torres García,Elisa Carvajal Trujillo, Francisco José Florencio OjedaThermal Power Group, Department of Energy Engineering, University of Seville, Escuela Técnica Superior de Ingenieros de Sevilla, Camino de los Descubrimientos,s/n. 41092 Sevilla, Spain
a r t i c l e i n f o
Article history:Received 12 May 2010Received in revised form 28 January 2011Accepted 9 February 2011
Keywords:Hybrid electric vehicles (HEVs)SimulationEnergy managementOptimal operationVehicle design
0306-2619/$ - see front matter � 2011 Elsevier Ltd. Adoi:10.1016/j.apenergy.2011.02.010
⇑ Corresponding author. Tel.: +34 954487245; fax:E-mail address: [email protected] (F.J. Jimenez-Espa
a b s t r a c t
Optimal energy flux analysis and design of a power plant for infantry mobility hybrid diesel-electric vehi-cle is dealt with in this paper. Control strategy management and propulsion system sizing is done on thebasis of minimizing total fuel consumption. A quasi-static system model has allowed analyzing the mostrestrictive operations; moreover the simulation has been used in expected real driving cycles in order tocheck the performance in typical mission.
From the point of view of energy consumption and CO2 emissions, HEV and automatic gear transmis-sion configuration have been compared. The results show a noticeable difference especially in the case ofthe driving cycle of low-power load conditions, with a very reduced proportion of batteries weight incomparison to vehicle. Fuel and emissions saving with HEV systems compared to automatic geared trans-mission along vehicle service life justify the higher inversion needed for the HEV system.
� 2011 Elsevier Ltd. All rights reserved.
1. Introduction
This paper develops a methodology for optimal energy fluxanalysis and design of a power plant for propulsion of an infantrymobility hybrid electric vehicle, where batteries size is alsodetermined.
Main characteristics of this new diesel-electric infantry mobilityvehicle are similar to other nonhybrid vehicles as the BMR-600 [1],the Boxer [2], the VBCI [3], the Piranha [4], the SEP [5] or the Amer-ican Striker [6].
Tracked vehicles are the best to move by irregular surfaces andvariable terrains. However, wheeled vehicles have some advanta-ges as better mobility and comfort, are cheaper, reduce fuel con-sumption and therefore exhaust gas emissions, are easier torepair and maintain and the equipments and shields can be thesame type that the ones installed in tracked vehicles [7].
The shield generally is made of steel or a grosser aluminiumplate, nowadays the new designs use composites as Kevlar. Mod-ern vehicles try to use commercial components to reduce costs,moreover the reliability is higher. Modular design is also interest-ing to improve the versatility of the vehicles.
Most of infantry mobility vehicles have six or eight wheels withthe possibility of traction in all of them. Usually there is one shaftwith permanent traction, being feasible distributing vehicle trac-tion on the rest shafts. Vehicle steering configuration can also be
ll rights reserved.
+34 954487243.dafor).
different, from one shaft all ones, in order to increasemaneuverability.
Installed engine power for these vehicles is between 260 kWand 410 kW, and generally use fully automatic transmission withsix or seven gear plus hydrodynamic torque converter.
With regard to the geometric characteristics, length is around7 m and 8 m, width is about 2.8 m, height is from 2.25 m to2.6 m and a weight from 14 ton of the BMR [1] to 26 ton of the VBCI[3]. Because weight affects power requirements, fuel consumptionand autonomy, typical values are between 750 km and 1000 km.
Hybrid concept using diesel engines coupled to generators thatfed hub wheel motors, are introduced in some of current vehiclesas the SEP design [5]. This traction configuration allows more de-sign flexibility because there are not mechanical coupling betweeninternal combustion engine and propulsion wheels. Also the elec-tric generation on board is very useful to meet demands of militaryelements, thus the type of missions that the vehicle can carry outincreases [8].
Furthermore, in recent years the energy crisis has grown theconcern on saving fuel and environmental power to prevent globalwarming. This has forced to search new vehicle configurationsmore efficient and cleaner, with lower emissions and better fueleconomy, compared with the conventional ones. The called zero-emission vehicle, pure electric vehicle, it is clearly limited by thefuel cell and batteries technology. The HEV synergizes the electricpower to the diesel engine improving the overall efficiency, beingconsidered a viable solution [9,10]. Thus hybrid technology is themost promising and practical alternative power train at present.Nowadays is even comparable with the zero-emissions vehicles if

Nomenclature
A frontal area (m2)Ce specific consumption (g kW h�1)CD aerodynamic resistance coefficient (drag)CO2 carbon dioxideF tractive effort (N)fr rolling resistant coefficientg acceleration due to gravity (m s�2)HEV hybrid electric vehicleH2O waterHC unburned hydrocarbonICE internal combustion enginem vehicle mass (kg)mfuel fuel mass (kg)mmolCO2
carbon dioxide mass for a molmmolfuel fuel mass for a molNOx nitrous oxideN2 diatomic nitrogenParticulates soot from diesel exhaustQB batteries electric charge (Ah)QB0 initial batteries electric charge (Ah)Qcharge batteries charge (Ah)Qdischarge batteries discharge (Ah)QMax
B maximum battery charge (Ah)r vehicle space control variable (m)t time (s)Dt time step (s)
V speed (m s�1)VB0 nominal batteries voltage (V)_Walt compact alternator power (kW)_Waux auxiliary power (kW)_Weng engine power (kW)_WB battery power discharge (kW)_WP
B batteries power discharge for propulsion (kW)_WAux
B batteries power discharge for auxiliary systems (kW)_WAux
EA power production of the compact alternator for auxil-iary systems (kW)
_WBEA power production of the compact alternator for batter-
ies (kW)_WP
EA power production of the compact alternator for propul-sion (kW)
_WRG regenerative brake power production (kW)_WB
RG regenerative brake power production for batteries (kW)_WP propulsion power (kW)
x moles of carbon of the hydrocarbonxC percentage of carbon in the fuely moles of hydrogen of the hydrocarbongB batteries charge efficiencygComb combustion efficiencygmec/elec mechanical–electrical efficiencyh climbing angleq air density (kg m�3)
Table 1Vehicle specifications.
Concept Data
Weight 22,000 kgFrontal width 2.8 mFrontal height 2.4 mNumber of power wheels 8
2642 F.J. Jimenez-Espadafor et al. / Applied Energy 88 (2011) 2641–2652
it is considered the pollution produced by electricity power plantfueled by carbon, natural gas or heavy fuel oil [11]. Only in the caseof electricity produced from hydroelectric, wind or solar energycould be considered full electrical vehicles as zero emissions.
Kukhyun Ahn et al. compare in [12] a HEV configuration oper-ated in either a power-boosting or an energy-saving mode, the firstone is used for responding only the driver’s full-load demand thesecond one use batteries to save energy. The second method in-crease number of degrees of freedom and the complex of the opti-mization however this is the optimal operation.
HEV combined with other power source as batteries offers flexi-bility to improve fuel economy and to reduce pollutant emissions.Yang et al. [13] study a controller to try a fuel-NOx optimization. Alsosupercapacitors are used in these applications in order to improvethe pulse power requirements; nevertheless their energy densitiesare still too low [14]. Other research lines try to develop new con-cepts named ‘‘ultra-batteries’’, a new element that combines theadvantage of super capacitors and batteries [15]. Energy manage-ment is also a research line that is focused on the design of the elec-tronic control unit. The work of Yuan-Yong Hsu et al. analyses theintegration and operation of different systems of a vehicle [16].Although optimal energy flows is one of the output of this work,the design of the electronic control unit is out of the scope of thispaper.
A lot of research activity has been devoted to the analysis of hy-brid configuration; a comparison between parallel and series hybridsystem from the point of view of energy consumption is shown byTomaz�Katrašnik [17] and a study about hybridization with com-pressed air is presented by David Huang et al. [18], also has been con-sidered the use of gas turbines as do Katras�nik et al. study [19].
There are two principal tasks covered by this paper; firstly toobtain the energy system size and the optimization of energy flowsin a HEV configuration vehicle so operation strategies and controlwould be defined, secondly to check the convenience of the useof HEV systems compared with standard automatic geartransmissions.
2. Description of the system configuration
Principal specifications of this infantry mobility vehicle are inTable 1, where the eight wheels drive and steer the vehicle. Powerplant is a diesel-electric configuration and it is integrated by twopacks diesel engine-alternator which energy can flow to propul-sion, auxiliaries or to charge high-power-density batteries. Batter-ies can also give energy for driving vehicle and auxiliaries.
Energy flow distribution is shown in Fig. 1, where arrows meanenergy flux direction.
According to the topologies described by Katras�nik in [20], theHEV configuration of this vehicle is of the serial type without anymechanical connection between power plant and tractive wheels.In spite of the fact that parallel and complex HEV topologies wouldgive lower fuel consumption than the serial one for the real trackanalyzed in Section 5.3, this serial topology with eight tractionwheels has been forced for other requirements:
Increase in available volume inside the vehicle and therefore onthe number of passengers of things to be transported.Increase in vehicle availability; the vehicle can work havingoperative only two wheels (obviously with a reduction inperformance).Reduction of the tractive mechanical noise.
The modeling of the system requires the knowledge of the ele-ment characteristics, especially important are the ICE and compact

Fig. 1. Configuration of the serial hybrid power train.
F.J. Jimenez-Espadafor et al. / Applied Energy 88 (2011) 2641–2652 2643
alternator. ICE has been chosen by its low specific fuel consump-tion among its category and good reliability, which main character-istics are presented in Table 2 and efficiency map is displayed inFig. 2. ICE power requirement is explained in epigraph 2.2. Com-pact alternator characteristics are given in Table 3 and the effi-ciency map is shown in Fig. 3.
Finally the operational map of the whole power unit composedby the ICE coupled to the compact alternator is represented inFig. 4.
Batteries characteristics are compatible to current commercialhybrid vehicles [21] batteries properties. Batteries maximum dis-charge is selected to 100 kW, energy density is 40 Wh kg�1, thevoltage is 600 V and efficiency is 98% being defined as Q discharge
Qcharge[22].
2.1. System power flow architecture
In serial hybrid configuration the links between system ele-ments is electrical, except the mechanical link between ICE andthe compact alternator. Therefore the whole system can be mod-eled as an energy system using power flows. The energy flow archi-tecture is shown in Fig. 5.
The mechanical power produced by the ICE is transformed toelectrical energy by the alternator and is distributed to the hubwheel motor, the auxiliary power demand or the batteries as afunction of the power system requirements. Also the batteriescan charge or discharge to minimizing the fuel consumption in awhole driving cycle but it is not allowed simultaneous batteriescharge and discharge.
Table 2Internal combustion engine characteristics.
Concept Data
Internal combustion engineContinuous power 228 kWTorque 1306 Nm (1500 rpm)Speed 1200–2200 rpmIdling speed 700 rpmSpecific fuel consumption 205 g(kW h)�1 (1500 rpm)Number of cylinders 5Configuration of cylinders In lineBore 127 mmStroke 140 mmTotal displacement 8,87 dm3
Weight 887 kg
2.2. Performance requirements
Vehicle extreme operational conditions are determined by theexpected performance of infantry mobility vehicles and it shouldbe fulfilled in the case of batteries failure. It should reach a velocityof 100 km h�1 in road without inclination, 80 km h�1 in road withmaximum inclination of 3% and a velocity of 5 km h�1 in a terrainwith a maximum inclination of a 60%.
In each case power requirement can be computed using Eq. (1),adding the power required by the auxiliary system demands. It hasbeen assumed that the auxiliary power is constant, 50 kW (see epi-graph 2.3). The power needed for each vehicle performance speci-fication can be seen in Table 4, where efficiency between alternatorand power demand has been fixed to 0.88. Because vehicle has notbeen built yet, two feasible CD have been considered, 0.6 and 1.1.
_WP ¼ F � V ¼ 12qCDA_r2 þm€r þmgffr � cos hþ sin hg
� �� V ð1Þ
The most restrictive condition is the third one, where the re-quired engine power is higher. This power has to be absorbed bythe two ICE; finally each engine has to give 200 kW.
Vehicle energy demand for propulsion is increased by wheelelectric motor efficiency which has been considered constant,0.96, given by manufacturer.
2.3. Auxiliary systems
The auxiliary system is electrically connected to the powerunits so energy can flow from batteries, from ICE-alternator orfrom both. Energy consumption from auxiliaries has differentsources: air conditioner, steering, active suspension, fans andpumps for cooling ICE-alternator and wheel engines and otherelectrical equipment.
Some of the auxiliary systems need to be on all time, the prin-cipal ones are the servo steering or the active suspension system.Other systems can be run intermittently as a function of the vehicleand passengers needs, like the air conditioning. The auxiliary sys-tem demands will be very variable and all cases must be suppliedwhatever the propulsion power. To ensure the capability of thepower plant to affront any demand, a constant load of 50 kW isused in the simulations. This is a little bit higher than others con-sidered [23].

Fig. 2. Engine efficiency map. Color bar in g(kW h)–1.
Table 3Compact alternator characteristics.
Concept Data
Compact alternatorContinuous power 200 kWContinuous torque 1000 Nm prox.Speed 0–2200 rpmEfficiency <96%
2644 F.J. Jimenez-Espadafor et al. / Applied Energy 88 (2011) 2641–2652
3. Simulation driving cycles
To simulate the vehicle performance some driving cycles aredesigned. The required power is due to the combination of Eq.(1) with the velocity–time load map, per each rolling resistanceand inclination, plus the auxiliary power. The whole power
Fig. 3. Generator e
requirement would be supplied by the compact alternators andthe batteries. For every power demand from auxiliaries and pro-pulsion and batteries charge, ICE-alternator can operate at anyspeed-torque position compatible with Fig. 4. The high variabilityof the ICE-alternator efficiency with load suggests the importanceof the driving cycle in the energy consumption of the system. Forthis reason three different driving cycles have been used, all ofthem last two hours and stand similar evolution. The main differ-ences between them are the mean power demanded that has beenspecified in 120 kW, 220 kW and 320 kW for cycles A, B and C.These represent 30%, 55% and 80% of the total installed powerrespectively. Fig. 6 shows velocity–time load map for driving cycleB, where rolling resistance coefficient is 0.015 and CD is 1.1.
The three driving cycles proposed cover most of the expectedoperational envelop of the vehicle, therefore they have been cho-sen to study optimal performance of the vehicle from the pointof view of fuel consumption and CO2 emissions.
fficiency map.

Fig. 4. Power unit efficiency map. Color bar in g(kW h)–1.
Fig. 5. Serial hybrid vehicle architecture power flow.
F.J. Jimenez-Espadafor et al. / Applied Energy 88 (2011) 2641–2652 2645

Table 4Compute of the necessary engine power in the limiting cases.
Limiting case Speed (km h�1) Inclination (%) h fr CD _WP (kW) gmec/elec _Waux (kW) _Weng (kW)
1� 100 0 0� 0.015 0.6 140 0.88 50 2091.1 181 257
2� 5 60 31� 0.25 0.6 218 0.88 50 3001.1
3� 80 3 1.7� 0.015 0.6 240 0.88 50 3221.1 260 345
Fig. 6. Driving cycle B, mean power around 55% of the maximum diesel engine power.
2646 F.J. Jimenez-Espadafor et al. / Applied Energy 88 (2011) 2641–2652
4. System optimization
Energy management strategies for HEV can be categorizedbased on their characteristics. According to Chau and Wong [24]control strategies aim to satisfy a number of goals which can besummarized in:
Maximum fuel economy.Minimum emissions.Minimum system costs.Good driving performance.
Being the increase of the vehicle operational range one of themain design task, system sizing is done on the basis of minimizingtotal fuel consumption and therefore CO2 emissions. It is based onthe resolution of an optimization problem which allows simulta-neously to determine optimum batteries capacity and to define en-ergy flows for each power demand throughout each velocity–timecycle.
4.1. Optimization problem
Guzzella and Sciarretta [25] propose a subdivision of energyoptimization strategies: Numerical optimization methods, analyti-cal optimization methods, equivalent consumption minimizationstrategies and heuristic strategies. In this work a numerical optimi-zation method has been used, where the entire driving cycle istaken into consideration and the global optimization is found
numerically. This method is therefore non-causal and is onlyimplementable in simulation environment. The problem is to ob-tain the power flows that minimize fuel consumption throughoutevery velocity–time load map, so the minimum CO2 emissionsfor every driving cycle are achieved. The objective and constraintfunctions are described with respect to the eight operational vari-ables _WEA; _WP
EA;_WAux
EA ;_WB
EA;_WB; _WP
B;_WAux
B and QB. The optimizationprocedure implemented in MATLAB determines at each time stepof the real driving cycle the values of the eight operational vari-ables that simultaneously minimizes the objective function (2).These variables are forced to be compatible with the energy bal-ance restrictions described from Eqs. (3)–(6), the batteries chargestate defined from Eqs. (7), (8), the regenerative power balance de-fined in Eq. (9) the lower limits of the variables imposed in Eq. (10)and the conditionals given by Eqs. (11) and (12), following a similarprocess shown in [26,27].
Objective function:
MinimizeXi¼1:n
2 � _WEAi� Cei � Dti
¼ mfuel ðthis is the fuel consumption of the two ICEÞ ð2Þ
Constraints: for each step i.
ð _WPEAiþ _WP
Bi� _WPi
Þ � Dti ¼ 0 ð3Þ
ð _WAuxEAiþ _WAux
Bi� _WAuxi
Þ � Dti ¼ 0 ð4Þ

F.J. Jimenez-Espadafor et al. / Applied Energy 88 (2011) 2641–2652 2647
ð _WPEAiþ _WB
EAiþ _WAux
EAi� _WEAi
Þ � Dti ¼ 0 ð5Þ
ð _WPBiþ _WAux
B � _WBiÞ � Dti ¼ 0 ð6Þ
Q B0i� Q Bi
þ f�ð _WPBiþ _WAux
BiÞ þ ðgB � _WB
EAiþ gB � _WB
RGiÞg Dti
VB0i
¼ 0
ð7Þ
Q MaxBi� Q Bi
6 0 ð8Þ
_WBRGi� _WRGi
¼ 0 ð9Þ
_WEAi; _WP
EAi; _WAux
EAi; _WB
EAi; _WBi
; _WPBi; _WAux
Bi;Q Bi
P 0 ð10Þ
If _WRGi> 0! _WP
EAi¼ _WB
EAi¼ _WBi
¼ _WPBi¼ _WAux
Bi¼ 0 ð11Þ
If _WBEAi> 0! _WBi
¼ _WPBi¼ _WAux
Bi¼ 0 ð12Þ
This model solves only for positive variables, therefore when_WP becomes negative in some step, regeneration range is called_WRG, as can be seen in the equations by inspection. The values of
the eight variables are obtained in an iteration procedure of thewhole driving cycle at each calculus step to minimize the fuelconsumption.
4.2. Calculation of CO2 emissions
ICE is diesel type so the stoichiometry balance with fixed com-bustion efficiency has been considered [28]. Eq. (13) is applied to acommon diesel fuel with a relation carbon and hydrogen in mass of1.89 = y/x [29].
CxHy þ xþ y4
� �� O2 þ 3:76 � xþ y
4
� �� N2
) x � CO2 þy2
� ��H2Oþ 3:76 � xþ y
4
� �� N2 ð13Þ
CO2 emissions from fuel consumption is related as Eq. (14)shows.
CO2 ¼ mmolCO2� xC � gComb �mfuel=mmolfuel ð14Þ
where mmolCO2 =44 g; mmolfuel=13.89 g; xC = 86.4%; gComb = 97%.The same structure followed in 4.1 could be used for other
objective function, as for example minimization of vehicle NOx
emissions if there is complete knowledge of the NOx emissionsmap of the ICE. This could be interesting in the new growing envi-ronmental conscience, and the possibly future cost of the emis-sions. Other demanded targets could be vehicle noise or exhaustgases temperature reduction.
5. Simulation results
5.1. Sizing analysis
The simulation results for driving cycle B are shown in Fig. 7,where the evolution of the different power flows for the optimalsolution are shown.
Left part of Fig. 7 shows energy flows from alternator. ‘‘Powergiven by Engine-Alternator’’ is the total power supplied by ICE-alternator at each point along the driving cycle. The three figuresbelow show the distribution of this total power among propulsion,auxiliary systems and batteries. On the right side of Fig. 7 areshown the energy flow from the batteries. ‘‘Power given by batter-ies’’ is the total power supplied by batteries at each point along thedriving cycle. The following two figures show the energy flow from
batteries to propulsion and the part to the auxiliary systems. Thefinal figure in green on the bottom right hand corner shows thebatteries charge in Ah throughout the complete cycle. The maxi-mum batteries charge, around 40 Ah for cycle B, determines themaximum capacity of the batteries and therefore its dimensionand weight.
It can be appreciated that batteries charge at the end of the driv-ing cycle is not null. This is because it has been imposed a mini-mum batteries charge, around a 30% of the total capacity, thatdoes not affect energy flow optimization and that seeks to maxi-mize batteries service life [30].
Table 5 shows main simulation results for driving cycles A, Band C. It can be observed that as higher mean power cycle, minormaximum optimal batteries capacity is. A feasible explanation tothis behavior is that when power demand is high, there is lesspower at disposal for whole energy optimization. Also the maxi-mum batteries charge change about a 3% from cycles A to B but re-duces around 82% from cycles B to C, when the mean power growsbetween these cycles about 55%. If fuel consumption is divided bymean power demanded in each cycle, it is easily obtained 1.20 l/kW, 1.10 l/kW and 1.14 kW for cycles A, B and C respectively. Theseresults show that system is non linear and that system perfor-mance is very dependent on power demands and ICE-alternatorcharacteristics. Finally, the optimal batteries capacity should beone close to cycle A solution, which represents 2.5% of the nominalweight of the vehicle.
5.2. Automatic gear transmission comparative
In order to establish the potentiality of fuel saving and CO2
emission reduction, power propulsion configuration has beenchanged to an ICE and automatic gear box transmission with thefollowing characteristics:
– The engine is the same that in HEV.– There is not compact alternator in this configuration.– Seven gear ratios of transmission: n1:7 = [11.67 6.27 3.22 1.74
1.4 1.36 1]. The maximum gear ratio is selected to achieve themost restrictive propulsion condition which is maximumattainable engine torque.
– The differential ratio is: ndif = 3.
Automatic gear box efficiency has been fixed to 90% and 95% forthe differential, which results a total transmission efficiency of85.5% from engine to wheel [31]. Finally, to supply energy to aux-iliary systems an alternator of high efficiency (80%) has been con-sidered [32].
The control algorithm for the automatic transmission estab-lishes at any power demand the gear ratio that maximizes the glo-bal efficiency, so it is the point where the fuel consumption islower.
Automatic transmission with its control algorithm has been ap-plied to the three driving cycles A, B and C defined in epigraph 3.Fig. 8 shows speed for engine and wheel, Fig. 9 shows gear ratioand torque and Fig. 10 shows gear ratio and engine efficiency fordriving cycle B. Analysis results for the three cycles comparingHEV solution and automatic gear transmission are presented inTable 6. The HEV solution used is the one without power supplyservice because is more comparable due to the extra batteries sup-poses an extra consumption that is not considered in the geartransmission configuration.
Several conclusions can be extracted from these results. First ofall is the fuel saving and CO2 reduction of HEV in front of automatictransmission for all the tested cycles. It can be observed that ashigher mean power cycle, minor fuel consumption reduction isachieved, going from 37.3% for cycle A to 13.3 for cycle C, the
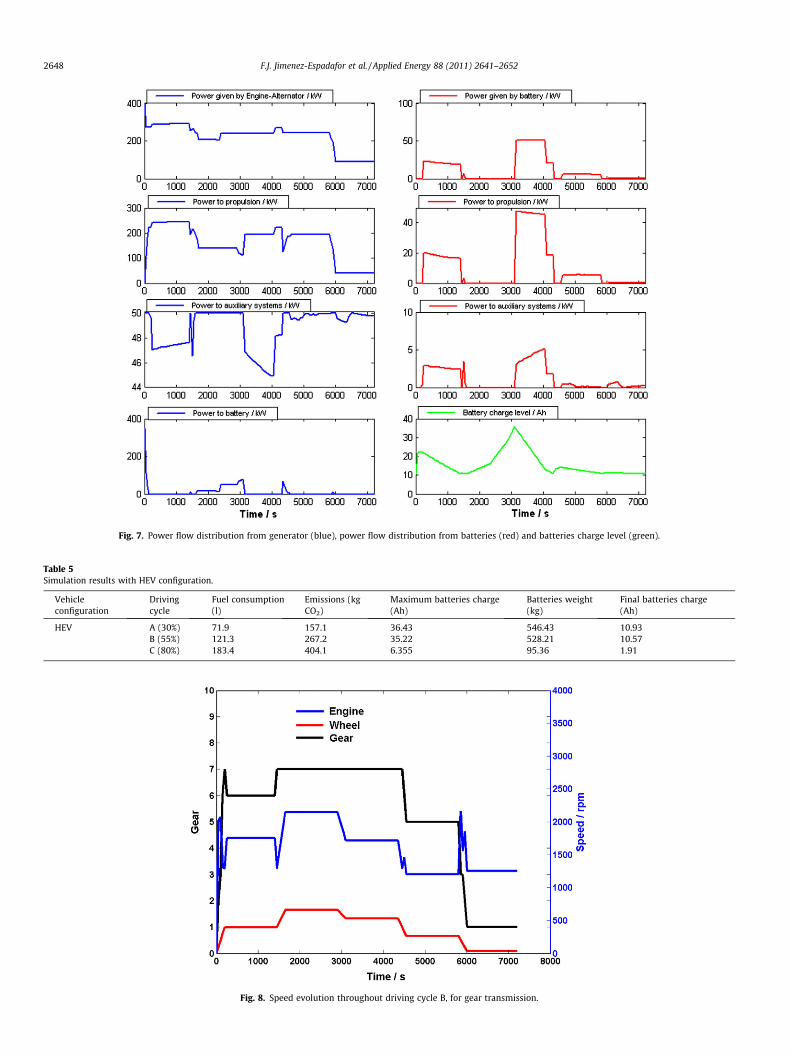
Fig. 7. Power flow distribution from generator (blue), power flow distribution from batteries (red) and batteries charge level (green).
Table 5Simulation results with HEV configuration.
Vehicleconfiguration
Drivingcycle
Fuel consumption(l)
Emissions (kgCO2)
Maximum batteries charge(Ah)
Batteries weight(kg)
Final batteries charge(Ah)
HEV A (30%) 71.9 157.1 36.43 546.43 10.93B (55%) 121.3 267.2 35.22 528.21 10.57C (80%) 183.4 404.1 6.355 95.36 1.91
Fig. 8. Speed evolution throughout driving cycle B, for gear transmission.
2648 F.J. Jimenez-Espadafor et al. / Applied Energy 88 (2011) 2641–2652

Fig. 9. Torque evolution throughout driving cycle B, for gear transmission.
Table 6Comparative of simulation results with two vehicle configuration.
Driving cycle Gear transmission fuelconsumption (l)
HEV Fuel consumption (l) Fuel consumption reduction (%) Gear transmission kg CO2 HEV transmission kg CO2
A (30%) 98.7 71.9 37.3 217.5 157.1B (55%) 148.2 121.3 22.2 326.6 267.2C (80%) 207.9 183.4 13.3 458.2 404.1
Fig. 10. Specific fuel consumption evolution throughout driving cycle B, for gear transmission.
F.J. Jimenez-Espadafor et al. / Applied Energy 88 (2011) 2641–2652 2649
one with the maximum mean power demand. There are two mainreasons for this behavior: first is that when power demand is high,there is less power at disposal for whole energy optimization andsecond, ICE-alternator efficiency is much reduced for low-powerdemand. This can be appreciated in Fig. 11 that shows the maxi-mum efficiency route for the power unit efficiency map (seeFig. 4), where from 80 kW efficiency is almost flat.
Although noxious ICE exhaust emissions as NOx, HC and Partic-ulates are not known, it can be assumed that next to the fuel con-
sumption reduction there will be a diminution of these emissionsbut in a different proportion as that derived from CO2 reduction.
5.3. Real application
This epigraph shows simulation results for a real driving cyclebetween Ávila and Talavera de la Reina (Spain). It is a typical itin-erary for a vehicle of these features where are included differentrolling resistance coefficients corresponding to motorways and

Fig. 11. Power-efficiency map of the ICE-generator power unit.
2650 F.J. Jimenez-Espadafor et al. / Applied Energy 88 (2011) 2641–2652
rural roads. The total distance is 130.4 km and the maximum ele-vation is around 1000 m. All trajectory details are obtained fromthe software CompeGPS [33]. The acceleration, velocity, rollingresistant coefficient and gradients of this trajectory are shown inFig. 12, where power demanded by auxiliaries has been consideredconstant, 50 kW.
Mean power of this trajectory is 144 kW, approximately 36% ofthe installed power. However should be noticed that there aresome power demands that overcome installed power at ICE, being
Fig. 12. Power distribution, acceleration, inclination, velocity and rolling
the maximum one about 725 kW near the end of the cycle. Thesepowers peaks can be satisfied with ICE-alternator and the batteriesonly if the previous vehicle power demands allow carrying extraenergy from ICE-alternator to the batteries. Hub wheels motor,batteries capacity and power and electrical wires should be dimen-sioned in order to be able to supply power peaks. Taking the previ-ous into account and for this specific trajectory, vehicle is able tocomplete the whole tract with fuel consumption optimized, beingresults shown in Fig. 13.
resistant coefficient along Ávila-Talavera de la Reina driving cycle.

Fig. 13. Power flow distribution from generator (blue), power flow distribution from batteries (red) and batteries charge level (green) throughout Ávila-Talavera de la Reinadriving cycle.
F.J. Jimenez-Espadafor et al. / Applied Energy 88 (2011) 2641–2652 2651
Total fuel consumption for this cycle is 116.4 l with 256.5 kg ofCO2 gases emission. Although mean power is close to that of cycleA, see epigraph 3, maximum batteries size required to minimizeconsumption is 18.16 Ah, this means 272 kg in front of 546.4 re-quired for cycle A. Maximum demanded batteries discharge poweris 324.3 kW that for batteries voltage of 600 V require maximumintensity of 540.5 A.
6. Conclusions
A mathematical model of the power system of a diesel-electricinfantry mobility vehicle has been developed in MATLAB program-ming environment. The optimization module has allowed gettingthe batteries size and the energy flow management for minimumfuel consumption and CO2 emissions. Energy vehicle flows havebeen analyzed throughout four different driving cycles so thatresults could be extrapolated to other operational cycle.
Optimum batteries weight represents only about 2.5% of themaximum vehicle weight, although it should be consider that opti-mum battery weight changes with cycle and battery characteris-tics. The improvement of battery technology, higher energy-weight ratio, would reduce battery weight but the optimal maxi-mum capacity of the battery would be the same. The convenienceof the use of hybrid electric system for this infantry mobility vehi-cle is clearly exposed when this solution is compared to the typi-cally used automatic gear transmissions. Although in theautomatic transmission configuration analyzed the engine hasbeen forced to work in the best operational point, the nonexistenceof batteries avoid the engine working near the optimum opera-tional locus which finally penalizes fuel consumption.
For the intermediate driving cycle B, fuel saving with HEV con-figuration is 22.2%. Being the expected service life of armouredvehicles of about 40 years [34] and estimating 1500 h per yearfor driving cycle B, fuel saving throughout service life would beabout 800,000 l, which means to avoid the emission of1,760,000 kg of CO2.
Moreover the versatility of the hybrid configuration has otheradvantage; the use of the vehicle as a power supply source for sta-tionary applications. In addition, if main system configuration al-lows, the ICE-alternator and the batteries can overcome powerdemands much higher than the ICE maximum power.
References
[1] BMR characteristics: <http://www.ejercito.mde.es/materiales/bmr.html>.[2] Boxer characteristics: <http://www.artec-boxer.com/>.[3] VBCI characteristics <http://www.defense.gouv.fr/>.[4] Piranha characteristics <http://www.mowag.ch/>.[5] SEP <http://www.army-technology.com/projects/sep/>.[6] Striker <http://www.army.mil/>.[7] Hornback Paul. The wheel versus track dilemma. Armor; 1998. p. 33–4
[March–April].[8] Ghassan Khalil. Challenges of hybrid electric vehicles for military applications.
In: US Army TARDEC. Vehicle power and propulsion conference, IEEE; 2009.[9] Williamson SS, Emadi A. Comparative assessment of hybrid electric and fuel
cell vehicles based on comprehensive well-to-wheels efficiency analysis. IEEETrans Veh Technol 2005;54:856–62.
[10] Demirdöven N, Deutch J. Hybrid cars now, fuel cell cars later. Science2004;305:974–6.
[11] Granovskii M, Dincer I, Rosen MA. Economic and environmental comparison ofconventional, hybrid, electric and hydrogen fuel cell vehicles. J Power Sources2006;159:1186–93.
[12] Ahn K, Papalambros PY. Engine optimal operation lines for power-split hybridelectric vehicles. Proc IMechE Part D: J Automob Eng 2009;223:1149–62.
[13] Ao G-Q, Qiang J-X, Zhong H, Mao X-J, Yang L, Zhuo B. Fuel Economy and NOx
emission potential investigation and trade-off of a hybrid electric vehicle

2652 F.J. Jimenez-Espadafor et al. / Applied Energy 88 (2011) 2641–2652
based on dynamic programming, Proc. IMechE Part D: J Automob Eng2008;222:1851–64.
[14] Chu A, Braatz P. Comparison of commercial supercapacitors and high-power lithium-ion batteries for power-assist applications in hybridelectric vehicles I. Initial characterization. J Power Sources 2002;112:236–46.
[15] Lam LT, Louey R. Development of ultra-batteries for hybrid-electric vehicleapplications. J Power Sources 2006;158:1140–8.
[16] Hsy Y Y, Lu S-Y. Design and implementation of a hybrid electric motorcyclemanagement system. Appl Energy 2010;87:3546–51.
[17] Katrašnik T. Analytical method to evaluate fuel consumption of hybrid electricvehicles at balanced energy content of the electronic storage devices. ApplEnergy 2010;87:3330–9.
[18] Huand K, Quang KV, Tseng K-T. Study of the effect of contraction of cross-sectional area n flow energy merger in hybrid pneumatic power system. ApplEnergy 2009;86:2171–82.
[19] Katrašnik T, Rodman S, Trenc F. Improvement of the dynamic characteristic ofan automotive engine by a turbocharger assisted by an electric motor. J EngGas Turb Power 2003;125(April):590–5.
[20] Katrašnik T. Analytical framework for analyzing the energy conversionefficiency of different hybrid electric vehicle topologies. Energy ConversManage 2009;50:1924–38.
[21] Toyota Prius batteries characteristics. <http://www.toyota.es>.[22] Broussely M, Pistoia G, editors. Industrial applications of batteries: from cars to
aerospace and energy storage. Traction Batteries. EV and HEV. Elsevier B.V.;2007 [chapter 4].
[23] Meinert M. New mobile energy storage system for rolling stock. In: SiemensAG editor. Industry sector, mobility division. IEEE Xplore. Power electronicsand applications, 13th European conference; October 2009.
[24] Chau KT, Wong YS. Overview of power management in hybrid electric vehicles.Energy Convers Manage 2002;43:1953–68.
[25] Sciarretta A, Guzzella L. Control of hybrid electric vehicles. IEEE Contr Syst Mag2007:60–70.
[26] Park JY, Park YK, Park JH. Optimal power distribution strategy for series–parallel hybrid electric vehicles. Proc IMechE Part D: J Automob Eng2008;222:989–1000.
[27] Oh K, Min J, Choi D, Kim H. Optimization of control strategy for a single-shaftparallel hybrid electric vehicle. Proc IMechE Part D: J Automob Eng2007;221(5):555–65.
[28] Heywood John B. Internal combustion engines fundamentals, internationaled. New York: Mc Graw-Hill; 1988.
[29] Guibet JC. Fuels and Engines; Technology-Energy-Environment. In: Technipeditor. Institut Français du Pétrole Publications; 1999.
[30] Karner D, Francfort J. Hybrid and plug-in hybrid electric vehicle performancetesting by the US department of energy advanced vehicle testing activity. JPower Sources 2007;174:69–75.
[31] Wong JY. Theory of ground vehicles. 4th ed. New Jersey: John Wiley & Sons,Inc.; 2008.
[32] Kiippers S, Nenneberger G. Numerical of procedures for the calculation anddesign of automotive alternators. IEEE Trans Magn 1997;33(2):2022–5.
[33] CompeGPS software. <http://www.compegps.com>.[34] Guenter H. Military terrain vehicles. J Terramechanics 2007;44:23–34.
Copyright © 2022 FDOKUMEN