
Effects of Passive Porous Walls on Hypersonic Boundary Layers
Upload
independentCategory
view
4download
0
u
,
i
AlAA 93-0401 Design of a Hypersonic Waverider-Derived Airplane
Robert J. Pegg, James L. Hunt, and Dennis t NASA Langley Research Center Hampton, Virginia
Leo Burkardt NASA Lewis Research Center Cleveland, Ohio
Petley
Daniel R. Stevens, Paul L. Moses, S. Zane Pinckney, Hanee Z. Kabis, Kevin A. Spoth, William M. Dziedzic, R.I. Kreis, and John G. Martin Lockheed Engineering and Sciences Company NASA Langley Research Center Hampton, Virginia
and
Paul J. Barnhart Sverdrup Technology, Inc. Brookpark, Ohio
31 st Aerospace Sciences Meeting & Exhibit
January 11 -14,19931Ren0, NV For permission to copy or republish, contact the American Institute of Aeronautics and Astronautics 370 L'Enfant Promenade, SW Washington, DC 20024
W DESIGN OF A HYPERSONIC WAVERIDER-DERIVED
AIRPLANE
Robert J. Pegg, James L. Hunt, and Dennis H. Petley NASA Langley Research Center
Hampton, Virginia
Leo Burkardt NASA Lewis Research Center
Cleveland, Ohio
Daniel R. Stevens, Paul L. Moses, S. Zane Pinckney, Hanee Z. Kabis, Kevin A. Spoth
William M. Dzicdzic, R. I. Kreis, and John G. Martin Lockheed Engineering and Sciences Company
Hampton, Virginia
and
Paul J. Barnhart Sverdrup Technology, Inc
Brookpark, Ohio
INTRODUCTION
The current global political situation suggests that long-range aircraft operating at high speeds would be of great potential benefit to the United States after the turn of the century (Rcf. 1). The research presented in this paper represents a preliminary assessment of a long- range cruise waverider vehiclc. This work was done by NASA Langley Research Center (LaRC) and NASA Lewis Research Center (LeRC) in conjunction with General Dynamics (GD) Cor the airframe structure and Pratt & Whitney (P&W) for the propulsion system. The NASA Langley Systems Analysis Office coordinated the work and technically monitored the efforts of GD and P & W which were provided under the Mach 5 cruise portion of the HiMate Program. The waverider planform was chosen as the basis for this study because i t has low drag characteristics, reasonable volumetrics, (Ref. 2 and 3) and is computationally easy to derive and optimize. Recent advances in high temperaturc materials, light-weight structurcs and high thrust-to-weight ratio propulsion systems indicatc that low hypersonic specd aircraft arc fcasible. A maximum airspeed of Mach 5.0 was chosen so that a practical "near-term" design could be formulated that uses hydrocarbon endothermic fucls.
For hypersonic vehicles with long-rangc missions, thc fuel load becomes a sizeable percentage of the overall weight. Thus, the installed thrust-to-weight ratio and the installed specific Cud consumption become important factors in the design of this class of aircraft. Hypersonic cruise vehicles generally cxperience a thrust- to-drag "pinch" at transonic and low supersonic Mach
d
d
numbers. Inlets and nozzles, sized for thrust and efficiency at high speeds, operate off-design with high losses in this Mach regime. The accelerator and ramduct must be sized to offset these losses, thus, increasing fuel burn during acceleration. This paper will address some of the issues involved in the airframe and propulsion system integration required to optimize a vehicle for maximum range. This report presents the initial iteration of an ongoing design process. Not all disciplines are closed: powerplant selection has not been optimized, and the aircraft has not been scaled. Take-off requirements were considered for purposes of propulsion, landing gear sizing and determining maximum takeoff weight.
Finally, some question exists as to the ability of the aeroanalysis methods employed here to accurately analyze waveriders. These methods require approximating the geomeuy as a wing section, not taking into account the contained conical shock flowfield generated by the waverider, and most likcly will overpredict wave drag and underpredict lift. An cffort is prescntly underway at LaRC to wind-tunnel test a similarly derived waverider-based vehicle, validate CFD methods, and provide a data base for calibrating other aeroanalysis methods. It was decided to use best engineering judgment for this paper and wait for this database before performing a more time consuming and costly CFD-based analysis.
MISSION DEFINITION
The mission on which this study is based was a tanker- to-tanker mission. The mission begins at Mach 0.8 and
30,000 fcet. Thc vehicle accelerates to Mach I .2 at constant altitudc thcn to Mach 5 whilc climbing to approximately 90,000 fcet. Thc entire acceleration takcs placc a t a dynamic pressurc bclow 1,000 psl, while maintaining duct pressures bclow 100 psi. A cruisc/climb profile was then estahlishcd to obtain thc maximum rangc at the hest-rangc altitudcs. A deceleration was thcn initiated that allowcd the aircraft to establish thermal equilibrium at flight idlc-powcr settings back to a 30,000-foot altitude and Mach 0.8 airspeed. Rcscrvc fuel, sufficient to maintain a timc of 20 minutes loiter, would enable rcndezvous with the tanker. Figurc 1 shows this mission profile.
DESCRIPTION OF VEHICLE
This rcscarch cffort is dircctcd towards achieving a n aircraft with maximum range at a cruisc Mach numbcr of 5.0. A wavcridcr shapc was sclccted f o r this sii idy bccausc of its good hlcnd of volumetric cfficicncy ;ind high lift-to-drag (LID) at thc dcsign cruisc Mach numbcr. The basic shapc was formed using thc Quickwavc codc (Ref. 4). Modifications to this shape wcrc necessary so tha t practical design considcrations could bc intcgrated into thc aircraft. Figurc 2 shnws a thrcc-vicw drawing of thc aircraft. Blending of tlic cngincs, tails, and cockpit arc indicatcd in figurc 1 which shows thc wcll-shapcd arca distribution ctirvc for the aircraft. Pcrtincnt vcliiclc dimcnsions and iirciis arc givcn in tahlc 1. Othcr integration issucs that have bccn addrcsscd arc discussed in refercnce 5. A comparison of thc size of the proposcd wavcrider aircraft is prcscntcd in figurc 4. Evcn though thc vchiclc I i i i s thc approximate wcight of a B-767 transport, thc actiiiil s i x is considcrably smallcr.
I t was assumed that thc airplanc would hc powcrctl hy four turboramjct cngincs. Thc STRJ-101 1 powcrplant systcm was supplicd by Pratt & Whitncy iintl is Ixiscd on currcnt tcchnology (gcn 5) using cndothcrmic f11cI. The turbojct would opcratc from takc-of1 to turbojct/r;imjct trimsition (approximatcly M:ich 2.0- 3.0). The rainjct cnginc is to be startcd at i i low supersonic Mach numbcr and opcratcd in parallel with thc turbojct through transition, aftcr which the rmjc t would opcratc alonc to complctc thc higli-Miicli accclcration and cruisc.
A ERO DY N AMI C AN A I, Y SI S
Thc geometry dcfinition was dcvclopctl using tlic computcr-aided dcsign (CAD) tool ACAD. Prcliininary acrodynamic daw for tlic Mach 5 cruisc aircrafl wiis gcncratcd using Acrodynamic Prcliminary Analysis Systcin (APAS 11) (Rcl'. 6) which fccaturcs liiiilicd Disuihutivc Panels (UDP) for subsonic, transonic, and low supcrsonic analysis and Hypcrsonic Arbitrary Body Program (HABP) for hypcrsonic analysis. I h t a
gcncratcd include acrodynamic forces and moments for L/ all Mach numbers as wcll as heating ratcs and tcnipcraturcs for hypcrsonic cdscs. Aerodynamic lift cocfficicnt is shown in figure 5 for 0 and 6 dcgrecs angle-of-attack.
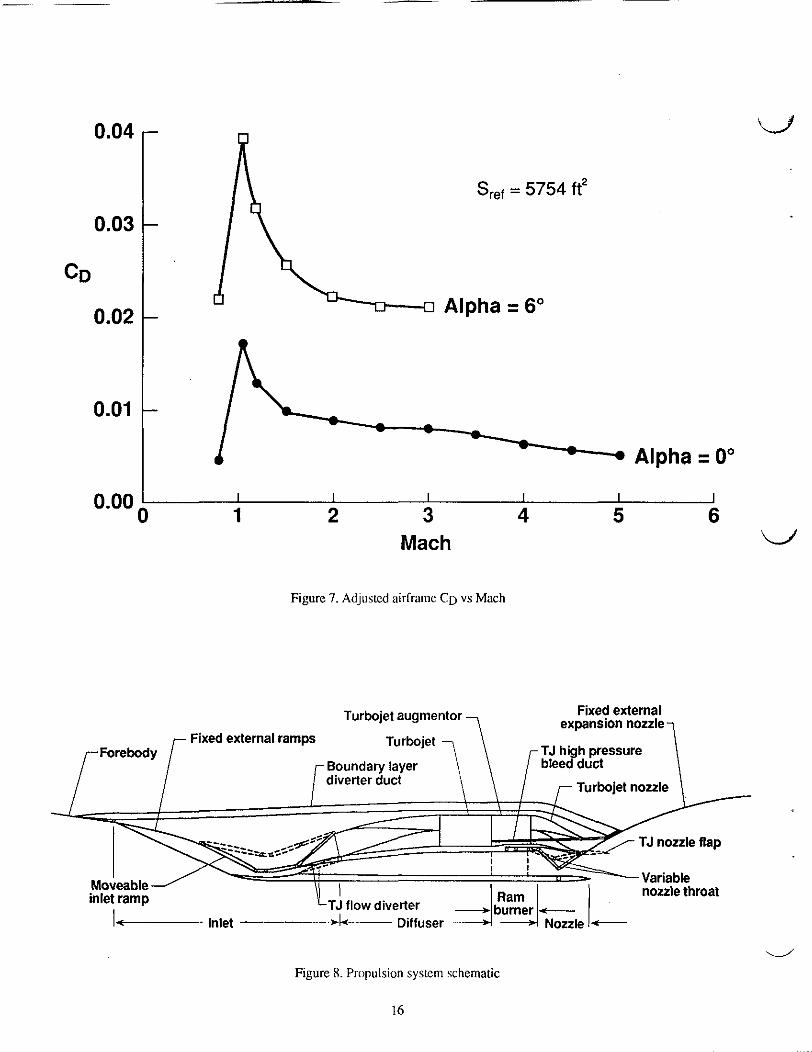
Transonic analysis for this typc of configuration pushes thc limits of applicability of the UDP code, which is bascd o n slender body theory. Additionally, in order to account for the cnginc cowl's external wetted surface, whilc cxcluding the inlet ramps and nozzlc, (which were bookkcpt in thc propulsion calculations), the aircraft had to bc modellcd as a wing-type geomewy (Le. streamwisc cross-scctions) using a relatively coarse panclling. This resultcd in unreasonably high wave drag. A comparison between wind-tunnel data for a similar waverider shape (Mach 4 design point, Fig. 6 from data in Rcf.7) and UDP analysis of these shapcs intlicatc that while lift is prcdictcd reasonably well, drag is ovcrpredicted by 50 pcrccnt to 100 percent. Correction factors were thcrefore applied to tlic drag cocfricicnts that were calculatcd by UDP up to Mach 3.0. Figure 7 shows thc drag coefficient as a function of Mach number for anglcs-of-attack of 0.0 and 6 dcgrccs. All drag coefficients shown in figurc 7 were calcul;itcd for 50,000 fect. Notc that all of thesc figures dcpict airframc lift and drag only (i.c. ignoring inlet ramps, internal cngine and cxtcmal nozzlc surfaces).
Data a i Mach 4 and above wcrc dcrivctl using HABP. For 21 conlincd flowficld configuration such as the wavcritlcr-likc dcsign herein, at the on-design condition (M=5.0, n =O dcg.), thc HABP docsn't prcdict the static prcssurc on flow-alignctl surfaces, thus possibly undcrcstimating lift for the prcsent configuration at thc dcsign point. For a Mach 6 waveridcr configuration vchiclc (Rcf. 8), this neglccted L/D incremcnt was a positive 15 pcrccnt uining a fully turbulent boundary layer (any portion of lamiiiiir Slow would incrcase this incrcmcnt). Thcrcforc, thc LID pcrformancc at thc dcsign cruisc conditions bascd on thc HABP could bc conscrviitivc.
Tables of l i f t , pitching momcnt, and drag cocfficicnts wcrc c~ilculatcd for scvcral sets of Mach numhcrs, iiltitiitlcs, and anglcs-of-attack, to be uscd for trajcctory an:ilysis. Control surficc cffcctivcncss was calculatcd by physically dcflccting thc ailcron flap geomctry and gcncraling a ncw configuration for each anglc dcsircd. The rcsulting forcc and momcnt data wcrc thcn subtr;ickxl from thc undcflcctcd casc data to producc tables of "dcluis" for usc i n trimming thc aircraft (pitch plane) (luring trajcctory analysis.
ii
PROPULSION I N T E G R A l I O N
4 The in~cgration of thc propulsion systcm is :I primary drivcr i n dcvcloping tlic layout of thc configuration.
2
The entire length of the vehicle undcrsurface can bc considered part of the propulsion system. Thc waveridcr forebody is the first compression ramp and providcs a clean, uniform compression flowfield for the propulsion system. The engine modulcs must be integrated in such a way as to fully utilize this bencficial waverider characteristic. Complicating this integration is the need for a high expansion area nozzle for efficient high-speed performance. The installed propulsion configuration presented here is a result of a synergistic optimization of several design parameters. Thcse are ( 1 ) achieving a prescribcd inlet-to-exit area ratio, (2) integration of an external expansion nozzle with an optimum expansion ratio, (3) the minimization of aft body base arca for transonic efficiency, and (4) a desirc to efficiently capture the conical inlet flow while utilizing highly efficient, easily optimized 2-D (right rectangular cross- section) inlets and nozzles.
In an attempt to reduce thc complexity of the dcsign as much as possible, an over/under turboramjct (the Pratt & Whitney STRJ-1011) with a subsonic splitter was selected. This choicc simplifies the analysis process as well as reduces mechanical complexity. Future iterations of this design may incorporatc morc advanced propulsion concepts if the bencfit polential is grcat enough to offsci the risk.
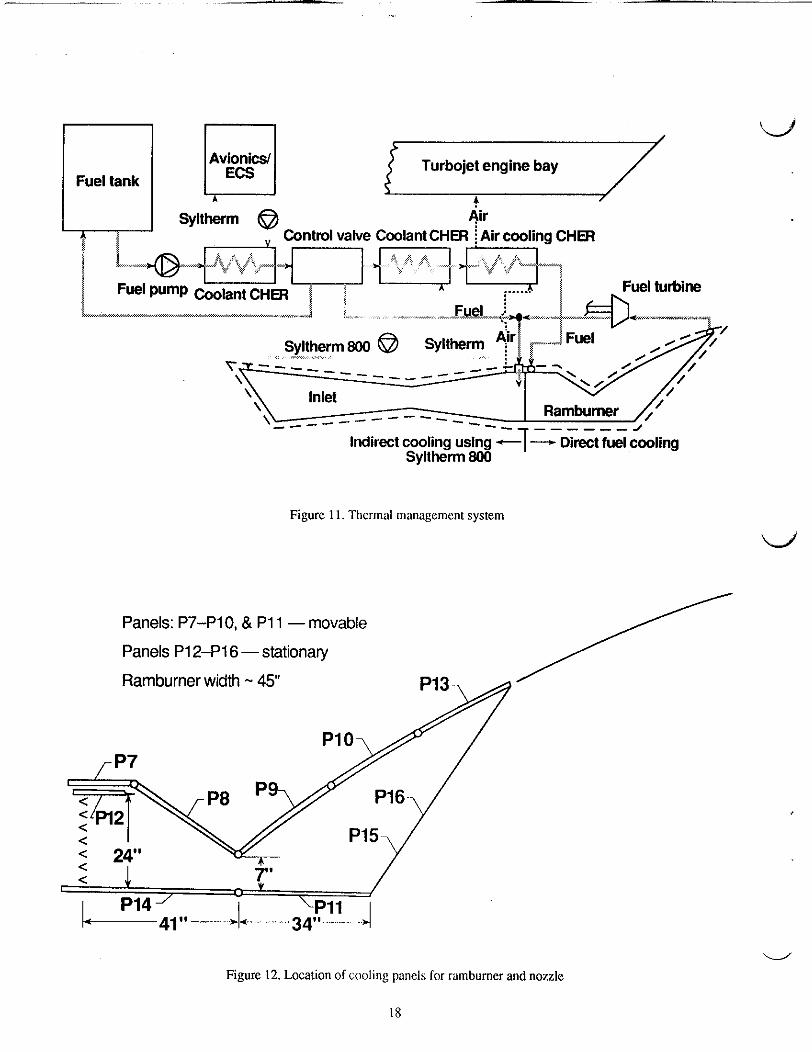
Inlet Design. Theorctically, the conical shock waverider forebody providcs a near-pcrfcct flowfield for ingestion into a propulsion system. Unfortunately, thc realities of propulsion dcsign crcatc a disconncct bctwecn the 3-D conical flowfield and thc convcx cross section of thc waverider forcbody and the probability that only 2-D variable geomctry inlcts can bc built within reasonable wcight limitations. Figurc 8 indicatcs thc coinplcxity (potcntial wcight gain) of a 2- D inlet is exicnsive. Thc increasc in complexity and weight required for a 3-D inlct systcin, howcvcr, would add unacceptable risk to thc design. A practical solution to this problem was deviscci that allows the usc of 2-D modulcs to capturc thc 3-D flow from thc wavcridcr without a significant sacrificc in performance.
Preliminary analysis of the inlct tlowficld indicatcd a need for comprcssion beyond what was provided by thc waverider flowfield. This additional comprcssion requires an external inlct ramp systcm to bc dcvisctl that not only provides thc nectled comprcssion ratio but transitions the inlet flowficld from 3-D to 2-D. Inlet strakes arc incorporated to isolatc cach inlct in case of an unstart or enginc-out condition in onc modulc. Thc outboard strakes arc cxtcndcd forward to the first auxiliary inlet ramp to control side spillage. Thc cowl is fixed so flow control in the inlct is to bc accomplished by the variable ramp systcm. A spliltcr that controls the capturc flow division bctwecn thc turbojet and ramjet is locatcd bchind thc inlct throat.
v'
',d
d
A boundary-layer diverter was integrated just forward of the first external inlet ramp to remove the low energy boundary-layer flow during turbojet operation only. This may not preclude the need for bleed internal to the inlet but will minimize the volume required, thus, simplifying the bleed system. Installed engine performance includes penalties for the forward bleed system and for eight percent internal inlet bleed even though no internal system is shown at this time.
To bettcr optimize the inlet system on this vehicle, the inlets conform to the 3-D flowfield and convex cross- sectional shape of the waverider body at the inlet station. However, it was found desirable to use a completely 2-D (horizontal cross-section) external nozzle design. A way of integrating these seemingly incompatible design drivers was devised which benefited other aspects of the vehicle optimization. A long subsonic diffuser was used to transition the flow from the wrap-around arrangement of the inlet modules to the 2-D horizontal nczzle arrangement. The long diffuser also brought the inlet Curther forward on the waverider forebody, thus, pulling the engine and nozzle up. This rcduccd both the maximum cross-sectional area and the aft base arca of thc vehicle, significantly improving the transonic performance of the design.
Nozzle Design. The turbojet, turbojet augmenter, turbojet nozzle, ramburner, ramjet-nozzle, and external cxpansion nozzle were aligned in a 2-D arrangement, resulting in a simplified nozzle design, as well as suuctural design. The external nozzle is designed as a single, large expansion surface with a 15:l expansion ratio. Sidewalls were incorporated only on thc outer edgcs of the nozzlc with no inter-module separators used bcyond the internal ramjet nozzle.
For low-spccd opcration, the design incorporates somc fcatures to maximizc the turbojet nozzle efficiency and decrease the boat-tail drag. As seen in figurc 8, a door opens to allow the turbojet nozzle flow to exit to the cxtcrnal nozzle just above the ramjet nozzle. Thc low- pressure diverter air is dumped into the external nozzlc just above thc turbojet exit, and high-pressure air, taken off the turbojct, is injected between thc turbojct exit and divcrtcr flow to create a slip stream bclween thcsc flows. As conccived, the ramjet will be started at approximately Mach 2.0. Whcn the turbojel shuts down at Mach 2.5, thc turbojet nozzle exit doors scal shut, lcaving a largc, unobsuucted expansion surface.
PROPULSION SYSTEM INSTALLED PERFORMANCE
The choice of the overlunder turboramjet propulsion system, with the accompanying variable geometry inlet and internal flow divider, allows propcr airflow control
3
(airflow split, etc.) for the turboramjet combination. Assuming this airflow control capability, ILRC generated the installed performance (including engine flowpath moments) for the Mach 0 to 2.5 flight region using uninstalled turboramjet performancc data furnishccl by P&W. No angle-of-attack effects were calculatcd for this data. For the ascent, the turbojets arc operating at maximum throttle until they are shut off at about Mach 2.5. The inlet/engine system size was controlled by the Mach 1.0 to 1.2vehicle drag levels which produced a turbojet cnginc with 34,000 pounds of installed sca- level static thrust at maximum afterburner. Turbojet engine performance was also generated for idle powcr settings for the descent portion of the trajectory. The ramjet pcrformance (including engine flowpath moments) from Mach 2.5 to 5.0 was generated at L.aRC using a version of the SRGULL code (Ref. 9). This code was used to generate the airflow values for Ihc conical flowfield of the on-design Mach 5.0 wavcridcr. For the Mach 2.5 to 5.0 ramjet performance, thc off- design effects of angle-of-attack and Mach numhcr were cstimated assuming a conical forebody to apprcixirnatc the flow distribution entering the 2-D ramp system. The minimum Mach number and maximum fuel cquivalcnce ratio at which the ramjet can operate is controlled by the available combustor area ratio. Within these limits, ramjet operation is assumed to begin about Mach 2.0 with the ramjet side of the flow being used essentially for turbojet flow control helow Mach 2.0 and to minimize capture flow spillage. For the ascent, the ranjet is operating at maximum fuel equivalence ratio and enthalpy level of the capture Ilow.
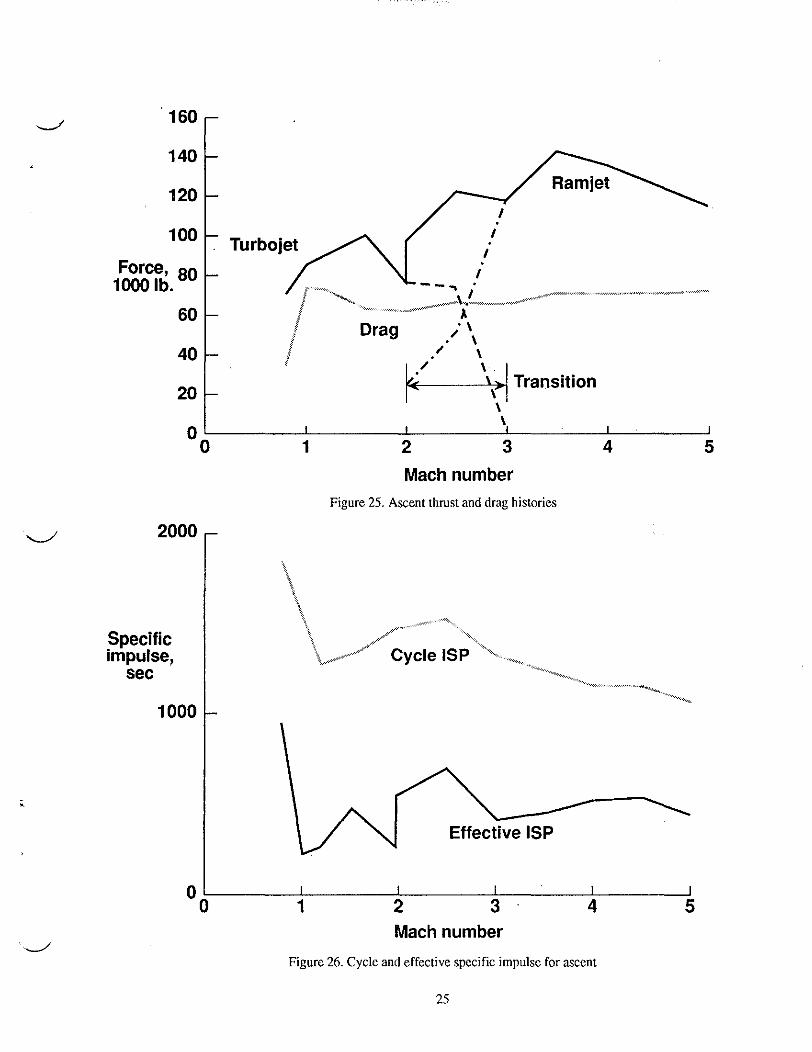
The maximum-thrust ascent produces minimum Lime to Mach 5.0, but the acceleration rate of the vehicle is loo low for cfficient performance. Values of thrust and specific impulse for the optimized trajectory arc shown in figures 9 and IO. Thrust and specific impulse computations. whcn both thc turbojet and ramjet arc operating simultaneously, are problematic bccausc it is difficult to dccidc how much of the inlet and nozzle losses to bookkccp to each system.
THERMAL CONTROL AND 1WEI.S
Endothermic fuels arc needed to provide the necessary hcat sink for cruise at Mach 5.0 and decclcration. Methylcyclohexane (MCH) and an advanced paraffin T i e l were considered. The paraffin fuel was choscn because it had a much higher flash-point temperature.
Both direct and indirect fucl cooling were used i n thc design. In either case, a catalyst is needed to promotc the endothermic chemical reaction of the fucl. Tlic thermal management system is shown in figiirc I 1 Direct fuel cooling is used in the ramburncr antl inoulc where the hcat load is highest. For these a r c a , thc catalyst is installcd on the inside of the supcralloy
cooling panels. The location of panels with direct fuel cooling is shown in figure 12. Indirect cooling is used for the inlet, avionics, and turbojet engine bay, and a catalytic hcat exchanger reactor (CHER) is employed to transfer heat from thc secondary fluid to the fuel and promotc the chemical reaction. The secondary fluid is Sylthcrm 800, a low viscosity, heat-transfer liquid and is described in reference 10. The inlet has integral titanium alloy cooling panels with insulation and a cobah L-605 heat shield. The inlet cooling concept is shown in figure 13.
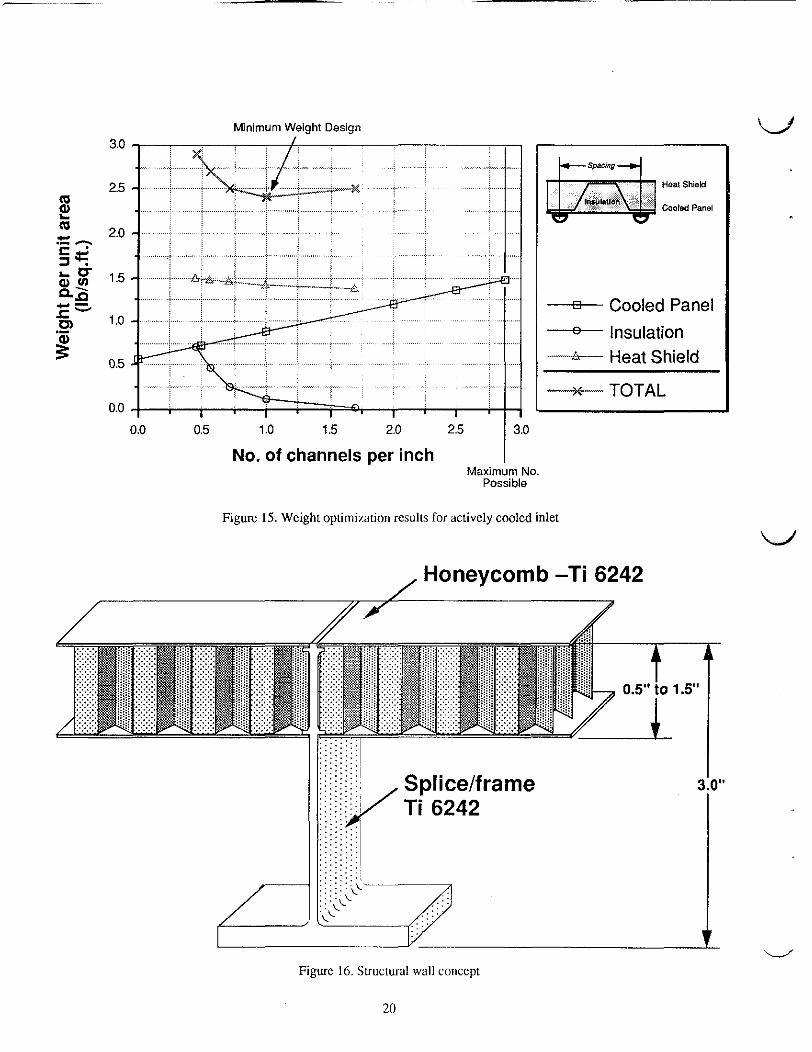
A schematic of the cooling system, as modeled in the thcrmal management system, is shown in figure 14. Power for the fuel pump and other aircraft systems requirements are derived horn the turbine shaft while the turbojet is operating and from a fuel expansion turbine whcn thc ramjet is operating. Both sources are available during transition. Analysis has shown that the powcr generated by the fucl turbine is much greater than the power needed to drive the fuel pump during Mach 5.0 cruise. Engine start and engine-out power will be obtained from an auxiliary power unit (APU). Results of the weight optimization study of the inlet cooling concept are shown in figure 15. The ramjet combustor and nozzle cooling circuit was analyzed using :I computer program called NASP/SINDA (Ref. 11). Fuel properties were obtained from thc Supcrtrapp fluid properties software (Ref. 12).
Onc of the most d cult problems for the thermal management system is cooling of the aircraft during high-speed deceleration. Thrust must be reduced which results in less fuel needed for combustion, while the hcat loads remain high. Thc hcat load to the combustor is reduced by turning off the outer fuel injectors. A layer of air would act as film cooling near the wall with combustion taking place in lhc ccnter core of the ramjet combustor.
AIRFRAME STRUCTURE DESIGN AND A N A L Y S I S
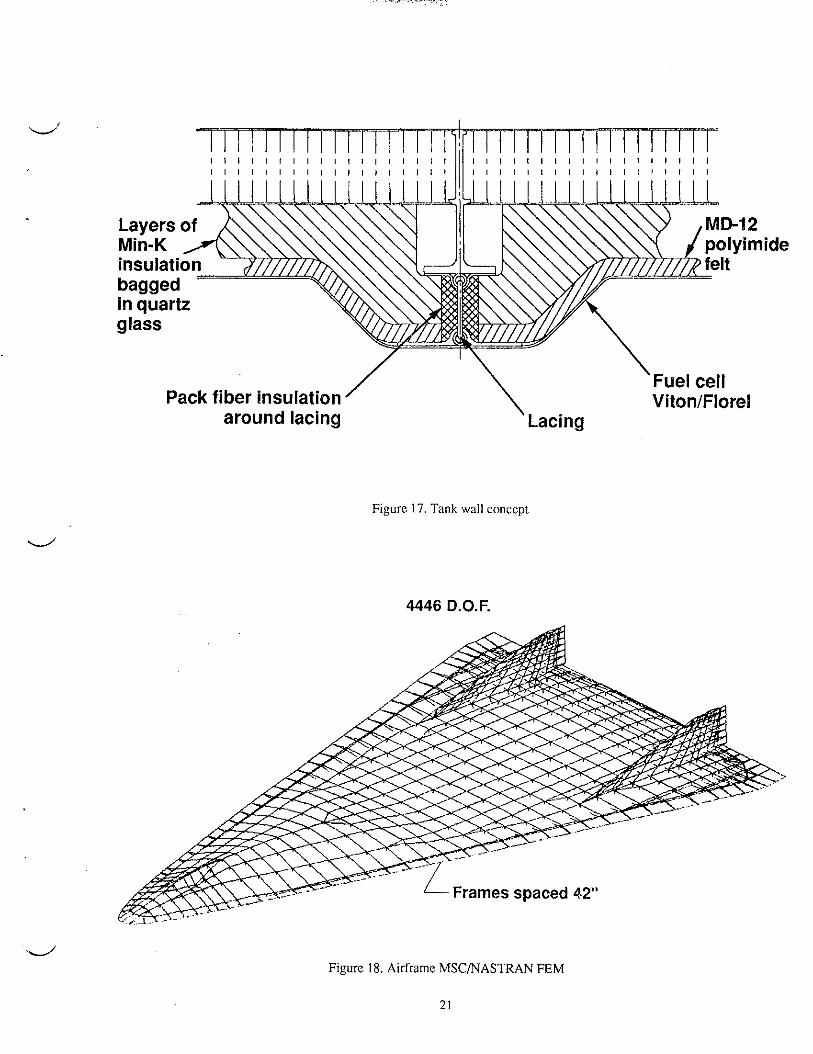
Structural Concept and Materials. The Mach 5 cruise aircraft was designed as a hot structure with integral tanks lined with insulation and containing flexible fuel cells. This concept was selected by GD for its simplicity, high structural efficiency, light weight antl Icak-frcc fucl containment.
Honeycomb sandwich pancls were sclcctcd for airframe skins because they provide a lightweight structural solution requiring only modest ringframes between lhe major frames and bulkheads. This concept uses skin pancls typically 42 inches wide by several feet in length that arc welded to intermediate frames to create large panel assemblies. This approach provides lighter joints antl improved vehicle smoothness which should rcducc
L)
W
4
drag and local heating. structural wall concept for the airframe.
Material choice for the airframe structure was driven by the maximum structural temperatures resulting from aerodynamic heating (mostly 800-900°F). This allowed the use of a monolithic titanium alloy, Ti 6242, which provides reasonable strength and modulus of elasticity. Wing and tail leading edges are more severely heated (1,300-1,500'F), so a metal matrix material is used which has silicon carbide fibers in a titanium-aluminide alloy matrix with a maximum temperature capability to 1,500"F.
Fuel Tank Concept and Materials. The chosen design uses flexible fuel cells within the integral tank. This allows the airframe to be completely assembled before installing the fuel cells, simplifying construction. Also, these tanks will be lighter than an equivalent, conformal graphite epoxy tank. Finally, since standard fuel cell materials can be used at the desired operating temperature (<250°F), their use will further reduce cost and weight. Rigid insulation will be used to protect the fuel cells from the hot airframe. The insulation scheme selected is depicted conceptually in figure 17.
Structural Analysis. Structural analysis of the Mach 5 cruise aircraft was accomplished using the f in i te -e lement s t ruc tura l analysis code , MSC/NASTRAN. The finite-element model (FEM) described here was developed from the configuration surface geometry with additional features for the internal structure obtained from the structural design layout within the CAD database. The resulting FEM surface definition also provided the model for use in developing inertial and aerodynamic load dah.
The aircraft mass distribution was applied to the entire vehicle model as a function of cross-sectional area versus length. The distributed mass included all of the initially predicted dry weight. The fuel masses were applied in the location of the fuel tanks as a function of the volume of each tank. Fuel was assumed to be burned uniformly from all tanks.
Loads analysis was done with the objective of reasonably bounding the required vehicle design envelope. Simplifying assumptions were made to limit the extent of analysis to a level consistent with advanced conceptual design. Therefore, twelve load conditions were selected from taxi through Mach 5.0 to represent the design envelope. The structural E M , as shown in figure 18, consisted of 2,291 elements with 4,446 degrees of freedom (D.O.F.).
Figure 16 illustrates the u'
'd
Structural panel sizing was accomplished using GD proprietary computer codes, which work with the d
NASTRAN FEM data and force output, to size each structural element. The panel sizing code uses temperature dependant material properties and generates panel forces due to the applied thru-thickness temperature gradients. Initially, the 0.020 inch minimum facesheet thickness of the Ti 6242 honeycomb sandwich panels appeared thick, but the combination of heavy biaxial loads and tank pressurization resulted in reasonable utilization of the material and the costly practice of chemical milling to get thinner gages was thereby avoided. Additionally, the extensive use of welded-in-place frames reduced the amount of parasitic panel close-out material normally associated with joints in mechanically fastened honeycomb sandwich-panel construction.
Finally, a study was made to determine optimum frame spacing. This study evaluated the weights for the honeycomb skin, as well as the frame, based on strength and global buckling checks at frame spacings of 36, 42, and 48 inches. It was determined that a spacing of 42 inches was optimum.
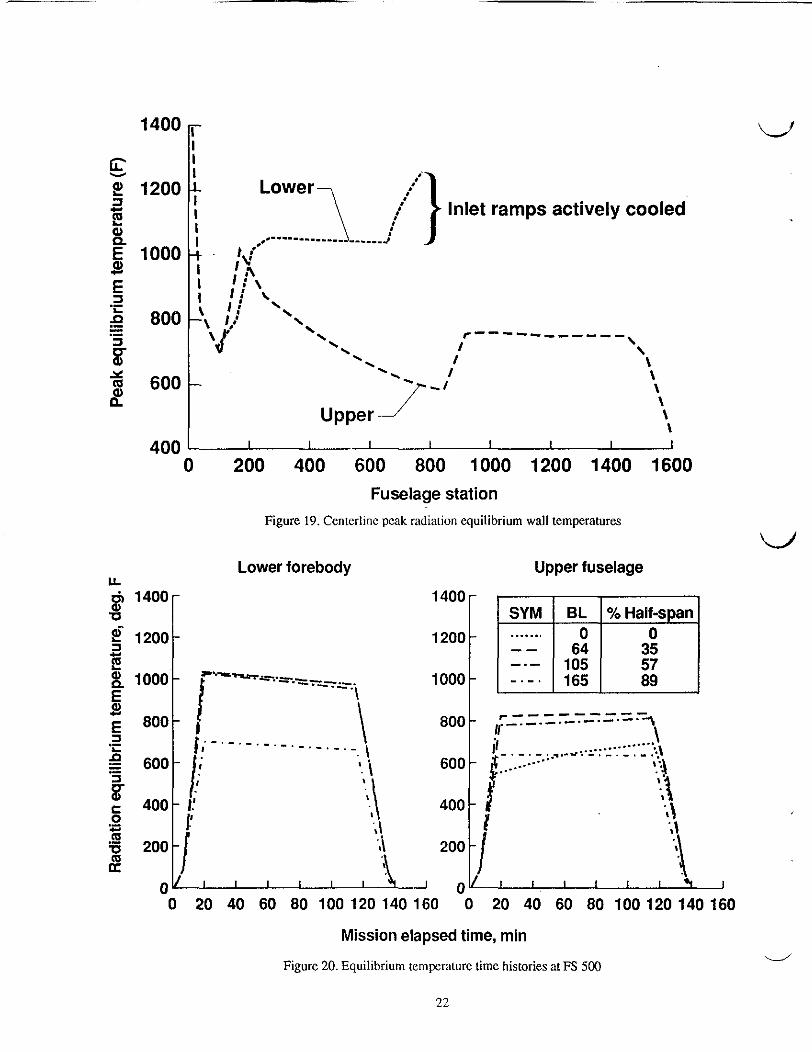
Aeroheating Analysis. Aerothermal analysis of the vehicle consisted of two primary tasks: Providing local heat transfer data at specific locations on the fuselage and generating acreage heating data over the majority of the external vehicle surface for the entire design mission. Initial aerothermal analysis centered around providing preliminary heating data to allow determination of forward, middle, and aft tank bulk fuel temperatures. For most of this analysis, the GD ASHAB code was used to determine heating to the midpoint of each fuel tank on both the upper and lower fuselage surfaces. All predictions for the lower forebcdy portion of the preliminary fuel tank insulation analysis, the detailed thermal modeling, and the global heating analysis were performed using the new GD BART engineering code. BART is similar in concept to the NASA MINIVER code (Ref. 13) but provides additional flexibility in input and output.
A number of assumptions were required in performing the aeroheating analysis. Air was assumed to behave as a perfect gas in all flowfield calculations. The boundary-layer transition criterion was based on flow over a cone under the assumption that transition starts when momentum-thickness Reynolds number divided by local Mach number equals 150. The length of transition was assumed to be 1.5 times the Reynolds number based on the length from the nose at transition. The Eckcrt reference enthalpy-turbulent heating method was used for turbulent acreage regions. For leading edge bcating calculatims, the laminar heating method ol Fay & Riddell was employed. Radiation equilibrium wall temperatures WETS) were calculated assuming a surface emissivity of 0.80. Calculations were made for 880 body locations at each time step in the trajectory.
Conical flow Mangler transformation factors werc used over the entire geometry and raised peak RETs by approximately 30'F in turbulent regions, and by almost 300'F in the laminar regions compared to the Pat platc assumption. Tangent cone pressures were used for all locations. Initially, discrete conical shocks wcre employed for cach of the compression ramps in thc inlet, but due to thc reduction in local Mach nuinbcr through the series of shock waves off each ramp, it was discovercd that. the rcsulting surface pressurcs wcre actually lower than if the shocks were ignorcd. For conservatism, the inlet ramps were treated simply as body panels without additional treatment for ramp shocks.
Preliminary heating analyses for discrete geomctric locations were performed on both the upper and lower fuselage. Figure 19. shows peak RETS for the uppcr and lower centerlincs of the vehicle. Boundary-layer transition occurred relatively early for both centcrlincs, near fusclage station (FS)135. The propulsion flowpath compression ramps wcrc considered part of thc inlet structure and were actively cooled, so thc RETs shown in that region were not used to size insulation. The upper centerline showed an initial peak of 1,022"F as the flow became turbulent on the facc of the cockpit bulge, but as the flow expanded over the top, the RETs decreascd to approximately 590'F at thc cnd o l thc bulgc. By FS 906, a recompression had takcn place which increases RETs to approximately 750'F 011 the aft upper fuselage. A final expansion occurcd at thc trailing edge of thc vehicle, dropping RETs sharply. Heating was reasonably uniform on the lower Corchody . with a drop in RETS inboard of the leading edgc where the boundary layer remaincd laminar.
Figure 20 shows representative equilibrium tempcraturc timc histories for four spanwise locations at or nciir FS 500. Of primary interest in this figure are the rapid heat-up and cool-down rates near the bcginning and cnd of thc mission and thc very long cruise timc during which thc vchiclc is cxposed to near-maximum hcating. The slow dccrcase in lower-surfxc RETs and incrcaK: in upper-surfacc RETs during the cruise phasc was doc to a stcady drop in angle-of-attack a s the vehicle lucl load was consumed.
Thermal Analysis. Thc thcrmal modcling clfort consisted of two tasks. The first was a prelimiriary evaluation of insulation requirements to maintain lucl temperatures below vaporization levels for thc tank pressurization schedulc. The second focuscd on dcrailcd thermal modeling o l the proposed structural conccpc to cnsurc that internal structural temperature limits for thc fuel tank bladder were not exceedcd and to dctcrininc temperature gradicnts in the honeycomb strucurc lor vchiclc structural analysis.
A preliminary analysis was conducted to determine :L/" insulation requirements to limit fuel temperatures to the Iowcst saturation temperature consistent with the in- flight tank pressurization scheme. The insulation selccted was Manville Min-K (Type 1301). The lowest saturation temperature corresponded to 280F which would occur at a minimum tank pressurization of 4 psia.
A onc-dimensional, transient SINDA model was formulatcd for each of the three regions of the tank forward, middle and aft. The decrease of fuel mass in thc tanks due to fuel consumption was considered in the analysis. The lower fucl cell surfaces of the tanks were assumcd to be completely wetted by the fuel for the duration of the mission. The upper fuel cell surfaces of the tanks wcre assumed to be uncovered by the fuel and could only radiate to the lower surface and subsequently to the luel. The final results indicated an insulation thickncss of 0.75 inches for the bottom surfaces of the vehiclc and 0.50 inches for the top surfaces. The rcsulting fuel temperatures did not exceed 260'F, except marginally in the nozzle region late in the flight.
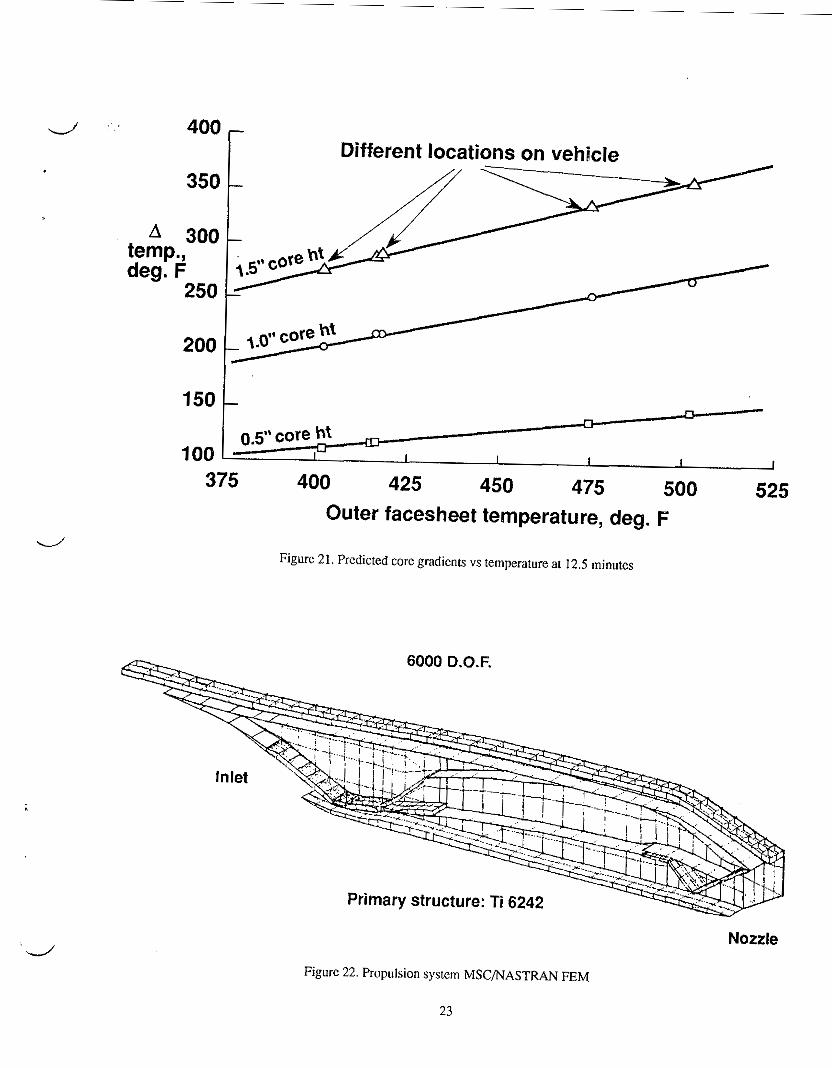
Thc sccond thermal analysis task was to calculate the outcr honeycomb facesheet temperatures, the inncr honcycornb facesheet temperatures and the average tctnpcratures for the joinvframe members. A primary concern was the variation in honeycomb core height throughout thc vehicle. The variation was required to mcct local structural requirements. To predict thc rcquircd ccmpemtures and gradients, a thermal/structural analysis was performed.
The structural wall concept is shown in figure 16. A major concern was the choice of insulation for use bctwecn thc honeycomb panel and thc fuel tank. The purposc of this insulation was to minimize the hcat absorbed by the fuel and to maintain the flexible fuel cell under its temperature limit. Structurally the insulation must bc capable of coinpressivc loading from Cue1 weight and tank pressure, which focused attention away from conventional blanket insulations to moldable insulations. A moldable form of Min-K 1301 was chosen lor usc as the primary insulation. It is suitable for continuous usc at temperatures up to 1,300'F. To protcct thc moldable insulation from mechanical abrasion or erosion, the insulation was wrapped with quartz fiber bagging to minimize direct contact between thc insulation and the vchicle structure. Additionally, 1/4 inch of Pyrope1 MD-12 insulation was substituted itnmcdiately next to the flexible fuel cell. This matcrial is a rigitlized polyimide fiber felt and will assist in cvcnly disuibuting the compressive loading on the Min- K. MD-12 is usable up to SS0'F for continuous operatioit.
L/
6
A review of external heating conditions and honeycomb panel requirements identified five locations on the vehicle which bounded the range of heating conditions and the thru-thickness gradients due to the heating. They were FS 435 (upper surface), FS 514 (lower surface), FS 559 (lower surface), FS 900 (upper surface) and FS 1,400 (upper surface). These locations were thermally modelled and analyzed considering honeycomb core heights of 0.5 inches, 1.0 inches and 1.5 inches. A two dimensional SINDA thermal model was constructed of the joinvframe area of the vehicle. The model had approximately 300 nodes and 550 conductors.
Heat transfer through the honeycomb core was modeled utilizing an effective thermal conductivity which accounts for combined conduction and radiation effects. Modeling the fuel presence was necessary because it moderates the bladder temperature response. It was assumed that the upper portion of a fuel cell could only radiate to the fuel mass or through the fuel to thc bladder portion of the tank underneath it. For the lower portion of the bladder, a convection coefficient of 25 BTU/hr*sq.ft.*'F was used to thermally connect the bladder to the fuel temperature.
The detailed thermal modeling confirmed the results of the earlier insulation sizing. An insulation thickncss of 0.5" was used in modeling the upper portions of the fuel tanks. This thickness maintained fuel cell temperatures below their limit. Likewise, an insulation thickness of 0.75" was found to be adequate for the lower surface. Substitution of MD-12 insulation for a portion of the Min-K insulation had no significant impact on overall structural temperatures.
Results of the detailcd thermal analysis indicate that the previously calculated RETS were only about 20°F to SOOF higher than the predicted surface temperatures from the thermal model. Therefore, the RETS could he conservatively used for outer facesheet temperatures at all locations on the vehicle. Analysis results from the run matrix were tabulated as honeycomb core gradients versus outer facesheet temperature. A nearly ideal lincar variation of thru-thickness gradient with outer facesheet temperature was observed for any given core height. Figure 21 shows a typical set of those plots. These relationships were utilized to define the structural temperature gradients as a function of core height for use in the structural analysis. In a similar manner, a gradient was defined betwcen the outer surfacc temperature and a point located at the center of thc splice/frame support.
d
d
PROPULSION STRUCTURE DESIGN AND ANALYSIS
Figurc 8 shows the two-dimensional layout of the d propulsion geometry. The propulsion structure must
provide integrated loadpaths and must also be designed to accommodate the kinematics and react thc loads of the variablc geometry. In order to compute internal forces and moments used for structural design, a complex finite-element model ( E M ) of this geometry was created as shown in figure 22, except for turbojet inlet and afterburner ducts which are addressed in a following section. The completed FEM consisting of 2,205 elements and 6,000 D.O.F. was loaded and analyzed for Mach 2.5 and 5.0 flight conditions and every structural panel was loaded with the appropriate operating pressure and temperature. The temperature of the structure was set equal to the backside temperaturc of the cooling panel which was calculated in the thermal management system analysis.
The MSC/NASTRAN model was used to compute internal forces and moments for each load case. These loads were utilized in ST-SIZE, a LaRC developed code (Ref. 14), to perform the structural sizing of cvery element in thc FEM. Resulting element sizes were uscd to create new FEM properties and the analysis repeated in an iterating fashion until the structural weight converged. All analysis was performed using temperature-dependent material properties (from Mil Handbook 5) for the titanium alloy material, Ti 6242.
Final structural weights arc determined by estimating those weights not directly addressed by the structural model. These weights include such components as actuators, insulation, hcat exchanger panels, and manifolds and plumbing. Actuator weights were cstimatcd based on current tcchnology ball-screw actuators.
The turbojet inlet and afterburner ducts werc not includcd in the main FEM because they were each designed of different materials and required siatically determinate, independent mounting schemes to allow for thc differential thermal growth. These ducts wcrc sized with indcpendent FEM's. With thc duct prcssures encountered, the minimum weight dcsign is a ringframe stiffened honeycomb. Thc inlet duct was chosen to be unprotected graphite polyimide with a 20 inch nominal ringframe spacing.
The afterburncr pressure case was constructed of Inconcl 718 with a 10 inch ringframe spacing. Inconcl 718 has cxcellcnt properties to about 1,200"F so thc afterburncr will be cooled with fuel to keep it below this limit. The resulting afterburner design required ringframes on a IO inch spacing to contain the maximum intcrnal prcssurc of approximately GO psi.
WEIGHTS
The weight input for the aircraft is shown bclow in cquations 1-6.
I
Dry weight,
where WsT, W,,, W,,,andWsu, are the wcights for the structure, propulsion system, landing gear, and subsystems, respectively.
Empty weight, w~ = wu + wu
where W, is the useful load and is composcd of the crew weight of 250 pounds, the payload of 10,000 pounds and trapped fuel.
where Wl,,ol, is the propcllant weight,
The structural analysis performed on the aircraft provides the basis for calculated structural weights; propulsion weights werc provided by P&W. Empirical weight relationships are used on other areas such as subsystems, landing gear and trapped fuel. Thcsc weight algorithms were taken, in part, from rcfercncc 15 and are givcn below as:
Table 2 provides a summary of thc individual wcights for the aircraft (with inlet blccd) with a gross wcight o l 551,052 pounds. This yiclds a gross propcllant wcight of 408,946 pounds. An assumed ullage factor of 4 percent gives 3 useable propellant load of 392,588 pounds and a propellant fucl fraction of71.2 pcrccnt.
PERFORMANCE
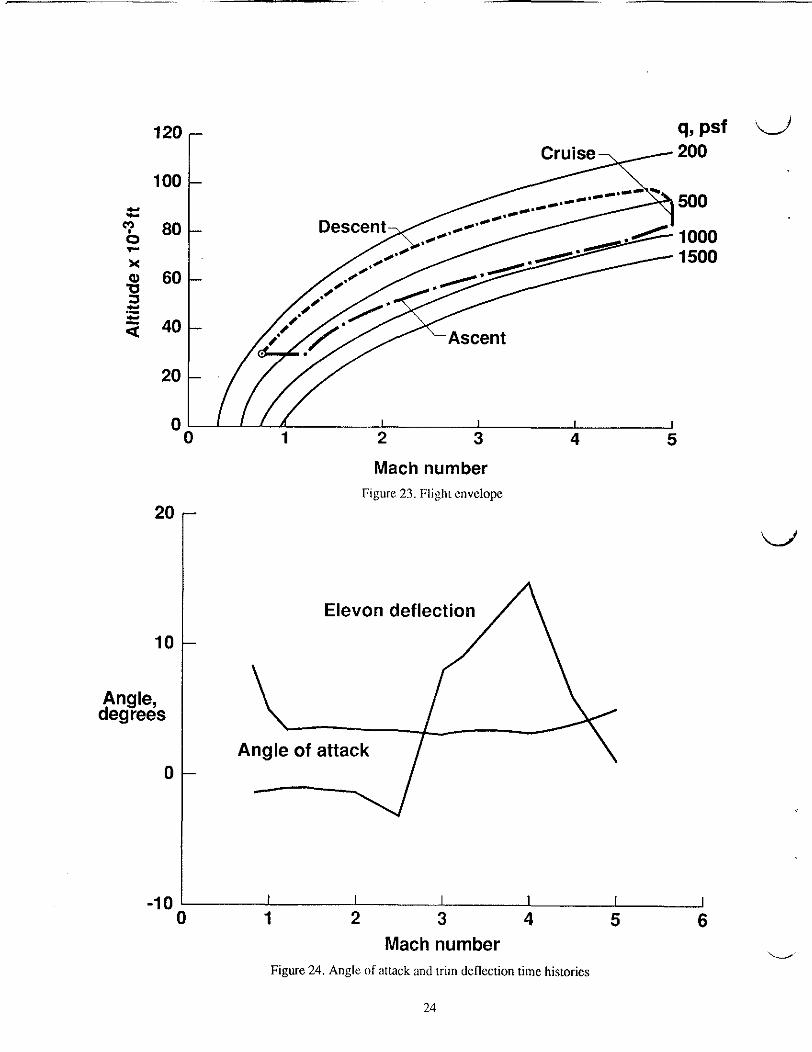
To facilitate lhc analysis, thc lanker-to-tanker mission was broken into three main segmenw ascent, cruisc and descent. The simulation was run using thc NASA LaRC dcvclopcd CSOTAV codc. This breakdown facililatcd the use of an energy inethod Cor ascent, :I Brcguel method for cruise and a reverse energy inclliod for descent. A prcscribcd Mach-altitudc profilc was input for ascent observing the transonic d y n m i c pressure and the ramjet duct pressure 1imil.s. Thc cruisc leg was to be flown at optimum altitudc for maximum
specific range, closely approximating a traditional Lj Brcguct cruise-climb profile. However, the ramjet duct pressurc limit forced the vehicle to fly at altitudes highcr than optimum initially, but as vehicle weight decrcased, the optimum altitude eventually rose above this constraint. Descent was flown, upon a brief pull- up maneuver to lower dynamic pressure, from end of cruise to Mach 0.8 at 30,000 feet using minimum power settings. The vehicle was trimmed during the entirc mission using elevons.
S m t of mission gross weight and empty weight used in thc performance analysis was 551,052 pounds and 142,106 pounds, respectively. Total useable fuel quantity for this design has been calculated at 392,588 pounds. Inlet boundary-layer bleed of 8 percent was asslimcd for the ramjet mode. This turns out to have a significant impact on range and will be discussed later.
Propulsive moments for the turbojet and turboramjet combinations were providcd by LeRC up to Mach 3.0. Thc SRGULL code was used to generate moments for thc ramjet mode from Mach 3.0 to 5.0. Basic unuiinincd aerodynamic moments were provided by GD from Mach 0.8 to 3.0 and by in-house analysis from Mach 3.0 to 5.0.
Figurc 23 shows the Mach-altitude schedule for this mission. Angle-of-attack and elevon deflection histories for asccnt are shown in figure 24. Maximum elevon tlcflcction during cruise was -5.9 degrees (trailing edge up) which was well within acceptable limits. Net thrust and drag histories and installed Isp and effective Isp histories can be seen in figures 25 and 26.
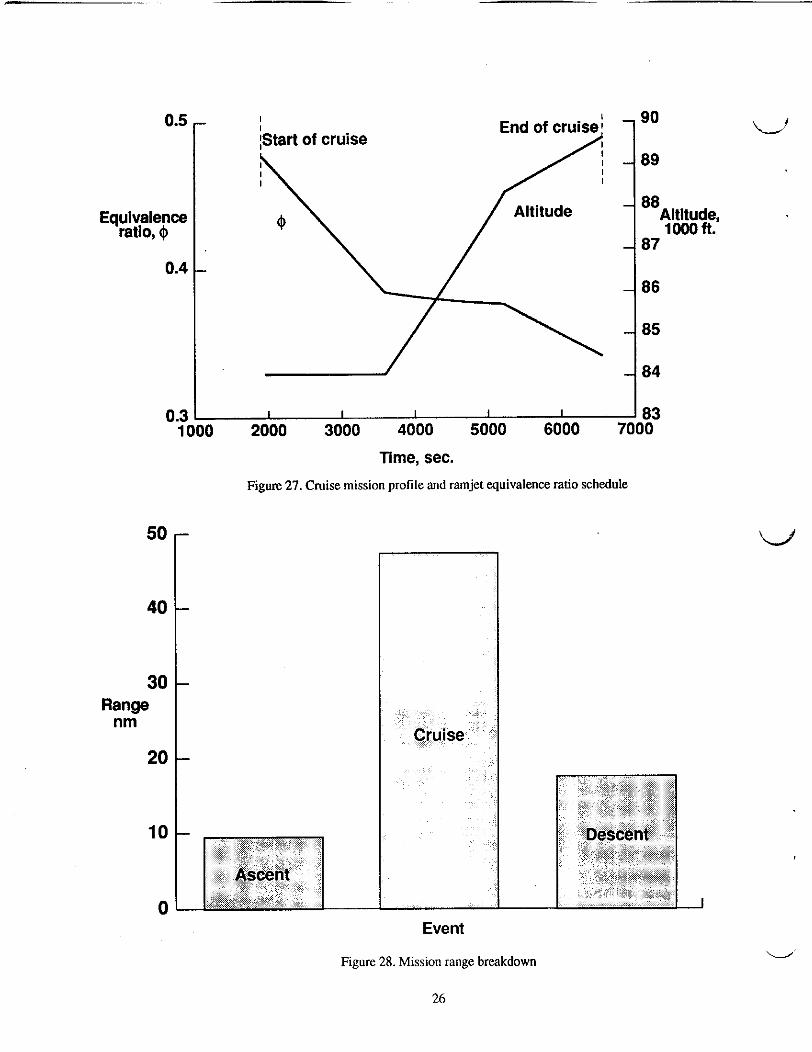
Maximum cruise range was achieved by operating at conditions where specific range (Rsp=V*L/D/sfc) was maximum. This entailed continuously adjusting thc altitude as the vchicle wcightdecreascd and resullcd in a climbing cruisc flight profilc. As noted carlicr howcvcr, the intial part of the cruise was donc at constant altitude. Throttlc scttings wcrc thcrcforc a fallout for cruisc by setting thrust equal to drag, where throttle setting is the fucl cquivalcnce ratio (phi) for the ramjct. Equivalence ratio and altitude historics for cruisc iirc shown in figurc 27. Minimum phi at which burning can be sustained for the ramjet is .3.
Dcsccnl was performed by throttling back to minimzc powcr sctting. Duc to the fact that thc cngines were sized to provide adcquatc thrust during acceleration, thcir m i n i m u m thrust lcvcls wcre relatively high, resulting in low dccclcration raler, and in turn led to a significant range for dcsccnt. It may be more efficient, however, to gcncratc range during Cruise using some of this descent fucl. This would require rcducing minimum thrust somchow, thereby incrcasing dccclcration ratc and
i-J
rcducing dccclcration timc. u
8
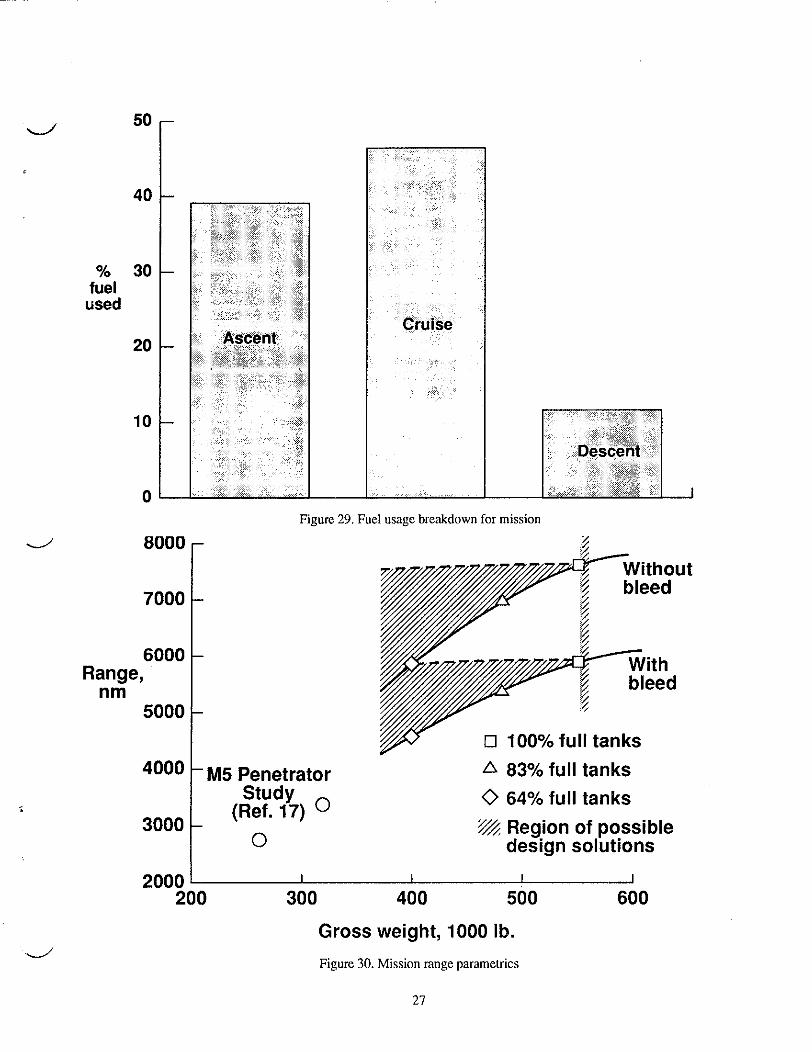
'U' Total mission rangc for the case with ramjct inlct bleed is 5,905 nm whcre 740 nm is 'accrucd during ascent, 3,769 nm is accrued during cruise and 1,396 nm is accumulated during dcsccnt as shown in figurc 28. Fuel usage breakdown can bc secn in figurc 29. Thc mission was also flown assuming no inlct boundary layer bleed for the ramjet modc. The total rangc for this case is 7,600 nm. This, of course, is unrcalistic becausc thc inlet would havc scrious opcrability problcms without blecd and only rcprcscnts a limiting casc. Shown in figure 30 are mission ranges for partially filled "as- drawn" vehicles for both ramjet blccd and no-bleed cases and are represented by thc solid lincs. This was a crude attempt at dctcrmining the rangc for smallcr sized vehicles. Thc lines rcprcsent a lowcr limit sincc thcse vchicles carry C X C ~ S S wcight and drag to contain the empty volume. The shadcd arca abovc thcsc lines rcprescnt potential rangc improvcinents lor down-sized vchicles.
A preliminary takeoll and landing analysis was pcrformcd to scc i f the vchiclc inccts thc gencral rcquircmcnu of MIL-CS01 1 A. An empirical approach was uscd to determinc the "balanced field length" distance (Ref. 16). This showed that for a gross takcoff weight of400,000 pounds and a takcoff lift cocfficicnt of 5 8 , a takeoff distlmcc to clear a 50-foot obsvaclc was 7,500 feet. Thc takeoff specd was calculatcd to bc 209 knots which is well within thc prescnt tirc dcsign capability. A landing spccd was calculatcd assuming a landing wcight 5 pcrccnt grcatcr than thc crnpty wcight and a 10' anglc-of-attack. This rcsultcd in ap. approach spccd of 181 knots ovcr a SO-foot obstaclc clc. drmcc. '
Although this prcliminary analysis docs not includc scribility and control cflccts at high angles-of-attack, i t does indicate a vchiclc which has normal takcoff and landing characteristics.
4
CONCLUDING REMARKS
This effort rcprcscnts thc first iteration of a waveridcr- dcrivcd Mach 5 airplanc design using fuselage intcgratcd-undcrslung ovcrhndcr turboramjcts with cndothcrmic fucl. This dcsign study is comprchensivc in that all major disciplines arc considcrcd and couplcd, at lcast to first ordcr. Thc initial rcsults arc promising in that a maximum tanker-to-unkcr rangc (without inlct blecd) of approximately 7,600 nm was achicvcd for a gross wcight of 550,000 pounds, an cmpty wcight of 141,000 pounds and a vchiclc lcngth of 135 fcct. Thc focus of this study was on an "as drawn" vchiclc. No attempt has yet becn madc to scalc down thc aircraft to find thc optimum rangc. Initial examination of rangc potential with reduced fucl load indicatcs downsizing may bc dcsircablc.
Much optimization is yet required to establish the full potential of this class of aircraft. The shape evolved mainly through aerodynamic considerations. Acrodynamic prediction methods that fully capture the waverider lift at the design point must be utilizcd. Also, thc engine integration and engine sizing must be morc influcntial in designing the vehicle in thc next iteration, and overall vchiclc sizing must be put into "play."
The impact of advanced technologies on the design must also be considered. For instance, the transonic drag, which sizes the turbojets, could be reduced dramatically if external burning of the endothermic fuel is a viable option. Thc engine weight and complexity could also be reduced with more advanced combined cycle propulsion concepts which would have higher thrust-to- weight potential. Redesigning the inlet to spread the shocks and thus climinatc or rcducc Ihe bleed would bc a tremendous asset.
The airframe structural design/wcight was based on monolithic, state-of-the-art, titanium material. Advanccd composite titanium-aluminidc materials being devcloped by thc National Acro-Spacc Plane program would rcducc thc airframc structural wcight substantially.
ACKNOWLEDGEMENTS
* Denis Medwick and the Hypersonic Aero Group at Pratt & Whitney for their work on the turboramjct propulsion system and engine cooling.
* Mikc Barnhart and his Structurcs Tcchnology team at General Dynamics, Fort Worth, for their effort dcvcloping thc vehicle structural dcsign.
REFERENCES
I . Vance, M.: Hypersonic Vehicles' National Security Value Assessed From The Global Geopolitical Climate. McDonncll Aircmft Company Report, MDC 91B0518, Rev A.
Bowcutt, K. G.: Anderson, J. P.: and Capriotti, D.: 2. Thc Viscous Optimized Hypersonic Wavcridcrs. AlAA Papcr 87-0272, 1987.
3. Kim, B. S.: Rasmussen, M. L.; and Jischke, M. C.: Optimization of Waveridcr Configurations Gcnerated from Axisymmctric Conical Flows. Journal ol Spacccraft and Rockcts, Vol. 20, No.5, Sept.-Oct. 1983.
4 . Rasmussen, M. L. and Stevens, D. R.: On Waverider Shapes Applicd to Acro-Spxc Planc
9
Forebody Configurations. AIAA Paper 87-2550, 16. Loftin, L. K.: Subsonic Aircraft: Evolution and he Matching of Size to Performance. NASA R P 1060, August 1980.
"W' August 1987.
5. Stevens, D. R.: Practical Considerations in Waverider Applications. AIAA Paper 92-4247, August 1992.
6. Bonner, E.; Clever, W.; and Dunn, K.: Aerodynamic Preliminary Analysis System, Part 1 Theory, NASA CR-165628, April 1981.
7. Bauer, S. X. S.: Covell, P. F.; Forrest, D. K.; and McGrath, B. E.: Preliminary Assessment of a Mach 4 and a Mach 6 Waverider. Proceedings or the 1st. International Hypersonic Waverider Symposium, October 1990
17. Cassidy. M.D.: Performance Sensitivities of a High Altitude Mach 5 Penetrator Aircraft Concept. NASA CR 3932, September 1985.
8. Hunt, J. L.; Johnston, J. M.; Cubbagc, J. M.: Dillion, J. L.: Richie, C. B.; and Marcum, D. C.: Hypersonic Airbreathing Missile Concepts Undcr Study at Langley. AIAA-82-0316, January 1982.
9. Pinckney, S. Z. and Walton, J. T.: Program SRGULL An Advanced Engineering Model for h e Prediction of Airframe-Integrated Subsonic/ Supersonic Hydrogen Combustion Ramjet Cyclc Performance. NASP TM 1120, January 1991
10. Anon.: Information about Sylthcrm 800 HcaL Transfer Liquid. Dow Corning Corp., Form No. 22-761G-86, Midland, MI., 1985.
11. Pctley, D. H.; Jones, S . C.; and Dziedzic, W. M.: Integrated Numerical Methods for Hypersonic Aircraft Cooling Systems Analysis. AIAA Paper 92-0254, January 1992.
12. Ely, J. F. and Huber, M. L.: NIST Thermophysical Properties of Hydrocarbon Mixtures Databasc (SUPERTRAPP). Ver.1 .O, U.S. Department of Commcrcc, February 1990.
13. Engel, C. D. and Praharaj, S. C.: MINIVER Upgrade for the AVID Systcm, Vol. I . , NASA CR- 172212, August 1983.
14. Moses, P. L.; Spoth, K. A,; and Collier, C. S.: Structural Analysis and Weight Predicdon for Advanced Hypersonic Vehicles. Proceedings ol thc ASME Winter Annual Meeting, Dallas, TX., November 1990.
15. Swanson, E. E.: Single-Slage-To-Orbit Structure and Subsystems Weight Estimation Equations. PRC Kentron, February 1986.
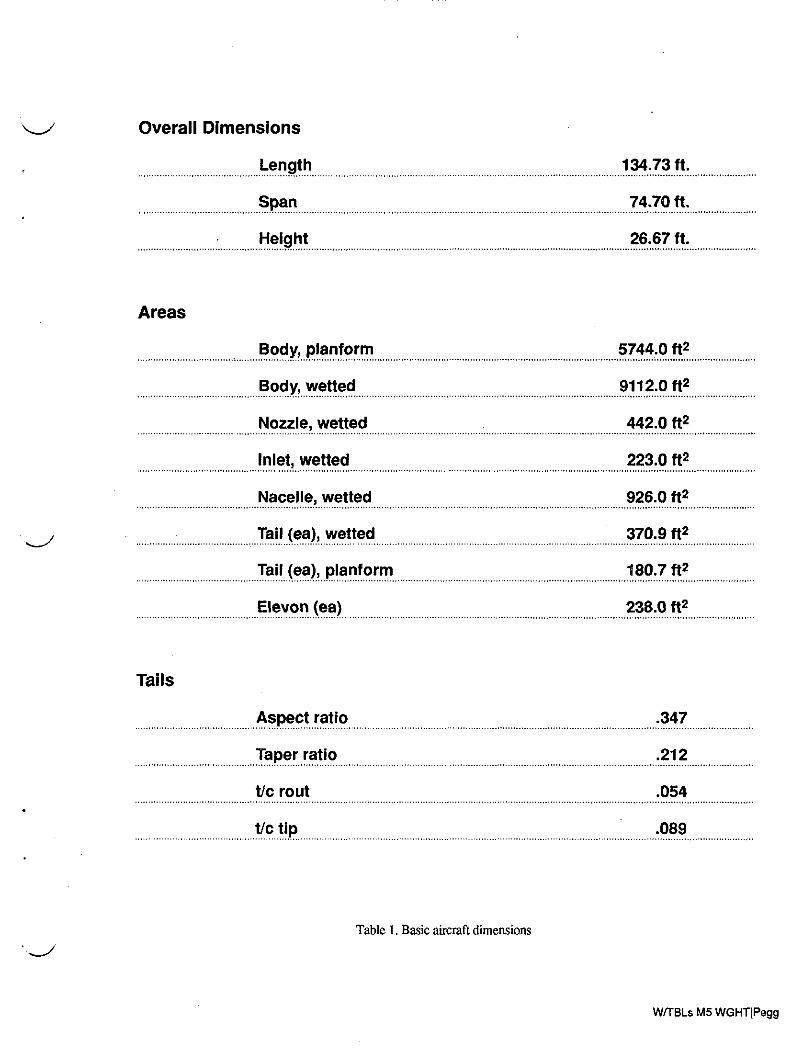
Overall Dimensions
Length 134.73 n. ...............................................................................................................................................................................................
...... ....
Height 26.67 ft. ............. .................................................. .........................................................................................................................................................
Areas
Body, planform 5744.0 n2
9112.0 n2
.................................... j ...................................................................................................................................................................................................
................................................ ......... ..... ....... Body, wetted
Nozzle wetted 442.0 ft2 ...
..... 223.0 n2 Inlet wetted
Nacelle, wetted 926.0 n2
............. ......... ........
.......................................................................................................................................................................................................................................
...........
Tail (ea), planform 180.7 n2 ........................................................................................................................................................................................................................................
Elevon (ea) ................................................ 238.0 ft2 ....................................................................................................................................
Tails
.347 ......... .......... .................................................................... Aspect ratio
Taper ratio
tlc rout
tlc tip .089
........................................................................................................
....................................................................................................................................................................
....................................................................................................................................................................................................................................
Table 1. Basic aircraft dimensions
W/TBLs M5 WGHTlPegg
STRUCTURE ......................................................................................
Vertical tails
Airframe
.....................................................................................
Engine primary structure ......................................................................
Thermal ..............................................................
Landing gear .................................................................
Propulsion ............................
Fuel system
Ramjets
. . . . . . . . . . . . . . . . . . . .
...................................................
Turboiets
Subsvstems
Dry weight
Useful load ... ....................................................................................
Crew
Residual fluid ....................................
Payload
EmDtv weiaht
Prsoellant weiaht
Gross weight
... 72,037 ................................................................................................
1,850
42.125
...........................................................................................................
13,500
14,562
................................................................................................
.................................................................... ....
7,816 ............................................................................................
. . ........................................................
1,127
9,214
14.973
...........................................................................
.........................................................................
23,972
129,139
. . 12,967 .................................................................................................
250
I ..................................................................................... 2,717
10,000
142.606 I 408.946 I 551,052
Table 2. Weight statcment (with inlet bled)
WRBLs M5 WGHTlPsgg
Mach 5 and best altitude cruise --,
\
Range
loiter Figure 1 . Tanker-to-tanker mission profile
75' LE sww
E d
.O'
Figure 2. Aircraft three-view
13
350 r
f-- 134.7ft
Cross- sectional
area, ft2
0 200 400 600 800 1000 1200 1400 1600 Fuselage station, in.
Figurc 3. Aircrafl area distribution u i
14
v 0.28
0.24
0.20
0.16
0.12
0.08
0.04
0.00
CL
'd
-
-
-
-
-
-
-
-
'4
UDP
---+ HABP
-0.04 I I I I I I
0 1 2 3 4 5 6 Mach
0.14 - 0.6
0.12 -
0.10 -
0.08 -
Figurc 5. Airframe CL vs Mach
-,
CD
0.06 -
0.04 -
0.02 -
-0.04 I I I I I I
0 1 2 3 4 5 6 Mach
0.14 - - 0.6
0.12 -
0.10 -
Figurc 5. Airframe CL vs Mach
-=-a?- n ,,> - 0.4
- 0.2 CD
0.08 - CL - 0.0
0.06 -
0.04 - Experimental data
0.02 -
0.00 I I I -0.6 -20 -1 0 0 10 20
Alpha, deg.
- -0.2
MN
-0- 2.16 -E- 1.5 - -0.4
Figure 6 . Reference flat top waverider windtunncl lift and drag characteristics
0.4
0.2
CL 0.0
-0.2
-0.4
0.00 I I I I 1-0.6 -20 -1 0 0 10 20
Alpha, deg. Figure 6 . Reference flat top waverider windtunncl lift and drag characteristics
15
0.04
0.03
CD
0.02
0.01
0.00
Sref = 5754 ft'
I I I I I I 1 2 3 4 5 6
Mach 'U
Figure 7. Adjusicd airlratnc C g vs Mach
Turbojet augmentor Fixed external
Fixed external ramps
TJ flow diverter
Figure 8. Propulsion sysicm schematic
16

d 200
150
50
0
2000
1800
ti I4O0 rn 1200
1000 0
1 2 3 4 5 Mach number
Figure 9. Ascent thrust
1 2 3 Mach number
Figure 10. Ascent specific impulse
4 5
17
Turbojet engine bay Avionics/
*--*-
Indirect cooling using -1 - Direct fuel cooling Syltherm 800
Figure 11. Thcrmal managerncnt system
Panels: P7-Pl0, & P1 1 - movable
Panels P12-P16 -stationary
Ramburner width - 4 5
Figure 12. Location of cooling panels for ramburner and nozzle
18
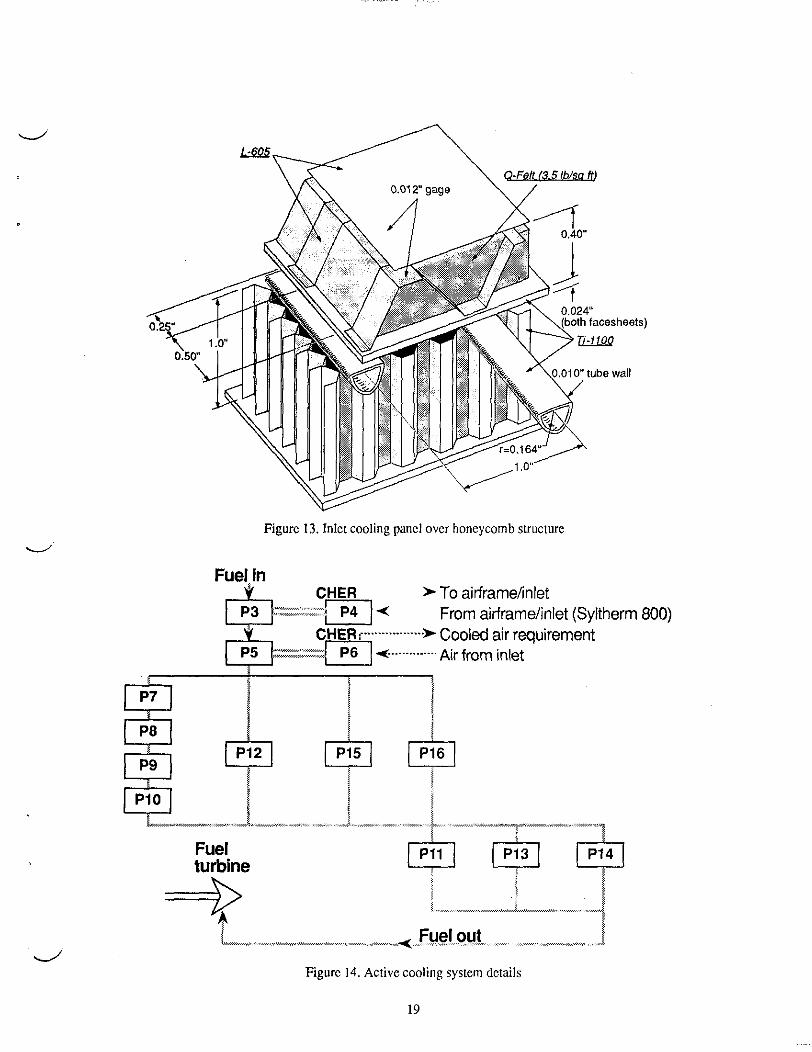
Figure 13. Inlet cooling panel over honeycomb structure
Fuel in CHER *To airframe/inlet
CHER *Cooled air requirement From airframe/inlet (Syltherm 800)
.................
Fuel turbine
==P Figure 14. Active cooling system details
19
Minimum Weight Design
0
No. of channels Der inch Maximum No.
Possible
Heal Shiekl
cooled Panel
- Cooled Panel * Insulation -,i-- Heat Shield
----)c--. TOTAL
Figure 15. Weight optimization m u 1 6 for actively cooled inlet
Honeycomb -Ti 6242
v Figure 16. Suuctural wall concept
20
I I I I I I I I I I I I I I
bagged in quartz glass
Fuel cell Viton/Florel
\ Pack fiber insulation
around lacing
Figurc 17. Tank wall conccpt
4446 D.O.F.
Figure 18. Airframe MSCmASTRAN FEM
1400
1400-
1200- TI
a e E E Oo0- .- a
4-
g 1000-
a 4-
L
li-
1400 SYM BL %Half-s an .......
165 ---L-..z..=F _._. 1000 - . _ .
1
--.\
I;-.-.-.- . - . _ . _ . _ , _ I - - - - - - - - - - 800 - ,~ _.-.-. 1
\ i'-. - . - . -.-w...;.:-. - , ...) ........... . \ \ f
Y m 600 2
0 m
, 200
;\ .- c
a
I I Lower ,,,,/''}
I Inlet ramps actively cooled
+ . t<* I 1 , I I : \ I \ 1 : 1 ; '\ '4
I I I ,,.-----..-----_ _ _ _ _ _ j
\ \
\ p - - - - - - - - - - -
-\ 1.:
I \ '. I \ I \
' 7 - 1 \
'\ '\ .. -
.,\ -/
Lower ,,,,/''} Inlet ramps actively cooled
,,.-----.I----__ _ _ _ _ _ j t<* 1 , 1 : \
I I : \
Upper - 1 \ \ \
400 I I I I I I I I I 0 200 400 600 800 1000 1200 1400 1600
Fuselage station Figure 19. Cenlerlinc peak radiauon equilibrium wall temperatures
d ' ' 400
150
100
350
-
0.5" core ht n
U rr.7
I I I I I
A 300
250
temp., deg. F
200
d
Different locations on vehicle
375 400 425 450 475 500 525
Outer facesheet temperature, deg. F
Figure 21. Predicted core gradients vs temperature at 12.5 minutes
6000 D.O.F.
Primary structure: Ti 6242
Nozzle
Figure 22. Propulsion system MSCiNASTRAN E M
23
120
-1 0
100
I I I I I I
c? 80 0 3-
x a 60
2 40 3 .I- .-
20
0
20
10
Angle, degrees
0
1 2 3 4 5
Mach number Figure 23. Fliglil cnvelope
Elevon deflection
Angle of attack
24
d
140
620
loo
Force, 80 1000 Ib.
60
40
20
0
160 r - -
7 Turboj -
-
- -
I \
I I I
2000
Specific impulse,
sec
1000
0 I I I I I 1 2 3 4 5
Mach number Figure 26. Cyclc and effective specific impulse for ascent
25
0.5
0.3
Equivalence
0.4
ratio, I$
I I I I I
50
40
30 Range
nm
20
90
89
86
85
84
83 10
Event
Figure 28. Mission range breakdown
26
il
W
50 r
aooo
7000
6000 Range,
nm 5000
4000
3000
2000
40
-
-
bleed
0 100% full tanks A 83% full tanks 0 64% full tanks
-
-
-M5 Penetrator Study
(Ref. 17) - % Region of possible
0 design solutions I I I I
% 30 fuel used
20
10
Figure 30. Mission nnge parametrics
21
Copyright © 2022 FDOKUMEN