Perceptual Learning Improves Contrast Sensitivity of V1 Neurons in Cats
12
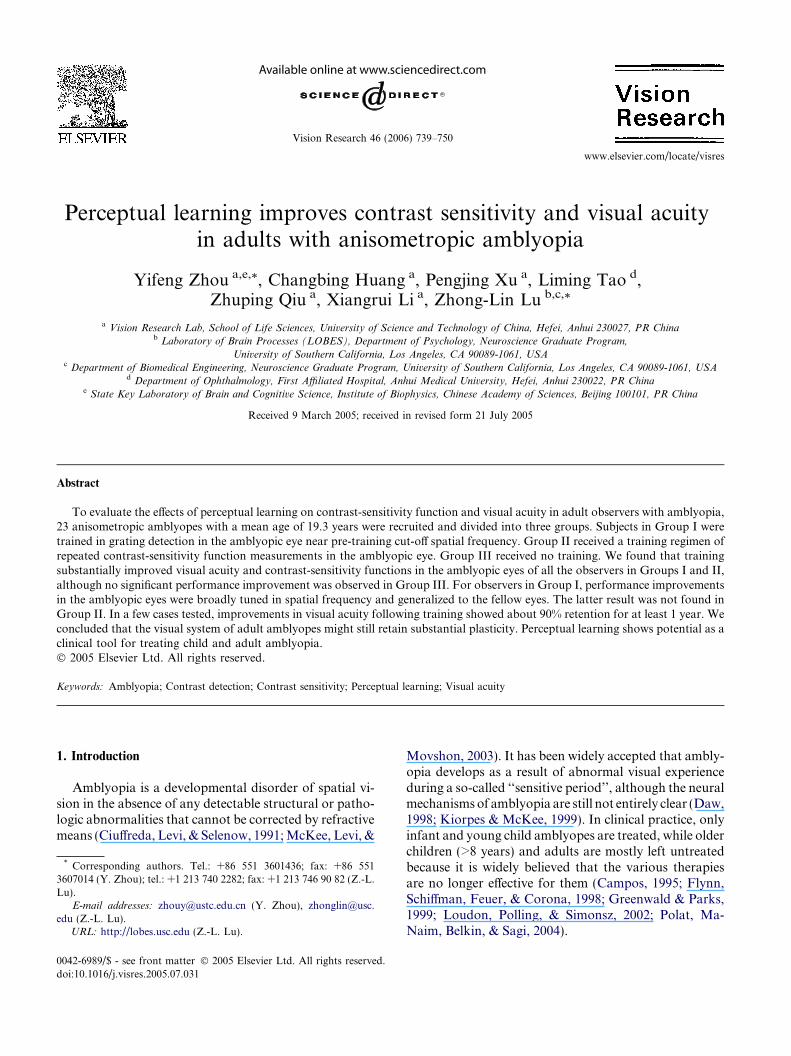
Perceptual learning improves contrast sensitivity and visual acuity in adults with anisometropic amblyopia Yifeng Zhou a,e, * , Changbing Huang a , Pengjing Xu a , Liming Tao d , Zhuping Qiu a , Xiangrui Li a , Zhong-Lin Lu b,c, * a Vision Research Lab, School of Life Sciences, University of Science and Technology of China, Hefei, Anhui 230027, PR China b Laboratory of Brain Processes (LOBES), Department of Psychology, Neuroscience Graduate Program, University of Southern California, Los Angeles, CA 90089-1061, USA c Department of Biomedical Engineering, Neuroscience Graduate Program, University of Southern California, Los Angeles, CA 90089-1061, USA d Department of Ophthalmology, First Affiliated Hospital, Anhui Medical University, Hefei, Anhui 230022, PR China e State Key Laboratory of Brain and Cognitive Science, Institute of Biophysics, Chinese Academy of Sciences, Beijing 100101, PR China Received 9 March 2005; received in revised form 21 July 2005 Abstract To evaluate the effects of perceptual learning on contrast-sensitivity function and visual acuity in adult observers with amblyopia, 23 anisometropic amblyopes with a mean age of 19.3 years were recruited and divided into three groups. Subjects in Group I were trained in grating detection in the amblyopic eye near pre-training cut-off spatial frequency. Group II received a training regimen of repeated contrast-sensitivity function measurements in the amblyopic eye. Group III received no training. We found that training substantially improved visual acuity and contrast-sensitivity functions in the amblyopic eyes of all the observers in Groups I and II, although no significant performance improvement was observed in Group III. For observers in Group I, performance improvements in the amblyopic eyes were broadly tuned in spatial frequency and generalized to the fellow eyes. The latter result was not found in Group II. In a few cases tested, improvements in visual acuity following training showed about 90% retention for at least 1 year. We concluded that the visual system of adult amblyopes might still retain substantial plasticity. Perceptual learning shows potential as a clinical tool for treating child and adult amblyopia. Ó 2005 Elsevier Ltd. All rights reserved. Keywords: Amblyopia; Contrast detection; Contrast sensitivity; Perceptual learning; Visual acuity 1. Introduction Amblyopia is a developmental disorder of spatial vi- sion in the absence of any detectable structural or patho- logic abnormalities that cannot be corrected by refractive means (Ciuffreda, Levi, & Selenow, 1991; McKee, Levi, & Movshon, 2003). It has been widely accepted that ambly- opia develops as a result of abnormal visual experience during a so-called ‘‘sensitive period’’, although the neural mechanisms of amblyopia are still not entirely clear (Daw, 1998; Kiorpes & McKee, 1999). In clinical practice, only infant and young child amblyopes are treated, while older children (>8 years) and adults are mostly left untreated because it is widely believed that the various therapies are no longer effective for them (Campos, 1995; Flynn, Schiffman, Feuer, & Corona, 1998; Greenwald & Parks, 1999; Loudon, Polling, & Simonsz, 2002; Polat, Ma- Naim, Belkin, & Sagi, 2004). 0042-6989/$ - see front matter Ó 2005 Elsevier Ltd. All rights reserved. doi:10.1016/j.visres.2005.07.031 * Corresponding authors. Tel.: +86 551 3601436; fax: +86 551 3607014 (Y. Zhou); tel.: +1 213 740 2282; fax: +1 213 746 90 82 (Z.-L. Lu). E-mail addresses: [email protected] (Y. Zhou), zhonglin@usc. edu (Z.-L. Lu). URL: http://lobes.usc.edu (Z.-L. Lu). www.elsevier.com/locate/visres Vision Research 46 (2006) 739–750
Transcript of Perceptual Learning Improves Contrast Sensitivity of V1 Neurons in Cats
www.elsevier.com/locate/visres
Vision Research 46 (2006) 739–750
Perceptual learning improves contrast sensitivity and visual acuityin adults with anisometropic amblyopia
Yifeng Zhou a,e,*, Changbing Huang a, Pengjing Xu a, Liming Tao d,Zhuping Qiu a, Xiangrui Li a, Zhong-Lin Lu b,c,*
a Vision Research Lab, School of Life Sciences, University of Science and Technology of China, Hefei, Anhui 230027, PR Chinab Laboratory of Brain Processes (LOBES), Department of Psychology, Neuroscience Graduate Program,
University of Southern California, Los Angeles, CA 90089-1061, USAc Department of Biomedical Engineering, Neuroscience Graduate Program, University of Southern California, Los Angeles, CA 90089-1061, USA
d Department of Ophthalmology, First Affiliated Hospital, Anhui Medical University, Hefei, Anhui 230022, PR Chinae State Key Laboratory of Brain and Cognitive Science, Institute of Biophysics, Chinese Academy of Sciences, Beijing 100101, PR China
Received 9 March 2005; received in revised form 21 July 2005
Abstract
To evaluate the effects of perceptual learning on contrast-sensitivity function and visual acuity in adult observers with amblyopia,23 anisometropic amblyopes with a mean age of 19.3 years were recruited and divided into three groups. Subjects in Group I weretrained in grating detection in the amblyopic eye near pre-training cut-off spatial frequency. Group II received a training regimen ofrepeated contrast-sensitivity function measurements in the amblyopic eye. Group III received no training. We found that trainingsubstantially improved visual acuity and contrast-sensitivity functions in the amblyopic eyes of all the observers in Groups I and II,although no significant performance improvement was observed in Group III. For observers in Group I, performance improvementsin the amblyopic eyes were broadly tuned in spatial frequency and generalized to the fellow eyes. The latter result was not found inGroup II. In a few cases tested, improvements in visual acuity following training showed about 90% retention for at least 1 year. Weconcluded that the visual system of adult amblyopes might still retain substantial plasticity. Perceptual learning shows potential as aclinical tool for treating child and adult amblyopia.� 2005 Elsevier Ltd. All rights reserved.
Keywords: Amblyopia; Contrast detection; Contrast sensitivity; Perceptual learning; Visual acuity
1. Introduction
Amblyopia is a developmental disorder of spatial vi-sion in the absence of any detectable structural or patho-logic abnormalities that cannot be corrected by refractivemeans (Ciuffreda, Levi, & Selenow, 1991;McKee, Levi, &
0042-6989/$ - see front matter � 2005 Elsevier Ltd. All rights reserved.doi:10.1016/j.visres.2005.07.031
* Corresponding authors. Tel.: +86 551 3601436; fax: +86 5513607014 (Y. Zhou); tel.: +1 213 740 2282; fax: +1 213 746 90 82 (Z.-L.Lu).
E-mail addresses: [email protected] (Y. Zhou), [email protected] (Z.-L. Lu).
URL: http://lobes.usc.edu (Z.-L. Lu).
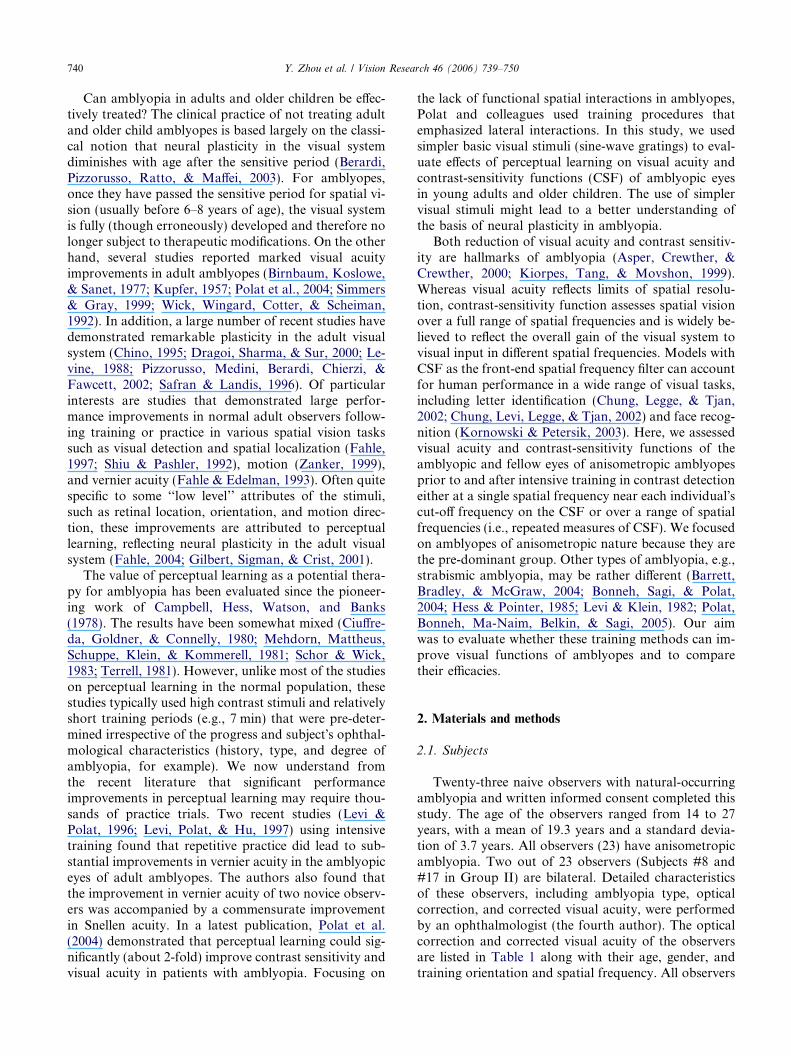
Movshon, 2003). It has been widely accepted that ambly-opia develops as a result of abnormal visual experienceduring a so-called ‘‘sensitive period’’, although the neuralmechanisms of amblyopia are still not entirely clear (Daw,1998; Kiorpes & McKee, 1999). In clinical practice, onlyinfant and young child amblyopes are treated, while olderchildren (>8 years) and adults are mostly left untreatedbecause it is widely believed that the various therapiesare no longer effective for them (Campos, 1995; Flynn,Schiffman, Feuer, & Corona, 1998; Greenwald & Parks,1999; Loudon, Polling, & Simonsz, 2002; Polat, Ma-Naim, Belkin, & Sagi, 2004).
740 Y. Zhou et al. / Vision Research 46 (2006) 739–750
Can amblyopia in adults and older children be effec-tively treated? The clinical practice of not treating adultand older child amblyopes is based largely on the classi-cal notion that neural plasticity in the visual systemdiminishes with age after the sensitive period (Berardi,Pizzorusso, Ratto, & Maffei, 2003). For amblyopes,once they have passed the sensitive period for spatial vi-sion (usually before 6–8 years of age), the visual systemis fully (though erroneously) developed and therefore nolonger subject to therapeutic modifications. On the otherhand, several studies reported marked visual acuityimprovements in adult amblyopes (Birnbaum, Koslowe,& Sanet, 1977; Kupfer, 1957; Polat et al., 2004; Simmers& Gray, 1999; Wick, Wingard, Cotter, & Scheiman,1992). In addition, a large number of recent studies havedemonstrated remarkable plasticity in the adult visualsystem (Chino, 1995; Dragoi, Sharma, & Sur, 2000; Le-vine, 1988; Pizzorusso, Medini, Berardi, Chierzi, &Fawcett, 2002; Safran & Landis, 1996). Of particularinterests are studies that demonstrated large perfor-mance improvements in normal adult observers follow-ing training or practice in various spatial vision taskssuch as visual detection and spatial localization (Fahle,1997; Shiu & Pashler, 1992), motion (Zanker, 1999),and vernier acuity (Fahle & Edelman, 1993). Often quitespecific to some ‘‘low level’’ attributes of the stimuli,such as retinal location, orientation, and motion direc-tion, these improvements are attributed to perceptuallearning, reflecting neural plasticity in the adult visualsystem (Fahle, 2004; Gilbert, Sigman, & Crist, 2001).
The value of perceptual learning as a potential thera-py for amblyopia has been evaluated since the pioneer-ing work of Campbell, Hess, Watson, and Banks(1978). The results have been somewhat mixed (Ciuffre-da, Goldner, & Connelly, 1980; Mehdorn, Mattheus,Schuppe, Klein, & Kommerell, 1981; Schor & Wick,1983; Terrell, 1981). However, unlike most of the studieson perceptual learning in the normal population, thesestudies typically used high contrast stimuli and relativelyshort training periods (e.g., 7 min) that were pre-deter-mined irrespective of the progress and subject�s ophthal-mological characteristics (history, type, and degree ofamblyopia, for example). We now understand fromthe recent literature that significant performanceimprovements in perceptual learning may require thou-sands of practice trials. Two recent studies (Levi &Polat, 1996; Levi, Polat, & Hu, 1997) using intensivetraining found that repetitive practice did lead to sub-stantial improvements in vernier acuity in the amblyopiceyes of adult amblyopes. The authors also found thatthe improvement in vernier acuity of two novice observ-ers was accompanied by a commensurate improvementin Snellen acuity. In a latest publication, Polat et al.(2004) demonstrated that perceptual learning could sig-nificantly (about 2-fold) improve contrast sensitivity andvisual acuity in patients with amblyopia. Focusing on
the lack of functional spatial interactions in amblyopes,Polat and colleagues used training procedures thatemphasized lateral interactions. In this study, we usedsimpler basic visual stimuli (sine-wave gratings) to eval-uate effects of perceptual learning on visual acuity andcontrast-sensitivity functions (CSF) of amblyopic eyesin young adults and older children. The use of simplervisual stimuli might lead to a better understanding ofthe basis of neural plasticity in amblyopia.
Both reduction of visual acuity and contrast sensitiv-ity are hallmarks of amblyopia (Asper, Crewther, &Crewther, 2000; Kiorpes, Tang, & Movshon, 1999).Whereas visual acuity reflects limits of spatial resolu-tion, contrast-sensitivity function assesses spatial visionover a full range of spatial frequencies and is widely be-lieved to reflect the overall gain of the visual system tovisual input in different spatial frequencies. Models withCSF as the front-end spatial frequency filter can accountfor human performance in a wide range of visual tasks,including letter identification (Chung, Legge, & Tjan,2002; Chung, Levi, Legge, & Tjan, 2002) and face recog-nition (Kornowski & Petersik, 2003). Here, we assessedvisual acuity and contrast-sensitivity functions of theamblyopic and fellow eyes of anisometropic amblyopesprior to and after intensive training in contrast detectioneither at a single spatial frequency near each individual�scut-off frequency on the CSF or over a range of spatialfrequencies (i.e., repeated measures of CSF). We focusedon amblyopes of anisometropic nature because they arethe pre-dominant group. Other types of amblyopia, e.g.,strabismic amblyopia, may be rather different (Barrett,Bradley, & McGraw, 2004; Bonneh, Sagi, & Polat,2004; Hess & Pointer, 1985; Levi & Klein, 1982; Polat,Bonneh, Ma-Naim, Belkin, & Sagi, 2005). Our aimwas to evaluate whether these training methods can im-prove visual functions of amblyopes and to comparetheir efficacies.
2. Materials and methods
2.1. Subjects
Twenty-three naive observers with natural-occurringamblyopia and written informed consent completed thisstudy. The age of the observers ranged from 14 to 27years, with a mean of 19.3 years and a standard devia-tion of 3.7 years. All observers (23) have anisometropicamblyopia. Two out of 23 observers (Subjects #8 and#17 in Group II) are bilateral. Detailed characteristicsof these observers, including amblyopia type, opticalcorrection, and corrected visual acuity, were performedby an ophthalmologist (the fourth author). The opticalcorrection and corrected visual acuity of the observersare listed in Table 1 along with their age, gender, andtraining orientation and spatial frequency. All observers
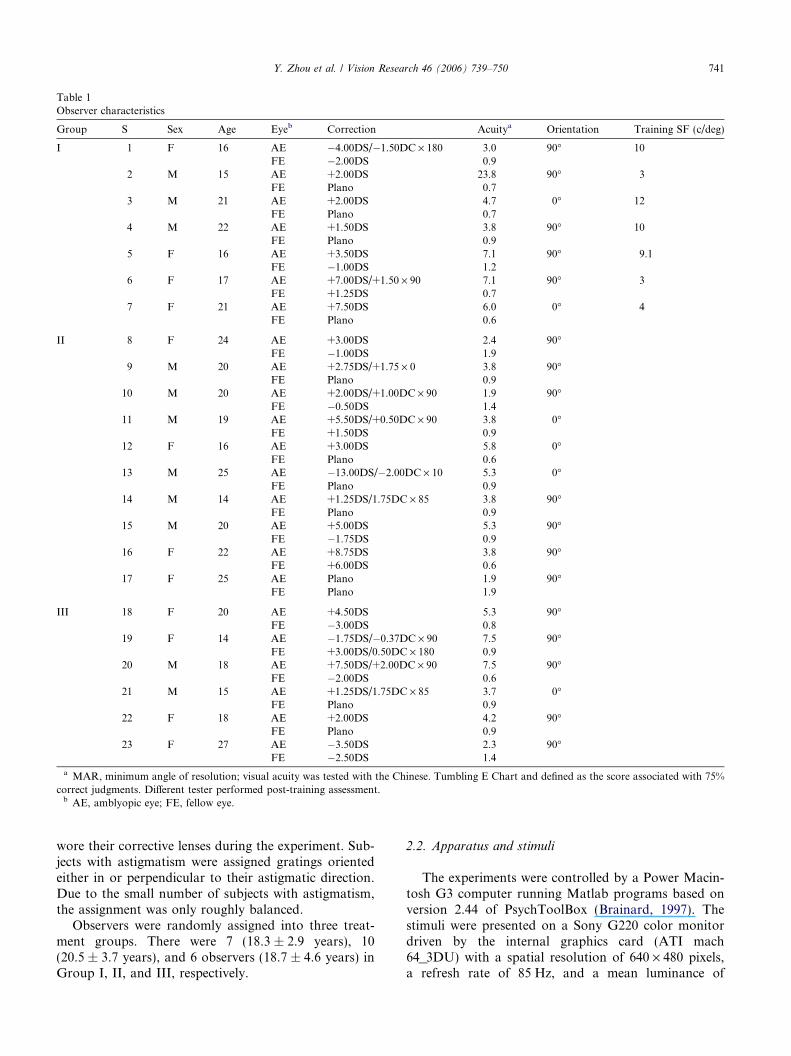
Table 1Observer characteristics
Group S Sex Age Eyeb Correction Acuitya Orientation Training SF (c/deg)
I 1 F 16 AE �4.00DS/�1.50DC · 180 3.0 90� 10FE �2.00DS 0.9
2 M 15 AE +2.00DS 23.8 90� 3FE Plano 0.7
3 M 21 AE +2.00DS 4.7 0� 12FE Plano 0.7
4 M 22 AE +1.50DS 3.8 90� 10FE Plano 0.9
5 F 16 AE +3.50DS 7.1 90� 9.1FE �1.00DS 1.2
6 F 17 AE +7.00DS/+1.50 · 90 7.1 90� 3FE +1.25DS 0.7
7 F 21 AE +7.50DS 6.0 0� 4FE Plano 0.6
II 8 F 24 AE +3.00DS 2.4 90�FE �1.00DS 1.9
9 M 20 AE +2.75DS/+1.75 · 0 3.8 90�FE Plano 0.9
10 M 20 AE +2.00DS/+1.00DC · 90 1.9 90�FE �0.50DS 1.4
11 M 19 AE +5.50DS/+0.50DC · 90 3.8 0�FE +1.50DS 0.9
12 F 16 AE +3.00DS 5.8 0�FE Plano 0.6
13 M 25 AE �13.00DS/�2.00DC · 10 5.3 0�FE Plano 0.9
14 M 14 AE +1.25DS/1.75DC · 85 3.8 90�FE Plano 0.9
15 M 20 AE +5.00DS 5.3 90�FE �1.75DS 0.9
16 F 22 AE +8.75DS 3.8 90�FE +6.00DS 0.6
17 F 25 AE Plano 1.9 90�FE Plano 1.9
III 18 F 20 AE +4.50DS 5.3 90�FE �3.00DS 0.8
19 F 14 AE �1.75DS/�0.37DC · 90 7.5 90�FE +3.00DS/0.50DC · 180 0.9
20 M 18 AE +7.50DS/+2.00DC · 90 7.5 90�FE �2.00DS 0.6
21 M 15 AE +1.25DS/1.75DC · 85 3.7 0�FE Plano 0.9
22 F 18 AE +2.00DS 4.2 90�FE Plano 0.9
23 F 27 AE �3.50DS 2.3 90�FE �2.50DS 1.4
a MAR, minimum angle of resolution; visual acuity was tested with the Chinese. Tumbling E Chart and defined as the score associated with 75%correct judgments. Different tester performed post-training assessment.b AE, amblyopic eye; FE, fellow eye.
Y. Zhou et al. / Vision Research 46 (2006) 739–750 741
wore their corrective lenses during the experiment. Sub-jects with astigmatism were assigned gratings orientedeither in or perpendicular to their astigmatic direction.Due to the small number of subjects with astigmatism,the assignment was only roughly balanced.
Observers were randomly assigned into three treat-ment groups. There were 7 (18.3 ± 2.9 years), 10(20.5 ± 3.7 years), and 6 observers (18.7 ± 4.6 years) inGroup I, II, and III, respectively.
2.2. Apparatus and stimuli
The experiments were controlled by a Power Macin-tosh G3 computer running Matlab programs based onversion 2.44 of PsychToolBox (Brainard, 1997). Thestimuli were presented on a Sony G220 color monitordriven by the internal graphics card (ATI mach64_3DU) with a spatial resolution of 640 · 480 pixels,a refresh rate of 85 Hz, and a mean luminance of
742 Y. Zhou et al. / Vision Research 46 (2006) 739–750
27 cd/m2. Using a special circuit that combines two 8-bitoutput channels of the graphics card, the display systemcan produce gray levels with 14 bits gray-level resolution(Li, Lu, Xu, Jin, & Zhou, 2003). All displays were viewedmonocularly in fovea at a distance of 2.28 m in a dimly litroom. An opaque eye patch was used to cover the eyethat was not being tested in a given condition.
The signal stimuli were vertical or horizontal3.06 · 3.06 deg sinusoidal luminance modulations (‘‘si-ne-wave gratings’’) presented in the center of the dis-play. To minimize edge effects, a 0.5 deg half-Gaussianramp was added to each side of the stimulus to blendthe stimuli to the background. Depending on the exper-imental condition, sine-wave gratings of different spatialfrequencies were used.
2.3. Experimental design
The experiment consisted of three consecutive phases:pre-training assessment, training, and post-training re-assessment. In pre- and post-training assessments, CSFand visual acuity for both eyes were measured for allthe observers. The pre-training assessment took a totalof 1.5 h, split across 2 days. It was followed by on aver-age 12.7 sessions (range from 9 to 19) of training and 2days of post-training assessment. Training was terminat-ed after first three consecutive sessions with similar per-formance. The order of testing in the pre-training andthe post-training assessments was counterbalanced foreach observer. For some observers, retention of theimprovements in CSF and visual acuity was also as-sessed several times after the initial post-training.
Contrast sensitivity (CS), defined as 1/threshold, wascalculated from sine-wave grating detection thresholdsat spatial frequencies 0.5, 1, 2, 4, 8, 10, 12, 14, and16 c/deg for the amblyopic eye, and 0.5, 1, 2, 4, 8, 12,and 16 c/deg for the fellow eye. The two additional spa-tial frequencies (10 and 14 c/deg) were used in theamplyopic eye to obtain more detailed measures of theCSF at high spatial frequencies. For a given observer,independent of group assignment, the orientation ofthe signal sine-wave gratings was either 0 or 90 deg (list-ed in Table 1), but consistent across spatial frequenciesand eyes. Visual acuity was assessed with the ChineseTumbling E Chart (Mou, 1966)1 and defined as the scoreassociated with 75% correct judgments.
Observers were only trained in their amblyopic eyes(or the more severe one for two bilateral amblyopes).Different training protocols were assigned to the threegroups of observers. Observers in Group I were trainedin a sine-wave grating detection task near each individ-
1 The chart we used was developed by Mou (1966). It has beenaccepted by Ministry of Health, PR China, as national standard(GB11533-1989). Due to language differences, it only uses ‘‘E’’ indifferent orientations instead of multiple letters.
ual�s cut-off spatial frequency (listed in Table 1), definedas the spatial frequency at which the estimated contrastthreshold from pre-training CSF measurements was0.50. Observers in Group II practiced the CSF task overthe entire range of spatial frequencies tested in theamblyopic eyes over many days. Observers in GroupIII received no training. For Group III, the two sets ofvisual acuity and CSF assessments were separated byat least 10 days.
2.4. Procedure
Each trial started with a 259 ms fixation cross in thecenter of the display. This was followed by two inter-vals of 118 ms separated by a 500 ms inter-stimulusinterval (ISI) and demarcated by a brief tone in thebeginning of each interval. The signal sine-wave gratingappeared in only one of the intervals for 118 ms. Theobserver was asked to indicate the interval that con-tained the signal by pressing one of two keys on thecomputer keyboard. During training, a brief tonefollowed each correct response; during pre- and post-training assessments, a brief tone followed each re-sponse regardless of its accuracy. The response alsoinitiated the next trial.
Contrast thresholds at 79.3% correct in the two-inter-val, forced-choice, sine-wave grating detection task wereestimated using an adaptive staircase method. The 3/1staircase method, expected to asymptote at 79.3% cor-rect, decreased signal contrast by 10% (multiplied theprevious value by 0.9) after every three consecutive cor-rect responses and increased signal contrast by 10% afterevery incorrect response. In assessing CSF, threshold fordetecting a sine-wave grating at a particular spatial fre-quency was estimated from 100 trials. A reversal resultswhen the staircase changes its direction (changing fromincreasing to decreasing contrast or vice versa). Follow-ing the standard practice in psychophysics, we excludedthe first three (if the number of total reversals was odd)or four (if even) reversals. The average contrast of theremaining reversals was taken as the contrast thresholdfor detecting grating of a certain spatial frequency. Thestarting contrast for each staircase was set close to theexpected threshold based on results from pilot testing.CSF for each eye was measured in separate sessions.All the staircases for all the spatial frequencies on a giv-en CSF were interleaved. Seven hundred trials andabout 35 min were used to measure a CSF in the felloweye; 900 trials and about 45 min were used in the ambly-opic eye.
For Group I, each training session consisted ofnine 120-trial blocks, often run in immediatesuccession. For Group II, each training session con-sisted of 900 trials, 100 trials per spatial frequency.Observers were given instruction trials before datacollection.
10 6 42 1 8Sessions
6
4
2Con
tras
t Sen
sitiv
ity
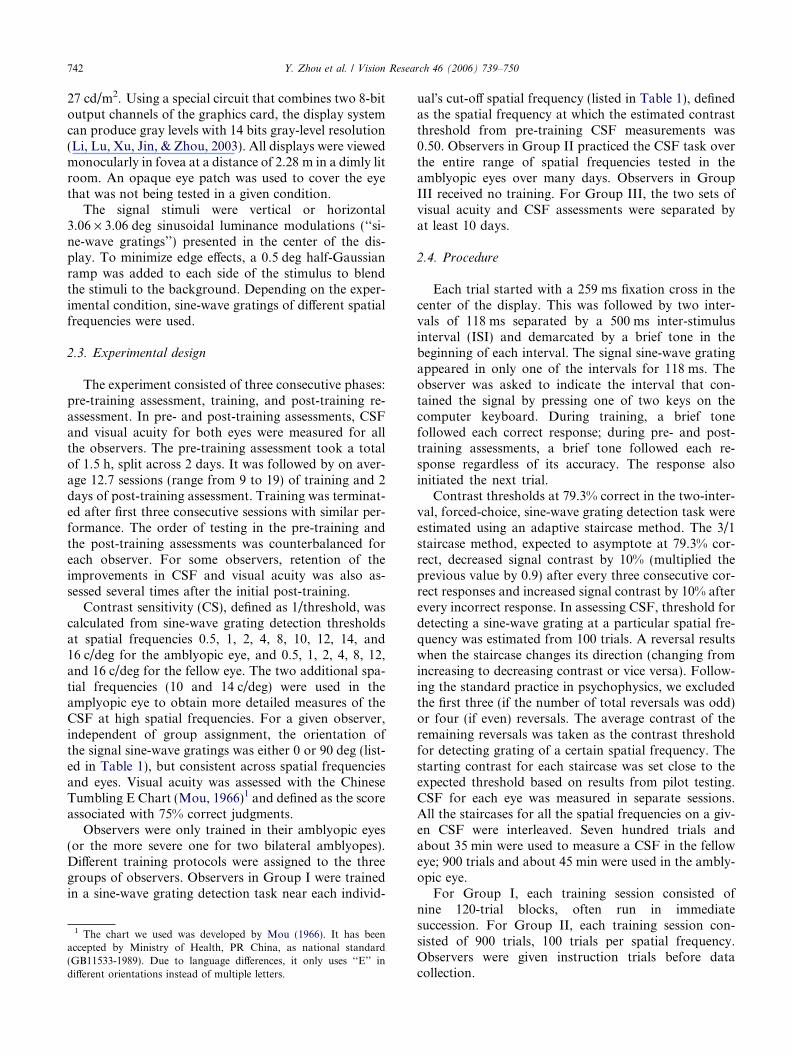
Fig. 1. Average learning curve of Group I. The first and last datapoints (filled circles) were derived from pre-training and post-trainingCSF measurements, respectively. Data from the training phase arerepresented by open circles. The number of training sessions variedbetween observers, from 9 to 19 (12.7 ± 3.4 SD) sessions. Only the first(‘‘common’’) nine sessions are illustrated here. Data were fitted with alinear function with a slope of 0.42 and r2 of 0.91 (p < 0.0001).
Y. Zhou et al. / Vision Research 46 (2006) 739–750 743
2.5. Statistical analysis and model fit
Data from the two orientations were compared usingbetween-subject analysis of variance (ANOVA). Pre-training and post-training CSF�s as well as the magnitudeof CSF improvements in the trained and untrained eyeswere compared using within-subject ANOVA. The aver-age CSF�s of each group prior to and after training wasfit with a Difference of Gaussian (DOG) model that al-lowed us to estimate the maximum sensitivities and cut-off spatial frequencies (Rohaly & Buchsbaum, 1988,1989). For Group I, contrast sensitivities at the trainedspatial frequency in the beginning and the end of trainingwere comparedusingwithin-subject t tests. For all groups,pre- and post-training visual acuity was compared usingwithin-subject t tests. Themagnitudes of contrast sensitiv-ity and visual acuity improvements among the threegroups were compared using between-subject ANOVA.
For each observer, the magnitude of improvement foreach measure (e.g., contrast sensitivity, average CSF�s,and visual acuity) was calculated as:
I individual ¼ 20 log10post-training Measure
pre-training MeasuredB. ð1Þ
We report I group =P
Iindividual/N (N is the totalnumber of individuals) for each group as the averagemagnitude of improvements for that group. We thenconvert the average dB improvement to percentimprovement:
P group ¼ ð10Igroup=20 � 1Þ � 100%. ð2Þ
3. Results
Statistical analysis revealed no significant differencesbetween pre-training CSFs of 0 deg and 90 deg in either(trained or untrained) eye for all three groups(F (1,45) = 0.48, p > 0.10 and F (1,40) = 3.47, p = 0.07;F (1,54) = 0.611, p > 0.10 and F (1,49) = 2.532, p > 0.10;F (1,41) = 0.181, p > 0.10 and F (1,27) = 0.669, p > 0.10for trained and untrained eyes of Group I, II, III, respec-tively.) We pooled data from the two orientations in allthe subsequent data analyses and report.
3.1. Group I
Training of the amblyopic eyes near each individual�scut-off spatial frequency resulted in highly significant(t (6) = 5.19, p < 0.01) improvements of contrast sensi-tivity at the trained spatial frequency. Averaged acrossobservers, contrast sensitivity improved by 9.8 dB (cal-culated from pre-training and post-training CSF evalua-tion; or 209%; range, 0.1–20.9 dB; median = 8.3 dB;SE = 2.7 dB). The average learning curve, i.e., CS as afunction of the common training sessions of all the
observers in the group (i.e., 9 sessions), is shown inFig. 1. Learning rates were estimated by using log–loglinear regressions of the learning curves, consistent withpower-law learning. Taking pre-training and post-train-ing evaluation into account, training improved contrastsensitivity with an average of 0.42 log units per log unitof training session (r2 = 0.91, p < 0.0001). Excludingdata from pre- and post-training sessions, the slope ofimprovement is 0.31 log units per log unit of trainingsession (r2 = 0.87, p < 0.01).
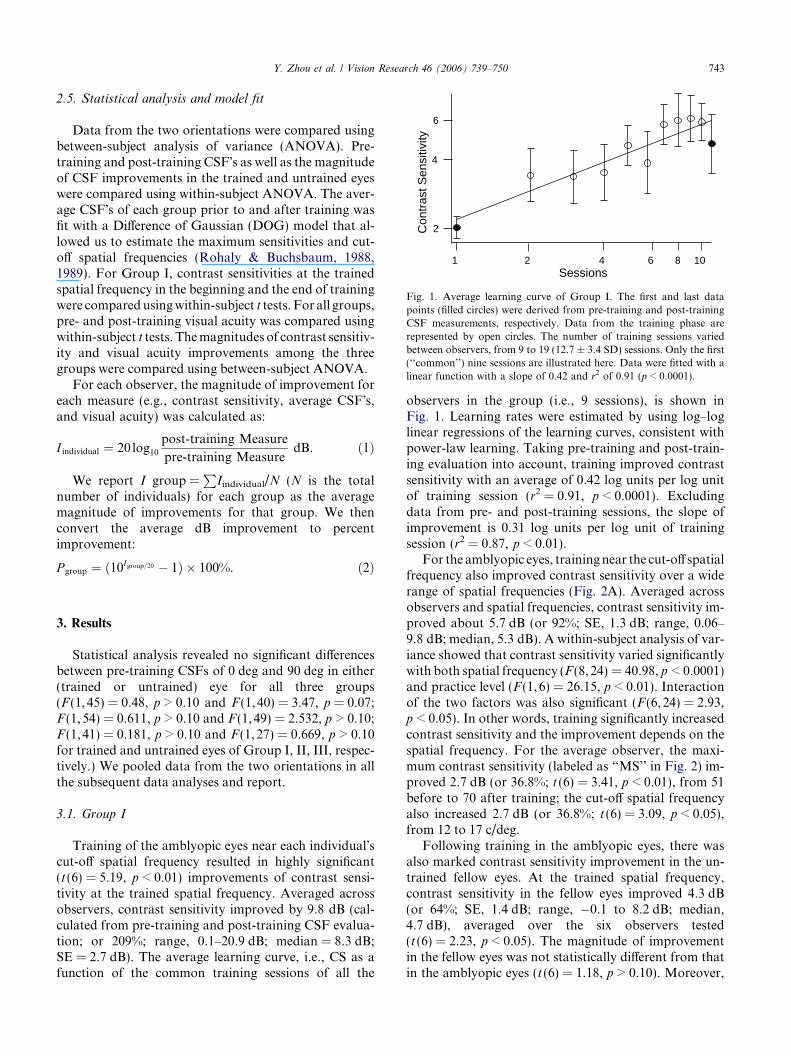
For the amblyopic eyes, trainingnear the cut-off spatialfrequency also improved contrast sensitivity over a widerange of spatial frequencies (Fig. 2A). Averaged acrossobservers and spatial frequencies, contrast sensitivity im-proved about 5.7 dB (or 92%; SE, 1.3 dB; range, 0.06–9.8 dB; median, 5.3 dB). A within-subject analysis of var-iance showed that contrast sensitivity varied significantlywith both spatial frequency (F (8,24) = 40.98, p < 0.0001)and practice level (F (1,6) = 26.15, p < 0.01). Interactionof the two factors was also significant (F (6,24) = 2.93,p < 0.05). In other words, training significantly increasedcontrast sensitivity and the improvement depends on thespatial frequency. For the average observer, the maxi-mum contrast sensitivity (labeled as ‘‘MS’’ in Fig. 2) im-proved 2.7 dB (or 36.8%; t (6) = 3.41, p < 0.01), from 51before to 70 after training; the cut-off spatial frequencyalso increased 2.7 dB (or 36.8%; t (6) = 3.09, p < 0.05),from 12 to 17 c/deg.
Following training in the amblyopic eyes, there wasalso marked contrast sensitivity improvement in the un-trained fellow eyes. At the trained spatial frequency,contrast sensitivity in the fellow eyes improved 4.3 dB(or 64%; SE, 1.4 dB; range, �0.1 to 8.2 dB; median,4.7 dB), averaged over the six observers tested(t (6) = 2.23, p < 0.05). The magnitude of improvementin the fellow eyes was not statistically different from thatin the amblyopic eyes (t (6) = 1.18, p > 0.10). Moreover,
-1.5
-1.0
-0.5
0.0Lo
g N
orm
aliz
ed C
S
0.5 1 2 4 8 16
Spatial Frequency
MS:51
MS:70
Pre-trainingPost-training
-1.5
-1.0
-0.5
0.0
Log
Nor
mal
ized
CS
0.5 1 2 4 8 16
Spatial Frequency
MS:146
MS:120
A
B
Fig. 2. Average contrast-sensitivity functions in the amblyopic eyes(A) and the fellow eyes (B) for observers in Group I. Triangles, pre-training; circles, post-training. For each observer, the maximumcontrast sensitivity (of all the data points on the pre- and post-trainingCSF�s) was set to 1.0. The CSF�s were normalized to the maximumcontrast sensitivity. Error bars indicate SEM. MS = maximum sensi-tivity. The smooth curves represent the best fitting DOG functions(Rohaly & Buchsbaum, 1988, 1989).
744 Y. Zhou et al. / Vision Research 46 (2006) 739–750
contrast sensitivity over a wide range of spatial frequen-cies also improved (Fig. 2B). Averaged across observersand spatial frequencies, contrast sensitivity improved2.0 dB (or 26%; SE, 0.4 dB; range, 0.8–3.4 dB; median,1.9 dB). Within-subject analysis of variance showed thatcontrast sensitivity varied significantly with both spatialfrequency (F (5,25) = 16.72, p < 0.0001), practice level(F (1,5) = 5.60, p = 0.06), and interaction of the two fac-tors (F (5,25) = 2.59, p = 0.05). For the average observ-er, the maximum contrast sensitivity improved 1.7 dB(or 22.1%; t (6) = 2.66, p < 0.05), from 120 before to146 after training; the cut-off spatial frequency also in-creased 1.3 dB (or 16.7%; t (6) = 1.15, p > 0.10), from35 to 41 c/deg.
We compared the magnitudes of contrast sensitivityimprovements in the trained and untrained eyes acrossthe seven common spatial frequencies tested in botheyes. Even though the magnitude of contrast sensitivityimprovement depended significantly on spatial frequen-cy (F (5,25) = 3.184, p < 0.02), it did not vary signifi-cantly between the two eyes (F (1,5) = 2.159, p > 0.15).
After training, visual acuity in the amblyopic eyesand fellow eyes improved 4.6 dB (or 69.8%;
t (6) = 4.38, p < 0.01; SE, 1.0 dB; range, 1.9–10.0 dB;median, 3.8 dB) and 1.7 dB (or 21.6%; t (7) = 5.16,p < 0.01; SD, 0.4 dB; range, 0–3.5 dB; median, 1.3 dB),respectively (Table 2). Visual acuity of all observers im-proved in the trained amblyopic eyes. The magnitude ofimprovement in the amblyopic eyes was significantlygreater than that in the fellow eyes (t (6) = 2.83,p < 0.05).
In Fig. 3, we plot visual acuity (logMAR) in theamblyopic eyes after training versus that before trainingfor the seven observers. Visual acuity of all observersimproved, signified by the clustering of most of the datapoints above the identity line. The best fitting linearregression curve has a slope of 0.58 (r2 = 0.93,p < 0.01), suggesting greater visual acuity improvementsfor observers with worse initial visual acuities.
3.2. Group II
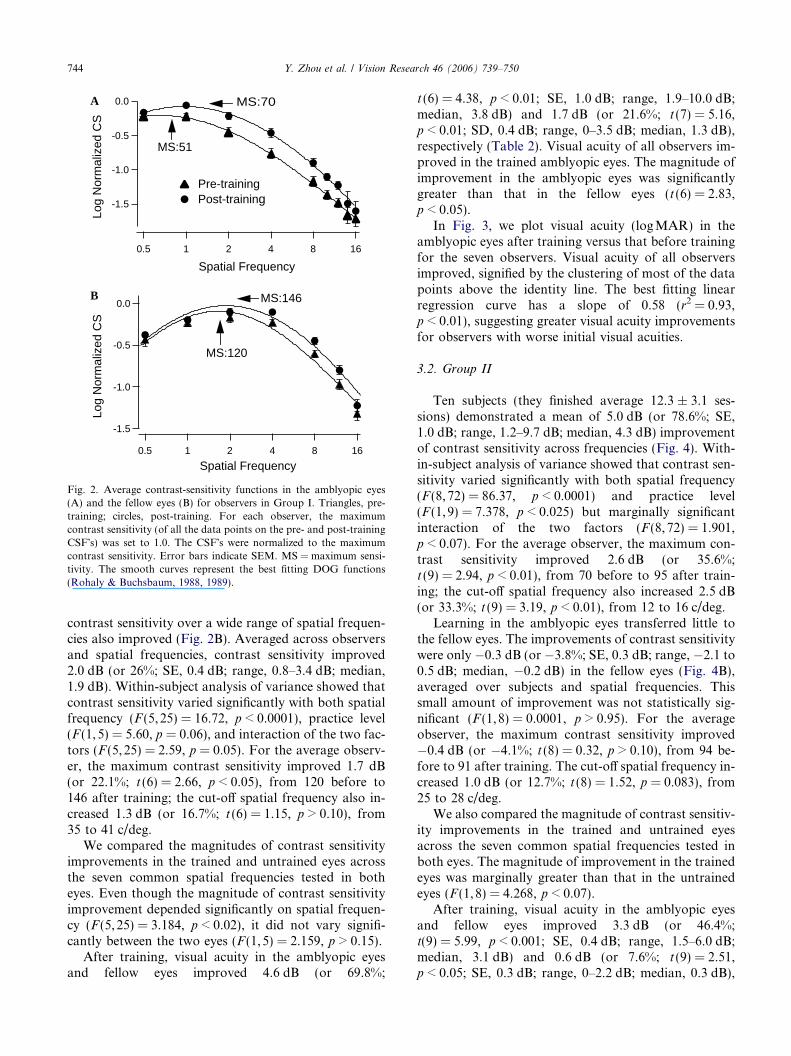
Ten subjects (they finished average 12.3 ± 3.1 ses-sions) demonstrated a mean of 5.0 dB (or 78.6%; SE,1.0 dB; range, 1.2–9.7 dB; median, 4.3 dB) improvementof contrast sensitivity across frequencies (Fig. 4). With-in-subject analysis of variance showed that contrast sen-sitivity varied significantly with both spatial frequency(F (8,72) = 86.37, p < 0.0001) and practice level(F (1,9) = 7.378, p < 0.025) but marginally significantinteraction of the two factors (F (8,72) = 1.901,p < 0.07). For the average observer, the maximum con-trast sensitivity improved 2.6 dB (or 35.6%;t (9) = 2.94, p < 0.01), from 70 before to 95 after train-ing; the cut-off spatial frequency also increased 2.5 dB(or 33.3%; t (9) = 3.19, p < 0.01), from 12 to 16 c/deg.
Learning in the amblyopic eyes transferred little tothe fellow eyes. The improvements of contrast sensitivitywere only �0.3 dB (or �3.8%; SE, 0.3 dB; range, �2.1 to0.5 dB; median, �0.2 dB) in the fellow eyes (Fig. 4B),averaged over subjects and spatial frequencies. Thissmall amount of improvement was not statistically sig-nificant (F (1,8) = 0.0001, p > 0.95). For the averageobserver, the maximum contrast sensitivity improved�0.4 dB (or �4.1%; t (8) = 0.32, p > 0.10), from 94 be-fore to 91 after training. The cut-off spatial frequency in-creased 1.0 dB (or 12.7%; t (8) = 1.52, p = 0.083), from25 to 28 c/deg.
We also compared the magnitude of contrast sensitiv-ity improvements in the trained and untrained eyesacross the seven common spatial frequencies tested inboth eyes. The magnitude of improvement in the trainedeyes was marginally greater than that in the untrainedeyes (F (1,8) = 4.268, p < 0.07).
After training, visual acuity in the amblyopic eyesand fellow eyes improved 3.3 dB (or 46.4%;t(9) = 5.99, p < 0.001; SE, 0.4 dB; range, 1.5–6.0 dB;median, 3.1 dB) and 0.6 dB (or 7.6%; t (9) = 2.51,p < 0.05; SE, 0.3 dB; range, 0–2.2 dB; median, 0.3 dB),

Table 2Improvements in visual acuity for Groups I, II, and III
Group Subject AE FE
Pre Post Improvement (dB) Pre Post Improvement (dB)
I 1 3 2.4 1.9 0.9 0.7 2.22 23.8 7.5 10.0 0.7 0.6 1.33 4.7 2.4 5.8 0.7 0.6 1.34 3.8 2.8 2.7 0.9 0.7 2.25 7.1 4.2 4.6 1.2 0.8 3.56 7.1 4.6 3.8 0.7 0.6 1.37 6 4.2 3.1 0.6 0.6 0.0
Average 4.6 1.7
II 1 2.4 1.9 2.0 1.9 1.5 2.12 3.8 2.5 3.6 0.9 0.9 0.03 1.9 1.6 1.5 1.4 1.3 0.64 3.8 2.7 3.0 0.9 0.9 0.05 5.8 3.7 3.9 0.6 0.6 0.06 5.3 3.7 3.1 0.9 0.9 0.07 3.8 1.9 6.0 0.9 0.7 2.28 5.3 3.7 3.1 0.9 0.8 1.09 3.8 2.2 4.7 0.6 0.6 0.010 1.9 1.5 2.1 1.9 1.8 0.5
Average 3.3 0.6
III 1 5.3 4.7 1.0 0.8 0.7 1.22 7.5 7.5 0.0 0.9 0.9 0.03 7.5 7.5 0.0 0.6 0.6 0.04 3.7 4.2 �1.1 0.9 0.9 0.05 4.2 3.8 0.9 0.9 0.9 0.06 2.3 2.4 �0.4 1.4 1 2.9
Average 0.1 0.7
AE, amblyopic eye; FE, fellow (dominant) eye.
-1.2
-1.0
-0.8
-0.6
-0.4
Pos
t-tr
aini
ng V
isua
l Acu
ity
-1.2 -1.0 -0.8 -0.6 -0.4
Pre-training Visual Acuity
Fig. 3. Post- versus pre-training visual acuity for observers in Group I.Both abscissa and ordinate are in logMAR uints. The best fittinglinear regression line (r2 = 0.93, p < 0.01) has a slope of 0.58,suggesting greater visual acuity improvements for observers withinitially worse visual acuities. The lower dashed line is the identity line(slope = 1), indicating the prediction of no improvement.
Y. Zhou et al. / Vision Research 46 (2006) 739–750 745
respectively (Table 2). The magnitude of improvementin the amblyopic eyes was significantly greater than thatin the fellow eyes (t (9) = 5.60, p < 0.001).
3.3. Group III
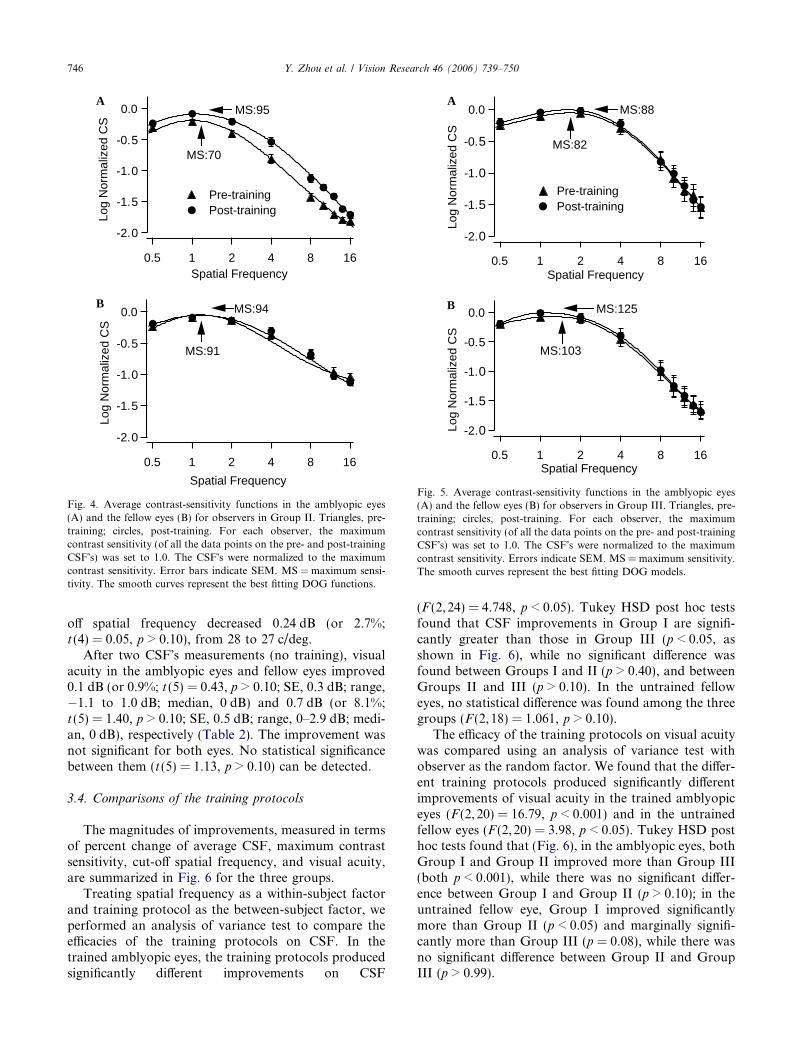
The second measurement of the CSF in the amblyopiceyes showed an average 0.7 dB (or 8.6%; SE, 0.4 dB;range, �0.5 to 2.4 dB; median, 0.5 dB) improvement ofcontrast sensitivity in the amblyopic eyes across observersand frequencies (Fig. 5A). The improvement, however,was not significant (F (1,6) = 0.474, p > 0.50). For theaverage observer, the maximum contrast sensitivity im-proved 0.68 dB (or 8.2%; t (5) = 0.98, p > 0.10), from 82to 88; the cut-off spatial frequency decreased 0.24 dB (or2.8%; t (4) = 0.94, p > 0.10), from 17 to 16 c/deg.
In the fellow eyes, contrast sensitivity improved1.4 dB (or 17.0%; SE, 0.3 dB; range, 0.1–2.4 dB; median,1.5 dB) over observers and spatial frequencies (Fig. 5B).The improvement was only marginally significant(F (1,4) = 4.970, p = 0.09). For the average observer,the maximum contrast sensitivity improved 1.6 dB (or20.7%; t(4) = 1.49, p > 0.10), from 103 to 125; the cut-
-2.0
-1.5
-1.0
-0.5
0.0
Log
Nor
mal
ized
CS
0.5 1 2 4 8 16
Spatial Frequency
MS:94
MS:91
-2.0
-1.5
-1.0
-0.5
0.0Lo
g N
orm
aliz
ed C
S
0.5 1 2 4 8 16Spatial Frequency
MS:95
MS:70
Pre-training Post-training
A
B
Fig. 4. Average contrast-sensitivity functions in the amblyopic eyes(A) and the fellow eyes (B) for observers in Group II. Triangles, pre-training; circles, post-training. For each observer, the maximumcontrast sensitivity (of all the data points on the pre- and post-trainingCSF�s) was set to 1.0. The CSF�s were normalized to the maximumcontrast sensitivity. Error bars indicate SEM. MS = maximum sensi-tivity. The smooth curves represent the best fitting DOG functions.
-2.0
-1.5
-1.0
-0.5
0.0
Log
Nor
mal
ized
CS
0.5 1 2 4 8 16Spatial Frequency
MS:88
MS:82
Pre-trainingPost-training
-2.0
-1.5
-1.0
-0.5
0.0
Log
Nor
mal
ized
CS
0.5 1 2 4 8 16Spatial Frequency
MS:125
MS:103
A
B
Fig. 5. Average contrast-sensitivity functions in the amblyopic eyes(A) and the fellow eyes (B) for observers in Group III. Triangles, pre-training; circles, post-training. For each observer, the maximumcontrast sensitivity (of all the data points on the pre- and post-trainingCSF�s) was set to 1.0. The CSF�s were normalized to the maximumcontrast sensitivity. Errors indicate SEM. MS = maximum sensitivity.The smooth curves represent the best fitting DOG models.
746 Y. Zhou et al. / Vision Research 46 (2006) 739–750
off spatial frequency decreased 0.24 dB (or 2.7%;t (4) = 0.05, p > 0.10), from 28 to 27 c/deg.
After two CSF�s measurements (no training), visualacuity in the amblyopic eyes and fellow eyes improved0.1 dB (or 0.9%; t (5) = 0.43, p > 0.10; SE, 0.3 dB; range,�1.1 to 1.0 dB; median, 0 dB) and 0.7 dB (or 8.1%;t (5) = 1.40, p > 0.10; SE, 0.5 dB; range, 0–2.9 dB; medi-an, 0 dB), respectively (Table 2). The improvement wasnot significant for both eyes. No statistical significancebetween them (t (5) = 1.13, p > 0.10) can be detected.
3.4. Comparisons of the training protocols
The magnitudes of improvements, measured in termsof percent change of average CSF, maximum contrastsensitivity, cut-off spatial frequency, and visual acuity,are summarized in Fig. 6 for the three groups.
Treating spatial frequency as a within-subject factorand training protocol as the between-subject factor, weperformed an analysis of variance test to compare theefficacies of the training protocols on CSF. In thetrained amblyopic eyes, the training protocols producedsignificantly different improvements on CSF
(F (2,24) = 4.748, p < 0.05). Tukey HSD post hoc testsfound that CSF improvements in Group I are signifi-cantly greater than those in Group III (p < 0.05, asshown in Fig. 6), while no significant difference wasfound between Groups I and II (p > 0.40), and betweenGroups II and III (p > 0.10). In the untrained felloweyes, no statistical difference was found among the threegroups (F (2,18) = 1.061, p > 0.10).
The efficacy of the training protocols on visual acuitywas compared using an analysis of variance test withobserver as the random factor. We found that the differ-ent training protocols produced significantly differentimprovements of visual acuity in the trained amblyopiceyes (F (2,20) = 16.79, p < 0.001) and in the untrainedfellow eyes (F (2,20) = 3.98, p < 0.05). Tukey HSD posthoc tests found that (Fig. 6), in the amblyopic eyes, bothGroup I and Group II improved more than Group III(both p < 0.001), while there was no significant differ-ence between Group I and Group II (p > 0.10); in theuntrained fellow eye, Group I improved significantlymore than Group II (p < 0.05) and marginally signifi-cantly more than Group III (p = 0.08), while there wasno significant difference between Group II and GroupIII (p > 0.99).
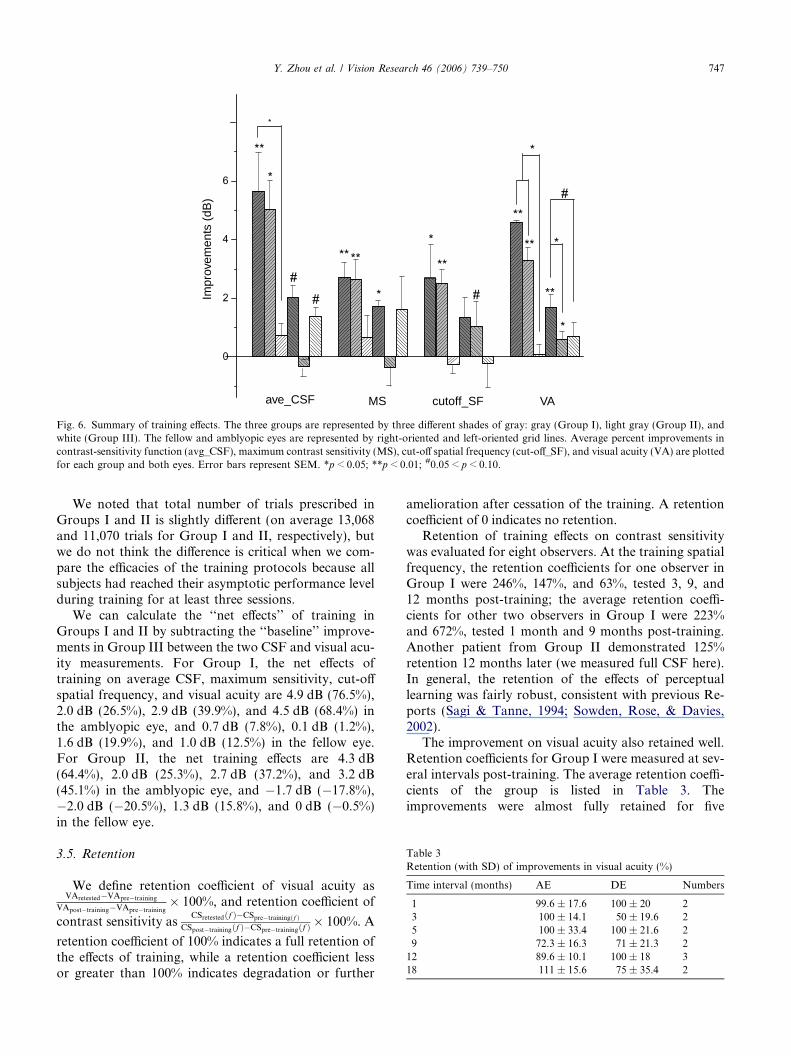
Table 3Retention (with SD) of improvements in visual acuity (%)
Time interval (months) AE DE Numbers
1 99.6 ± 17.6 100 ± 20 23 100 ± 14.1 50 ± 19.6 25 100 ± 33.4 100 ± 21.6 29 72.3 ± 16.3 71 ± 21.3 212 89.6 ± 10.1 100 ± 18 318 111 ± 15.6 75 ± 35.4 2
ave_CSF MS cutoff_SF VA
Impr
ovem
ents
(dB
)
Fig. 6. Summary of training effects. The three groups are represented by three different shades of gray: gray (Group I), light gray (Group II), andwhite (Group III). The fellow and amblyopic eyes are represented by right-oriented and left-oriented grid lines. Average percent improvements incontrast-sensitivity function (avg_CSF), maximum contrast sensitivity (MS), cut-off spatial frequency (cut-off_SF), and visual acuity (VA) are plottedfor each group and both eyes. Error bars represent SEM. *p < 0.05; **p < 0.01; #0.05 < p < 0.10.
Y. Zhou et al. / Vision Research 46 (2006) 739–750 747
We noted that total number of trials prescribed inGroups I and II is slightly different (on average 13,068and 11,070 trials for Group I and II, respectively), butwe do not think the difference is critical when we com-pare the efficacies of the training protocols because allsubjects had reached their asymptotic performance levelduring training for at least three sessions.
We can calculate the ‘‘net effects’’ of training inGroups I and II by subtracting the ‘‘baseline’’ improve-ments in Group III between the two CSF and visual acu-ity measurements. For Group I, the net effects oftraining on average CSF, maximum sensitivity, cut-offspatial frequency, and visual acuity are 4.9 dB (76.5%),2.0 dB (26.5%), 2.9 dB (39.9%), and 4.5 dB (68.4%) inthe amblyopic eye, and 0.7 dB (7.8%), 0.1 dB (1.2%),1.6 dB (19.9%), and 1.0 dB (12.5%) in the fellow eye.For Group II, the net training effects are 4.3 dB(64.4%), 2.0 dB (25.3%), 2.7 dB (37.2%), and 3.2 dB(45.1%) in the amblyopic eye, and �1.7 dB (�17.8%),�2.0 dB (�20.5%), 1.3 dB (15.8%), and 0 dB (�0.5%)in the fellow eye.
3.5. Retention
We define retention coefficient of visual acuity asVAretested�VApre�training
VApost�training�VApre�training� 100%, and retention coefficient of
contrast sensitivity asCSretestedðf Þ�CSpre�trainingðf Þ
CSpost�trainingðf Þ�CSpre�trainingðf Þ� 100%. A
retention coefficient of 100% indicates a full retention ofthe effects of training, while a retention coefficient lessor greater than 100% indicates degradation or further
amelioration after cessation of the training. A retentioncoefficient of 0 indicates no retention.
Retention of training effects on contrast sensitivitywas evaluated for eight observers. At the training spatialfrequency, the retention coefficients for one observer inGroup I were 246%, 147%, and 63%, tested 3, 9, and12 months post-training; the average retention coeffi-cients for other two observers in Group I were 223%and 672%, tested 1 month and 9 months post-training.Another patient from Group II demonstrated 125%retention 12 months later (we measured full CSF here).In general, the retention of the effects of perceptuallearning was fairly robust, consistent with previous Re-ports (Sagi & Tanne, 1994; Sowden, Rose, & Davies,2002).
The improvement on visual acuity also retained well.Retention coefficients for Group I were measured at sev-eral intervals post-training. The average retention coeffi-cients of the group is listed in Table 3. Theimprovements were almost fully retained for five
748 Y. Zhou et al. / Vision Research 46 (2006) 739–750
months, close to 90% for one year and more than 100%for one and a half year. The degree and duration ofretention seem to be better than those observed in a ver-nier training task (Levi & Polat, 1996).
4. Discussion
In the amblyopic eyes, training at a single spatial fre-quency improved contrast sensitivity by about 4.9 dB (or76.5%), averaged across all the spatial frequencies, andvisual acuity by about 4.5 dB (68.4%; Group I). Repeat-ed training over the entire range of spatial frequency usedin CSF test improved the average contrast sensitivity byabout 4.3 (64.4%), and visual acuity by about 3.2 dB(45.1%; Group II). No significant training effects werefound in the control group (Group III). Both trainingprotocols generated significantly more improvements inCSF and visual acuity than the passive control proce-dure. Even though on average larger amount of improve-ments was generated by training in one single spatialfrequency, the magnitudes of improvements producedby the two procedures were not statistically different.
Training at a single spatial frequency in the amblyo-pic eyes improved contrast sensitivity (0.7 dB or 7.8%,averaged across spatial frequencies) and visual acuity(1.0 dB or 12.5%) in the untrained, fellow eyes. Repeat-ed training over the entire range of spatial frequenciesused in CSF test and the control procedure did not sig-nificantly improve CSF or visual acuity in the felloweyes for most observers.
Compared to the control group, both training proto-cols produced significant improvements in CSF andvisual acuity, indicating significant performanceimprovements due to training rather than re-testing.Group I improved most in terms of CSF and visual acu-ity in both the amblyopic and the fellow eyes, eventhough the magnitudes of improvements produced bythe two training protocols are not statistically different.Among the three training protocols tested, the mosteffective training protocol was therefore practice ofsine-wave grating detection near the cut-off frequency.
We chose to investigate the effects of perceptuallearning on both contrast-sensitivity function and visualacuity because contrast sensitivity is believed to be afundamental characteristic of the visual system and themost important measure in spatial vision (Nicholas,Heywood, & Cowey, 1996). Our results complementthose of Levi and Polat (1996) and Levi et al. (1997)who trained adult amblyopes in a vernier task andshowed a 50% performance (�3.5 dB) improvementsafter eight (or so) sessions of training, and those of Polatet al. (2004), that documented a 2-fold (�9.5 dB) con-trast sensitivity improvement in adult amblyopes follow-ing training in Gabor detection (with and withoutflankers). In the two previous and the current studies,
training in some basic psychophysical task also im-proved visual acuity. On the other hand, ‘‘direct’’ train-ing in a letter acuity task did not produce considerableimprovements in peripheral visual acuity (Westheimer,2001). Perhaps training in basic psychophysical tasksimproved processing/coding of basic visual features thatin turn facilitated performance in the high-level visualacuity task, while training of visual acuity may not haveallowed direct access to some of the basic visual features(Ahissar & Hochstein, 1996; Dosher & Lu, 1998).
For Group I, training at a single spatial frequencynear the initial cut-off of the contrast-sensitivity functionimproved contrast sensitivity over a wide range of spa-tial frequencies. The range of spatial frequency overwhich learning generalized in the amblyopic eyes seemedto be much wider than that documented in para-fovea ofnormal observers (Sowden et al., 2002). This potentiallyinteresting aspect of perceptual learning in amblyopes isdiscussed in detail in another manuscript (Lu, Huang, &Zhou, in preparation).
Different patterns of inter-occular transfer of percep-tual learning from the trained amplyopic eyes to the un-trained fellow eyes were found in Group I and Group II,following different training schemes. While significantperformance improvements were observed in the felloweyes in Group I after training at a single spatial frequen-cy in the amblyopic eyes, no significant inter-occulartransfer was found in Group II, who participated inrepeated CSF measurements. Why the two training pro-tocols generated these different results is beyond thescope of the current study. Nevertheless the effect isinteresting and worth further investigation.
Retention of the training effects was excellent for thefew observers tested: improvements on visual acuitywere fully retained for at least 5 months and were closeto 90% 1 year post-training. It can also be fully retainedfor one and a half years in two subjects tested. The con-siderable degree of improvements on CSF and visualacuity as well as the excellent retention suggests thatperceptual learning might be of great clinical value intreating adult amblyopes (Polat et al., 2004), and theage-boundary for amblyopia treatment may not be sohard-wired as is maintained in the current literature onthe topic (Levi et al., 1997). For child amblyopes, com-bining the active, intensified perceptual learning methodwith the conventional occlusion procedures may alsopotentially increase the efficacy of the conventional pro-cedures. A large-scale, carefully controlled clinical studyis necessary to further evaluate perceptual learning as aclinical tool for treating child and adult amblyopia.
Acknowledgments
This research was supported by the National NaturalScience Foundation of China (grant 30128006 to Z.-L.
Y. Zhou et al. / Vision Research 46 (2006) 739–750 749
Lu), National Basic Research Program(2006CB500804), Foundation of Chinese Academy ofSciences (grants KGCX2-SW-101), and State Key Lab-oratory of Brain and Cognitive Science, Institute of Bio-physics, Chinese Academy of Sciences.
References
Ahissar, M., & Hochstein, S. (1996). Learning pop-out detection:Specificities to stimulus characteristics. Vision Research, 36(21),3487–3500.
Asper, L., Crewther, D., & Crewther, S. G. (2000). Strabismicamblyopia. Part 1, Psychophysics. Clinical & Experimental Optom-
etry, 83(2), 49–58.Barrett, B. T., Bradley, A., & McGraw, P. V. (2004). Understanding
the neural basis of amblyopia. Neuroscientist, 10(2), 106–117.Berardi, N., Pizzorusso, T., Ratto, G. M., & Maffei, L. (2003).
Molecular basis of plasticity in the visual cortex. Trends in
Neuroscience, 26(7), 369–378.Birnbaum, M. H., Koslowe, K., & Sanet, R. (1977). Success in
ambylopia therapy as a function of age: A literature survey.American Journal of Optometry and Physiological Optics, 54(5),269–275.
Bonneh, Y. S., Sagi, D., & Polat, U. (2004). Local and non-localdeficits in amblyopia: Acuity and spatial interactions. Vision
Research, 44(27), 3099–3110.Brainard, D. H. (1997). The psychophysics toolbox. Spatial Vision,
10(4), 433–436.Campbell, F. W., Hess, R. F., Watson, P. G., & Banks, R. (1978).
Preliminary results of a physiologically based treatment of ambly-opia. British Journal of Ophthalmology, 62(11), 748–755.
Campos, E. (1995). Amblyopia. Survey of Ophthalmology, 40(1),23–39.
Chino, Y. M. (1995). Adult plasticity in the visual system. CanadianJournal of Physiology Pharmacology, 73(9), 1323–1338.
Chung, S. T., Legge, G. E., & Tjan, B. S. (2002). Spatial-frequencycharacteristics of letter identification in central and peripheralvision. Vision Research, 42(18), 2137–2152.
Chung, S. T., Levi, D. M., Legge, G. E., & Tjan, B. S. (2002). Spatial-frequency properties of letter identification in amblyopia. VisionResearch, 42(12), 1571–1581.
Ciuffreda, K. J., Levi, D. M., & Selenow, A. (1991). Amblyopia: Basic
and clinical aspects. Boston: Butterworth-Heinemann.Ciuffreda, K. J., Goldner, K., & Connelly, R. (1980). Lack of positive
results of a physiologically based treatment of amblyopia. BritishJournal of Ophthalmology, 64(8), 607–612.
Daw, N. W. (1998). Critical periods and amblyopia. Archives of
Ophthalmology, 116(4), 502–505.Dosher, B. A., & Lu, Z. L. (1998). Perceptual learning reflects external
noise filtering and internal noise reduction through channelreweighting. Proceedings of National Academy of Sciences of the
United States of America, 95(23), 13988–13993.Dragoi, V., Sharma, J., & Sur, M. (2000). Adaptation-induced
plasticity of orientation tuning in adult visual cortex. Neuron,
28(1), 287–298.Fahle, M. (1997). Specificity of learning curvature, orientation, and
vernier discriminations. Vision Research, 37(14), 1885–1895.Fahle, M. (2004). Perceptual learning: A case for early selection.
Journal of Vision, 4879–4890.Fahle, M., & Edelman, S. (1993). Long-term learning in vernier acuity:
Effects of stimulus orientation, range and of feedback. Vision
Research, 33(3), 397–412.Flynn, J. T., Schiffman, J., Feuer, W., & Corona, A. (1998). The
therapy of amblyopia: An analysis of the results of amblyopia
therapy utilizing the pooled data of published studies. Transactionof the American Ophthalmological Society, 96431–96450, discussion450-3.
Gilbert, C. D., Sigman, M., & Crist, R. E. (2001). The neural basis ofperceptual learning. Neuron, 31(5), 681–697.
Greenwald, M. J., & Parks, M. M. (1999). In T. Duane (Ed.), Clinicalophthalomogy, Vol. 1. MD, Harper and Row, Hagerstown.
Hess, R. F., & Pointer, J. S. (1985). Differences in the neural basis ofhuman amblyopia: The distribution of the anomaly across thevisual field. Vision Research, 25(11), 1577–1594.
Kiorpes, L., & McKee, S. P. (1999). Neural mechanisms underlyingamblyopia. Current Opinion in Neurobiology, 9(4), 480–486.
Kiorpes, L., Tang, C., & Movshon, J. A. (1999). Factors limitingcontrast sensitivity in experimentally amblyopic macaque monkeys.Vision Research, 39(25), 4152–4160.
Kornowski, J. A., & Petersik, J. T. (2003). Effects on face recognitionof spatial-frequency information contained in inspection and teststimuli. Journal of General Psychology, 130(3), 229–244.
Kupfer, C. (1957). Treatment of amblyopia exanopsia in adults; apreliminary report of seven cases. American Journal of Ophthal-
mology, 43(6), 918–922.Levi, D. M., & Klein, S. (1982). Differences in vernier discrimination
for grating between strabismic and anisometropic amblyopes.Investigative Ophthalmology & Visual Science, 23(3), 398–407.
Levi, D. M., & Polat, U. (1996). Neural plasticity in adults withamblyopia. Proceedings of National Academy of Sciences of the
United States of America, 93(13), 6830–6834.Levi, D. M., Polat, U., & Hu, Y. S. (1997). Improvement in vernier
acuity in adults with amblyopia. Practice makes better. Investiga-tive Ophthalmology & Visual Science, 38(8), 1493–1510.
Levine, S. M. (1988). Adult visual system plasticity. Journal of
American Optometric Association, 59(2), 135–139.Li, X., Lu, Z. L., Xu, P., Jin, J., & Zhou, Y. (2003). Generating high
gray-level resolution monochrome displays with conventionalcomputer graphics cards and color monitors. Journal of Neurosci-
ence Methods, 130(1), 9–18.Loudon, S. E., Polling, J. R., & Simonsz, H. J. (2002). A preliminary
report about the relation between visual acuity increase andcompliance in patching therapy for amblyopia. Strabismus, 10(2),79–82.
Lu, Z.-L., Huang, C., & Zhou, Y. (in preparation). Adult Amblyopesreserve more plasticity than Normal Adults–A Study of PerceptualLearning.
McKee, S. P., Levi, D. M., & Movshon, J. A. (2003). The pattern ofvisual deficits in amblyopia. Journal of Vision, 3(5), 380–405.
Mehdorn, E., Mattheus, S., Schuppe, A., Klein, U., & Kommerell, G.(1981). Treatment for amblyopia with rotating gratings andsubsequent occlusion: A controlled study. International Ophthal-
mology, 3(3), 161–166.Mou, T. (1966). Logarithmic visual acuity chart and five-score
recording. Chinese Journal of Ophthalmology, 13(1), 96–106 (inChinese).
Nicholas, J. J., Heywood, C. A., & Cowey, A. (1996). Contrastsensitivity in one-eyed subjects. Vision Research, 36(1), 175–180.
Pizzorusso, T., Medini, P., Berardi, N., Chierzi, S., Fawcett, J. W.,et al. (2002). Reactivation of ocular dominance plasticity in theadult visual cortex. Science, 298(5596), 1248–1251.
Polat, U., Bonneh, Y., Ma-Naim, T., Belkin, M., & Sagi, D. (2005).Spatial interactions in amblyopia: Effects of stimulus parametersand amblyopia type. Vision Research, 45(11), 1471–1479.
Polat, U., Ma-Naim, T., Belkin, M., & Sagi, D. (2004). Improvingvision in adult amblyopia by perceptual learning. Proceedings of
National Academy of Sciences of the United States of America,
101(17), 6692–6697.Rohaly, A. M., & Buchsbaum, G. (1988). Inference of global
spatiochromatic mechanisms from contrast sensitivity functions.Journal of the Optical Society of America A, 5(4), 572–576.

750 Y. Zhou et al. / Vision Research 46 (2006) 739–750
Rohaly, A. M., & Buchsbaum, G. (1989). Global spatiochromaticmechanism accounting for luminance variations in contrast sensi-tivity functions. Journal of the Optical Society of America A, 6(2),312–317.
Safran, A. B., & Landis, T. (1996). Plasticity in the adult visualcortex: Implications for the diagnosis of visual field defects andvisual rehabilitation. Current Opinion in Ophthalmology, 7(6),53–64.
Sagi, D., & Tanne, D. (1994). Perceptual learning: Learning to see.Current Opinion in Neurobiology, 4(2), 195–199.
Schor, C., & Wick, B. (1983). Rotating grating treatment of amblyopiawith and without eccentric fixation. Journal of American Optomet-
ric Association, 54(6), 545–549.Shiu, L. P., & Pashler, H. (1992). Improvement in line orientation
discrimination is retinally local but dependent on cognitive set.Perception & Psychophysics, 52(5), 582–588.
Simmers, A. J., & Gray, L. S. (1999). Improvement of visual functionin an adult amblyope. Optometry and Vision Science, 76(2), 82–87.
Sowden, P. T., Rose, D., & Davies, I. R. (2002). Perceptual learning ofluminance contrast detection: Specific for spatial frequency andretinal location but not orientation. Vision Research, 42(10),1249–1258.
Terrell, A. (1981). Cambridge stimulator treatment for amblyopia. Anevaluation of 80 consecutive cases treated by this method.Australian Journal of Ophthalmology, 9(2), 121–127.
Westheimer, G. (2001). Is peripheral visual acuity susceptible toperceptual learning in the adult. Vision Research, 41(1), 47–52.
Wick, B., Wingard, M., Cotter, S., & Scheiman, M. (1992). Anisome-tropic amblyopia: Is the patient ever too old to treat. Optometry
and Vision Science, 69(11), 866–878.Zanker, J. M. (1999). Perceptual learning in primary and secondary
motion vision. Vision Research, 39(7), 1293–1304.