Use Case Development Report – V1 - ES
95
PROPRIETARY RIGHTS STATEMENT THIS DOCUMENT CONTAINS INFORMATION, WHICH IS PROPRIETARY TO THE CRYSTAL CONSORTIUM. NEITHER THIS DOCUMENT NOR THE INFORMATION CONTAINED HEREIN SHALL BE USED, DUPLICATED OR COMMUNICATED BY ANY MEANS TO ANY THIRD PARTY, IN WHOLE OR IN PARTS, EXCEPT WITH THE PRIOR WRITTEN CONSENT OF THE CESAR CONSORTIUM THIS RESTRICTION LEGEND SHALL NOT BE ALTERED OR OBLITERATED ON OR FROM THIS DOCUMENT. THE RESEARCH LEADING TO THESE RESULTS HAS RECEIVED FUNDING FROM THE EUROPEAN UNION’S SEVENTH FRAMEWORK PROGRAM (FP7/2007-2013) FOR CRYSTAL – CRITICAL SYSTEM ENGINEERING ACCELERATION JOINT UNDERTAKING UNDER GRANT AGREEMENT N° 332830 AND FROM SPECIFIC NATIONAL PROGRAMS AND / OR FUNDING AUTHORITIES. CRitical SYSTem Engineering AcceLeration Use Case Development Report – V1 D402.901
-
Upload
khangminh22 -
Category
Documents
-
view
1 -
download
0
Transcript of Use Case Development Report – V1 - ES
PROPRIETARY RIGHTS STATEMENT
THIS DOCUMENT CONTAINS INFORMATION, WHICH IS PROPRIETARY TO THE CRYSTAL CONSORTIUM. NEITHER THIS DOCUMENT NOR THE INFORMATION CONTAINED HEREIN SHALL BE USED, DUPLICATED OR COMMUNICATED BY ANY MEANS TO ANY THIRD PARTY, IN WHOLE OR IN PARTS, EXCEPT WITH THE PRIOR WRITTEN CONSENT OF THE CESAR CONSORTIUM THIS RESTRICTION LEGEND SHALL NOT BE ALTERED OR OBLITERATED ON OR FROM THIS DOCUMENT. THE RESEARCH LEADING TO THESE RESULTS HAS RECEIVED FUNDING FROM THE EUROPEAN UNION’S SEVENTH FRAMEWORK PROGRAM (FP7/2007-2013) FOR CRYSTAL – CRITICAL SYSTEM ENGINEERING ACCELERATION JOINT UNDERTAKING UNDER GRANT AGREEMENT N° 332830 AND FROM SPECIFIC NATIONAL PROGRAMS AND / OR FUNDING AUTHORITIES.
CRitical SYSTem Engineering AcceLeration
Use Case Development Report – V1
D402.901
D402.901 Use Case Development Report – V1
Version Nature Date Page
V1.00 R 2014-04-30 2 of 66
DOCUMENT INFORMATION
Project CRYSTAL
Grant Agreement No. ARTEMIS-2012-1-332830
Deliverable Title Use Case Development Report – V1
Deliverable No. D402.901
Dissemination Level CO
Nature R
Document Version V1.0
Date 2014-04-30
Contact Rob Ekkel
Organization Philips
Phone +31 6 10084377
E-Mail [email protected]
D402.901 Use Case Development Report – V1
Version Nature Date Page
V1.00 R 2014-04-30 3 of 66
AUTHORS TABLE
Name Company E-Mail
M. Artz Philips [email protected]
I. van Binsbergen Philips [email protected]
B. Cruts Philips [email protected]
W. Spaak Philips [email protected]
R. Bezemer TNO [email protected]
S. Kalisvaart TNO [email protected]
E. Somers TNO [email protected]
CHANGE HISTORY
Version Date Reason for Change Pages affected
V0.1 2014-04-17 Initial version for internal Crystal review
V1.0 2014-04-29 update after internal Crystal review
D402.901 Use Case Development Report – V1
Version Nature Date Page
V1.00 R 2014-04-30 4 of 66
CONTENT
1 INTRODUCTION ...................................................................................................................................................... 6
1.1 ROLE OF DELIVERABLE ....................................................................................................................................... 6 1.2 RELATIONSHIP TO OTHER CRYSTAL DOCUMENTS .......................................................................................... 6 1.3 STRUCTURE OF THIS DOCUMENT ....................................................................................................................... 7
2 USE CASE 4.2 OVERALL RISK MANAGEMENT PROCESS ........................................................................ 8
2.1 INTRODUCTION .................................................................................................................................................... 8 2.2 MEDICAL USE CASE AND FUNCTIONS ................................................................................................................. 8 2.3 CHALLENGES AT M0 ........................................................................................................................................... 9
3 ENGINEERING WORKFLOW ............................................................................................................................. 10
3.1 ENGINEERING WORKFLOW AT M0 .................................................................................................................... 10 3.2 INITIATIVES STARTED ........................................................................................................................................ 14
3.2.1 A1 - Product Risk Management Improvements ................................................................................. 14 3.2.2 A2 - Analysis of safety risk management process (TNO, ITKE) ..................................................... 24 3.2.3 A3 - Safety incident search tool for safety risk management (TNO) .............................................. 32 3.2.4 A4 - Product Risk Management (QlikView) Application ................................................................... 36
3.3 ENGINEERING WORKFLOW AT M12 .................................................................................................................. 44 3.4 PROJECT INNOVATIONS .................................................................................................................................... 45 3.5 ENGINEERING METHODS .................................................................................................................................. 46 3.6 ENVISIONED ENGINEERING WORKFLOW ........................................................................................................... 46
4 BUILDING SEE ...................................................................................................................................................... 47
4.1 SEE AT M0 ....................................................................................................................................................... 47 4.2 SEE AT M12 ..................................................................................................................................................... 48 4.3 TOOL CHAIN DESCRIPTION ................................................................................................................................ 49
4.3.1 Safety incident search tool (or MAUDE Database Extractor) .......................................................... 49 4.3.2 QlikView ................................................................................................................................................... 49 4.3.3 Excel......................................................................................................................................................... 49
5 DEMONSTRATOR DESCRIPTIONS ................................................................................................................. 50
5.1 TNO SAFETY INCIDENT SEARCH TOOL ............................................................................................................. 50
6 CONCLUSION AND WAY AHEAD .................................................................................................................... 54
6.1 EVALUATION ...................................................................................................................................................... 54 6.1.1 Use Case Development lessons learned ........................................................................................... 54 6.1.2 Cross domain lessons learned ............................................................................................................. 54
6.2 PLANNED FUTURE WORK ON ENGINEERING WORKFLOW ................................................................................ 54 6.2.1 Product Risk Management Improvements ......................................................................................... 54 6.2.2 Safety incident search tool .................................................................................................................... 55 6.2.3 Safety risk management tooling ........................................................................................................... 56
6.3 PLANNED FUTURE WORK ON BUILDING SEE ................................................................................................... 56 6.3.1 Safety incident search tool for risk management (TNO) .................................................................. 56 6.3.2 Product Risk Management (QlikView) Application ............................................................................ 56
6.4 PLANNED FUTURE WORK ON INTEGRATING SEE IN R&D PROJECTS .............................................................. 56 6.4.1 Safety risk management tooling ........................................................................................................... 56
7 GLOSSARY ............................................................................................................................................................ 58
CONTENT OF FIGURES
Figure 1: Crystal timeline .................................................................................................................................... 6
D402.901 Use Case Development Report – V1
Version Nature Date Page
V1.00 R 2014-04-30 5 of 66
Figure 2: Crystal project structure ...................................................................................................................... 6 Figure 3: Philips’ path from a qualitative Risk analysis toward a pro-active quantitative Risk analysis ............. 9 Figure 4: Engineering workflow at M0 .............................................................................................................. 11 Figure 5: Example of RMM @M0 ..................................................................................................................... 12 Figure 6: Example of a page from the HHM-codes document ......................................................................... 15 Figure 7: Risk Management document structure ............................................................................................. 18 Figure 8: Example of a generated Excel RMM tab ........................................................................................... 21 Figure 9: Safety Management Process – 1 ...................................................................................................... 27 Figure 10: Safety Management Process – 2 .................................................................................................... 27 Figure 11: Safety Management Process – 3 .................................................................................................... 28 Figure 12: H-model representing parallel application model, validation and structure model development .... 29 Figure 13: Core and refined requirements shown in the H-model ................................................................... 30 Figure 14: QlikView Access Point ..................................................................................................................... 38 Figure 15: iXR Navigator .................................................................................................................................. 39 Figure 16: Overview of required data sources and combining the data to QlikView. ....................................... 40 Figure 17: QlikView Design set-up ................................................................................................................... 41 Figure 18: Engineering workflow at M12 .......................................................................................................... 44 Figure 19: Engineering methods ...................................................................................................................... 46 Figure 20: Overview of the Systems Engineering Environment at M0 ............................................................. 47 Figure 21: Overview of the Systems Engineering Environment at M12 ........................................................... 48 Figure 22: Closed loop E2E product risk management .................................................................................... 55 Figure 23: Safety risk management data objects in the H-model .................................................................... 57
Content of Tables
Table 1: Severity levels..................................................................................................................................... 10 Table 2: Probability levels (qualitative) ............................................................................................................. 10 Table 3: Risk Matrix example ........................................................................................................................... 11 Table 4: Probability levels (quantitative) ........................................................................................................... 14 Table 5: FMEA Excel fields............................................................................................................................... 20 Table 6: Mapping between planned and initiated activities and the User Stories allocated to WP4.2............. 60
Content of Appendix
ANNEX A: MAPPING BETWEEN WP4.2 ACTIVITIES AND ALLOCATED USER STORIES ........................ 60
ANNEX B: DETAILED DESCRIPTIONS OF THE ENGINEERING METHODS.................................................. 61
ANNEX B1: ENGINEERING METHOD UC4.2 COMPLAINT RISK EVALUATION ........................................... 61
ANNEX B2: ENGINEERING METHOD UC4.2 COLLECT AND ANALYSE ADVERSE SAFETY EVENTS . 62
ANNEX B3: ENGINEERING METHOD UC4.2 FIELD SURVEILLANCE ............................................................. 63
ANNEX B4: ENGINEERING METHOD UC4.2 IMPACT DESIGN CHANGES .................................................... 64
ANNEX B5: ARTEFACTS............................................................................................................................................ 65
ANNEX C: UPDATED USE CASE DEFINITION REPORT .................................................................................... 66
D402.901 Use Case Development Report – V1
Version Nature Date Page
V1.00 R 2014-04-30 6 of 66
1 Introduction
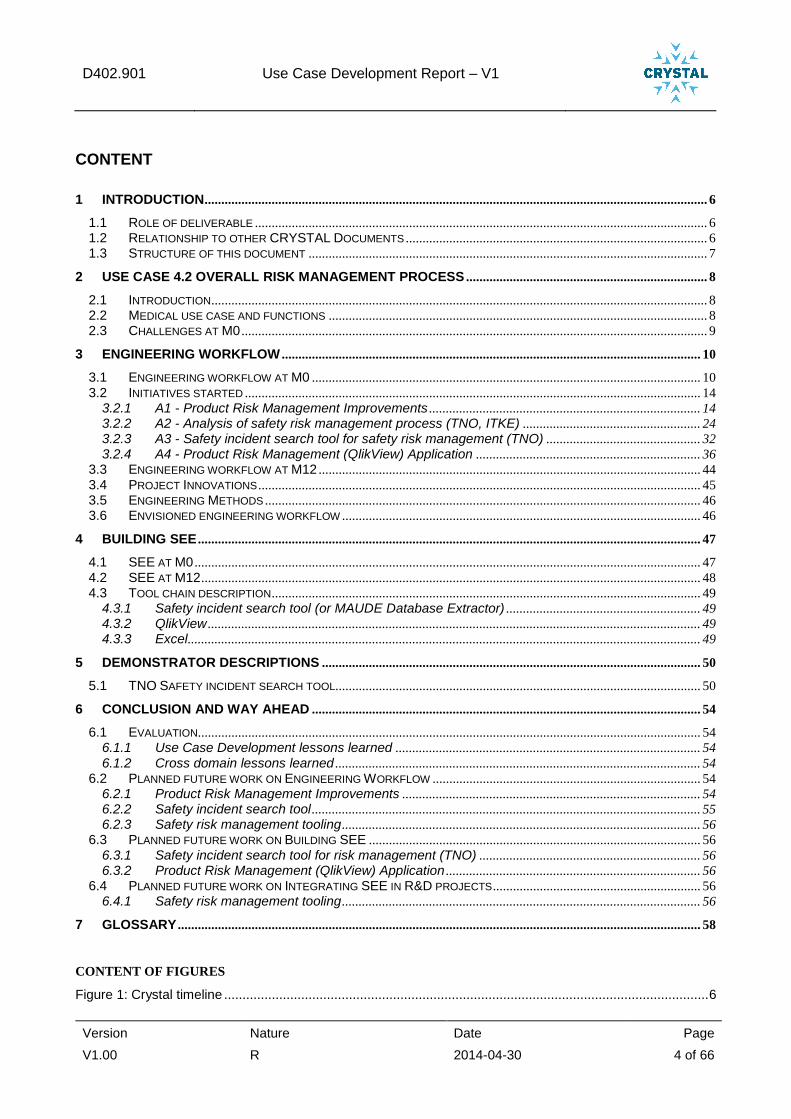
1.1 Role of deliverable The intention of this Use Case Development Report is to provide an (annual) overview on the status of engineering methods, engineering environment and improvement activities related to the development of Use Case 4.2 Overall Risk Management Process. As depicted in the figure below, its content will vary over time, in line with the phase of the Crystal project it is reporting upon.
Figure 1: Crystal timeline
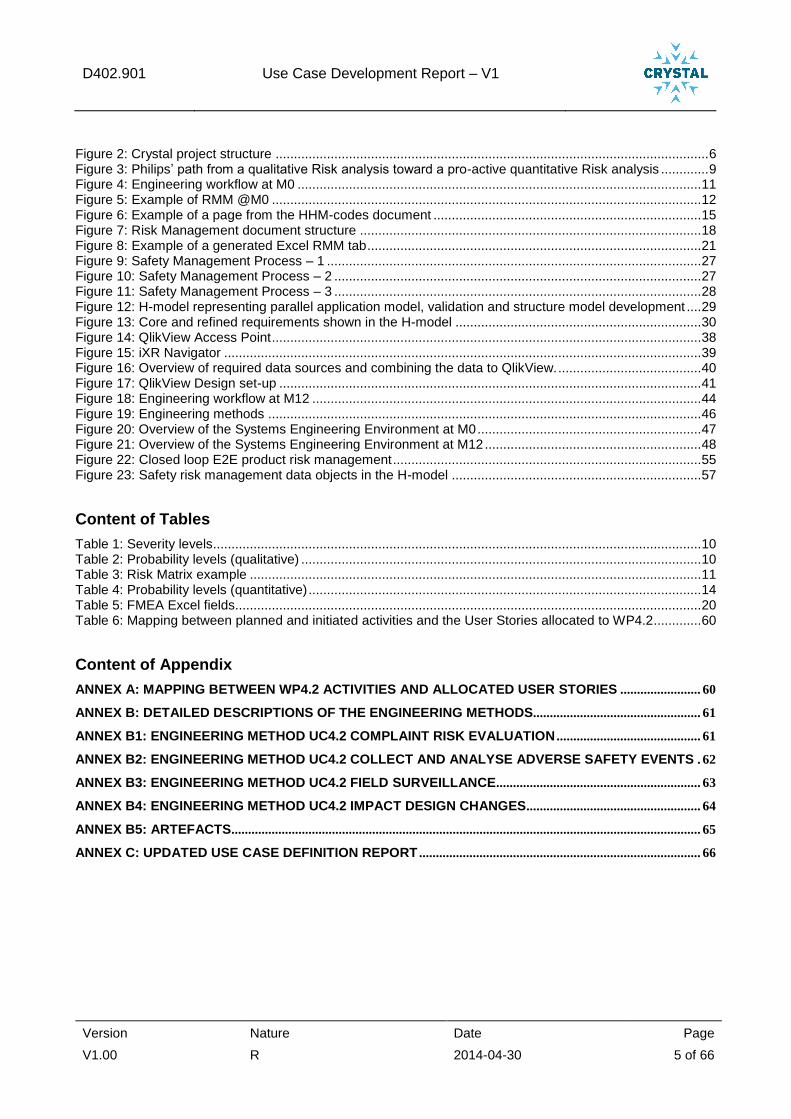
1.2 Relationship to other CRYSTAL Documents
The figure below provides a general overview of the internal structure of the Crystal project. This work package is part of the Healthcare domain (SP4). Its information and reports are input for WP6.
SP2 Domain
AEROSPACE
SP6 R&T Activities 6.1 IOS Evolution & Development, Standardisation 6.2 Platform builder 6.3-6.13 Technology bricks development/improvement and integration (incl. technical topics and methodologies), based on service oriented architecture and ontologies
SP3 Domain
AUTOMOTIVE
SP4 Domain HEALTH
CARE
SP5 Domain
RAIL
SP1 Project Mgmt & Exploitation Project Mgmt, Exploitation & Dissemination (Perennial techn. bricks, Showroom) Steering board
Standard Organizations
Other Academia Other SME
Other Projects
Insid
e P
roje
ct
Ou
tsid
e
US
E C
AS
ES
Tech
nic
al To
pic
s
Figure 2: Crystal project structure
This document is closely related to the Use Case Definition Report for Use Case 4.2 Overall Risk Management Process (refer to document: D402.010). Where the Use Case Definition Report elaborates on the technical details and the safety risk management decision making process, the Use Case Development Report is used to provide a condensed overview of the planned and scheduled improvement activities, with an Executive summary on the description of work and its conclusions.
D402.901 Use Case Development Report – V1
Version Nature Date Page
V1.00 R 2014-04-30 7 of 66
1.3 Structure of this document The structure of the document is as follows:
Section 2 briefly restates the original Use Case description as defined in the Crystal project proposal and highlights the organization challenges faced.
Section 3 describes the development activities related to the engineering workflow for this work package. It describes the initiatives started, and the envisioned engineering workflow, planned to be available at the M36 milestone. It highlights the engineering methods associated with this work package.
Section 4 discusses the Systems Engineering Environment and the improvements made here. It also provides a description of the tool chain and its artefacts.
Section 5 provides a brief description on the content of the demonstrator prepared.
Section 6 elaborates on the lessons learned, both within the work package, from other industry partners, or cross-domain.
Annex A provides a mapping between the activities in the User Stories allocated to WP4.2 and the activities initiated or planned for in WP4.2.
Annex B captures the detailed descriptions of the engineering methods and the relevant artefacts.
Annex C provides an integral (updated) version of the Use Case Definition Report of Use Case 4.2.
D402.901 Use Case Development Report – V1
Version Nature Date Page
V1.00 R 2014-04-30 8 of 66
2 Use Case 4.2 Overall Risk Management Process
2.1 Introduction Whereas use cases WP401 and WP403 focus on improving the development process itself, use case WP402 is about improving the safety risk management process. In general, the safety risk management process is running in parallel to the development process. In short, the safety risk management process takes into account the system requirements and the system design and analyses whether additional risk control measures need to be implemented to fulfil safety requirements. It also covers the complete product lifecycle including risk management surveillance after the product has been released. In general, the safety risk management process also takes into account usability related safety aspects (IEC 62366) and aspects related to using the system in an IT-network (IEC 80001-1).
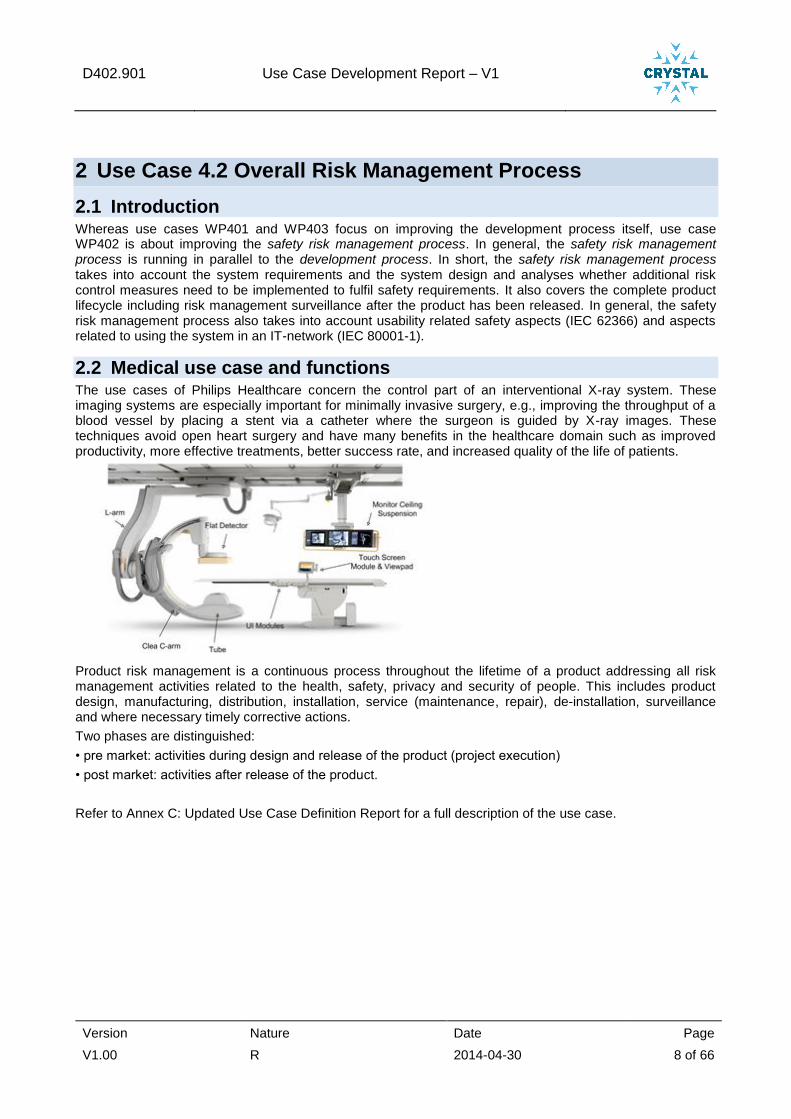
2.2 Medical use case and functions The use cases of Philips Healthcare concern the control part of an interventional X-ray system. These imaging systems are especially important for minimally invasive surgery, e.g., improving the throughput of a blood vessel by placing a stent via a catheter where the surgeon is guided by X-ray images. These techniques avoid open heart surgery and have many benefits in the healthcare domain such as improved productivity, more effective treatments, better success rate, and increased quality of the life of patients.
Product risk management is a continuous process throughout the lifetime of a product addressing all risk management activities related to the health, safety, privacy and security of people. This includes product design, manufacturing, distribution, installation, service (maintenance, repair), de-installation, surveillance and where necessary timely corrective actions.
Two phases are distinguished:
• pre market: activities during design and release of the product (project execution)
• post market: activities after release of the product.
Refer to Annex C: Updated Use Case Definition Report for a full description of the use case.
D402.901 Use Case Development Report – V1
Version Nature Date Page
V1.00 R 2014-04-30 9 of 66
2.3 Challenges at M0
Challenges in safety-critical system engineering:
The requirements for the safety risk management process are defined in ISO 14971: “Medical devices – Application of risk management to medical devices”, with the following extensions:
Usability IEC 62366 “accesses and mitigates risks caused by usability problems”
IT-networking IEC 80001-1 extends the definition of harm with: “Reduction in effectiveness or breath of data and system security”
The challenges here are:
1. To manage the overwhelming complexity of safety management and it’s reporting to FDA and Philips management, at an aggregated level to enable building an all-over opinion on the system safety level. With the very elaborate safety management and safety analysis information at individual part and cause level, this is no longer comprehensible for a normal human.
2. To embed comparison between estimated ‘residual risk’ (during pre-market design time) and ‘actual risk’ (actual observed risk based on post-market surveillance data) as a routine process into safety risk management. Such a comparison acts as learning cycle and would support realistic pre-market safety risk management likelihood estimations.
3. To be able to focus risk assessments separately on clinical and on technical safety, since the clinical view on safety hazards is quite different from the technical view on these hazards. One large safety FMEA, including both foci, is inefficient, since the participants have different background knowledge and skills.
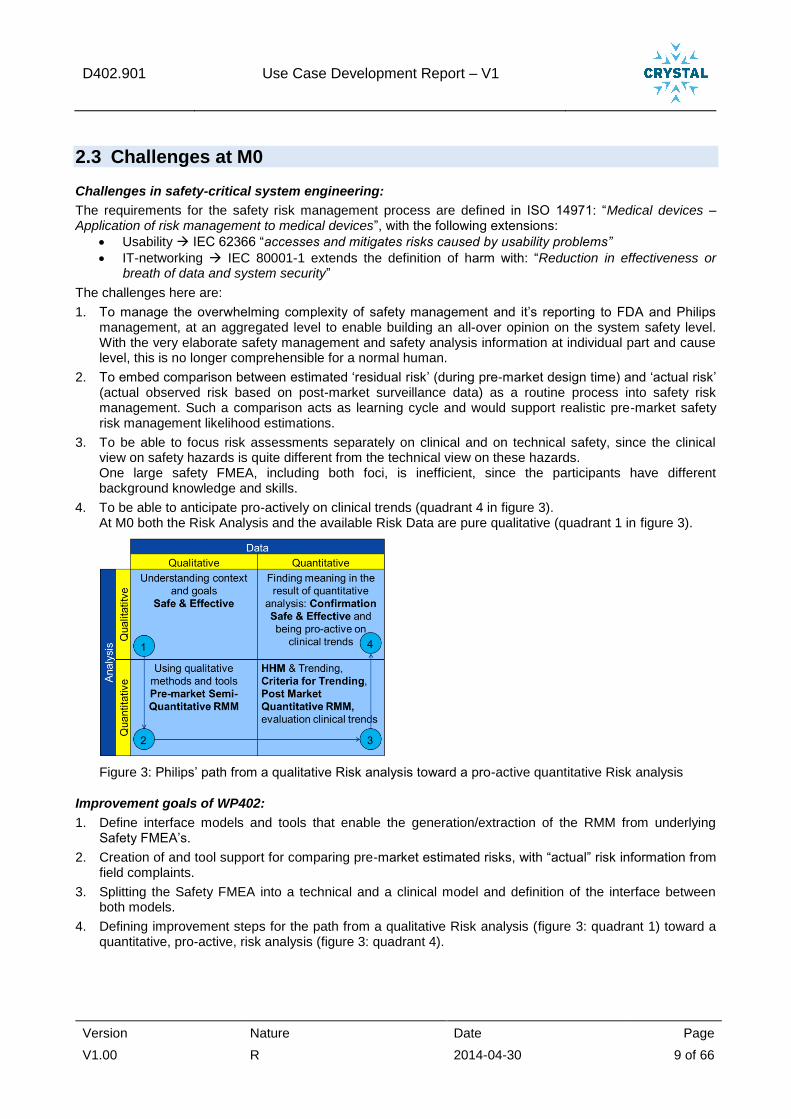
4. To be able to anticipate pro-actively on clinical trends (quadrant 4 in figure 3). At M0 both the Risk Analysis and the available Risk Data are pure qualitative (quadrant 1 in figure 3).
Figure 3: Philips’ path from a qualitative Risk analysis toward a pro-active quantitative Risk analysis
Improvement goals of WP402:
1. Define interface models and tools that enable the generation/extraction of the RMM from underlying Safety FMEA’s.
2. Creation of and tool support for comparing pre-market estimated risks, with “actual” risk information from field complaints.
3. Splitting the Safety FMEA into a technical and a clinical model and definition of the interface between both models.
4. Defining improvement steps for the path from a qualitative Risk analysis (figure 3: quadrant 1) toward a quantitative, pro-active, risk analysis (figure 3: quadrant 4).
D402.901 Use Case Development Report – V1
Version Nature Date Page
V1.00 R 2014-04-30 10 of 66
3 Engineering workflow Product risk management is a continuous process throughout the lifetime of a product addressing all risk
management activities related to the health, safety, privacy and security of people. This includes product
design, manufacturing, distribution, installation, service (maintenance, repair), de-installation, surveillance
and where necessary timely corrective actions.
3.1 Engineering workflow at M0
Introduction:
The terms used in this document are aligned with the definitions in ISO 14971:2007 (see also 7 Glossary).
Risk matrices are used to determine the degree of a risk and whether or not the risk is sufficiently controlled. The Risk Matrix shows how likely a certain harm severity is in a two dimensional matrix. A Risk Matrix is used during Risk Assessment to define the various risk levels, as the combination of the harm severity categories and harm probability categories. This is a simple mechanism to increase risk visibility and assist risk management decision making.
A Severity is the amount of harm that can be expected to occur during a given time period due to specific harm cause or event (e.g., an accident). In practice, the risk is usually categorized into a small number of levels because neither the harm probability nor the harm severity can typically be estimated with accuracy and precision during development. Once a data-driven pro-active risk management level is achieved (see figure 3), harm probability may be estimated more precisely. Severity might eventually be expressed in DALY (disability adjusted life years) but only for severe hazards. For smaller hazards, loss of productivity or costs of corrective actions or corrective treatment might be used as severity indicator.
Determination of Risk levels:
Severity
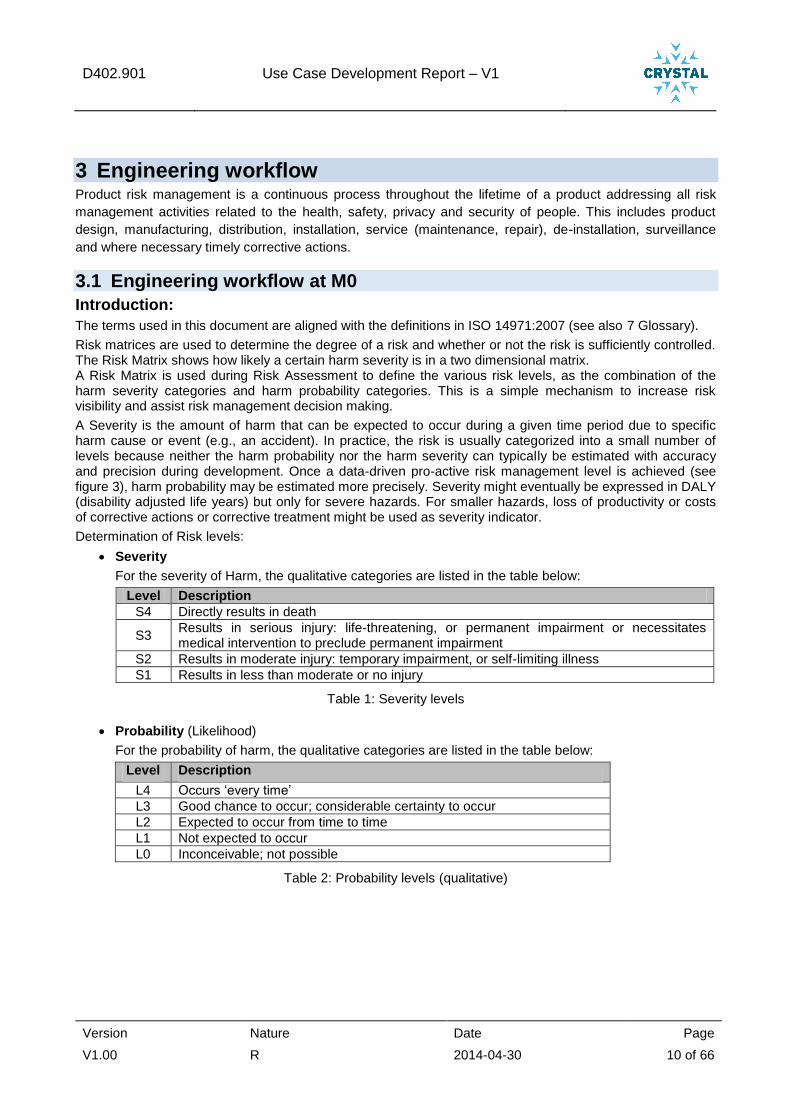
For the severity of Harm, the qualitative categories are listed in the table below:
Level Description
S4 Directly results in death
S3 Results in serious injury: life-threatening, or permanent impairment or necessitates medical intervention to preclude permanent impairment
S2 Results in moderate injury: temporary impairment, or self-limiting illness
S1 Results in less than moderate or no injury
Table 1: Severity levels
Probability (Likelihood)
For the probability of harm, the qualitative categories are listed in the table below:
Level Description
L4 Occurs ‘every time’
L3 Good chance to occur; considerable certainty to occur
L2 Expected to occur from time to time
L1 Not expected to occur
L0 Inconceivable; not possible
Table 2: Probability levels (qualitative)

D402.901 Use Case Development Report – V1
Version Nature Date Page
V1.00 R 2014-04-30 11 of 66
There are also criteria defined for the determination of the acceptability of risks:
Where for the risk applies:
unacceptable
further analysis required
acceptable
Table 3: Risk Matrix example
engineering workflow at M0:
The figure below shows the engineering workflow at the start of the Crystal project.
Figure 4: Engineering workflow at M0
Two phases are distinguished:
1. Pre-market activities (the grey blocks in the figure above) during design and release of the product
(project execution)
2. Post-market activities (green in the figure above) after release of the product.
1. Pre-market (New Product Introduction):
During New Product Introduction the agreed stakeholder needs are realised in a new product. This part
of the Engineering Workflow is described in WP401 (see D401.901 Medical procedures in an
interventional X-ray system)
For Product Risk Management, safety assessments are held. Input for the assessments are the Product
specifications and design documents. For all imaginable causes of harm for a particular hazard-category
D402.901 Use Case Development Report – V1
Version Nature Date Page
V1.00 R 2014-04-30 12 of 66
an initial risk (combination of harm probability and harm severity) is estimated (see also 3.2.1 –
Introduction, for a description of the used risk levels).
During safety assessments we used to estimate, for each individual harm cause, only the worst-case
quantitative level combination of likelihood and severity.
For risks that are ‘unacceptable’ or ‘requires further analysis’ (see table 3: risk matrix example),
mitigating Risk Control Measures must be defined to reduce the risk to an ‘acceptable’ residual risk level.
The residual risk is the remaining risk at product launch after all safety activities during development are
implemented.
Notice: In case a ‘further analysis required’ risk can’t be further mitigated, a Risk Benefit Analysis must
be made where advantages and disadvantages should be weighted.
These Risk Control Measures are new detailed product safety requirements and/or safety design
constraints that need to be taken into account while designing/developing the system.
They are built upon decades of experience in developing X-ray equipment and have proven to be
effective measures to eliminate or mitigate risks.
For smaller risks, standard FMEA activities are performed during engineering, to manage these risks.
Requirement and design changes always result in a new safety assessment (the purple arrow).
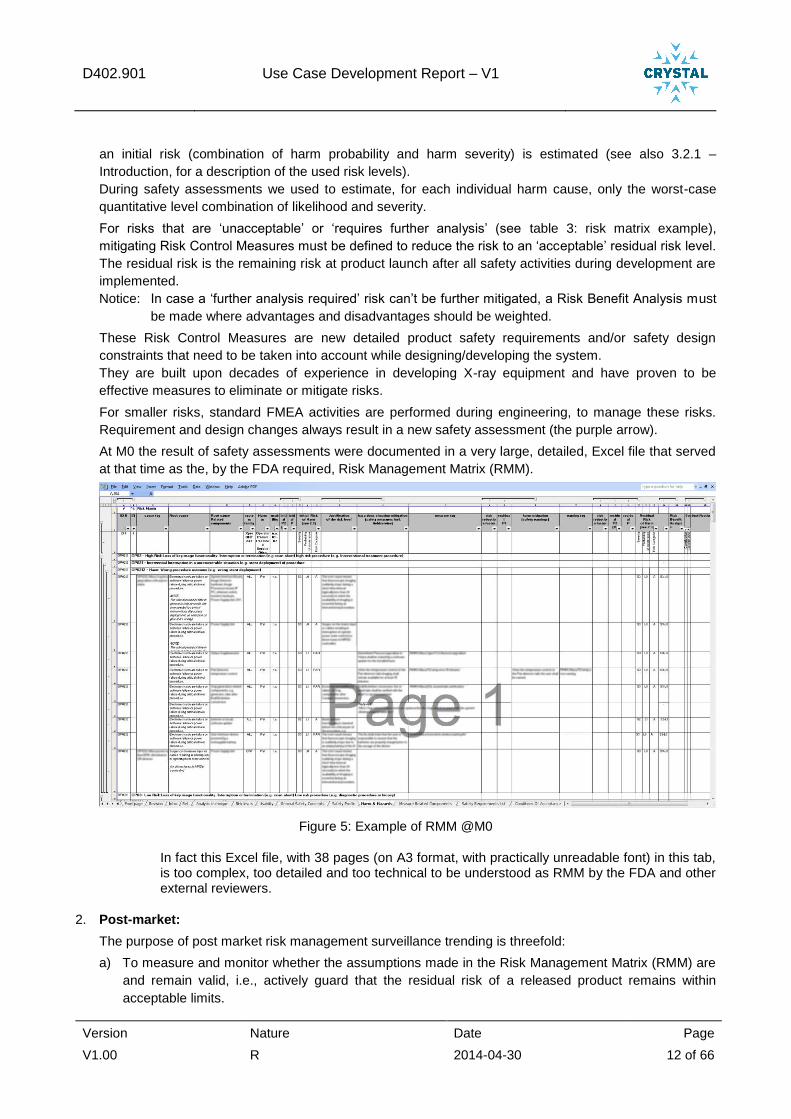
At M0 the result of safety assessments were documented in a very large, detailed, Excel file that served
at that time as the, by the FDA required, Risk Management Matrix (RMM).
Figure 5: Example of RMM @M0
In fact this Excel file, with 38 pages (on A3 format, with practically unreadable font) in this tab, is too complex, too detailed and too technical to be understood as RMM by the FDA and other external reviewers.
2. Post-market:
The purpose of post market risk management surveillance trending is threefold:
a) To measure and monitor whether the assumptions made in the Risk Management Matrix (RMM) are
and remain valid, i.e., actively guard that the residual risk of a released product remains within
acceptable limits.
D402.901 Use Case Development Report – V1
Version Nature Date Page
V1.00 R 2014-04-30 13 of 66
b) To identify and assess risks which were unknown at the release of a product. Symptoms that signal
a potential or actual change in risk are triggers to execute a risk assessment.
Routinely field complaints (including service work orders), the MAUDE adverse event database and
changes in standards and regulations are assessed for impact on risk management (see also 4.1).
Depending on the outcome of these checks a new safety risk assessment is initiated.
c) To identify whether or not the defined Essential Performance is still correct after releasing the
product.
The impact check of post market surveillance on the RMM is realised by manual filtering of field complaints and service work orders from the TrackWise field complaints database and manual impact/problem analyse on these filtered complaints. Another post-market source is the FDA’s MAUDE adverse event database, which is checked by manual webpage queries (status M0) for relevant events for our medical products.
Because at M0 the RMM is cause based, no comparison between the pre-market and post-market risk profile is possible.

D402.901 Use Case Development Report – V1
Version Nature Date Page
V1.00 R 2014-04-30 14 of 66
3.2 Initiatives started The following activities were started:
A1 - Product Risk Management Improvements (see 3.2.1)
A2 - Analysis of safety risk management process (TNO, ITKE) (see 3.2.2)
A3 - Safety incident search tool for safety risk management (TNO) (see 3.2.3)
A4 - Product Risk Management (QlikView) Application (see 3.2.4)
Described in both chapter 2: Engineering workflow and chapter 4: Building SEE.
3.2.1 A1 - Product Risk Management Improvements
Introduction:
Probability (Likelihood)
For the probability of harm, quantitative categories are added as indicated in the table below:
Where the probability or likelihood level is also expressed in Parts Per Million (ppm) clinical cases.
Level Probability
(ppm) Description
L4 >10.000 Occurs ‘every time’
L3 1000 – 10.000 Good chance to occur; considerable certainty to occur
L2 100 – 1000 Expected to occur from time to time
L1 10 – 100 Not expected to occur
L0 < 10 Inconceivable; not possible
Table 4: Probability levels (quantitative)
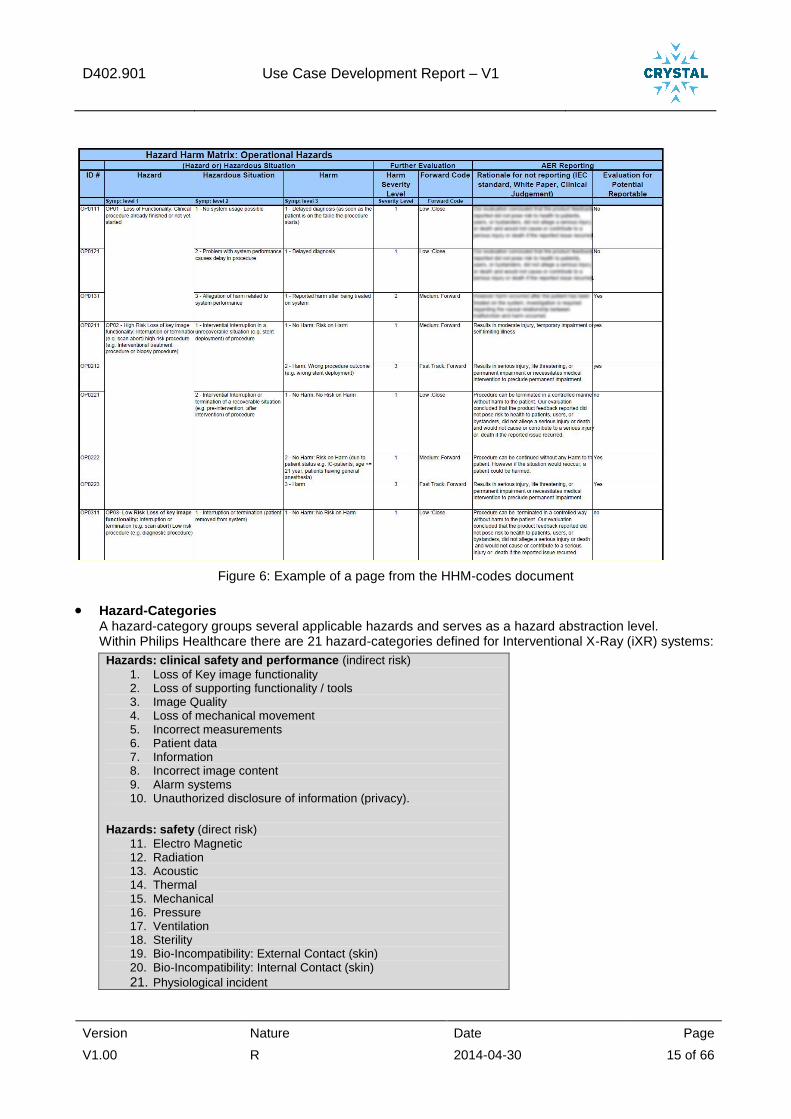
The explanations below help understanding the role of HHM-codes and Hazard-Categories in this document.
HHM (Hazard-Harm-Matrix) HHM-codes are used for problem trending (Adverse Event, Malfunction and Product Quality).
The HHM-code is added to the Product Feedback surveillance form and used in the field complaints handling database, to categorize the information and enable the proper disposition and prioritization in a uniform and timely manner. The HHM-code describes 3 factors (Hazard, Hazardous situation and Harm).
All combinations of cases are described in the Hazard Harm Matrix: o In a generic way, system independent o Related to Risk and thus potential events o It supports processes and enables trending by categorizing problems o Problem Trending reveals structural issues
D402.901 Use Case Development Report – V1
Version Nature Date Page
V1.00 R 2014-04-30 15 of 66
Figure 6: Example of a page from the HHM-codes document
Hazard-Categories A hazard-category groups several applicable hazards and serves as a hazard abstraction level. Within Philips Healthcare there are 21 hazard-categories defined for Interventional X-Ray (iXR) systems:
Hazards: clinical safety and performance (indirect risk)
1. Loss of Key image functionality 2. Loss of supporting functionality / tools 3. Image Quality 4. Loss of mechanical movement 5. Incorrect measurements 6. Patient data 7. Information 8. Incorrect image content 9. Alarm systems 10. Unauthorized disclosure of information (privacy).
Hazards: safety (direct risk)
11. Electro Magnetic 12. Radiation 13. Acoustic 14. Thermal 15. Mechanical 16. Pressure 17. Ventilation 18. Sterility 19. Bio-Incompatibility: External Contact (skin) 20. Bio-Incompatibility: Internal Contact (skin)
21. Physiological incident
D402.901 Use Case Development Report – V1
Version Nature Date Page
V1.00 R 2014-04-30 16 of 66
3.2.1.1 A rationale why the activity was needed
The result of medical equipment Safety Risk Assessments, are laid down in a so called Safety FMEA Excel document. This document identifies causes, links them to hazards and harm and identifies corresponding risk control measures. However, this document contains too much detail and is too technical to be understood by the US Food and Drug Administration (FDA) and other external reviewers. As such the Safety FMEA does not serve as the Risk Management Matrix (RMM) evidence the FDA requires to obtain insight in risk visibility and the risk management decision making.
So, we need to give an outside-in view on Risk Management, with focus on the more abstract hazards we defined for our medical equipment range and with high level safety concepts instead of technical details.
We also want to make a step into our directional view to become pro-active on clinical trends in safety Risk Management. Therefore we need an RMM that relates directly to our surveillance activities.
And last, but not least, we need to support multiple risk management views, such as: • Which Hazards can be caused by the Medical User? • Which Hazards can be caused by Manufacturing? • Which planned maintenance activities by Field Service Engineers are safety related? • Etc.
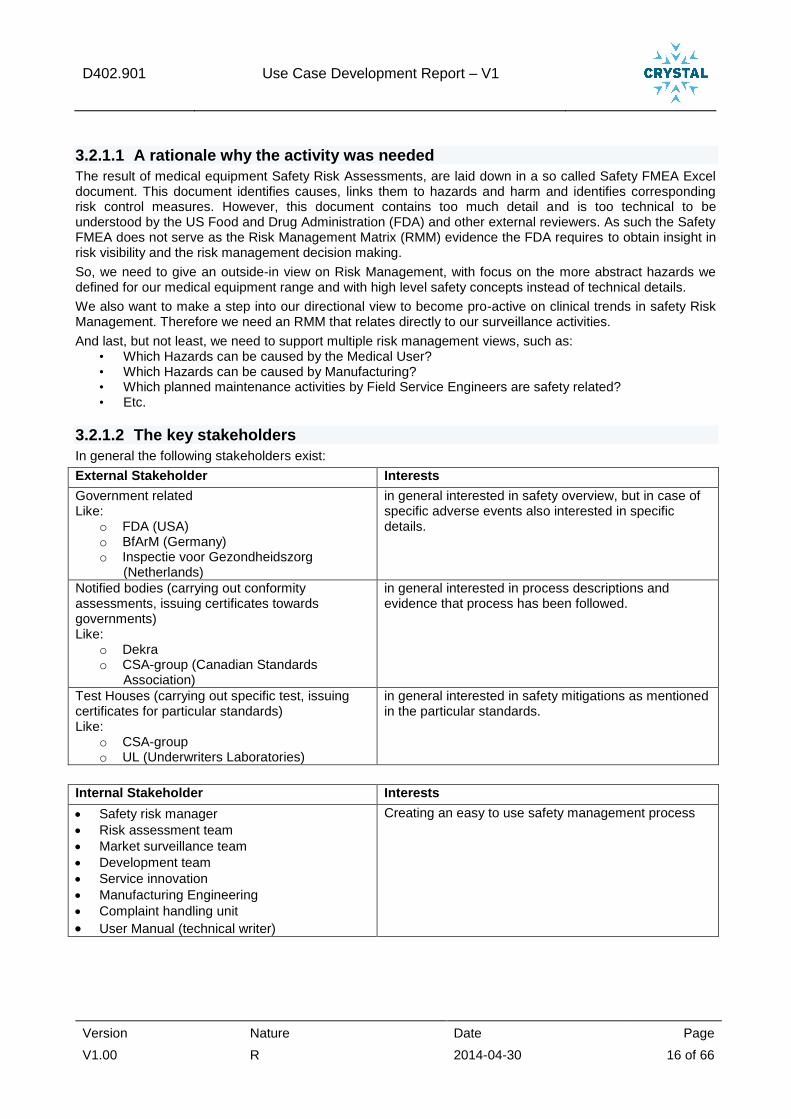
3.2.1.2 The key stakeholders
In general the following stakeholders exist:
External Stakeholder Interests
Government related Like:
o FDA (USA) o BfArM (Germany) o Inspectie voor Gezondheidszorg
(Netherlands)
in general interested in safety overview, but in case of specific adverse events also interested in specific details.
Notified bodies (carrying out conformity assessments, issuing certificates towards governments) Like:
o Dekra o CSA-group (Canadian Standards
Association)
in general interested in process descriptions and evidence that process has been followed.
Test Houses (carrying out specific test, issuing certificates for particular standards) Like:
o CSA-group o UL (Underwriters Laboratories)
in general interested in safety mitigations as mentioned in the particular standards.
Internal Stakeholder Interests
Safety risk manager
Risk assessment team
Market surveillance team
Development team
Service innovation
Manufacturing Engineering
Complaint handling unit
User Manual (technical writer)
Creating an easy to use safety management process
D402.901 Use Case Development Report – V1
Version Nature Date Page
V1.00 R 2014-04-30 17 of 66
3.2.1.3 A brief description on the activity itself
First focus was to bring the FDA submission documentation on the right abstraction level, documentation that could be understood by the FDA and other external reviewers.
Goal was:
1. Generation of an RMM from the underlying Safety FMEA(s) to guarantee consistency between Safety FMEA and RMM. To realize this goal, a restructure of the existing Safety FMEA was required, since the Safety FMEA contains all conceivable hazard causes and all mitigations (= risk control measures) to reduce the risk of harm for that harm cause. The main restructuring activities were:
Adding abstraction levels to the Safety FMEA for RMM generation.
Changing the Safety FMEA possible harm cause probability levels (L0..L4) into a likelihood, expressed in ppm.
2. Establishing and stimulating a learning cycle for risk estimation, to be able to learn from the actual installed base risk profiles, during new product risk assessments and their risk estimations. To realize this goal, data mining of field complaints was needed, to be able to extract the actual hazard risk profile (see 3.2.4) and to use that actual hazard risk profile to define a hazard risk distribution model. In the RMM the hazard risk distribution model is used to generate an initial and residual hazard risk profile from all Safety FMEA hazard cause likelihoods (in ppm). To close the learning cycle, the estimated initial and residual hazard risk profiles can be compared with the actual hazard risk profile from surveillance data.
D402.901 Use Case Development Report – V1
Version Nature Date Page
V1.00 R 2014-04-30 18 of 66
3.2.1.4 Results
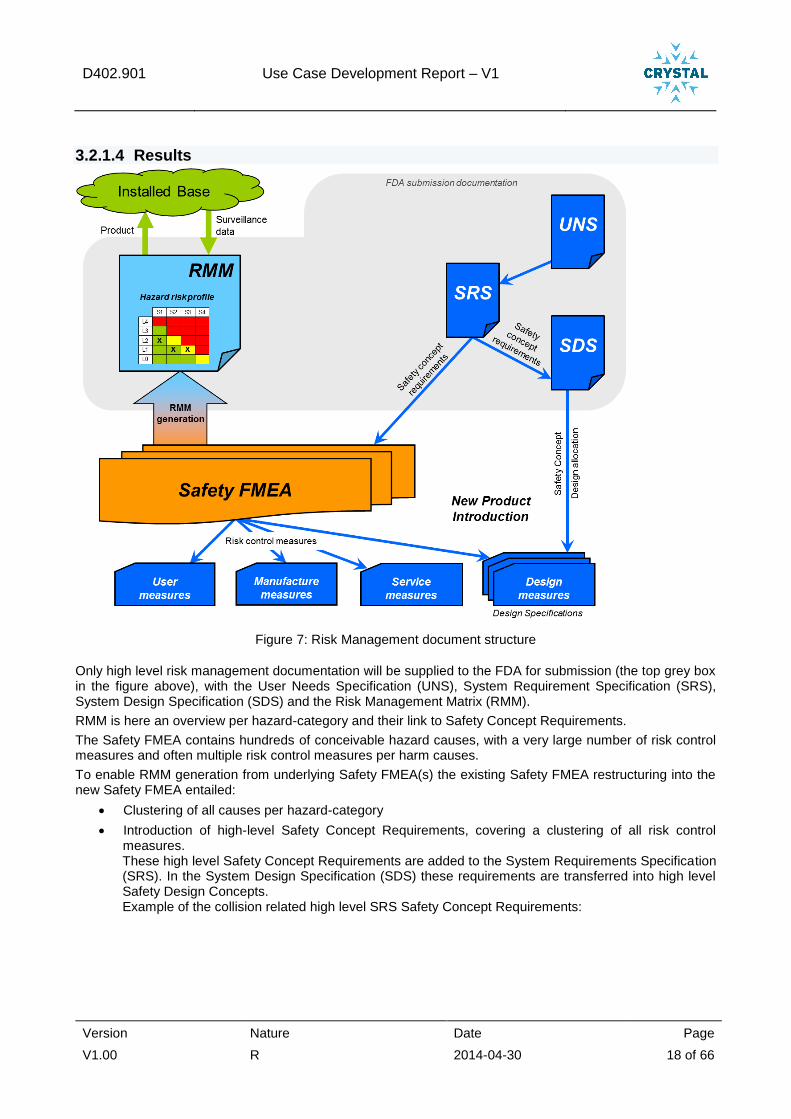
Figure 7: Risk Management document structure
Only high level risk management documentation will be supplied to the FDA for submission (the top grey box in the figure above), with the User Needs Specification (UNS), System Requirement Specification (SRS), System Design Specification (SDS) and the Risk Management Matrix (RMM).
RMM is here an overview per hazard-category and their link to Safety Concept Requirements.
The Safety FMEA contains hundreds of conceivable hazard causes, with a very large number of risk control measures and often multiple risk control measures per harm causes.
To enable RMM generation from underlying Safety FMEA(s) the existing Safety FMEA restructuring into the new Safety FMEA entailed:
Clustering of all causes per hazard-category
Introduction of high-level Safety Concept Requirements, covering a clustering of all risk control measures. These high level Safety Concept Requirements are added to the System Requirements Specification (SRS). In the System Design Specification (SDS) these requirements are transferred into high level Safety Design Concepts. Example of the collision related high level SRS Safety Concept Requirements:
D402.901 Use Case Development Report – V1
Version Nature Date Page
V1.00 R 2014-04-30 19 of 66
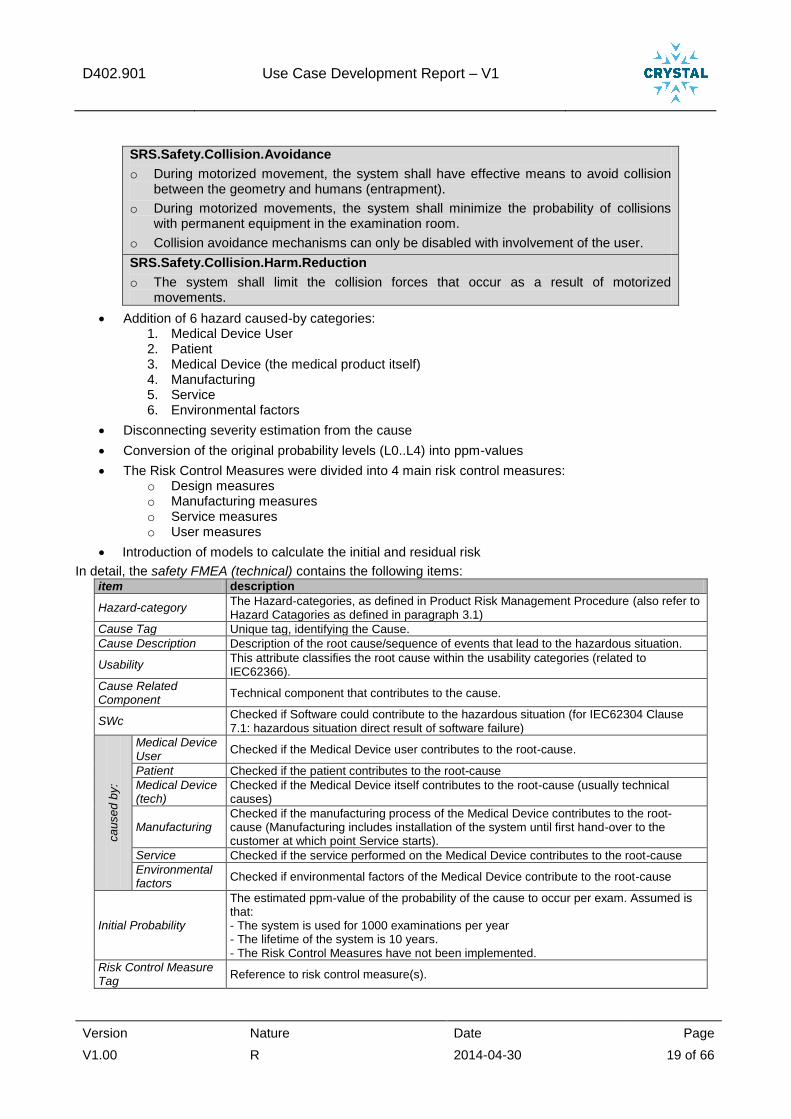
SRS.Safety.Collision.Avoidance
o During motorized movement, the system shall have effective means to avoid collision between the geometry and humans (entrapment).
o During motorized movements, the system shall minimize the probability of collisions with permanent equipment in the examination room.
o Collision avoidance mechanisms can only be disabled with involvement of the user.
SRS.Safety.Collision.Harm.Reduction
o The system shall limit the collision forces that occur as a result of motorized movements.
Addition of 6 hazard caused-by categories: 1. Medical Device User 2. Patient 3. Medical Device (the medical product itself) 4. Manufacturing 5. Service 6. Environmental factors
Disconnecting severity estimation from the cause
Conversion of the original probability levels (L0..L4) into ppm-values
The Risk Control Measures were divided into 4 main risk control measures: o Design measures o Manufacturing measures o Service measures o User measures
Introduction of models to calculate the initial and residual risk
In detail, the safety FMEA (technical) contains the following items: item description
Hazard-category The Hazard-categories, as defined in Product Risk Management Procedure (also refer to Hazard Catagories as defined in paragraph 3.1)
Cause Tag Unique tag, identifying the Cause.
Cause Description Description of the root cause/sequence of events that lead to the hazardous situation.
Usability This attribute classifies the root cause within the usability categories (related to IEC62366).
Cause Related Component
Technical component that contributes to the cause.
SWc Checked if Software could contribute to the hazardous situation (for IEC62304 Clause 7.1: hazardous situation direct result of software failure)
ca
use
d b
y:
Medical Device User
Checked if the Medical Device user contributes to the root-cause.
Patient Checked if the patient contributes to the root-cause
Medical Device (tech)
Checked if the Medical Device itself contributes to the root-cause (usually technical causes)
Manufacturing Checked if the manufacturing process of the Medical Device contributes to the root-cause (Manufacturing includes installation of the system until first hand-over to the customer at which point Service starts).
Service Checked if the service performed on the Medical Device contributes to the root-cause
Environmental factors
Checked if environmental factors of the Medical Device contribute to the root-cause
Initial Probability
The estimated ppm-value of the probability of the cause to occur per exam. Assumed is that: - The system is used for 1000 examinations per year - The lifetime of the system is 10 years. - The Risk Control Measures have not been implemented.
Risk Control Measure Tag
Reference to risk control measure(s).
D402.901 Use Case Development Report – V1
Version Nature Date Page
V1.00 R 2014-04-30 20 of 66
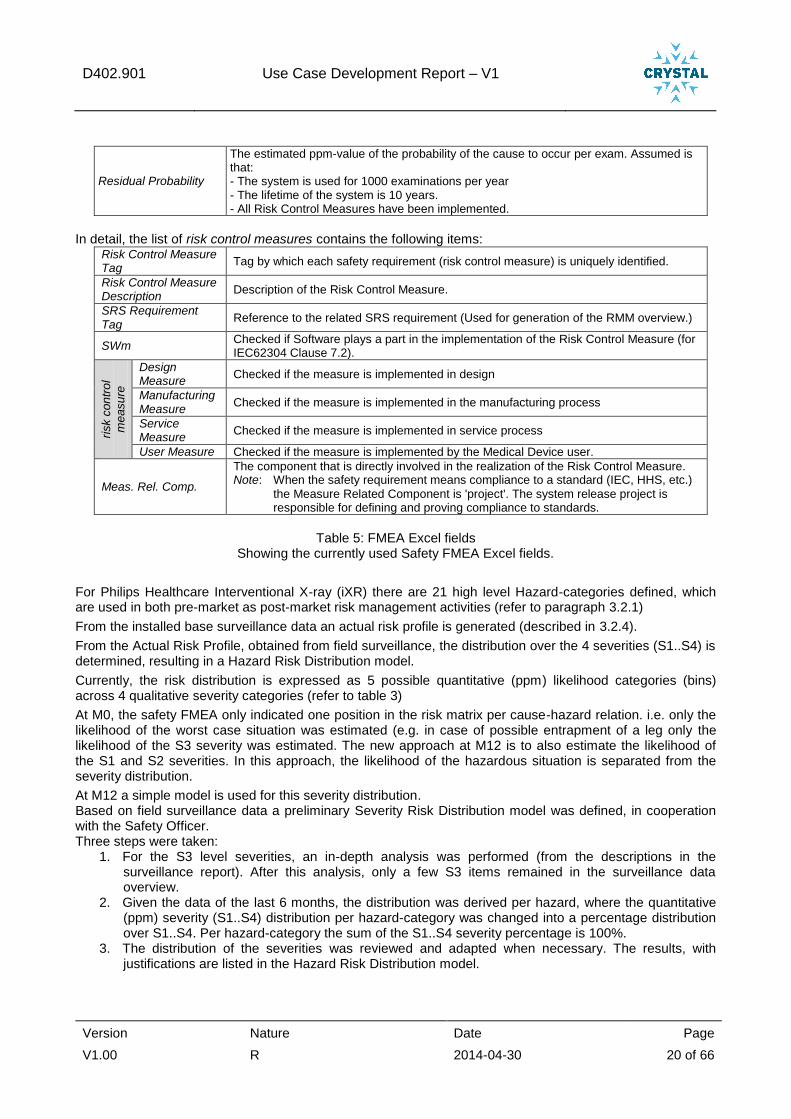
Residual Probability
The estimated ppm-value of the probability of the cause to occur per exam. Assumed is that: - The system is used for 1000 examinations per year - The lifetime of the system is 10 years. - All Risk Control Measures have been implemented.
In detail, the list of risk control measures contains the following items:
Risk Control Measure Tag
Tag by which each safety requirement (risk control measure) is uniquely identified.
Risk Control Measure Description
Description of the Risk Control Measure.
SRS Requirement Tag
Reference to the related SRS requirement (Used for generation of the RMM overview.)
SWm Checked if Software plays a part in the implementation of the Risk Control Measure (for IEC62304 Clause 7.2).
risk c
on
tro
l
me
asu
re
Design Measure
Checked if the measure is implemented in design
Manufacturing Measure
Checked if the measure is implemented in the manufacturing process
Service Measure
Checked if the measure is implemented in service process
User Measure Checked if the measure is implemented by the Medical Device user.
Meas. Rel. Comp.
The component that is directly involved in the realization of the Risk Control Measure. Note: When the safety requirement means compliance to a standard (IEC, HHS, etc.)
the Measure Related Component is 'project'. The system release project is responsible for defining and proving compliance to standards.
Table 5: FMEA Excel fields
Showing the currently used Safety FMEA Excel fields.
For Philips Healthcare Interventional X-ray (iXR) there are 21 high level Hazard-categories defined, which are used in both pre-market as post-market risk management activities (refer to paragraph 3.2.1)
From the installed base surveillance data an actual risk profile is generated (described in 3.2.4).
From the Actual Risk Profile, obtained from field surveillance, the distribution over the 4 severities (S1..S4) is determined, resulting in a Hazard Risk Distribution model.
Currently, the risk distribution is expressed as 5 possible quantitative (ppm) likelihood categories (bins) across 4 qualitative severity categories (refer to table 3)
At M0, the safety FMEA only indicated one position in the risk matrix per cause-hazard relation. i.e. only the likelihood of the worst case situation was estimated (e.g. in case of possible entrapment of a leg only the likelihood of the S3 severity was estimated. The new approach at M12 is to also estimate the likelihood of the S1 and S2 severities. In this approach, the likelihood of the hazardous situation is separated from the severity distribution.
At M12 a simple model is used for this severity distribution. Based on field surveillance data a preliminary Severity Risk Distribution model was defined, in cooperation with the Safety Officer. Three steps were taken:
1. For the S3 level severities, an in-depth analysis was performed (from the descriptions in the surveillance report). After this analysis, only a few S3 items remained in the surveillance data overview.
2. Given the data of the last 6 months, the distribution was derived per hazard, where the quantitative (ppm) severity (S1..S4) distribution per hazard-category was changed into a percentage distribution over S1..S4. Per hazard-category the sum of the S1..S4 severity percentage is 100%.
3. The distribution of the severities was reviewed and adapted when necessary. The results, with justifications are listed in the Hazard Risk Distribution model.
D402.901 Use Case Development Report – V1
Version Nature Date Page
V1.00 R 2014-04-30 21 of 66
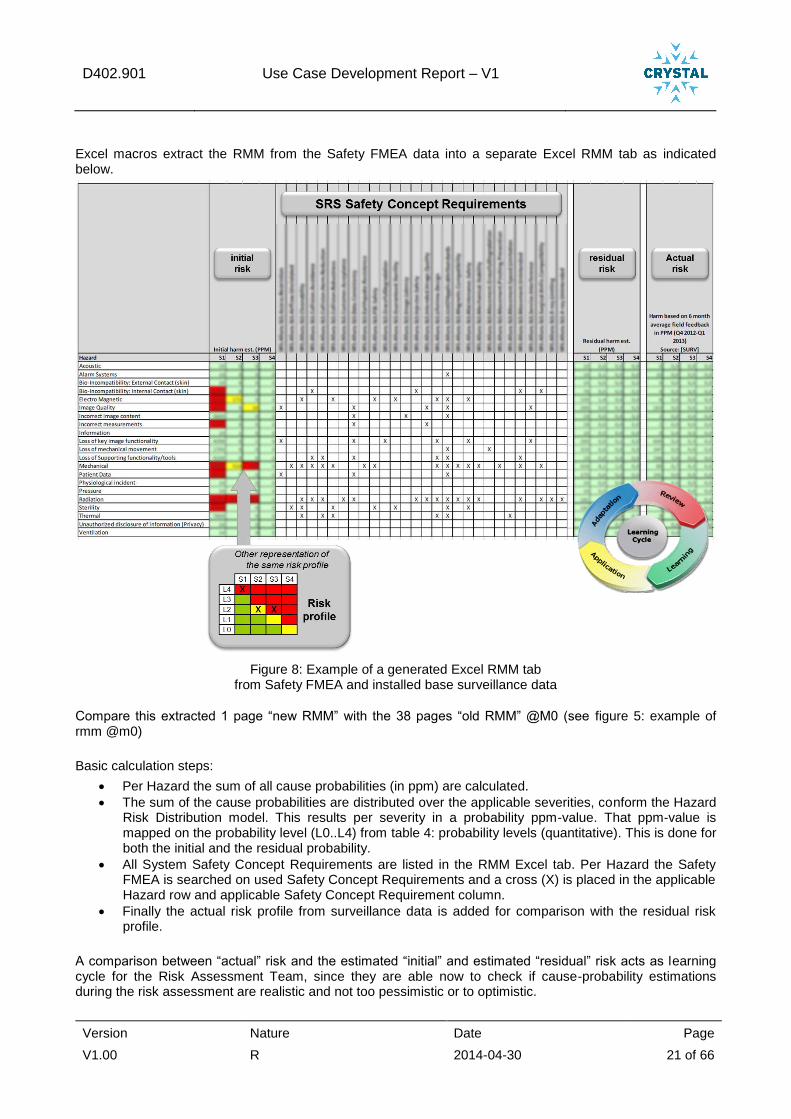
Excel macros extract the RMM from the Safety FMEA data into a separate Excel RMM tab as indicated below.
Figure 8: Example of a generated Excel RMM tab from Safety FMEA and installed base surveillance data
Compare this extracted 1 page “new RMM” with the 38 pages “old RMM” @M0 (see figure 5: example of rmm @m0)
Basic calculation steps:
Per Hazard the sum of all cause probabilities (in ppm) are calculated.
The sum of the cause probabilities are distributed over the applicable severities, conform the Hazard Risk Distribution model. This results per severity in a probability ppm-value. That ppm-value is mapped on the probability level (L0..L4) from table 4: probability levels (quantitative). This is done for both the initial and the residual probability.
All System Safety Concept Requirements are listed in the RMM Excel tab. Per Hazard the Safety FMEA is searched on used Safety Concept Requirements and a cross (X) is placed in the applicable Hazard row and applicable Safety Concept Requirement column.
Finally the actual risk profile from surveillance data is added for comparison with the residual risk profile.
A comparison between “actual” risk and the estimated “initial” and estimated “residual” risk acts as learning cycle for the Risk Assessment Team, since they are able now to check if cause-probability estimations during the risk assessment are realistic and not too pessimistic or to optimistic.
D402.901 Use Case Development Report – V1
Version Nature Date Page
V1.00 R 2014-04-30 22 of 66
3.2.1.5 References to additional documentation
See Crystal deliverable D402.010.
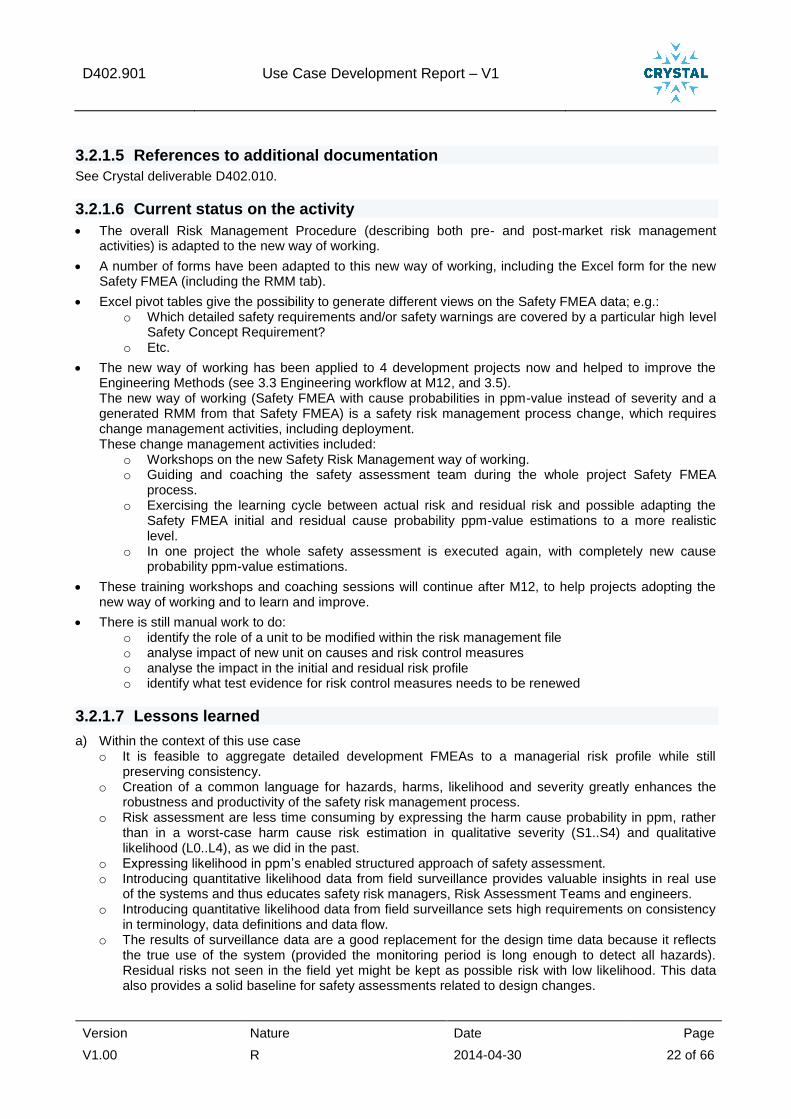
3.2.1.6 Current status on the activity
The overall Risk Management Procedure (describing both pre- and post-market risk management activities) is adapted to the new way of working.
A number of forms have been adapted to this new way of working, including the Excel form for the new Safety FMEA (including the RMM tab).
Excel pivot tables give the possibility to generate different views on the Safety FMEA data; e.g.: o Which detailed safety requirements and/or safety warnings are covered by a particular high level
Safety Concept Requirement? o Etc.
The new way of working has been applied to 4 development projects now and helped to improve the Engineering Methods (see 3.3 Engineering workflow at M12, and 3.5). The new way of working (Safety FMEA with cause probabilities in ppm-value instead of severity and a generated RMM from that Safety FMEA) is a safety risk management process change, which requires change management activities, including deployment. These change management activities included:
o Workshops on the new Safety Risk Management way of working. o Guiding and coaching the safety assessment team during the whole project Safety FMEA
process. o Exercising the learning cycle between actual risk and residual risk and possible adapting the
Safety FMEA initial and residual cause probability ppm-value estimations to a more realistic level.
o In one project the whole safety assessment is executed again, with completely new cause probability ppm-value estimations.
These training workshops and coaching sessions will continue after M12, to help projects adopting the new way of working and to learn and improve.
There is still manual work to do: o identify the role of a unit to be modified within the risk management file o analyse impact of new unit on causes and risk control measures o analyse the impact in the initial and residual risk profile o identify what test evidence for risk control measures needs to be renewed
3.2.1.7 Lessons learned
a) Within the context of this use case o It is feasible to aggregate detailed development FMEAs to a managerial risk profile while still
preserving consistency. o Creation of a common language for hazards, harms, likelihood and severity greatly enhances the
robustness and productivity of the safety risk management process. o Risk assessment are less time consuming by expressing the harm cause probability in ppm, rather
than in a worst-case harm cause risk estimation in qualitative severity (S1..S4) and qualitative likelihood (L0..L4), as we did in the past.
o Expressing likelihood in ppm’s enabled structured approach of safety assessment. o Introducing quantitative likelihood data from field surveillance provides valuable insights in real use
of the systems and thus educates safety risk managers, Risk Assessment Teams and engineers. o Introducing quantitative likelihood data from field surveillance sets high requirements on consistency
in terminology, data definitions and data flow. o The results of surveillance data are a good replacement for the design time data because it reflects
the true use of the system (provided the monitoring period is long enough to detect all hazards). Residual risks not seen in the field yet might be kept as possible risk with low likelihood. This data also provides a solid baseline for safety assessments related to design changes.
D402.901 Use Case Development Report – V1
Version Nature Date Page
V1.00 R 2014-04-30 23 of 66
b) From cross domain partners o The automotive and aerospace sector has valuable though rigid tooling in place for safety risk
management process. o Simulation of safety can be gradually advanced from FMEA and fault trees to cause-effect nets. For
critical topics like motorized movement, 3D simulation of motion may be used to assess safety aspects (see also WP401).
D402.901 Use Case Development Report – V1
Version Nature Date Page
V1.00 R 2014-04-30 24 of 66
3.2.2 A2 - Analysis of safety risk management process (TNO, ITKE)
3.2.2.1 A rationale why the activity was needed
Philips Healthcare has been active in safety risk management and certification for medical standards for many decades. As described in the above sections, in 2013 a substantial update of the safety risk process was performed in the context of the Crystal project.
To identify what the next steps for improving Safety risk management should be and to create a common perspective among the WP402 partners on the desirable end situation for Crystal and beyond, this activity was set up. Using the expertise of the partners TNO, TU/e and ITKE (WP604, Brick 3.06 FMEA, FMEDA, FTA), fresh insights on further development were collected.
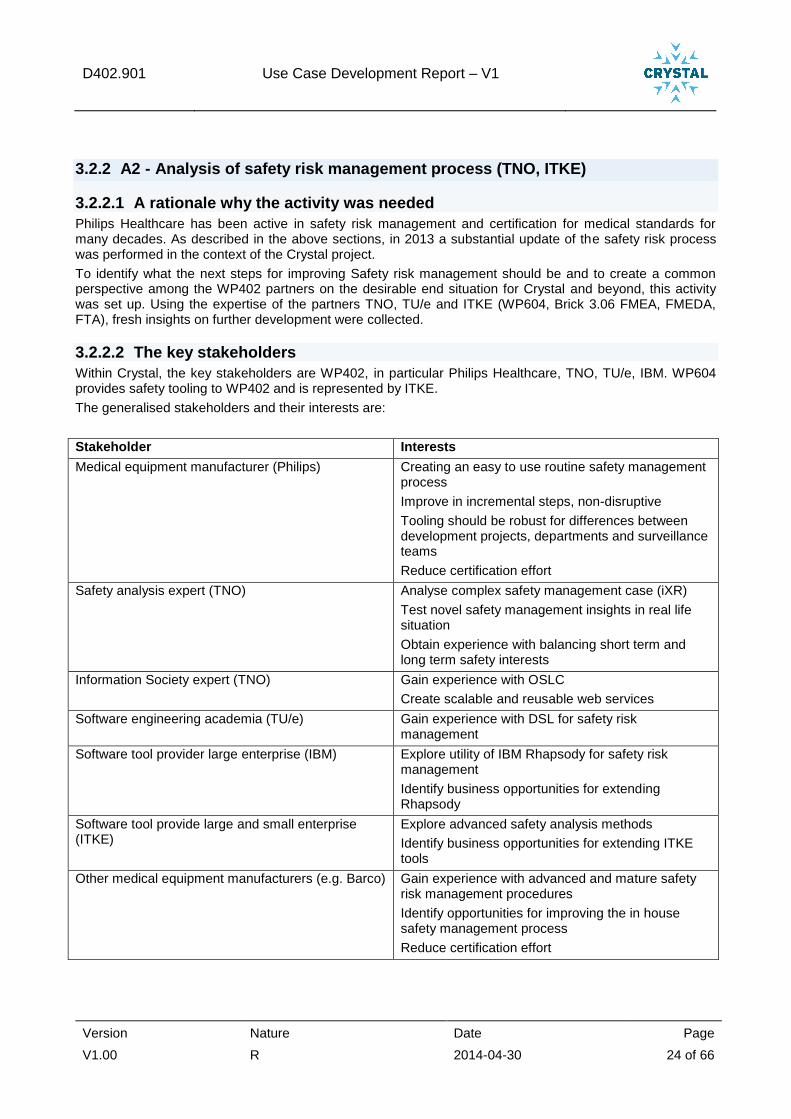
3.2.2.2 The key stakeholders
Within Crystal, the key stakeholders are WP402, in particular Philips Healthcare, TNO, TU/e, IBM. WP604 provides safety tooling to WP402 and is represented by ITKE.
The generalised stakeholders and their interests are:
Stakeholder Interests
Medical equipment manufacturer (Philips) Creating an easy to use routine safety management process
Improve in incremental steps, non-disruptive
Tooling should be robust for differences between development projects, departments and surveillance teams
Reduce certification effort
Safety analysis expert (TNO) Analyse complex safety management case (iXR)
Test novel safety management insights in real life situation
Obtain experience with balancing short term and long term safety interests
Information Society expert (TNO) Gain experience with OSLC
Create scalable and reusable web services
Software engineering academia (TU/e) Gain experience with DSL for safety risk management
Software tool provider large enterprise (IBM) Explore utility of IBM Rhapsody for safety risk management
Identify business opportunities for extending Rhapsody
Software tool provide large and small enterprise (ITKE)
Explore advanced safety analysis methods
Identify business opportunities for extending ITKE tools
Other medical equipment manufacturers (e.g. Barco) Gain experience with advanced and mature safety risk management procedures
Identify opportunities for improving the in house safety management process
Reduce certification effort

D402.901 Use Case Development Report – V1
Version Nature Date Page
V1.00 R 2014-04-30 25 of 66
3.2.2.3 A brief description on the activity itself
TNO had several sessions with Philips Healthcare to understand and analyse the current safety management process. This was laid down in a detailed description of the Use case process (UML diagrams in D402.010, chapter 3).
Given the many Excel analyses and Excel data exchange steps used in the safety risk management process, TNO made a data structure analysis. For maturing the safety risk management processes, Excel does not provide sufficient maintainability, consistency and relational consistency strength. Therefore, a definition of the safety risk management data structure is needed (Access database to replace many Excel tables).
The analysis of current and desired situation as documented in D402.010, was further translated into technical core requirements and technical refined requirements.
Finally, TNO created an H-model for the system lifecycle, providing an alternative for the V-model that emphasis parallelism and distinction between clinical application and technical solution.
3.2.2.4 Results
Three specific case studies were earlier defined by Philips Healthcare within the context of the safety management process, see the D402.010:
1. Analysing risk profile related to an adverse event
2. Impact analysis of design changes
3. Comparing actual to residual risk profile (trending)
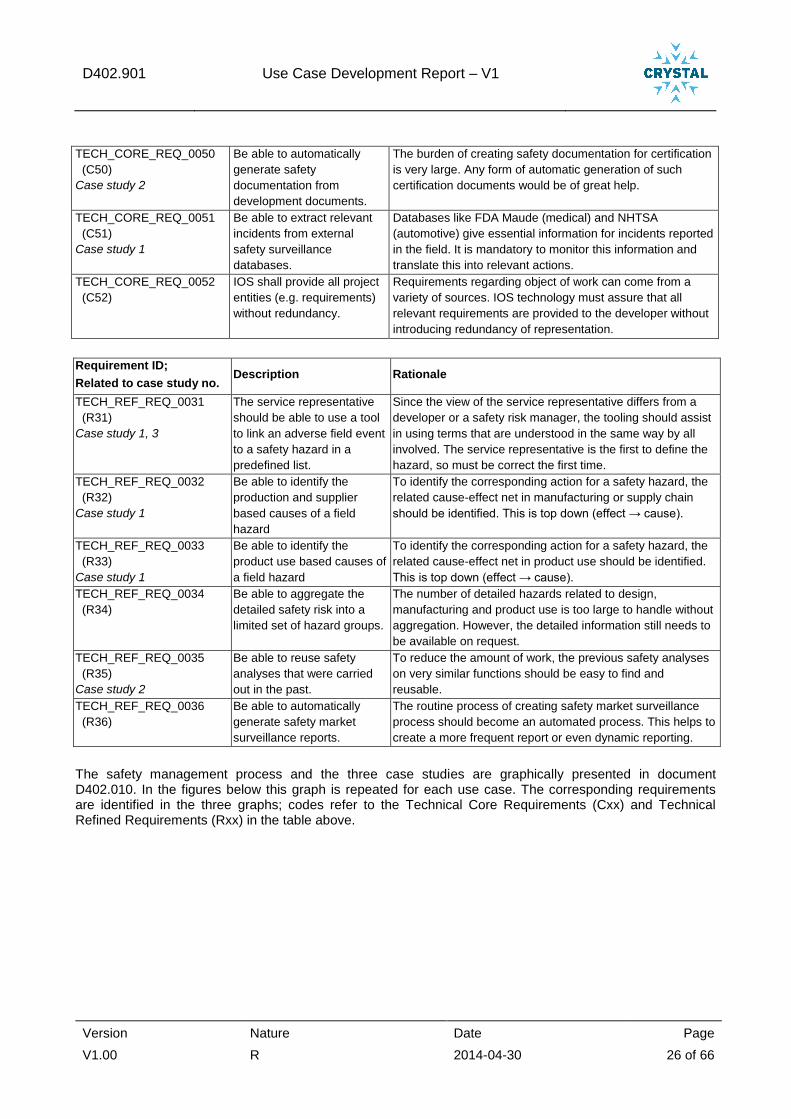
For the safety management process a set of requirements was defined, aimed at next steps to improve the current situation regarding safety management. This was an iterative process in which requirements were suggested, combined, left out and finally accepted as a basis for future activities. Philips Healthcare, TNO and ITKE were involved in this process. The improvement requirements are divided into “Technical Core Requirements” and “Technical Refined Requirements” and filed in the CRYSTAL SharePoint.
Most requirements pertain to one or two case studies. Some are general requirements, relevant to the safety management process as a whole. The requirements are the following (requirement identification the same as on the SharePoint):
Requirement ID;
Related to case study no. Description Rationale
TECH_CORE_REQ_0047
(C47)
Case study 1, 3
Be able to analyse the safety
risk at system behaviour
level with a tool.
Safety behaviour needs to be analysed at aggregate level to
allow managerial decisions. The number of detailed hazards
related to design, manufacturing and product use is too large
to handle without aggregation.
TECH_CORE_REQ_0048
(C48)
Case study 3
Be able to analyse whether
a new field hazard pushes
risks beyond predefined
tolerable risk boundaries and
update the system level
safety risk profile with field
call data.
As soon as a new field hazard crosses a threshold of
tolerable risk, the safety surveillance team needs to take
quick action. The tooling should assist this priority setting.
The system risk profile should then be a live, up-to-date
document, so it needs to be fed with experience from
product use. FDA requires a form of market monitoring for
changes in risk profiles.
TECH_CORE_REQ_0049
(C49)
Case study 1, 2
Be able to identify the design
based causes of a field
hazard and to identify the
safety impact of system
design change requests.
To identify the corresponding action for a field hazard, the
related cause-effect net in product design, manufacturing or
product use should be identified. This is top down (effect →
cause).
In the design phase, design changes need to be assessed
for safety consequences. Ideally, safety consequences
would be automatically suggested during design work. This
is bottom up (cause → effect).
D402.901 Use Case Development Report – V1
Version Nature Date Page
V1.00 R 2014-04-30 26 of 66
TECH_CORE_REQ_0050
(C50)
Case study 2
Be able to automatically
generate safety
documentation from
development documents.
The burden of creating safety documentation for certification
is very large. Any form of automatic generation of such
certification documents would be of great help.
TECH_CORE_REQ_0051
(C51)
Case study 1
Be able to extract relevant
incidents from external
safety surveillance
databases.
Databases like FDA Maude (medical) and NHTSA
(automotive) give essential information for incidents reported
in the field. It is mandatory to monitor this information and
translate this into relevant actions.
TECH_CORE_REQ_0052
(C52)
IOS shall provide all project
entities (e.g. requirements)
without redundancy.
Requirements regarding object of work can come from a
variety of sources. IOS technology must assure that all
relevant requirements are provided to the developer without
introducing redundancy of representation.
Requirement ID;
Related to case study no. Description Rationale
TECH_REF_REQ_0031
(R31)
Case study 1, 3
The service representative
should be able to use a tool
to link an adverse field event
to a safety hazard in a
predefined list.
Since the view of the service representative differs from a
developer or a safety risk manager, the tooling should assist
in using terms that are understood in the same way by all
involved. The service representative is the first to define the
hazard, so must be correct the first time.
TECH_REF_REQ_0032
(R32)
Case study 1
Be able to identify the
production and supplier
based causes of a field
hazard
To identify the corresponding action for a safety hazard, the
related cause-effect net in manufacturing or supply chain
should be identified. This is top down (effect → cause).
TECH_REF_REQ_0033
(R33)
Case study 1
Be able to identify the
product use based causes of
a field hazard
To identify the corresponding action for a safety hazard, the
related cause-effect net in product use should be identified.
This is top down (effect → cause).
TECH_REF_REQ_0034
(R34)
Be able to aggregate the
detailed safety risk into a
limited set of hazard groups.
The number of detailed hazards related to design,
manufacturing and product use is too large to handle without
aggregation. However, the detailed information still needs to
be available on request.
TECH_REF_REQ_0035
(R35)
Case study 2
Be able to reuse safety
analyses that were carried
out in the past.
To reduce the amount of work, the previous safety analyses
on very similar functions should be easy to find and
reusable.
TECH_REF_REQ_0036
(R36)
Be able to automatically
generate safety market
surveillance reports.
The routine process of creating safety market surveillance
process should become an automated process. This helps to
create a more frequent report or even dynamic reporting.
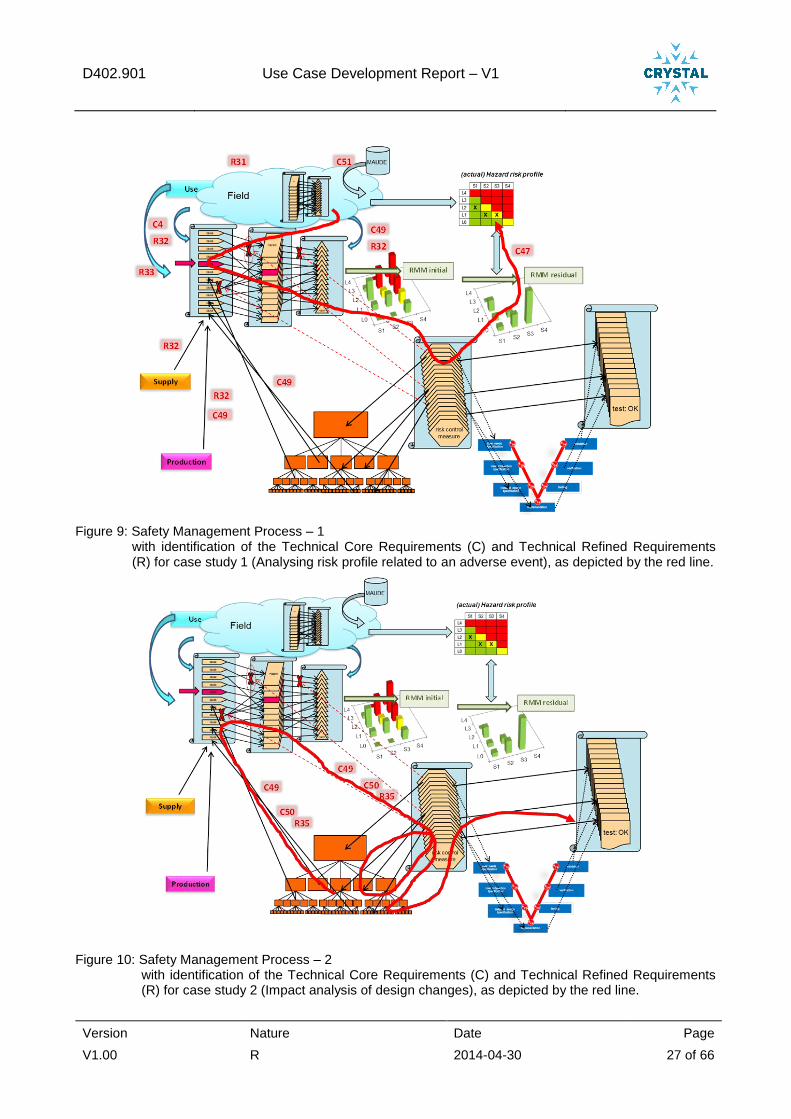
The safety management process and the three case studies are graphically presented in document D402.010. In the figures below this graph is repeated for each use case. The corresponding requirements are identified in the three graphs; codes refer to the Technical Core Requirements (Cxx) and Technical Refined Requirements (Rxx) in the table above.
D402.901 Use Case Development Report – V1
Version Nature Date Page
V1.00 R 2014-04-30 27 of 66
Figure 9: Safety Management Process – 1 with identification of the Technical Core Requirements (C) and Technical Refined Requirements (R) for case study 1 (Analysing risk profile related to an adverse event), as depicted by the red line.
Figure 10: Safety Management Process – 2 with identification of the Technical Core Requirements (C) and Technical Refined Requirements (R) for case study 2 (Impact analysis of design changes), as depicted by the red line.

D402.901 Use Case Development Report – V1
Version Nature Date Page
V1.00 R 2014-04-30 28 of 66
Figure 11: Safety Management Process – 3 with identification of the Technical Core Requirements (C) and Technical Refined Requirements (R) for case study 3 (Comparing actual to residual risk profile (trending)), as depicted by the red line.
Based on the safety management process, the case studies and the related technical requirements, more detailed technical items have been defined that are relevant for fulfilling the requirements. They are included as 17 “Technical Items” on the CRYSTAL SharePoint, which are part of Brick 3.6 “FTA, FMEA, FMEDA”. The requirements cover the following main issues:
Engineers should have easy access to a body of knowledge about clinical behaviour and incidents. This information could be related to new or earlier developed systems/units. This enables them to better understand the non-technical aspects of the final application and to consider this in their role in the requirements / safety risk management process (such as drawing up or modifying FME(D)As).
FTAs and FME(D)As from earlier systems/units might be applicable to (parts of) systems/units that are currently under development, or could be readily translated into new FTAs and FME(D)As.
Relate FTAs (which are built top-down based on hazards and harms) with FME(D)As (which are built bottom-up based on component failure). This results in so-called “two-way cause-effect nets”, which could support the analysis and prevention of adverse events or complaints.
Risk profiles should be more automatically generated and compared with each other. Underlying information (e.g. for incidents or for a high-level safety dashboard) should be available in a more structured, readily accessible way. This set of requirements has a relation to those in section 2.3.2 of this report.
H-model of system lifecycle The ubiquitous V-model is an easy and simple way to depict the development process. However, it suggests that verification and validation only take place after the system has been developed in quite some detail. With the advent of agile development and model driven system engineering this is no longer the case. Also, product use is not shown in the V-model whereas this is quite important for usability, safety field surveillance, continuous improvement and improving across generations within one product family.
D402.901 Use Case Development Report – V1
Version Nature Date Page
V1.00 R 2014-04-30 29 of 66
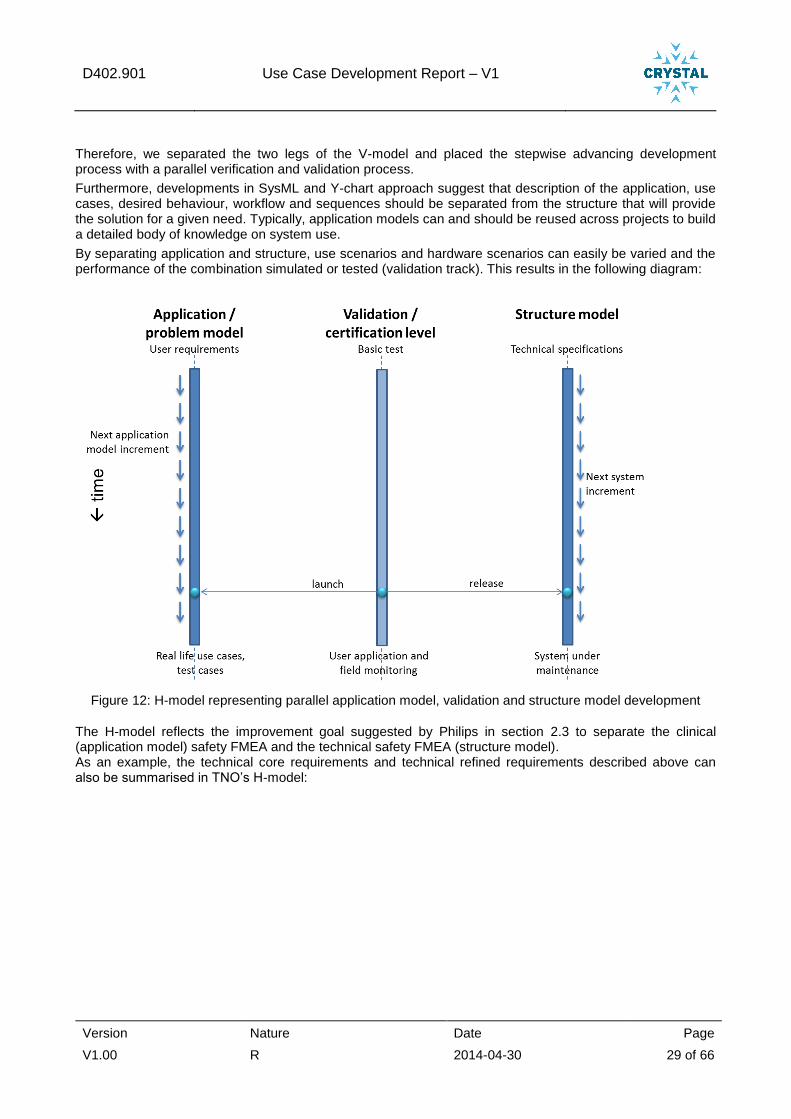
Therefore, we separated the two legs of the V-model and placed the stepwise advancing development process with a parallel verification and validation process.
Furthermore, developments in SysML and Y-chart approach suggest that description of the application, use cases, desired behaviour, workflow and sequences should be separated from the structure that will provide the solution for a given need. Typically, application models can and should be reused across projects to build a detailed body of knowledge on system use.
By separating application and structure, use scenarios and hardware scenarios can easily be varied and the performance of the combination simulated or tested (validation track). This results in the following diagram:
Figure 12: H-model representing parallel application model, validation and structure model development
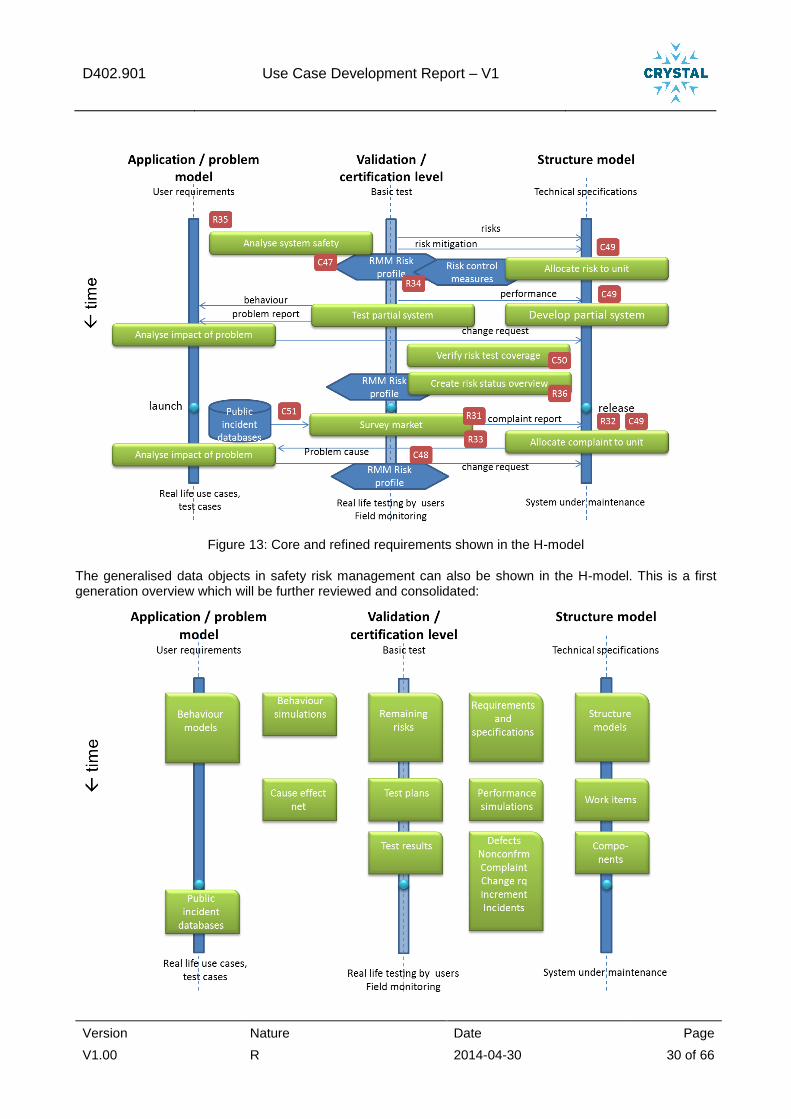
The H-model reflects the improvement goal suggested by Philips in section 2.3 to separate the clinical (application model) safety FMEA and the technical safety FMEA (structure model). As an example, the technical core requirements and technical refined requirements described above can also be summarised in TNO’s H-model:
D402.901 Use Case Development Report – V1
Version Nature Date Page
V1.00 R 2014-04-30 30 of 66
Figure 13: Core and refined requirements shown in the H-model
The generalised data objects in safety risk management can also be shown in the H-model. This is a first generation overview which will be further reviewed and consolidated:
D402.901 Use Case Development Report – V1
Version Nature Date Page
V1.00 R 2014-04-30 31 of 66
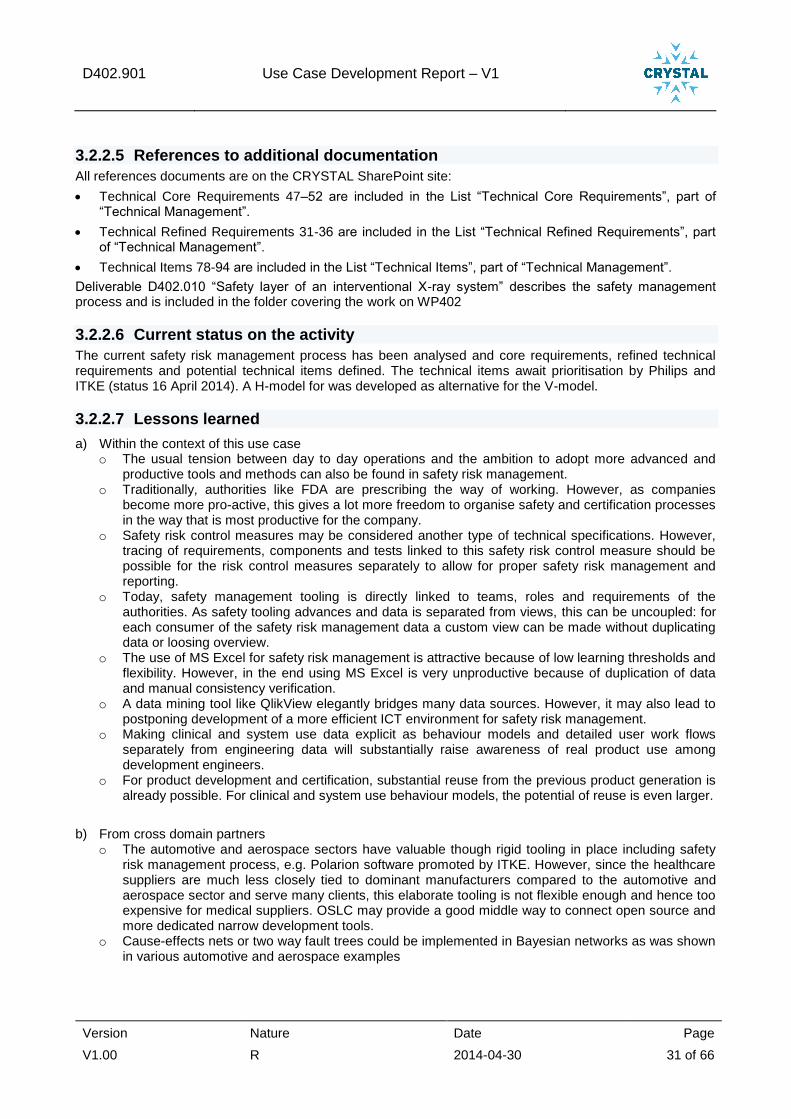
3.2.2.5 References to additional documentation
All references documents are on the CRYSTAL SharePoint site:
Technical Core Requirements 47–52 are included in the List “Technical Core Requirements”, part of “Technical Management”.
Technical Refined Requirements 31-36 are included in the List “Technical Refined Requirements”, part of “Technical Management”.
Technical Items 78-94 are included in the List “Technical Items”, part of “Technical Management”.
Deliverable D402.010 “Safety layer of an interventional X-ray system” describes the safety management process and is included in the folder covering the work on WP402
3.2.2.6 Current status on the activity
The current safety risk management process has been analysed and core requirements, refined technical requirements and potential technical items defined. The technical items await prioritisation by Philips and ITKE (status 16 April 2014). A H-model for was developed as alternative for the V-model.
3.2.2.7 Lessons learned
a) Within the context of this use case o The usual tension between day to day operations and the ambition to adopt more advanced and
productive tools and methods can also be found in safety risk management. o Traditionally, authorities like FDA are prescribing the way of working. However, as companies
become more pro-active, this gives a lot more freedom to organise safety and certification processes in the way that is most productive for the company.
o Safety risk control measures may be considered another type of technical specifications. However, tracing of requirements, components and tests linked to this safety risk control measure should be possible for the risk control measures separately to allow for proper safety risk management and reporting.
o Today, safety management tooling is directly linked to teams, roles and requirements of the authorities. As safety tooling advances and data is separated from views, this can be uncoupled: for each consumer of the safety risk management data a custom view can be made without duplicating data or loosing overview.
o The use of MS Excel for safety risk management is attractive because of low learning thresholds and flexibility. However, in the end using MS Excel is very unproductive because of duplication of data and manual consistency verification.
o A data mining tool like QlikView elegantly bridges many data sources. However, it may also lead to postponing development of a more efficient ICT environment for safety risk management.
o Making clinical and system use data explicit as behaviour models and detailed user work flows separately from engineering data will substantially raise awareness of real product use among development engineers.
o For product development and certification, substantial reuse from the previous product generation is already possible. For clinical and system use behaviour models, the potential of reuse is even larger.
b) From cross domain partners o The automotive and aerospace sectors have valuable though rigid tooling in place including safety
risk management process, e.g. Polarion software promoted by ITKE. However, since the healthcare suppliers are much less closely tied to dominant manufacturers compared to the automotive and aerospace sector and serve many clients, this elaborate tooling is not flexible enough and hence too expensive for medical suppliers. OSLC may provide a good middle way to connect open source and more dedicated narrow development tools.
o Cause-effects nets or two way fault trees could be implemented in Bayesian networks as was shown in various automotive and aerospace examples
D402.901 Use Case Development Report – V1
Version Nature Date Page
V1.00 R 2014-04-30 32 of 66
3.2.3 A3 - Safety incident search tool for safety risk management (TNO)
3.2.3.1 A rationale why the activity was needed
When a system is launched onto the market, safety risk management does not stop. Clinical users of an iXR system may use the system in new procedures or in other unforeseen ways. Also, defects or adverse interactions with other systems in the operating room may be found. This leads to new insights in the application field, new use cases, new test cases and sometimes to corrective actions to adapt the iXR system design. Traditionally seen as inappropriate use, training or plain bad news, nowadays this market information is seen as an enormous source of information for continuous improvement. In the medical field, the FDA enforces a market surveillance mechanism as part of system certification. The EU is developing a similar structure.
In fields like automotive and aerospace, this is also common. The importance of market surveillance was recently confirmed with the GM Delphi car key case, where allegedly 300 deaths were caused by a neglected series of reported incidents with car keys turning to off at full driving speed.
IEC 61508: Functional Safety of Electrical/Electronic/Programmable Electronic Safety-related Systems (E/E/PE, or E/E/PES)
ISO 26262: Road vehicles: functional safety
Philips has instituted a surveillance team for each system in the market for these activities. This activity is described in detail in D402.010, case studies 1 and 3.
There are various sources for market surveillance:
1. Observations of staff servicing Philips equipment. In many cases, the service staff collects observations from local medical staff during its visits or other clinical contacts. These service staff entries are collected by Philips using the TrackWise tool. The data is structured according to Philips wishes and hazards are categorised using a Philips classification.
2. Public databases of hazards and incidents with medical equipment. Medical staff and service personnel are obliged to report medical hazards and incidents. This information is somewhat structured in data fields. However, word use and level of detail are completely unstructured. The relevance of the reports is varying largely.
This activity focuses on public database of safety hazards and incidents. It starts with the FDA Maude database of medical incidents. Other possible sources are BfArM (Bundesinstitut für Arzneimittel and Medizinprodukte) and the Scandinavian arthroplasty database NARA. Outside of healthcare, also other domains might be covered, depending on applicability for the Crystal use cases. For example the public NHTSA FARS database contains automotive incidents.
In this activity, the various public incident databases will be made available through a common OSLC service with common search fields and mechanisms. This makes daily or frequent update of market surveillance queries possible without manual selection of data on the websites of the various source databases.
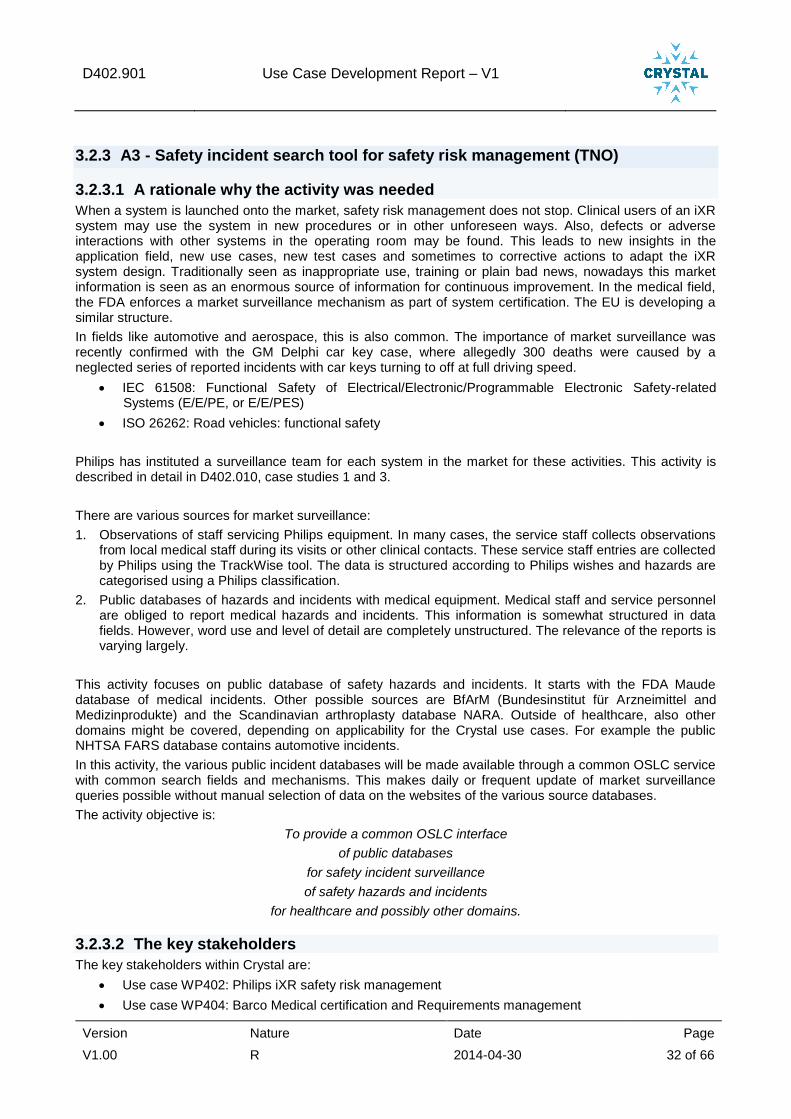
The activity objective is:
To provide a common OSLC interface
of public databases
for safety incident surveillance
of safety hazards and incidents
for healthcare and possibly other domains.
3.2.3.2 The key stakeholders
The key stakeholders within Crystal are:
Use case WP402: Philips iXR safety risk management
Use case WP404: Barco Medical certification and Requirements management
D402.901 Use Case Development Report – V1
Version Nature Date Page
V1.00 R 2014-04-30 33 of 66
Possibly WP306 OS MultiCore Compatible AUTOSAR & Safety Mechanisms for ISO26262 Compliance
In more generalized terms, the following stakeholders exist:
Stakeholder Interest
Public safety organization More frequent use of public databases
Quick response to incidents in the field
Reduction of hazards resulting from systems in the field
Safety risk manager Search multiple database at once
Ease of use of standard database searches
Opportunity to automate searches
Opportunity to provide related incidents as application experience to development team
Development software tool manager Standardised data service for incident reports
Engineer
Development team
Learn from market incidents
Opportunity to automatically receive related incidents for a certain safety analysis
Market Surveillance team Search multiple database at once
Ease of use of standard database searches
Opportunity to automate searches
Clinical application team Opportunity to add relevant incidents and field hazards to body of application knowledge (use cases, test cases)
3.2.3.3 A brief description on the activity itself
The exports provided by the FDA have been used to create a local database with medical device reports. This database is frequently updated to ensure actualization and accuracy. Using RESTful webservice, the database can be used to gather information and feed processes concerning safety risk management. The main architecture is designed to support multiple information resources.
The RESTful webservice will be used as a base for the OSLC implementation, which is being designed and implemented with the existing OSLC definitions as a base definition.
D402.901 Use Case Development Report – V1
Version Nature Date Page
V1.00 R 2014-04-30 34 of 66
3.2.3.4 Results
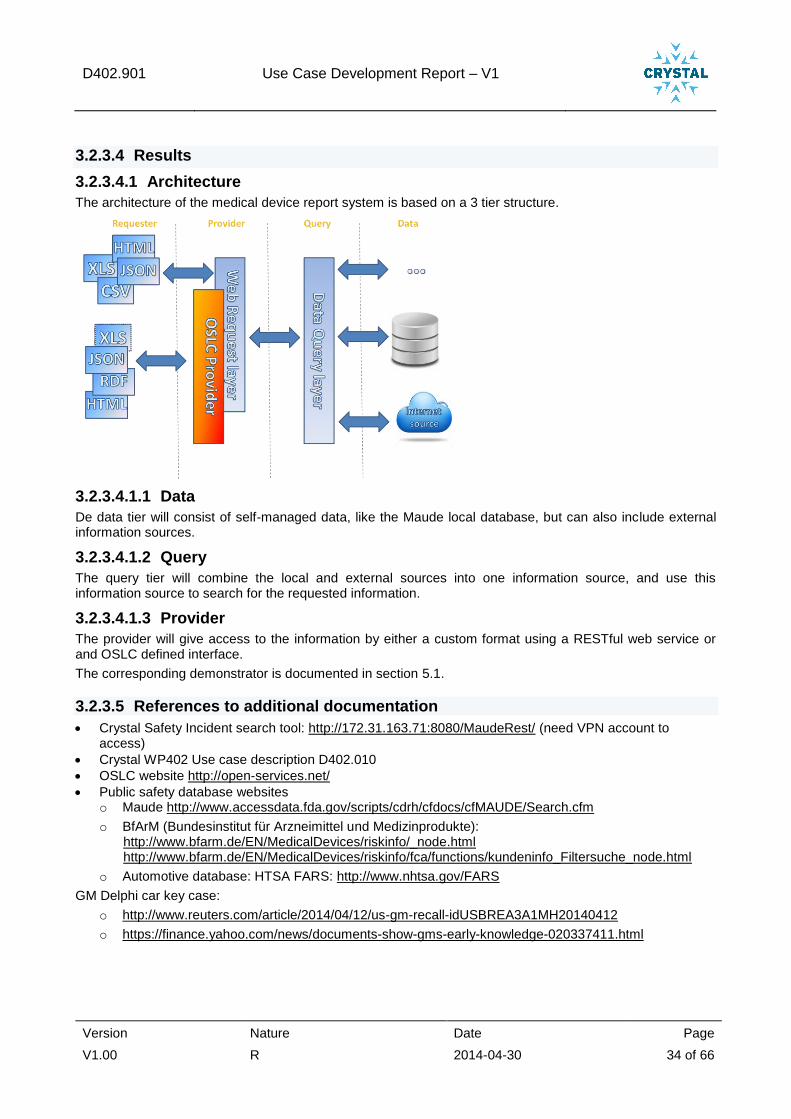
3.2.3.4.1 Architecture
The architecture of the medical device report system is based on a 3 tier structure.
3.2.3.4.1.1 Data
De data tier will consist of self-managed data, like the Maude local database, but can also include external information sources.
3.2.3.4.1.2 Query
The query tier will combine the local and external sources into one information source, and use this information source to search for the requested information.
3.2.3.4.1.3 Provider
The provider will give access to the information by either a custom format using a RESTful web service or and OSLC defined interface.
The corresponding demonstrator is documented in section 5.1.
3.2.3.5 References to additional documentation
Crystal Safety Incident search tool: http://172.31.163.71:8080/MaudeRest/ (need VPN account to access)
Crystal WP402 Use case description D402.010
OSLC website http://open-services.net/
Public safety database websites o Maude http://www.accessdata.fda.gov/scripts/cdrh/cfdocs/cfMAUDE/Search.cfm
o BfArM (Bundesinstitut für Arzneimittel und Medizinprodukte): http://www.bfarm.de/EN/MedicalDevices/riskinfo/_node.html http://www.bfarm.de/EN/MedicalDevices/riskinfo/fca/functions/kundeninfo_Filtersuche_node.html
o Automotive database: HTSA FARS: http://www.nhtsa.gov/FARS
GM Delphi car key case:
o http://www.reuters.com/article/2014/04/12/us-gm-recall-idUSBREA3A1MH20140412
o https://finance.yahoo.com/news/documents-show-gms-early-knowledge-020337411.html
D402.901 Use Case Development Report – V1
Version Nature Date Page
V1.00 R 2014-04-30 35 of 66
3.2.3.6 Current status on the activity
The described architecture at 3.2.3.4.1 has partly been implemented in a prototype. The RESTful web service is active and contains the base functionality needed for the safety risk management process. The service can be expanded with new search options and functionalities if requested.
Research has been done towards the definition of the OSLC provider.
3.2.3.7 Lessons learned
a. Within the context of this use case
Making a public incident database accessible through an OSLC interface for safety incident surveillance is feasible and demonstrated.
In some cases, this requires restructuring the original data structure and making the data consistent.
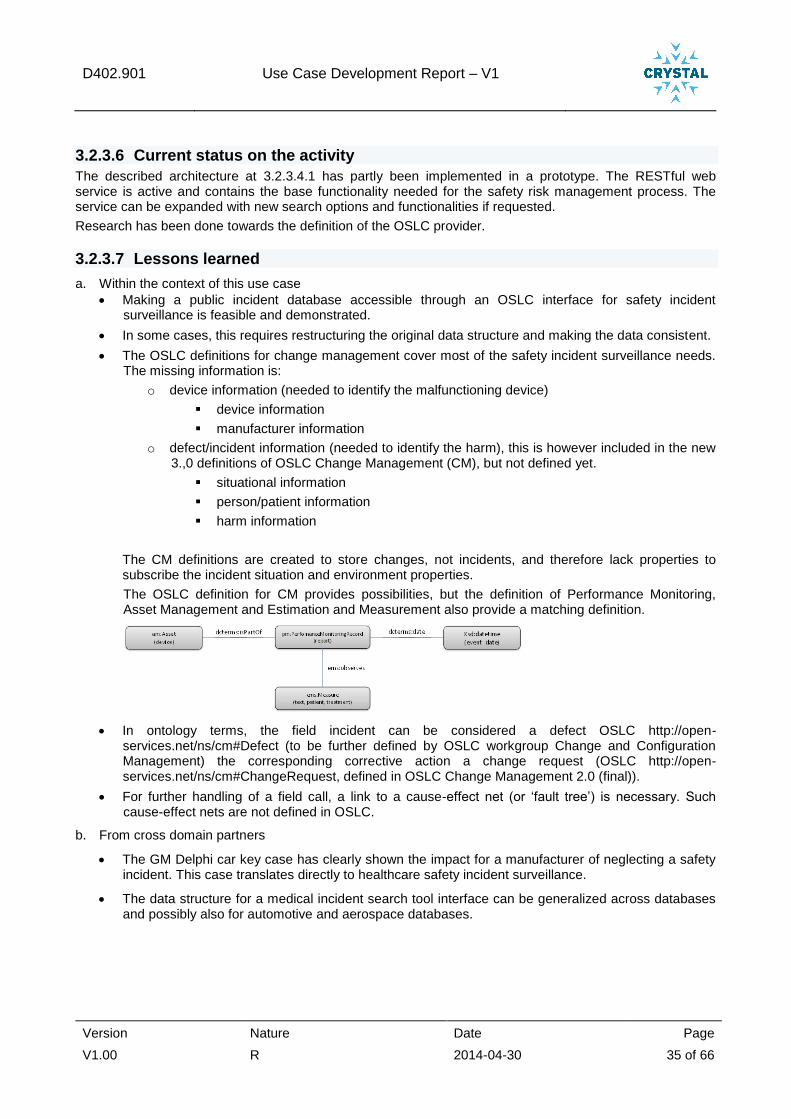
The OSLC definitions for change management cover most of the safety incident surveillance needs. The missing information is:
o device information (needed to identify the malfunctioning device)
device information
manufacturer information
o defect/incident information (needed to identify the harm), this is however included in the new 3.,0 definitions of OSLC Change Management (CM), but not defined yet.
situational information
person/patient information
harm information
The CM definitions are created to store changes, not incidents, and therefore lack properties to subscribe the incident situation and environment properties.
The OSLC definition for CM provides possibilities, but the definition of Performance Monitoring, Asset Management and Estimation and Measurement also provide a matching definition.
In ontology terms, the field incident can be considered a defect OSLC http://open-services.net/ns/cm#Defect (to be further defined by OSLC workgroup Change and Configuration Management) the corresponding corrective action a change request (OSLC http://open-services.net/ns/cm#ChangeRequest, defined in OSLC Change Management 2.0 (final)).
For further handling of a field call, a link to a cause-effect net (or ‘fault tree’) is necessary. Such cause-effect nets are not defined in OSLC.
b. From cross domain partners
The GM Delphi car key case has clearly shown the impact for a manufacturer of neglecting a safety incident. This case translates directly to healthcare safety incident surveillance.
The data structure for a medical incident search tool interface can be generalized across databases and possibly also for automotive and aerospace databases.
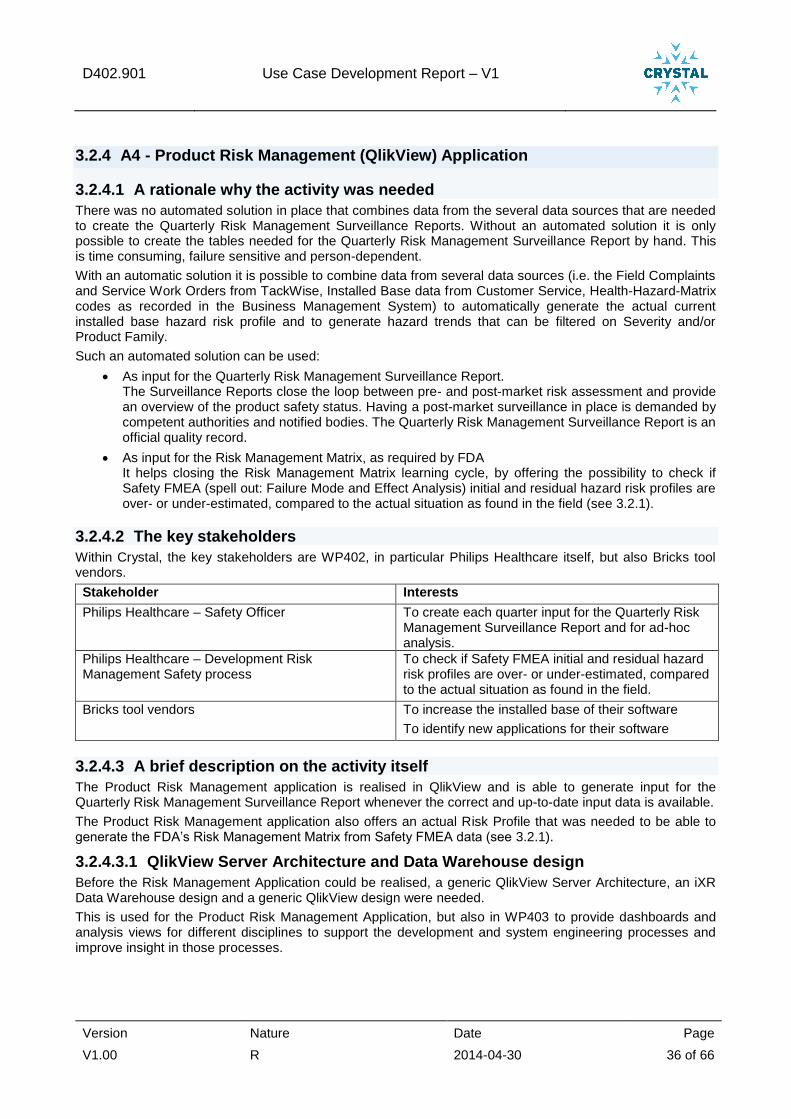
D402.901 Use Case Development Report – V1
Version Nature Date Page
V1.00 R 2014-04-30 36 of 66
3.2.4 A4 - Product Risk Management (QlikView) Application
3.2.4.1 A rationale why the activity was needed
There was no automated solution in place that combines data from the several data sources that are needed to create the Quarterly Risk Management Surveillance Reports. Without an automated solution it is only possible to create the tables needed for the Quarterly Risk Management Surveillance Report by hand. This is time consuming, failure sensitive and person-dependent.
With an automatic solution it is possible to combine data from several data sources (i.e. the Field Complaints and Service Work Orders from TackWise, Installed Base data from Customer Service, Health-Hazard-Matrix codes as recorded in the Business Management System) to automatically generate the actual current installed base hazard risk profile and to generate hazard trends that can be filtered on Severity and/or Product Family.
Such an automated solution can be used:
As input for the Quarterly Risk Management Surveillance Report. The Surveillance Reports close the loop between pre- and post-market risk assessment and provide an overview of the product safety status. Having a post-market surveillance in place is demanded by competent authorities and notified bodies. The Quarterly Risk Management Surveillance Report is an official quality record.
As input for the Risk Management Matrix, as required by FDA It helps closing the Risk Management Matrix learning cycle, by offering the possibility to check if Safety FMEA (spell out: Failure Mode and Effect Analysis) initial and residual hazard risk profiles are over- or under-estimated, compared to the actual situation as found in the field (see 3.2.1).
3.2.4.2 The key stakeholders
Within Crystal, the key stakeholders are WP402, in particular Philips Healthcare itself, but also Bricks tool vendors.
Stakeholder Interests
Philips Healthcare – Safety Officer To create each quarter input for the Quarterly Risk Management Surveillance Report and for ad-hoc analysis.
Philips Healthcare – Development Risk Management Safety process
To check if Safety FMEA initial and residual hazard risk profiles are over- or under-estimated, compared to the actual situation as found in the field.
Bricks tool vendors To increase the installed base of their software
To identify new applications for their software
3.2.4.3 A brief description on the activity itself
The Product Risk Management application is realised in QlikView and is able to generate input for the Quarterly Risk Management Surveillance Report whenever the correct and up-to-date input data is available.
The Product Risk Management application also offers an actual Risk Profile that was needed to be able to generate the FDA’s Risk Management Matrix from Safety FMEA data (see 3.2.1).
3.2.4.3.1 QlikView Server Architecture and Data Warehouse design
Before the Risk Management Application could be realised, a generic QlikView Server Architecture, an iXR Data Warehouse design and a generic QlikView design were needed.
This is used for the Product Risk Management Application, but also in WP403 to provide dashboards and analysis views for different disciplines to support the development and system engineering processes and improve insight in those processes.

D402.901 Use Case Development Report – V1
Version Nature Date Page
V1.00 R 2014-04-30 37 of 66
1. QlikView Server Architecture
QlikView Server architectures are defined for:
o Development (DEV)
o Quality Assurance (QA)
o Production (PROD)
Where:
Term Description
DSC Directory Service Connector
IIS Internet Information Services
QDS QlikView Distribution Service
QMC QlikView Management Console
QVS QlikView Server
QVWS QlikView Webserver
The QlikView production server only uses the data from PROD share and the QlikView quality assurance environment only uses the data from the QA share. The DEV share is used for development purposes.
2. Data Warehouse Design
Microsoft SQL Server 2008 R2 is the database that will facilitate data storage for the iXR Data Warehouse (DWH). The Database Management System (DBMS) supports SQL & T-SQL for retrieving data from the database. Other important features of Microsoft SQL Server 2008 R2 are:
- Clustering (up-scaling database server) - Backup - Mirroring - Extensive Logging - Exporting (exporting database schema + contents) - Data Governance (provide certain data sets to certain users)
Microsoft SQL Server Integration Services (SSIS) is used as a tool for the Extract Transform Load (ETL) process. SSIS is a component of the Microsoft SQL Server database software that can be used to perform a broad range of data manipulation tasks.
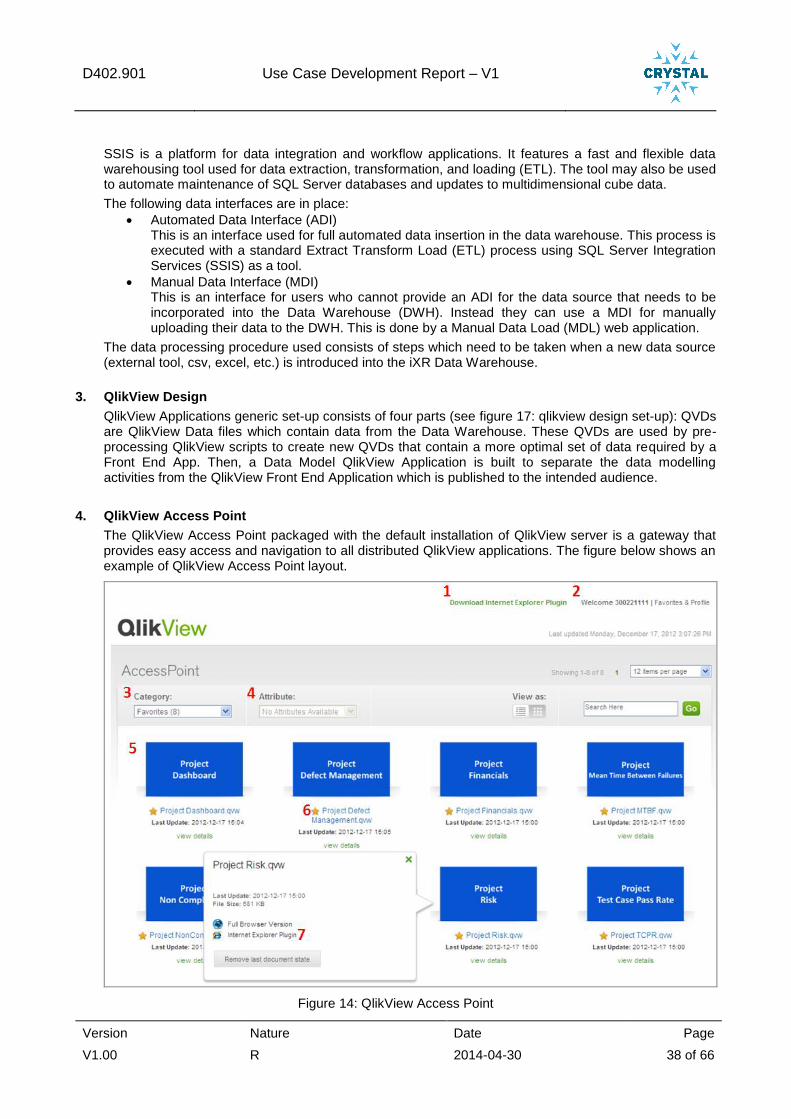
D402.901 Use Case Development Report – V1
Version Nature Date Page
V1.00 R 2014-04-30 38 of 66
SSIS is a platform for data integration and workflow applications. It features a fast and flexible data warehousing tool used for data extraction, transformation, and loading (ETL). The tool may also be used to automate maintenance of SQL Server databases and updates to multidimensional cube data.
The following data interfaces are in place:
Automated Data Interface (ADI) This is an interface used for full automated data insertion in the data warehouse. This process is executed with a standard Extract Transform Load (ETL) process using SQL Server Integration Services (SSIS) as a tool.
Manual Data Interface (MDI) This is an interface for users who cannot provide an ADI for the data source that needs to be incorporated into the Data Warehouse (DWH). Instead they can use a MDI for manually uploading their data to the DWH. This is done by a Manual Data Load (MDL) web application.
The data processing procedure used consists of steps which need to be taken when a new data source (external tool, csv, excel, etc.) is introduced into the iXR Data Warehouse.
3. QlikView Design
QlikView Applications generic set-up consists of four parts (see figure 17: qlikview design set-up): QVDs are QlikView Data files which contain data from the Data Warehouse. These QVDs are used by pre-processing QlikView scripts to create new QVDs that contain a more optimal set of data required by a Front End App. Then, a Data Model QlikView Application is built to separate the data modelling activities from the QlikView Front End Application which is published to the intended audience.
4. QlikView Access Point
The QlikView Access Point packaged with the default installation of QlikView server is a gateway that provides easy access and navigation to all distributed QlikView applications. The figure below shows an example of QlikView Access Point layout.
Figure 14: QlikView Access Point
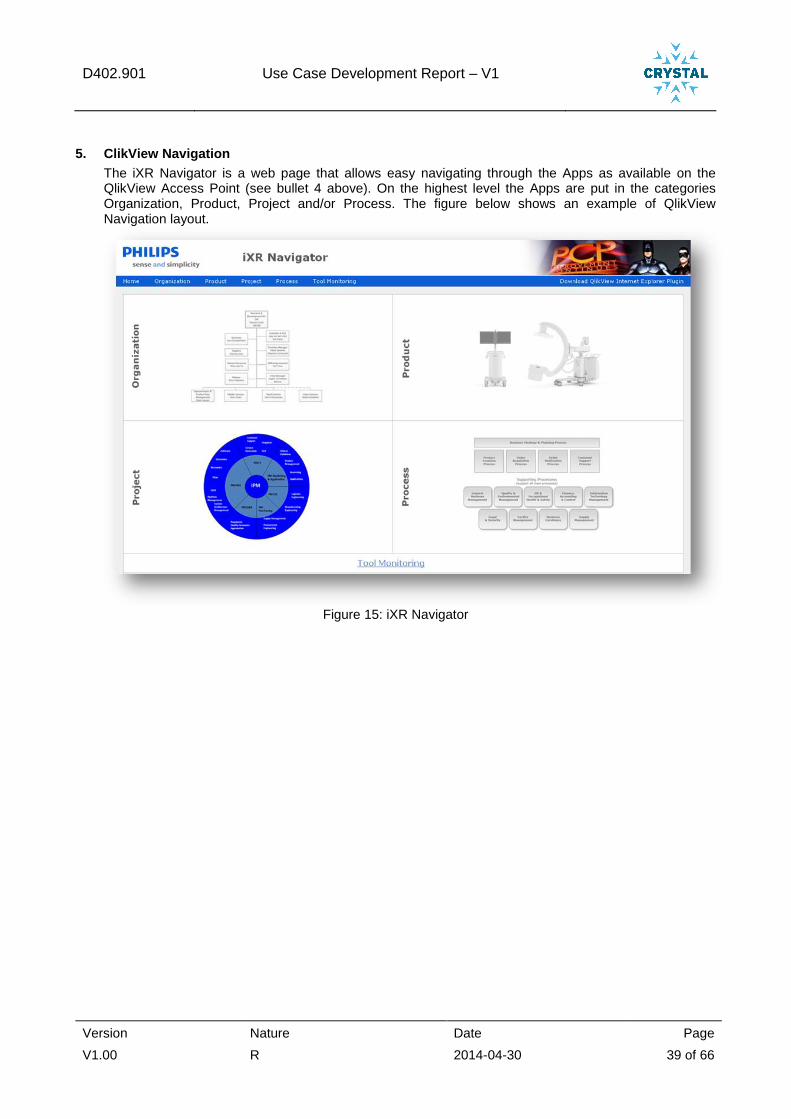
D402.901 Use Case Development Report – V1
Version Nature Date Page
V1.00 R 2014-04-30 39 of 66
5. ClikView Navigation
The iXR Navigator is a web page that allows easy navigating through the Apps as available on the QlikView Access Point (see bullet 4 above). On the highest level the Apps are put in the categories Organization, Product, Project and/or Process. The figure below shows an example of QlikView Navigation layout.
Figure 15: iXR Navigator
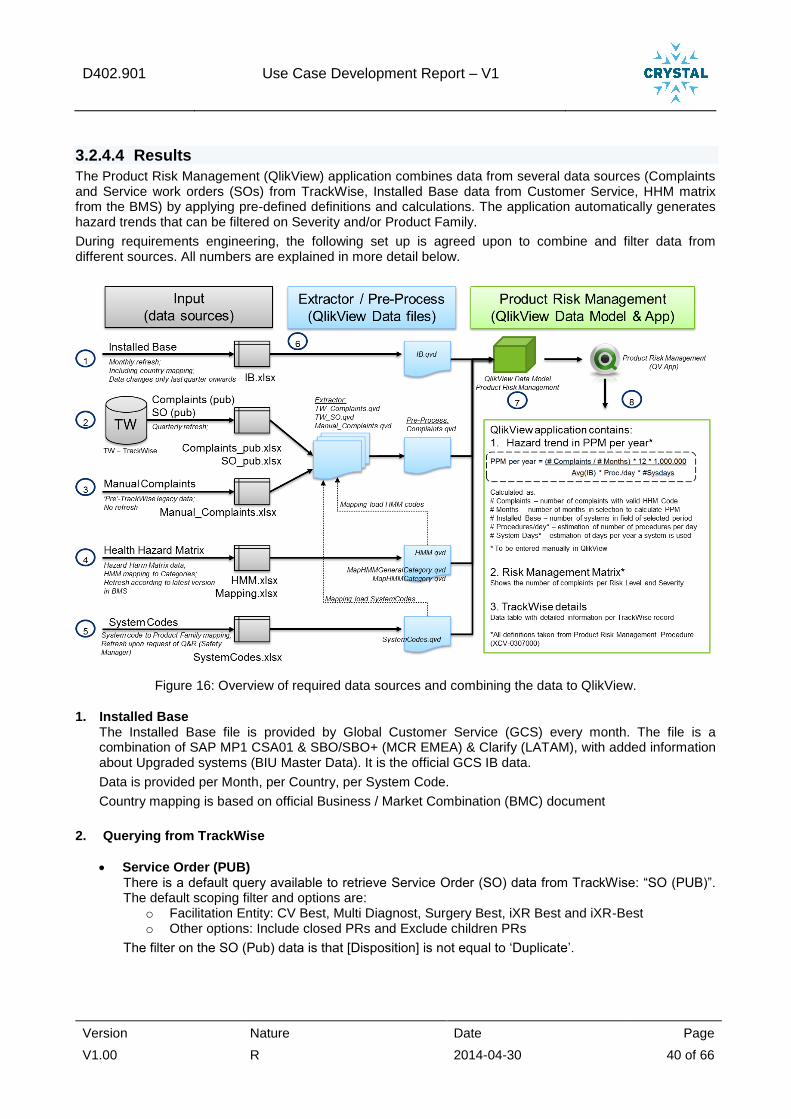
D402.901 Use Case Development Report – V1
Version Nature Date Page
V1.00 R 2014-04-30 40 of 66
3.2.4.4 Results
The Product Risk Management (QlikView) application combines data from several data sources (Complaints and Service work orders (SOs) from TrackWise, Installed Base data from Customer Service, HHM matrix from the BMS) by applying pre-defined definitions and calculations. The application automatically generates hazard trends that can be filtered on Severity and/or Product Family.
During requirements engineering, the following set up is agreed upon to combine and filter data from different sources. All numbers are explained in more detail below.
Figure 16: Overview of required data sources and combining the data to QlikView.
1. Installed Base The Installed Base file is provided by Global Customer Service (GCS) every month. The file is a combination of SAP MP1 CSA01 & SBO/SBO+ (MCR EMEA) & Clarify (LATAM), with added information about Upgraded systems (BIU Master Data). It is the official GCS IB data.
Data is provided per Month, per Country, per System Code.
Country mapping is based on official Business / Market Combination (BMC) document
2. Querying from TrackWise
Service Order (PUB) There is a default query available to retrieve Service Order (SO) data from TrackWise: “SO (PUB)”. The default scoping filter and options are:
o Facilitation Entity: CV Best, Multi Diagnost, Surgery Best, iXR Best and iXR-Best o Other options: Include closed PRs and Exclude children PRs
The filter on the SO (Pub) data is that [Disposition] is not equal to ‘Duplicate’.
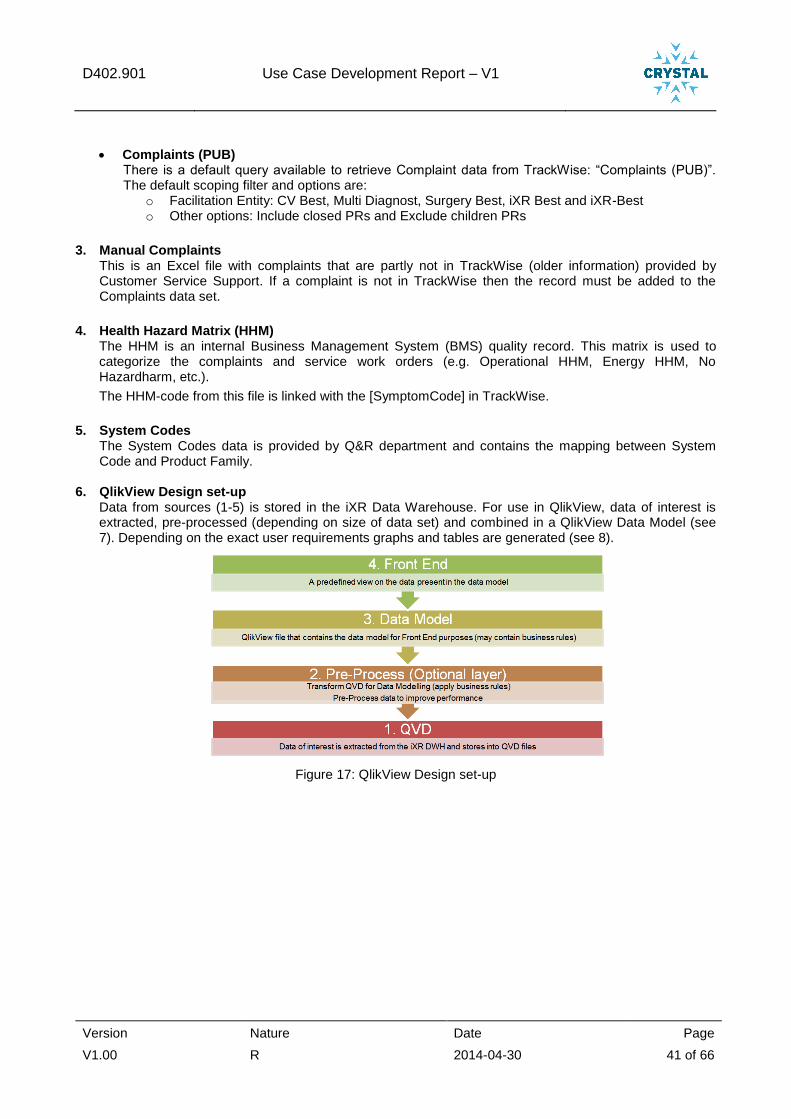
D402.901 Use Case Development Report – V1
Version Nature Date Page
V1.00 R 2014-04-30 41 of 66
Complaints (PUB) There is a default query available to retrieve Complaint data from TrackWise: “Complaints (PUB)”. The default scoping filter and options are:
o Facilitation Entity: CV Best, Multi Diagnost, Surgery Best, iXR Best and iXR-Best o Other options: Include closed PRs and Exclude children PRs
3. Manual Complaints This is an Excel file with complaints that are partly not in TrackWise (older information) provided by Customer Service Support. If a complaint is not in TrackWise then the record must be added to the Complaints data set.
4. Health Hazard Matrix (HHM) The HHM is an internal Business Management System (BMS) quality record. This matrix is used to categorize the complaints and service work orders (e.g. Operational HHM, Energy HHM, No Hazardharm, etc.).
The HHM-code from this file is linked with the [SymptomCode] in TrackWise.
5. System Codes
The System Codes data is provided by Q&R department and contains the mapping between System Code and Product Family.
6. QlikView Design set-up Data from sources (1-5) is stored in the iXR Data Warehouse. For use in QlikView, data of interest is extracted, pre-processed (depending on size of data set) and combined in a QlikView Data Model (see 7). Depending on the exact user requirements graphs and tables are generated (see 8).
Figure 17: QlikView Design set-up
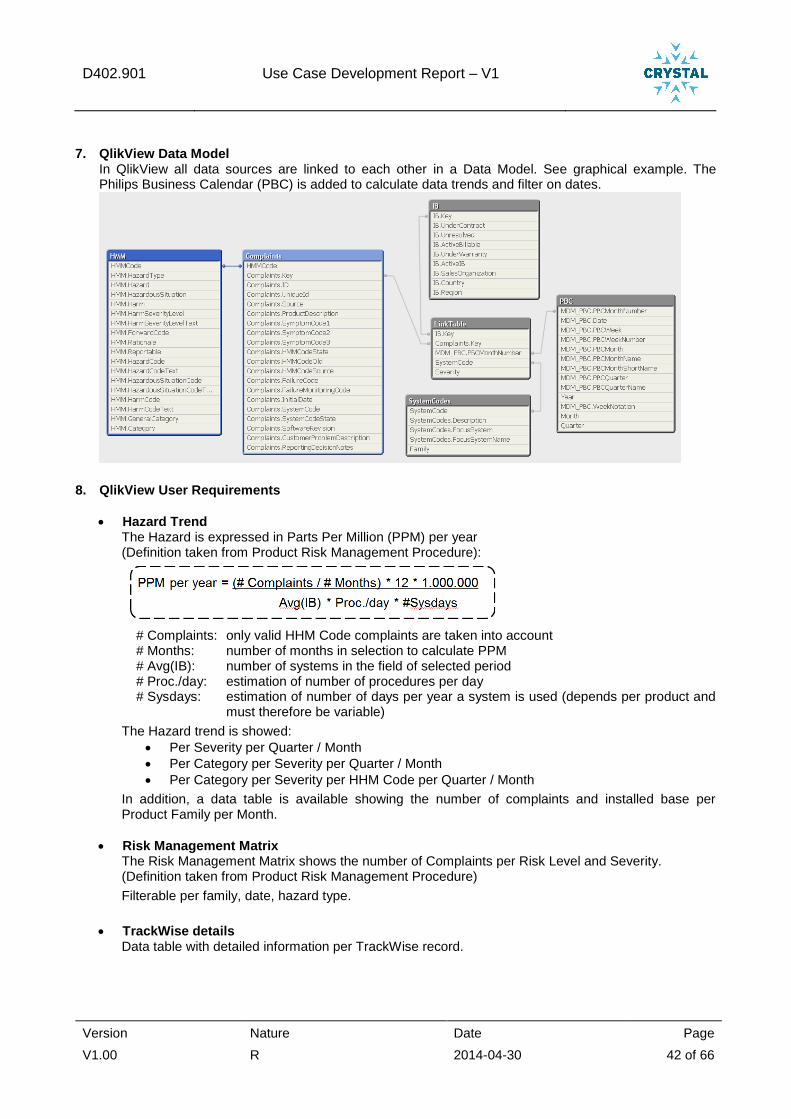
D402.901 Use Case Development Report – V1
Version Nature Date Page
V1.00 R 2014-04-30 42 of 66
7. QlikView Data Model In QlikView all data sources are linked to each other in a Data Model. See graphical example. The Philips Business Calendar (PBC) is added to calculate data trends and filter on dates.
8. QlikView User Requirements
Hazard Trend The Hazard is expressed in Parts Per Million (PPM) per year (Definition taken from Product Risk Management Procedure):
# Complaints: only valid HHM Code complaints are taken into account # Months: number of months in selection to calculate PPM # Avg(IB): number of systems in the field of selected period # Proc./day: estimation of number of procedures per day # Sysdays: estimation of number of days per year a system is used (depends per product and
must therefore be variable)
The Hazard trend is showed:
Per Severity per Quarter / Month
Per Category per Severity per Quarter / Month
Per Category per Severity per HHM Code per Quarter / Month
In addition, a data table is available showing the number of complaints and installed base per Product Family per Month.
Risk Management Matrix The Risk Management Matrix shows the number of Complaints per Risk Level and Severity. (Definition taken from Product Risk Management Procedure)
Filterable per family, date, hazard type.
TrackWise details Data table with detailed information per TrackWise record.
D402.901 Use Case Development Report – V1
Version Nature Date Page
V1.00 R 2014-04-30 43 of 66
3.2.4.5 Current status on the activity
The Product Risk Management application is realised in QlikView and is able to generate input for the Quarterly Risk Management Surveillance Report and RMM, whenever the input data is available.
3.2.4.6 Lessons learned
a) Within the context of this use case Time needed by the safety manager to create the report is reduced, and the quality less man-dependent and much higher, since the same definitions and calculations are used consistently between different reports.
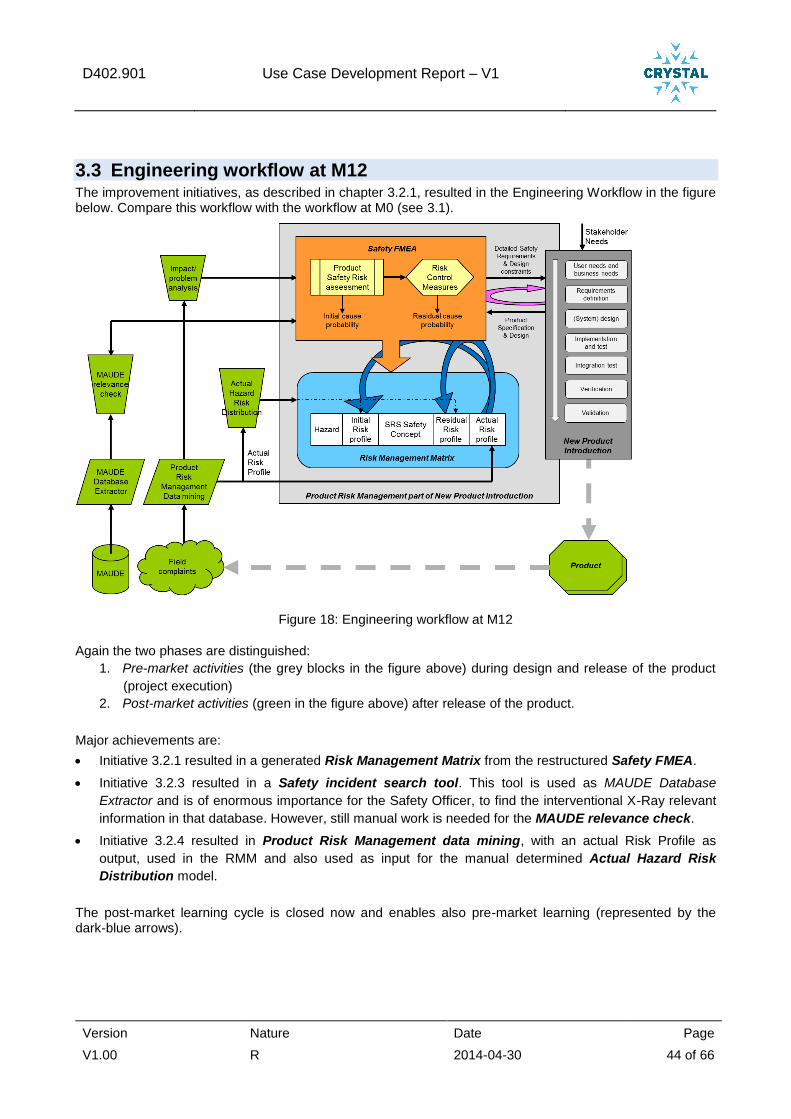
D402.901 Use Case Development Report – V1
Version Nature Date Page
V1.00 R 2014-04-30 44 of 66
3.3 Engineering workflow at M12 The improvement initiatives, as described in chapter 3.2.1, resulted in the Engineering Workflow in the figure below. Compare this workflow with the workflow at M0 (see 3.1).
Figure 18: Engineering workflow at M12
Again the two phases are distinguished:
1. Pre-market activities (the grey blocks in the figure above) during design and release of the product
(project execution)
2. Post-market activities (green in the figure above) after release of the product.
Major achievements are:
Initiative 3.2.1 resulted in a generated Risk Management Matrix from the restructured Safety FMEA.
Initiative 3.2.3 resulted in a Safety incident search tool. This tool is used as MAUDE Database
Extractor and is of enormous importance for the Safety Officer, to find the interventional X-Ray relevant
information in that database. However, still manual work is needed for the MAUDE relevance check.
Initiative 3.2.4 resulted in Product Risk Management data mining, with an actual Risk Profile as
output, used in the RMM and also used as input for the manual determined Actual Hazard Risk
Distribution model.
The post-market learning cycle is closed now and enables also pre-market learning (represented by the dark-blue arrows).
D402.901 Use Case Development Report – V1
Version Nature Date Page
V1.00 R 2014-04-30 45 of 66
3.4 Project Innovations A significant improvement in the engineering workflow is covered by the new Safety FMEA way of working and generated Risk Management Matrix (RMM) and the solutions offered by the Safety incident search tool and Product Risk Management Data mining (see figure 18: engineering workflow at m12).
The two level dynamic risk management approach that is now introduced is innovative
• in its distinction between aggregated safety behaviour (Risk Management matrix) and detailed safety behaviour (Safety FMEA)
• in its closed loop character where field data is used to continuously update residual risk profiles and to feed forward to engineers in running development projects
In the next year, innovation is foreseen in creating two-way cause effect nets to make the safety risk mechanisms more tangible and reusable. This can again be done at several levels of detail and with various cross-sections (e.g. motion and radiation; electrical; clinical exceptions; information misinterpretation or unavailability). Also, the cause-effect net can be detailed for high severity risks and be kept simple for low-severity risks.
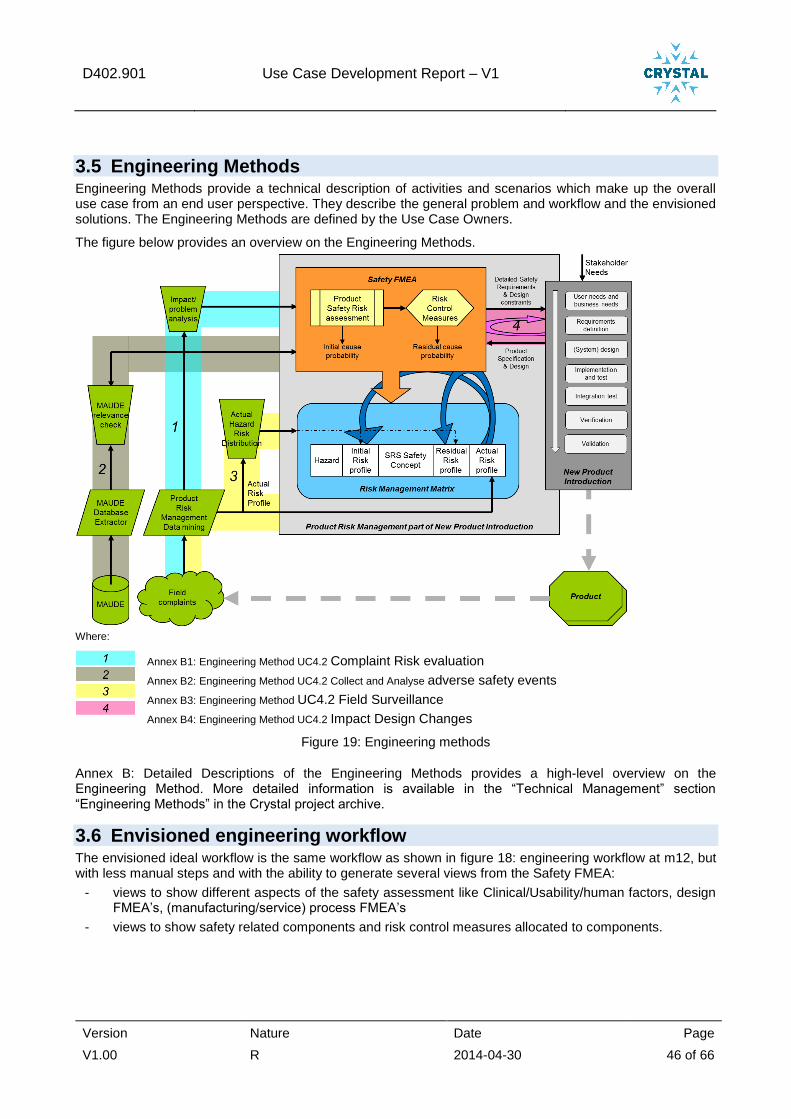
D402.901 Use Case Development Report – V1
Version Nature Date Page
V1.00 R 2014-04-30 46 of 66
3.5 Engineering Methods Engineering Methods provide a technical description of activities and scenarios which make up the overall use case from an end user perspective. They describe the general problem and workflow and the envisioned solutions. The Engineering Methods are defined by the Use Case Owners.
The figure below provides an overview on the Engineering Methods.
Where:
Annex B1: Engineering Method UC4.2 Complaint Risk evaluation
Annex B2: Engineering Method UC4.2 Collect and Analyse adverse safety events
Annex B3: Engineering Method UC4.2 Field Surveillance
Annex B4: Engineering Method UC4.2 Impact Design Changes
Figure 19: Engineering methods
Annex B: Detailed Descriptions of the Engineering Methods provides a high-level overview on the Engineering Method. More detailed information is available in the “Technical Management” section “Engineering Methods” in the Crystal project archive.
3.6 Envisioned engineering workflow The envisioned ideal workflow is the same workflow as shown in figure 18: engineering workflow at m12, but with less manual steps and with the ability to generate several views from the Safety FMEA:
- views to show different aspects of the safety assessment like Clinical/Usability/human factors, design FMEA’s, (manufacturing/service) process FMEA’s
- views to show safety related components and risk control measures allocated to components.
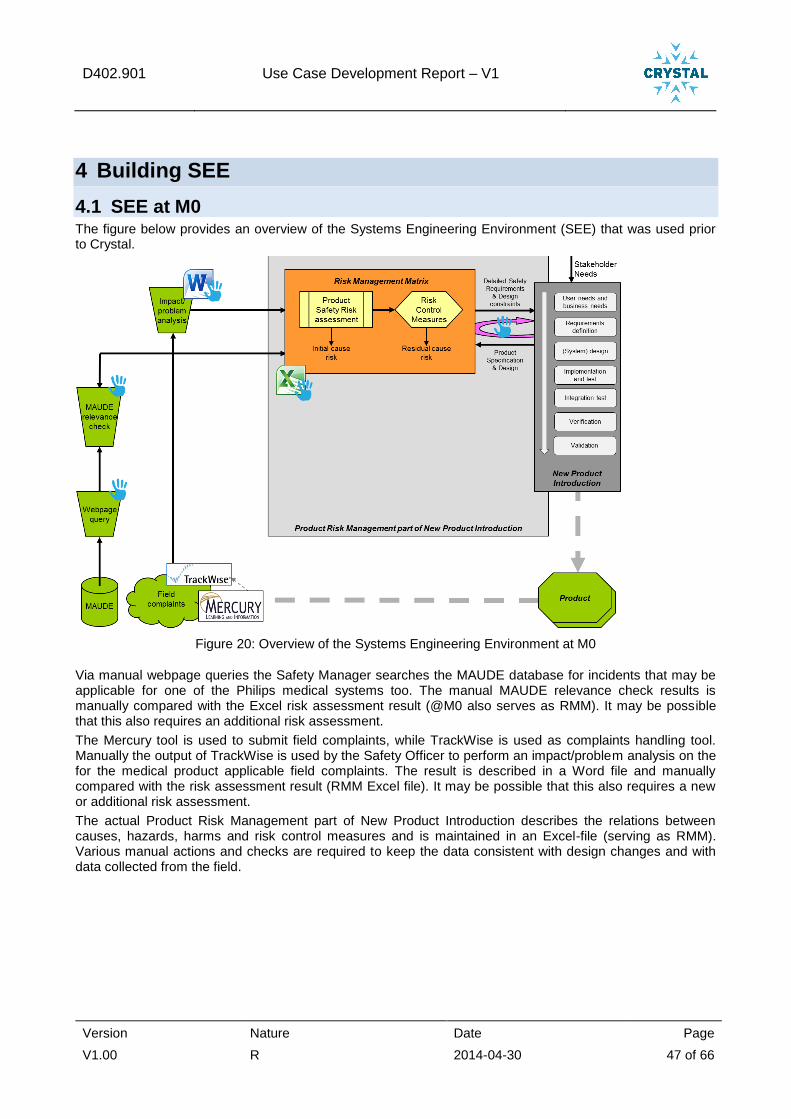
D402.901 Use Case Development Report – V1
Version Nature Date Page
V1.00 R 2014-04-30 47 of 66
4 Building SEE
4.1 SEE at M0 The figure below provides an overview of the Systems Engineering Environment (SEE) that was used prior to Crystal.
Figure 20: Overview of the Systems Engineering Environment at M0
Via manual webpage queries the Safety Manager searches the MAUDE database for incidents that may be applicable for one of the Philips medical systems too. The manual MAUDE relevance check results is manually compared with the Excel risk assessment result (@M0 also serves as RMM). It may be possible that this also requires an additional risk assessment.
The Mercury tool is used to submit field complaints, while TrackWise is used as complaints handling tool. Manually the output of TrackWise is used by the Safety Officer to perform an impact/problem analysis on the for the medical product applicable field complaints. The result is described in a Word file and manually compared with the risk assessment result (RMM Excel file). It may be possible that this also requires a new or additional risk assessment.
The actual Product Risk Management part of New Product Introduction describes the relations between causes, hazards, harms and risk control measures and is maintained in an Excel-file (serving as RMM). Various manual actions and checks are required to keep the data consistent with design changes and with data collected from the field.
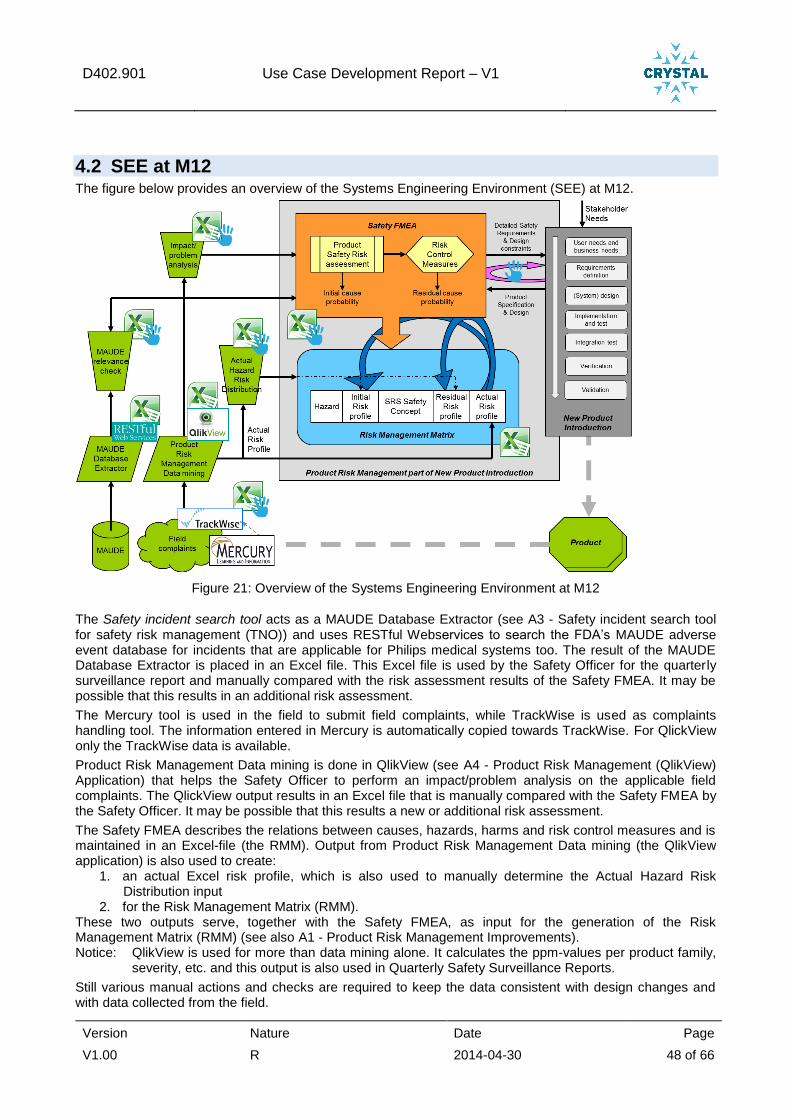
D402.901 Use Case Development Report – V1
Version Nature Date Page
V1.00 R 2014-04-30 48 of 66
4.2 SEE at M12 The figure below provides an overview of the Systems Engineering Environment (SEE) at M12.
Figure 21: Overview of the Systems Engineering Environment at M12
The Safety incident search tool acts as a MAUDE Database Extractor (see A3 - Safety incident search tool for safety risk management (TNO)) and uses RESTful Webservices to search the FDA’s MAUDE adverse event database for incidents that are applicable for Philips medical systems too. The result of the MAUDE Database Extractor is placed in an Excel file. This Excel file is used by the Safety Officer for the quarterly surveillance report and manually compared with the risk assessment results of the Safety FMEA. It may be possible that this results in an additional risk assessment.
The Mercury tool is used in the field to submit field complaints, while TrackWise is used as complaints handling tool. The information entered in Mercury is automatically copied towards TrackWise. For QlickView only the TrackWise data is available.
Product Risk Management Data mining is done in QlikView (see A4 - Product Risk Management (QlikView) Application) that helps the Safety Officer to perform an impact/problem analysis on the applicable field complaints. The QlickView output results in an Excel file that is manually compared with the Safety FMEA by the Safety Officer. It may be possible that this results a new or additional risk assessment.
The Safety FMEA describes the relations between causes, hazards, harms and risk control measures and is maintained in an Excel-file (the RMM). Output from Product Risk Management Data mining (the QlikView application) is also used to create:
1. an actual Excel risk profile, which is also used to manually determine the Actual Hazard Risk Distribution input
2. for the Risk Management Matrix (RMM). These two outputs serve, together with the Safety FMEA, as input for the generation of the Risk Management Matrix (RMM) (see also A1 - Product Risk Management Improvements). Notice: QlikView is used for more than data mining alone. It calculates the ppm-values per product family,
severity, etc. and this output is also used in Quarterly Safety Surveillance Reports.
Still various manual actions and checks are required to keep the data consistent with design changes and with data collected from the field.
D402.901 Use Case Development Report – V1
Version Nature Date Page
V1.00 R 2014-04-30 49 of 66
4.3 Tool chain description This paragraph provides a short introduction on the individual engineering tools (also known as. Brick) mentioned in the Systems Engineering Environment at M0 and M12.
4.3.1 Safety incident search tool (or MAUDE Database Extractor)
The Safety incident search tool makes the various public incident databases (such as the FDA Maude) available through a common OSLC service with common search fields and mechanisms. This makes daily or frequent update of market surveillance queries possible without manual selection of data on the websites of the various source databases. (See A3 - Safety incident search tool for safety risk management (TNO)).
4.3.2 QlikView
The Qlikview Business Discovery Platform is a Business Intelligence tool that provides a flexible and dynamic way to present information to support innovative and collaborative decision making. Qlikview supports easy creation of dashboards, dynamic data representation and powerful data analysis from multiple angles like functional disciplines and organizational hierarchy.
In this use case the QlikView tool is used as Product Risk Management Application (see A4 - Product Risk Management (QlikView) Application)
4.3.3 Excel
As figure 21: overview of the systems engineering environment at m12 shows, Excel is widely used in Risk Management.
Dedicated Excel macros are written to generate the RMM from the Safety FMEA. The basic calculation steps are:
Per Hazard the sum of all cause probabilities (in ppm) are calculated.
The sum of the cause probabilities are distributed over the applicable severities, conform the Hazard Risk Distribution model. This results per severity in a probability ppm-value. That ppm-value is mapped on the probability level (L0..L4) from table 4: probability levels (quantitative). This is done for both the initial and the residual probability.
All System Safety Concept Requirements are listed in the RMM Excel tab. Per Hazard the Safety FMEA is searched on used Safety Concept Requirements and a cross (X) is placed in the applicable Hazard row and applicable Safety Concept Requirement column.
Finally the actual risk profile from surveillance data is added for comparison with the residual risk profile.
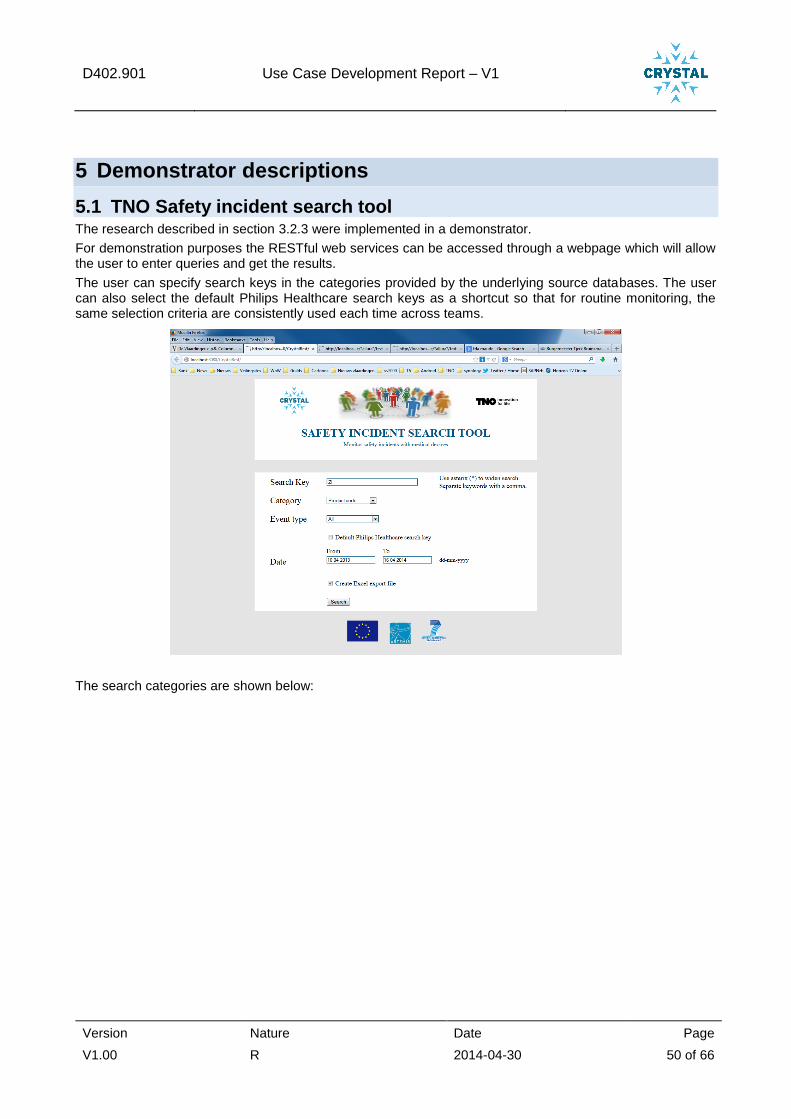
D402.901 Use Case Development Report – V1
Version Nature Date Page
V1.00 R 2014-04-30 50 of 66
5 Demonstrator descriptions
5.1 TNO Safety incident search tool The research described in section 3.2.3 were implemented in a demonstrator.
For demonstration purposes the RESTful web services can be accessed through a webpage which will allow the user to enter queries and get the results.
The user can specify search keys in the categories provided by the underlying source databases. The user can also select the default Philips Healthcare search keys as a shortcut so that for routine monitoring, the same selection criteria are consistently used each time across teams.
The search categories are shown below:

D402.901 Use Case Development Report – V1
Version Nature Date Page
V1.00 R 2014-04-30 51 of 66
The various safety event types can be selected:
By default, data for the last year is provided. The user can modify this to his desire.
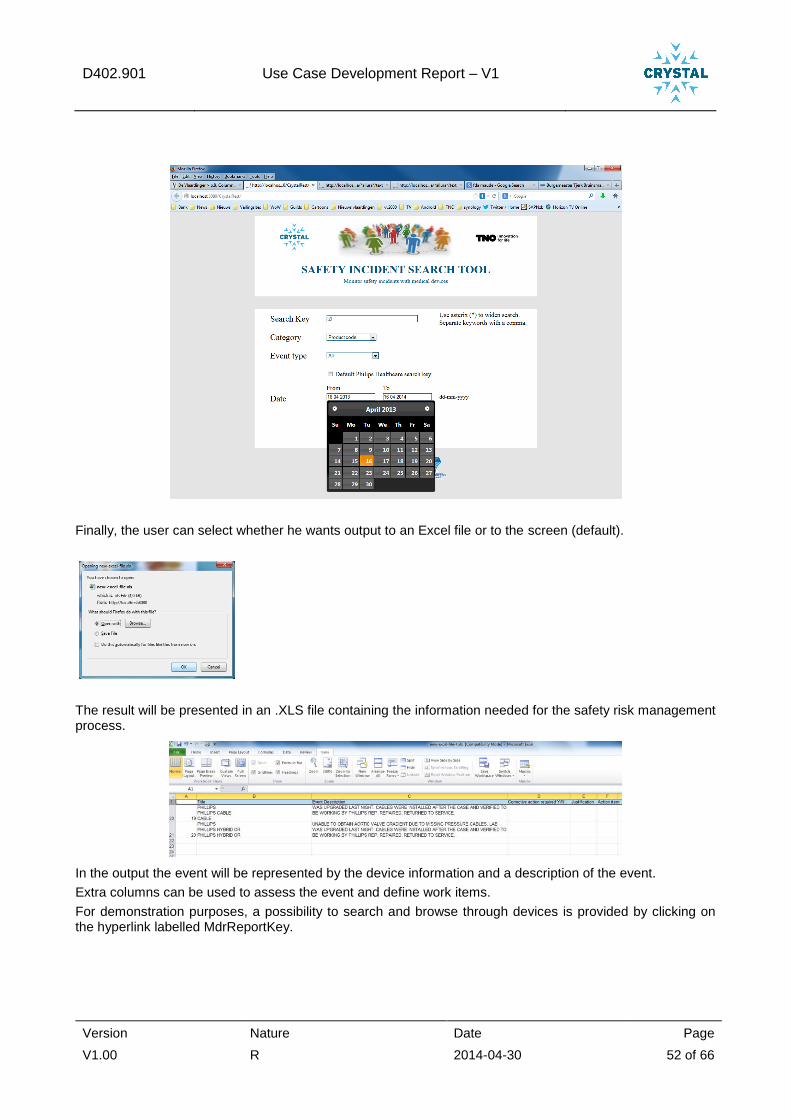
D402.901 Use Case Development Report – V1
Version Nature Date Page
V1.00 R 2014-04-30 52 of 66
Finally, the user can select whether he wants output to an Excel file or to the screen (default).
The result will be presented in an .XLS file containing the information needed for the safety risk management process.
In the output the event will be represented by the device information and a description of the event.
Extra columns can be used to assess the event and define work items.
For demonstration purposes, a possibility to search and browse through devices is provided by clicking on the hyperlink labelled MdrReportKey.
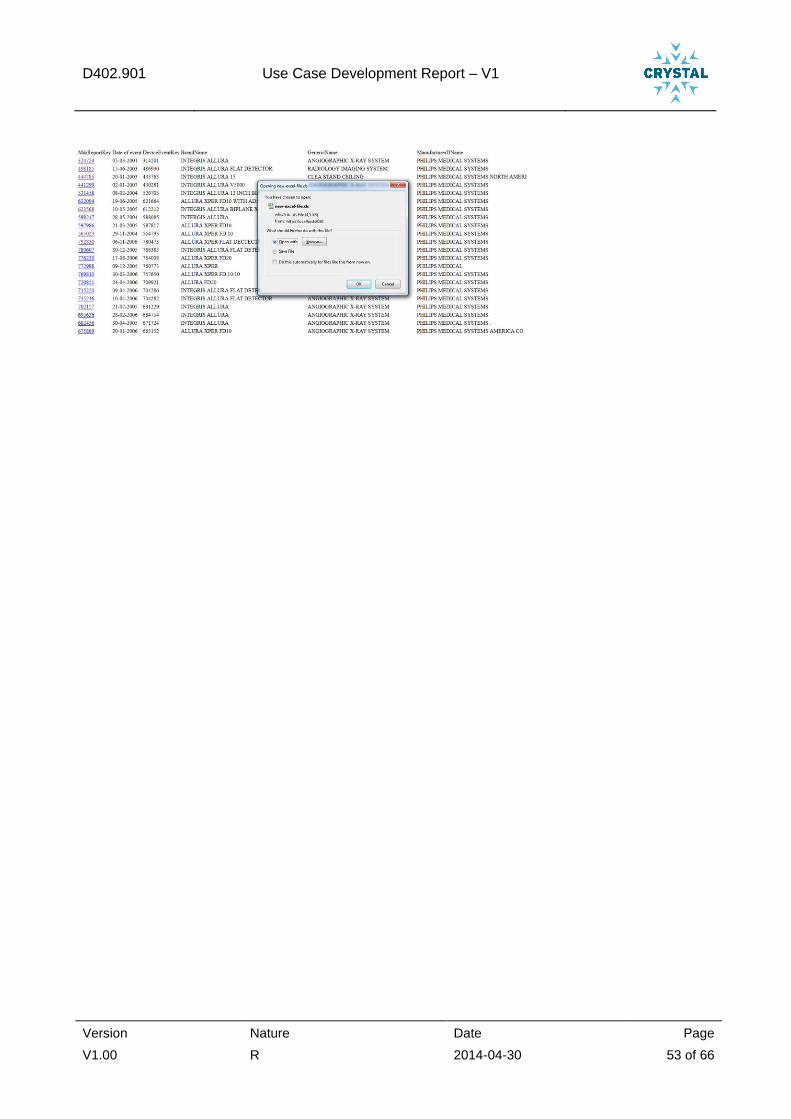
D402.901 Use Case Development Report – V1
Version Nature Date Page
V1.00 R 2014-04-30 53 of 66

D402.901 Use Case Development Report – V1
Version Nature Date Page
V1.00 R 2014-04-30 54 of 66
6 Conclusion and way ahead
6.1 Evaluation
6.1.1 Use Case Development lessons learned
Now that a more robust work flow and risk classification has been defined, the various roles in the safety risk management process can be further served with dedicated views on the same underlying safety risk data. This requires separation of views from data. We need automated support to visualize safety related aspects of manufacturing (including purchased parts and the role of a component) and service, with visa-versa safety views over the whole V-model.
In close cooperation with WP6, solutions for these automated supporting views may be achieved.
6.1.2 Cross domain lessons learned
Tool maturity in automotive and aerospace is at a higher level compared to healthcare with respect to safety risk management (and possible other development domains). The automotive and aerospace clusters of companies are largely cantered around dominant manufacturers that can prescribe software tooling and standards for documentation to some extent. In the healthcare sector, suppliers are more loosely linked to the manufacturers and to more than one manufacturer. This means that the manufacturers cannot prescribe software tooling and have to deal with a larger variety in data interfaces. Also, automotive and aerospace solutions cannot always be transferred to healthcare. In conclusion, the importance of interoperability in healthcare is even larger than for automotive and aerospace.
6.2 Planned future work on Engineering Workflow This paragraph provides details on the planned future work for WP402. See also Appendix A for a mapping between the activities started and/or planned for in WP402 and its activities per allocated User Stories.
The work started on using field surveillance data to quantify likeliness in risk profiles will be made available to development engineers as well to give quick feedback on the risks related to the unit under design.
The insights among development engineers about actual events during system use may be increased by providing more elaborate safety use cases and user stories, related to certain functions or units.
6.2.1 Product Risk Management Improvements
A selection will be made of technical requirements and technical items for which the first tools will be developed and small-scale tested. After that, tool development will start. It seems likely to give priority to tools for the following (many related to TNO, but there are quite a lot in common with Philips):
1. Definition of Actual Hazard Risk Distribution Models (see figure 18) for all hazards, with explicit hazardous situations included in that model. With such models pro-active reaction on clinical trends will become possible (see also figure 3: philips’ path from a qualitative risk analysis toward a pro-active quantitative risk analysis).
2. Creation of different risk management view possibilities, among others to:
- visualize possible necessary service and manufacturing (including purchased parts) safety-related actions,
- the safety role of a component.
Distinctive views are needed between the frontside (= hazard-related, where the FDA is looking at) and the backside (= control measure related, where factory and service are looking at).
Offering bi-directional safety requirements related links over the whole V-model (or H-model) and visa-versa. And for product defect management the link the failure rates and risk management
So there is a need for closed loop End to End (E2E) product risk management, linking risk management activities cross functional and externally towards suppliers, as shown in the figure below.
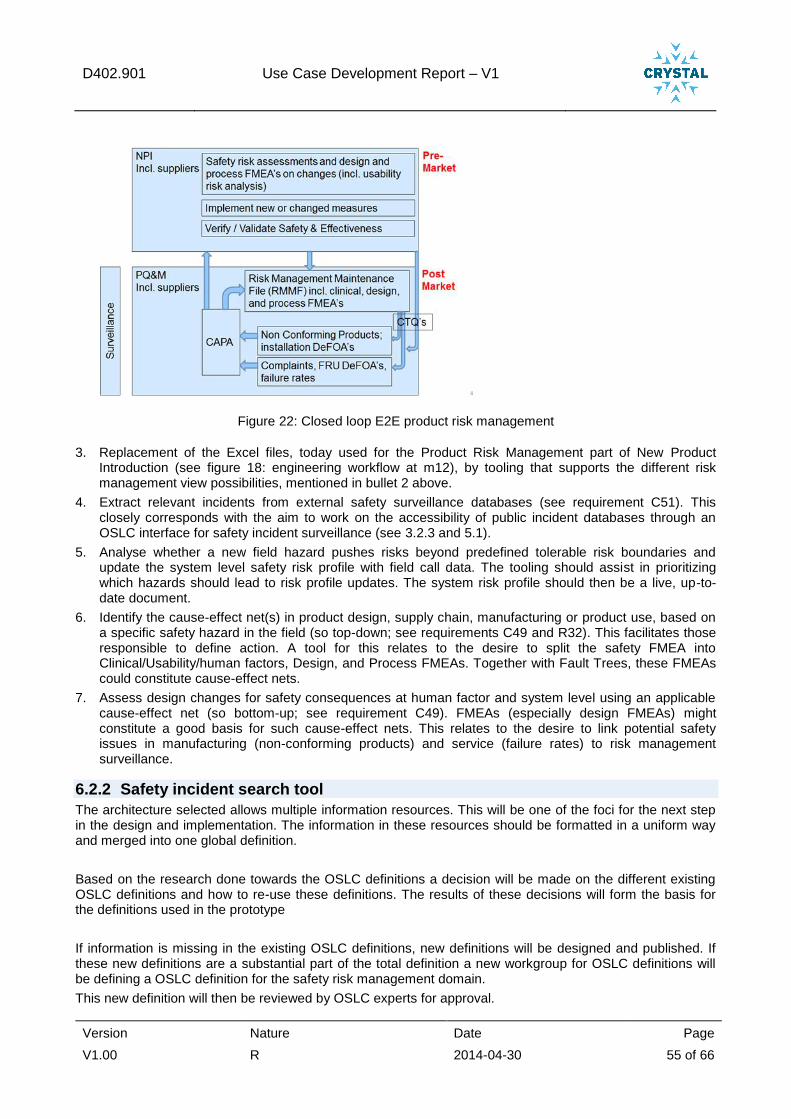
D402.901 Use Case Development Report – V1
Version Nature Date Page
V1.00 R 2014-04-30 55 of 66
Figure 22: Closed loop E2E product risk management
3. Replacement of the Excel files, today used for the Product Risk Management part of New Product Introduction (see figure 18: engineering workflow at m12), by tooling that supports the different risk management view possibilities, mentioned in bullet 2 above.
4. Extract relevant incidents from external safety surveillance databases (see requirement C51). This closely corresponds with the aim to work on the accessibility of public incident databases through an OSLC interface for safety incident surveillance (see 3.2.3 and 5.1).
5. Analyse whether a new field hazard pushes risks beyond predefined tolerable risk boundaries and update the system level safety risk profile with field call data. The tooling should assist in prioritizing which hazards should lead to risk profile updates. The system risk profile should then be a live, up-to-date document.
6. Identify the cause-effect net(s) in product design, supply chain, manufacturing or product use, based on a specific safety hazard in the field (so top-down; see requirements C49 and R32). This facilitates those responsible to define action. A tool for this relates to the desire to split the safety FMEA into Clinical/Usability/human factors, Design, and Process FMEAs. Together with Fault Trees, these FMEAs could constitute cause-effect nets.
7. Assess design changes for safety consequences at human factor and system level using an applicable cause-effect net (so bottom-up; see requirement C49). FMEAs (especially design FMEAs) might constitute a good basis for such cause-effect nets. This relates to the desire to link potential safety issues in manufacturing (non-conforming products) and service (failure rates) to risk management surveillance.
6.2.2 Safety incident search tool
The architecture selected allows multiple information resources. This will be one of the foci for the next step in the design and implementation. The information in these resources should be formatted in a uniform way and merged into one global definition.
Based on the research done towards the OSLC definitions a decision will be made on the different existing OSLC definitions and how to re-use these definitions. The results of these decisions will form the basis for the definitions used in the prototype
If information is missing in the existing OSLC definitions, new definitions will be designed and published. If these new definitions are a substantial part of the total definition a new workgroup for OSLC definitions will be defining a OSLC definition for the safety risk management domain.
This new definition will then be reviewed by OSLC experts for approval.
D402.901 Use Case Development Report – V1
Version Nature Date Page
V1.00 R 2014-04-30 56 of 66
6.2.3 Safety risk management tooling
In this document, a range of improvements to the safety risk management tooling has been identified. Following the OSLC philosophy, the focus is on the data availability and less on the individual software tools that create and modify the data.
In the coming period, the underlying data objects, the actors, the required operations and the relationships between the data objects will be further analysed and documented. This will be linked to the OSLC definitions and missing definitions will be identified.
6.3 Planned future work on Building SEE Now that the safety management process is well defined and introduced, the corresponding software
tooling can be raised to a next level of maturity.
A long list of technical items for tooling improvement was made. This is discussed in section 3.2.2 and listed in the AVL SharePoint site: https://projects.avl.com/11/0154/Lists/Technical%20Items/AllItems.aspx
6.3.1 Safety incident search tool for risk management (TNO)
The chosen architecture allows multiple information resources. This will be one of the foci for the next step in the design and implementation. This information in these resources should be formatted in a uniform way and merged into one global definition.
Based on the research done towards the OSLC definitions a decision will be made on the different existing OSLC definitions and how to re-use these definitions. The results of these decisions will form the base form the definitions used in the prototype
If information is missing in the existing OSLC definitions, new definitions will be designed and published. If these new definitions are a substantial part of the total definition a new workgroup for OSLC definitions will be defining an OSLC definition for the safety risk management domain.
This new definition will then be reviewed by OSLC experts for approval.
6.3.2 Product Risk Management (QlikView) Application
Improve the TrackWise database interface, to be able to automatically receive the data we need from TrackWise
1.
Integrate the output of FDA’s MAUDE database extraction into the Product Risk Management application
6.4 Planned future work on Integrating SEE in R&D projects Currently, training on the high level safety risk management approach is already ongoing. Additions to the process and changes in tooling will be integrated in this training. If new tooling makes this the easiest way of performing safety design, adoption will go smoothly.
6.4.1 Safety risk management tooling
In this document, a range of improvements to the safety risk management tooling has been identified. Following the OSLC philosophy, the focus is on the data definition and availability and less on the individual software tools that create and modify the data.
In the coming period, the underlying data objects, the actors, the required operations and the relationships between the data objects will be further analysed and documented. This will be linked to the OSLC definitions and missing definitions will be identified. As a first visualisation of this, the H-model with data objects can be shown:
1 At this moment we don’t have an interface with TrackWise. Each quarter we retrieve data manually from TrackWise by running default queries. As the amount of data that is retrieved by these queries is huge, these queries take a lot of time (and often the system times out when trying).
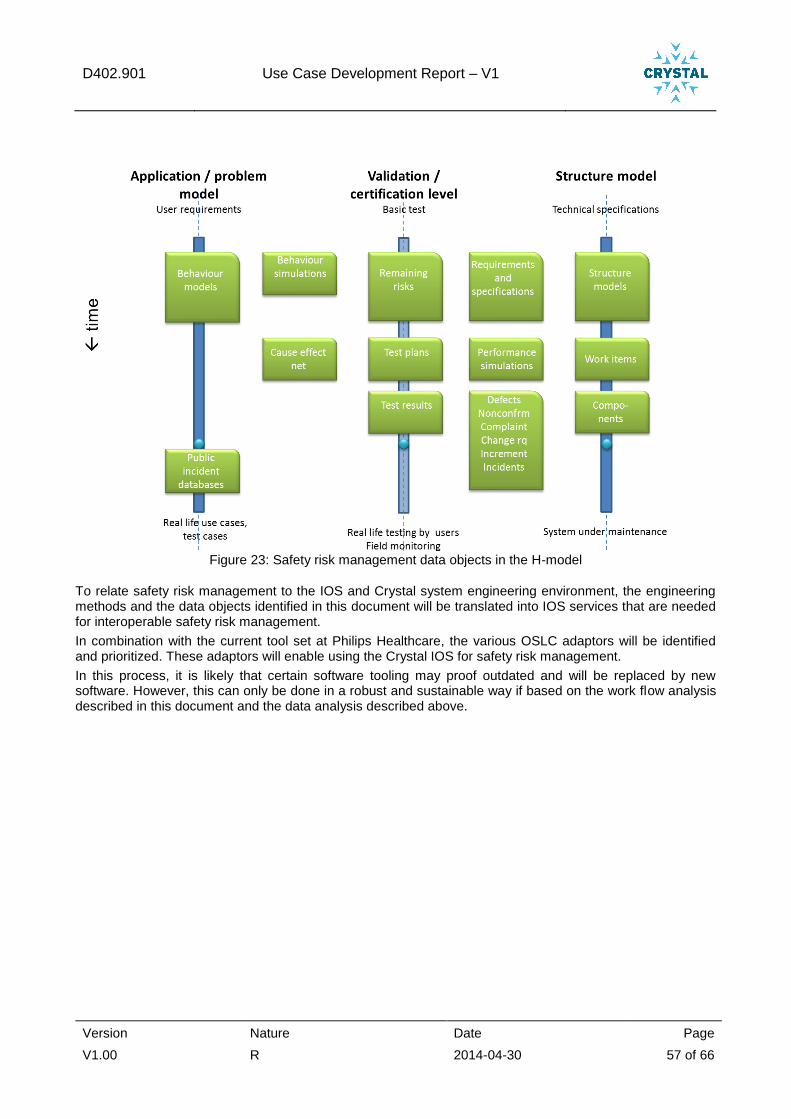
D402.901 Use Case Development Report – V1
Version Nature Date Page
V1.00 R 2014-04-30 57 of 66
Figure 23: Safety risk management data objects in the H-model
To relate safety risk management to the IOS and Crystal system engineering environment, the engineering methods and the data objects identified in this document will be translated into IOS services that are needed for interoperable safety risk management.
In combination with the current tool set at Philips Healthcare, the various OSLC adaptors will be identified and prioritized. These adaptors will enable using the Crystal IOS for safety risk management.
In this process, it is likely that certain software tooling may proof outdated and will be replaced by new software. However, this can only be done in a robust and sustainable way if based on the work flow analysis described in this document and the data analysis described above.
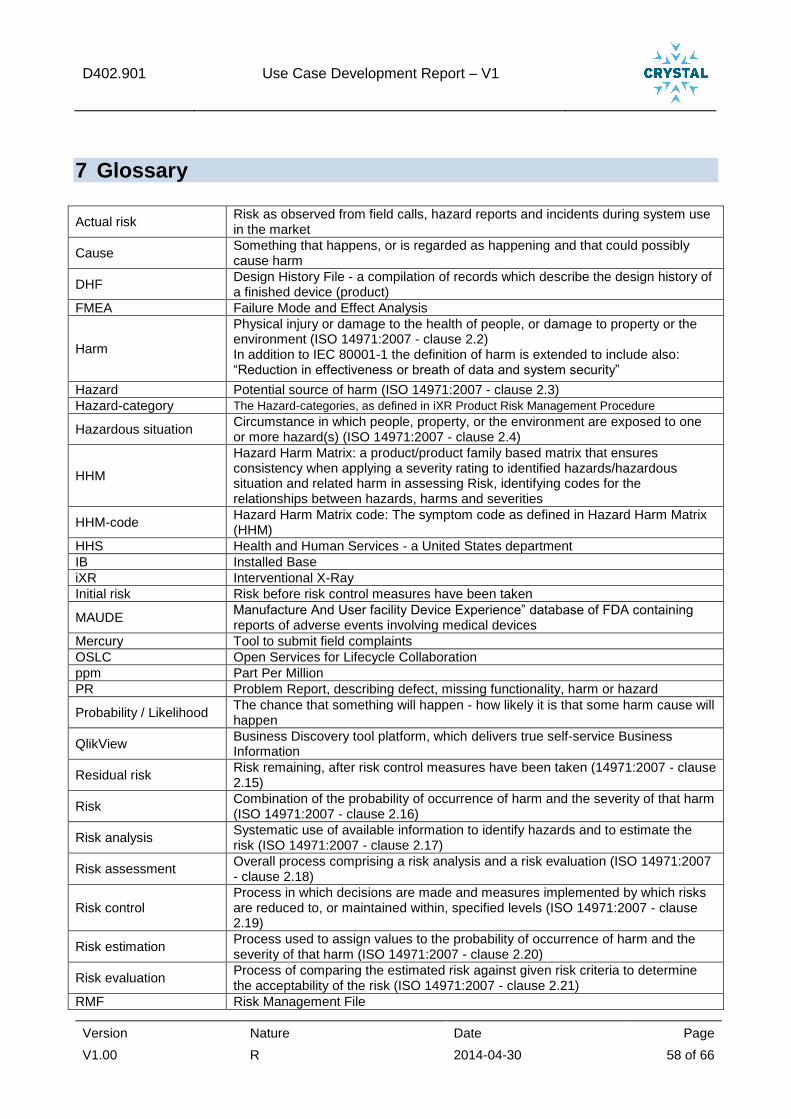
D402.901 Use Case Development Report – V1
Version Nature Date Page
V1.00 R 2014-04-30 58 of 66
7 Glossary
Actual risk Risk as observed from field calls, hazard reports and incidents during system use in the market
Cause Something that happens, or is regarded as happening and that could possibly cause harm
DHF Design History File - a compilation of records which describe the design history of a finished device (product)
FMEA Failure Mode and Effect Analysis
Harm
Physical injury or damage to the health of people, or damage to property or the environment (ISO 14971:2007 - clause 2.2) In addition to IEC 80001-1 the definition of harm is extended to include also: “Reduction in effectiveness or breath of data and system security”
Hazard Potential source of harm (ISO 14971:2007 - clause 2.3)
Hazard-category The Hazard-categories, as defined in iXR Product Risk Management Procedure
Hazardous situation Circumstance in which people, property, or the environment are exposed to one or more hazard(s) (ISO 14971:2007 - clause 2.4)
HHM
Hazard Harm Matrix: a product/product family based matrix that ensures consistency when applying a severity rating to identified hazards/hazardous situation and related harm in assessing Risk, identifying codes for the relationships between hazards, harms and severities
HHM-code Hazard Harm Matrix code: The symptom code as defined in Hazard Harm Matrix (HHM)
HHS Health and Human Services - a United States department
IB Installed Base
iXR Interventional X-Ray
Initial risk Risk before risk control measures have been taken
MAUDE Manufacture And User facility Device Experience” database of FDA containing reports of adverse events involving medical devices
Mercury Tool to submit field complaints
OSLC Open Services for Lifecycle Collaboration
ppm Part Per Million
PR Problem Report, describing defect, missing functionality, harm or hazard
Probability / Likelihood The chance that something will happen - how likely it is that some harm cause will happen
QlikView Business Discovery tool platform, which delivers true self-service Business Information
Residual risk Risk remaining, after risk control measures have been taken (14971:2007 - clause 2.15)
Risk Combination of the probability of occurrence of harm and the severity of that harm (ISO 14971:2007 - clause 2.16)
Risk analysis Systematic use of available information to identify hazards and to estimate the risk (ISO 14971:2007 - clause 2.17)
Risk assessment Overall process comprising a risk analysis and a risk evaluation (ISO 14971:2007 - clause 2.18)
Risk control Process in which decisions are made and measures implemented by which risks are reduced to, or maintained within, specified levels (ISO 14971:2007 - clause 2.19)
Risk estimation Process used to assign values to the probability of occurrence of harm and the severity of that harm (ISO 14971:2007 - clause 2.20)
Risk evaluation Process of comparing the estimated risk against given risk criteria to determine the acceptability of the risk (ISO 14971:2007 - clause 2.21)
RMF Risk Management File
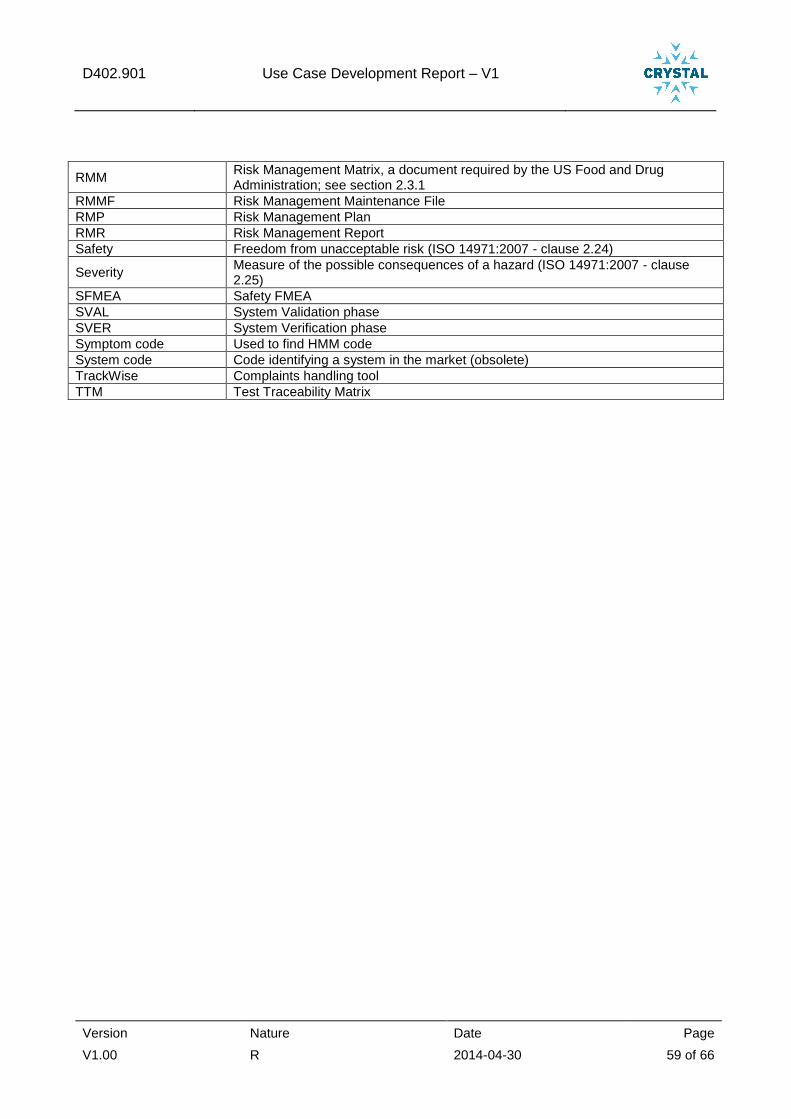
D402.901 Use Case Development Report – V1
Version Nature Date Page
V1.00 R 2014-04-30 59 of 66
RMM Risk Management Matrix, a document required by the US Food and Drug Administration; see section 2.3.1
RMMF Risk Management Maintenance File
RMP Risk Management Plan
RMR Risk Management Report
Safety Freedom from unacceptable risk (ISO 14971:2007 - clause 2.24)
Severity Measure of the possible consequences of a hazard (ISO 14971:2007 - clause 2.25)
SFMEA Safety FMEA
SVAL System Validation phase
SVER System Verification phase
Symptom code Used to find HMM code
System code Code identifying a system in the market (obsolete)
TrackWise Complaints handling tool
TTM Test Traceability Matrix
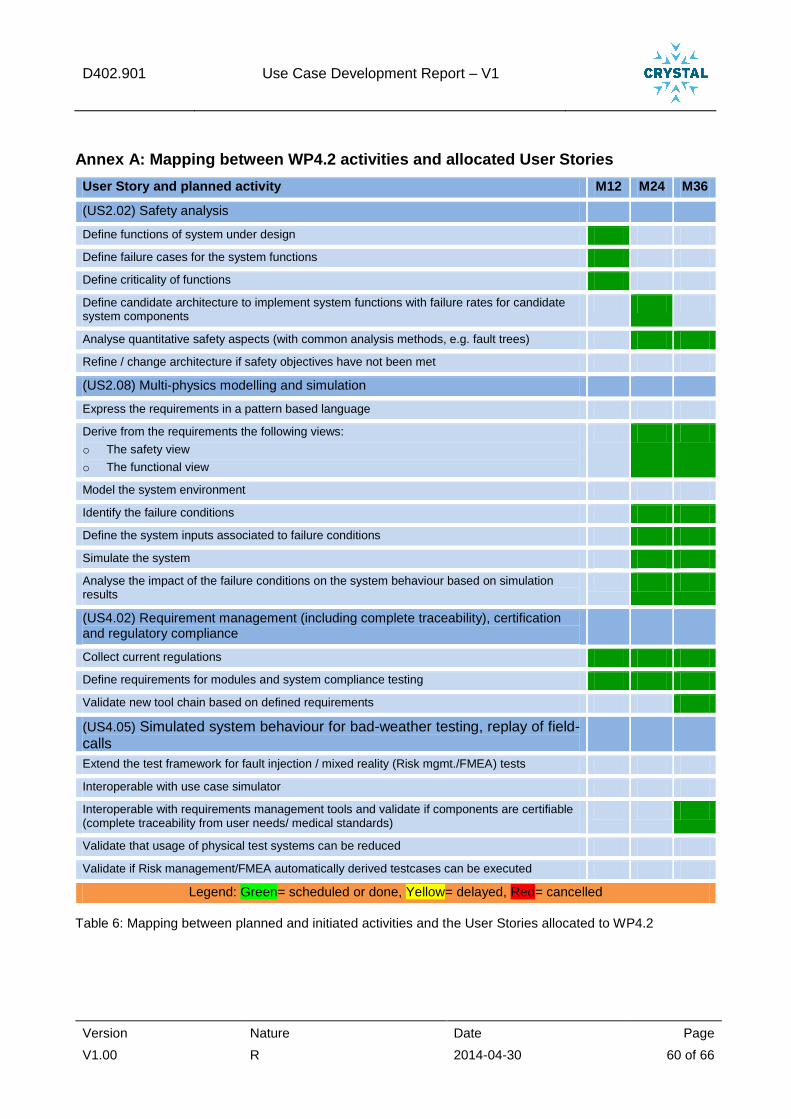
D402.901 Use Case Development Report – V1
Version Nature Date Page
V1.00 R 2014-04-30 60 of 66
Annex A: Mapping between WP4.2 activities and allocated User Stories
User Story and planned activity M12 M24 M36
(US2.02) Safety analysis
Define functions of system under design
Define failure cases for the system functions
Define criticality of functions
Define candidate architecture to implement system functions with failure rates for candidate system components
Analyse quantitative safety aspects (with common analysis methods, e.g. fault trees)
Refine / change architecture if safety objectives have not been met
(US2.08) Multi-physics modelling and simulation
Express the requirements in a pattern based language
Derive from the requirements the following views:
o The safety view
o The functional view
Model the system environment
Identify the failure conditions
Define the system inputs associated to failure conditions
Simulate the system
Analyse the impact of the failure conditions on the system behaviour based on simulation results
(US4.02) Requirement management (including complete traceability), certification and regulatory compliance
Collect current regulations
Define requirements for modules and system compliance testing
Validate new tool chain based on defined requirements
(US4.05) Simulated system behaviour for bad-weather testing, replay of field-calls
Extend the test framework for fault injection / mixed reality (Risk mgmt./FMEA) tests
Interoperable with use case simulator
Interoperable with requirements management tools and validate if components are certifiable (complete traceability from user needs/ medical standards)
Validate that usage of physical test systems can be reduced
Validate if Risk management/FMEA automatically derived testcases can be executed
Legend: Green= scheduled or done, Yellow= delayed, Red= cancelled
Table 6: Mapping between planned and initiated activities and the User Stories allocated to WP4.2
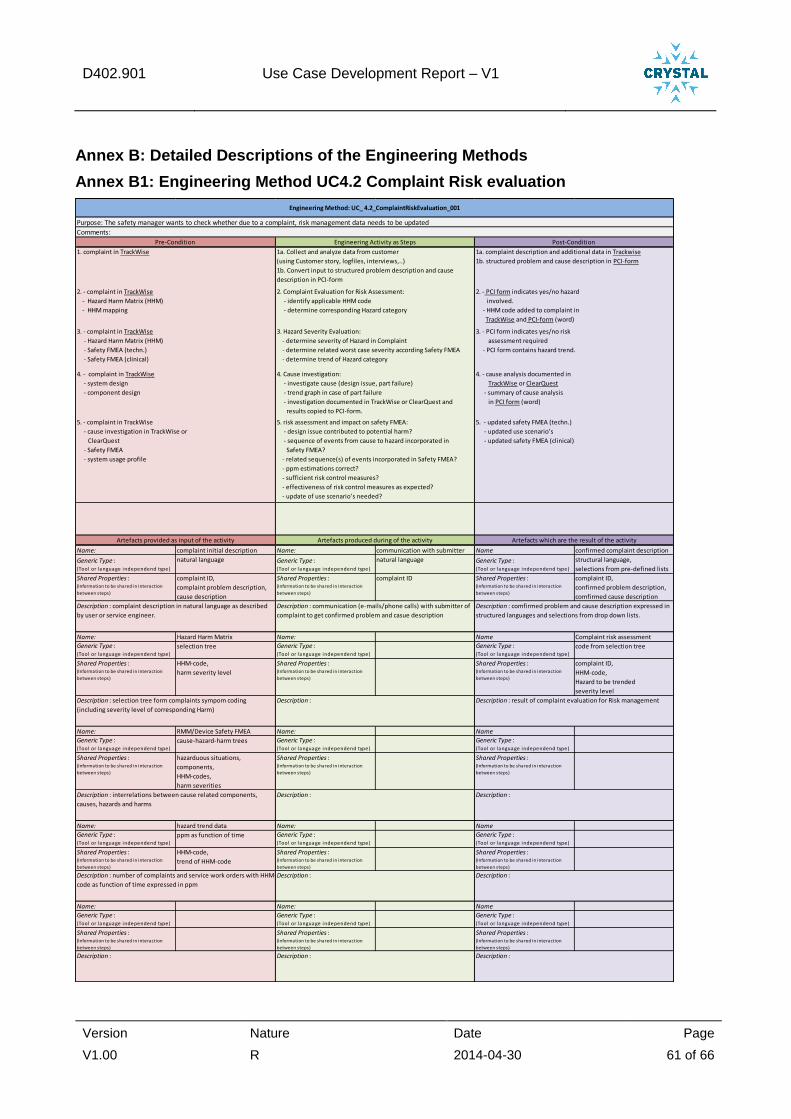
D402.901 Use Case Development Report – V1
Version Nature Date Page
V1.00 R 2014-04-30 61 of 66
Annex B: Detailed Descriptions of the Engineering Methods
Annex B1: Engineering Method UC4.2 Complaint Risk evaluation
Name: complaint initial description Name: communication with submitter Name confirmed complaint description
Generic Type :(Tool or language independend type)
natural language Generic Type :(Tool or language independend type)
natural language Generic Type :(Tool or language independend type)
structural language,
selections from pre-defined lists
Shared Properties :(Information to be shared in interaction
between steps)
complaint ID,
complaint problem description,
cause description
Shared Properties :(Information to be shared in interaction
between steps)
complaint ID Shared Properties :(Information to be shared in interaction
between steps)
complaint ID,
confirmed problem description,
comfirmed cause description
Name: Hazard Harm Matrix Name: Name Complaint risk assessment
Generic Type :(Tool or language independend type)
selection tree Generic Type :(Tool or language independend type)
Generic Type :(Tool or language independend type)
code from selection tree
Shared Properties :(Information to be shared in interaction
between steps)
HHM-code,
harm severity level
Shared Properties :(Information to be shared in interaction
between steps)
Shared Properties :(Information to be shared in interaction
between steps)
complaint ID,
HHM-code,
Hazard to be trended
severity level
Name: RMM/Device Safety FMEA Name: Name
Generic Type :(Tool or language independend type)
cause-hazard-harm trees Generic Type :(Tool or language independend type)
Generic Type :(Tool or language independend type)
Shared Properties :(Information to be shared in interaction
between steps)
hazarduous situations,
components,
HHM-codes,
harm severities
Shared Properties :(Information to be shared in interaction
between steps)
Shared Properties :(Information to be shared in interaction
between steps)
Name: hazard trend data Name: Name
Generic Type :(Tool or language independend type)
ppm as function of time Generic Type :(Tool or language independend type)
Generic Type :(Tool or language independend type)
Shared Properties :(Information to be shared in interaction
between steps)
HHM-code,
trend of HHM-code
Shared Properties :(Information to be shared in interaction
between steps)
Shared Properties :(Information to be shared in interaction
between steps)
Name: Name: Name
Generic Type :(Tool or language independend type)
Generic Type :(Tool or language independend type)
Generic Type :(Tool or language independend type)
Shared Properties :(Information to be shared in interaction
between steps)
Shared Properties :(Information to be shared in interaction
between steps)
Shared Properties :(Information to be shared in interaction
between steps)
Description : interrelations between cause related components,
causes, hazards and harms
Description : Description :
Description : number of complaints and service work orders with HHM-
code as function of time expressed in ppm
Description : Description :
Artefacts provided as input of the activity Artefacts produced during of the activity Artefacts which are the result of the activity
Description : Description : Description :
Description : complaint description in natural language as described
by user or service engineer.
Description : communication (e-mails/phone calls) with submitter of
complaint to get confirmed problem and casue description
Description : comfirmed problem and cause description expressed in
structured languages and selections from drop down lists.
Description : selection tree form complaints sympom coding
(including severity level of corresponding Harm)
Description : Description : result of complaint evaluation for Risk management
Engineering Method: UC_ 4.2_ComplaintRiskEvaluation_001
Pre-Condition Engineering Activity as Steps Post-Condition
5. - complaint in TrackWise
- cause investigation in TrackWise or
ClearQuest
- Safety FMEA
- system usage profile
5. risk assessment and impact on safety FMEA:
- design issue contributed to potential harm?
- sequence of events from cause to hazard incorporated in
Safety FMEA?
- related sequence(s) of events incorporated in Safety FMEA?
- ppm estimations correct?
- sufficient risk control measures?
- effectiveness of risk control measures as expected?
- update of use scenario’s needed?
5. - updated safety FMEA (techn.)
- updated use scenario’s
- updated safety FMEA (clinical)
1. complaint in TrackWise 1a. Collect and analyze data from customer
(using Customer story, logfiles, interviews,..)
1b. Convert input to structured problem description and cause
description in PCI-form
1a. complaint description and additional data in Trackwise
1b. structured problem and cause description in PCI-form
2. - complaint in TrackWise
- Hazard Harm Matrix (HHM)
- HHM mapping
2. Complaint Evaluation for Risk Assessment:
- identify applicable HHM code
- determine corresponding Hazard category
2. - PCI form indicates yes/no hazard
involved.
- HHM code added to complaint in
TrackWise and PCI-form (word)
3. - complaint in TrackWise
- Hazard Harm Matrix (HHM)
- Safety FMEA (techn.)
- Safety FMEA (clinical)
3. Hazard Severity Evaluation:
- determine severity of Hazard in Complaint
- determine related worst case severity according Safety FMEA
- determine trend of Hazard category
3. - PCI form indicates yes/no risk
assessment required
- PCI form contains hazard trend.
Purpose: The safety manager wants to check whether due to a complaint, risk management data needs to be updated
Comments:
4. - complaint in TrackWise
- system design
- component design
4. Cause investigation:
- investigate cause (design issue, part failure)
- trend graph in case of part failure
- investigation documented in TrackWise or ClearQuest and
results copied to PCI-form.
4. - cause analysis documented in
TrackWise or ClearQuest
- summary of cause analysis
in PCI form (word)
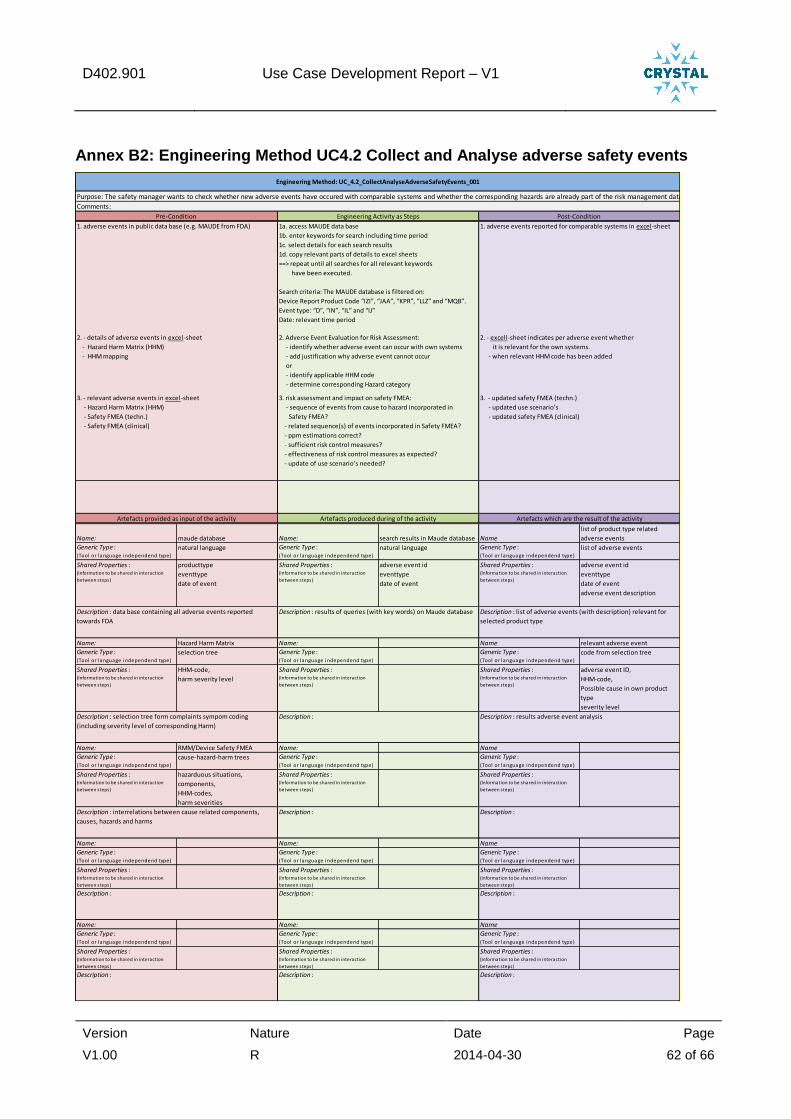
D402.901 Use Case Development Report – V1
Version Nature Date Page
V1.00 R 2014-04-30 62 of 66
Annex B2: Engineering Method UC4.2 Collect and Analyse adverse safety events
Name: maude database Name: search results in Maude database Name
list of product type related
adverse events
Generic Type :(Tool or language independend type)
natural language Generic Type :(Tool or language independend type)
natural language Generic Type :(Tool or language independend type)
list of adverse events
Shared Properties :(Information to be shared in interaction
between steps)
producttype
eventtype
date of event
Shared Properties :(Information to be shared in interaction
between steps)
adverse event id
eventtype
date of event
Shared Properties :(Information to be shared in interaction
between steps)
adverse event id
eventtype
date of event
adverse event description
Name: Hazard Harm Matrix Name: Name relevant adverse event
Generic Type :(Tool or language independend type)
selection tree Generic Type :(Tool or language independend type)
Generic Type :(Tool or language independend type)
code from selection tree
Shared Properties :(Information to be shared in interaction
between steps)
HHM-code,
harm severity level
Shared Properties :(Information to be shared in interaction
between steps)
Shared Properties :(Information to be shared in interaction
between steps)
adverse event ID,
HHM-code,
Possible cause in own product
type
severity level
Name: RMM/Device Safety FMEA Name: Name
Generic Type :(Tool or language independend type)
cause-hazard-harm trees Generic Type :(Tool or language independend type)
Generic Type :(Tool or language independend type)
Shared Properties :(Information to be shared in interaction
between steps)
hazarduous situations,
components,
HHM-codes,
harm severities
Shared Properties :(Information to be shared in interaction
between steps)
Shared Properties :(Information to be shared in interaction
between steps)
Name: Name: Name
Generic Type :(Tool or language independend type)
Generic Type :(Tool or language independend type)
Generic Type :(Tool or language independend type)
Shared Properties :(Information to be shared in interaction
between steps)
Shared Properties :(Information to be shared in interaction
between steps)
Shared Properties :(Information to be shared in interaction
between steps)
Description : Description : Description :
Description : interrelations between cause related components,
causes, hazards and harms
Description : Description :
Description : Description : Description :
Description : data base containing all adverse events reported
towards FDA
Description : results of queries (with key words) on Maude database Description : list of adverse events (with description) relevant for
selected product type
Description : selection tree form complaints sympom coding
(including severity level of corresponding Harm)
Description : Description : results adverse event analysis
Artefacts provided as input of the activity Artefacts produced during of the activity Artefacts which are the result of the activity
2. - details of adverse events in excel-sheet
- Hazard Harm Matrix (HHM)
- HHM mapping
2. Adverse Event Evaluation for Risk Assessment:
- identify whether adverse event can occur with own systems
- add justification why adverse event cannot occur
or
- identify applicable HHM code
- determine corresponding Hazard category
2. - excell-sheet indicates per adverse event whether
it is relevant for the own systems.
- when relevant HHM code has been added
3. - relevant adverse events in excel-sheet
- Hazard Harm Matrix (HHM)
- Safety FMEA (techn.)
- Safety FMEA (clinical)
3. risk assessment and impact on safety FMEA:
- sequence of events from cause to hazard incorporated in
Safety FMEA?
- related sequence(s) of events incorporated in Safety FMEA?
- ppm estimations correct?
- sufficient risk control measures?
- effectiveness of risk control measures as expected?
- update of use scenario’s needed?
3. - updated safety FMEA (techn.)
- updated use scenario’s
- updated safety FMEA (clinical)
Engineering Method: UC_4.2_CollectAnalyseAdverseSafetyEvents_001
Purpose: The safety manager wants to check whether new adverse events have occured with comparable systems and whether the corresponding hazards are already part of the risk management data of our own systems.
Comments:
Pre-Condition Engineering Activity as Steps Post-Condition
1. adverse events in public data base (e.g. MAUDE from FDA) 1a. access MAUDE data base
1b. enter keywords for search including time period
1c. select details for each search results
1d. copy relevant parts of details to excel sheets
==> repeat until all searches for all relevant keywords
have been executed.
Search criteria: The MAUDE database is filtered on:
Device Report Product Code “IZI”, “JAA”, “KPR”, “LLZ” and “MQB”.
Event type: “D”, “IN”, “IL” and “IJ”
Date: relevant time period
1. adverse events reported for comparable systems in excel-sheet
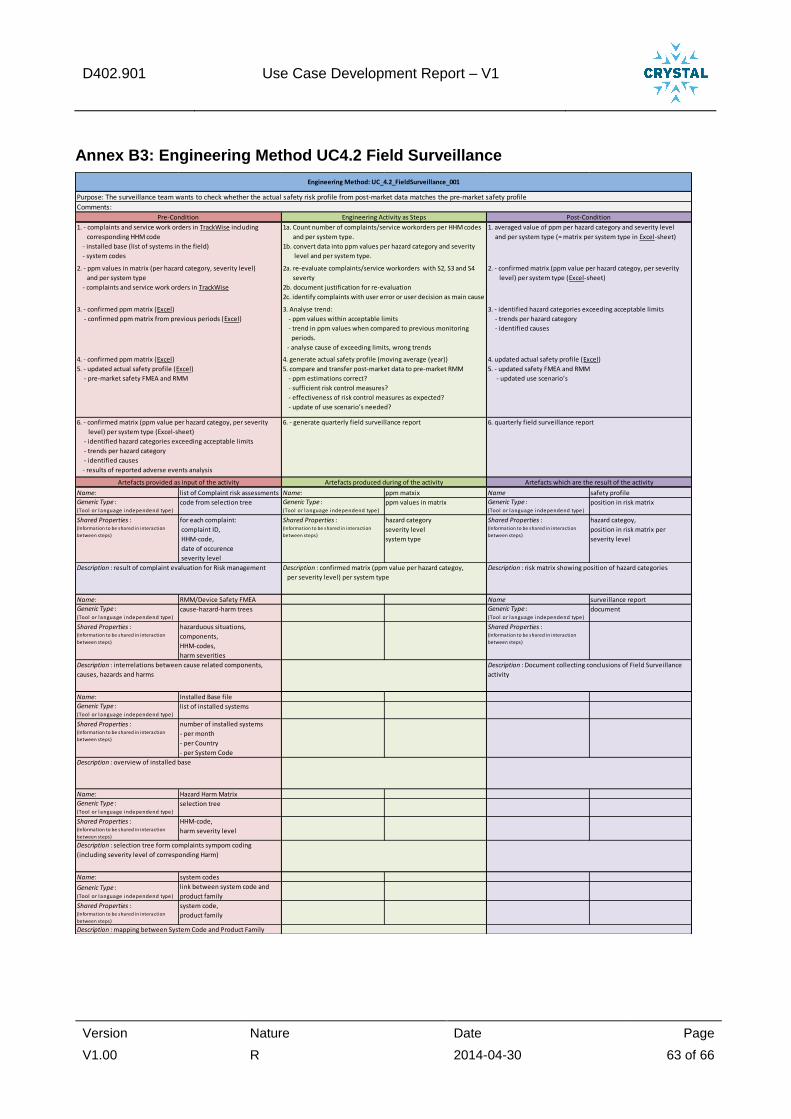
D402.901 Use Case Development Report – V1
Version Nature Date Page
V1.00 R 2014-04-30 63 of 66
Annex B3: Engineering Method UC4.2 Field Surveillance
Name: list of Complaint risk assessments Name: ppm matxix Name safety profile
Generic Type :(Tool or language independend type)
code from selection tree Generic Type :(Tool or language independend type)
ppm values in matrix Generic Type :(Tool or language independend type)
position in risk matrix
Shared Properties :(Information to be shared in interaction
between steps)
for each complaint:
complaint ID,
HHM-code,
date of occurence
severity level
Shared Properties :(Information to be shared in interaction
between steps)
hazard category
severity level
system type
Shared Properties :(Information to be shared in interaction
between steps)
hazard categoy,
position in risk matrix per
severity level
Name: RMM/Device Safety FMEA Name surveillance report
Generic Type :(Tool or language independend type)
cause-hazard-harm trees Generic Type :(Tool or language independend type)
document
Shared Properties :(Information to be shared in interaction
between steps)
hazarduous situations,
components,
HHM-codes,
harm severities
Shared Properties :(Information to be shared in interaction
between steps)
Name: Installed Base file
Generic Type :(Tool or language independend type)
list of installed systems
Shared Properties :(Information to be shared in interaction
between steps)
number of installed systems
- per month
- per Country
- per System Code
Name: Hazard Harm Matrix
Generic Type :(Tool or language independend type)
selection tree
Shared Properties :(Information to be shared in interaction
between steps)
HHM-code,
harm severity level
Name: system codes
Generic Type :(Tool or language independend type)
link between system code and
product family
Shared Properties :(Information to be shared in interaction
between steps)
system code,
product family
Description : selection tree form complaints sympom coding
(including severity level of corresponding Harm)
Description : overview of installed base
Description : interrelations between cause related components,
causes, hazards and harms
Description : Document collecting conclusions of Field Surveillance
activity
Artefacts provided as input of the activity Artefacts produced during of the activity Artefacts which are the result of the activity
Description : result of complaint evaluation for Risk management Description : confirmed matrix (ppm value per hazard categoy,
per severity level) per system type
Description : risk matrix showing position of hazard categories
5. - updated actual safety profile (Excel)
- pre-market safety FMEA and RMM
5. compare and transfer post-market data to pre-market RMM
- ppm estimations correct?
- sufficient risk control measures?
- effectiveness of risk control measures as expected?
- update of use scenario’s needed?
5. - updated safety FMEA and RMM
- updated use scenario’s
6. - confirmed matrix (ppm value per hazard categoy, per severity
level) per system type (Excel-sheet)
- identified hazard categories exceeding acceptable limits
- trends per hazard category
- identified causes
- results of reported adverse events analysis
6. - generate quarterly field surveillance report 6. quarterly field surveillance report
3. - confirmed ppm matrix (Excel)
- confirmed ppm matrix from previous periods (Excel)
3. Analyse trend:
- ppm values within acceptable limits
- trend in ppm values when compared to previous monitoring
periods.
- analyse cause of exceeding limits, wrong trends
3. - identified hazard categories exceeding acceptable limits
- trends per hazard category
- identified causes
4. - confirmed ppm matrix (Excel) 4. generate actual safety profile (moving average (year)) 4. updated actual safety profile (Excel)
1. - complaints and service work orders in TrackWise including
corresponding HHM code
- installed base (list of systems in the field)
- system codes
1a. Count number of complaints/service workorders per HHM codes
and per system type.
1b. convert data into ppm values per hazard category and severity
level and per system type.
1. averaged value of ppm per hazard category and severity level
and per system type (= matrix per system type in Excel-sheet)
2. - ppm values in matrix (per hazard category, severity level)
and per system type
- complaints and service work orders in TrackWise
2a. re-evaluate complaints/service workorders with S2, S3 and S4
severty
2b. document justification for re-evaluation
2c. identify complaints with user error or user decision as main cause
2. - confirmed matrix (ppm value per hazard categoy, per severity
level) per system type (Excel-sheet)
Description : mapping between System Code and Product Family
Engineering Method: UC_4.2_FieldSurveillance_001
Purpose: The surveillance team wants to check whether the actual safety risk profile from post-market data matches the pre-market safety profile
Comments:
Pre-Condition Engineering Activity as Steps Post-Condition
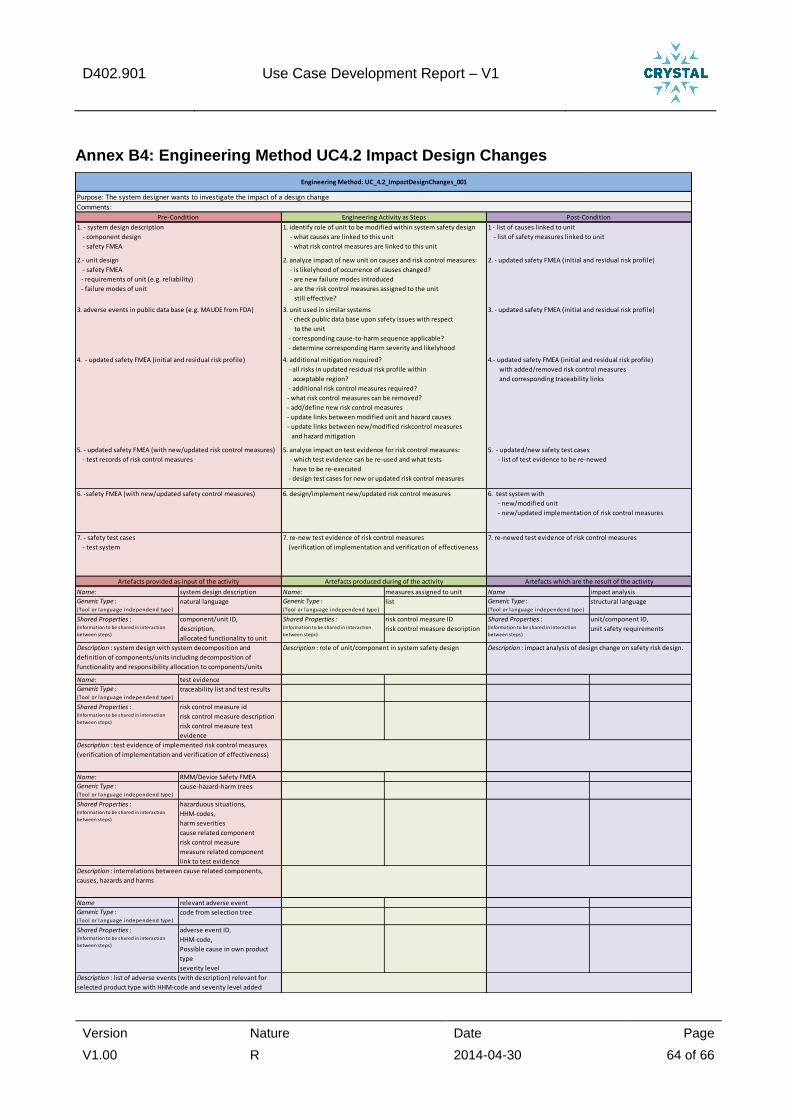
D402.901 Use Case Development Report – V1
Version Nature Date Page
V1.00 R 2014-04-30 64 of 66
Annex B4: Engineering Method UC4.2 Impact Design Changes
Name: system design description Name: measures assigned to unit Name impact analysis
Generic Type :(Tool or language independend type)
natural language Generic Type :(Tool or language independend type)
list Generic Type :(Tool or language independend type)
structural language
Shared Properties :(Information to be shared in interaction
between steps)
component/unit ID,
description,
allocated functionality to unit
Shared Properties :(Information to be shared in interaction
between steps)
risk control measure ID
risk control measure description
Shared Properties :(Information to be shared in interaction
between steps)
unit/component ID,
unit safety requirements
Name: test evidence
Generic Type :(Tool or language independend type)
traceability list and test results
Shared Properties :(Information to be shared in interaction
between steps)
risk control measure id
risk control measure description
risk control measure test
evidence
Name: RMM/Device Safety FMEA
Generic Type :(Tool or language independend type)
cause-hazard-harm trees
Shared Properties :(Information to be shared in interaction
between steps)
hazarduous situations,
HHM-codes,
harm severities
cause related component
risk control measure
measure related component
link to test evidence
Name relevant adverse event
Generic Type :(Tool or language independend type)
code from selection tree
Shared Properties :(Information to be shared in interaction
between steps)
adverse event ID,
HHM-code,
Possible cause in own product
type
severity level
Description : interrelations between cause related components,
causes, hazards and harms
Description : list of adverse events (with description) relevant for
selected product type with HHM-code and severity level added
Description : system design with system decomposition and
definition of components/units including decomposition of
functionality and responsibility allocation to components/units
Description : role of unit/component in system safety design Description : impact analysis of design change on safety risk design.
Description : test evidence of implemented risk control measures
(verification of implementation and verification of effectiveness)
7. - safety test cases
- test system
7. re-new test evidence of risk control measures
(verification of implementation and verification of effectiveness
7. re-newed test evidence of risk control measures
Artefacts provided as input of the activity Artefacts produced during of the activity Artefacts which are the result of the activity
3. - updated safety FMEA (initial and residual risk profile)
4. - updated safety FMEA (initial and residual risk profile) 4. additional mitigation required?
- all risks in updated residual risk profile within
acceptable region?
- additional risk control measures required?
- what risk control measures can be removed?
- add/define new risk control measures
- update links between modified unit and hazard causes
- update links between new/modified riskcontrol measures
and hazard mitigation
4.- updated safety FMEA (initial and residual risk profile)
with added/removed risk control measures
and corresponding traceability links
5. - updated safety FMEA (with new/updated risk control measures)
- test records of risk control measures
5. analyse impact on test evidence for risk control measures:
- which test evidence can be re-used and what tests
have to be re-executed
- design test cases for new or updated risk control measures
5. - updated/new safety test cases
- list of test evidence to be re-newed
Purpose: The system designer wants to investigate the impact of a design change
Comments:
Pre-Condition Engineering Activity as Steps Post-Condition
1. - system design description
- component design
- safety FMEA
1. identify role of unit to be modified within system safety design
- what causes are linked to this unit
- what risk control measures are linked to this unit
1 - list of causes linked to unit
- list of safety measures linked to unit
2.- unit design
- safety FMEA
- requirements of unit (e.g. reliability)
- failure modes of unit
6. -safety FMEA (with new/updated safety control measures) 6. design/implement new/updated risk control measures 6. test system with
- new/modified unit
- new/updated implementation of risk control measures
Engineering Method: UC_4.2_ImpactDesignChanges_001
2. analyze impact of new unit on causes and risk control measures:
- is likelyhood of occurrence of causes changed?
- are new failure modes introduced
- are the risk control measures assigned to the unit
still effective?
2. - updated safety FMEA (initial and residual risk profile)
3. adverse events in public data base (e.g. MAUDE from FDA) 3. unit used in similar systems
- check public data base upon safety issues with respect
to the unit
- corresponding cause-to-harm sequence applicable?
- determine corresponding Harm severity and likelyhood

D402.901 Use Case Development Report – V1
Version Nature Date Page
V1.00 R 2014-04-30 65 of 66
Annex B5: Artefacts
The artefacts in the dark-grey New Product Introduction are described in WP401 and WP403.
SRS Safety Concept Requirements are input for the Safety FMEA
Risk Control Measures land in the applicable New Product Introduction documents.
In the WP402 Product Risk Management part of New Product Introduction (in light-grey), the following artefacts are applicable:
Safety FMEA [Excel file]
Risk Management Matrix (RMM) [Excel file, generated from Safety FMEA]
D402.901 Use Case Development Report – V1
Version Nature Date Page
V1.00 R 2014-04-30 66 of 66
Annex C: Updated Use Case Definition Report
Safety layer of an
interventional X-ray system
CRitical SYSTem Engineering AcceLeration
UC 4.2
Safety layer of an interventional X-ray system
D402.010

D402.010 Safety layer of an
interventional X-ray system
Version Confidentiality Level Date Page
V 2.1 R/P/D/O… see TA 29-apr-2014 2 of 29
DOCUMENT INFORMATION
Project CRYSTAL
Grant Agreement No. ARTEMIS-2012-1-332830
Deliverable Title Safety layer of an interventional X-ray system )
Deliverable No. D402.010
Dissemination Level CO/PP/PU/RE … see TA
Confidentiality R/P/D/O… see TA
Document Version V 2.1
Date 29-apr-2014
Contact H.E.P. Cruts
Organization Philips Healthcare
Phone +31-402764507
E-Mail [email protected]
D402.010 Safety layer of an
interventional X-ray system
Version Confidentiality Level Date Page
V 2.1 R/P/D/O… see TA 29-apr-2014 3 of 29
AUTHORS TABLE
Name Company E-Mail
H.E.P. Cruts Philips Healthcare [email protected]
CHANGE HISTORY
Version Date Reason for Change Pages
Affected
0 1-nov-2013 initial version
V 1.0 15-nov-2013 update after internal/external review; added details of use case process; added details of engineering method
V 1.1 10-feb-2014 update after discussion with TNO; added details to case studies.
V 2.0 18-apr-2014 update to reflect actual situation at M12 (april-2014).
V 2.1 29-apr-2014 update after review by TNO
D402.010 Safety layer of an
interventional X-ray system
Version Confidentiality Level Date Page
V 2.1 R/P/D/O… see TA 29-apr-2014 4 of 29
CONTENT
UC 4.2 ............................................................................................................................................................................ 1 D402.010 ....................................................................................................................................................................... 1
1 INTRODUCTION ...................................................................................................................................................... 6
1.1 ROLE OF DELIVERABLE ....................................................................................................................................... 6 1.2 RELATIONSHIP TO OTHER CRYSTAL DOCUMENTS .......................................................................................... 6 1.3 STRUCTURE OF THIS DOCUMENT ....................................................................................................................... 6
2 USE CASE PROCESS DESCRIPTION ............................................................................................................... 7
2.1 RATIONALES........................................................................................................................................................ 7 2.2 THE SAFETY RISK MANAGEMENT PROCESS ........................................................................................................ 8
2.2.1 Introduction................................................................................................................................................ 8 2.2.2 Definition of terms .................................................................................................................................... 8 2.2.3 Description of safety risk management process .................................................................................. 9 2.2.4 Tools used in the safety risk management process .......................................................................... 12
2.3 CASE STUDIES .................................................................................................................................................. 13 2.3.1 Case study 1: analysing risk profile related to an adverse event .................................................... 13 2.3.2 Case study 2: impact analysis of design changes ............................................................................ 15 2.3.3 Case study 3: comparing actual risk profile to residual risk profile (trending) ............................... 17
3 DETAILED DESCRIPTION OF THE USE CASE PROCESS ........................................................................ 19
4 IDENTIFICATION OF ENGINEERING METHODS .......................................................................................... 22
5 TERMS, ABBREVIATIONS AND DEFINITIONS ............................................................................................. 23
6 REFERENCES ....................................................................................................................................................... 24
7 ANNEX I: DETAILED DESCRIPTIONS OF THE ENGINEERING METHODS ........................................... 25
8 ANNEX II: TECHNOLOGY BASE LINE & PROGRESS BEYOND ............................................................... 29

D402.010 Safety layer of an
interventional X-ray system
Version Confidentiality Level Date Page
V 2.1 R/P/D/O… see TA 29-apr-2014 5 of 29
Content of Tables
Figure 2-1: The V-model showing the process (left) and the documentation (right). ......................................... 7 Figure 2-2: Graphical representation of terms used within the risk management process. ............................... 9 Figure 2-3: Overview of interrelations between parts of the safety risk management process. ....................... 10 Figure 2-4: Tools used within the safety risk management process ................................................................ 12 Figure 2-5: Analysing events reported from the field. ....................................................................................... 13 Figure 2-6: Impact analysis of design changes. ............................................................................................... 15 Figure 2-7: Comparing actual risk profile to residual risk profile. ..................................................................... 17 Figure 3-1: Overview of Risk Management Process. ....................................................................................... 19
Content of Figures
Table 5-1: Terms, Abbreviations and Definitions ............................................................................................. 23 Table 7-1: detailed description of complaint risk evaluation ............................................................................. 25 Table 7-2: detailed description of Collect and Analyse Adverse Safety Events ............................................... 26 Table 7-3: detailed description of Field Surveillance ........................................................................................ 27 Table 7-4: detailed description of Impact Design Changes .............................................................................. 28
Content of Appendix
No table of contents entries found.
D402.010 Safety layer of an
interventional X-ray system
Version Confidentiality Level Date Page
V 2.1 R/P/D/O… see TA 29-apr-2014 6 of 29
1 Introduction
1.1 Role of deliverable
This document has the following major purposes:
Define of the overall use case, including a detailed description of the underlying
development processes and the set of involved process activities and engineering
methods
Provide input to SP6 in general and to WP601 (IOS Development) required to derive
specific IOS-related requirements
Provide input to WP602 (Platform Builder) required to derive adequate meta models
Provide input to WP604 (Tools for safety engineering) required to derive requirements for
safety engineering tools
Establish the technology baseline with respect to the use-case, and the expected
progress beyond (existing functionalities vs. functionalities that are expected to be
developed in CRYSTAL)
Describe baseline at M12 (apr-2014)
1.2 Relationship to other CRYSTAL Documents Guiding documents:
• Aerospace example for use case description process:
Dependent documents
• Requirements to tooling for WP 604
1.3 Structure of this document
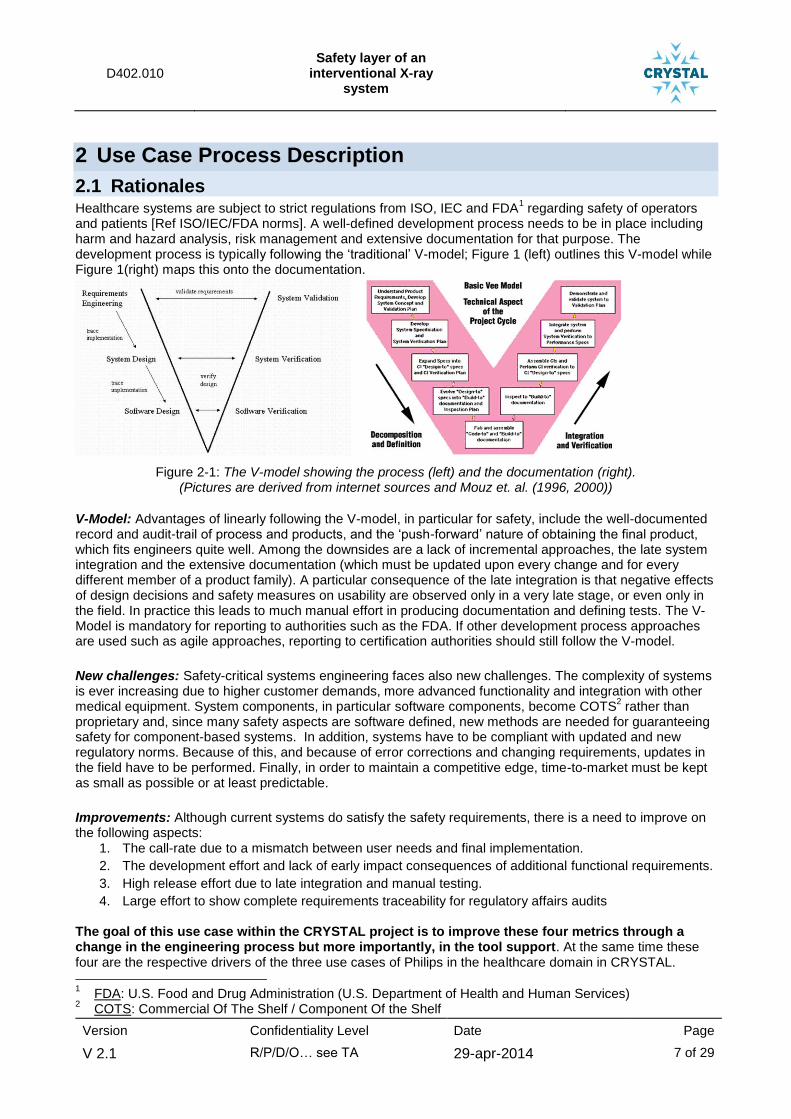
D402.010 Safety layer of an
interventional X-ray system
Version Confidentiality Level Date Page
V 2.1 R/P/D/O… see TA 29-apr-2014 7 of 29
2 Use Case Process Description
2.1 Rationales Healthcare systems are subject to strict regulations from ISO, IEC and FDA
1 regarding safety of operators
and patients [Ref ISO/IEC/FDA norms]. A well-defined development process needs to be in place including harm and hazard analysis, risk management and extensive documentation for that purpose. The development process is typically following the ‘traditional’ V-model; Figure 1 (left) outlines this V-model while Figure 1(right) maps this onto the documentation.
Figure 2-1: The V-model showing the process (left) and the documentation (right). (Pictures are derived from internet sources and Mouz et. al. (1996, 2000))
V-Model: Advantages of linearly following the V-model, in particular for safety, include the well-documented record and audit-trail of process and products, and the ‘push-forward’ nature of obtaining the final product, which fits engineers quite well. Among the downsides are a lack of incremental approaches, the late system integration and the extensive documentation (which must be updated upon every change and for every different member of a product family). A particular consequence of the late integration is that negative effects of design decisions and safety measures on usability are observed only in a very late stage, or even only in the field. In practice this leads to much manual effort in producing documentation and defining tests. The V-Model is mandatory for reporting to authorities such as the FDA. If other development process approaches are used such as agile approaches, reporting to certification authorities should still follow the V-model.
New challenges: Safety-critical systems engineering faces also new challenges. The complexity of systems is ever increasing due to higher customer demands, more advanced functionality and integration with other medical equipment. System components, in particular software components, become COTS
2 rather than
proprietary and, since many safety aspects are software defined, new methods are needed for guaranteeing safety for component-based systems. In addition, systems have to be compliant with updated and new regulatory norms. Because of this, and because of error corrections and changing requirements, updates in the field have to be performed. Finally, in order to maintain a competitive edge, time-to-market must be kept as small as possible or at least predictable.
Improvements: Although current systems do satisfy the safety requirements, there is a need to improve on the following aspects:
1. The call-rate due to a mismatch between user needs and final implementation.
2. The development effort and lack of early impact consequences of additional functional requirements.
3. High release effort due to late integration and manual testing.
4. Large effort to show complete requirements traceability for regulatory affairs audits
The goal of this use case within the CRYSTAL project is to improve these four metrics through a change in the engineering process but more importantly, in the tool support. At the same time these four are the respective drivers of the three use cases of Philips in the healthcare domain in CRYSTAL.
1 FDA: U.S. Food and Drug Administration (U.S. Department of Health and Human Services)
2 COTS: Commercial Of The Shelf / Component Of the Shelf

D402.010 Safety layer of an
interventional X-ray system
Version Confidentiality Level Date Page
V 2.1 R/P/D/O… see TA 29-apr-2014 8 of 29
2.2 The safety risk management process
2.2.1 Introduction
Whereas use cases WP4.1 and WP4.3 focus on improving the development process itself, use case WP4.2
is about improving the safety risk management process. In general, the safety risk management process is
running in parallel to the development process. In short, the safety risk management process takes into
account the system requirements and the system design and analyses whether additional risk control
measures need to be implemented to fulfil safety requirements. In general, the safety risk management
process also takes into account usability related safety aspects. IEC62366 especially focusses on assessing
and managing safety risks related to usability. In addition, IEC8001-1 extends the risk management process
to also include “reduction in Effectiveness, or breach of data and system security” into the definition of Harm.
The requirements for the safety risk management process are defined in ISO 14971: “Medical devices –
Application of risk management to medical devices”. The general requirement is as follows:
ISO 14971: clause 3.1 Risk management process
The manufacturer shall establish, document and maintain throughout the life-cycle an ongoing
process for identifying hazards associated with a medical device, estimating and evaluating the
associated risks, controlling these risks, and monitoring the effectiveness of the controls. This
process shall include the following elements:
- risk analysis
- risk evaluation
- risk control
- production and post-production information.
2.2.2 Definition of terms
The terms used in this document are aligned with the definitions in ISO 14971:2007.
ISO 14971: clause 2 Terms and definitions
term definition (the number refers to the corresponding clause in ISO 14971:2007)
Harm (2.2) physical injury or damage to the health of people, or damage to property or the environment.
Hazard (2.3) potential source of harm.
Hazardous situation (2.4) circumstance in which people, property, or the environment are exposed to one or more hazard(s).
Severity (2.25) measure of the possible consequences of a hazard.
Risk (2.16) combination of the probability of occurrence of harm and the severity of that harm.
Residual risk (2.15) risk remaining after risk control measures have been taken.
Safety (2.24) freedom from unacceptable risk.
Risk estimation (2.20) process used to assign values to the probability of occurrence of harm and the severity of that harm.
Risk analysis (2.17) systematic use of available information to identify hazards and to estimate the risk.
Risk evaluation (2.21) process of comparing the estimated risk against given risk criteria to determine the acceptability of the risk
Risk assessment (2.18) overall process comprising a risk analysis and a risk evaluation.
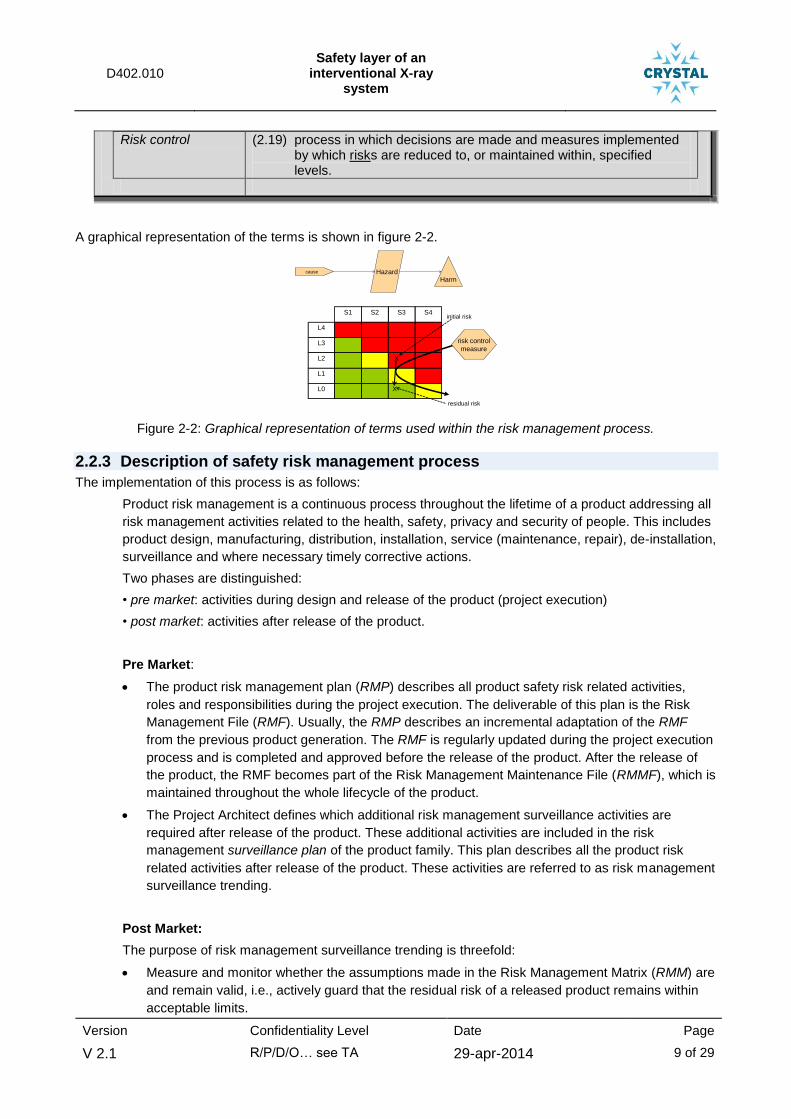
D402.010 Safety layer of an
interventional X-ray system
Version Confidentiality Level Date Page
V 2.1 R/P/D/O… see TA 29-apr-2014 9 of 29
Risk control (2.19) process in which decisions are made and measures implemented by which risks are reduced to, or maintained within, specified levels.
A graphical representation of the terms is shown in figure 2-2.
S3
cause HazardHarm
L4
L3
L2
L1
L0
S1 S2 S4
X
X
initial risk
residual risk
risk control
measure
Figure 2-2: Graphical representation of terms used within the risk management process.
2.2.3 Description of safety risk management process
The implementation of this process is as follows:
Product risk management is a continuous process throughout the lifetime of a product addressing all
risk management activities related to the health, safety, privacy and security of people. This includes
product design, manufacturing, distribution, installation, service (maintenance, repair), de-installation,
surveillance and where necessary timely corrective actions.
Two phases are distinguished:
• pre market: activities during design and release of the product (project execution)
• post market: activities after release of the product.
Pre Market:
The product risk management plan (RMP) describes all product safety risk related activities,
roles and responsibilities during the project execution. The deliverable of this plan is the Risk
Management File (RMF). Usually, the RMP describes an incremental adaptation of the RMF
from the previous product generation. The RMF is regularly updated during the project execution
process and is completed and approved before the release of the product. After the release of
the product, the RMF becomes part of the Risk Management Maintenance File (RMMF), which is
maintained throughout the whole lifecycle of the product.
The Project Architect defines which additional risk management surveillance activities are
required after release of the product. These additional activities are included in the risk
management surveillance plan of the product family. This plan describes all the product risk
related activities after release of the product. These activities are referred to as risk management
surveillance trending.
Post Market:
The purpose of risk management surveillance trending is threefold:
Measure and monitor whether the assumptions made in the Risk Management Matrix (RMM) are
and remain valid, i.e., actively guard that the residual risk of a released product remains within
acceptable limits.
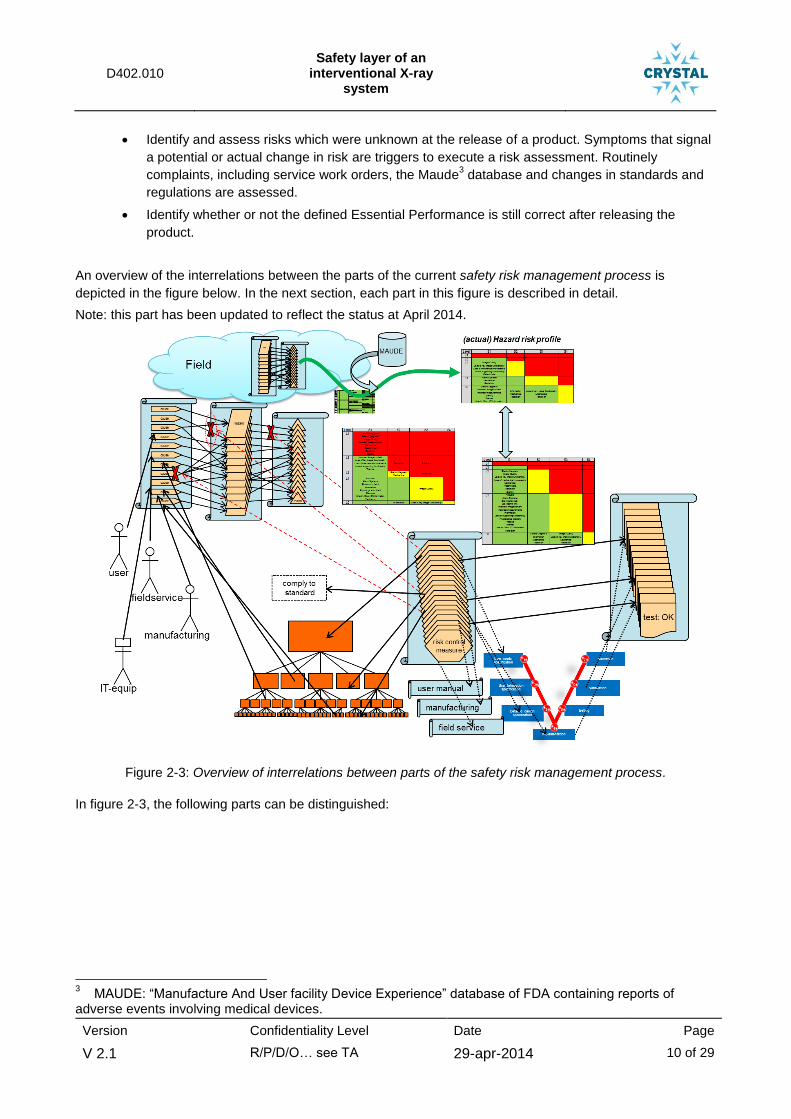
D402.010 Safety layer of an
interventional X-ray system
Version Confidentiality Level Date Page
V 2.1 R/P/D/O… see TA 29-apr-2014 10 of 29
Identify and assess risks which were unknown at the release of a product. Symptoms that signal
a potential or actual change in risk are triggers to execute a risk assessment. Routinely
complaints, including service work orders, the Maude3 database and changes in standards and
regulations are assessed.
Identify whether or not the defined Essential Performance is still correct after releasing the
product.
An overview of the interrelations between the parts of the current safety risk management process is
depicted in the figure below. In the next section, each part in this figure is described in detail.
Note: this part has been updated to reflect the status at April 2014.
Figure 2-3: Overview of interrelations between parts of the safety risk management process.
In figure 2-3, the following parts can be distinguished:
3 MAUDE: “Manufacture And User facility Device Experience” database of FDA containing reports of
adverse events involving medical devices.

D402.010 Safety layer of an
interventional X-ray system
Version Confidentiality Level Date Page
V 2.1 R/P/D/O… see TA 29-apr-2014 11 of 29
product safety risk assessment: This represents the
sequence of events that can produce hazardous situations
and harm. The indicated sequence is from cause to hazard
to harm. As indicated in the figure, one cause can result in
more than one hazard and in more than one harm. One harm
can be caused by more than one cause. This results in a
m-to-n relationship between causes, hazards and harms.
The red-crosses are entry points for risk control measures.
system design: The system is build up from hardware and
software components and units. The corresponding design
choices directly affect the possible causes for hazards and
harms. The diagram represents the hierarchical build-up of
the system design. Note that also the operator/user (i.e. the
human system element) and the manufacturing and field
service and even other IT-equipment can be a cause-related
component.
initial risk profile: based upon the severity of harm and
likelihood of occurrence of the hazards, a risk profile of the
complete product can be compiled. Sequences of events
resulting in harms with high severity (e.g. S4) and high
likelihood (e.g. L4) are unacceptable.
risk control measure: Within the risk management process
risk control measures are defined and implemented to
reduce the risk(s) to an acceptable level. As indicated with
the connecting lines, risk control measures are preferable
defined as safety concepts and specified in the top level of
the system design. Other risk control measures are defined
and implemented on unit level. Some risk control measures
are realized as warnings in the user manual (IfU) or as action
in the manufacturing or field service process.
residual risk profile: This is the risk profile after implementing
the risk control measures. The risk analysis process is
repeated until sufficient risk control measures have been
defined and implemented to reduce the risks to an
acceptable level.
development process: The risk control measures are realized
via the development process. Note that some measures
have impact at the overall system requirements and design
level and some only at the low-level detailed design level.
For each risk control measure, test and verification results
are collected at the corresponding design levels.
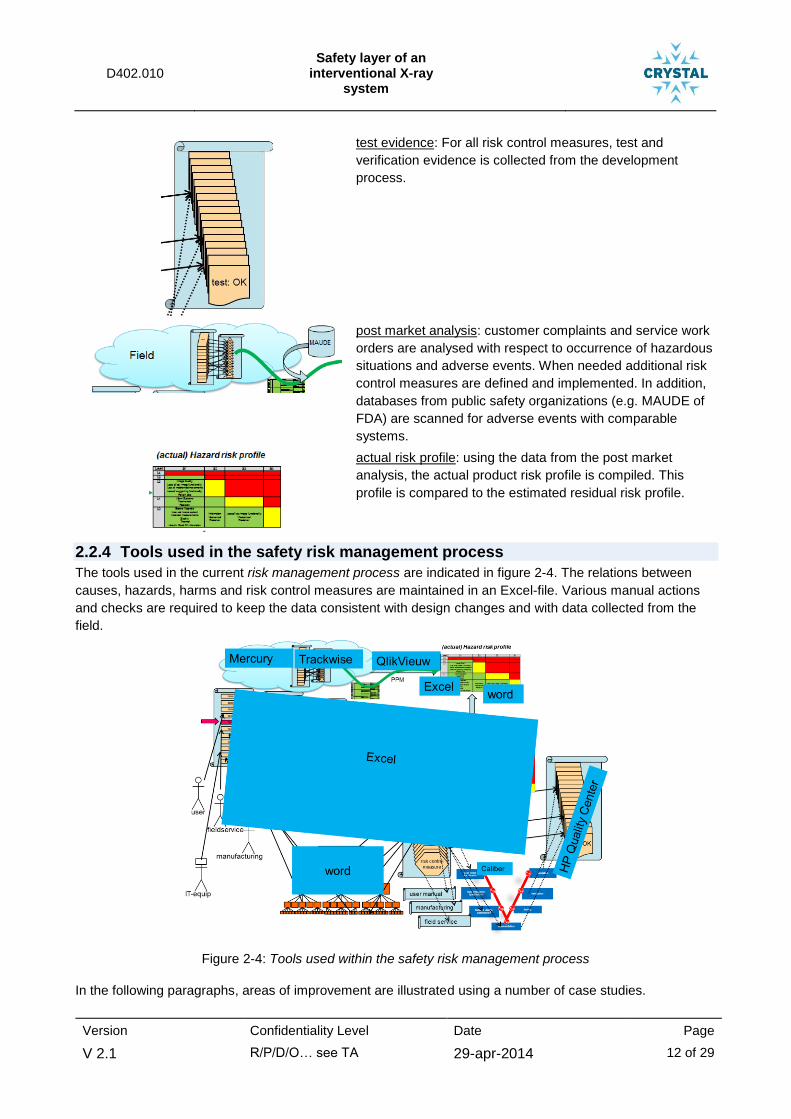
D402.010 Safety layer of an
interventional X-ray system
Version Confidentiality Level Date Page
V 2.1 R/P/D/O… see TA 29-apr-2014 12 of 29
test evidence: For all risk control measures, test and
verification evidence is collected from the development
process.
post market analysis: customer complaints and service work
orders are analysed with respect to occurrence of hazardous
situations and adverse events. When needed additional risk
control measures are defined and implemented. In addition,
databases from public safety organizations (e.g. MAUDE of
FDA) are scanned for adverse events with comparable
systems.
actual risk profile: using the data from the post market
analysis, the actual product risk profile is compiled. This
profile is compared to the estimated residual risk profile.
2.2.4 Tools used in the safety risk management process
The tools used in the current risk management process are indicated in figure 2-4. The relations between
causes, hazards, harms and risk control measures are maintained in an Excel-file. Various manual actions
and checks are required to keep the data consistent with design changes and with data collected from the
field.
Figure 2-4: Tools used within the safety risk management process
In the following paragraphs, areas of improvement are illustrated using a number of case studies.
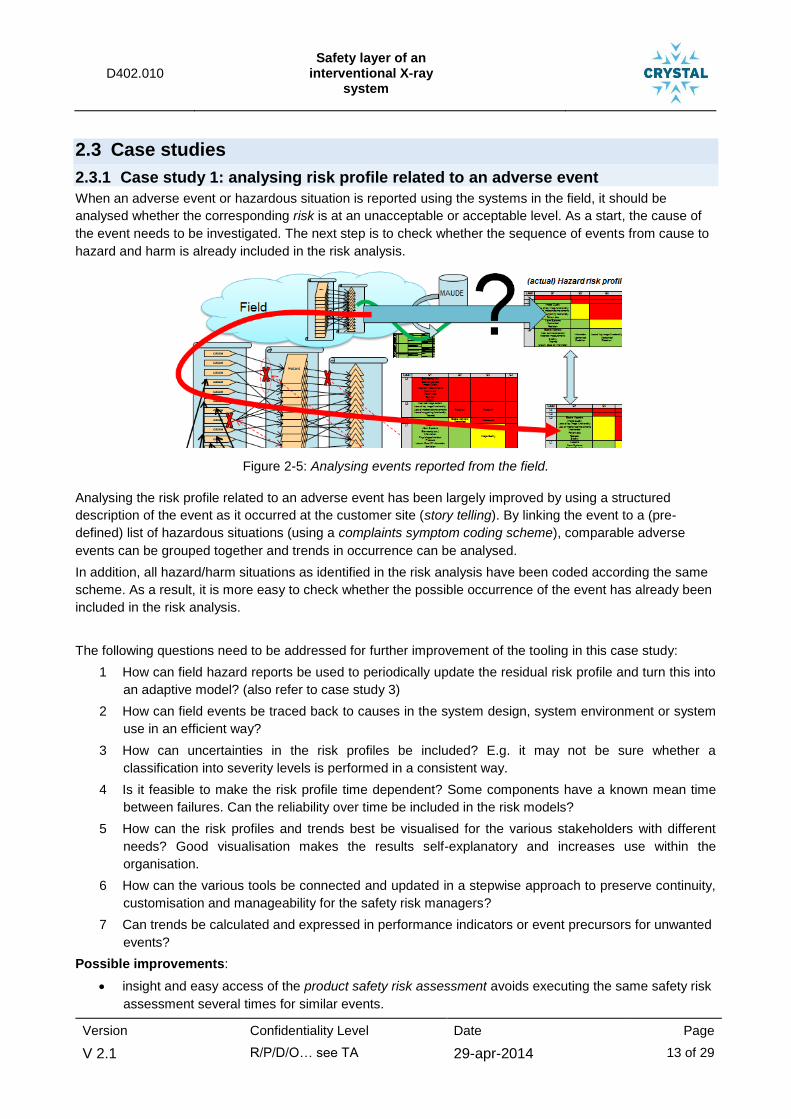
D402.010 Safety layer of an
interventional X-ray system
Version Confidentiality Level Date Page
V 2.1 R/P/D/O… see TA 29-apr-2014 13 of 29
2.3 Case studies
2.3.1 Case study 1: analysing risk profile related to an adverse event
When an adverse event or hazardous situation is reported using the systems in the field, it should be
analysed whether the corresponding risk is at an unacceptable or acceptable level. As a start, the cause of
the event needs to be investigated. The next step is to check whether the sequence of events from cause to
hazard and harm is already included in the risk analysis.
Figure 2-5: Analysing events reported from the field.
Analysing the risk profile related to an adverse event has been largely improved by using a structured
description of the event as it occurred at the customer site (story telling). By linking the event to a (pre-
defined) list of hazardous situations (using a complaints symptom coding scheme), comparable adverse
events can be grouped together and trends in occurrence can be analysed.
In addition, all hazard/harm situations as identified in the risk analysis have been coded according the same
scheme. As a result, it is more easy to check whether the possible occurrence of the event has already been
included in the risk analysis.
The following questions need to be addressed for further improvement of the tooling in this case study:
1 How can field hazard reports be used to periodically update the residual risk profile and turn this into
an adaptive model? (also refer to case study 3)
2 How can field events be traced back to causes in the system design, system environment or system
use in an efficient way?
3 How can uncertainties in the risk profiles be included? E.g. it may not be sure whether a
classification into severity levels is performed in a consistent way.
4 Is it feasible to make the risk profile time dependent? Some components have a known mean time
between failures. Can the reliability over time be included in the risk models?
5 How can the risk profiles and trends best be visualised for the various stakeholders with different
needs? Good visualisation makes the results self-explanatory and increases use within the
organisation.
6 How can the various tools be connected and updated in a stepwise approach to preserve continuity,
customisation and manageability for the safety risk managers?
7 Can trends be calculated and expressed in performance indicators or event precursors for unwanted
events?
Possible improvements:
insight and easy access of the product safety risk assessment avoids executing the same safety risk
assessment several times for similar events.

D402.010 Safety layer of an
interventional X-ray system
Version Confidentiality Level Date Page
V 2.1 R/P/D/O… see TA 29-apr-2014 14 of 29
create automated reasoning mechanisms across safety cases (e.g. ontology) so that related safety
cases can be found automatically.
use model updating techniques from other fields (e.g. data assimilation) to turn the initial risk model
into an adaptive model (using formal methods).
structure risk data retrieval in such a way that accumulated data are analysed automatically and self-
signalling when exposure limits are reached.
collect data with respect to the failing component that caused the adverse event.
collect data with respect to changes in system usage possible resulting in an increase of adverse
events.
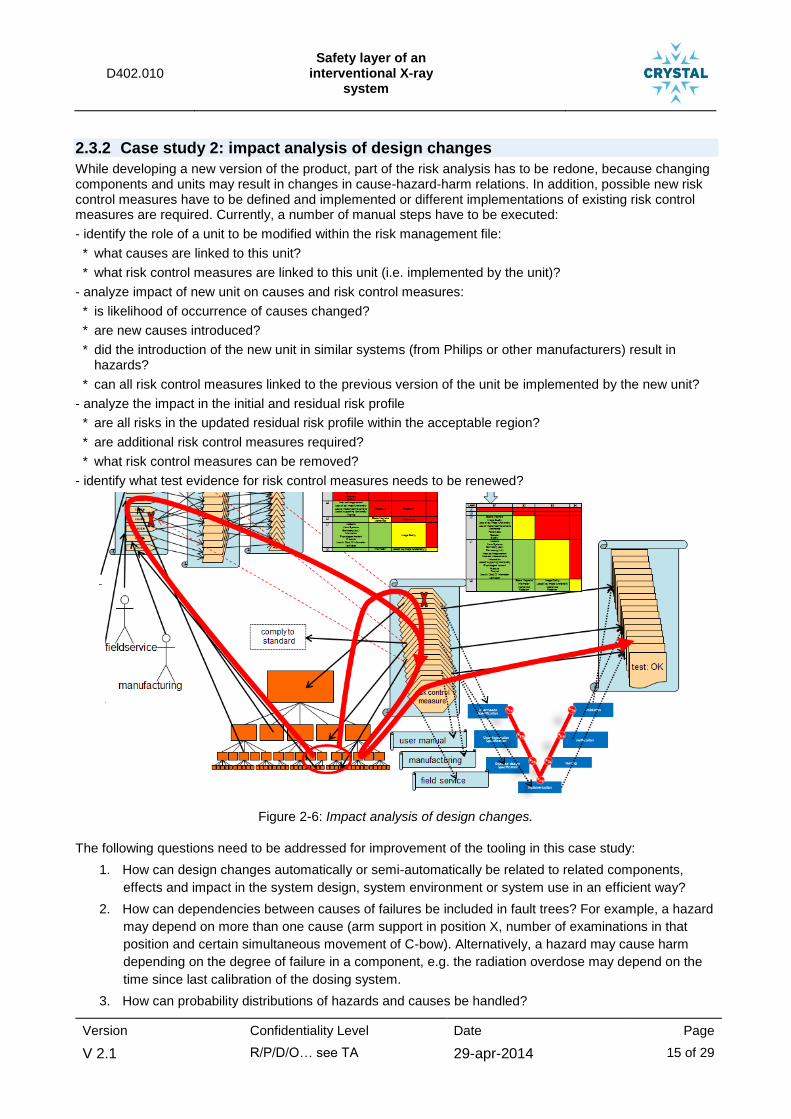
D402.010 Safety layer of an
interventional X-ray system
Version Confidentiality Level Date Page
V 2.1 R/P/D/O… see TA 29-apr-2014 15 of 29
2.3.2 Case study 2: impact analysis of design changes
While developing a new version of the product, part of the risk analysis has to be redone, because changing components and units may result in changes in cause-hazard-harm relations. In addition, possible new risk control measures have to be defined and implemented or different implementations of existing risk control measures are required. Currently, a number of manual steps have to be executed:
- identify the role of a unit to be modified within the risk management file:
* what causes are linked to this unit?
* what risk control measures are linked to this unit (i.e. implemented by the unit)?
- analyze impact of new unit on causes and risk control measures:
* is likelihood of occurrence of causes changed?
* are new causes introduced?
* did the introduction of the new unit in similar systems (from Philips or other manufacturers) result in hazards?
* can all risk control measures linked to the previous version of the unit be implemented by the new unit?
- analyze the impact in the initial and residual risk profile
* are all risks in the updated residual risk profile within the acceptable region?
* are additional risk control measures required?
* what risk control measures can be removed?
- identify what test evidence for risk control measures needs to be renewed?
Figure 2-6: Impact analysis of design changes.
The following questions need to be addressed for improvement of the tooling in this case study:
1. How can design changes automatically or semi-automatically be related to related components,
effects and impact in the system design, system environment or system use in an efficient way?
2. How can dependencies between causes of failures be included in fault trees? For example, a hazard
may depend on more than one cause (arm support in position X, number of examinations in that
position and certain simultaneous movement of C-bow). Alternatively, a hazard may cause harm
depending on the degree of failure in a component, e.g. the radiation overdose may depend on the
time since last calibration of the dosing system.
3. How can probability distributions of hazards and causes be handled?
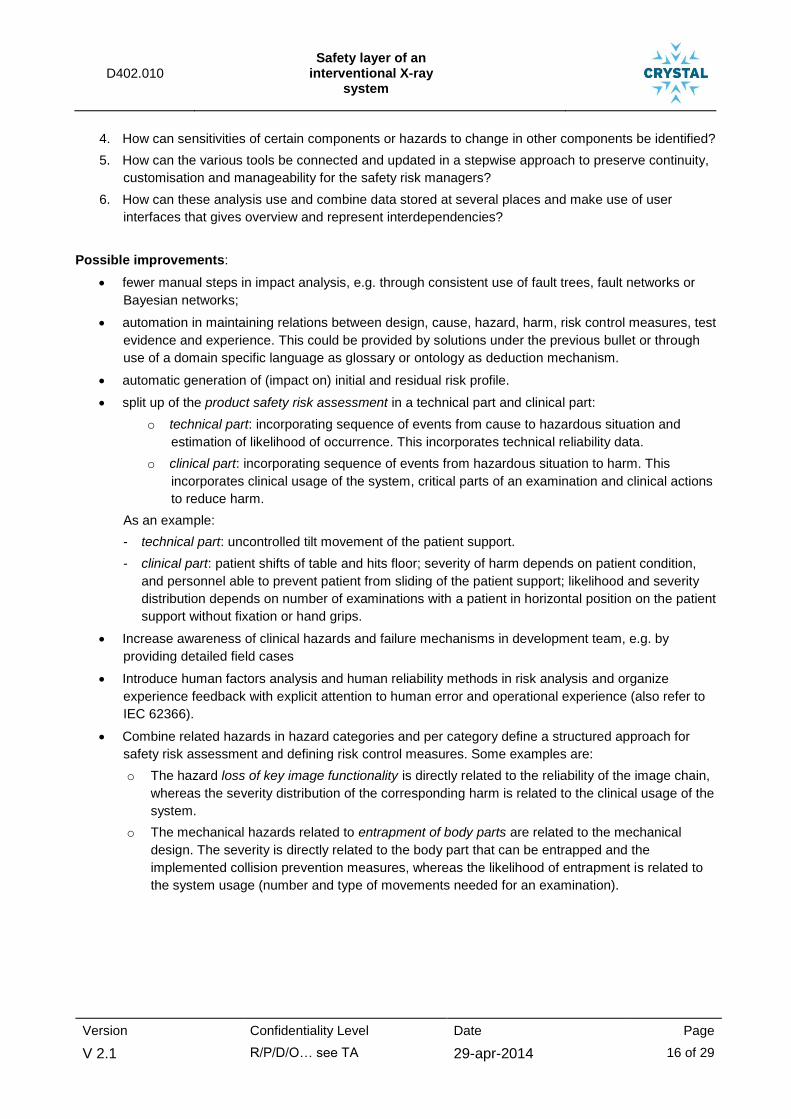
D402.010 Safety layer of an
interventional X-ray system
Version Confidentiality Level Date Page
V 2.1 R/P/D/O… see TA 29-apr-2014 16 of 29
4. How can sensitivities of certain components or hazards to change in other components be identified?
5. How can the various tools be connected and updated in a stepwise approach to preserve continuity,
customisation and manageability for the safety risk managers?
6. How can these analysis use and combine data stored at several places and make use of user
interfaces that gives overview and represent interdependencies?
Possible improvements:
fewer manual steps in impact analysis, e.g. through consistent use of fault trees, fault networks or
Bayesian networks;
automation in maintaining relations between design, cause, hazard, harm, risk control measures, test
evidence and experience. This could be provided by solutions under the previous bullet or through
use of a domain specific language as glossary or ontology as deduction mechanism.
automatic generation of (impact on) initial and residual risk profile.
split up of the product safety risk assessment in a technical part and clinical part:
o technical part: incorporating sequence of events from cause to hazardous situation and
estimation of likelihood of occurrence. This incorporates technical reliability data.
o clinical part: incorporating sequence of events from hazardous situation to harm. This
incorporates clinical usage of the system, critical parts of an examination and clinical actions
to reduce harm.
As an example:
- technical part: uncontrolled tilt movement of the patient support.
- clinical part: patient shifts of table and hits floor; severity of harm depends on patient condition,
and personnel able to prevent patient from sliding of the patient support; likelihood and severity
distribution depends on number of examinations with a patient in horizontal position on the patient
support without fixation or hand grips.
Increase awareness of clinical hazards and failure mechanisms in development team, e.g. by
providing detailed field cases
Introduce human factors analysis and human reliability methods in risk analysis and organize
experience feedback with explicit attention to human error and operational experience (also refer to
IEC 62366).
Combine related hazards in hazard categories and per category define a structured approach for
safety risk assessment and defining risk control measures. Some examples are:
o The hazard loss of key image functionality is directly related to the reliability of the image chain,
whereas the severity distribution of the corresponding harm is related to the clinical usage of the
system.
o The mechanical hazards related to entrapment of body parts are related to the mechanical
design. The severity is directly related to the body part that can be entrapped and the
implemented collision prevention measures, whereas the likelihood of entrapment is related to
the system usage (number and type of movements needed for an examination).
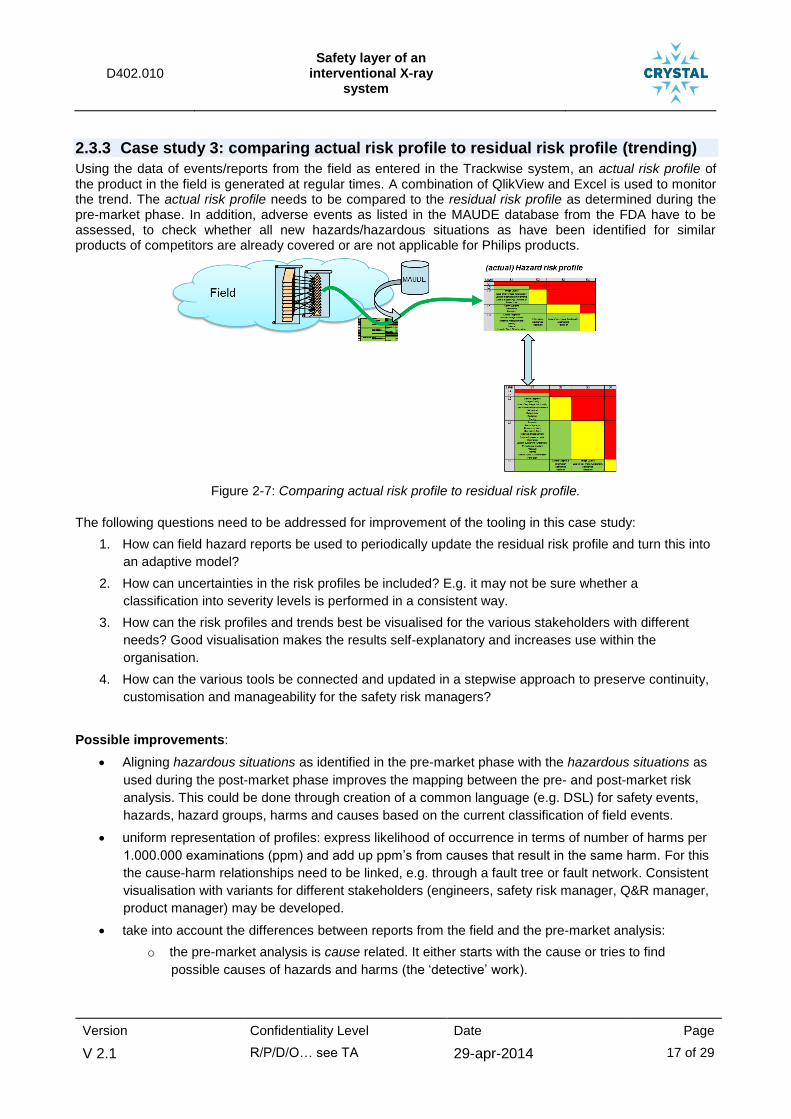
D402.010 Safety layer of an
interventional X-ray system
Version Confidentiality Level Date Page
V 2.1 R/P/D/O… see TA 29-apr-2014 17 of 29
2.3.3 Case study 3: comparing actual risk profile to residual risk profile (trending)
Using the data of events/reports from the field as entered in the Trackwise system, an actual risk profile of the product in the field is generated at regular times. A combination of QlikView and Excel is used to monitor the trend. The actual risk profile needs to be compared to the residual risk profile as determined during the pre-market phase. In addition, adverse events as listed in the MAUDE database from the FDA have to be assessed, to check whether all new hazards/hazardous situations as have been identified for similar products of competitors are already covered or are not applicable for Philips products.
Figure 2-7: Comparing actual risk profile to residual risk profile.
The following questions need to be addressed for improvement of the tooling in this case study:
1. How can field hazard reports be used to periodically update the residual risk profile and turn this into
an adaptive model?
2. How can uncertainties in the risk profiles be included? E.g. it may not be sure whether a
classification into severity levels is performed in a consistent way.
3. How can the risk profiles and trends best be visualised for the various stakeholders with different
needs? Good visualisation makes the results self-explanatory and increases use within the
organisation.
4. How can the various tools be connected and updated in a stepwise approach to preserve continuity,
customisation and manageability for the safety risk managers?
Possible improvements:
Aligning hazardous situations as identified in the pre-market phase with the hazardous situations as
used during the post-market phase improves the mapping between the pre- and post-market risk
analysis. This could be done through creation of a common language (e.g. DSL) for safety events,
hazards, hazard groups, harms and causes based on the current classification of field events.
uniform representation of profiles: express likelihood of occurrence in terms of number of harms per
1.000.000 examinations (ppm) and add up ppm’s from causes that result in the same harm. For this
the cause-harm relationships need to be linked, e.g. through a fault tree or fault network. Consistent
visualisation with variants for different stakeholders (engineers, safety risk manager, Q&R manager,
product manager) may be developed.
take into account the differences between reports from the field and the pre-market analysis:
o the pre-market analysis is cause related. It either starts with the cause or tries to find
possible causes of hazards and harms (the ‘detective’ work).
D402.010 Safety layer of an
interventional X-ray system
Version Confidentiality Level Date Page
V 2.1 R/P/D/O… see TA 29-apr-2014 18 of 29
o the post-market reports are event related. It reports how the customer sees a certain event
and the actual cause is not relevant or not clear for the customer. The link with pre-market
analysis is mainly on hazard or harm.
Both viewpoints may result in a structural difference between residual risk profile and actual risk
profile. This needs to be handled in an efficient and consistent way. It needs to be determined which
viewpoints are most relevant for which engineering method and stakeholder.

D402.010 Safety layer of an
interventional X-ray system
Version Confidentiality Level Date Page
V 2.1 R/P/D/O… see TA 29-apr-2014 19 of 29
3 Detailed Description of the Use Case Process An overview of the safety risk management process is presented in figure 3-1.
Overview product safety management
Sales and services R&D/Development projectteamMarketing/Clinical
marketingDevelopment projecteam/Product risk
management role
Ph
ase
Safety teamProjectteam
Test team
Surveillance team
System requirements
Safety analysisHSP
HAZIDRISK scenario’sRISK analysisPropose risk
mitigating measures
Safety FMEA (techn.)- from cause to hazard- Risk control measures- PPM
Safety risk allocation to component
(subsysteem)
System Design
RMPProject document
Risk management file
Norm compliance check
Submits to FDA, testhouses,
(documentsets depending on stakeholder)
Norm Compliance file to e.g. FDA
Reliability FMEA on selected
components
PQ&M team
Verificatie
Validation
Test Traceability matrix with
Listing of test results
Risk management report- residual risk profile
Check on completeness
Problem reports on new experiences
(in and after project)
Riskmanagement matrix
(summary FMEA)
Respond to safety events
E.g. analysisSafety event
(e.g. incident follow up of service call)
Observation after delivery
Impact/problem analysis
Complaint risk evaluation
Update Safety FMEA
Risc control measures
Implements design changes
User need specification
Info on use scenaro’s
Surveillance report including actual risk
profile
System design
Component designComponent design
Component design
SoftwareClassification
create RMM(summary FMEA)
Safety FMEA (clinical)- from hazards to harm(severity distribution)
Classify software
components
Decomposition of RCM
.
Figure 3-1: Overview of Risk Management Process.
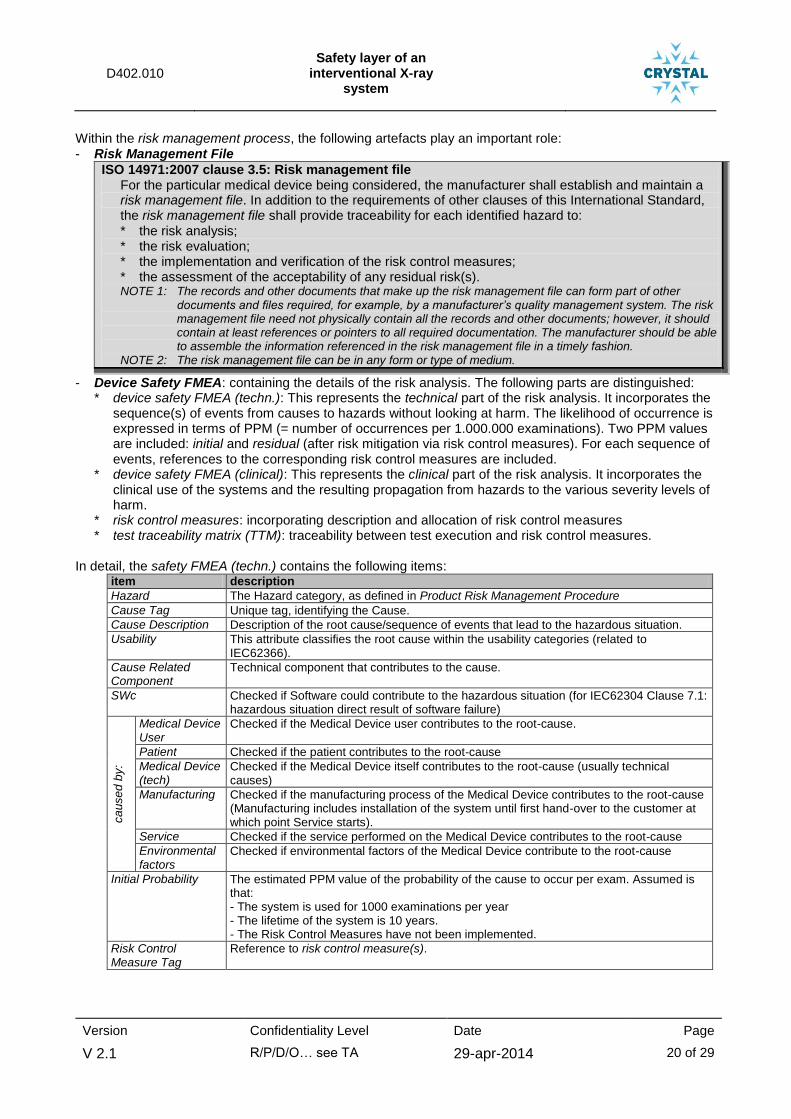
D402.010 Safety layer of an
interventional X-ray system
Version Confidentiality Level Date Page
V 2.1 R/P/D/O… see TA 29-apr-2014 20 of 29
Within the risk management process, the following artefacts play an important role: - Risk Management File
ISO 14971:2007 clause 3.5: Risk management file For the particular medical device being considered, the manufacturer shall establish and maintain a
risk management file. In addition to the requirements of other clauses of this International Standard, the risk management file shall provide traceability for each identified hazard to: * the risk analysis; * the risk evaluation; * the implementation and verification of the risk control measures; * the assessment of the acceptability of any residual risk(s). NOTE 1: The records and other documents that make up the risk management file can form part of other
documents and files required, for example, by a manufacturer’s quality management system. The risk management file need not physically contain all the records and other documents; however, it should contain at least references or pointers to all required documentation. The manufacturer should be able to assemble the information referenced in the risk management file in a timely fashion.
NOTE 2: The risk management file can be in any form or type of medium.
- Device Safety FMEA: containing the details of the risk analysis. The following parts are distinguished: * device safety FMEA (techn.): This represents the technical part of the risk analysis. It incorporates the
sequence(s) of events from causes to hazards without looking at harm. The likelihood of occurrence is expressed in terms of PPM (= number of occurrences per 1.000.000 examinations). Two PPM values are included: initial and residual (after risk mitigation via risk control measures). For each sequence of events, references to the corresponding risk control measures are included.
* device safety FMEA (clinical): This represents the clinical part of the risk analysis. It incorporates the clinical use of the systems and the resulting propagation from hazards to the various severity levels of harm.
* risk control measures: incorporating description and allocation of risk control measures * test traceability matrix (TTM): traceability between test execution and risk control measures.
In detail, the safety FMEA (techn.) contains the following items:
item description
Hazard The Hazard category, as defined in Product Risk Management Procedure
Cause Tag Unique tag, identifying the Cause.
Cause Description Description of the root cause/sequence of events that lead to the hazardous situation.
Usability This attribute classifies the root cause within the usability categories (related to IEC62366).
Cause Related Component
Technical component that contributes to the cause.
SWc Checked if Software could contribute to the hazardous situation (for IEC62304 Clause 7.1: hazardous situation direct result of software failure)
ca
use
d b
y:
Medical Device User
Checked if the Medical Device user contributes to the root-cause.
Patient Checked if the patient contributes to the root-cause
Medical Device (tech)
Checked if the Medical Device itself contributes to the root-cause (usually technical causes)
Manufacturing Checked if the manufacturing process of the Medical Device contributes to the root-cause (Manufacturing includes installation of the system until first hand-over to the customer at which point Service starts).
Service Checked if the service performed on the Medical Device contributes to the root-cause
Environmental factors
Checked if environmental factors of the Medical Device contribute to the root-cause
Initial Probability The estimated PPM value of the probability of the cause to occur per exam. Assumed is that: - The system is used for 1000 examinations per year - The lifetime of the system is 10 years. - The Risk Control Measures have not been implemented.
Risk Control Measure Tag
Reference to risk control measure(s).
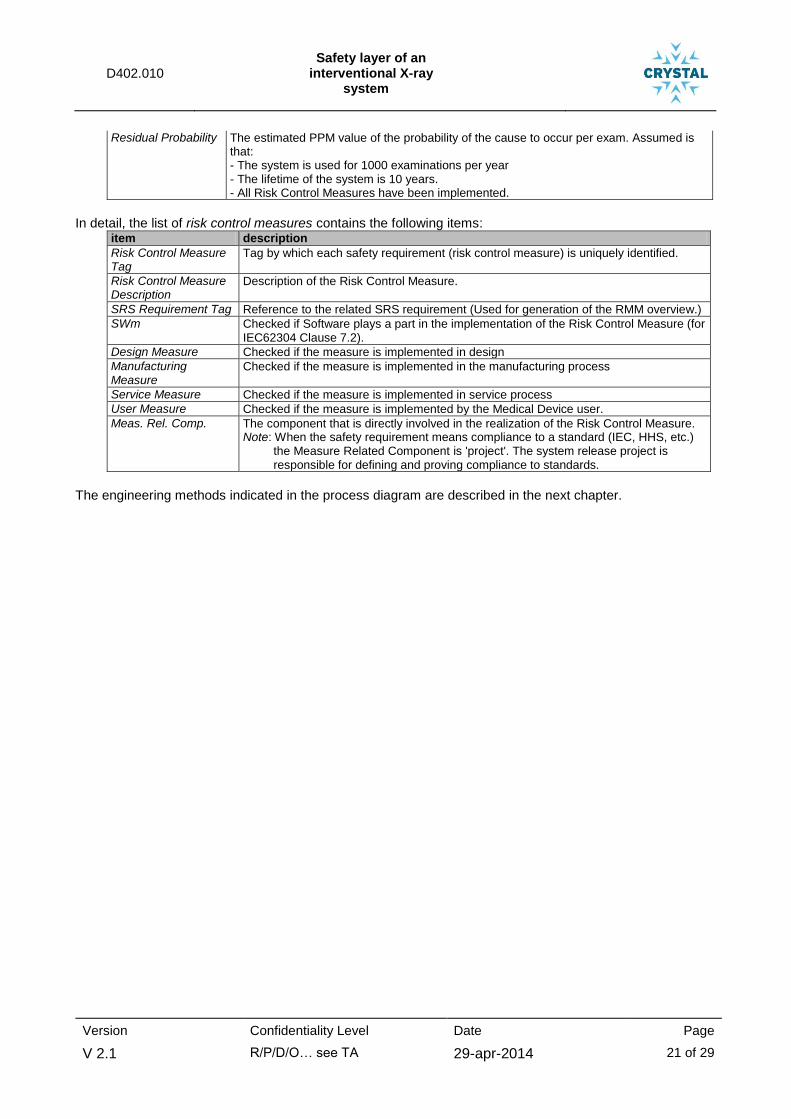
D402.010 Safety layer of an
interventional X-ray system
Version Confidentiality Level Date Page
V 2.1 R/P/D/O… see TA 29-apr-2014 21 of 29
Residual Probability The estimated PPM value of the probability of the cause to occur per exam. Assumed is that: - The system is used for 1000 examinations per year - The lifetime of the system is 10 years. - All Risk Control Measures have been implemented.
In detail, the list of risk control measures contains the following items:
item description
Risk Control Measure Tag
Tag by which each safety requirement (risk control measure) is uniquely identified.
Risk Control Measure Description
Description of the Risk Control Measure.
SRS Requirement Tag Reference to the related SRS requirement (Used for generation of the RMM overview.)
SWm Checked if Software plays a part in the implementation of the Risk Control Measure (for IEC62304 Clause 7.2).
Design Measure Checked if the measure is implemented in design
Manufacturing Measure
Checked if the measure is implemented in the manufacturing process
Service Measure Checked if the measure is implemented in service process
User Measure Checked if the measure is implemented by the Medical Device user.
Meas. Rel. Comp. The component that is directly involved in the realization of the Risk Control Measure. Note: When the safety requirement means compliance to a standard (IEC, HHS, etc.)
the Measure Related Component is 'project'. The system release project is responsible for defining and proving compliance to standards.
The engineering methods indicated in the process diagram are described in the next chapter.

D402.010 Safety layer of an
interventional X-ray system
Version Confidentiality Level Date Page
V 2.1 R/P/D/O… see TA 29-apr-2014 22 of 29
4 Identification of Engineering Methods
Input Output Tools
Safety analysis (impact design change)
(analyze risk scenario’s (including adverse events with similar devices (philips + others)); intended use; foreseeable misuse; identify hazards; risk estimation; risk evaluation; propose risk mitigating measures)
- System Requirements Spec. - System Design Specification - info on use scenario’s - MAUDE database (adverse
events) - Safety FMEA (clinical)
Device Safety FMEA (techn.) Excel (file create) Agile DHF (PLM) Word (SRS/SDS) WebBrowser(MAUDE)
Safety risk allocation to component (subsystem)
- Device Safety FMEA (techn.) (risk control measures) - system design specification
Decomposition of Risk Control Measures
(allocated to components)
Excel
Impact/problem analysis (redo part of safety analysis)
- problem report Device Safety FMEA (techn.) ClearQuest Excel
Check on completeness (all test case for risk control
measures executed with “passed” test result)
- Test Traceability with test results
- Safety FMEA
Risk management report (RMR)
Word (file create) Excel
create RMM (summary FMEA)
- Device Safety FMEA (techn.) - Device Safety FMEA (clinical)
Risk Management Matrix (RMM)
Word (file create) Excel
Complaint risk evaluation (analyze complaint information; identify hazard; risk estimation; cause identification; update device safety FMEA)
- Complaint description - System Design Specification - Device Safety FMEA (techn.) - Device Safety FMEA (clinical)
Device Safety FMEA (techn.) (update)
Device Safety FMEA (clinical) (update)
TrackWise ClearQuest Word Agile DHF (PLM) Excel
Collect and Analyse Adverse Safety Events
(check whether new adverse events have occurred with comparable systems and whether the corresponding hazards are already part of the risk management data of our own systems.)
- adverse event database Coded adverse events Device Safety FMEA (techn.)
(update) Device Safety FMEA (clinical)
(update)
WebBrowser(MAUDE) Excel
Post market surveillance trending (Field Surveillance)
(analyze trends in complaint information;
analyze adverse events with similar devices of other manufacturers;
update device safety FMEA)
- Complaint hazard codes - Coded adverse events - Device Safety FMEA (techn.) - Device Safety FMEA (clinical)
Surveillance report Device Safety FMEA (techn.)
(update) Device Safety FMEA (clinical)
(update)
TrackWise QlikView Word Agile DHF (PLM) Excel
Refer to chapter 7 Annex I: Detailed Descriptions of the Engineering Methods for a detailed description of the engineering method complaint risk evaluation.

D402.010 Safety layer of an
interventional X-ray system
Version Confidentiality Level Date Page
V 2.1 R/P/D/O… see TA 29-apr-2014 23 of 29
5 Terms, Abbreviations and Definitions
Also refer to definitions in paragraph 2.2.2 Definition of terms.
FDA U.S. Food and Drug Administration (U.S. Department of Health and Human Services)
IfU Instructions for Use (User Manual)
MAUDE “Manufacture And User facility Device Experience” database of FDA containing reports of
adverse events involving medical devices.
Table 5-1: Terms, Abbreviations and Definitions

D402.010 Safety layer of an
interventional X-ray system
Version Confidentiality Level Date Page
V 2.1 R/P/D/O… see TA 29-apr-2014 24 of 29
6 References
European Directive
[MDD]
Council directive concerning medical devices (Medical Device Directive, MDD)
Annex I – Essential Requirements.
(93/42/EEC 1993-06-14; up to and including amendment 5: 2007/47/EC 2007-09-05)
USA federal Regulations
[FDA]
Code of Federal Regulations, Title 21, Subchapter J, Part 1010: Performance standards for electronic products: general (2012-04-01) Part 1020: Performance standards for ionizing radiation emitting products .30: Diagnostic X-ray systems and their major components (2012-04-01) .31: Radiographic equipment (2012-04-01) .32: Fluoroscopic equipment (2012-04-01)
[IEC60601-1:2005] Medical electrical equipment – part 1: General requirements for basic safety and
essential performance
(edition 3.0: 2005-12)
[ISO14971:2007] Medical devices – Application of risk management to medical devices
(second edition: 2007-03-01; corrected edition 2007-10-01)
IEC62366:2007 Medical devices. Application of usability engineering to medical devices
(edition 1.0: 2007-10).
IEC62304:2006 Medical device software – Software life cycle processes
(first edition: 2006-05)
IEC80001-1:2010-10 Application of risk management for IT-networks incorporating medical devices
(edition 1.0: 2010-10)
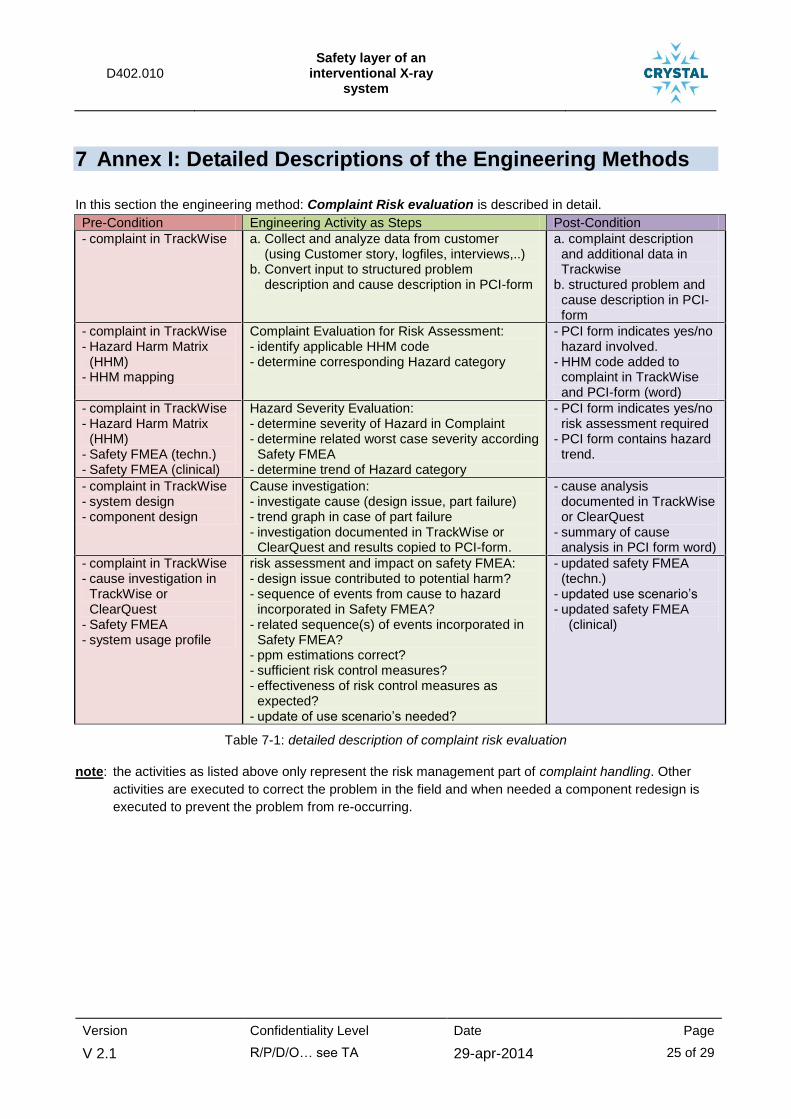
D402.010 Safety layer of an
interventional X-ray system
Version Confidentiality Level Date Page
V 2.1 R/P/D/O… see TA 29-apr-2014 25 of 29
7 Annex I: Detailed Descriptions of the Engineering Methods
In this section the engineering method: Complaint Risk evaluation is described in detail.
Pre-Condition Engineering Activity as Steps Post-Condition
- complaint in TrackWise a. Collect and analyze data from customer (using Customer story, logfiles, interviews,..) b. Convert input to structured problem description and cause description in PCI-form
a. complaint description and additional data in Trackwise
b. structured problem and cause description in PCI-form
- complaint in TrackWise - Hazard Harm Matrix
(HHM) - HHM mapping
Complaint Evaluation for Risk Assessment: - identify applicable HHM code - determine corresponding Hazard category
- PCI form indicates yes/no hazard involved.
- HHM code added to complaint in TrackWise and PCI-form (word)
- complaint in TrackWise - Hazard Harm Matrix
(HHM) - Safety FMEA (techn.) - Safety FMEA (clinical)
Hazard Severity Evaluation: - determine severity of Hazard in Complaint - determine related worst case severity according
Safety FMEA - determine trend of Hazard category
- PCI form indicates yes/no risk assessment required
- PCI form contains hazard trend.
- complaint in TrackWise - system design - component design
Cause investigation: - investigate cause (design issue, part failure) - trend graph in case of part failure - investigation documented in TrackWise or
ClearQuest and results copied to PCI-form.
- cause analysis documented in TrackWise or ClearQuest
- summary of cause analysis in PCI form word)
- complaint in TrackWise - cause investigation in
TrackWise or ClearQuest
- Safety FMEA - system usage profile
risk assessment and impact on safety FMEA: - design issue contributed to potential harm? - sequence of events from cause to hazard
incorporated in Safety FMEA? - related sequence(s) of events incorporated in
Safety FMEA? - ppm estimations correct? - sufficient risk control measures? - effectiveness of risk control measures as
expected? - update of use scenario’s needed?
- updated safety FMEA (techn.)
- updated use scenario’s - updated safety FMEA
(clinical)
Table 7-1: detailed description of complaint risk evaluation
note: the activities as listed above only represent the risk management part of complaint handling. Other
activities are executed to correct the problem in the field and when needed a component redesign is
executed to prevent the problem from re-occurring.
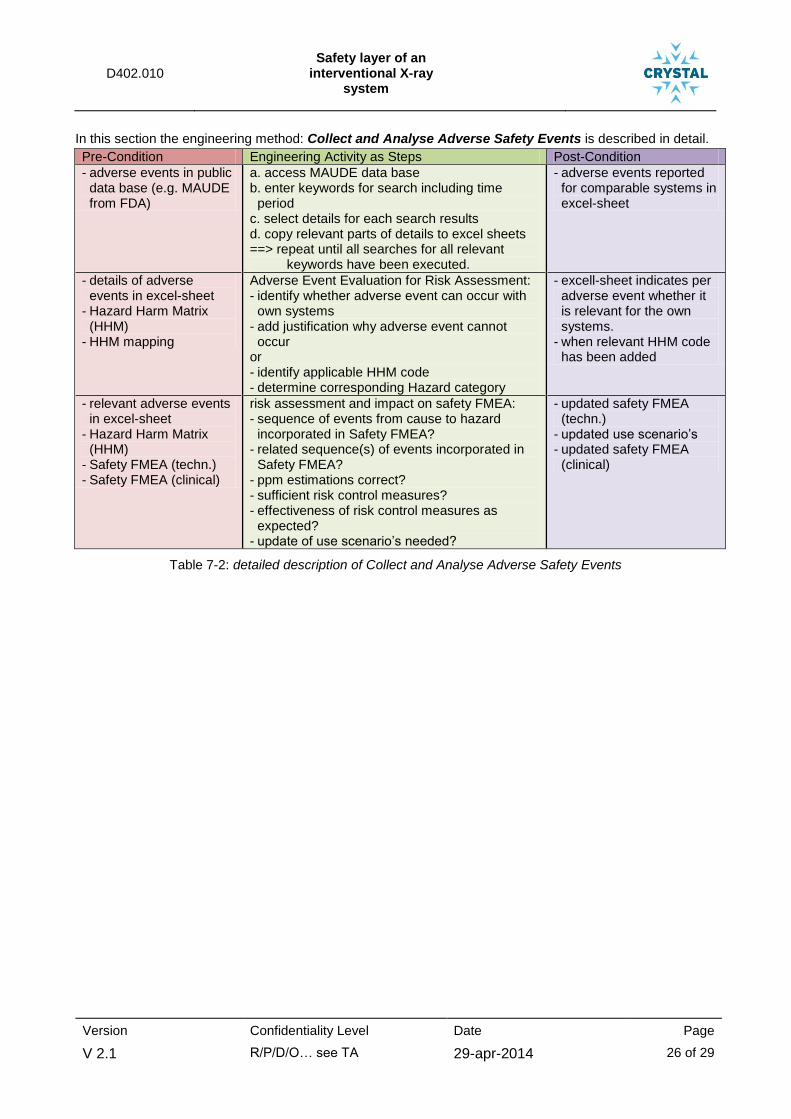
D402.010 Safety layer of an
interventional X-ray system
Version Confidentiality Level Date Page
V 2.1 R/P/D/O… see TA 29-apr-2014 26 of 29
In this section the engineering method: Collect and Analyse Adverse Safety Events is described in detail.
Pre-Condition Engineering Activity as Steps Post-Condition
- adverse events in public data base (e.g. MAUDE from FDA)
a. access MAUDE data base b. enter keywords for search including time
period c. select details for each search results d. copy relevant parts of details to excel sheets ==> repeat until all searches for all relevant
keywords have been executed.
- adverse events reported for comparable systems in excel-sheet
- details of adverse events in excel-sheet
- Hazard Harm Matrix (HHM)
- HHM mapping
Adverse Event Evaluation for Risk Assessment: - identify whether adverse event can occur with
own systems - add justification why adverse event cannot
occur or - identify applicable HHM code - determine corresponding Hazard category
- excell-sheet indicates per adverse event whether it is relevant for the own systems.
- when relevant HHM code has been added
- relevant adverse events in excel-sheet
- Hazard Harm Matrix (HHM)
- Safety FMEA (techn.) - Safety FMEA (clinical)
risk assessment and impact on safety FMEA: - sequence of events from cause to hazard
incorporated in Safety FMEA? - related sequence(s) of events incorporated in
Safety FMEA? - ppm estimations correct? - sufficient risk control measures? - effectiveness of risk control measures as
expected? - update of use scenario’s needed?
- updated safety FMEA (techn.)
- updated use scenario’s - updated safety FMEA
(clinical)
Table 7-2: detailed description of Collect and Analyse Adverse Safety Events

D402.010 Safety layer of an
interventional X-ray system
Version Confidentiality Level Date Page
V 2.1 R/P/D/O… see TA 29-apr-2014 27 of 29
In this section the engineering method: Field Surveillance is described in detail.
Pre-Condition Engineering Activity as Steps Post-Condition
- complaints and service work orders in TrackWise including corresponding HHM code
- installed base (list of systems in the field)
- system codes
a. Count number of complaints/service workorders per HHM codes and per system type.
b. convert data into ppm values per hazard category and severity level and per system type.
- averaged value of ppm per hazard category and severity level and per system type (= matrix per system type in Excel-sheet)
- ppm values in matrix (per hazard category, severity level) and per system type
- complaints and service work orders in TrackWise
a. re-evaluate complaints/service workorders with S2, S3 and S4 severty
b. document justification for re-evaluation c. identify complaints with user error or user
decision as main cause
- confirmed matrix (ppm value per hazard categoy, per severity level) per system type (Excel-sheet)
- confirmed ppm matrix (Excel)
- confirmed ppm matrix from previous periods (Excel)
Analyse trend: - ppm values within acceptable limits - trend in ppm values when compared to
previous monitoring periods. - analyse cause of exceeding limits, wrong
trends
- identified hazard categories exceeding acceptable limits
- trends per hazard category
- identified causes
- confirmed ppm matrix (Excel)
- confirmed ppm matrix from previous periods (Excel)
- generate actual safety profile (moving average (year))
4. updated actual safety profile (Excel)
- updated actual safety profile (Excel)
- pre-market safety FMEA and RMM
compare and transfer post-market data to pre-market RMM
- ppm estimations correct? - sufficient risk control measures? - effectiveness of risk control measures as
expected? - update of use scenario’s needed?
- updated safety FMEA and RMM
- updated use scenario’s
- confirmed matrix (ppm value per hazard categoy, per severity level) per system type (Excel-sheet)
- identified hazard categories exceeding acceptable limits
- trends per hazard category
- identified causes - results of reported
adverse events analysis
- generate quarterly field surveillance report - quarterly field surveillance report
Table 7-3: detailed description of Field Surveillance
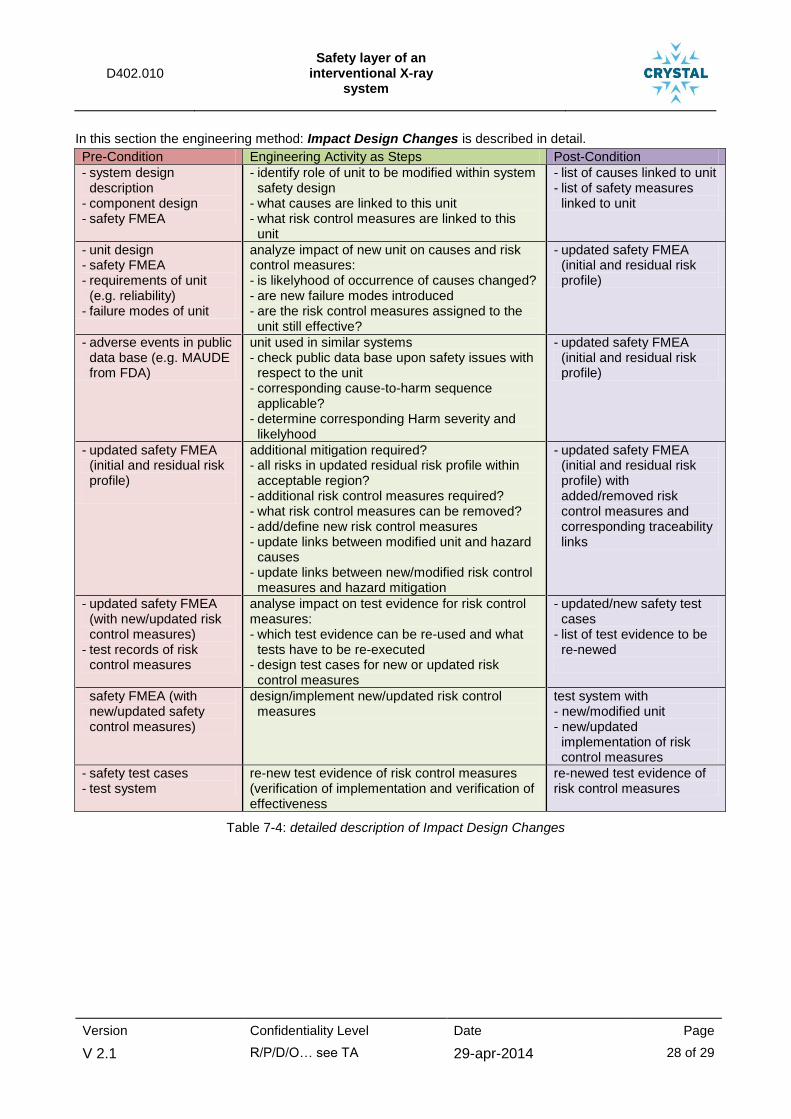
D402.010 Safety layer of an
interventional X-ray system
Version Confidentiality Level Date Page
V 2.1 R/P/D/O… see TA 29-apr-2014 28 of 29
In this section the engineering method: Impact Design Changes is described in detail.
Pre-Condition Engineering Activity as Steps Post-Condition
- system design description
- component design - safety FMEA
- identify role of unit to be modified within system safety design
- what causes are linked to this unit - what risk control measures are linked to this
unit
- list of causes linked to unit - list of safety measures
linked to unit
- unit design - safety FMEA - requirements of unit
(e.g. reliability) - failure modes of unit
analyze impact of new unit on causes and risk control measures: - is likelyhood of occurrence of causes changed? - are new failure modes introduced - are the risk control measures assigned to the
unit still effective?
- updated safety FMEA (initial and residual risk profile)
- adverse events in public data base (e.g. MAUDE from FDA)
unit used in similar systems - check public data base upon safety issues with
respect to the unit - corresponding cause-to-harm sequence
applicable? - determine corresponding Harm severity and
likelyhood
- updated safety FMEA (initial and residual risk profile)
- updated safety FMEA (initial and residual risk profile)
additional mitigation required? - all risks in updated residual risk profile within
acceptable region? - additional risk control measures required? - what risk control measures can be removed? - add/define new risk control measures - update links between modified unit and hazard
causes - update links between new/modified risk control
measures and hazard mitigation
- updated safety FMEA (initial and residual risk profile) with added/removed risk control measures and corresponding traceability links
- updated safety FMEA (with new/updated risk control measures)
- test records of risk control measures
analyse impact on test evidence for risk control measures: - which test evidence can be re-used and what
tests have to be re-executed - design test cases for new or updated risk
control measures
- updated/new safety test cases
- list of test evidence to be re-newed
safety FMEA (with new/updated safety control measures)
design/implement new/updated risk control measures
test system with - new/modified unit - new/updated
implementation of risk control measures
- safety test cases - test system
re-new test evidence of risk control measures (verification of implementation and verification of effectiveness
re-newed test evidence of risk control measures
Table 7-4: detailed description of Impact Design Changes
D402.010 Safety layer of an
interventional X-ray system
Version Confidentiality Level Date Page
V 2.1 R/P/D/O… see TA 29-apr-2014 29 of 29
8 Annex II: Technology Base Line & Progress Beyond
This information will be collected globally, and the respective part will be inserted here. Basically it could be something like a table with a row for each engineering method and a column for the current functionality, which is the technology baseline (e.g., “data has to be transferred by hand”), and a column for the expected progress in CRYSTAL (e.g., to be implemented in CRYSYTAL / “future work”).
The exact content of this section will be defined in the next technical Board Meeting.