Perceptions of key business and financial risks by large-scale sugarcane farmers in KwaZulu-Natal in...
20
Agrekon, Vol 46, No 3 (September 2007) Mac Nicol, Ortmann & Ferrer Perceptions of key business and financial risks by large-scale sugarcane farmers in KwaZulu-Natal in a dynamic socio- political environment R Mac Nicol, GF Ortmann & SRD Ferrer 1 Abstract This study identifies sources of risk that commercial sugarcane farmers in the province of KwaZulu-Natal (KZN), South Africa, presently perceive to pose the greatest threat to the viability of their businesses. Sugarcane contributes approximately 82% of the income from field crops in KZN, with 72% of the crop planted by large-scale growers. Data obtained in 2006 via structured personal interviews of 76 large-scale sugarcane farmers from a stratified random sample of 110 farmers in two separate mill-supply areas of KZN were used to elicit farmers’ perceptions of various sources of risk. The most important risk sources were found to be the threat posed by land reform, minimum wage legislation and the variability of the sugar price, in that order. Land reform and minimum wage legislation did not feature prominently in past studies of KZN farmers during the 1990s. Factor analysis identified additional risk dimensions that exist within the remaining risk sources. Regional differences between the two study areas were also evident. Recommendations include that government improve accessibility to information regarding future plans for land and labour policies, and that farmers become more proactive in terms of obtaining information to reduce uncertainty and resultant efficiency barriers. Keywords: Risk sources; farmers’ perceptions; large-scale sugarcane farms; KwaZulu-Natal, South Africa. 1. Introduction The South African (SA) sugarcane industry supports approximately 50,940 small and large-scale producers who collectively farm an estimated area of 426,861 hectares (SACGA, 2006). On average, 22 million tons of sugarcane is produced seasonally in 14 mill-supply areas, extending from Northern Pondoland in the Eastern Cape, through the coastal belt and midlands of KwaZulu-Natal (KZN), and into the lowveld of Mpumalanga (SASA, 2006). Sugarcane contributes approximately 82% of the income from field crops in 1 Respectively, Masters student, Professor and Lecturer in Agricultural Economics, School of Agricultural Sciences and Agribusiness, University of KwaZulu-Natal, Private Bag X01, Scottsville 3209, South Africa. E- mail addresses: [email protected], [email protected] and [email protected], respectively. 351
-
Upload
independent -
Category
Documents
-
view
1 -
download
0
Transcript of Perceptions of key business and financial risks by large-scale sugarcane farmers in KwaZulu-Natal in...

Agrekon, Vol 46, No 3 (September 2007) Mac Nicol, Ortmann & Ferrer
Perceptions of key business and financial risks by large-scale sugarcane farmers in KwaZulu-Natal in a dynamic socio-political environment R Mac Nicol, GF Ortmann & SRD Ferrer1 Abstract This study identifies sources of risk that commercial sugarcane farmers in the province of KwaZulu-Natal (KZN), South Africa, presently perceive to pose the greatest threat to the viability of their businesses. Sugarcane contributes approximately 82% of the income from field crops in KZN, with 72% of the crop planted by large-scale growers. Data obtained in 2006 via structured personal interviews of 76 large-scale sugarcane farmers from a stratified random sample of 110 farmers in two separate mill-supply areas of KZN were used to elicit farmers’ perceptions of various sources of risk. The most important risk sources were found to be the threat posed by land reform, minimum wage legislation and the variability of the sugar price, in that order. Land reform and minimum wage legislation did not feature prominently in past studies of KZN farmers during the 1990s. Factor analysis identified additional risk dimensions that exist within the remaining risk sources. Regional differences between the two study areas were also evident. Recommendations include that government improve accessibility to information regarding future plans for land and labour policies, and that farmers become more proactive in terms of obtaining information to reduce uncertainty and resultant efficiency barriers. Keywords: Risk sources; farmers’ perceptions; large-scale sugarcane farms; KwaZulu-Natal, South Africa. 1. Introduction The South African (SA) sugarcane industry supports approximately 50,940 small and large-scale producers who collectively farm an estimated area of 426,861 hectares (SACGA, 2006). On average, 22 million tons of sugarcane is produced seasonally in 14 mill-supply areas, extending from Northern Pondoland in the Eastern Cape, through the coastal belt and midlands of KwaZulu-Natal (KZN), and into the lowveld of Mpumalanga (SASA, 2006). Sugarcane contributes approximately 82% of the income from field crops in
1 Respectively, Masters student, Professor and Lecturer in Agricultural Economics, School of Agricultural Sciences and Agribusiness, University of KwaZulu-Natal, Private Bag X01, Scottsville 3209, South Africa. E-mail addresses: [email protected], [email protected] and [email protected], respectively.
351
Agrekon, Vol 46, No 3 (September 2007) Mac Nicol, Ortmann & Ferrer KZN (STATSSA, 2002), with 72% of the crop planted by large-scale growers compared with 19% by small-scale growers (SACGA, 2006). The remaining nine percent is planted by millers. KZN sugarcane growers contribute approximately 87% of the gross farming income earned by sugarcane farmers in South Africa (STATSSA, 2002). SA farmers are faced with many challenges that lead to an uncertain decision making environment. In addition to dealing with the deregulation of domestic agricultural markets in the 1990s and thus more variable product prices, SA farmers also have to adapt to a dynamic global economic and trade environment, and a dynamic political environment. More specifically, the challenges include: land reform, AgriBEE (Agricultural Black Economic Empowerment in Agriculture), new labour legislation and minimum wages, property (rural land) taxes, skills levies, uncertain water rights, HIV/Aids, a volatile exchange rate, and high transport and communication costs (Ortmann and Machethe, 2003; Ortmann, 2005). SA sugarcane farmers also had to deal with a highly variable sugar price in recent years (Illovo Sugar, 2006). Between January and March 2006 the International Sugar Agreement (ISA) daily price averaged 37.43 US cents per kilogram, 91% higher than in the same period in 2005 (FAO, 2006). Following a rise to almost 44 US cents per kilogram in early 2006, the price declined to about 26 US cents per kilogram by November 2006. European Union sugar policy reforms are a major market driver and are expected to continue to reduce world exports and contribute to strengthening prices, together with demand growth in China and India (FAO, 2006). Sugar production in Brazil is another major market driver, with projected growth in supply and the relative proportions of their crop split between sucrose and ethanol production being important market forces (FAO, 2006). Eighty percent of South Africa’s anticipated export raw sugar sales for the 2006-2007 season has been sold at 33.58 US cents per kilogram, a price that is significantly higher than in the previous year (Illovo Sugar, 2006). SA studies where farm-level data sets were used to identify the perceived importance of multiple risk sources include those by Swanepoel and Ortmann (1993), Bullock et al. (1994), Woodburn et al. (1995), Stockil and Ortmann (1997) and Hardman et al. (2002). The study by Woodburn et al. (1995) was conducted among commercial farmers in KZN, with 55 percent of respondents reporting a sugarcane enterprise. Similar studies conducted in the USA include those by Boggess et al. (1985), Patrick et al. (1985) and Ortmann et al. (1992). These studies identified mainly price and production risks as the most important perceived risk sources, although there was a trend towards the increasing
352

Agrekon, Vol 46, No 3 (September 2007) Mac Nicol, Ortmann & Ferrer importance of government legislation risks by the late 1990s. This is evident in the study by Stockil and Ortmann (1997) where changing labour laws and land reform policies were found to be the fourth and sixth most important risk sources, respectively. This study complements the research conducted by Swanepoel and Ortmann (1993), Bullock et al. (1993), Woodburn et al. (1995), Stockil and Ortmann (1997) and Hardman et al. (2002). Results are briefly compared to previous studies in South Africa and KZN to analyse farmers’ changing risk perceptions. This study will help to identify sources of risk that are currently perceived to be the most important by large-scale commercial sugarcane farmers in KZN and aims to use factor analysis to examine the dimensions of these perceived risks. This research will facilitate a better understanding of the risks facing commercial sugarcane producers. Findings could assist policy-makers, consultants, extension officers and financial institutions in designing appropriate risk management products and strategies for this group of farmers. 2. Data source The sample for this study was drawn from a list of commercial sugarcane farmers in KZN that was compiled by the South African Cane Growers’ Association (SACGA). Respondents were drawn from two separate mill-supply areas in KZN, namely the Noodsberg mill-supply area in the KZN Midlands and the Umfolozi mill-supply area on the Zululand Coast. This split was considered necessary in order to account for regional differences that may exist between inland and coastal-belt producers. The SACGA regional managers responsible for the study areas were contacted and agreed to provide contact details for all large-scale commercial sugarcane operations in their respective areas. In consultation with SACGA representatives, large-scale operations were defined in this study as those responsible for annual sugarcane deliveries exceeding 10,000 tons. The decision to focus on large-scale producers was made because these farmers account for 72% of the area planted to sugarcane (contributing over 88% of production), compared with small-scale farmers who account for 19% of the total area planted to sugarcane and yet are responsible for less than 12% of production (Eweg, 2005; SACGA, 2006). Large-scale farmers, therefore, have a different range of options available to manage risk, due mainly to size economies and higher education levels (Barry, 2003). The relatively high costs of using the personal interview approach for data collection and a restricted research budget limited the maximum size of the sample to about 100 respondents. Based on consultations with SACGA regional managers, and on the results of a pilot survey, it was decided that an
353

Agrekon, Vol 46, No 3 (September 2007) Mac Nicol, Ortmann & Ferrer initial sample size of 110 farming operations would be used to compensate for possible non-responses. Fifty-five farming operations were randomly selected from a complete list of large-scale growers in each mill-supply area. The principal decision-makers for each business were contacted telephonically to arrange structured interviews. Every effort was made to encourage the participation of those decision-makers contacted. Of the 110 principal decision-makers contacted overall, a total of 76 usable responses were obtained (69%). Equal numbers of usable responses (38) were obtained from both study areas after four responses from the Zululand region were deemed to be non-representative, and were excluded. These respondents operated extensive beef and game enterprises (with 8,100, 7,400, 5,800 and 4,800 hectares of land owned), with sugarcane contributing less than 30 percent of gross farm income.
The overall response rate of 69% is lower than that obtained by Ferrer et al. (1997) of 82%, but higher than those obtained in studies using the postal survey approach. This is evident from the usable response rates of eight percent, 37%, 35% and 19% obtained by Swanepoel and Ortmann (1993), Bullock et al. (1994), Woodburn et al. (1995), and Stockil and Ortmann (1997), respectively, in postal surveys. 3. Characteristics of respondents The average age and experience of survey respondents is summarised in Table 1. Table 1: Age and experience of large-scale sugarcane respondents, KwaZulu-Natal, 2006
Overall (n=76)
Zululand (n=38)
Midlands (n=38) Mean comparison
mean mean mean t (assume ≠ variances)
Age (years) 47.17 49.05 45.29 0.061* Experience: managing current farm (years) 18.14 15.92 20.37 0.035** Experience: growing sugar cane (years) 21.88 21.76 22.00 0.915
Note: *, ** indicate means statistically significantly different at the ten and five percent levels of probability, respectively.
354

Agrekon, Vol 46, No 3 (September 2007) Mac Nicol, Ortmann & Ferrer Respondents were on average 47 years of age with 22 years of sugar cane growing experience, and had been involved with their current farming businesses for an average of 18 years. Respondents from the Zululand region were statistically significantly older than those from the KZN Midlands, by about four years (on average). Midlands respondents have significantly greater experience managing their current farm, a difference significant at the five percent level of probability. Means comparisons in this study were conducted using two-tailed t-tests for independent samples, with equal variances not assumed (Steel and Torrie, 1980: 106). Formal education levels of respondents (Table 2) were similar for the two survey regions except for matrics and diplomas – 18% of respondents from Zululand had no more than a matric qualification compared with three percent of respondents from the Midlands, a difference statistically significant at the five percent level of probability. The mean percentage difference for diplomas was statistically significant at the 10% level of probability. In the Zululand region three percent of respondents had obtained a trade, 32% diplomas and 47% university degrees. This compares to Midlands’ respondents of whom eight percent had obtained a trade, 52% diplomas, and 37% university degrees. Table 2: Formal education levels of large-scale sugarcane respondents, KwaZulu-Natal, 2006
Overall (n=76)
Zululand (n=38)
Midlands (n=38) Mean comparison
Formal Education Level Percent Percent Percent
t (assume ≠ variances)
Matric 11 18 3 0.025** Trade 5 3 8 0.311
Diploma 42 32 52 0.064* University degree 42 47 37 0.359
Note: *, ** indicate means statistically significantly different at the ten and five percent levels of probability, respectively.
Table 3 summarises the business arrangements of survey respondents in the two study regions. Overall, the highest percentage of respondents (47%) operated their businesses as sole proprietorships. This was followed by respondents whose businesses were identified as partnerships (19%), trusts (17%), close corporations (12%) and companies (five percent). In the Zululand region 39% of respondents identified their businesses as sole proprietorships, 21% as trusts and close corporations, 11% as companies, and eight percent as partnerships. In the Midlands region 55% of respondents identified their businesses as sole proprietorships, 29% as partnerships, 13% as trusts and three percent as close corporations.
355
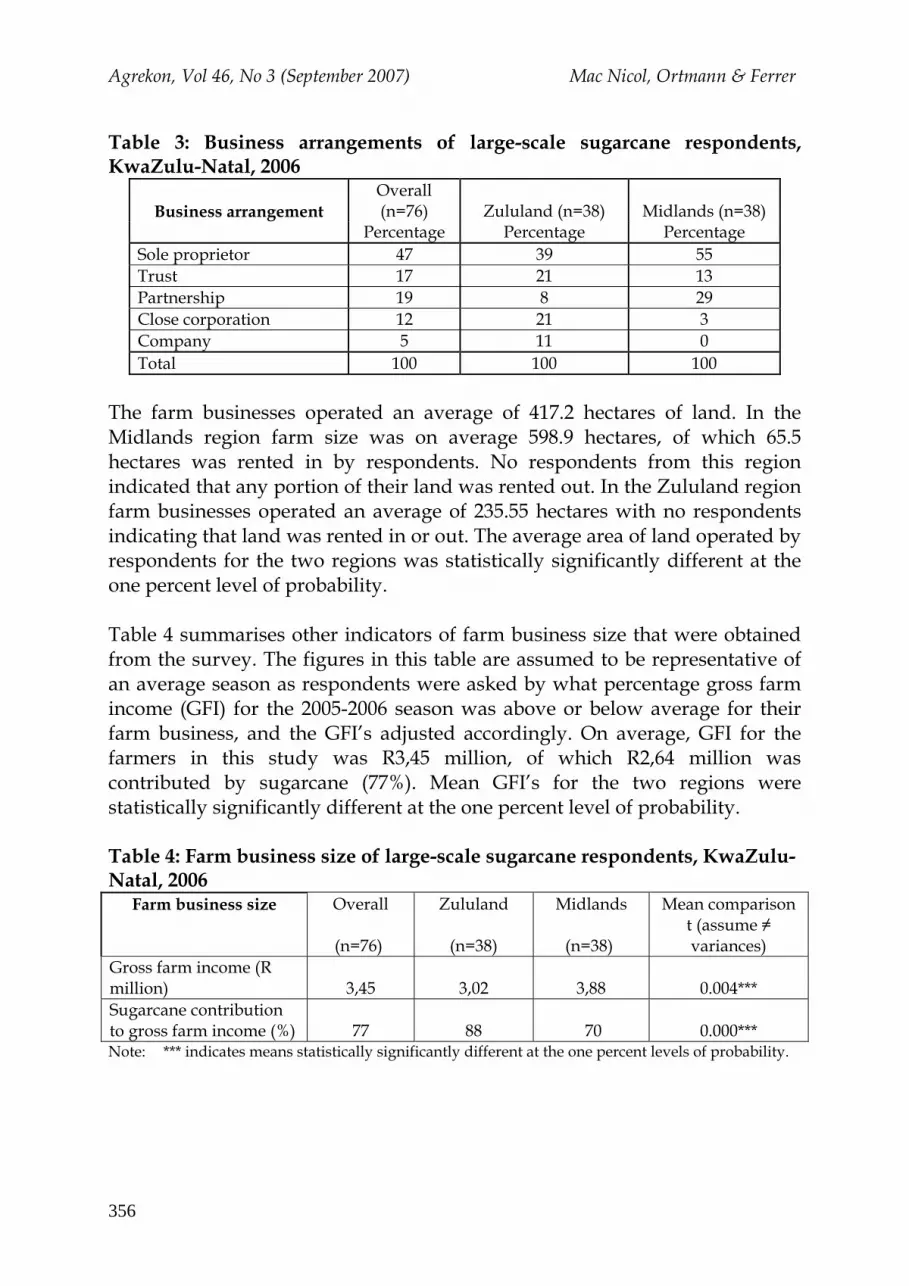
Agrekon, Vol 46, No 3 (September 2007) Mac Nicol, Ortmann & Ferrer Table 3: Business arrangements of large-scale sugarcane respondents, KwaZulu-Natal, 2006
Business arrangement Overall (n=76) Zululand (n=38) Midlands (n=38)
Percentage Percentage Percentage Sole proprietor 47 39 55 Trust 17 21 13 Partnership 19 8 29 Close corporation 12 21 3 Company 5 11 0 Total 100 100 100
The farm businesses operated an average of 417.2 hectares of land. In the Midlands region farm size was on average 598.9 hectares, of which 65.5 hectares was rented in by respondents. No respondents from this region indicated that any portion of their land was rented out. In the Zululand region farm businesses operated an average of 235.55 hectares with no respondents indicating that land was rented in or out. The average area of land operated by respondents for the two regions was statistically significantly different at the one percent level of probability. Table 4 summarises other indicators of farm business size that were obtained from the survey. The figures in this table are assumed to be representative of an average season as respondents were asked by what percentage gross farm income (GFI) for the 2005-2006 season was above or below average for their farm business, and the GFI’s adjusted accordingly. On average, GFI for the farmers in this study was R3,45 million, of which R2,64 million was contributed by sugarcane (77%). Mean GFI’s for the two regions were statistically significantly different at the one percent level of probability. Table 4: Farm business size of large-scale sugarcane respondents, KwaZulu-Natal, 2006
Farm business size Overall Zululand Midlands Mean comparison
(n=76) (n=38) (n=38) t (assume ≠ variances)
Gross farm income (R million) 3,45 3,02 3,88 0.004*** Sugarcane contribution to gross farm income (%) 77 88 70 0.000*** Note: *** indicates means statistically significantly different at the one percent levels of probability.
356

Agrekon, Vol 46, No 3 (September 2007) Mac Nicol, Ortmann & Ferrer 4. Sources of risk in agriculture A comprehensive review of the risk-related literature revealed much research on the sources of risk that affect agricultural producers. Based on this research, risk may be separated into two broad categories, namely business and financial risk. Business risk is often defined as being that risk which is inherent in the farming operation, and which is independent of the way in which the farm business is financed (Eidman, 1990; Hardaker et al., 2004). Financial risk is the added variability of net returns to owner’s equity that results from financial obligations associated with debt financing (Eidman, 1990; Hardaker et al., 2004). Several different methods of separating business and financial risks into sub-categories have been proposed and various dimensions amongst risk sources identified. Eidman (1990) identified five dimensions of risk and uncertainty, which included changes in the technological, climatic, social, political and economic environments. Hardaker et al. (2004) identify business and financial risk, and further categorised business risk into four sub-categories, namely production risk, price or market risk, institutional risk, and personal or human risk. Institutional risk comprises political risk, sovereign risk and relationship risk. Moschini and Hennessy (2001) propose a similar categorisation but include technological risk as a component of business risk. Sources of risk (especially business risk) will differ in perceived importance depending on the type of farming operation, and on the country in which a farm business operates, amongst other factors. Six past studies that identified the sources of risk perceived as important by farmers are summarised in Table 5. The range of various risk sources and their respective rankings that have been revealed by previous studies are evident in Table 5. The table summarises studies by Patrick et al. (1985), Ortmann et al. (1992), Swanepoel and Ortmann (1993), Bullock et al. (1994), Woodburn et al. (1995) and Stockil and Ortmann (1997). The four latest studies were conducted in South Africa with the remaining two performed in the USA. A large part of the variation in risk sources and their relative importance in each study may be attributed to differences between each analysis in terms of farm type, farm size, the prevailing economic and political environment, timing of the study and other factors such as geographical location.
357

Agrekon, Vol 46, No 3 (September 2007) Mac Nicol, Ortmann & Ferrer Table 5: Ranking of risk sources in previous studies
AUTHOR Stockil & Ortmann
(1997)
Woodburn et al. (1995)
Bullock et al. (1994)
Swanepoel & Ortmann
(1993)
Ortmann et al. (1992)
Patrick et al. (1985)
REGION South Africa
South Africa
South Africa
South Africa
USA USA
Risk Source: Variation in:
(n=112) (n=199) (n=67) (n=93) (n=80) (n=149)
Cost of inputs 1 1 4 5 6 3 Tax Legislation 2 11 11 Government regulations 10 16 14 5 12 Crop yield 8 2 3 13 2 Crop price 7 3 1 16 1 2 Livestock production 14 8 1 15 Livestock price 2 4,5 3 12 Cost of capital items 9 6 8 9 7 8 Interest rates 11 7 6 7 9 9 Illness or death of operator
10 10 6 3 7
Labour force 14 7 14 11 Rand exchange rate 5 Weather 2 2 1 Labour laws 4 12 5 11 17 Land reform 6 9 9 4 Marketing boards / commodity programs
13 18 16 15 4 10
Diseases and pests 5 Inflation (deflation) rate 3 World events 6 Use of leverage 13 Technology 15 13 12 8 15 Land rents 15 14 11 16 Credit availability 16 13 12 19 13 13 Family relationships 17 18 10 Unionization of labour 22 Political environment 10 Marketing costs 8 Note: Values represent the rankings of risk sources in order of perceived importance in each study.
Woodburn et al. (1995) and Stockil and Ortmann (1997) identified changes in costs of farm inputs as the source of risk that commercial farmers in KZN perceived as most important. In Stockil and Ortmann’s (1997) study this was followed by changes in tax legislation and variability in livestock prices, changes in labour legislation, changes in the Rand exchange rate, further land redistribution by government, variation in crop prices and variation in crop yields. According to Woodburn et al. (1995), the next most important sources
358

Agrekon, Vol 46, No 3 (September 2007) Mac Nicol, Ortmann & Ferrer of risk were perceived to be variability in crop yield, crop price, livestock price, changes in capital item costs, changes in interest rates, livestock production variability and changes in land policies. Bullock et al. (1994) and Ortmann et al. (1992) found that crop price variability was the most important perceived source of risk amongst commercial vegetable farmers in KZN and leading Cornbelt farmers in the USA, respectively. Bullock et al. (1994) found, in order of diminishing importance in rating, climatic variability, yield variation, changes in input costs, changes in labour legislation, interest rate variability, changes in the labour force, changes in the cost of capital items, and changes in land policy to be important. The ranking of climatic variability as high as second was attributed to the study area having been recently affected by drought. These three studies all used factor analysis to categorise risk sources into various dimensions or factors. Ortmann et al. (1992) found sources of risk for large US Cornbelt farmers other than crop price and yield variability to be important, namely injury, illness or death of the farm operator, changes in government commodity programs, changes in government environmental regulations, and changes in costs of inputs. Swanepoel and Ortmann (1993) ranked livestock production variability, rainfall variability, livestock price variability, the threat of land reform and changes in input costs as the five most important sources of risk amongst livestock farmers in the north-west Transvaal bushveld. Patrick et al. (1985) identified weather variability, crop price variability, costs of inputs and variation in the inflation (deflation) rate, and changing disease and pest pressure as sources of risk perceived as most important for the average farmer in the 1983 survey on which their analysis was based. Robison and Barry (1987) propose storage cost fluctuations and uncertain futures prices as additional sources of risk. Darroch (2001) found that crime was the most highly rated source of risk amongst game-based tourism operators in KZN. 4.1 Sources of risk as perceived by survey respondents Respondents were asked to rate sources of risk for their farm businesses, from a list of 14 potential sources, on a Likert-type scale of one to five – where five and one indicate “highly important” or “not particularly important”, respectively. Mean ratings of risk sources are shown in Table 6. Respondents could include additional risk sources (e.g., crime) that they deemed to be important; however, no additional risk sources were included. Respondents were also asked to rank their top five most important risk sources from the list. The table indicates the frequency with which risk sources were included in the respondents’ top-five list.
359
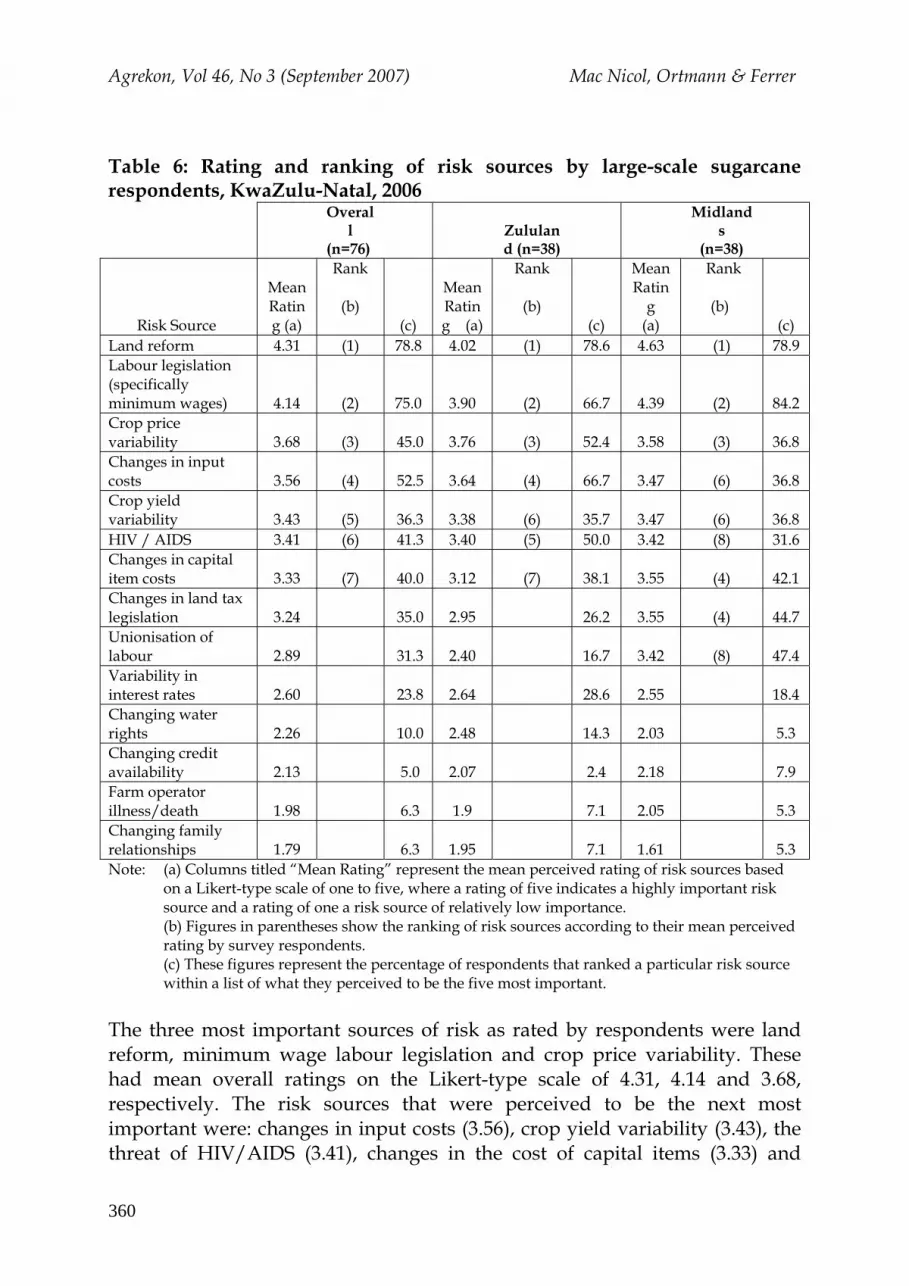
Agrekon, Vol 46, No 3 (September 2007) Mac Nicol, Ortmann & Ferrer Table 6: Rating and ranking of risk sources by large-scale sugarcane respondents, KwaZulu-Natal, 2006
Overall
(n=76) Zululand (n=38)
Midlands
(n=38)
Risk Source
Mean Rating (a)
Rank
(b) (c)
Mean Rating (a)
Rank
(b) (c)
Mean Ratin
g (a)
Rank
(b) (c)
Land reform 4.31 (1) 78.8 4.02 (1) 78.6 4.63 (1) 78.9 Labour legislation (specifically minimum wages) 4.14 (2) 75.0 3.90 (2) 66.7 4.39 (2) 84.2 Crop price variability 3.68 (3) 45.0 3.76 (3) 52.4 3.58 (3) 36.8 Changes in input costs 3.56 (4) 52.5 3.64 (4) 66.7 3.47 (6) 36.8 Crop yield variability 3.43 (5) 36.3 3.38 (6) 35.7 3.47 (6) 36.8 HIV / AIDS 3.41 (6) 41.3 3.40 (5) 50.0 3.42 (8) 31.6 Changes in capital item costs 3.33 (7) 40.0 3.12 (7) 38.1 3.55 (4) 42.1 Changes in land tax legislation 3.24
35.0 2.95 26.2 3.55 (4) 44.7
Unionisation of labour 2.89
31.3 2.40 16.7 3.42 (8) 47.4
Variability in interest rates 2.60
23.8 2.64 28.6 2.55 18.4
Changing water rights 2.26
10.0 2.48 14.3 2.03 5.3
Changing credit availability 2.13
5.0 2.07 2.4 2.18 7.9
Farm operator illness/death 1.98
6.3 1.9 7.1 2.05 5.3
Changing family relationships 1.79
6.3 1.95 7.1 1.61 5.3
Note: (a) Columns titled “Mean Rating” represent the mean perceived rating of risk sources based on a Likert-type scale of one to five, where a rating of five indicates a highly important risk source and a rating of one a risk source of relatively low importance. (b) Figures in parentheses show the ranking of risk sources according to their mean perceived rating by survey respondents. (c) These figures represent the percentage of respondents that ranked a particular risk source within a list of what they perceived to be the five most important.
The three most important sources of risk as rated by respondents were land reform, minimum wage labour legislation and crop price variability. These had mean overall ratings on the Likert-type scale of 4.31, 4.14 and 3.68, respectively. The risk sources that were perceived to be the next most important were: changes in input costs (3.56), crop yield variability (3.43), the threat of HIV/AIDS (3.41), changes in the cost of capital items (3.33) and
360

Agrekon, Vol 46, No 3 (September 2007) Mac Nicol, Ortmann & Ferrer changes in land tax legislation (3.24). Compared to previous SA and KZN studies, these findings confirm that government legislation risks (particularly relating to agrarian reform) have become increasingly important, relative to price and production risks. The remaining sources of risk included in the survey questionnaire (unionisation of labour, variability in interest rates, changing water rights, changing credit availability, farm operator illness or death, and changes in family relationships) received mean overall ratings of less than three, indicating that most respondents regarded them as less than moderately important. Concerns among respondents regarding the land reform process in South Africa have become more pertinent leading up to the time of this survey, considering threats by the SA government to discard the willing seller, willing buyer principle due to the perceived slow pace of land reform (Farmers’ Weekly, 2006; Democratic Alliance, 2006; Afrol News, 2006). Subsequent to the survey, the Restitution of Land Rights Act 22 of 1994 has been changed to allow the Minister of Land Affairs to expropriate land, for the purpose of awarding it to a claimant who is entitled to the restitution of a land right, on behalf of the state without being ordered to do so by the court. Effectively, should negotiations over a new market value for claimed land fail, the government will issue farmers with notices of appropriation allowing a period of 30 days for reconsideration, after which final letters of expropriation will be issued and farmers compensated at government-determined “market values” (Nailana and Gotte 2006). The Sectoral Determination (an amendment to the Basic Conditions of Employment Act 75 of 1997) required farmers to meet new minimum-wage requirements from March 2003 (Department of Labour, 2006), creating uncertainty amongst sugarcane producers and increasing the costs of managing permanent labour (i.e., those who work more than 27 hours per week). Many survey respondents speculated during the interview process that minimum wage legislation could be extended to include casual or part-time labour. Considering the relatively high demand for this form of labour in the sugar industry (during planting and harvesting) (SACGA, 2006), respondents consider the potential higher costs involved to pose the second most important threat to their business’ viability. Uncertainties, therefore, may be due to recent changes in land and labour legislation creating expectations that further changes are likely. Overall, 79% and 75% of respondents included land reform and minimum wage legislation, respectively, in their top five list of risk sources most important to their farm businesses. These two risk sources were considered to
361

Agrekon, Vol 46, No 3 (September 2007) Mac Nicol, Ortmann & Ferrer pose the greatest threat to farm businesses in both regions. Compared to findings of previous studies (Swanepoel and Ortmann (1993); Bullock et. al. (1994); Woodburn et. al. (1995); Stockil and Ortmann (1997); Hardman et. al. (2002)), these risk sources have become more prominent. Crop price variability was included in the top five list by 45% of all respondents. This may be explained by the high degree of fluctuation of the sugar price during the time leading up to the survey. Product price variability was previously found to be among the three most important perceived risk sources by Bullock et. al. (1994) and Woodburn et. al. (1995). Changes in input costs (53%) was the fourth most likely risk source to be included in the top five list. Compared to Midlands respondents, double the number of respondents from Zululand (67%) included changes in input costs as one of the five most important risks faced by their farm businesses, whereas more than double the number of respondents from the Midlands (47%) included the risk of unionisation of labour in their top five. This is most likely due to respondents in the Midlands region facing threats of labour union strike action shortly prior to the interview process. 4.2 Factor analysis of risk sources All 14 sources of risk initially considered were included in a factor analysis incorporating all sample respondents. The multivariate technique of Principal Component Analysis (PCA) was used to determine the number of factors to be included in the factor analysis. The main aim of PCA is to reduce the dimensionality of a data set, while retaining as much of the variation present in that data set as possible. This reduction is achieved by transforming data to a new set of variables, the principal components (PCs), which are orthogonal and ordered so that successive PCs contain diminishing proportions of the total variation present in the original data (Jolliffe, 1986: 1). Principal components were extracted using the covariance matrix. The first seven factors had initial eigenvalues greater than one and collectively explained 78% of the variance in all 14 risk sources. Ten of the 14 risk sources had factor loadings exceeding 0.40 in absolute value in more than one factor and therefore a varimax rotation with Kaiser Normalisation was used in order to obtain factors that are easier to interpret. The rescaled communalities for risk sources all exceeded 0.62 with the exception of changes in the cost of capital items (0.565), indicating that most of the variance in the perceived importance of risk sources was accounted for by the first seven common factors (Manly, 1986). These factors are shown in Table 7 and discussed in this section (risk sources with absolute factor loadings <0.40 are excluded from the table and equations below).
362

Agrekon, Vol 46, No 3 (September 2007) Mac Nicol, Ortmann & Ferrer Table 7: Rotated factor loadings(a) of risk sources and regional factor scores for large-scale sugarcane respondents, 2006 (n = 76) Factor 1 2 3 4 5 6 7 Initial Eigenvalue 3.208 2.401 2.297 1.922 1.442 1.141 1.008 Percentage variance explained (cumulative) 14.01 26.32 37.97 49.31 59.23 68.94 77.93
Sources of risk
Rescaled Communalities
(b) Land reform 0.681 -0.518 0.591 Labour legislation (minimum wages) 0.787 0.681 0.526 Crop price variability 0.666 0.781 Changes in input costs 0.640 -0.450 -0.482 Crop yield variability 0.884 0.926 HIV / AIDS 0.857 0.903 Changes in capital item costs 0.565 0.655 Changes in land tax legislation 0.863 0.916 Unionisation of labour 0.945 0.929 Variability in interest rates 0.629 0.542 0.432 Changing water rights 0.895 0.931 Changing credit availability 0.780 0.710 0.469 Farm operator illness/death 0.819 0.512 0.512 Changing family relationships 0.899 0.921 Zululand:
mean factor scores 0.146 -0.218 -0.245 -0.360 -0.047 0.090 0.113
KZN Midlands:
mean factor scores -0.146 0.218 0.245 0.360 0.047 -0.090 -0.113
Means comparison
t-test (significance) 0.207 0.057* 0.033** 0.001*** 0.688 0.435 0.329
Note: (a) Only factor loadings with an absolute value greater than 0.4 are shown. (b) That part of the variance of a risk source that is related to the common factors. *,**,*** indicate means statistically significantly different at the ten, five and one percent levels of probability, respectively.
363

Agrekon, Vol 46, No 3 (September 2007) Mac Nicol, Ortmann & Ferrer Factor 1: “Crop Gross Income Index” = (0.926) crop yield variability + (0.781) crop price variability – (0.518) land reform. Factor 1 indicates that the ratings for crop yield and price variability were positively correlated and displayed a high degree of variability. This factor suggests that respondents who are concerned with price and yield variability are less concerned with the threat posed by land reform and vice versa. This may be due to farmers with significant liquidity stress being less concerned about losing their farms to land reform. It may also suggest that some farmers have more confidence in the government’s land reform policies than others. A comparison of group means for this factor indicates that farmers in both regions are, on average, similarly concerned with Crop Gross Income variability. The reason that land reform seemed to be more of a concern for respondents from the Midlands (negative mean value) may be explained by a larger proportion of respondents from the Midlands (44.7%) facing land claims in line with the land redistribution programme, as compared to respondents from Zululand (9.5%). Mean factor scores for each region were estimated for each factor and comparisons conducted using a two-tailed t-test for independent samples, with equal variances not assumed (Steel and Torrie 1980). Factor 2: “Macroeconomic and Political Index” = (0.710) changing credit availability + (0.655) changing capital item costs + (0.591) land reform + (0.542) interest rate variability. Mean factor scores show that Midlands respondents are, on average, more concerned with the four “Macroeconomic and Political” risk sources. This can be explained by the larger number of land claims lodged for farmland in this area, and Midlands respondents had relatively more capital investment (e.g., for forestry enterprises) than respondents from Zululand. Forestry enterprises contribute, on average, 22% of gross farm income (GFI) in the Midlands compared to 0.5% in Zululand. Mean factor scores for the two regions are statistically significantly different at the 10% level of probability. Factor 3: “Legislation Index” = (0.916) changes in land tax legislation + (0.681) minimum wage legislation + (0.432) interest rate variability. Mean factor scores for the two regions in this factor (which are statistically significantly different at the five percent level of probability) show that the three risk sources with the highest factor loadings are, on average, more important to Midlands respondents. This could be due to these respondents employing larger labour forces on average, using extra labour capacity mainly for their timber enterprises. The fact that respondents in this area considered the threat of a land tax to be relatively more important than respondents from Zululand could be due to increased familiarity of this issue among Midlands
364

Agrekon, Vol 46, No 3 (September 2007) Mac Nicol, Ortmann & Ferrer respondents. The higher level of information on land tax issues by Midlands respondents can be attributed to legal precedents involving the initial implementation of this legislation in the region. Factor 4: “Labour and Inputs Index” = (0.929) labour unionisation + (0.526) minimum wage legislation – (0.450) changing input costs. The negative loading attached to changes in input costs suggests that respondents who are concerned with labour unionisation and minimum wage legislation are relatively less concerned with changes in input costs and vice versa. This may be due to substitution between labour and other inputs. Zululand respondents are, on average, more concerned with changing input costs due to the more intensive nature of sugarcane farming in the coastal region. Sugarcane is normally harvested annually in the Zululand region compared to every 20 months in the Midlands. On average, Midlands respondents consider minimum wage legislation and the threat of labour unionisation to be relatively more important. This can be attributed to respondents in the Midlands employing larger labour forces on average. Mean factor scores are statistically significantly different at the one percent level of probability. Factor 5: “Human Capital and Credit Access Index” = (0.903) HIV/AIDS + (0.512) illness or death of farm operator + (0.469) changes in credit availability. The fact that illness or death of the farm operator and changes in credit availability occur together in this factor may be due to the effects of the death of the farm operator on borrowing capacity. Mean factor scores were similar for the two study regions. The threat of HIV/AIDS, illness or death of the farm operator and changing credit availability are, therefore, on average, considered equally important by respondents from both regions. Factor 6: “Management Index” = (0.921) changes in family relationships + (0.512) illness or death of the farm operator. Respondents from both regions are, on average, equally concerned with the threats posed by changes in family relationships and the illness or death of the farm operator in this factor. Factor 7: “Water Rights Index” = (0.931) changes in water rights - (0.482) changes in input costs. Mean factor scores for the two regions in this factor show that average levels of concern over these two sources of risk are similar. This result is surprising because Zululand respondents are more reliant on irrigation. On average, Zululand respondents irrigated 60% of their sugarcane area compared to 11%
365

Agrekon, Vol 46, No 3 (September 2007) Mac Nicol, Ortmann & Ferrer by Midlands respondents, a difference statistically significant at the one percent level of probability. 5. Discussion and conclusions This study shows evidence of the risk sources that large-scale commercial sugarcane farmers in KwaZulu-Natal perceived to be most important in 2006. The sources of risk given the highest mean ratings were the threat of land reform, the uncertainty involved with minimum wage labour legislation and the variability of the sugar cane price, in that order. With the exception of crop price variability, the relative ranking of risk factors differs from those of previous studies. Clearly, this is due to farmers now facing a new set of challenges such as continued land reform, property rates legislation and minimum wage legislation, which did not feature prominently in the past. The fact that the perceived importance of risk sources within dimensions has changed compared to previous studies indicates that current government land and labour legislation in particular are raising levels of uncertainty amongst commercial sugarcane producers. Similar dimensions of risk to those identified in previous studies were found, although these categories were not identical. This may be attributed to the use of a different study population in this study and changes in the risk environment. Risk associated with decision making may be decreased by providing information that reduces the uncertainty of that decision. It is, therefore, important that the government’s land and labour legislation processes are conducted in as transparent a manner as possible, with improved information made available concerning specific objectives and timeframes. For the SA sugarcane industry to remain competitive in a continually globalising market environment, policy makers need to create an enabling business environment that will help to reduce risk and uncertainty for producers. Although recent developments regarding the land restitution process have offered farmers some certainty regarding the willing seller, willing buyer principle, further uncertainty has been created amongst farmers in terms of the accuracy and reliability of the government’s land valuation process. Government should also consider making labour legislation reform more flexible to avoid raising the relative costs associated with permanent labour to levels that encourage the use of substitutes such as machinery or casual labour. This has important implications for levels of unemployment. Farmers also need to develop risk management strategies that reduce the barriers to greater efficiency. For this to be realised, detailed knowledge of the prevailing risk environment is required which incorporates the various dimensions that exist between sources of risk. It is recommended that the SA Cane Growers’ Association should survey its
366

Agrekon, Vol 46, No 3 (September 2007) Mac Nicol, Ortmann & Ferrer members to establish farmers’ current information requirements, and to use their existing extension services to provide information to farmers on proposed policy changes as well as production and market information. This study has contributed toward ongoing research into risk management amongst commercial sugarcane farmers by describing the changes in perceived risk by a representative sample of large-scale producers in two regions of the SA sugar industry. It has identified that the threats posed by land reform and minimum wage legislation have become more relevant and are currently perceived to pose the greatest risks to business viability. Although the relative ranking of risk sources differs from previous research, information presented in this paper may also be relevant to other farm enterprise types since the dimensionality between risk sources was found to be comparable with that identified in previous research conducted amongst farmers from other industries. Further research could be aimed at quantifying the various responses to these sources of risk, and at identifying the extent to which producers consider multiple sources and responses to risk simultaneously. Acknowledgements The authors gratefully acknowledge funding from the National Research Foundation (NRF) in South Africa. The NRF supported this research under the “Making South African firms and farms competitive” project (GUN 2054254). All views, interpretations, recommendations and conclusions expressed in this paper are those of the authors and do not necessarily reflect those of the NRF. References Afrol News (2006). Renewed focus on South African land reform. http://www.afrol.com/articles/18026 (accessed on 05/12/2006). Barry PJ (2003). Major Ideas in the History of Agricultural Finance and Farm Management. Department of Applied Economics and Management, Cornell University, Ithaca, New York, USA. Boggess WG, Anaman KA & Hanson GD (1985). Importance, causes, and management responses to farm risks: Evidence from Florida and Alabama. Southern Journal of Agricultural Economics 17(2):105-116. Bullock WI, Ortmann GF & Levin JB (1994). Farmer characteristics, risk sources and managerial responses to risk in vegetable farming: Evidence from
367
Agrekon, Vol 46, No 3 (September 2007) Mac Nicol, Ortmann & Ferrer large- and small-scale commercial vegetable farmers in KwaZulu-Natal. Agrekon 33(3):103-112. Darroch MAG (2001). Risk management and Internet use by game-based tourism operators in KwaZulu-Natal, South Africa. Agrekon 40(4):563-572. Department of Labour (2006). http://www.lab.gov.org/ (accessed on 18/03/2006). Democratic Alliance (2006) http://www.da.org.za/DA/Site/Eng/campaigns/DOCS/DAPOS%20willingbuyer%20seller.doc(accessed on 05/12/2006). Eidman VT (1990). Quantifying and managing risk in Agriculture. Agrekon 29(1):11-23. Eweg MJ (2005). The changing profile of small-scale ‘sugarcane’ farmers in South Africa. South African Sugarcane Research Institute, Mount Edgecombe, South Africa. FAO (2006). Sugar Commodity Note: World sugar prices have increased significantly since FAO’s preliminary forecast in December 2005. http://www.fao.org/ES/ESC/en/20953/21032/highlight_108726en_p.html. (accessed on 05/12/2006). Farmer’s Weekly (2006). Officials hatch secret land plan. 13 October 2006:24-27. Ferrer SRD, Hoag DL & Nieuwoudt WL (1997). Risk preferences of KwaZulu-Natal commercial sugar cane farmers. Agrekon 36(4):484-491. Hardaker JB, Huirne RBM, Anderson JR & Lein G (2004). Coping with Risk in Agriculture (Second Edition). CABI Publishing, Wallingford, Oxfordshire, UK. Hardman PA, Darroch MAG & Ortmann GF (2002). Improving cooperation to make the South African fresh apple export value chain more competitive. Journal on Chain and Network Science 2(1):61-72.
368

Agrekon, Vol 46, No 3 (September 2007) Mac Nicol, Ortmann & Ferrer Illovo Sugar (2006). Interim Report for the six months ended 30 September 2006, Durban. http://www.illovosugar.com/financial/pdf2006/Interim/Interim%20Report.pdf(accessed on 05/12/2006). Jolliffe IT (1986). Principal Component Analysis. Springer-Verlag New York Inc., New York. Manly BFJ (1986). Multivariate Statistical Methods: A Primer. JW Arrowsmith Ltd, Bristol. Moschini G & Hennessy DA (2001). Uncertainty, risk aversion, and risk management for agricultural producers. In: Gardner BL & Rausser GL (Eds), Handbook of Agricultural Economics. Elsevier-North-Holland, Amsterdam, Holland. Nailana K & Gotte S (2006). Expropriation – your questions answered. AgriReview, Standard Bank, fourth quarter 2006. http://www.standardbank.co.za/za/vgn/images/portal/cit_4931/41/47/24740676aGRIq42006.pdf (accessed on 23/03/07). Ortmann GF (2005). Promoting the competitiveness of South African agriculture in a dynamic economic and political environment. Agrekon 44(3):286-320. Ortmann G & Machethe C (2003). Problems and opportunities in South African agriculture. In: Nieuwoudt WL & Groenewald JA (Eds), The Challenge of Change: Agriculture, Land and the South African Economy. University of Natal Press, Pietermaritzburg:47-62. Ortmann GF, Patrick GF, Musser WN & Doster DH (1992). Sources and management of risk: Evidence from leading Cornbelt farmers in the USA. Agrekon 31(4):216-221. Patrick G, Wilson P, Barry P, Boggess W & Young D (1985). Risk perceptions and management responses: Producer generated hypotheses for risk modeling. Southern Journal of Agricultural Economics 17:231-238. Read D, Loewenstein G & Rabin M (1999). Choice bracketing. Journal of Risk and Uncertainty 19:171-197.
369

Agrekon, Vol 46, No 3 (September 2007) Mac Nicol, Ortmann & Ferrer Robison LJ & Barry PJ (1987). The Competitive Firm’s Response to Risk. Macmillan Publishing Company, New York, USA. SACGA (SA Cane Growers’ Association) (2006). http://www.sacanegrowers.co.za (accessed on 14/03/2006). SASA (SA Sugar Association) (2006). http://www.sasa.org (accessed on 14/03/2006). STATSSA (Statistics South Africa) (2002). Census of commercial agriculture, Report No. 11-02-01 (2002). http://www.statssa.gov.za/publications/Report-11-02-012002.pdf (accessed on 01/11/2006). Steel RGD & Torrie JH (1980). Principals and Procedures of Statistics: A Biometrical Approach (Second edition). McGraw-Hill Book Company. Stockil RC & Ortmann GF (1997). Perceptions of risk among commercial farmers in KwaZulu-Natal in a changing economic environment. Agrekon 36(2):139-156. Swanepoel V & Ortmann GF (1993). Sources and management of risk in extensive livestock farming in the North-Western Transvaal Bushveld. Agrekon 32(4):196-200. Woodburn MR, Ortmann GF & Levin JB (1995). Sources and management of risk: Evidence from commercial farmers in KwaZulu-Natal. South African Journal of Economic and Management Sciences 17(summer 1995):46-63.
370