Pedogeochemical mapping of Al, Ba, Pb, Ti and V in surface soils of Barcelona Province (Catalonia,...
12
Pedogeochemical mapping of Al, Ba, Pb, Ti and V in surface soils of Barcelona Province (Catalonia, NE Spain): Relationships with soil physicochemical properties J. Bech a, ⁎, F. Reverter b , P. Tume c , P. Sanchez b , L. Longan a , J. Bech d , T. Oliver a a Soil Science Chair. Faculty of Biology, University of Barcelona, Avda. Diagonal 645 (08028), Barcelona, Spain b Department of Statistics. Faculty of Biology, University of Barcelona, Avda. Diagonal 645 (08028), Barcelona, Spain c Facultad de Ingeniería, Universidad Católica de la Santísima Concepción, Casilla 297, Concepción, Chile d Department of Astronomy and Meteorology, Faculty of Physics, University of Barcelona, Avda. Diagonal 647 (08028), Barcelona, Spain abstract article info Article history: Received 30 April 2010 Accepted 5 October 2010 Available online 16 November 2010 Keywords: Soils Aluminium Barium Lead Titanium Vanadium Barcelona province Pedogeochemical maps We estimated the concentrations and distributions of Al, Ba, Pb, Ti and V in surface soils of the Barcelona Province (NE Spain). This province covers 7731 km 2 . The geology is varied: granites and Paleozoic shales predominate in SE–E and Mesozoic and Cenozoic limestones, dolomites, marlstones, gypsum and sandstones in the remainder of the studied area. In all, 316 topsoil samples (0–20 cm) were collected at 5 km intervals on a regular grid. General soil properties were analyzed by standard methods. Aqua regia digests (DIN 38414-S7) of Al, Ba, Pb, Ti and V were determined by Inductively Coupled Plasma Spectrometry. Statistical data treatment was carried out using R statistical project. We applied Exploratory Data Analysis (EDA) techniques to statistically describe the data. Analytical data is represented using growing dot maps. The limits for the cartographic classes were chosen by the percentile method. We compared the behaviour of Al, Ba, Pb, Ti and V in different data sub-sets (by districts, texture, pH, organic carbon and CaCO 3 ). Some results are: Al mg kg -1 min 4410, max 194,786, mean 18,146, sd 12,112, med 16,273; Ba mg kg -1 min 7.3, max 1709, mean 128, sd 149, med 91.7; Pb mg kg -1 min 2.8, max 486, mean 52.2, sd 46.3, med 46; Ti mg kg -1 min 11.6, max 3540, mean 268, sd 421, med 132 and V mg kg -1 min 2.2, max 289, mean 31.4, sd 25.7 and med 26. The highest mean values of Ba, Pb and V correspond to the Barcelonés district, which has mainly urban and industrial influences. The highest Al value is found in Garraf district, with abundant Luvisols located in karst landscape. Titanium highest mean value is found in the Maresme district, over a granitic batholite. The combination of EDA and pedogeochemical mapping is a useful tool for estimating the baseline and distribution of potentially toxic elements. © 2010 Published by Elsevier B.V. 1. Introduction Soils are essential components of the environment, the basis of terrestrial ecosystems and a crossroads for biogeochemical cycles at the biosphere–lithosphere interface. The content and distribution of chemical elements in soils depend on rock composition, climate, topography, soil type and soil use (Bech et al., 2008). Therefore there is a large variability and the global reference values do not reflect true local conditions. Pedogeochemical mapping is used to give informa- tion about the concentration and distribution of chemical elements in soil. Pedogeochemical maps historically have been used in different ways: before 1970 they were focused on soil taxonomy or agronomic characteristics (i.e.: organic matter content, fertility—N, P, K, Ca-levels for crops productivity, deficiencies, etc.) and in geochemistry exploration for the location of economical mineral deposits. After 1970 this spectrum of priorities was enlarged to include environmen- tal assessment, soil pollution and subsequent health risks in the urban environment as well as in the countryside. Some examples of geochemical maps for use in environmental studies are: Shacklette and Boerngen (1984), Mc Grath and Loveland (1992), Gustavsson et al. (2001), Tarvainen and Kallio (2002), Reimann et al. (2003), Bounessah and Atkin (2003), Horckmans et al. (2005), Salminen (2005), Cicchella et al. (2005), Ujiie-Mikoshiba et al. (2006), De Vivo et al. (2008a,b), Bech et al. (2005), Bech et al. (2006), Bech et al. (2008), Albanese et al. (2008), Zhang et al. (2008). In a previous work Bech et al. (2008) was studied the concentration and mapping of Cr, Ni and Cu in surface soils of the Barcelona province (Catalonia, NE Spain) and their relationships with soil parameters and administrative- geographic districts. The aims of the present paper were to: estimate the concentration and spatial distribution of Al, Ba, Pb, Ti and V in soils of the Barcelona Province (Catalonia, NE, Spain), its relationships with districts and some soil properties (texture, pH, organic carbon and CaCO 3 ). Journal of Geochemical Exploration 109 (2011) 26–37 ⁎ Corresponding author. Tel.: +34 93 410 70 93; fax: +34 93 411 28 42. E-mail address: [email protected] (J. Bech). 0375-6742/$ – see front matter © 2010 Published by Elsevier B.V. doi:10.1016/j.gexplo.2010.10.002 Contents lists available at ScienceDirect Journal of Geochemical Exploration journal homepage: www.elsevier.com/locate/jgeoexp
-
Upload
independent -
Category
Documents
-
view
0 -
download
0
Transcript of Pedogeochemical mapping of Al, Ba, Pb, Ti and V in surface soils of Barcelona Province (Catalonia,...

Journal of Geochemical Exploration 109 (2011) 26–37
Contents lists available at ScienceDirect
Journal of Geochemical Exploration
j ourna l homepage: www.e lsev ie r.com/ locate / jgeoexp
Pedogeochemical mapping of Al, Ba, Pb, Ti and V in surface soils of BarcelonaProvince (Catalonia, NE Spain): Relationships with soil physicochemical properties
J. Bech a,⁎, F. Reverter b, P. Tume c, P. Sanchez b, L. Longan a, J. Bech d, T. Oliver a
a Soil Science Chair. Faculty of Biology, University of Barcelona, Avda. Diagonal 645 (08028), Barcelona, Spainb Department of Statistics. Faculty of Biology, University of Barcelona, Avda. Diagonal 645 (08028), Barcelona, Spainc Facultad de Ingeniería, Universidad Católica de la Santísima Concepción, Casilla 297, Concepción, Chiled Department of Astronomy and Meteorology, Faculty of Physics, University of Barcelona, Avda. Diagonal 647 (08028), Barcelona, Spain
⁎ Corresponding author. Tel.: +34 93 410 70 93; faxE-mail address: [email protected] (J. Bec
0375-6742/$ – see front matter © 2010 Published by Edoi:10.1016/j.gexplo.2010.10.002
a b s t r a c t
a r t i c l e i n f oArticle history:Received 30 April 2010Accepted 5 October 2010Available online 16 November 2010
Keywords:SoilsAluminiumBariumLeadTitaniumVanadiumBarcelona provincePedogeochemical maps
We estimated the concentrations and distributions of Al, Ba, Pb, Ti and V in surface soils of the BarcelonaProvince (NE Spain). This province covers 7731 km2. The geology is varied: granites and Paleozoic shalespredominate in SE–E and Mesozoic and Cenozoic limestones, dolomites, marlstones, gypsum and sandstonesin the remainder of the studied area. In all, 316 topsoil samples (0–20 cm) were collected at 5 km intervals ona regular grid. General soil properties were analyzed by standard methods. Aqua regia digests (DIN 38414-S7)of Al, Ba, Pb, Ti and V were determined by Inductively Coupled Plasma Spectrometry.Statistical data treatment was carried out using R statistical project. We applied Exploratory Data Analysis(EDA) techniques to statistically describe the data. Analytical data is represented using growing dot maps. Thelimits for the cartographic classes were chosen by the percentile method. We compared the behaviour of Al,Ba, Pb, Ti and V in different data sub-sets (by districts, texture, pH, organic carbon and CaCO3).Some results are: Al mg kg−1 min 4410, max 194,786, mean 18,146, sd 12,112, med 16,273; Ba mg kg−1 min7.3, max 1709, mean 128, sd 149, med 91.7; Pb mg kg−1 min 2.8, max 486, mean 52.2, sd 46.3, med 46; Timg kg−1 min 11.6, max 3540, mean 268, sd 421, med 132 and V mg kg−1 min 2.2, max 289, mean 31.4, sd25.7 and med 26.The highest mean values of Ba, Pb and V correspond to the Barcelonés district, which has mainly urban andindustrial influences. The highest Al value is found in Garraf district, with abundant Luvisols located in karstlandscape. Titanium highest mean value is found in the Maresme district, over a granitic batholite.The combination of EDA and pedogeochemical mapping is a useful tool for estimating the baseline anddistribution of potentially toxic elements.
: +34 93 411 28 42.h).
lsevier B.V.
© 2010 Published by Elsevier B.V.
1. Introduction
Soils are essential components of the environment, the basis ofterrestrial ecosystems and a crossroads for biogeochemical cycles atthe biosphere–lithosphere interface. The content and distribution ofchemical elements in soils depend on rock composition, climate,topography, soil type and soil use (Bech et al., 2008). Therefore thereis a large variability and the global reference values do not reflect truelocal conditions. Pedogeochemical mapping is used to give informa-tion about the concentration and distribution of chemical elements insoil. Pedogeochemical maps historically have been used in differentways: before 1970 they were focused on soil taxonomy or agronomiccharacteristics (i.e.: organic matter content, fertility—N, P, K, Ca-levelsfor crops productivity, deficiencies, etc.) and in geochemistry
exploration for the location of economical mineral deposits. After1970 this spectrum of priorities was enlarged to include environmen-tal assessment, soil pollution and subsequent health risks in the urbanenvironment as well as in the countryside. Some examples ofgeochemical maps for use in environmental studies are: Shackletteand Boerngen (1984), Mc Grath and Loveland (1992), Gustavsson etal. (2001), Tarvainen and Kallio (2002), Reimann et al. (2003),Bounessah and Atkin (2003), Horckmans et al. (2005), Salminen(2005), Cicchella et al. (2005), Ujiie-Mikoshiba et al. (2006), De Vivoet al. (2008a,b), Bech et al. (2005), Bech et al. (2006), Bech et al.(2008), Albanese et al. (2008), Zhang et al. (2008). In a previous workBech et al. (2008)was studied the concentration andmapping of Cr, Niand Cu in surface soils of the Barcelona province (Catalonia, NE Spain)and their relationships with soil parameters and administrative-geographic districts.
The aims of the present paper were to: estimate the concentrationand spatial distribution of Al, Ba, Pb, Ti and V in soils of the BarcelonaProvince (Catalonia, NE, Spain), its relationships with districts andsome soil properties (texture, pH, organic carbon and CaCO3).
27J. Bech et al. / Journal of Geochemical Exploration 109 (2011) 26–37
2. Materials and methods
2.1. Site description
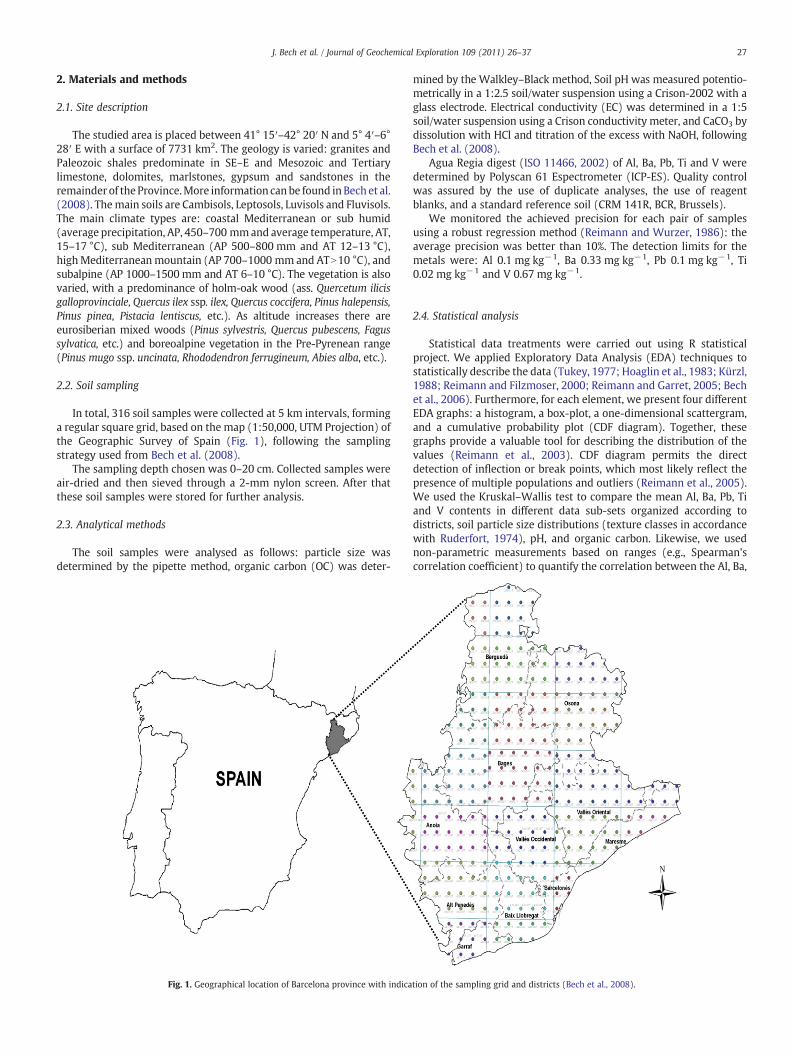
The studied area is placed between 41° 15′–42° 20′ N and 5° 4′–6°28′ E with a surface of 7731 km2. The geology is varied: granites andPaleozoic shales predominate in SE–E and Mesozoic and Tertiarylimestone, dolomites, marlstones, gypsum and sandstones in theremainder of the Province.More information canbe found inBech et al.(2008). Themain soils are Cambisols, Leptosols, Luvisols and Fluvisols.The main climate types are: coastal Mediterranean or sub humid(average precipitation, AP, 450–700 mmand average temperature, AT,15–17 °C), sub Mediterranean (AP 500–800 mm and AT 12–13 °C),highMediterraneanmountain (AP 700–1000 mm and ATN10 °C), andsubalpine (AP 1000–1500mm and AT 6–10 °C). The vegetation is alsovaried, with a predominance of holm-oak wood (ass. Quercetum ilicisgalloprovinciale, Quercus ilex ssp. ilex, Quercus coccifera, Pinus halepensis,Pinus pinea, Pistacia lentiscus, etc.). As altitude increases there areeurosiberian mixed woods (Pinus sylvestris, Quercus pubescens, Fagussylvatica, etc.) and boreoalpine vegetation in the Pre-Pyrenean range(Pinus mugo ssp. uncinata, Rhododendron ferrugineum, Abies alba, etc.).
2.2. Soil sampling
In total, 316 soil samples were collected at 5 km intervals, forminga regular square grid, based on the map (1:50,000, UTM Projection) ofthe Geographic Survey of Spain (Fig. 1), following the samplingstrategy used from Bech et al. (2008).
The sampling depth chosen was 0–20 cm. Collected samples wereair-dried and then sieved through a 2-mm nylon screen. After thatthese soil samples were stored for further analysis.
2.3. Analytical methods
The soil samples were analysed as follows: particle size wasdetermined by the pipette method, organic carbon (OC) was deter-
Fig. 1. Geographical location of Barcelona province with indica
mined by the Walkley–Black method, Soil pH was measured potentio-metrically in a 1:2.5 soil/water suspension using a Crison-2002 with aglass electrode. Electrical conductivity (EC) was determined in a 1:5soil/water suspension using a Crison conductivity meter, and CaCO3 bydissolution with HCl and titration of the excess with NaOH, followingBech et al. (2008).
Agua Regia digest (ISO 11466, 2002) of Al, Ba, Pb, Ti and V weredetermined by Polyscan 61 Espectrometer (ICP-ES). Quality controlwas assured by the use of duplicate analyses, the use of reagentblanks, and a standard reference soil (CRM 141R, BCR, Brussels).
We monitored the achieved precision for each pair of samplesusing a robust regression method (Reimann and Wurzer, 1986): theaverage precision was better than 10%. The detection limits for themetals were: Al 0.1 mg kg−1, Ba 0.33 mg kg−1, Pb 0.1 mg kg−1, Ti0.02 mg kg−1 and V 0.67 mg kg−1.
2.4. Statistical analysis
Statistical data treatments were carried out using R statisticalproject. We applied Exploratory Data Analysis (EDA) techniques tostatistically describe the data (Tukey, 1977; Hoaglin et al., 1983; Kürzl,1988; Reimann and Filzmoser, 2000; Reimann and Garret, 2005; Bechet al., 2006). Furthermore, for each element, we present four differentEDA graphs: a histogram, a box-plot, a one-dimensional scattergram,and a cumulative probability plot (CDF diagram). Together, thesegraphs provide a valuable tool for describing the distribution of thevalues (Reimann et al., 2003). CDF diagram permits the directdetection of inflection or break points, which most likely reflect thepresence of multiple populations and outliers (Reimann et al., 2005).We used the Kruskal–Wallis test to compare the mean Al, Ba, Pb, Tiand V contents in different data sub-sets organized according todistricts, soil particle size distributions (texture classes in accordancewith Ruderfort, 1974), pH, and organic carbon. Likewise, we usednon-parametric measurements based on ranges (e.g., Spearman'scorrelation coefficient) to quantify the correlation between the Al, Ba,
tion of the sampling grid and districts (Bech et al., 2008).
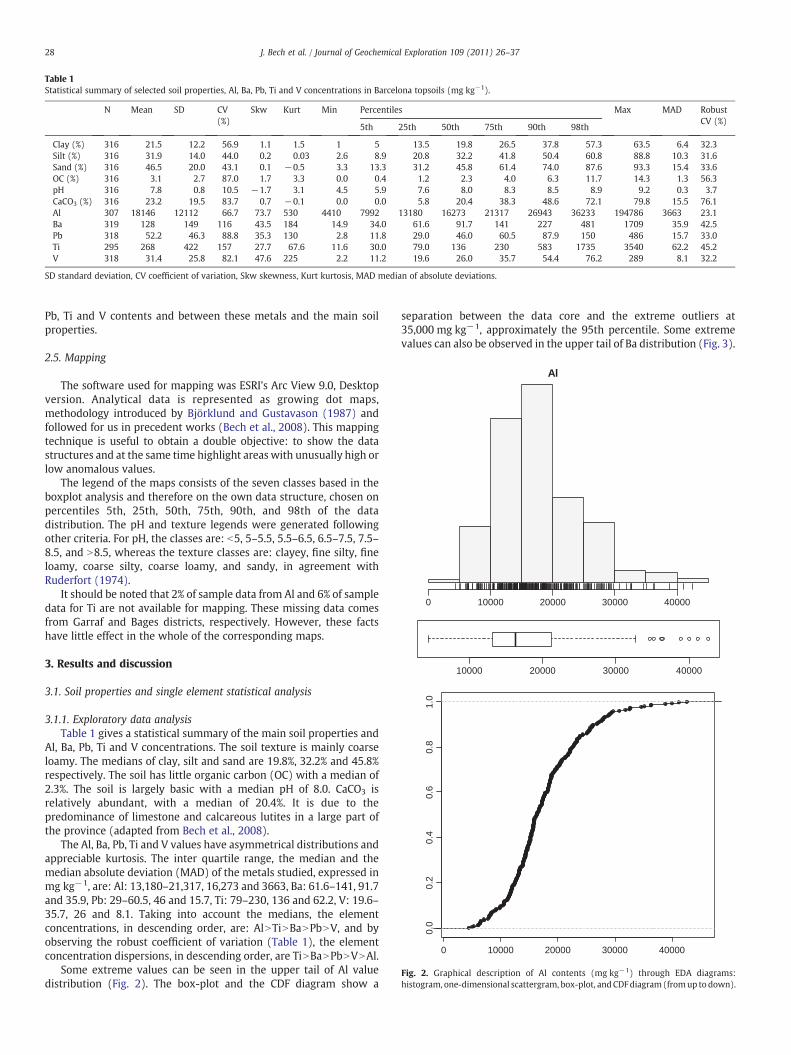
Table 1Statistical summary of selected soil properties, Al, Ba, Pb, Ti and V concentrations in Barcelona topsoils (mg kg−1).
N Mean SD CV(%)
Skw Kurt Min Percentiles Max MAD RobustCV (%)
5th 25th 50th 75th 90th 98th
Clay (%) 316 21.5 12.2 56.9 1.1 1.5 1 5 13.5 19.8 26.5 37.8 57.3 63.5 6.4 32.3Silt (%) 316 31.9 14.0 44.0 0.2 0.03 2.6 8.9 20.8 32.2 41.8 50.4 60.8 88.8 10.3 31.6Sand (%) 316 46.5 20.0 43.1 0.1 −0.5 3.3 13.3 31.2 45.8 61.4 74.0 87.6 93.3 15.4 33.6OC (%) 316 3.1 2.7 87.0 1.7 3.3 0.0 0.4 1.2 2.3 4.0 6.3 11.7 14.3 1.3 56.3pH 316 7.8 0.8 10.5 −1.7 3.1 4.5 5.9 7.6 8.0 8.3 8.5 8.9 9.2 0.3 3.7CaCO3 (%) 316 23.2 19.5 83.7 0.7 −0.1 0.0 0.0 5.8 20.4 38.3 48.6 72.1 79.8 15.5 76.1Al 307 18146 12112 66.7 73.7 530 4410 7992 13180 16273 21317 26943 36233 194786 3663 23.1Ba 319 128 149 116 43.5 184 14.9 34.0 61.6 91.7 141 227 481 1709 35.9 42.5Pb 318 52.2 46.3 88.8 35.3 130 2.8 11.8 29.0 46.0 60.5 87.9 150 486 15.7 33.0Ti 295 268 422 157 27.7 67.6 11.6 30.0 79.0 136 230 583 1735 3540 62.2 45.2V 318 31.4 25.8 82.1 47.6 225 2.2 11.2 19.6 26.0 35.7 54.4 76.2 289 8.1 32.2
SD standard deviation, CV coefficient of variation, Skw skewness, Kurt kurtosis, MAD median of absolute deviations.
Al
0 10000 20000 30000 40000
10000 20000 30000 40000
0 10000 20000 30000 40000
0.0
0.2
0.4
0.6
0.8
1.0
Fig. 2. Graphical description of Al contents (mg kg−1) through EDA diagrams:histogram, one-dimensional scattergram, box-plot, andCDFdiagram (fromup to down).
28 J. Bech et al. / Journal of Geochemical Exploration 109 (2011) 26–37
Pb, Ti and V contents and between these metals and the main soilproperties.
2.5. Mapping
The software used for mapping was ESRI's Arc View 9.0, Desktopversion. Analytical data is represented as growing dot maps,methodology introduced by Björklund and Gustavason (1987) andfollowed for us in precedent works (Bech et al., 2008). This mappingtechnique is useful to obtain a double objective: to show the datastructures and at the same time highlight areas with unusually high orlow anomalous values.
The legend of the maps consists of the seven classes based in theboxplot analysis and therefore on the own data structure, chosen onpercentiles 5th, 25th, 50th, 75th, 90th, and 98th of the datadistribution. The pH and texture legends were generated followingother criteria. For pH, the classes are: b5, 5–5.5, 5.5–6.5, 6.5–7.5, 7.5–8.5, and N8.5, whereas the texture classes are: clayey, fine silty, fineloamy, coarse silty, coarse loamy, and sandy, in agreement withRuderfort (1974).
It should be noted that 2% of sample data from Al and 6% of sampledata for Ti are not available for mapping. These missing data comesfrom Garraf and Bages districts, respectively. However, these factshave little effect in the whole of the corresponding maps.
3. Results and discussion
3.1. Soil properties and single element statistical analysis
3.1.1. Exploratory data analysisTable 1 gives a statistical summary of the main soil properties and
Al, Ba, Pb, Ti and V concentrations. The soil texture is mainly coarseloamy. The medians of clay, silt and sand are 19.8%, 32.2% and 45.8%respectively. The soil has little organic carbon (OC) with a median of2.3%. The soil is largely basic with a median pH of 8.0. CaCO3 isrelatively abundant, with a median of 20.4%. It is due to thepredominance of limestone and calcareous lutites in a large part ofthe province (adapted from Bech et al., 2008).
The Al, Ba, Pb, Ti and V values have asymmetrical distributions andappreciable kurtosis. The inter quartile range, the median and themedian absolute deviation (MAD) of the metals studied, expressed inmg kg−1, are: Al: 13,180–21,317, 16,273 and 3663, Ba: 61.6–141, 91.7and 35.9, Pb: 29–60.5, 46 and 15.7, Ti: 79–230, 136 and 62.2, V: 19.6–35.7, 26 and 8.1. Taking into account the medians, the elementconcentrations, in descending order, are: AlNTiNBaNPbNV, and byobserving the robust coefficient of variation (Table 1), the elementconcentration dispersions, in descending order, are TiNBaNPbNVNAl.
Some extreme values can be seen in the upper tail of Al valuedistribution (Fig. 2). The box-plot and the CDF diagram show a
separation between the data core and the extreme outliers at35,000 mg kg−1, approximately the 95th percentile. Some extremevalues can also be observed in the upper tail of Ba distribution (Fig. 3).
Ba
0 200 400 600 800 1000 1200
0 200 400 600 800 1000 1200
0 200 400 600 800 1000 1200
0.0
0.2
0.4
0.6
0.8
1.0
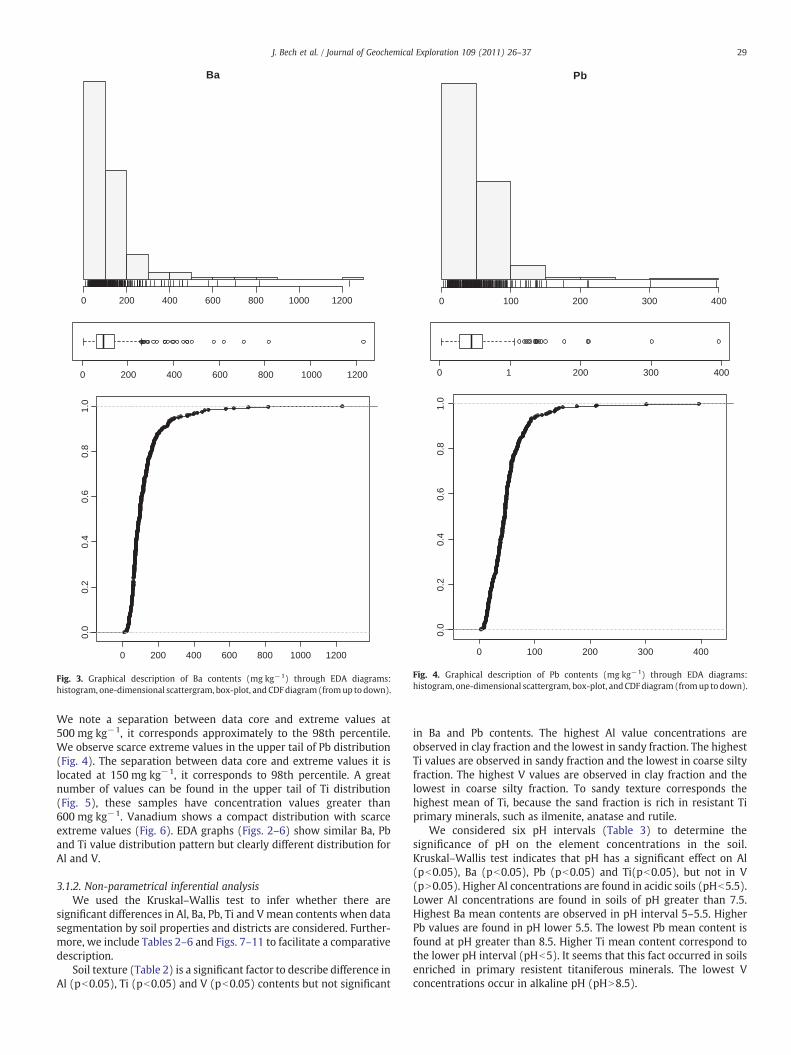
Fig. 3. Graphical description of Ba contents (mg kg−1) through EDA diagrams:histogram, one-dimensional scattergram, box-plot, andCDFdiagram (fromup to down).
Pb
0 100 200 300 400
0 1 200 300 400
0 100 200 300 400
0.0
0.2
0.4
0.6
0.8
1.0
Fig. 4. Graphical description of Pb contents (mg kg−1) through EDA diagrams:histogram, one-dimensional scattergram, box-plot, andCDFdiagram (fromup to down).
29J. Bech et al. / Journal of Geochemical Exploration 109 (2011) 26–37
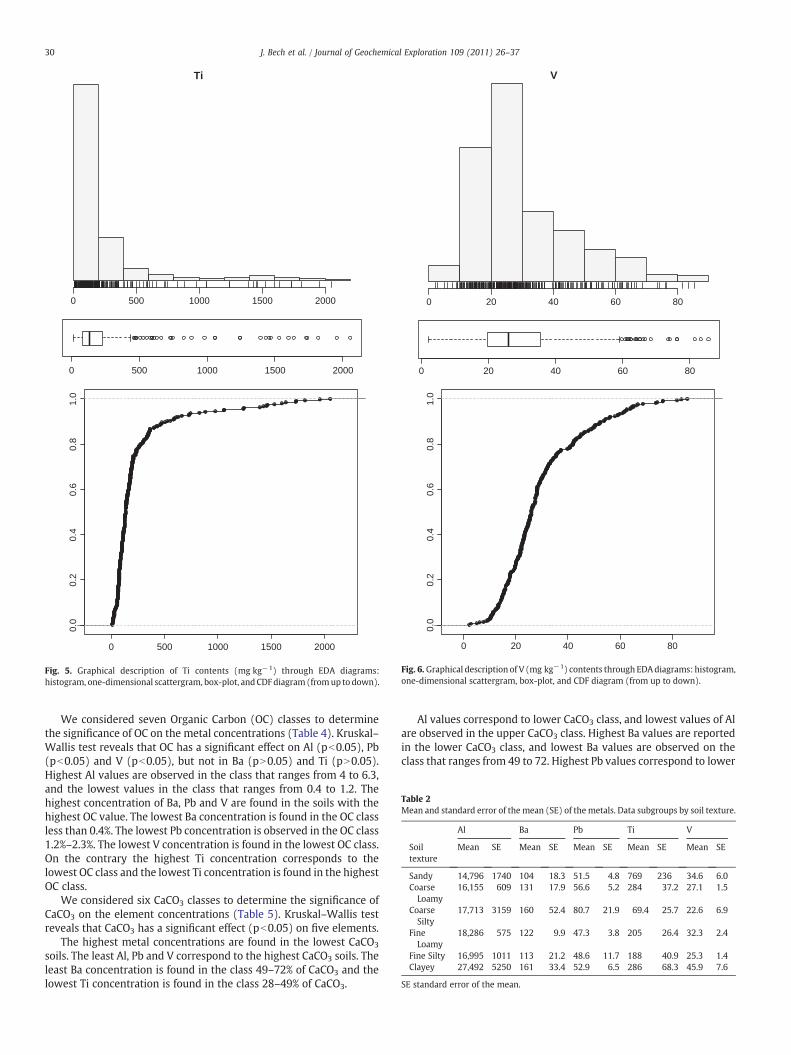
We note a separation between data core and extreme values at500 mg kg−1, it corresponds approximately to the 98th percentile.We observe scarce extreme values in the upper tail of Pb distribution(Fig. 4). The separation between data core and extreme values it islocated at 150 mg kg−1, it corresponds to 98th percentile. A greatnumber of values can be found in the upper tail of Ti distribution(Fig. 5), these samples have concentration values greater than600 mg kg−1. Vanadium shows a compact distribution with scarceextreme values (Fig. 6). EDA graphs (Figs. 2–6) show similar Ba, Pband Ti value distribution pattern but clearly different distribution forAl and V.
3.1.2. Non-parametrical inferential analysisWe used the Kruskal–Wallis test to infer whether there are
significant differences in Al, Ba, Pb, Ti and V mean contents when datasegmentation by soil properties and districts are considered. Further-more, we include Tables 2–6 and Figs. 7–11 to facilitate a comparativedescription.
Soil texture (Table 2) is a significant factor to describe difference inAl (pb0.05), Ti (pb0.05) and V (pb0.05) contents but not significant
in Ba and Pb contents. The highest Al value concentrations areobserved in clay fraction and the lowest in sandy fraction. The highestTi values are observed in sandy fraction and the lowest in coarse siltyfraction. The highest V values are observed in clay fraction and thelowest in coarse silty fraction. To sandy texture corresponds thehighest mean of Ti, because the sand fraction is rich in resistant Tiprimary minerals, such as ilmenite, anatase and rutile.
We considered six pH intervals (Table 3) to determine thesignificance of pH on the element concentrations in the soil.Kruskal–Wallis test indicates that pH has a significant effect on Al(pb0.05), Ba (pb0.05), Pb (pb0.05) and Ti(pb0.05), but not in V(pN0.05). Higher Al concentrations are found in acidic soils (pHb5.5).Lower Al concentrations are found in soils of pH greater than 7.5.Highest Ba mean contents are observed in pH interval 5–5.5. HigherPb values are found in pH lower 5.5. The lowest Pb mean content isfound at pH greater than 8.5. Higher Ti mean content correspond tothe lower pH interval (pHb5). It seems that this fact occurred in soilsenriched in primary resistent titaniferous minerals. The lowest Vconcentrations occur in alkaline pH (pHN8.5).
Ti
0 500 1000 1500 2000
0 500 1000 1500 2000
0 500 1000 1500 2000
0.0
0.2
0.4
0.6
0.8
1.0
Fig. 5. Graphical description of Ti contents (mg kg−1) through EDA diagrams:histogram, one-dimensional scattergram, box-plot, andCDFdiagram (fromup to down).
V
0 20 40 60 80
0 20 40 60 80
0 20 40 60 80
0.0
0.2
0.4
0.6
0.8
1.0
Fig. 6. Graphical description of V (mg kg−1) contents through EDAdiagrams: histogram,one-dimensional scattergram, box-plot, and CDF diagram (from up to down).
Table 2Mean and standard error of the mean (SE) of the metals. Data subgroups by soil texture.
Al Ba Pb Ti V
Soiltexture
Mean SE Mean SE Mean SE Mean SE Mean SE
Sandy 14,796 1740 104 18.3 51.5 4.8 769 236 34.6 6.0CoarseLoamy
16,155 609 131 17.9 56.6 5.2 284 37.2 27.1 1.5
CoarseSilty
17,713 3159 160 52.4 80.7 21.9 69.4 25.7 22.6 6.9
FineLoamy
18,286 575 122 9.9 47.3 3.8 205 26.4 32.3 2.4
Fine Silty 16,995 1011 113 21.2 48.6 11.7 188 40.9 25.3 1.4Clayey 27,492 5250 161 33.4 52.9 6.5 286 68.3 45.9 7.6
SE standard error of the mean.
30 J. Bech et al. / Journal of Geochemical Exploration 109 (2011) 26–37
We considered seven Organic Carbon (OC) classes to determinethe significance of OC on the metal concentrations (Table 4). Kruskal–Wallis test reveals that OC has a significant effect on Al (pb0.05), Pb(pb0.05) and V (pb0.05), but not in Ba (pN0.05) and Ti (pN0.05).Highest Al values are observed in the class that ranges from 4 to 6.3,and the lowest values in the class that ranges from 0.4 to 1.2. Thehighest concentration of Ba, Pb and V are found in the soils with thehighest OC value. The lowest Ba concentration is found in the OC classless than 0.4%. The lowest Pb concentration is observed in the OC class1.2%–2.3%. The lowest V concentration is found in the lowest OC class.On the contrary the highest Ti concentration corresponds to thelowest OC class and the lowest Ti concentration is found in the highestOC class.
We considered six CaCO3 classes to determine the significance ofCaCO3 on the element concentrations (Table 5). Kruskal–Wallis testreveals that CaCO3 has a significant effect (pb0.05) on five elements.
The highest metal concentrations are found in the lowest CaCO3
soils. The least Al, Pb and V correspond to the highest CaCO3 soils. Theleast Ba concentration is found in the class 49–72% of CaCO3 and thelowest Ti concentration is found in the class 28–49% of CaCO3.
Al values correspond to lower CaCO3 class, and lowest values of Alare observed in the upper CaCO3 class. Highest Ba values are reportedin the lower CaCO3 class, and lowest Ba values are observed on theclass that ranges from 49 to 72. Highest Pb values correspond to lower
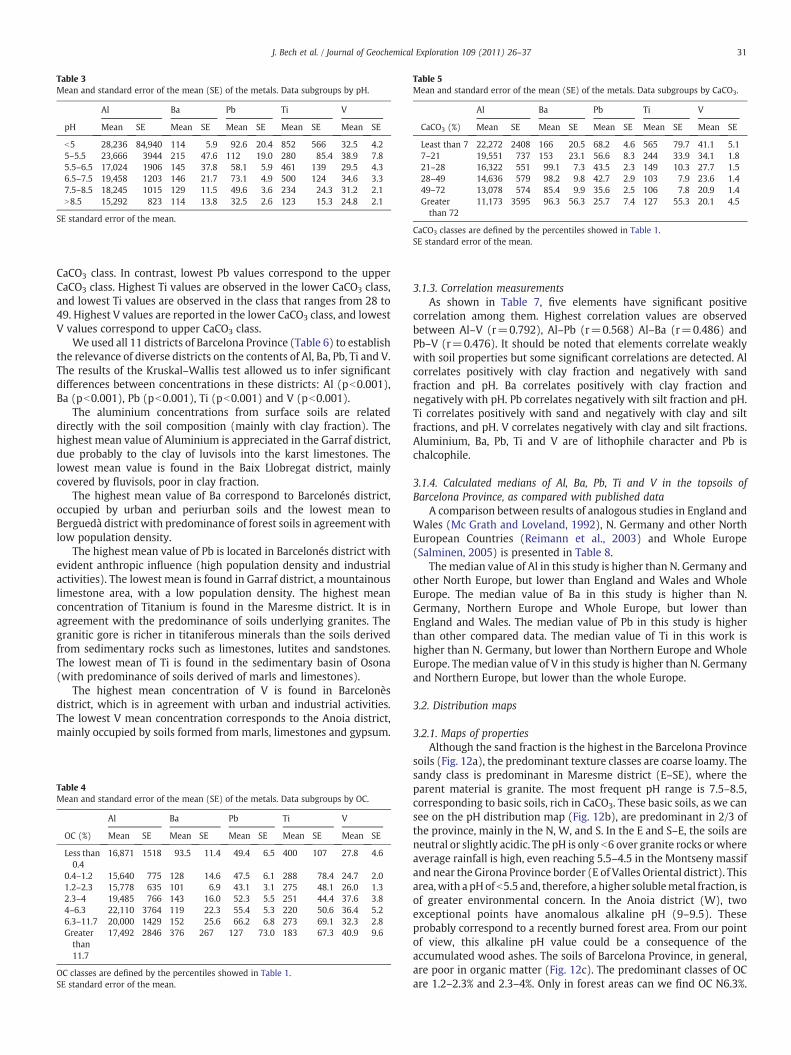
Table 3Mean and standard error of the mean (SE) of the metals. Data subgroups by pH.
Al Ba Pb Ti V
pH Mean SE Mean SE Mean SE Mean SE Mean SE
b5 28,236 84,940 114 5.9 92.6 20.4 852 566 32.5 4.25–5.5 23,666 3944 215 47.6 112 19.0 280 85.4 38.9 7.85.5–6.5 17,024 1906 145 37.8 58.1 5.9 461 139 29.5 4.36.5–7.5 19,458 1203 146 21.7 73.1 4.9 500 124 34.6 3.37.5–8.5 18,245 1015 129 11.5 49.6 3.6 234 24.3 31.2 2.1N8.5 15,292 823 114 13.8 32.5 2.6 123 15.3 24.8 2.1
SE standard error of the mean.
Table 5Mean and standard error of the mean (SE) of the metals. Data subgroups by CaCO3.
Al Ba Pb Ti V
CaCO3 (%) Mean SE Mean SE Mean SE Mean SE Mean SE
Least than 7 22,272 2408 166 20.5 68.2 4.6 565 79.7 41.1 5.17–21 19,551 737 153 23.1 56.6 8.3 244 33.9 34.1 1.821–28 16,322 551 99.1 7.3 43.5 2.3 149 10.3 27.7 1.528–49 14,636 579 98.2 9.8 42.7 2.9 103 7.9 23.6 1.449–72 13,078 574 85.4 9.9 35.6 2.5 106 7.8 20.9 1.4Greaterthan 72
11,173 3595 96.3 56.3 25.7 7.4 127 55.3 20.1 4.5
CaCO3 classes are defined by the percentiles showed in Table 1.SE standard error of the mean.
31J. Bech et al. / Journal of Geochemical Exploration 109 (2011) 26–37
CaCO3 class. In contrast, lowest Pb values correspond to the upperCaCO3 class. Highest Ti values are observed in the lower CaCO3 class,and lowest Ti values are observed in the class that ranges from 28 to49. Highest V values are reported in the lower CaCO3 class, and lowestV values correspond to upper CaCO3 class.
We used all 11 districts of Barcelona Province (Table 6) to establishthe relevance of diverse districts on the contents of Al, Ba, Pb, Ti and V.The results of the Kruskal–Wallis test allowed us to infer significantdifferences between concentrations in these districts: Al (pb0.001),Ba (pb0.001), Pb (pb0.001), Ti (pb0.001) and V (pb0.001).
The aluminium concentrations from surface soils are relateddirectly with the soil composition (mainly with clay fraction). Thehighest mean value of Aluminium is appreciated in the Garraf district,due probably to the clay of luvisols into the karst limestones. Thelowest mean value is found in the Baix Llobregat district, mainlycovered by fluvisols, poor in clay fraction.
The highest mean value of Ba correspond to Barcelonés district,occupied by urban and periurban soils and the lowest mean toBerguedà district with predominance of forest soils in agreement withlow population density.
The highest mean value of Pb is located in Barcelonés district withevident anthropic influence (high population density and industrialactivities). The lowest mean is found in Garraf district, a mountainouslimestone area, with a low population density. The highest meanconcentration of Titanium is found in the Maresme district. It is inagreement with the predominance of soils underlying granites. Thegranitic gore is richer in titaniferous minerals than the soils derivedfrom sedimentary rocks such as limestones, lutites and sandstones.The lowest mean of Ti is found in the sedimentary basin of Osona(with predominance of soils derived of marls and limestones).
The highest mean concentration of V is found in Barcelonèsdistrict, which is in agreement with urban and industrial activities.The lowest V mean concentration corresponds to the Anoia district,mainly occupied by soils formed from marls, limestones and gypsum.
Table 4Mean and standard error of the mean (SE) of the metals. Data subgroups by OC.
Al Ba Pb Ti V
OC (%) Mean SE Mean SE Mean SE Mean SE Mean SE
Less than0.4
16,871 1518 93.5 11.4 49.4 6.5 400 107 27.8 4.6
0.4–1.2 15,640 775 128 14.6 47.5 6.1 288 78.4 24.7 2.01.2–2.3 15,778 635 101 6.9 43.1 3.1 275 48.1 26.0 1.32.3–4 19,485 766 143 16.0 52.3 5.5 251 44.4 37.6 3.84–6.3 22,110 3764 119 22.3 55.4 5.3 220 50.6 36.4 5.26.3–11.7 20,000 1429 152 25.6 66.2 6.8 273 69.1 32.3 2.8Greaterthan11.7
17,492 2846 376 267 127 73.0 183 67.3 40.9 9.6
OC classes are defined by the percentiles showed in Table 1.SE standard error of the mean.
3.1.3. Correlation measurementsAs shown in Table 7, five elements have significant positive
correlation among them. Highest correlation values are observedbetween Al–V (r=0.792), Al–Pb (r=0.568) Al–Ba (r=0.486) andPb–V (r=0.476). It should be noted that elements correlate weaklywith soil properties but some significant correlations are detected. Alcorrelates positively with clay fraction and negatively with sandfraction and pH. Ba correlates positively with clay fraction andnegatively with pH. Pb correlates negatively with silt fraction and pH.Ti correlates positively with sand and negatively with clay and siltfractions, and pH. V correlates negatively with clay and silt fractions.Aluminium, Ba, Pb, Ti and V are of lithophile character and Pb ischalcophile.
3.1.4. Calculated medians of Al, Ba, Pb, Ti and V in the topsoils ofBarcelona Province, as compared with published data
A comparison between results of analogous studies in England andWales (Mc Grath and Loveland, 1992), N. Germany and other NorthEuropean Countries (Reimann et al., 2003) and Whole Europe(Salminen, 2005) is presented in Table 8.
Themedian value of Al in this study is higher than N. Germany andother North Europe, but lower than England and Wales and WholeEurope. The median value of Ba in this study is higher than N.Germany, Northern Europe and Whole Europe, but lower thanEngland and Wales. The median value of Pb in this study is higherthan other compared data. The median value of Ti in this work ishigher than N. Germany, but lower than Northern Europe and WholeEurope. The median value of V in this study is higher than N. Germanyand Northern Europe, but lower than the whole Europe.
3.2. Distribution maps
3.2.1. Maps of propertiesAlthough the sand fraction is the highest in the Barcelona Province
soils (Fig. 12a), the predominant texture classes are coarse loamy. Thesandy class is predominant in Maresme district (E–SE), where theparent material is granite. The most frequent pH range is 7.5–8.5,corresponding to basic soils, rich in CaCO3. These basic soils, as we cansee on the pH distribution map (Fig. 12b), are predominant in 2/3 ofthe province, mainly in the N, W, and S. In the E and S–E, the soils areneutral or slightly acidic. The pH is only b6 over granite rocks or whereaverage rainfall is high, even reaching 5.5–4.5 in the Montseny massifand near the Girona Province border (E of Valles Oriental district). Thisarea,with a pHof b5.5 and, therefore, a higher solublemetal fraction, isof greater environmental concern. In the Anoia district (W), twoexceptional points have anomalous alkaline pH (9–9.5). Theseprobably correspond to a recently burned forest area. From our pointof view, this alkaline pH value could be a consequence of theaccumulated wood ashes. The soils of Barcelona Province, in general,are poor in organic matter (Fig. 12c). The predominant classes of OCare 1.2–2.3% and 2.3–4%. Only in forest areas can we find OC N6.3%.

Table 6Mean and standard error of the mean (SE) of the metals. Data subgroups by districts.
Al Ba Pb Ti V
Districts Mean SE Mean SE Mean SE Mean SE Mean SE
Berguedà 17,749 861 67.5 4.9 46.0 3.6 145 14.4 32.8 2.2Osona 15,279 695 76.5 5.4 47.9 2.6 83.5 7.8 22.3 1.0Bages 17,844 801 146.3 14.0 40.7 2.7 158 12.6 32.5 2.2Anoia 14,969 1001 97.1 8.9 37.7 3.0 116 9.5 21.0 1.3Vallès Occidental 18,443 1568 125.8 15.8 66.8 7.5 220 36.2 27.5 2.9Vallès Oriental 22,203 1072 209.2 45.5 84.8 12.9 618 84.6 38.2 2.5Maresme 19,102 1448 144.5 17.1 71.7 10.0 1049 215 41.8 4.8Alt Penedès 26,059 9002 140.9 47.5 31.1 8.4 205 56.7 34.8 10.8Baix Llobregat 13,137 1637 192.2 50.7 52.0 16.4 118 15.8 36.4 16.1Barcelonès 23,676 4863 328.1 140 140 66.7 952 267 54.7 8.7Garraf 27,017 11833 86.4 13.9 28.9 5.3 148 20.6 33.7 6.8
SE standard error of the mean.
32 J. Bech et al. / Journal of Geochemical Exploration 109 (2011) 26–37
Two such classes (6.3–11.6% and N11.6%) are found in themountainousareas to theWandEof theprovince. In theE, at theMontsenymassif, therelative richness of OC is favoured by higher amounts of early rainfall(N800 mm). OC levels are also relatively high in the NW, in the Pre-Pyrenean ranges (mainly in the Cadi Mountains, North of Bergadadistrict). A clear pattern of CaCO3 is observed in the topsoils of BarcelonaProvince (Fig. 12d). Themaximumconcentrations are found in theW,N,and SW, where the parent materials are limestones, marls, lutites, etc.This is clearer in the W, where scarce rainfall (500 mm approx.) isassociated with a predominance of parent materials rich in CaCO3,mainly calcareous rocks. The CaCO3 of these soils is almost notsolubilized. In contrast, CaCO3 concentrations are lower (6.5%) in the Eand SE, where granite, shales, and other silicic rocks are found. Greater
(...,5)
[5-5.5)
[5.5-6.5)
[6.5-7.5)
[7.5-8.5)
[8.5,...)
10000 20000 30000 40000
Clayey
Coarse loamy
Coarse silty
Fine loamy
Fine silty
Sandy
10000
Fig. 7. Relations between Al (mg kg−1) and pH,
(...,5)
[5-5.5)
[5.5-6.5)
[6.5-7.5)
[7.5-8.5)
[8.5,...)
Clayey
Coarse loamy
Coarse silty
Fine loamy
Fine silty
Sandy
0 200 4000 200 400 600 800 1000 1200
Fig. 8. Relations between Ba (mg kg−1) and pH,
than average rainfall (N800 mm) in the Montseny (E of Valles Orientaldistrict) augments this situation. Therefore, CaCO3 is absent in thesesoils due to the nature of the parentmaterials (granites, shales, siliceoussandstones, etc.); rainfall and age have also contributed to thedissolution of CaCO3 in soils over limestones.
3.2.2. Maps of metals• Aluminium mapThe map (Fig. 13) shows in the S–SW an empty corner,corresponding to topographical map of Vilanova la Geltru, mainlyin the Garraf district due to non availability of Al-analysis data ofsome samples. This feature does not affect substantially the wholemain Province map of Barcelona.
20000 30000 40000
Alt Penedès
Anoia
Bages
Baix Llobregat
Barcelonès
Berguedà
Garraf
Maresme
Osona
Vallès Occidental
Vallès Oriental
10000 20000 30000 40000
soil texture and districts (from left to right).
Alt Penedès
Anoia
Bages
Baix Llobregat
Barcelonès
Berguedà
Garraf
Maresme
Osona
Vallès Occidental
Vallès Oriental
0 200 400 600 800600 800 1000 1200
soil texture and districts (from left to right).
(...,5)
[5-5.5)
[5.5-6.5)
[6.5-7.5)
[7.5-8.5)
[8.5,...)
Clayey
Coarse loamy
Coarse silty
Fine loamy
Fine silty
Sandy
Alt Penedès
Anoia
Bages
Baix Llobregat
Barcelonès
Berguedà
Garraf
Maresme
Osona
Vallès Occidental
Vallès Oriental
200100 300 4000200100 300 4000200100 300 4000
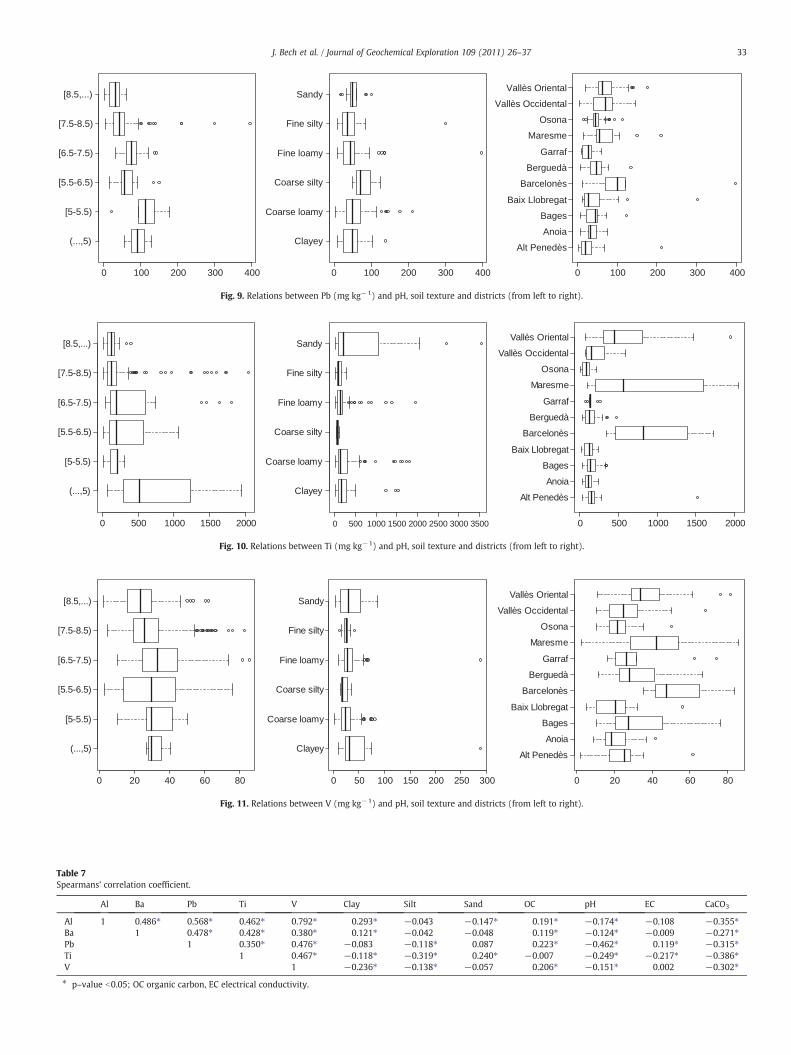
Fig. 9. Relations between Pb (mg kg−1) and pH, soil texture and districts (from left to right).
(...,5)
[5-5.5)
[5.5-6.5)
[6.5-7.5)
[7.5-8.5)
[8.5,...)
Clayey
Coarse loamy
Coarse silty
Fine loamy
Fine silty
Sandy
0 500 1000 1500 2000 2500 3000 3500
Alt Penedès
Anoia
Bages
Baix Llobregat
Barcelonès
Berguedà
Garraf
Maresme
Osona
Vallès Occidental
Vallès Oriental
0 500 1000 1500 20000 500 1000 1500 2000
Fig. 10. Relations between Ti (mg kg−1) and pH, soil texture and districts (from left to right).
(...,5)
[5-5.5)
[5.5-6.5)
[6.5-7.5)
[7.5-8.5)
[8.5,...)
0 20 40 60 80
Clayey
Coarse loamy
Coarse silty
Fine loamy
Fine silty
Sandy
0 50 100 150 200 250 300
Alt Penedès
Anoia
Bages
Baix Llobregat
Barcelonès
Berguedà
Garraf
Maresme
Osona
Vallès Occidental
Vallès Oriental
0 20 40 60 80
Fig. 11. Relations between V (mg kg−1) and pH, soil texture and districts (from left to right).
Table 7Spearmans’ correlation coefficient.
Al Ba Pb Ti V Clay Silt Sand OC pH EC CaCO3
Al 1 0.486⁎ 0.568⁎ 0.462⁎ 0.792⁎ 0.293⁎ −0.043 −0.147⁎ 0.191⁎ −0.174⁎ −0.108 −0.355⁎Ba 1 0.478⁎ 0.428⁎ 0.380⁎ 0.121⁎ −0.042 −0.048 0.119⁎ −0.124⁎ −0.009 −0.271⁎Pb 1 0.350⁎ 0.476⁎ −0.083 −0.118⁎ 0.087 0.223⁎ −0.462⁎ 0.119⁎ −0.315⁎Ti 1 0.467⁎ −0.118⁎ −0.319⁎ 0.240⁎ −0.007 −0.249⁎ −0.217⁎ −0.386⁎V 1 −0.236⁎ −0.138⁎ −0.057 0.206⁎ −0.151⁎ 0.002 −0.302⁎
⁎ p–value b0.05; OC organic carbon, EC electrical conductivity.
33J. Bech et al. / Journal of Geochemical Exploration 109 (2011) 26–37
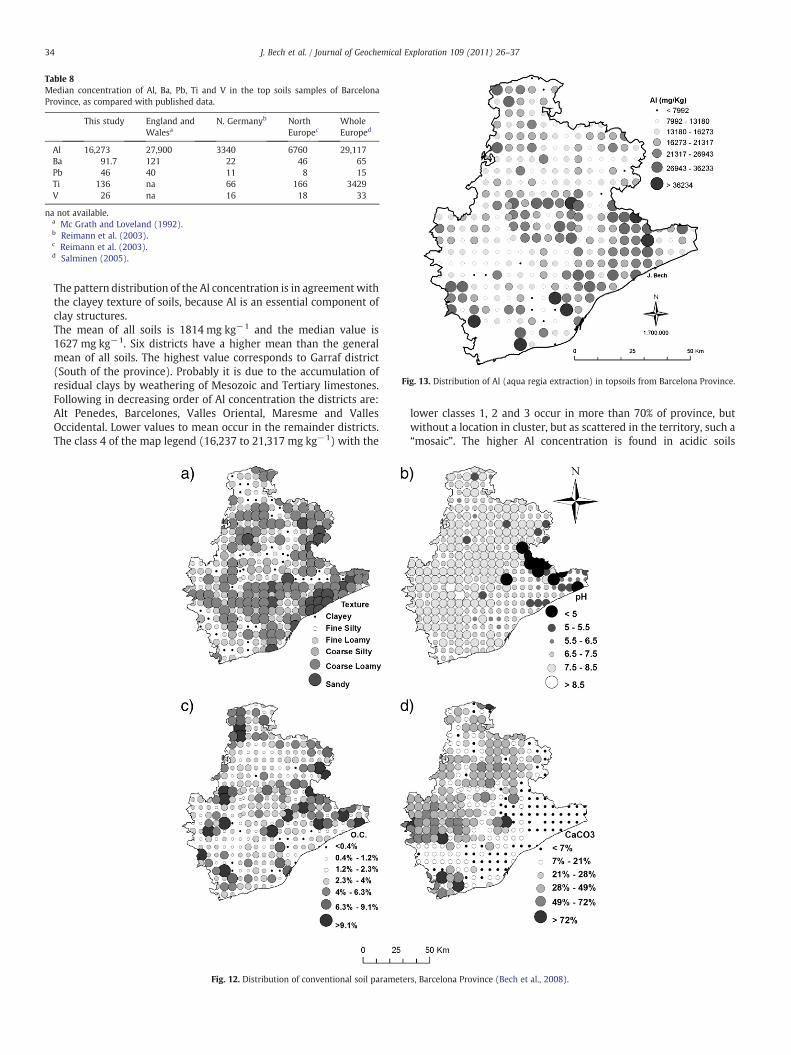
Table 8Median concentration of Al, Ba, Pb, Ti and V in the top soils samples of BarcelonaProvince, as compared with published data.
This study England andWalesa
N. Germanyb NorthEuropec
WholeEuroped
Al 16,273 27,900 3340 6760 29,117Ba 91.7 121 22 46 65Pb 46 40 11 8 15Ti 136 na 66 166 3429V 26 na 16 18 33
na not available.a Mc Grath and Loveland (1992).b Reimann et al. (2003).c Reimann et al. (2003).d Salminen (2005).
Fig. 13. Distribution of Al (aqua regia extraction) in topsoils from Barcelona Province.
34 J. Bech et al. / Journal of Geochemical Exploration 109 (2011) 26–37
The pattern distribution of the Al concentration is in agreement withthe clayey texture of soils, because Al is an essential component ofclay structures.The mean of all soils is 1814 mg kg−1 and the median value is1627 mg kg−1. Six districts have a higher mean than the generalmean of all soils. The highest value corresponds to Garraf district(South of the province). Probably it is due to the accumulation ofresidual clays by weathering of Mesozoic and Tertiary limestones.Following in decreasing order of Al concentration the districts are:Alt Penedes, Barcelones, Valles Oriental, Maresme and VallesOccidental. Lower values to mean occur in the remainder districts.The class 4 of the map legend (16,237 to 21,317 mg kg−1) with the
Fig. 12. Distribution of conventional soil parame
lower classes 1, 2 and 3 occur in more than 70% of province, butwithout a location in cluster, but as scattered in the territory, such a“mosaic”. The higher Al concentration is found in acidic soils
ters, Barcelona Province (Bech et al., 2008).
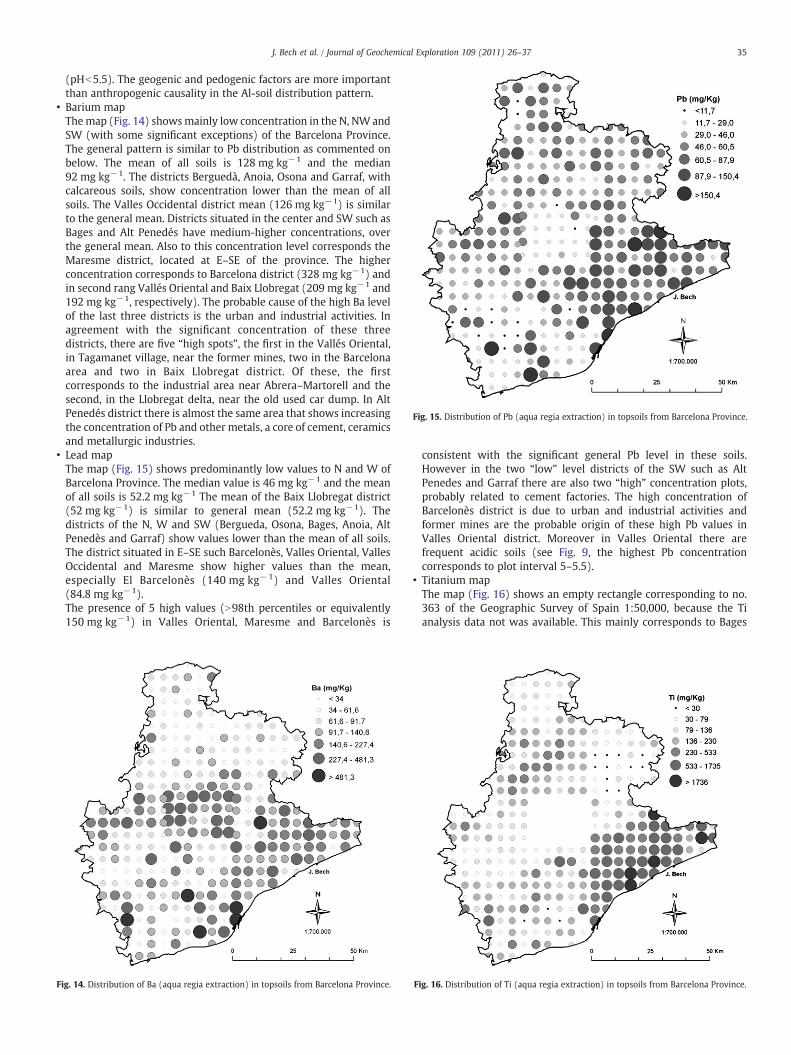
Fig. 15. Distribution of Pb (aqua regia extraction) in topsoils from Barcelona Province.
35J. Bech et al. / Journal of Geochemical Exploration 109 (2011) 26–37
(pHb5.5). The geogenic and pedogenic factors are more importantthan anthropogenic causality in the Al-soil distribution pattern.
• Barium mapThemap (Fig. 14) showsmainly low concentration in the N, NW andSW (with some significant exceptions) of the Barcelona Province.The general pattern is similar to Pb distribution as commented onbelow. The mean of all soils is 128 mg kg−1 and the median92 mg kg−1. The districts Berguedà, Anoia, Osona and Garraf, withcalcareous soils, show concentration lower than the mean of allsoils. The Valles Occidental district mean (126 mg kg−1) is similarto the general mean. Districts situated in the center and SW such asBages and Alt Penedés have medium-higher concentrations, overthe general mean. Also to this concentration level corresponds theMaresme district, located at E–SE of the province. The higherconcentration corresponds to Barcelona district (328 mg kg−1) andin second rang Vallés Oriental and Baix Llobregat (209 mg kg−1 and192 mg kg−1, respectively). The probable cause of the high Ba levelof the last three districts is the urban and industrial activities. Inagreement with the significant concentration of these threedistricts, there are five “high spots”, the first in the Vallés Oriental,in Tagamanet village, near the former mines, two in the Barcelonaarea and two in Baix Llobregat district. Of these, the firstcorresponds to the industrial area near Abrera–Martorell and thesecond, in the Llobregat delta, near the old used car dump. In AltPenedés district there is almost the same area that shows increasingthe concentration of Pb and other metals, a core of cement, ceramicsand metallurgic industries.
• Lead mapThe map (Fig. 15) shows predominantly low values to N and W ofBarcelona Province. The median value is 46 mg kg−1 and the meanof all soils is 52.2 mg kg−1 The mean of the Baix Llobregat district(52 mg kg−1) is similar to general mean (52.2 mg kg−1). Thedistricts of the N, W and SW (Bergueda, Osona, Bages, Anoia, AltPenedès and Garraf) show values lower than the mean of all soils.The district situated in E–SE such Barcelonès, Valles Oriental, VallesOccidental and Maresme show higher values than the mean,especially El Barcelonès (140 mg kg−1) and Valles Oriental(84.8 mg kg−1).The presence of 5 high values (N98th percentiles or equivalently150 mg kg−1) in Valles Oriental, Maresme and Barcelonès is
Fig. 14. Distribution of Ba (aqua regia extraction) in topsoils from Barcelona Province.
consistent with the significant general Pb level in these soils.However in the two “low” level districts of the SW such as AltPenedes and Garraf there are also two “high” concentration plots,probably related to cement factories. The high concentration ofBarcelonès district is due to urban and industrial activities andformer mines are the probable origin of these high Pb values inValles Oriental district. Moreover in Valles Oriental there arefrequent acidic soils (see Fig. 9, the highest Pb concentrationcorresponds to plot interval 5–5.5).
• Titanium mapThe map (Fig. 16) shows an empty rectangle corresponding to no.363 of the Geographic Survey of Spain 1:50,000, because the Tianalysis data not was available. This mainly corresponds to Bages
Fig. 16. Distribution of Ti (aqua regia extraction) in topsoils from Barcelona Province.
36 J. Bech et al. / Journal of Geochemical Exploration 109 (2011) 26–37
district. This not affect substantially to the whole main ProvinceMap of Barcelona. The map shows the predominance of low values,under the mean (268 mg kg−1) in a 75% of surface located in the N,NW, NE, Center, W, SW and S mainly with calcareous soils. Onlythese districts placed in the E–SE: Maresme (mean 1049 mg kg−1),Barcelonès (mean 952 mg kg−1) and Vallés Oriental (mean618 mg kg−1), exceed the general mean. The highest concentrationof Ti in soils of Maresme is caused by the granite as parent rock. Thesame granite occurs in the eastern border of Vallés Oriental, in theMontseny Mountain. The geologic factor is decisive in the Ti contentof soils of Maresme, and in Vallés Oriental and Barcelonès districts,also important is the anthropic factor (high urban density,industries such as Ti-alloys and Ti-paint production). There arefive plots with the highest Ti concentration (N98th percentile orequivalently N1735 mg kg−1). One is located in the eastern borderof Vallés Oriental, in the Montseny Mountain, and the remainingfour are located in Maresme district (litoral range). The differentparent rock nature is decisive in the Ti-soil distribution.
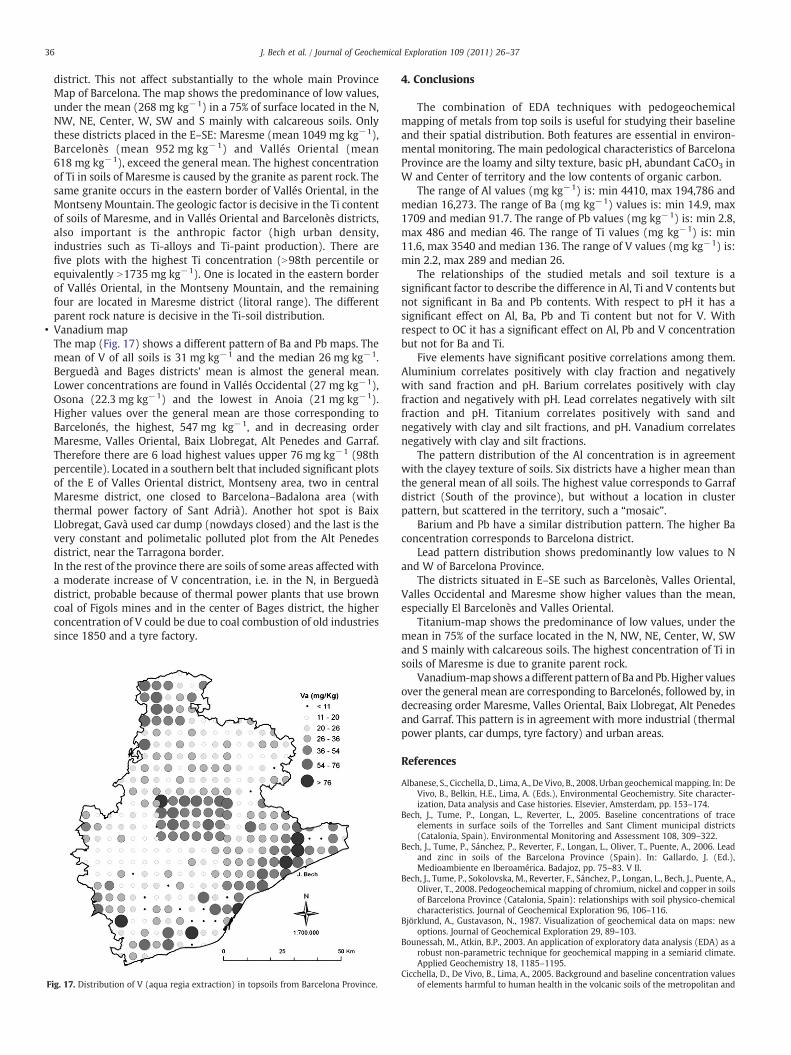
• Vanadium mapThe map (Fig. 17) shows a different pattern of Ba and Pb maps. Themean of V of all soils is 31 mg kg−1 and the median 26 mg kg−1.Berguedà and Bages districts’ mean is almost the general mean.Lower concentrations are found in Vallés Occidental (27 mg kg−1),Osona (22.3 mg kg−1) and the lowest in Anoia (21 mg kg−1).Higher values over the general mean are those corresponding toBarcelonés, the highest, 547 mg kg−1, and in decreasing orderMaresme, Valles Oriental, Baix Llobregat, Alt Penedes and Garraf.Therefore there are 6 load highest values upper 76 mg kg−1 (98thpercentile). Located in a southern belt that included significant plotsof the E of Valles Oriental district, Montseny area, two in centralMaresme district, one closed to Barcelona–Badalona area (withthermal power factory of Sant Adrià). Another hot spot is BaixLlobregat, Gavà used car dump (nowdays closed) and the last is thevery constant and polimetalic polluted plot from the Alt Penedesdistrict, near the Tarragona border.In the rest of the province there are soils of some areas affected witha moderate increase of V concentration, i.e. in the N, in Berguedàdistrict, probable because of thermal power plants that use browncoal of Figols mines and in the center of Bages district, the higherconcentration of V could be due to coal combustion of old industriessince 1850 and a tyre factory.
Fig. 17. Distribution of V (aqua regia extraction) in topsoils from Barcelona Province.
4. Conclusions
The combination of EDA techniques with pedogeochemicalmapping of metals from top soils is useful for studying their baselineand their spatial distribution. Both features are essential in environ-mental monitoring. The main pedological characteristics of BarcelonaProvince are the loamy and silty texture, basic pH, abundant CaCO3 inW and Center of territory and the low contents of organic carbon.
The range of Al values (mg kg−1) is: min 4410, max 194,786 andmedian 16,273. The range of Ba (mg kg−1) values is: min 14.9, max1709 and median 91.7. The range of Pb values (mg kg−1) is: min 2.8,max 486 and median 46. The range of Ti values (mg kg−1) is: min11.6, max 3540 and median 136. The range of V values (mg kg−1) is:min 2.2, max 289 and median 26.
The relationships of the studied metals and soil texture is asignificant factor to describe the difference in Al, Ti and V contents butnot significant in Ba and Pb contents. With respect to pH it has asignificant effect on Al, Ba, Pb and Ti content but not for V. Withrespect to OC it has a significant effect on Al, Pb and V concentrationbut not for Ba and Ti.
Five elements have significant positive correlations among them.Aluminium correlates positively with clay fraction and negativelywith sand fraction and pH. Barium correlates positively with clayfraction and negatively with pH. Lead correlates negatively with siltfraction and pH. Titanium correlates positively with sand andnegatively with clay and silt fractions, and pH. Vanadium correlatesnegatively with clay and silt fractions.
The pattern distribution of the Al concentration is in agreementwith the clayey texture of soils. Six districts have a higher mean thanthe general mean of all soils. The highest value corresponds to Garrafdistrict (South of the province), but without a location in clusterpattern, but scattered in the territory, such a “mosaic”.
Barium and Pb have a similar distribution pattern. The higher Baconcentration corresponds to Barcelona district.
Lead pattern distribution shows predominantly low values to Nand W of Barcelona Province.
The districts situated in E–SE such as Barcelonès, Valles Oriental,Valles Occidental and Maresme show higher values than the mean,especially El Barcelonès and Valles Oriental.
Titanium-map shows the predominance of low values, under themean in 75% of the surface located in the N, NW, NE, Center, W, SWand S mainly with calcareous soils. The highest concentration of Ti insoils of Maresme is due to granite parent rock.
Vanadium-map shows adifferent pattern of Ba andPb.Higher valuesover the general mean are corresponding to Barcelonés, followed by, indecreasing order Maresme, Valles Oriental, Baix Llobregat, Alt Penedesand Garraf. This pattern is in agreement with more industrial (thermalpower plants, car dumps, tyre factory) and urban areas.
References
Albanese, S., Cicchella, D., Lima, A., De Vivo, B., 2008. Urban geochemical mapping. In: DeVivo, B., Belkin, H.E., Lima, A. (Eds.), Environmental Geochemistry. Site character-ization, Data analysis and Case histories. Elsevier, Amsterdam, pp. 153–174.
Bech, J., Tume, P., Longan, L., Reverter, L., 2005. Baseline concentrations of traceelements in surface soils of the Torrelles and Sant Climent municipal districts(Catalonia, Spain). Environmental Monitoring and Assessment 108, 309–322.
Bech, J., Tume, P., Sánchez, P., Reverter, F., Longan, L., Oliver, T., Puente, A., 2006. Leadand zinc in soils of the Barcelona Province (Spain). In: Gallardo, J. (Ed.),Medioambiente en Iberoamérica. Badajoz, pp. 75–83. V II.
Bech, J., Tume, P., Sokolovska, M., Reverter, F., Sánchez, P., Longan, L., Bech, J., Puente, A.,Oliver, T., 2008. Pedogeochemical mapping of chromium, nickel and copper in soilsof Barcelona Province (Catalonia, Spain): relationships with soil physico-chemicalcharacteristics. Journal of Geochemical Exploration 96, 106–116.
Björklund, A., Gustavason, N., 1987. Visualization of geochemical data on maps: newoptions. Journal of Geochemical Exploration 29, 89–103.
Bounessah, M., Atkin, B.P., 2003. An application of exploratory data analysis (EDA) as arobust non-parametric technique for geochemical mapping in a semiarid climate.Applied Geochemistry 18, 1185–1195.
Cicchella, D., De Vivo, B., Lima, A., 2005. Background and baseline concentration valuesof elements harmful to human health in the volcanic soils of the metropolitan and

37J. Bech et al. / Journal of Geochemical Exploration 109 (2011) 26–37
provincial areas of Napoli (Italy). Geochemistry: Exploration, Environment,Analysis 5 (1), 29–40.
De Vivo, B., Lima, A., Bove, M.A., et al., 2008a. Geochemical Atlas of Italy. Aracne Editrice,Roma.
De Vivo, B., Lima, A., Bove, M.A., Albanese, S., Cichella, D., Sabatini, G., Di Lella, L.A.,Protano, G., Riccobono, F., Frizzo, P., Raccagni, R., 2008b. Environmentalgeochemical maps of Italy from the FOREGS database. Geochemistry: Exploration,Environment, Analysis 8, 267–277.
Gustavsson, N., Bolviken, B., Smith, D.B., Severson, 2001.Geochemical Landscapes of theConterminous United States—New map Presentations for 22 Elements: U.S.Geological Survey Professional Paper 1648. http://pubs.usgs.gov/pp/p1648/.
Hoaglin, D.C., Mosteller, F., Tukey, J.W., 1983. Understanding Robust and ExploratoryData Analysis. John Wiley and Sons, New York.
Horckmans, L., Swennen, R., Deckers, J., Maquil, R., 2005. Local background concentra-tions of trace elements in soils: a case study in the Grand Duchy of Luxemburg.Catena 59, 279–304.
ISO 11466, 2002. Soil Quality: Extraction of Trace Elements Soluble in Aqua Regia.International Organization for Standardization, Geneva.
Kürzl, H., 1988. Exploratory data analysis: recent advances for the interpretation ofgeochemical data. Journal of Geochemical Exploration 30, 309–322.
Mc Grath, S.P., Loveland, P.J., 1992. The Soil Geochemical Atlas of England and Wales.Blackie Academia and Professional, London.
Reimann, C., Filzmoser, P., 2000. Normal and log normal data distribution ingeochemistry: death of a myth Consequences for the statistical treatment ofgeochemical and environmental data. Environmental Geology 39, 1001–1014.
Reimann, C., Garret, R.G., 2005. Geochemical Background—Concept and Reality. Scienceof the Total Environment 350, 12–27.
Reimann, C., Wurzer, F., 1986. Monitoring accuracy and precision—improvement byintroducing and resistant statistics. Microchimica Acta, II 31–42 Wien.
Reimann, C., Siewers, U., Tarvainen, T., Bityukova, L., Eriksson, A., Gilucis, V.,Gregorauskiene, V., Lukashev, V. K., Matinian, N. N., Pasieczna, A., 2003. Agriculturalsoils in Northern Europe: A Geochemical Atlas. Geologisches Jahrbuch. Sonder-hefte, Reihe D Heff SD5. Stuttgart. Schweizerbart’ sche Verlagsbuchandlung.Hannover. Germany. ISBN 3–510–95906–X.
Reimann, C., Filzmoser, P., Garret, R.G., 2005. Background and threshold: criticalcomparison of methods of determination. The Science of the Total Environment346, 1–16.
Rudeforth, C.C., 1974. Soils in Dyfed ll, Soil Survey Record No. 24. Harpenden.Salminen, R. (Chief editor), Batista, M.J., Bidovec, M. Demetriades, A., DeVivo, B., DeVos,
W., Duris, M., Gilucis, A., Gregourauskiene, V., Halamic, J., Heitzmann, P., Lima, A.,Jordan, G., Klavier, G., Klein, P., Lis, J., Locutura, J.,Marsina, K.,Mazreku, O´Connor, P.J.,Olsson, S.A., Ottensen, R.–T., Petersell, V, Plant, J.A., Reeder, S., Salpeteur, I.,Sandström, H., Siewers, U., Steenfelt, A., Tarvainen, T., 2005. Geochemical Atlas ofEurope. Part 1. Background Information. Methodology andMaps. Geological Surveyof Finland, Esopo, Finland, 526 p.
Shacklette, H.T., Boerngen, J.G., 1984. Element concentrations in soils and other surficialmaterials of the conterminous United States. USGS Prof. Pap. 1270. U.S. Gov. Print.Office, Washington, DC.
Tarvainen, T., Kallio, E., 2002. Baselines of certain bioavailable and total heavy metalconcentrations in Finland. Applied Geochemistry 17, 975–980.
Tukey, J.W., 1977. Exploratory Data Analysis. Addison-Wesley, Reading.Ujiie-Mikoshiba, M., Imai, N., Terashima, S., Tachibana, Y., Okai, T., 2006. Geochemical
mapping in northern Honshu, Japan. Applied Geochemistry 21, 492–514.Zhang, H.H., Li, F.B., Wu, Z.F., Li, D.Q., Xu, D.R., Yuan, H.X., 2008. Baseline concentrations
and spatial distribution of trace metals in surface soils of Guandong Province China.Journal of Environmental Quality 37, 1752–1760.