Biological Properties of Dietary Micronutrients: Antioxidant ...

ORIGINAL ARTICLE
PDA-assisted low glycemic index dietaryintervention for type II diabetes: a pilot study
Y Ma1, BC Olendzki1, D Chiriboga1, M Rosal1, E Sinagra1, S Crawford1, AR Hafner1, SL Pagoto1,
RP Magner1 and IS Ockene2
1Division of Preventive and Behavioral Medicine, Department of Medicine, University of Massachusetts Medical School, Worcester, MA,USA and 2Division of Cardiovascular Medicine, University of Massachusetts Medical School, Worcester, MA, USA
Background: Epidemiological and dietary intervention studies suggest that a low-glycemic index (GI) diet is beneficial for bloodglucose control; however, long-term clinical utility of the low GI diet has not been fully investigated.Objectives: To evaluate the feasibility and efficacy of a nutritionist-delivered low-GI dietary intervention, with the support of apersonal digital assistant (PDA), for adult patients with poorly controlled type II diabetes.Method: The low-GI intervention consisted of six counseling sessions and the use of a PDA-based food database with GI scoresfor 6 months. Study outcomes included feasibility measures, glycosylated hemoglobin levels (HbA1c), GI and glycemic load (GL)score of self-reported dietary intake, body weight, depression and quality of life (QOL). Measures were obtained at baseline, 3and 6 months.Results: Of 31 adult patients approached, 15 met study eligibility criteria and were enrolled in the study. Thirteen patients(87%) completed all study assessments. Findings included decreases in average HbA1c (�0.5% P¼ 0.02), body weight, hipcircumference, blood pressure, dietary GI and daily caloric intake. Diabetes impact scores also decreased. All but one participantcompleted all components of the intervention. There were mixed reports regarding the usefulness of the PDAs; however,participants offered helpful suggestions for further development.Conclusions: Results of this pilot study support the feasibility of implementing a nutritionist-delivered, PDA-assisted low-GIdietary intervention for patients with poorly controlled type II diabetes. Encouraging initial efficacy data require further testing inthe context of a randomized clinical trial.
European Journal of Clinical Nutrition (2006) 60, 1235–1243. doi:10.1038/sj.ejcn.1602443; published online 17 May 2006
Keywords: diabetes mellitus; glycemic index; diet; PDA
Introduction
The glycemic index (GI) is based on a ranking of carbohy-
drate-containing foods according to the rate at which they
raise blood glucose levels after eating (Jenkins et al., 1981). A
recent meta-analysis of randomized clinical trials (RCTs)
(Brand-Miller et al., 2003a) suggests that choosing low-GI
foods has a modest but clinically useful effect on medium-
term glycemic control in patients with type II diabetes.
However, in most of the published RCTs, patients were fed
experimental diets, leaving controversy over the applicabi-
lity of GI-based diets in the clinical setting for the manage-
ment of diabetes. The American Diabetes Association (ADA)
states that evidence is lacking to support a change in dietary
recommendations which are based on carbohydrate count-
ing (Franz, 2003). One of the barriers to implementation of a
low-GI diet among diabetic patients is the relative complex-
ity involved in ascertaining the GI score of each food or
meal; whereas carbohydrate counting is much more familiar,
and available on every label or through averages from the
exchange list (Franz, 2003). Carbohydrate counting and use
of a low-GI diet are not mutually exclusive; thus, integrating
a low-GI diet with carbohydrate counting may be optimal for
glycemic control.Received 5 October 2005; revised 27 January 2006; accepted 16 February
2006; published online 17 May 2006
Correspondence: Dr Y Ma, Division of Preventive and Behavioral Medicine,
Department of Medicine, University of Massachusetts Medical School, 55 Lake
Avenue North, Worcester, MA 01655, USA.
E-mail: [email protected]
Guarantor: Y Ma.
Contributors: Study concept and design: YM, BCO, DC and ISO; statistical
analysis: ARH, YM and SC; drafting of the manuscripts: YM and BCO; critical
revision of the mannuuscript for important intellectual contents: DC, MR, ES,
SC, ARH, SLP, RPM and ISO.
European Journal of Clinical Nutrition (2006) 60, 1235–1243& 2006 Nature Publishing Group All rights reserved 0954-3007/06 $30.00
www.nature.com/ejcn
Advances in the technology of personal digital assistants
(PDAs) including smaller size, user friendliness, familiarity,
easily modifiable software, and lower cost have contributed
to their increasing use in psychological and medical studies
since the early 1990s. PDAs have successfully assisted self-
monitoring in studies of diabetes (Clarke et al., 1995),
respiratory diseases (Tiplady et al., 1997), panic disorder
(Taylor et al., 1990), smoking cessation (Shiffman et al.,
1996), effects of night shift work on psychological symptoms
during the menstrual cycle (Totterdell et al., 1995) and
menstrual cycling (Johannes et al., 2000). PDAs might also
reduce the burden of GI self-monitoring in the management
of diabetes.
The objectives of this study are to evaluate the feasibility
of implementation and explore the potential efficacy of a
nutritionist-delivered low-GI dietary intervention in a
sample of patients diagnosed with type II diabetes, which
was poorly controlled. Outcomes of interest included patient
completion of intervention sessions, relevant physiological
variables (glycosylated hemoglobin (HbA1c), blood pressure
and weight), dietary intake and quality of life (QOL)
measures.
Subjects and methods
Subject recruitment and enrollment
The study protocol was approved by the University of
Massachusetts (UMass) Medical School Institutional Review
Board for use of human subjects in medical research. All
study participants provided informed consent before being
enrolled into the study.
UMass Memorial Health Care patients with a diagnosis of
type II diabetes were recruited between July and October
2004 through referrals from a network of participating
health-care providers. Eligibility criteria included: having a
diagnosis of type II diabetes and having an HbA1c level of
7.0% or greater. We did not include fasting glucose levels as
an inclusion criterion, as we were interested in the long-term
control of blood glucose which is reflected in HbA1c.
Exclusion criteria included: planning to become pregnant
or to relocate during the study period, being pregnant,
inability to provide informed consent, being on glucocorti-
coid therapy within the previous 3 months, having experi-
enced an acute coronary event within the previous 6
months, having a diagnosis of a medical condition
that precluded adherence to study dietary recommenda-
tions, that is, Crohn’s disease, ulcerative colitis, end-stage
renal disease, diagnosis of a severe psychiatric illness,
significant visual impairment or currently following a low-
carbohydrate, high-fat diet such as the Atkins Diet (Atkins,
1998). Because the Atkins diet is low in all sources of
carbohydrates, modification of the type of carbohydrate
(GI) will have limited effect on glycemic load (GL) and
therefore HbA1c.
Study design and intervention format
This was a pilot study with a single treatment arm. The goal
of the intervention was to improve HbA1c levels via a low-GI
diet that was customized to the participant’s taste prefer-
ences and eating habits. The 6-month nutritionist-delivered
low-GI dietary intervention consisted of two group sessions,
one individual session and three telephone counseling
sessions. All participants received a Palm Zire 21 PDA to
use for the duration of the study.
The initial 2.5 h group session was held in a demonstration
kitchen by a trained nutritionist and involved information
on low-GI diet. Factors that influence the GI value of a food
(i.e., acid, particle size, fiber content and cooking time), how
to integrate a low-GI diet into one’s life, and low-GI
substitutions for common high-GI foods were discussed.
The group then sampled low-GI foods, were provided with
low-GI recipes and given hands-on training in the use of the
PDA. At the subsequent 1-h individual visit with a nutri-
tionist 2 weeks later, low-GI diet information was reviewed
and patient-centered counseling was provided to facilitate
the following behavior change strategies: goal-setting, self-
monitoring and problem-solving to address each patient’s
adherence barriers (to diet or use of the PDA). At the
individual visit, participants’ PDA data were uploaded to our
study database; these data were used by the nutritionist to
guide the nutritional counseling. The group reconvened for
a 2-h grocery store tour at week 4. Subsequent 30-min
telephone counseling sessions with the nutritionist were
completed at 2-, 3- and 5- month time points. These sessions
addressed the progress towards goals and challenges to
adherence.
Low-GI diet and PDA GI database
Patients were trained to locate and record individual foods in
their diets on the PDA. The Glycemic Index Meal Planner
software was provided by the Glycemic Diet Software, LLC
(http://www.glycemicdietsw.com). Study investigators pro-
vided the software company with nutrient and GI values for
food equivalent to those from the International Table of GI
(Foster-Powell et al., 2002), as well as those on 400 additional
foods that are commonly consumed by Americans (Ma et al.,
2005, 2006). The Meal Planner can be accessed easily from
the PDA home screen. Once in the program, the patient can
choose breakfast, lunch, dinner, or snack as the meal type,
and then select the food group from a list. Foods in the
selected group will be displayed, along with the GI score or
calories per serving. The ranges for high (469), medium (56–
69), and low (o56) GI values are displayed to assist the
patient in choosing foods (Foster-Powell et al., 2002; Brand-
Miller et al., 2003b). The software calculates the overall GI for
individual meals and for the entire day. It also provides
carbohydrate, calorie, protein, fat, fiber and sodium intake
analysis by meal and by day. The program has the capacity to
store up to 30 days of data, and data can be uploaded to
external databases (via cradle). Patients can view a log which
PDA-assisted dietary GI score and diabetesY Ma et al
1236
European Journal of Clinical Nutrition

displays the GI, GL, carbohydrate content and calories for
each of the last 30 dates on which they have entered meal
data. The software also allows patients to view data on meals
and individual foods eaten on each of the dates. At the
telephone counseling sessions, the nutritionist reviewed the
log with participants, and identified days with high GI.
Specific high-GI foods eaten on that day could be identified.
Assessment of study outcomes
The study data collection period was 6 months. Feasibility of
study implementation was assessed based on retention rate
and attendance records. Treatment acceptability was assessed
via questionnaire at the end of the study.
Data were collected at baseline, and then 3 and 6 months
following study enrollment and included: HbA1c, blood
pressure, body weight, height, waist and hip circumference
and medication use; behavioral measures such as dietary
intake and physical activity level; and psychosocial measures
including QOL and depression.
Fasting blood samples were used to assess HbA1c. Weight
and height were measured using a balance beam scale, with
participants wearing light clothing and no shoes. Blood
pressure measurements were taken using a Dinamap XL
automated blood pressure monitor (Sturrock et al., 1997),
which allows standardized measurements.
Dietary intake was assessed by the Seven-Day Diet Recall
(7DDR) (Hebert et al., 1997b). The 7DDR also included a brief
validated physical activity assessment, described elsewhere
(Matthews et al., 1997, 2000). The GI score was determined
from the intake data collected through the 7DDR using
published tables (Foster-Powell et al., 2002; Brand-Miller
et al., 2003b). GI and GL (GI of a food times the amount of
carbohydrate in grams eaten divided by 100) were also
calculated, as in previous reports (Ma et al., 2005, 2006).
Use of oral hypoglycemics, insulin, lipid-lowering and
antihypertensive medications was assessed using a ques-
tionnaire at each study visit (baseline, 3 and 6 months).
Depression was assessed using the Center for Epidemiolo-
gical Studies-Depression Scale (CES-D) (Radloff, 1977; Devins
and Orme, 1985) and QOL was assessed using the Diabetes
Impact Survey (Schwartz et al., 2005). Age, gender, educa-
tion, occupation, ethnicity, income data and diabetic
complications were collected by questionnaire at baseline.
Statistical analyses
Demographic data were summarized using mean (s.d.) or
frequency (%) as appropriate. For physiological, dietary,
physical activity and psychosocial variables, mean and
standard deviation (s.d.) were computed at baseline. We
conducted longitudinal analyses to evaluate within-partici-
pant change over time in physiological, dietary, physical
activity and psychosocial variables, using linear mixed
modeling (Littell et al., 1996). Consistent with our previous
longitudinal analyses of HbA1c (Rosal et al., 2005), we
employed compound symmetry for the within-subject
covariance structure, estimating subject-specific intercepts,
that is, subject was considered to be a random effect. Each
variable was modeled as a function of categorized time
(baseline, 3 and 6 months). Within-subject changes between
each of the three time points were estimated, to assess both
short-term and long-term changes, and stability between 3
and 6 months.
Results
Of the 31 patients approached for the study, 15 met
eligibility criteria and were enrolled. Major reasons for
ineligibility were HbA1co7 (eight subjects). We could not
assess eligibility for two subjects because of inability to
contact the patients. Two subjects indicated they were too
busy to participate, and one subject was excluded for each of
the following reasons: planned to have weight loss surgery,
moving out of the area within 6 months, had type I diabetes,
and already on low-GI diet. Of the subjects recruited, 15 were
enrolled in the study with one participant dropping out after
the first group session owing to job relocation. In addition,
one patient was excluded from the final analysis owing to a
diagnosis of advanced breast cancer during the study and
subsequent inability to adhere to the low-GI diet. Thirteen
patients completed the study and their data were used for
the analysis. Of these, all but one completed all components
of the study intervention (one subject missed two telephone
counseling sessions).
Participants’ characteristics are presented in Table 1. They
were predominately white, married and well-educated. The
average age was 58 years with a range of 39–72 years. Nine
men and four women participated. The majority worked
full-time and all but one had an annual household income
of $60 000 or more. Eighty-five percent of the participants
reported diabetic complications, the most common being
hypertension, neuropathy and heart disease. However, the
majority of participants characterized their health as ‘very
good’ or ‘good’. In addition, most (10 out of 13) of the
participants had first-degree relatives with diabetes. All
participants were being treated with diet and medication.
When asked at the beginning of the study if they thought
the PDA would be helpful in tracking their diet, all
participants answered ‘yes’.
The average baseline HbA1c was 8%. Most (nine out of 13)
participants’ HbA1c levels decreased over the course of the
intervention (Table 2). For the group as a whole, the decrease
in HbA1c was 0.5%, which is clinically significant. There was
a statistically significant decrease in HbA1c levels at both the
3-month (P¼0.02) and 6-month (P¼0.02) time points for
the overall group compared to baseline. HbA1c remained
stable between 3- and 6-month visits (P¼0.98).
Oral hypoglycemic medications at baseline visit included
metformin (used by five subjects or 38%), pioglitazone
(31%), glyburide (25%), rosiglitazone (15%), and glimepiride
PDA-assisted dietary GI score and diabetesY Ma et al
1237
European Journal of Clinical Nutrition
(8%). Five subjects (38%) were on insulin. Over the course of
the study, several participants reported medically supervised
changes in their diabetes treatment (Table 2). Two decreased
their insulin dosage, one discontinued an oral hypoglycemic
agent and one decreased oral hypoglycemic dosage. Two
participants switched oral hypoglycemic agents, one started
taking an additional oral hypoglycemic agent and one began
using insulin. When grouping the study results in a category
of ‘effective GI intervention’, meaning either improved in
HbA1c, associated with no change in medication or no
change in HbA1c associated with a decrease in medication
dosage (a total of seven subjects), the average decrease in
HbA1c in this subgroup was �5.1% at 3 months and �3.5%
at 6 months as compared to baseline. Four subjects in this
group (60%) decreased their medication dosage, or the
number of medications. On the other hand, in the group
where medication dosage was increased, and/or HbA1c
increased during the study period (n¼6), categorized as
‘not-effective GI intervention’, HbA1c increased by 4.1% at 3
months and 1.2% at 6 months, as compared to baseline.
Three of these patients (50%) required increased dosage of
medication or addition of a different medication.
Table 3 presents baseline as well as changes in physiolo-
gical, dietary, physical activity and psychosocial variables.
Baseline average BMI was 32.81 kg/m2 (s.d.¼5.87). Daily
caloric intake was 1994 kcal (s.d.¼669). GI was 81.96
(s.d.¼7.20). Forty-four percent of calories were from total
fat and 35% were from carbohydrate. Weight decreased by an
average of 1.8 kg over the course of the study but this was
marginally statistically significant owing to the small sample
size (P¼0.07). Systolic and diastolic blood pressure also
decreased over the 6-month period (�7.6 and �6.1 mm Hg
on average, respectively), the latter attaining statistical
significance. Hip circumference decreased significantly over
the 6 months for the group overall (�1.9 cm, P¼0.03);
however, waist circumference did not change significantly
during the study period. Most (nine out of 12) participants’
dietary GI decreased from baseline at 3 months but this
change did not reach statistical significance. However, when
we examined the change of GI at the individual level, we
noted that one subject’s GI score increased by 24 units at the
3-month time point, which affected the overall significance
of the change in GI score for the entire group; when we
excluded from the analysis the GI value from this subject,
the average GI decreased by 4 units for the group as a whole,
at 3 months (P¼0.05). Daily calorie intake also decreased,
with a mean reduction of 185 kcal at 6 months, but this
reduction was not statistically significant. Depression scores
were stable over the course of the study but a decrease in the
diabetes impact score was observed and was marginally
significant at 6 months (P¼0.09), indicating a better QOL.
Participants completed a questionnaire at the end of the
intervention to assess acceptability of the intervention. Most
participants (11 out of 13) reported that they liked the
intervention. Three reported that they had difficulty adher-
ing to the lower-GI diet, three were neutral and seven found
it easy, with all participants but one reporting that they liked
the low-GI diet. Opinions about the PDA database were
mixed. Eight (62%) participants reported that it was difficult
to use owing to inability to find all the foods they consumed,
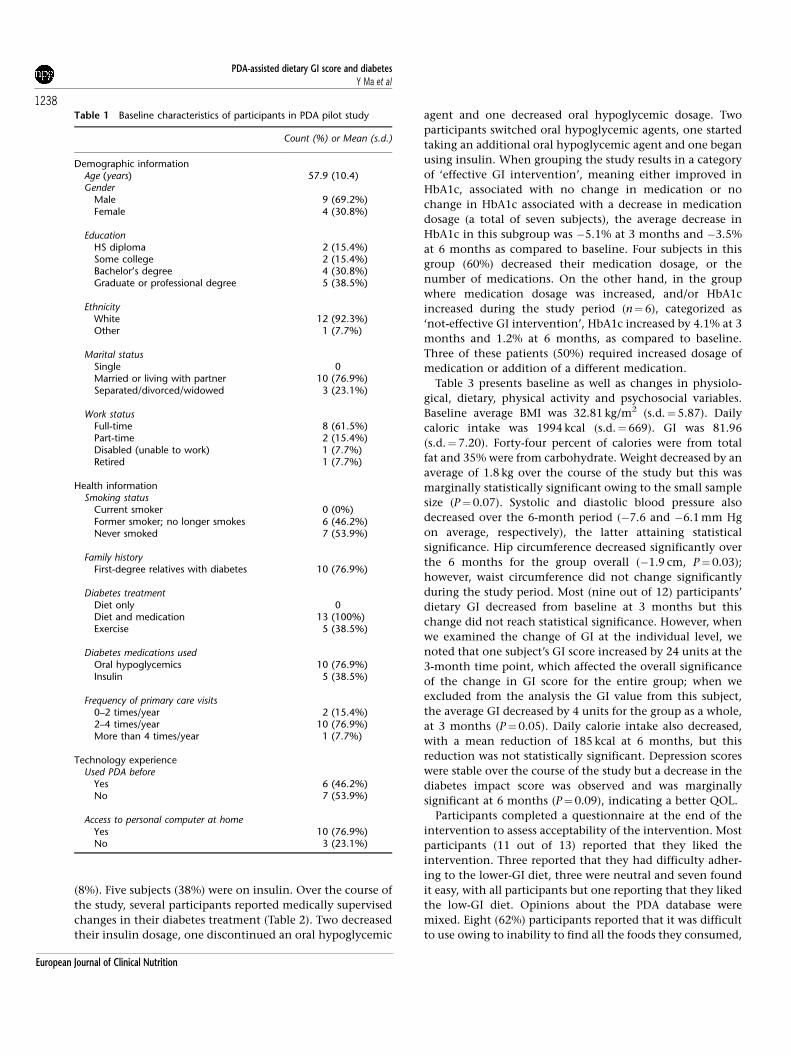
Table 1 Baseline characteristics of participants in PDA pilot study
Count (%) or Mean (s.d.)
Demographic informationAge (years) 57.9 (10.4)Gender
Male 9 (69.2%)Female 4 (30.8%)
EducationHS diploma 2 (15.4%)Some college 2 (15.4%)Bachelor’s degree 4 (30.8%)Graduate or professional degree 5 (38.5%)
EthnicityWhite 12 (92.3%)Other 1 (7.7%)
Marital statusSingle 0Married or living with partner 10 (76.9%)Separated/divorced/widowed 3 (23.1%)
Work statusFull-time 8 (61.5%)Part-time 2 (15.4%)Disabled (unable to work) 1 (7.7%)Retired 1 (7.7%)
Health informationSmoking status
Current smoker 0 (0%)Former smoker; no longer smokes 6 (46.2%)Never smoked 7 (53.9%)
Family historyFirst-degree relatives with diabetes 10 (76.9%)
Diabetes treatmentDiet only 0Diet and medication 13 (100%)Exercise 5 (38.5%)
Diabetes medications usedOral hypoglycemics 10 (76.9%)Insulin 5 (38.5%)
Frequency of primary care visits0–2 times/year 2 (15.4%)2–4 times/year 10 (76.9%)More than 4 times/year 1 (7.7%)
Technology experienceUsed PDA before
Yes 6 (46.2%)No 7 (53.9%)
Access to personal computer at homeYes 10 (76.9%)No 3 (23.1%)
PDA-assisted dietary GI score and diabetesY Ma et al
1238
European Journal of Clinical Nutrition

tedium of continuously recording diet, or screen size too
small. Five (38%) participants reported that it was fairly easy
to use the PDA.
Discussion
This study provides encouraging data regarding the feasi-
bility of a nutritionist-delivered low-GI intervention, assisted
by a PDA food database, for patients with type II diabetes.
The results support the feasibility of implementing a fully
powered RCT to explore the impact of a PDA-assisted low-GI
intervention on glycemic control in type II diabetes. There
were mixed reports regarding the usefulness of the PDAs;
however, participants offered helpful suggestions for further
development.
Glycemic response is influenced by several factors includ-
ing the nature of the monosaccharides absorbed, the amount
of carbohydrate consumed, the rate of absorption, and
colonic fermentation (Wolever, 2003). In addition, several
other factors affect the glycemic response to carbohydrates,
including acid content (Ostman et al., 2005), the proportion
of certain nutritional components (fat, protein) in the mixed
meal, the physical state of a food item (e.g., whole vs
ground), the content of non-nutrients in foods like legumes
(e.g., phytates), and, perhaps most important, the overall
fiber content of a meal (Nuttall, 1993; Wursch and Pi-Sunyer,
1997). The mechanisms of the proposed beneficial effects of
dietary fiber and a low-GI diet on glucose control remain
unclear, but they may include delayed gastric emptying,
altered transit time in the small intestine, insulation of
carbohydrate from digestive enzymes, and digestive enzyme
inhibition. Reducing overall carbohydrate intake can in-
crease postprandial serum free-fatty acids, whereas low-GI
diets have been shown to both reduce serum free-fatty acids
and improve glycemic control (Wolever, 2003).
Results from our study are consistent with a recent meta-
analysis of RCTs of low-GI diets among type I and type II
diabetic patients suggesting that choosing low-GI foods in
place of high-GI foods has a modest but clinically useful
effect on medium-term glycemic control (Brand-Miller et al.,
2003a). Among type I diabetic patients (Weyman-Daum
Table 2 Subject-specific HbA1c changes and medication changes
Subject ID Baseline medications BaselineHbA1c
Change(3-mon. tobaseline)
Change(6-mon. tobaseline)
Change(6-mon. to
3-mos.)
Medication changes
4 Metformin 500 mg 2� /day 10.1 �1.5 0 1.5 Switched to glyburide at 3 months;began insulin glargine at 6 months
7 Not on medication 8.2 — �0.3 — No change8 Metformin 100 mg 2� /day,
pioglitazone 35 mg 1� /day7.8 0 0 0 No change
10 Metformin 8 mg 1� /day, glyburide32 mg 12/day
8.3 �0.1 0 0.1 Discontinued glyburide, switchedfrom metformin to rosiglitazone4 mg at 6 months
12 Pioglitazone 1� /day, metformin3� /day, insulin lispro 15–75 unitsat mealtime, insulin glargine 50units at night
7.5 �0.1 �1.3 �1.2 Decreased insulin lispro by 80% at 6months
13 Insulin lispro 15 units 1� /day,insulin glargine 50 units 1� /day
7.0 0.2 �0.5 �0.7 No change
14 Rosiglitazone 2 mg 2� /day 8.2 �0.5 �1.7 �1.2 Added metformin at 6 months15 Metformin 850 mg 2� /day 7.1 0 0.1 0.1 No change18 Rosiglitazone 4 mg 1� /day 7.3 �0.1 0.7 0.8 Non-compliant—dropped
medications and increased dietaryand GI intake
24 Glimepiride 3 mg 1� /day,pioglitazone 15 mg 1� /day
7.4 �0.9 �0.9 0 Halved glimepiride dosage at 6months
25 Glyburide 5 mg 2� /day 8.0 �1.1 �1.2 �0.1 Added metformin at 3 months29 Insulin glargine 70 units 1� /day 9.7 �1.6 �1.3 0.3 Lowered insulin to 60 units at 6
months31 Glipizide 2 mg 2� /day,
pioglitazone 1 mg 1� /day, insulinlispro 16 units 1� /day and 20 units1� /day
7.4 �0.2 0 0.2 No change
Mean (s.d.) 8.00 (0.95)Mean (s.e.) �0.49 (0.20) �0.49 (0.19) �0.004 (0.20)P-value* 0.02 0.02 0.98
*P-values were from a mixed model for comparison of differences of least-squares means. Model was fit using HbA1c as dependent variable, time as independent
variable and subject as random effect. The overall P-value for the model was 0.03.
PDA-assisted dietary GI score and diabetesY Ma et al
1239
European Journal of Clinical Nutrition

et al., 1987; Giacco et al., 2000; Gilbertson et al., 2003), a low-
GI diet resulted in significant decreases in postprandial
plasma glucose levels, improved glycemic control and
reduction in hypoglycemic events. Results were consistent
among type II diabetic patients (Jenkins et al., 1988, 2002;
Gulliford et al., 1989; Wolever et al., 1992; Jarvi et al., 1999;
Tsihlias et al., 2000; Heilbronn et al., 2002; Kabir et al., 2002;
Brynes et al., 2003; Gilbertson et al., 2003), where low-GI diet
improved plasma glucose control and had the added benefit
of significantly decreasing cholesterol.
Supporting the results from our study, a limited number of
clinical trials have demonstrated that low-GI dietary educa-
tional interventions delivered by a clinical nutritionist can
lead to improved metabolic control in patients with diabetes
(Frost et al., 1994; Gilbertson et al., 2001, 2003; Rizkalla et al.,
2004). These reports are consistent with our findings. For
example, in a study performed in Britain, 60 patients with
type II diabetes were randomized to either a standard advice
group or a low-GI advice group over a 12-week period (Frost
et al., 1994). Results demonstrated that patients in the low-
GI diet group were successful in decreasing the GI of the food
they consumed. Fasting blood glucose, fructosamine, total
cholesterol and triglyceride levels showed a significantly
greater decrease in the low-GI group as compared to those of
the patients in the standard advice group.
As in our study, PDAs were used to monitor diet and blood
glucose readings for 6 months in a pilot study with 20
diabetic patients (Tsang et al., 2001). The dietary records
were transmitted to a computerized diabetes monitoring
system, and patients received immediate dietary feedback.
Although no other intervention was involved, a significant
improvement in glycemic control was reported. The study
also found that 95% of the patients found PDAs easy to
operate and 63% found them useful.
Critics of low-GI diets for diabetes often suggest that the
concept of the GI is too complicated and restrictive to be of
practical importance (Franz et al., 2003). Another potential
limitation that is shared with carbohydrate counting is that,
if not carefully chosen, a low-GI diet can be high in saturated
fat and cholesterol, both of which can increase serum lipids
and the associated cardiovascular disease risk (Neff, 2003).
Nutrition counseling can help ensure that the patient will
choose a healthy and balanced low-GI diet, with results from
initial trials suggesting that a structured low-GI diet can be a
safe and usable tool for the management of diabetes,
regardless of the patients’ education levels (Frost et al.,
1994; Gilbertson et al., 2001, 2003).
PDAs have been used for gathering data in several studies
(Taylor et al., 1990; Clarke et al., 1995; Shiffman et al., 1996;
Tiplady et al., 1997; Johannes et al., 2000). PDAs are ideally
suited as an intervention tool for several reasons: they are
compact and portable, and for the most part self-explanatory
in their operation. PDA prices have decreased significantly,
leading to a wider use in the population. The use of the PDA
in our study also provided a channel for interaction between
the user and the provider. Whereas further development of
the software is ongoing, the option of immediate feedback
on GI programmed into the PDA proved to be quite useful to
Table 3 Within-subject changes in physiological, dietary, physical activity, and psychosocial variables in PDA study between baseline and 3-monthpoint, between baseline and 6-month point and between 3- and 6-month points
Baseline Change (3 months to baseline) Change (6 months to baseline) Change (6 months to 3 months)
Mean (s.d.) Mean (s.e.) P-value* Mean (s.e.) P-value* Mean (s.e.) P-value*
Physiological variablesWeight (kg) 95.79 (19.60) �0.68 (0.92) 0.47 �1.77 (0.95) 0.07 �1.08 (0.95) 0.26Hip circumference (cm) 114.69 (11.14) �1.58 (0.78) 0.05 �1.85 (0.81) 0.03 �0.26 (0.81) 0.75Waist circumference (cm) 109.02 (15.12) 2.21 (0.99) 0.04 1.82 (1.03) 0.91 �0.39 (1.03) 0.71Systolic blood pressure (mmHg) 133.00 (13.35) 5.04 (4.23) 0.25 �7.64 (4.23) 0.08 �12.68 (4.34) 0.008Diastolic blood pressure (mmHg) 81.008 (7.06) �2.35 (2.03) 0.26 �6.07 (2.03) 0.007 �3.72 (2.08) 0.09
Dietary variablesGlycemic index (GI) 81.96 (7.20) �1.15 (2.42) 0.64 �1.86 (2.49) 0.47 �0.71 (2.56) 0.78Glycemic load (GL) 155.87 (74.86) 10.66 (32.30) 0.74 �27.30 (33.24) 0.42 �37.96 (34.11) 0.28Daily caloric intake (Kcal) 1993.54 (668.49) 135.41 (324.74) 0.68 �184.85 (334.36) 0.59 �320.25 (343.10) 0.36Fat percentage 43.95 (5.71) �0.64 (2.14) 0.77 1.45 (2.20) 0.52 2.09 (2.26) 0.37Saturated fat percentage 14.37 (2.56) �0.44 (0.74) 0.56 0.52 (0.76) 0.50 0.96 (0.78) 0.23Total daily carbohydrate (g) 179.25 (83.89) 16.82 (38.34) 0.67 �23.98 (39.45) 0.55 �40.80 (40.45) 0.32Carbohydrate percentage 34.98 (5.77) 0.69 (0.30) 0.77 �0.29 (2.37) 0.90 �0.98 (2.43) 0.69Daily dietary fiber (g) 13.31 (6.04) 1.14 (2.70) 0.68 0.11 (2.79) 0.97 �1.03 (2.86) 0.72
Leisure physical activity (min/week) 176.82 (168.30) �16.01 (53.23) 0.77 �21.61 (53.24) 0.69 �5.60 (57.84) 0.92
Psychosocial variablesDepression score (CES-D) 6.38 (4.84) 0.44 (1.80) 0.81 0.50 (1.85) 0.79 0.07 (1.87) 0.97Diabetes impact score 51.77 (14.01) �2.58 (3.39) 0.45 �6.16 (3.50) 0.09 �3.57 (3.52) 0.32
*P-values were from a mixed model from which we estimated mean within-subject differences over time. Models were fit using each physiological, dietary, physical
activity and psychosocial variable as the dependent variable, time as the independent variable and subject as a random effect.
PDA-assisted dietary GI score and diabetesY Ma et al
1240
European Journal of Clinical Nutrition

participants. Use of the PDA GI software addresses some of
the perceived barriers (Franz, 2003) to the implementation of
a low-GI nutrition intervention, as users are provided with
readily accessible information on low-GI foods. As suggested
by Henker and Colleagues (Henker et al., 2002), PDAs have
great potential to add to the effectiveness of protocol-driven
treatment interventions.
We observed a decrease in HbA1c and a change in overall
GI score during the study. At the same time, we noted that
total carbohydrate intake in the group as a whole also
decreased from an average of 180 g/day at baseline to 140 g/
day at 6 months. Although the change did not achieve
statistical significance (P¼0.32), it could have contributed to
the decrease in HbA1c levels. In addition, GL decreased 27
points between baseline and 6 months, so the change in
HbA1c may also be related to the decrease in GL.
There are some weaknesses in our study, including lack of
control group, small sample size, limited generalizability
owing to population characteristics, need for refinement of
the PDA food database and software, and potential measure-
ment error of the GI score. First, owing to the pilot nature
and design of our study, we were unable to examine which
components (nutritionist or PDA) of the intervention were
most important in achieving the results. Given that there
was only one arm, our results could be explained by the
combination of the intervention, placebo effects, and
regression to the mean. Second, firm conclusions about
effectiveness cannot be derived from our data given the
small sample size and demographic characteristics of the
study population. The fact that changes were generally in a
consistently favorable direction, and that some changes were
large enough to be statistically significant, however, is
encouraging and indicates that a larger study is warranted.
Participants were primarily white, highly educated, above
average income levels and, although about half had no PDA
experience, most had very positive attitudes towards the
possibility that the PDAs would help them. Thus, general-
izability is limited. This pilot study provided important
information on efficacy, rather than effectiveness. We are
investigating this further in a more diverse population,
which is currently underway. Third, the PDA database and
software require further development. The PDA develop-
ment would include expansion of the database to increase
patient satisfaction with their ability to obtain information
on common foods, and an automated and personalized
feedback system, in as close to real time as possible. Finally,
structured assessment instruments, such as the 7DDR, used
in our pilot study, have been associated with a variety of
measurement errors (Hebert et al., 1997a, 2001, 2002) with
particular concern regarding the estimation of the GI.
Collapsing foods into groups, rather than using specific
foods and food quantities, could increase measurement error
of GI with the 7DDR. Therefore, several 24-h diet recalls,
which utilize the multiple pass recall methodology, may
generate greater accuracy in future studies; however, this is
more labor intensive.
Strengths of this pilot study include the fact that it was
conducted in the clinical, ‘real-world’ setting, and that it
attempted to address the perceived barriers to implementa-
tion of the GI score concept, using a technological device
that is gaining acceptability in the general population.
The Dietary Guidelines for Americans (Marlett et al., 2002;
US Department of Health and Human Services, 2005) stress
an increase in consumption of whole grains, dietary fiber,
fruit and vegetables, all of which are intrinsic to the low-GI
diet, but are not necessarily part of the carbohydrate
counting method. Optimal dietary management of diabetes
may involve a combination of the two: decreasing the GI
score of the diet, as well as the amount of carbohydrates
consumed per day.
Diet is a fundamental component in the management of
type II diabetes, but adherence to dietary recommendations
is a challenging issue. Refinements in instruments that foster
adherence are urgently needed. Technological devices such
as the PDAs to promote adherence to dietary interventions
via facilitation of food choices and real-time feedback appear
to improve diabetes control.
In conclusion, results of this pilot study support the
feasibility of implementing a nutritionist-delivered, PDA-
assisted, low-GI dietary intervention for patients with poorly
controlled type II diabetes. Randomized controlled trials
testing the efficacy of PDA-assisted low-GI diet on glycemic
control are justified. On the other hand, although partici-
pants’ perceptions regarding the practicality of the PDAs
were positive overall, a more comprehensive GI database
with ‘real-time’ personalized feedback is needed.
Acknowledgements
The project described was supported by an internal grant
from the University of Massachusetts Medical School to Dr
Yunsheng Ma. We thank Dr Judith K Ockene for her
consistent encouragement and support of this work; Mr
Hongzhen Zhang who helped with the innovative idea of
proactive control and management of human activities
through computer software; Mr Keith Crozier and Dr Frank
J Domino for the development of the PDA software; Ms Mary
Jane Campbell for her assistance with study recruitment and
data collection; Ms Victoria Andersen for her assistance with
the intervention; Ms Jennifer Griffith for her assistance in
creating GI database for PDA; and Ms Annie Culver, BS
Pharm for her assistance in understanding pharmacological
issues related to participants.
References
Atkins RC (1998). Dr. Atkins’ New Diet Revolution. Avon Books:New York.
Brand-Miller J, Hayne S, Petocz P, Colagiuri S (2003a). Low-glycemicindex diets in the management of diabetes: a meta-analysis ofrandomized controlled trials. Diabetes Care 26, 2261–2267.
PDA-assisted dietary GI score and diabetesY Ma et al
1241
European Journal of Clinical Nutrition

Brand-Miller J, Wolever TM, Foster-Powell K, Colagiuri S (2003b). TheNew Glucose Revolution: The Authoritative Guide to the GlycemicIndex—The Dietary Solution for Lifelong Health. Marlowe & Com-pany: New York, NY.
Brynes AE, Lee JL, Brighton RE, Leeds AR, Dornhorst A, Frost GS(2003). A low glycemic diet significantly improves the 24-h bloodglucose profile in people with type 2 diabetes, as assessed usingthe continuous glucose MiniMed monitor. Diabetes Care 26,548–549.
Clarke WL, Cox DJ, Gonder-Frederick LA, Julian D, Schlundt D,Polonsky W (1995). Reduced awareness of hypoglycemia in adultswith IDDM. A prospective study of hypoglycemic frequency andassociated symptoms. Diabetes Care 18, 517–522.
Devins G, Orme C (1985). Center for epidemiologic studiesdepression scale. Sweetland R (ed). Test Critiques. Test Corp ofAmerica, a subsidiary of Westport Publishers, Inc.: Kansas City.pp 144–160.
Foster-Powell K, Holt SH, Brand-Miller JC (2002). International tableof glycemic index and glycemic load values: 2002. Am J Clin Nutr76, 5–56.
Franz MJ (2003). Meta-analysis of low-glycemic index diets in themanagement of diabetes: response to brand—Miller et al. andMann. Diabetes Care 26, 3364–3365.
Franz MJ, Bantle JP, Beebe CA, Brunzell JD, Chiasson JL, Garg A et al.(2003). Evidence-based nutrition principles and recommendationsfor the treatment and prevention of diabetes and relatedcomplications. Diabetes Care 26, S51–S61.
Frost G, Wilding J, Beecham J (1994). Dietary advice based on theglycaemic index improves dietary profile and metabolic control intype 2 diabetic patients. Diabetes Med 11, 397–401.
Giacco R, Parillo M, Rivellese AA, Lasorella G, Giacco A, D’Episcopo Let al. (2000). Long-term dietary treatment with increased amountsof fiber-rich low-glycemic index natural foods improves bloodglucose control and reduces the number of hypoglycemic eventsin type 1 diabetic patients. Diabetes Care 23, 1461–1466.
Gilbertson HR, Brand-Miller JC, Thorburn AW, Evans S, Chondros P,Werther GA (2001). The effect of flexible low glycemic indexdietary advice versus measured carbohydrate exchange diets onglycemic control in children with type 1 diabetes. Diabetes Care24, 1137–1143.
Gilbertson HR, Thorburn AW, Brand-Miller JC, Chondros P, WertherGA (2003). Effect of low-glycemic-index dietary advice on dietaryquality and food choice in children with type 1 diabetes. Am J ClinNutr 77, 83–90.
Gulliford MC, Bicknell EJ, Scarpello JH (1989). Differential effect ofprotein and fat ingestion on blood glucose responses to high- andlow-glycemic-index carbohydrates in noninsulin-dependentdiabetic subjects. Am J Clin Nutr 50, 773–777.
Hebert J, Ebbeling C, Matthews C, Ma Y, Clemow L, Hurley T et al.(2002). Systematic errors in middle-aged women’s estimates ofenergy intake: comparing three self-report measures to totalenergy expenditure from doubly labeled water. Ann Epidemiol 12,577–586.
Hebert JR, Ma Y, Clemow L, Ockene IS, Saperia G, Stanek E et al.(1997a). Gender difference in social desirability and socialapproval bias in dietary self-report. Am J Epidemiol 146,1046–1055.
Hebert JR, Ockene IS, Hurley TG, Luippold R, Well AD, Harmatz MG(1997b). Development and testing of a seven-day dietary recall.J Clin Epidemiol 50, 925–937.
Hebert JR, Peterson KE, Hurley TG, Stoddard AM, Cohen N, Field AEet al. (2001). The effect of social desirability trait on self-reporteddietary measures among multi-ethnic female health centeremployees. Ann Epidemiol 11, 417–427.
Heilbronn LK, Noakes M, Clifton PM (2002). The effect of high- andlow-glycemic index energy restricted diets on plasma lipid andglucose profiles in type 2 diabetic subjects with varying glycemiccontrol. J Am Coll Nutr 21, 120–127.
Henker B, Whalen CK, Jamner LD, Delfino RJ (2002). Anxiety, affect,and activity in teenagers: monitoring daily life with electronicdiaries. J Am Acad Child Adolesc Psychiatry 41, 660–670.
Jarvi AE, Karlstrom BE, Granfeldt YE, Bjorck IE, Asp NG, Vessby BO(1999). Improved glycemic control and lipid profile and normal-ized fibrinolytic activity on a low-glycemic index diet in type 2diabetic patients. Diabetes Care 22, 10–18.
Jenkins AL, Jenkins DJ, Zdravkovic U, Wursch P, Vuksan V (2002).Depression of the glycemic index by high levels of beta-glucanfiber in two functional foods tested in type 2 diabetes. Eur J ClinNutr 56, 622–628.
Jenkins DJ, Wolever TM, Buckley G, Lam KY, Giudici S, Kalmusky Jet al. (1988). Low-glycemic-index starchy foods in the diabeticdiet. Am J Clin Nutr 48, 248–254.
Jenkins DJ, Wolever TM, Taylor RH, Barker H, Fielden H, Baldwin JMet al. (1981). Glycemic index of foods: a physiological basis forcarbohydrate exchange. Am J Clin Nutr 34, 362–366.
Johannes CB, Crawford SL, Woods J, Goldstein RB, Tran D, MehrotraS et al. (2000). An electronic menstrual cycle calendar:comparison of data quality with a paper version. Menopause 7,200–208.
Kabir M, Oppert JM, Vidal H, Bruzzo F, Fiquet C, Wursch P et al.(2002). Four-week low-glycemic index breakfast with a modestamount of soluble fibers in type 2 diabetic men. Metabolism 51,819–826.
Littell R, Milliken G, Stroup W, Wolfinger R (1996). SAS System forMixed Models. SAS Institute Inc.: Cary, NC.
Ma Y, Li Y, Chiriboga D, Olendzki B, Hebert J, Li W et al. (2006).Association between carbohydrate intake and serum lipids. J AmColl Nutr 25(2), 155–163.
Ma Y, Olendzki B, Chiriboga D, Hebert J, Li Y, Li W et al. (2005).Association between dietary carbohydrates and body weight. Am JEpidemiol 161, 359–367.
Marlett JA, McBurney MI, Slavin JL (2002). Position of the AmericanDietetic Association: health implications of dietary fiber. J Am DietAssoc 102, 993–1000.
Matthews CE, Freedson P, Hebert J, Stanek E, Ockene I, Merriam P(2000). Comparison of physical activity assessment methods inthe seasonal variation of blood cholesterol levels study. Med SciSports Exerc 32, 976–984.
Matthews CE, Hebert JR, Ockene IS, Saperia G, Merriam PA (1997).The inter-relation between leisure time physical activity andselected dietary variables. Med Sci Sports Exerc 29, 1199–1207.
Neff LM (2003). Evidence-based dietary recommendations forpatients with type 2 diabetes mellitus. Nutr Clin Care 6, 51–61.
Nuttall FQ (1993). Dietary fiber in the management of diabetes.Diabetes 42, 503–508.
Ostman E, Granfeldt Y, Persson L, Bjorck I (2005). Vinegarsupplementation lowers glucose and insulin responses andincreases satiety after a bread meal in healthy subjects. Eur J ClinNutr 59, 983–988.
Rosal MC, Olendzki B, Reed GW, Gumieniak O, Scavron J,Ockene I (2005). Diabetes self-management among low-incomeSpanish speaking patients: a pilot study. Ann Behav Med 29(3),225–235.
Radloff L (1977). The CES-D scale: a self-report depression scalefor research in the general population. Appl Psychol Meas 1,385–401.
Rizkalla SW, Taghrid L, Laromiguiere M, Huet D, Boillot J, Rigoir Aet al. (2004). Improved plasma glucose control, whole-bodyglucose utilization, and lipid profile on a low-glycemic index dietin type 2 diabetic men: a randomized controlled trial. DiabetesCare 27, 1866–1872.
Schwartz CE, Welch G, Santiago-Kelley P (2005). Cultural challengesin developing a diabetes CAT tool for Hispanics and non-Hispanicspatients. Ann Behav Med 29, S38.
Shiffman S, Gnys M, Richards TJ, Paty JA, Hickcox M, Kassel JD(1996). Temptations to smoke after quitting: a comparison oflapsers and maintainers. Health Psychol 15, 455–461.
PDA-assisted dietary GI score and diabetesY Ma et al
1242
European Journal of Clinical Nutrition
Sturrock ND, Pound N, Peck GM, Soar CM, Jeffcoate WJ (1997). Anassessment of blood pressure measurement in a diabetic clinicusing random-zero, semi-automated, and 24-hour monitoring.Diabetes Med 14, 370–375.
Taylor CB, Fried L, Kenardy J (1990). The use of a real-time computerdiary for data acquisition and processing. Behav Res Ther 28, 93–97.
Tiplady B, Crompton G, GE BF Matusiewicz S, Campbell L,Brackenridge D (1997). The use of electronic diaries in respiratorystudies. Drug Inf J 31, 759–764.
Totterdell P, Spelten E, Pokorski J (1995). The effects of nightwork onpsychological changes during the menstrual cycle. J Adv Nurs 21,996–1005.
Tsang MW, Mok M, Kam G, Jung M, Tang A, Chan U et al. (2001).Improvement in diabetes control with a monitoring system basedon a hand-held, touch-screen electronic diary. J Telemed Telecare 7,47–50.
Tsihlias EB, Gibbs AL, McBurney MI, Wolever TM (2000). Compar-ison of high- and low-glycemic-index breakfast cereals with
monounsaturated fat in the long-term dietary management oftype 2 diabetes. Am J Clin Nutr 72, 439–449.
US Department of Health and Human Services (HHS) and theDepartment of Agriculture (USDA) (2005). Dietary Guidelines forAmericans.
Weyman-Daum M, Fort P, Recker B, Lanes R, Lifshitz F (1987).Glycemic response in children with insulin-dependent diabetesmellitus after high- or low-glycemic-index breakfast. Am J ClinNutr 46, 798–803.
Wolever TM (2003). Carbohydrate and the regulation of bloodglucose and metabolism. Nutr Rev 61, S40–S48.
Wolever TM, Jenkins DJ, Vuksan V, Jenkins AL, Wong GS, Josse RG(1992). Beneficial effect of low-glycemic index diet in overweightNIDDM subjects. Diabetes Care 15, 562–564.
Wursch P, Pi-Sunyer FX (1997). The role of viscous soluble fiberin the metabolic control of diabetes. A review with specialemphasis on cereals rich in beta-glucan. Diabetes Care 20,1774–1780.
PDA-assisted dietary GI score and diabetesY Ma et al
1243
European Journal of Clinical Nutrition

Copyright © 2022 FDOKUMEN