nutritional status, glycemic control and barriers to treatment
Upload
khangminh22Category
view
2download
0
Glycemic Control Markers to Pounded Plantain Varying in Cultivar Plantain (Musa spp., AAB group: cv afoto,
cv agnrin, cv ameletiha)
Kouamé Adam Camille1,2*; Abodo Jacko Rhedoor3; Coulibaly Aissatou1,2; N’dri Yao Denis2; Pereko Kingsley Kwadwo Asare4 and Amani N’guessan Georges2
1Food Biochemistry and Tropical Products Technology laboratory, Nutrition Section, Department of Food Science and Technology, University Nangui Abrogoua, PO box 801 Abidjan 02, Cote d’Ivoire
2Food Biochemistry and Tropical Products Technology Laboratory, Biochemistry and Food Technology Section, Department of Food Science and Technology, University Nangui Abrogoua, PO box 801 Abidjan 02, Cote d’Ivoire
3Endocrinology Diabetes Nutrition, CHU Yopougon, P.O. Box 632 Abidjan 23, Cote d’Ivoire 4Department of Community Medicine, School of Medical Sciences, PMB University of Cape Coast, Cape Coast,
University Post Office, University Avenue Central Region, Ghana 00233; Ghana Email: [email protected]
Abstract. The rapid increase in diabetes incidence in Côte d’Ivoire indicates the need to evaluate the nutritional profile of foods. In this study, we performed a nutritional characterization and glycemic index/load (GI/GL) of pounded plantain, which is the predominant mode of banana consumption. Five groups of 13 apparently healthy subjects consumed in random order 5 experimental products variants and twice a glucose solution. Proximate composition was conducted by AOAC standard methods. The GI was obtained following ISO/FDI 26642:2010 protocol and the GL was calculated from test food’s GI, considering the amount of available carbohydrate in the traditional portion size. Moisture of samples ranged from 55.8–70.9g/100g. Based on dry weight per 100 gram, the samples had 0.2-0.8g ash, 0.3-1.3g lipids, 3.5-10.5g protein, 1.8-1.9g crude fibre, 86.8-94.1g carbohydrates and 398.4-403.5kcal for energy. Excepted pounded plantain from agnrin variety at “green” stage of ripeness (GI 40), the corresponding GI values were high (GI 75-84). The GL values of the foods tested were also considered high, varying from 60 to 144. Data showed that pounded plantain is potentially a source of high GI/GL carbohydrate.
Keywords: Nutritional profile, glycemic index, glycemic load, pounded plantain, cultivar.
1 Introduction
Glycemic index (GI) and glycemic load (GL) concepts are used throughout the world in the management of blood sugar levels among diabetic patients and other related disorders. They are physiological indicators differentiating carbohydrate-containing food products, depending on the degree of increase in postprandial blood glucose [1]. Based on meta-analysis of intervention trials conducted over the past decades, it is estimated that low GI/GL foods have a more favourable health profile than high GI/GL [2]. Low GI/GL foods intake is associated with an improved prevention and control metabolic and cardiovascular diseases (e. g., diabetes and myocardial infarction) [1]. However, in Côte d’Ivoire, little information regarding the GI/GL of local meals is available whereas the Ivorian diet is characterized by its high carbohydrates content. In this Ivorian diet, the plantain remains an important traditional staple food for both rural and urban populace. It should be noted that the plantain-banana (Musa paradisiacal normalis) is a staple food for millions people of worldwide, particularly in sub-tropical countries with global production estimated at 139.1 MT in 2012 [3]. In Côte d’Ivoire, it is the third food crop (1.5 MT/year) among the most consumed foods after yams and cassava for a consumption estimated at 120 kg/capita/year [4]. Plantain-banana can be referred to cooking-banana (Musa acuminate) and it is consumed after cooking at desired stages of maturation or ripeness [5] to provide dietary energy and good quality diet in urban and rural income in West Africa [6]. During the
Advances in Food Science and Engineering, Vol. 2, No. 4, December 2018 https://dx.doi.org/10.22606/afse.2018.24001 99
Copyright © 2018 Isaac Scientific Publishing AFSE
process of maturation before the cooking of banana, starch, pectin, cellulose and hemicellulose in internal fruit change dramatically due to the action of enzymes, and especially the starch is progressively converted to sugar as ripening progresses [7]. The cooking also increases the digestibility of starch by gelatinization, which facilitates enzymatic degradation in the gut [5]. Both sugar content and starch gelatinization during ripeness stages and cooking could have a significant impact on blood glucose metabolism, thereby generating long-term metabolic disorders such as diabetes mellitus [8], which has become an issue of public health in Côte d’Ivoire. According to variety and ripeness stage, plantain is used for many foods in which the most appreciated by the Ivorian population is pounded plantain or "foutou banane" eaten with vegetable sauces [5]. Pounded plantain is considered as delicacy. Our previous study showed that only five pounded plantains are the preference of consumers according to variety and maturation stage of plantain in urban areas of Abidjan-Côte d'Ivoire [5]. In view of these concerns, the objective of this research was to evaluate the nutritional quality and GI/GL to “foutou banane” varying in cultivar plantain as for cv afoto, cv agnrin, cv ameletiha (Musa spp., AAB group).
2 Materials and Methods
2.1 Setting
The study was conducted at the Department of Foods Sciences and Technologies of University Nangui Abrogoua using internationally recognized GI methodology [9],[10]. All clinical procedures were carried out at the Endocrinology and Diabetology Center, CHU Yopougon, Abidjan, Côte d’Ivoire.
2.2 Subjects
The study involved a total of 65 (44 men and 21 women) healthy non-obese and physically active volunteers. Each food was tested by 13 individuals. The subjects were recruited at the University Nangui Abrogoua among the staff and students through advertisement. All interested subjects were screened for eligibility through an interview and received an information brochure about the purpose and the protocol of the study. At the screening visit, these subjects had to fill in a medical and general questionnaire. Subjects with a family history of cardiovascular diseases and diabetes mellitus, a history of renal or liver disease, surgery within the previous 6 months, use of drug therapy, and women who were pregnant or lactating were excluded from the study. Smokers were also excluded from the study. The subjects were selected on age (18 – 40 yrs), BMI (19 – 25 kg/m2) and fasting blood glucose value (4 – 5.5 mmol/L) basis. Glycated haemoglobin (HbA1c) was also evaluated and subjects with an HbA1c < 7 % were included in the study. Anthropometric measurements were carried out for all the subjects using standardized methods before the start of the study. Height was recorded to the nearest centimeter using a Stadiometer (Seca Limited, Birmingham, West Midlands, UK) with the subjects standing erect without shoes. Body weight was recorded using the Tanita BC-418 MA (Tanita UK Limited, Yiewsley, Middlesex, UK) with the subjects wearing light clothing and no shoes and blood pressure was measured with an automatic device (A & D Company Ltd., Tokyo, Japan). Determination of HbA1c was assessed with a Bio-Rad’s DiaSTAT™ Hemoglobin A1C Analyzer. Subjects’ characteristics are summarized in Table 1. All subjects fulfilled the criteria recommended for the measurement of GI of foods [10].
2.3 Study Meals
The reference food glucose (Glucose pur anhydre, COOPER, Place Lucien Anvert) was from Arts Pharmacy Limited in Abidjan-District, Côte d’Ivoire. The glucose reference was prepared using 50 g of anhydrous glucose dissolved in 250 mL of water of tap. The GIs of five experimental food products: pounded plantain from afoto variety at “light green” stage of ripeness (Faf2), pounded plantain from afoto variety at “yellow with green tip” stage of ripeness (Faf5), pounded plantain from agnrin at “green” stage of ripeness (Fag1), pounded plantain from agnrin variety at “more yellow than green” stage of ripeness (Fag4) and a pounded plantain from ameletiha variety at maturity stage half-green, half yellow (Fam3) were determined. Fresh and mature fruits of false horn plantain (Musa spp., AAB group, cv afoto), french horn plantain (Musa spp., AAB group, cv agnrin) and french plantain (Musa
100 Advances in Food Science and Engineering, Vol. 2, No. 4, December 2018
AFSE Copyright © 2018 Isaac Scientific Publishing
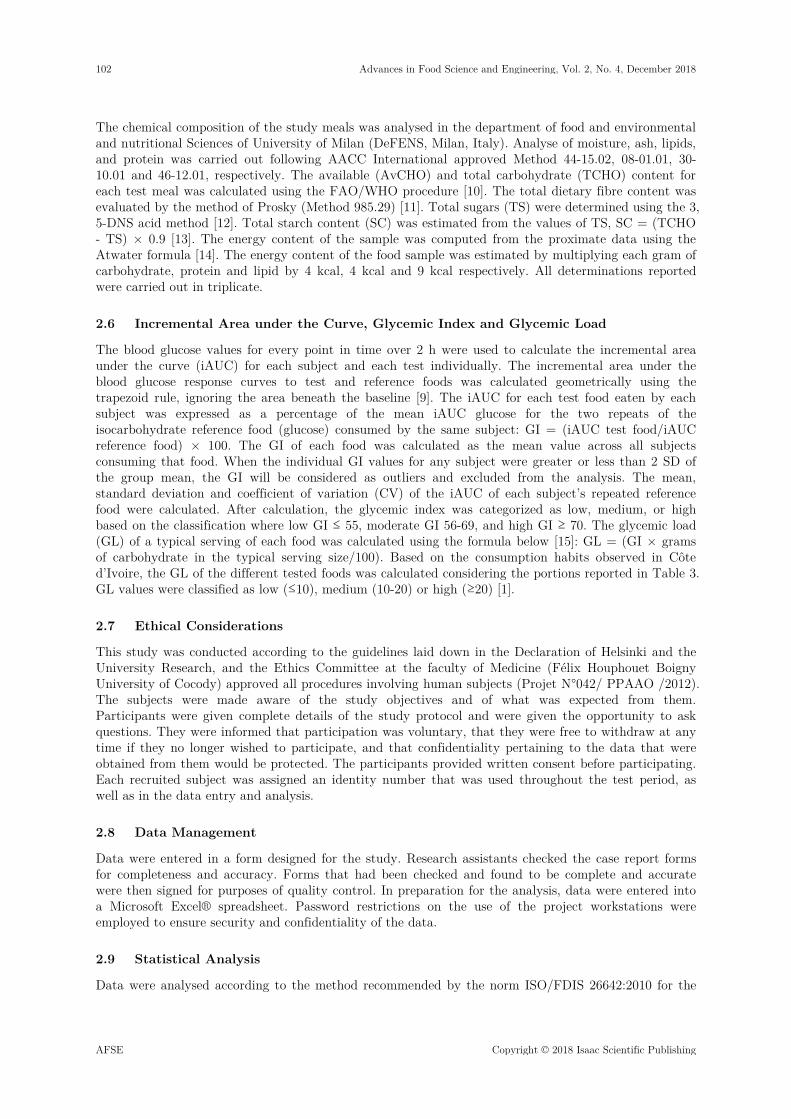
spp., AAB group, cv ameletiha) were used in this experiment. Fruits were purchased in the local market of Yopougon-Siporex, Abidjan-District (Côte d’Ivoire) in quantities sufficient to conduct all tests. In order to make sample more homogeneous, each batch of plantain was bought on a single day from the same seller and stored in the laboratory under the same conditions, at room temperature (28°± 2°C) and relative humidity of 80 – 90 %. Fruit stages of maturation were controlled in laboratory at room temperature. The foutou banane was prepared with pulp fruit of cv afoto at ripeness stages 2 (light green) and 5 (yellow with green tip), cv agnrin at stages 1 (green) and 4 (more yellow than green) and cv ameletiha at stage 3 (half green, half yellow) according to the preference of Ivorian consumers as described by our previous study [5]. The recipe preparation of pounded plantain was as follows: plantain and cassava (Manihot esculenta Crantz, variety IAC) were washed and peeled. Plantain was sliced lengthways into two with a stainless steel knife to cut out the black spots (atrophied seeds). Peeled cassava (30 %) and plantain pieces (70 %) were boiled with water (3:7w/v) for 1 h until soft. After cooling, the water was drained and the boiled plantain/cassava was transferred into a traditional wooden mortar and pounded to obtain a smooth consistent paste. Pounded plantain sample was moulded into spherical balls (Figure 1).
Figure 1. Pounded plantain (foutou banane)
2.4 Study Protocol
The protocol was performed in accordance with the international standard GI testing protocol [9], in line with procedures recommended by the FAO/WHO Expert Consultation [10]. The study was designed as a randomized, controlled study with 5 groups of 13 healthy volunteers. Each group of 13 volunteers consumed in random order the test product and twice a glucose solution as reference. Subjects were invited to attend the test’s sessions on seven consecutive occasions with a 2-day interval between test days. The plantain dishes were prepared on the day of testing following the common practices used by the local food household in Côte d’Ivoire. All foods were tested in portions containing equivalent available carbohydrate amounts (50 g). On the day before a test, subjects were asked to restrict their intake of alcohol and caffeine-containing drinks and to restrict their participation in intense physical activity. The order of test foods was randomized and all the foods were tested after a 12-h overnight fast. Blood glucose concentrations were measured in the capillary whole blood obtained by finger prick (Accu-Chek® Fastclix Lancing Device -Castle Hill, NSW, Australia) in the fasted state and at 15, 30, 45, 60, 90 and 120 min after the start of the meal. Blood glucose was measured using a calibrated Accu-Chek® Performa glucometer (Accu-Chek Performa, Roche Diagnostic, Castle Hill, NSW, Australia). The reference or test foods were consumed at an even pace over 15 min and the participants remained seated throughout at a comfortable place. Each morning before and after testing, the correct functioning of the instruments was checked by using a manufacturer’s control. During the study, subjects were advised to continue their customary daily activities without any change in their physical activities.
2.5 Chemical Analysis of Plantain-based Meals
Advances in Food Science and Engineering, Vol. 2, No. 4, December 2018 101
Copyright © 2018 Isaac Scientific Publishing AFSE
The chemical composition of the study meals was analysed in the department of food and environmental and nutritional Sciences of University of Milan (DeFENS, Milan, Italy). Analyse of moisture, ash, lipids, and protein was carried out following AACC International approved Method 44-15.02, 08-01.01, 30-10.01 and 46-12.01, respectively. The available (AvCHO) and total carbohydrate (TCHO) content for each test meal was calculated using the FAO/WHO procedure [10]. The total dietary fibre content was evaluated by the method of Prosky (Method 985.29) [11]. Total sugars (TS) were determined using the 3, 5-DNS acid method [12]. Total starch content (SC) was estimated from the values of TS, SC = (TCHO - TS) × 0.9 [13]. The energy content of the sample was computed from the proximate data using the Atwater formula [14]. The energy content of the food sample was estimated by multiplying each gram of carbohydrate, protein and lipid by 4 kcal, 4 kcal and 9 kcal respectively. All determinations reported were carried out in triplicate.
2.6 Incremental Area under the Curve, Glycemic Index and Glycemic Load
The blood glucose values for every point in time over 2 h were used to calculate the incremental area under the curve (iAUC) for each subject and each test individually. The incremental area under the blood glucose response curves to test and reference foods was calculated geometrically using the trapezoid rule, ignoring the area beneath the baseline [9]. The iAUC for each test food eaten by each subject was expressed as a percentage of the mean iAUC glucose for the two repeats of the isocarbohydrate reference food (glucose) consumed by the same subject: GI = (iAUC test food/iAUC reference food) × 100. The GI of each food was calculated as the mean value across all subjects consuming that food. When the individual GI values for any subject were greater or less than 2 SD of the group mean, the GI will be considered as outliers and excluded from the analysis. The mean, standard deviation and coefficient of variation (CV) of the iAUC of each subject’s repeated reference food were calculated. After calculation, the glycemic index was categorized as low, medium, or high based on the classification where low GI ≤ 55, moderate GI 56-69, and high GI ≥ 70. The glycemic load (GL) of a typical serving of each food was calculated using the formula below [15]: GL = (GI × grams of carbohydrate in the typical serving size/100). Based on the consumption habits observed in Côte d’Ivoire, the GL of the different tested foods was calculated considering the portions reported in Table 3. GL values were classified as low (≤10), medium (10-20) or high (≥20) [1].
2.7 Ethical Considerations
This study was conducted according to the guidelines laid down in the Declaration of Helsinki and the University Research, and the Ethics Committee at the faculty of Medicine (Félix Houphouet Boigny University of Cocody) approved all procedures involving human subjects (Projet N°042/ PPAAO /2012). The subjects were made aware of the study objectives and of what was expected from them. Participants were given complete details of the study protocol and were given the opportunity to ask questions. They were informed that participation was voluntary, that they were free to withdraw at any time if they no longer wished to participate, and that confidentiality pertaining to the data that were obtained from them would be protected. The participants provided written consent before participating. Each recruited subject was assigned an identity number that was used throughout the test period, as well as in the data entry and analysis.
2.8 Data Management
Data were entered in a form designed for the study. Research assistants checked the case report forms for completeness and accuracy. Forms that had been checked and found to be complete and accurate were then signed for purposes of quality control. In preparation for the analysis, data were entered into a Microsoft Excel® spreadsheet. Password restrictions on the use of the project workstations were employed to ensure security and confidentiality of the data.
2.9 Statistical Analysis
Data were analysed according to the method recommended by the norm ISO/FDIS 26642:2010 for the
102 Advances in Food Science and Engineering, Vol. 2, No. 4, December 2018
AFSE Copyright © 2018 Isaac Scientific Publishing
foods product. iAUC and GI/GL were calculated using an Excel spreadsheet (Microsoft Excel® 2013). Data are presented as means, standard deviations (SD) and range. The statistical significance of the differences between blood glucose concentrations at different time points, the incremental peaks, the iAUCs and GI values were assessed by using the one-way analysis of variance (RM-ANOVA). If analysis of variance was significant, a paired sampled t-test was used to determine the mean differences in iAUC or GI between paired foods. Levels of inter- and intra-individual variation of the standard (glucose) tests were assessed by determining the CV [CV % = 100 × (SD/mean)]. Statistical analysis of the proximate composition between food samples was also performed with repeated-measures analysis of variance (ANOVA) with Tukey test to adjust for multiple comparisons (SPSS version 17.0, SPSS Inc., Chicago, IL). Differences were considered significant at p < 0.05.
3 Results
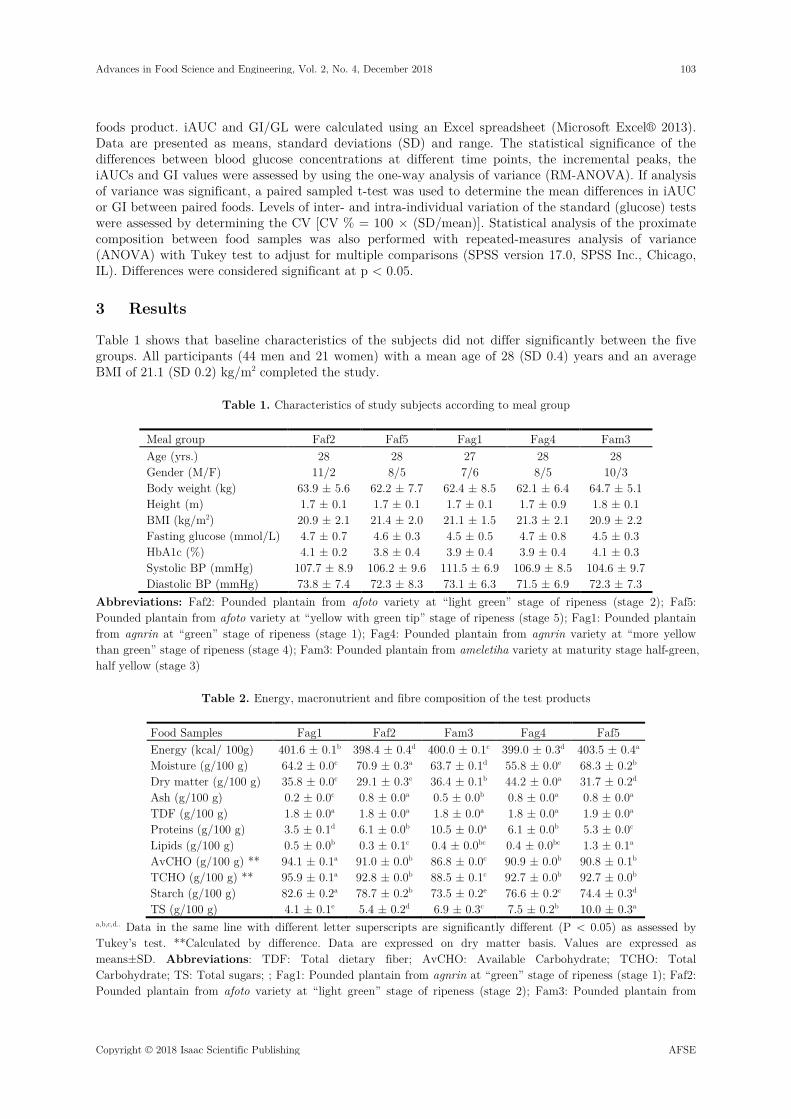
Table 1 shows that baseline characteristics of the subjects did not differ significantly between the five groups. All participants (44 men and 21 women) with a mean age of 28 (SD 0.4) years and an average BMI of 21.1 (SD 0.2) kg/m2 completed the study.
Table 1. Characteristics of study subjects according to meal group
Meal group Faf2 Faf5 Fag1 Fag4 Fam3 Age (yrs.) 28 28 27 28 28 Gender (M/F) 11/2 8/5 7/6 8/5 10/3 Body weight (kg) 63.9 ± 5.6 62.2 ± 7.7 62.4 ± 8.5 62.1 ± 6.4 64.7 ± 5.1 Height (m) 1.7 ± 0.1 1.7 ± 0.1 1.7 ± 0.1 1.7 ± 0.9 1.8 ± 0.1 BMI (kg/m2) 20.9 ± 2.1 21.4 ± 2.0 21.1 ± 1.5 21.3 ± 2.1 20.9 ± 2.2 Fasting glucose (mmol/L) 4.7 ± 0.7 4.6 ± 0.3 4.5 ± 0.5 4.7 ± 0.8 4.5 ± 0.3 HbA1c (%) 4.1 ± 0.2 3.8 ± 0.4 3.9 ± 0.4 3.9 ± 0.4 4.1 ± 0.3 Systolic BP (mmHg) 107.7 ± 8.9 106.2 ± 9.6 111.5 ± 6.9 106.9 ± 8.5 104.6 ± 9.7 Diastolic BP (mmHg) 73.8 ± 7.4 72.3 ± 8.3 73.1 ± 6.3 71.5 ± 6.9 72.3 ± 7.3
Abbreviations: Faf2: Pounded plantain from afoto variety at “light green” stage of ripeness (stage 2); Faf5: Pounded plantain from afoto variety at “yellow with green tip” stage of ripeness (stage 5); Fag1: Pounded plantain from agnrin at “green” stage of ripeness (stage 1); Fag4: Pounded plantain from agnrin variety at “more yellow than green” stage of ripeness (stage 4); Fam3: Pounded plantain from ameletiha variety at maturity stage half-green, half yellow (stage 3)
Table 2. Energy, macronutrient and fibre composition of the test products
Food Samples Fag1 Faf2 Fam3 Fag4 Faf5 Energy (kcal/ 100g) 401.6 ± 0.1b 398.4 ± 0.4d 400.0 ± 0.1c 399.0 ± 0.3d 403.5 ± 0.4a Moisture (g/100 g) 64.2 ± 0.0c 70.9 ± 0.3a 63.7 ± 0.1d 55.8 ± 0.0e 68.3 ± 0.2b Dry matter (g/100 g) 35.8 ± 0.0c 29.1 ± 0.3e 36.4 ± 0.1b 44.2 ± 0.0a 31.7 ± 0.2d Ash (g/100 g) 0.2 ± 0.0c 0.8 ± 0.0a 0.5 ± 0.0b 0.8 ± 0.0a 0.8 ± 0.0a TDF (g/100 g) 1.8 ± 0.0a 1.8 ± 0.0a 1.8 ± 0.0a 1.8 ± 0.0a 1.9 ± 0.0a Proteins (g/100 g) 3.5 ± 0.1d 6.1 ± 0.0b 10.5 ± 0.0a 6.1 ± 0.0b 5.3 ± 0.0c Lipids (g/100 g) 0.5 ± 0.0b 0.3 ± 0.1c 0.4 ± 0.0bc 0.4 ± 0.0bc 1.3 ± 0.1a AvCHO (g/100 g) ** 94.1 ± 0.1a 91.0 ± 0.0b 86.8 ± 0.0c 90.9 ± 0.0b 90.8 ± 0.1b TCHO (g/100 g) ** 95.9 ± 0.1a 92.8 ± 0.0b 88.5 ± 0.1c 92.7 ± 0.0b 92.7 ± 0.0b Starch (g/100 g) 82.6 ± 0.2a 78.7 ± 0.2b 73.5 ± 0.2e 76.6 ± 0.2c 74.4 ± 0.3d TS (g/100 g) 4.1 ± 0.1e 5.4 ± 0.2d 6.9 ± 0.3c 7.5 ± 0.2b 10.0 ± 0.3a
a,b,c,d.. Data in the same line with different letter superscripts are significantly different (P < 0.05) as assessed by Tukey’s test. **Calculated by difference. Data are expressed on dry matter basis. Values are expressed as means±SD. Abbreviations: TDF: Total dietary fiber; AvCHO: Available Carbohydrate; TCHO: Total Carbohydrate; TS: Total sugars; ; Fag1: Pounded plantain from agnrin at “green” stage of ripeness (stage 1); Faf2: Pounded plantain from afoto variety at “light green” stage of ripeness (stage 2); Fam3: Pounded plantain from
Advances in Food Science and Engineering, Vol. 2, No. 4, December 2018 103
Copyright © 2018 Isaac Scientific Publishing AFSE
ameletiha variety at maturity stage half-green, half yellow (stage 3); Fag4: Pounded plantain from agnrin variety at “more yellow than green” stage of ripeness (stage 4); Faf5: Pounded plantain from afoto variety at “yellow with green tip” stage of ripeness (stage 5).
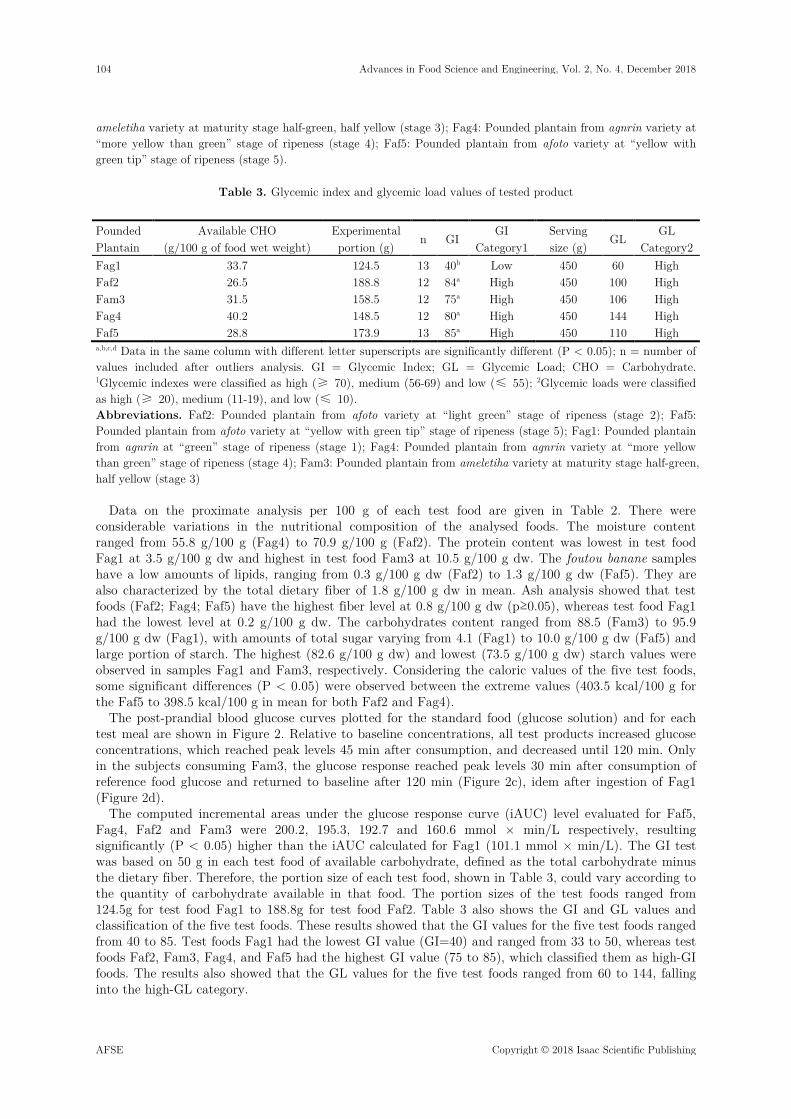
Table 3. Glycemic index and glycemic load values of tested product
a,b,c,d Data in the same column with different letter superscripts are significantly different (P < 0.05); n = number of values included after outliers analysis. GI = Glycemic Index; GL = Glycemic Load; CHO = Carbohydrate. 1Glycemic indexes were classified as high (≥ 70), medium (56-69) and low (≤ 55); 2Glycemic loads were classified as high (≥ 20), medium (11-19), and low (≤ 10). Abbreviations. Faf2: Pounded plantain from afoto variety at “light green” stage of ripeness (stage 2); Faf5: Pounded plantain from afoto variety at “yellow with green tip” stage of ripeness (stage 5); Fag1: Pounded plantain from agnrin at “green” stage of ripeness (stage 1); Fag4: Pounded plantain from agnrin variety at “more yellow than green” stage of ripeness (stage 4); Fam3: Pounded plantain from ameletiha variety at maturity stage half-green, half yellow (stage 3)
Data on the proximate analysis per 100 g of each test food are given in Table 2. There were considerable variations in the nutritional composition of the analysed foods. The moisture content ranged from 55.8 g/100 g (Fag4) to 70.9 g/100 g (Faf2). The protein content was lowest in test food Fag1 at 3.5 g/100 g dw and highest in test food Fam3 at 10.5 g/100 g dw. The foutou banane samples have a low amounts of lipids, ranging from 0.3 g/100 g dw (Faf2) to 1.3 g/100 g dw (Faf5). They are also characterized by the total dietary fiber of 1.8 g/100 g dw in mean. Ash analysis showed that test foods (Faf2; Fag4; Faf5) have the highest fiber level at 0.8 g/100 g dw (p≥0.05), whereas test food Fag1 had the lowest level at 0.2 g/100 g dw. The carbohydrates content ranged from 88.5 (Fam3) to 95.9 g/100 g dw (Fag1), with amounts of total sugar varying from 4.1 (Fag1) to 10.0 g/100 g dw (Faf5) and large portion of starch. The highest (82.6 g/100 g dw) and lowest (73.5 g/100 g dw) starch values were observed in samples Fag1 and Fam3, respectively. Considering the caloric values of the five test foods, some significant differences (P < 0.05) were observed between the extreme values (403.5 kcal/100 g for the Faf5 to 398.5 kcal/100 g in mean for both Faf2 and Fag4).
The post-prandial blood glucose curves plotted for the standard food (glucose solution) and for each test meal are shown in Figure 2. Relative to baseline concentrations, all test products increased glucose concentrations, which reached peak levels 45 min after consumption, and decreased until 120 min. Only in the subjects consuming Fam3, the glucose response reached peak levels 30 min after consumption of reference food glucose and returned to baseline after 120 min (Figure 2c), idem after ingestion of Fag1 (Figure 2d).
The computed incremental areas under the glucose response curve (iAUC) level evaluated for Faf5, Fag4, Faf2 and Fam3 were 200.2, 195.3, 192.7 and 160.6 mmol × min/L respectively, resulting significantly (P < 0.05) higher than the iAUC calculated for Fag1 (101.1 mmol × min/L). The GI test was based on 50 g in each test food of available carbohydrate, defined as the total carbohydrate minus the dietary fiber. Therefore, the portion size of each test food, shown in Table 3, could vary according to the quantity of carbohydrate available in that food. The portion sizes of the test foods ranged from 124.5g for test food Fag1 to 188.8g for test food Faf2. Table 3 also shows the GI and GL values and classification of the five test foods. These results showed that the GI values for the five test foods ranged from 40 to 85. Test foods Fag1 had the lowest GI value (GI=40) and ranged from 33 to 50, whereas test foods Faf2, Fam3, Fag4, and Faf5 had the highest GI value (75 to 85), which classified them as high-GI foods. The results also showed that the GL values for the five test foods ranged from 60 to 144, falling into the high-GL category.
Pounded Plantain
Available CHO (g/100 g of food wet weight)
Experimental portion (g)
n GI GI
Category1 Serving size (g)
GL GL
Category2 Fag1 33.7 124.5 13 40b Low 450 60 High Faf2 26.5 188.8 12 84a High 450 100 High Fam3 31.5 158.5 12 75a High 450 106 High Fag4 40.2 148.5 12 80a High 450 144 High Faf5 28.8 173.9 13 85a High 450 110 High
104 Advances in Food Science and Engineering, Vol. 2, No. 4, December 2018
AFSE Copyright © 2018 Isaac Scientific Publishing
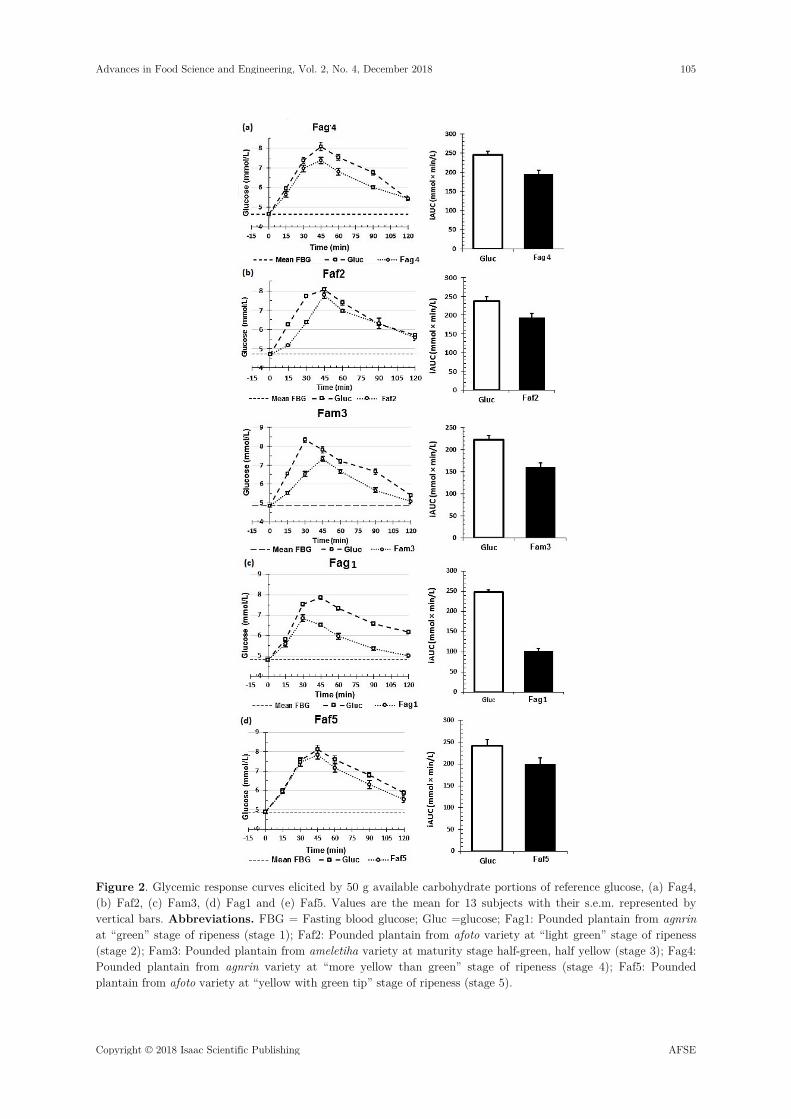
Figure 2. Glycemic response curves elicited by 50 g available carbohydrate portions of reference glucose, (a) Fag4, (b) Faf2, (c) Fam3, (d) Fag1 and (e) Faf5. Values are the mean for 13 subjects with their s.e.m. represented by vertical bars. Abbreviations. FBG = Fasting blood glucose; Gluc =glucose; Fag1: Pounded plantain from agnrin at “green” stage of ripeness (stage 1); Faf2: Pounded plantain from afoto variety at “light green” stage of ripeness (stage 2); Fam3: Pounded plantain from ameletiha variety at maturity stage half-green, half yellow (stage 3); Fag4: Pounded plantain from agnrin variety at “more yellow than green” stage of ripeness (stage 4); Faf5: Pounded plantain from afoto variety at “yellow with green tip” stage of ripeness (stage 5).
Advances in Food Science and Engineering, Vol. 2, No. 4, December 2018 105
Copyright © 2018 Isaac Scientific Publishing AFSE
4 Discussion
We performed a nutritional characterization of foutou banane products. It is also the first stage involved in the calculation of the GI value. The proximate composition varied significantly (P < 0.05) among plantain-based dishes and was diversely affected by the variety and plantain fruit ripeness stage. The moisture content of foutou banane samples was high and similar to those of pounded yam (foutou d’igname), pounded cassava (foutou de manioc), placali and kokondé (a traditional culinary dishes made from cassava), or maize meal stiff porridge [5];[16]. The high moisture content could be a disadvantage because it can affect the stability and the shelf life as mentioned by Egbebi and bademosi [17]. The significant difference in moisture content in foutou banane samples might be attributed to a nutritional composition and the ripeness stage of each plantain fruit. The values of protein content (with the exception of Fam3) are close to that determined in pounded cassava (2.4 g/100 g), placali (4 g/100 g) and kokondé (3.9 g/100 g) by Zoumenou et al. [16]. Data showed high protein content (p < 0.05) in Fam3 (10.5 g/100 g) compared to other samples. Protein content is not significantly influenced by ripeness stage and cooking method as reported by Baiyeri et al. [18]. The high protein content in Fam3 is probably due to plantain variety (ameletiha) and underlines the potential source of protein of some plantain cultivars as cv agbagba (9.2 g/100 g) or the cv obino l’ewai (12.2 g/100 g) mentioned by Makanjuola et al. [19]. The foutou banane samples have a low amount of lipids. Several previous studies have already shown that the plantain and cassava roots are known to be a very low source of lipid [16]. The foutou banane meals are also characterized by the low content of total dietary fiber (1.8 g/100 g dw). This value is comparable to those determined in dodo ikire (a culinary dishes made from over ripe fried plantain) reported by Kayode et al. [20] where total dietary fiber content ranged from 0.8 to 2.7 g/100 g. Ash content is lower than the value of 1.3 g/100 g determined in bread produced from Wheat/Plantain/Bambara groundnut flour with 25 % plantain flour, unripe plantain cv agbagba [21]. Moreover, Aboua [22] reported higher amount of ash (2.4 g/100 g) in foutou with plantain and cassava. Carbohydrates were the main component in study meals, with amounts of total sugar and large portion of starch. Highest and lowest starch values were observed in samples Fag1 and Fam3 respectively. Data showed that starch decreased and the total sugars increased with ripeness stage independently of plantain variety. These observations could be justified by the degradation of starch for synthesis of sugars during maturity of plantain fruit as mentioned by Khawas et al. [7]. The finding of starch as the major component in these food products is consistent with those of previous studies on plantain-based meals [5]; [22] and justifies easily a high-energy content of test foods. They could greatly address the daily energy needs of populations. Both of high starch content, high total sugars content and high energy in these foods could induce metabolic disorders and show the interest of their GI and GL determination. Consequently, we determined the GI and GL of this selection of five plantain-based meals locally called foutou banane obtained from three plantain cultivars. The GIs of these foods were described in Table 3 using a standardized [9] and quite robust protocol. The subjects for the present study were selected according to specific criteria. The reason for setting these inclusion criteria was to assess the GI value of selected commonly consumed traditional foods by subjects with a normal BMI with respect to their age, weight, and height. Additionally, other parameters, HbA1c, Systolic BP and Diastolic BP, were also taken into consideration when selecting subjects within the normal range. During the study, subjects' fasting plasma glucose levels varied between 3.68 and 6.17 mmol/L. None of the subjects had experienced any adverse effects of the different food products as reported in their diaries (data not shown). There were no significant changes in the subjects’ anthropometric measurements at baseline and post-test. The mean intra-individual CV of glycemic responses (GR)s to the 50 g glucose standard tests for the subjects of each food group tested was lower than 25 %. The inter-individual CV in GR to the standard tests was lower than 10 %. These values are consistent with recently reported data that low mean within-subject variation (reference CV < 30 %) is required for accuracy [23]. On the five foodstuffs tested in normoglycemic adults, only the mean GI assessed for Fag1 was low (GI=40). The low GI value of Fag1 could be attributed to the green maturity of fruit. It is reported low, or intermediate GI of boiled plantain at green maturity stage as reported by Oladele [24]. These values are close to that determined in Fag1 (Low GI of Faf1) and could be due to the partial digestibility of native starch in green plantain [25]. As expected from iAUC values, the majority of GI values of foods tested (with the exception of Fag1) have been identified as high GI [26]. When ANOVA
106 Advances in Food Science and Engineering, Vol. 2, No. 4, December 2018
AFSE Copyright © 2018 Isaac Scientific Publishing
with the paired sampled t-test was applied to the experimental data, significant (P < 0.05) differences were found among GI. In particular, Faf5, Fag4, Faf2 and Fam3 meals showed significantly (P < 0.05) higher values than the one of Fag1. In terms of variability, CVs evaluated for GI data were highest for Faf5 (22 %), followed by Faf2 (15 %), Fag4 (13 %), both Fag1 and Fam3 (11 %). Due to their high carbohydrate contents (over than 80 % dry weight; Table 2) and the presence of gelatinized starch after water cooking, these foods have been able to induce significant glycaemia in normal serving sizes contrary to Fag1, which could be considered as a low GI food (GI <55) [26]. Indeed boiling solubilizes starch and makes it more available and digestible. High GI foods are known to produce high glycemic response as a result of the fast rate of digestion of carbohydrate in the intestinal lumen hence, the high absorption of glucose into circulation [1]. These foods are not suitable or adequate meals for type II diabetics considering their high glycemic response indices. There are of greater for in insulin-resistant individuals who must increase insulin secretion in order to re-establish glucose homeostasis, increasing the burden on the β-cell and therefore the risk of type 2 diabetes [27]. This would be a great relevance in the context of Côte d’Ivoire, where the pounded plantain is considered as a delicacy. From the literature survey, similar several studies showed high GI values of traditional starchy products [5]; [28]. As mentioned above, foutou banane is a food highly consumed in Côte d'Ivoire and the GLs calculated for tested plantain foods appear high (GL > 20) [26] because of the large serving-size (450 g) which is usually consumed per day (Table 3). Considering the widespread consumption of these foods in Côte d’Ivoire, a suggestion to reduce the portion sizes of these foods should be recommended in the Ivoirian dietary guidelines.
5 Conclusion
This study confirmed that foutou of banana is a good source of carbohydrate and energy. Pounded plantain Fag1 has promising a good control effect on blood glucose level and could be better used in the management of metabolic disorder such as diabetes mellitus because of its relatively low GI. Therefore, the high GI/GL of all of these meals suggests a decrease of portions commonly consumed or their consumption with moderation. Conflict of Interest. The authors declare no conflict of interest. Acknowledgements. The authors thanked Dr. Maria C. Casiraghi, of Department of Food Environmental and Nutritional Sciences (DeFENS), Human Nutrition Unit, University of Milan, for calculating the incremental area under the curve and GI. The financial support of the Agricultural Productivity Program in West Africa (PPAAO/WAAPP 1B). Don IDA N°6260 CI is gratefully acknowledged.
References
1. L. S. A. Augustin, W. C. C. Kendall, D. J. A. Jenkins, C. W. Willett, A. Astrup, A. Barclay, et al. “Glycemic index, glycemic load and glycemic response: An International Scientific Consensus Summit from the International Carbohydrate Quality Consortium (ICQC)”. Nutrition, Metabolism & Cardiovascular Diseases, vol. 25, pp 795-815, 2015.
2. N. S. Bhupathiraju, K. D. Tobias, V. S. Malik, A. Pan, A. Hruby, J. E. Manson, et al. “Glycemic index, glycemic load, and risk of type 2 diabetes: results from 3 large US cohorts and an updated meta-analysis”. American Journal of Clinical Nutrition; vol. 100, pp 218–32, 2014 DOI:10.3945/ajcn.113.079533
3. FAO-Food and Agriculture Organization of the United Nations. FAOSTAT. [Cited 2010 Mar 13]. Available from http://faostat3.fao.org/faostat-gateway/go/to/home/E
4. CNRA. Programme Plantain, Bananes, Ananas. Actualité de recherché, 2013. [Cited 2010 Mar 13] Available from http://www.cnra.ci/descprog.php?id=13&prog=Plantain,%20Bananes,%20Ananas&act=present»
5. A. C. Kouamé, K. N. Kouassi, Y. D. N’dri and N. G. Amani, “Glycemic index and load values tested in normoglycemic adults for five staple foodstuffs: pounded yam, pounded cassava-plantain, placali, attieke and maize meal stiff porridge”. Nutrients, vol. 7, pp 1267-1281, 2015 doi: 10.3390/nu7021267
Advances in Food Science and Engineering, Vol. 2, No. 4, December 2018 107
Copyright © 2018 Isaac Scientific Publishing AFSE
6. J. Cauthen, D. G. Jones, K. Mary and C. L. Anderson, “Banana and Plantain Value Chain: West Africa”. Evans School Policy Analysis and Research (EPAR), EPAR Brief No. 239, 2013. 25p.
7. P. Khawas, A. J. Das, N. Sit, L. S. Badwaik, C. S. Deka, “Nutritional Composition of Culinary Musa ABB at Different Stages of Development”. American Journal of Food Science and Technology, vol. 2 no. 3, pp 80-87, 2014; doi: 10.12691/ajfst-2-3-1
8. K. Hermansen, O. Rasmussen, S. Gregersen and S. Larsen, “Influence of ripeness of banana on the blood glucose and insulin response in type 2 diabetic subjects”. Diabetic Medicine, vol. 9, pp 730–734, 1992.
9. International Standards Organisation. ISO 26642-2010. Food Products - Determination of the Glycemic Index (GI) and Recommendation for Food Classification”. Geneva, Switzerland, International Standards Organisation, 2010.
10. FAO/WHO. Carbohydrates in Human Nutrition, FAO Food and Nutrition Paper 66. 1998. Available from http://www.fao.org/docrep/W8079E/W8079E00.htm
11. L. Prosky, N. G. Asp, T. F. Schweitzer, J. W. DeVries and I. Furda, “Determination of insoluble and soluble and total dietary fiber in foods and food products: Interlaboratory study”. Journal of AOAC International, vol 75, pp 360–367, 1992.
12. M. Dubois, K. A. Gilles, J. K. Hamilton, P. A. Rebers and F. Smith, “Colorimetric method for the determination of sugars and related substances.” Analytical Chemistry, vol 28 pp 350 – 356, 1956.
13. H. N. Englyst, S. M. Kingman and J. H. Cummings, “Classifcation and measurement of nutritionally important starch fractions”. European Journal of Clinical Nutrition, vol. 46, pp S33-S50, 1992.
14. Joint FAO/WHO Ad Hoc Expert Committee on Energy and Protein Requirements, World Health Organization & Food and Agriculture Organization of the United Nations. 1973 . Energy and protein requirements: report of a Joint FAO/WHO ad hoc expert committee [ meeting held in Rome from 22 March to 2 April 1971] . Geneva: World Health Organization. Available from http://www.who.int/iris/handle/10665/41042
15. J. Salmeron, A. Ascherio, E. B. Rimm, G. A. Colditz, D. Spiegelman, D. J. Jenkins, et al. “Dietary fiber, glycemic load, and risk of NIDDM in men”. Diabetes Care, vol. 20, pp 545–550, 1997.
16. V. Zoumenou, F. Aboua, D. Gnakri and A. Kamenan, “Étude des caractéristiques physicochimique de certains plats traditionnels dérivés du manioc (foutou, placali et kokondé)”. Tropicultura, vol. 16-17, no. 3, pp 120-126, 1999.
17. O. A. Egbebi and A. T. bademosi, “Chemical compositions of ripe and unripe banana and plantain”. International Journal of Tropical Medicine and Public Health 1(1) pp 1-5, 2012.
18. K. P. Baiyeri, S. C. Aba, G. T. Otitoju and O. B. Mbah, “The effects of ripening and cooking method on mineral and proximate composition of plantain (Musa sp. AAB cv. “Agbagba”) fruit pulp”. African Journal of Biotechnology, vol. 10, no. 36, pp 6979-6984, 2011.
19. R. M. O. Kayode, A. T. Ajiboye, A. A. Babayeju, B. I. Kayode, C. O. Oladoye and K. T. Adu, “Proximate, mineral composition and microbial counts of over-ripe fried plantain (dodo-ikire) sold by vendors in ikire town, NIGERIA”. International Journal of Biotechnology, vol.2, no. 4, pp 68-82, 2013.
20. O. M. Makanjuola, A. B. Ajayi, K. Mathew, J. O. Makanjuola, “The proximate composition and mineral contents of three plantain cultivars harvested at matured green level”. International Journal of Innovations in Biosciences, vol. 3, no. 2, pp 23-26, 2013.
21. D. B. Kiin-Kabari, “Physico-chemical and sensory properties of bread prepared from wheat and unripe plantain composite flours fortified with Bambara groundnut protein concentrate. International Journal of Nutrition and Food Sciences, vol. 4, no. 5, 594-599, 2015. doi: 10.11648/j.ijnfs.20150405.23
22. F. Aboua, “Effect of home processing methods on the nutritional value of plantains in Ivory Coast”. Tropical Science, vol 34, pp 274-281, 1994.
23. M. T. Wolever, C. J. Brand-Miller, J. Abernethy, A. Astrup, F. Atkinson, M. Axelsen, et al. “Measuring the glycemic index of foods: interlaboratory study”. American Journal of Clinical Nutrition, 87(suppl):S247-S57, 2008.
24. E-O. Oladele, “Peace Resistant starch in plantain (Musa AAB) and implications for the glycemic index”. PhD thesis, University of Leeds. School of Food Science and Nutrition, 2013; 281p. Available from http://etheses.whiterose.ac.uk/id/eprint/5239 [accessed 13.03.15].
25. D. Gnakri, M. Champ, P. Colonna, “Préparations de banane plantain: analyse des constituants glucidiques et digestibilité in vitro de l'amidon”. Reproduction Nutrition Development, EDP Sciences, vol. 31, no. 3, pp.323-323, 1991.
108 Advances in Food Science and Engineering, Vol. 2, No. 4, December 2018
AFSE Copyright © 2018 Isaac Scientific Publishing
26. The University of Sydney, Glycemic Index. Sydney University Glycemic Index Research Service (SUGIRS). Available online: www.glycemicindex.com (accessed on 21 August 2016).
27. J. C. Brand-Miller, H. J. Griffin and S. Colagiuri, “The carnivore connection hypothesis: revisited”. Journal of obesity, 2011. J Obes; Volume 2012 Article ID 258624, 9 pages. http://dx.doi.org/10.1155/2012/258624
28. S. O. Mahgoub, M. Sabone and J. Jackson, “Glycemic index of selected staple carbohydrate-rich foods commonly consumed in Botswana”. South African Journal of Clinical Nutrition, vol. 26, no. 4, pp 182-187. 2013;
Advances in Food Science and Engineering, Vol. 2, No. 4, December 2018 109
Copyright © 2018 Isaac Scientific Publishing AFSE
Copyright © 2022 FDOKUMEN