PCMC TOD Workshop Report 130718 FINAL - ITDP Global
67
Transit Oriented Development for Pimpri Chinchwad: Workshop Outcomes and Action Plan Prepared by the Institute for Transportation and Development Policy for the Pimpri Chinchwad Municipal Corporation March 2013
-
Upload
khangminh22 -
Category
Documents
-
view
1 -
download
0
Transcript of PCMC TOD Workshop Report 130718 FINAL - ITDP Global
Transit Oriented Development for Pimpri Chinchwad: Workshop Outcomes and Action Plan
Prepared by the Institute for Transportation and Development Policy for the Pimpri Chinchwad Municipal Corporation
March 2013
i
Table of Contents 1. Executive Summary .......................................................................................................................... 1 2. Introduction ....................................................................................................................................... 2
3. TOD Principles ................................................................................................................................. 4 3.1 Walk .......................................................................................................................................... 4
3.2 Cycle .......................................................................................................................................... 7
3.3 Connect ...................................................................................................................................... 9
3.4 Public Transport ...................................................................................................................... 10
3.5 Mix .......................................................................................................................................... 11
3.6 Densify .................................................................................................................................... 13
3.7 Compact ................................................................................................................................... 14
3.8 Shift ......................................................................................................................................... 16
3.9 TOD Standard Scorecard ......................................................................................................... 18
4. PCMC Case Study .......................................................................................................................... 19 4.1 Walk ........................................................................................................................................ 21
4.2 Cycle ........................................................................................................................................ 25
4.3 Connect .................................................................................................................................... 27
4.4 Transit ...................................................................................................................................... 30
4.5 Mix .......................................................................................................................................... 30
4.6 Density ..................................................................................................................................... 33
4.7 Compact ................................................................................................................................... 34
4.8 Shift ......................................................................................................................................... 34
4.9 Overall TOD score .................................................................................................................. 35
5. Workshop findings .......................................................................................................................... 37
5.1 Workshop agenda .................................................................................................................... 37
5.2 Group 1: Transit oriented land use planning ........................................................................... 42
5.3 Group 2: Structure and design of the public realm .................................................................. 48
5.4 Group 3. Built form and its impact on the public realm .......................................................... 53
6. Action plan ...................................................................................................................................... 58 6.1 Delineation of TOD zones ....................................................................................................... 58
6.2 Intensification of residential and commercial uses in TOD zones .......................................... 59
6.3 Provision of affordable housing in TOD zones ....................................................................... 59
6.4 Creation of a dense network of streets .................................................................................... 60

ii
6.5 Development of complete streets with high quality walking and cycling facilities ................ 60
6.6 On-going management of street space .................................................................................... 60
6.7 Parking management in TOD zones ........................................................................................ 61
6.8 Urban design reforms .............................................................................................................. 62
7. Appendix: Workshop participants .................................................................................................. 63
1
1. Executive Summary Pimpri Chinchwad is at a critical juncture in its development trajectory, enjoying accelerated economic growth coupled with a rapidly increasing population and a fast pace of urban development. The Pimpri Chinchwad Municipal Corporation (PCMC) is showing leadership in the area of sustainable transport with its implementation of a high quality bus rapid transit (BRT) system. To capitalise on these transport investments, PCMC is now pursuing transit-oriented development (TOD) to ensure that a large number of people can live, work, and play along the BRT corridors. This report examines strategies and actions that PCMC can consider as it formulates TOD policies.
The findings reported here were developed through a one-day participatory workshop with public officials, Corporation staff, and other stakeholders. The workshop in turn was informed by background research by the Institute for Transportation and Development Policy, involving comprehensive surveys of existing travel patterns, land use characteristics, and built form.
Pimpri Chinchwad faces multiple challenges in securing a sustainable urban future for its growing population. Much needs to be done to develop infrastructure and housing, and this expansion must be coupled with efforts to promote sustainable modes (e.g. walking, cycling, and public transport) and reduce dependence on personal motor vehicles. To enable mode shift, it is essential to increase residential and job densities near rapid transit corridors. Policies should aim at accommodating the majority of new housing and employment in areas with close proximity to high quality public transport. In addition, a denser network of streets and paths is needed to provide connectivity and reduce walking distances to public transport stations. Revenue generation through effective management of street space along with funds from sale of tradable development rights can help pay for improvements in the transport system and other types of infrastructure. Finally, building control regulations can create incentives for private players to develop projects that contribute to an active, vibrant public realm that is safe for all users.
This report elaborates on these objectives and identifies concrete steps that PCMC can take to achieve TOD. The proposals cover multi-scalar issues of density, land use, housing, jobs, public space, street management, parking, urban form, building typologies, and non-motorized transport, all essential considerations for an effective citywide TOD policy. Implementation of this TOD strategy will require dedicated funding mechanisms as well as accompanying institutional changes. While this workshop and its findings mark the first step towards initiating dialogues among various stakeholders, PCMC would not be able to achieve comprehensive implementation of TOD across Pimpri Chinchwad without consulting and seeking active support of the development community, landowners, residents, and non-governmental organisations. Therefore, greater engagement with these stakeholders will be crucial in this process.

2
2. Introduction The Pimpri Chinchwad Municipal Corporation (PCMC) is making considerable investments in sustainable transport and local area improvements for its residents. Most notably, the city is introducing a high quality bus rapid transit (BRT) system along four major corridors to enhance the mobility and accessibility of all residents (Figure 1). Other mass rapid transit systems such as metro and monorail/light rail are also being considered.
Figure 1. BRT corridors in PCMC.
PCMC has recognised the importance of integrating land use policies with the city’s mass rapid transit system in order to ensure the success of investments like BRT while also increasing the overall liveability of the city. Transit oriented development (TOD) is an integral part of this strategy, allowing for a concentration of housing and jobs within walking distance of mass rapid transit stations.
Well designed and fully realized TOD areas can play a key role in the city’s economic and cultural wellbeing, creating vibrant, lively places for people of all ages and income groups. A strategic concentration of compatible activities in conjunction with high quality transport systems can help reduce dependence on personal motor vehicles and curb emissions of harmful smog-forming and greenhouse gas (GHG) pollutants. Adoption of innovative and contextual TOD policies and practices in PCMC can become a model for the wider region as well as the rest of India.
TOD planning is a complex process, involving multiple stakeholders and requiring a high level of interdepartmental collaboration between various government agencies. As part of PCMC’s efforts to gain clarity on its TOD policies and initiatives, the Institute for Transportation and Development Policy conducted a one-day workshop with municipal officials and other participants to explore various elements of the TOD planning process. The intention was, on one hand, to familiarize

3
everyone with TOD concepts and methodologies, and on the other hand, to discuss politically viable strategies and actions that could be taken by the Municipal Corporation, residents, and local developers.
This report is the product of a collaborative effort and can serve as a stepping-stone towards the adoption of TOD policies, projects, and initiatives. The following section describes eight key principles of TOD that can guide the policymaking process in PCMC. Next, the TOD Standard, a set of criteria developed by the Institute for Transportation and Development Policy (ITDP) to rate quality of TODs, is applied to a case study site along PCMC’s Nashik Phata-Wakad BRT corridor. During the workshop, the case study was presented to help generate discussion on some of the opportunities and challenges to TOD in the context of PCMC’s BRT corridors. Next, the report discusses the recommendation that emerged from the group discussions during the workshops. Finally, the report synthesizes the recommendations from the three groups into a set of strategies and actions to facilitate TOD. PCMC’s planning and engineering staff can now initiate the necessary studies, activities, and dialogue required for a full implementation of TOD along BRT corridors in PCMC.
4
3. TOD Principles Transit-oriented urban development and planning is a multi-faceted endeavour, requiring consideration of the built environment at multiple scales, governmental policy at multiple levels, public transport investments, and private interest. As in any complex planning exercise, it is prudent to underline these activities with a set of widely accepted principles informed by worldwide best practices. At the heart of TOD planning is the recognition of urban form and development patterns that strategically house people and jobs within walking distance of high-capacity public transport stations. In addition, the urban design and land use characteristics of TOD facilitate the use of public transport, walking, and cycling. TOD is actively oriented toward, rather than simply adjacent to, public transport. The following principles describe the key features of TOD:
1. Walk: Develop neighbourhoods that promote walking. 2. Cycle: Prioritizing motorised transport networks 3. Connect: Create dense networks of streets and paths. 4. Public transport: Locate development near high-quality public transport 5. Mix: Plan for mixed use 6. Densify: Match density and public transport capacity 7. Compact: Create compact regions with short commutes 8. Shift: Increase mobility by regulating parking and road use
Together, these urban development principles foster efficient spatial configurations that enable high-quality, and car-independent lifestyles. The reduced vehicle-kilometres travelled (VKT) in these developments mean less time wasted in traffic, less congestion, and reduced air pollution.
It is important to have measurable objectives that quantify the degree to which existing and proposed policies and design solutions work towards a successful TOD. ITDP has worked with its global partners to develop a set of principles and standards, known as the “TOD Standard,” to facilitate this process. 1 The Standard expands upon the eight principles outlined above with a set of quantitative metrics that can be used to determine how close a particular development comes to representing best practice TOD. This section introduces the TOD Standard metrics. In the next section, the Standard is applied to a study area in PCMC.
3.1 Walk
We are all pedestrians. Walking is the most natural, affordable, healthy, and clean way of getting around, but it requires more than just feet and legs. It requires walkable streets—the fundamental building blocks of a sustainable city. Hence, TODs cannot be considered successful without providing safe, comfortable and attractive walking options for their residents, both to and from station areas and within the TOD zone.
3.1.1 Objective: The pedestrian network is safe and complete
A great walking environment must protect pedestrians from motor vehicles. Streets need dedicated pedestrian footpaths or vehicle speeds need to be radically reduced in case of a shared space. Footpaths need to be unobstructed, continuous, shaded, and well lit. Vehicle speeds at crossings must be slowed down with tighter turns, narrower lanes, restrictions on free turns, and speed bumps. 1 The draft TOD Standard is available at <http://www.itdp.org/library/publications/the-tod-standard-draft>. The Standard is in draft stage and ITDP welcomes comments or questions about the scoring system.

5
Crossings should be made safer with leading pedestrian crossing signals, pedestrian islands and curb extensions that minimize crossing distances. These facilities need to be ramped to ensure accessibility for all—including a person in a wheelchair or a family using a stroller.
The pedestrian network should foster the most direct access to all local destinations, such as schools, work, and public transport stations, and should offer choices of pleasant and interesting routes. Finally, the number of driveways cutting across pedestrian pathways need to be minimized.
Figure 2. Wide, unobstructed footpaths are an essential component of a safe and complete pedestrian network.
The following metrics measure the degree to which a given pedestrian network is safe and complete:
Metric 1.1 Walkways: Percentage of block frontage with complete, wheelchair-accessible walkways.
Metric 1.2 Crosswalks: Percentage of intersections with complete, wheelchair-accessible crosswalks in all directions.
Metric 1.3 Driveway Density: Average number of driveways per 100 m of block frontage.
3.1.2 Objective: The pedestrian realm is active and vibrant
Streetscapes should be thoughtfully and artistically designed to draw more people to walk for both utility and pleasure. The most successful and best-loved cities in the world have vibrant and safe streets. In order to achieve this level of quality, the interface between private buildings and the public realm is very important. Streets with many shop fronts, doors, windows and patios that open directly to pedestrian environments create a feeling of safety, while producing a more active and vibrant atmosphere.

6
Figure 3. Active and vibrant pedestrian realm.
The following metrics measure the degree to which streets provide possibility for active and vibrant pedestrian realm:
Metric 1.4 Visually Active Frontage: Percentage of street frontage that provides visual connection to building interior activity.
Metric 1.5 Physically Permeable Frontage: Average number of shops and pedestrian building entrances per 100m of street frontage.
3.1.3 Objective: The pedestrian realm is temperate and comfortable
Great cities start with great pedestrian environments that protect pedestrians from the elements. Trees are critical in providing natural shade in the summer. Buildings that extend to the property edge, storefront awnings, and arcades also help protect pedestrians from rain and sun.

7
Figure 4. Shade provided by trees or buildings helps to create a temperate and comfortable pedestrian realm.
Metric 1.6 Shade and Shelter: Percentage of walkway segments that incorporate adequate shade or shelter element.
3.2 Cycle
Cycles allow the convenience of door-to-door travel while using less space and fewer resources. They are a healthier and more sustainable alternative to cars, two-wheelers, auto-rickshaws, and taxis for short trips. Many people will choose cycling if street design makes cycling safe and comfortable.
3.2.1 Objective: The cycling network is safe and complete
The more cycles on the streets, the safer the streets become. Segregated bike lanes are needed on higher speed roads, while on local streets, traffic calming and shared street designs are better, allowing traffic to mix at slow speeds. In hot countries in particular, shade is very important. A great cycling environment is one where a child can cycle without danger and where a cyclist can safely and quickly travel to any destination.

8
Figure 5. Continuous dedicated cycle tracks are an important component of a complete cycle network.
The following metric measures the degree to which a TOD area provides a safe and complete cycle network:
Metric 2.1 Cycle Network: Percentage of streets with safe and complete cycleways.
3.2.2 Objective: Cycle parking is ample and secure
Without high quality and safe space for parking cycles in private developments and on public streets, cycling is not a viable option for many potential users. Cycling can also successfully be integrated with public transportation, if fully protected cycle parking is provided.
Figure 6. Ample and secure cycle parking should be available at public transport stations.

9
The following metrics measure availability of secure spaces for cycle parking:
Metric 2.2 Cycle Parking at Public Transport Stations: Secure multi-space cycle parking facilities are provided at all public transport stations.
Metric 2.3 Cycle Parking at Buildings: Percentage of new buildings that provide secure, weather-protected cycle parking.
Metric 2.4 Cycle Access in Buildings: Buildings allow cycle storage within tenant-controlled spaces.
3.3 Connect
Cities that are pleasant to walk and cycle typically have large numbers of narrow and short streets with many intersections per unit of area. This makes the traffic slow down to make walking safe, more direct, varied, interesting and attractive.
3.3.1 Objective: Walking and cycling routes are short, direct, and varied
The overall street network should offer frequent pedestrian and cycle connections to minimise the distance between public transport stations and residential, employment, and other destinations. The street network should be legible for someone on foot, such that each corner offers glimpses of alternate routes or places.
Figure 7. Short, direct, and varied pedestrian routes reduce walking distances.
The following metrics measure the degree to which an area’s urban structure provides greater connectivity and choice to pedestrians and cyclists:
Metric 3.1 Pedestrian Intersection Density: Intersections of pedestrian routes per square km.
Metric 3.2 Small Blocks: Percentage of blocks that are no more than 150 meters in length.
3.3.2 Objective: Walking and cycling routes are shorter than motor vehicle routes
The tighter the street grid, the less detour to a destination. Detours can affect the decision to undertake a trip and by what means. At walking speeds, detours matter much more than at car speeds. Street networks that prioritize shortest distances for pedestrians and cyclists result in more successful TOD areas.
10
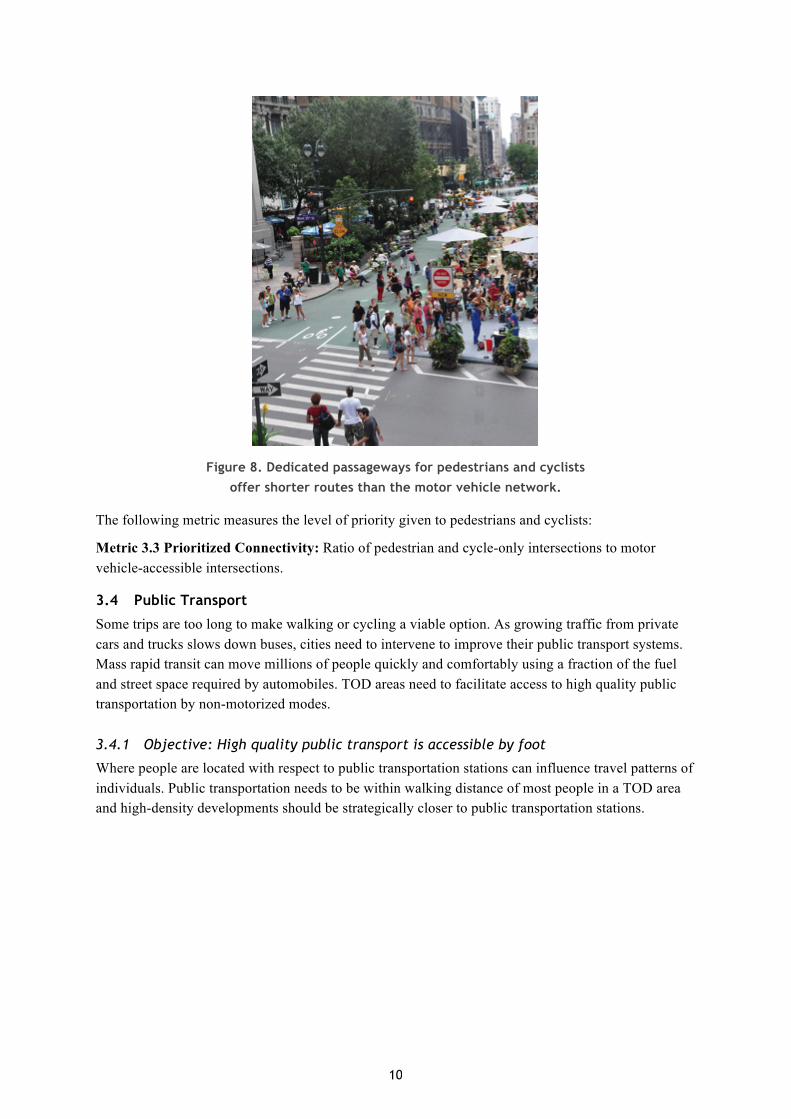
Figure 8. Dedicated passageways for pedestrians and cyclists offer shorter routes than the motor vehicle network.
The following metric measures the level of priority given to pedestrians and cyclists:
Metric 3.3 Prioritized Connectivity: Ratio of pedestrian and cycle-only intersections to motor vehicle-accessible intersections.
3.4 Public Transport
Some trips are too long to make walking or cycling a viable option. As growing traffic from private cars and trucks slows down buses, cities need to intervene to improve their public transport systems. Mass rapid transit can move millions of people quickly and comfortably using a fraction of the fuel and street space required by automobiles. TOD areas need to facilitate access to high quality public transportation by non-motorized modes.
3.4.1 Objective: High quality public transport is accessible by foot
Where people are located with respect to public transportation stations can influence travel patterns of individuals. Public transportation needs to be within walking distance of most people in a TOD area and high-density developments should be strategically closer to public transportation stations.
11
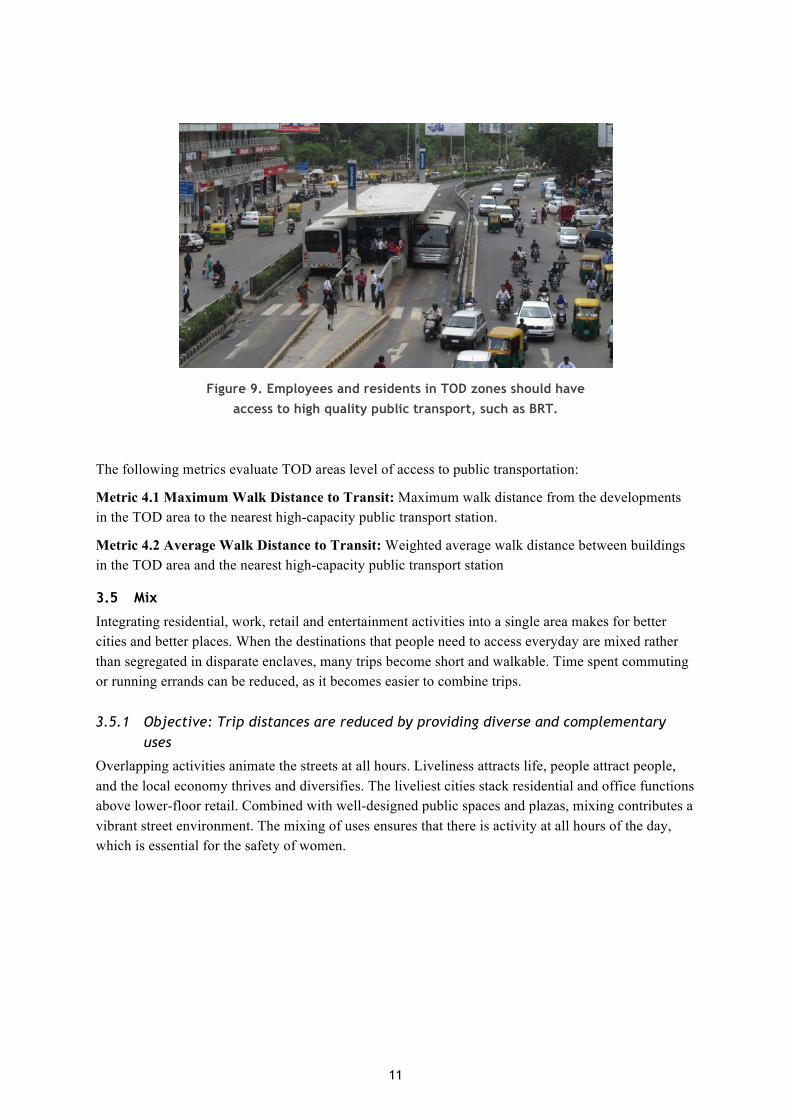
Figure 9. Employees and residents in TOD zones should have access to high quality public transport, such as BRT.
The following metrics evaluate TOD areas level of access to public transportation:
Metric 4.1 Maximum Walk Distance to Transit: Maximum walk distance from the developments in the TOD area to the nearest high-capacity public transport station.
Metric 4.2 Average Walk Distance to Transit: Weighted average walk distance between buildings in the TOD area and the nearest high-capacity public transport station
3.5 Mix
Integrating residential, work, retail and entertainment activities into a single area makes for better cities and better places. When the destinations that people need to access everyday are mixed rather than segregated in disparate enclaves, many trips become short and walkable. Time spent commuting or running errands can be reduced, as it becomes easier to combine trips.
3.5.1 Objective: Trip distances are reduced by providing diverse and complementary uses
Overlapping activities animate the streets at all hours. Liveliness attracts life, people attract people, and the local economy thrives and diversifies. The liveliest cities stack residential and office functions above lower-floor retail. Combined with well-designed public spaces and plazas, mixing contributes a vibrant street environment. The mixing of uses ensures that there is activity at all hours of the day, which is essential for the safety of women.

12
Figure 10. The mixing of complementary residential and commercial reduces trip distances.
The following metrics measure the level of mixing in a neighbourhood:
Metric 5.1 Complementary Uses: Presence of residential and non-residential uses combined within the same or adjacent blocks.
Metric 5.2 Accessibility to Food: Percentage of residential units that are within 500 m walk of an existing, or planned, source of fresh food.
3.5.2 Objective: Short commutes for lower income groups
Socially diverse, mixed-income neighbourhoods shorten trip distances and are safer and more interesting. Streetscapes become more varied, rich and socially just. People with lower economic means benefit from having shorter commute times and greater access to public transport.
13
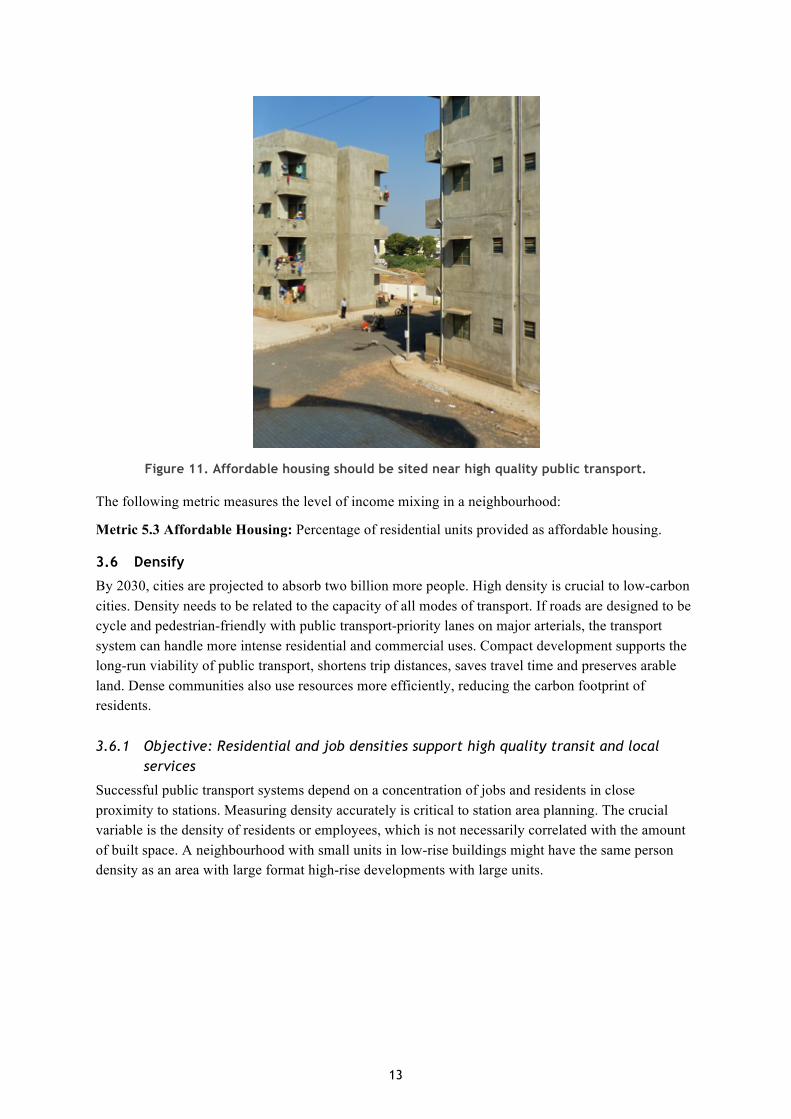
Figure 11. Affordable housing should be sited near high quality public transport.
The following metric measures the level of income mixing in a neighbourhood:
Metric 5.3 Affordable Housing: Percentage of residential units provided as affordable housing.
3.6 Densify
By 2030, cities are projected to absorb two billion more people. High density is crucial to low-carbon cities. Density needs to be related to the capacity of all modes of transport. If roads are designed to be cycle and pedestrian-friendly with public transport-priority lanes on major arterials, the transport system can handle more intense residential and commercial uses. Compact development supports the long-run viability of public transport, shortens trip distances, saves travel time and preserves arable land. Dense communities also use resources more efficiently, reducing the carbon footprint of residents.
3.6.1 Objective: Residential and job densities support high quality transit and local services
Successful public transport systems depend on a concentration of jobs and residents in close proximity to stations. Measuring density accurately is critical to station area planning. The crucial variable is the density of residents or employees, which is not necessarily correlated with the amount of built space. A neighbourhood with small units in low-rise buildings might have the same person density as an area with large format high-rise developments with large units.

14
Figure 12. Placing density close to public transport stations enables more people to use public transport.
The following metrics measure residential and non-residential densities:
Metric 6.1 Residential Density: Residential density measured in Dwelling Units per Net Hectare (DU/NHa) of developable land.
Metric 6.2 Non-Residential Density: Non-residential density measured in Floor Area per Net Hectare (FAR/NHa) for the project.
3.7 Compact
Community location has a long-term impact on sustainability. New developments placed far from existing cities are inconvenient and rarely thrive. City planners can avoid this by locating compact new sub-centres within or adjacent to existing cities.
3.7.1 Objective: The development is close to jobs, services and other frequent destinations
Most cities have underutilized land no longer needed for its original purpose. Old docklands, rail yards, surface parking, industrial zones, or decommissioned military bases can often be re-used and become vital new urban centres.
Cities need to create incentives to develop this land first, before driving development to distant greenfields. In addition to protecting arable land, this strategy significantly decreases the cost of providing public transport, utilities, and other services to these new locations, while reducing most residents’ daily commute.
15
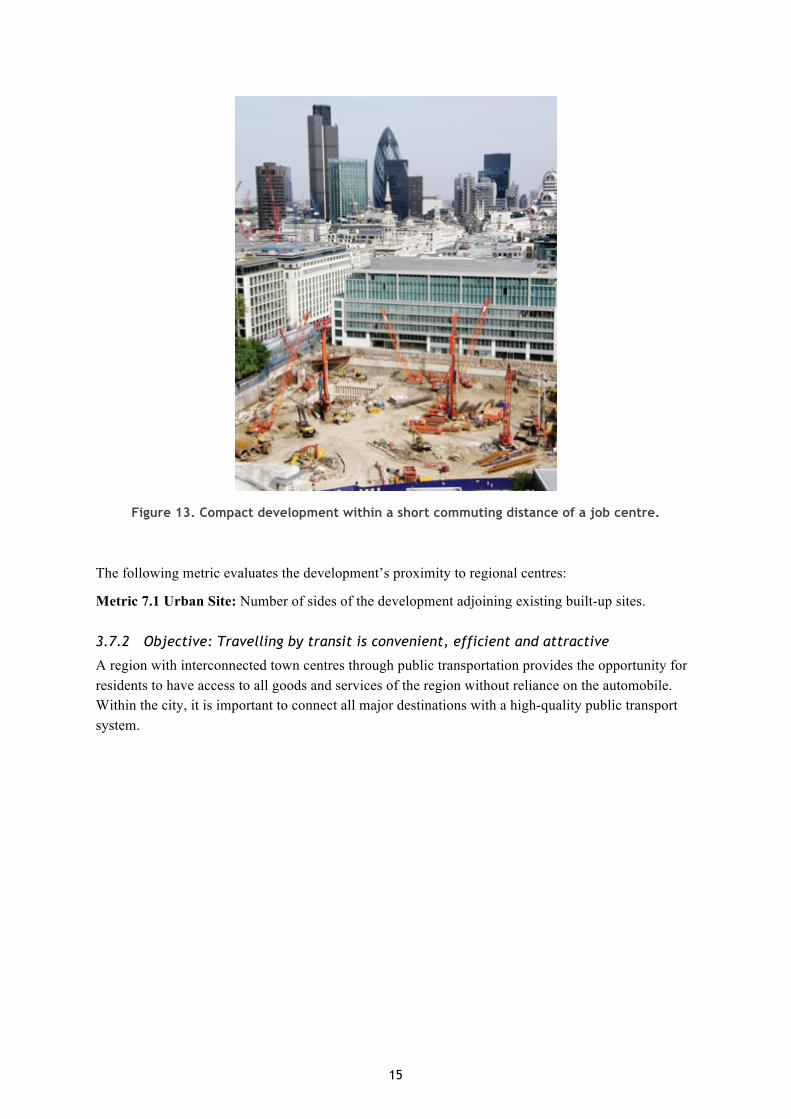
Figure 13. Compact development within a short commuting distance of a job centre.
The following metric evaluates the development’s proximity to regional centres:
Metric 7.1 Urban Site: Number of sides of the development adjoining existing built-up sites.
3.7.2 Objective: Travelling by transit is convenient, efficient and attractive
A region with interconnected town centres through public transportation provides the opportunity for residents to have access to all goods and services of the region without reliance on the automobile. Within the city, it is important to connect all major destinations with a high-quality public transport system.

16
Figure 14. Public transport framework linking different city areas.
The following metric measures commute times:
Metric 7.2 Short Commute: Average peak-time commute duration in minutes by public transport to the nearest urban centre.
3.8 Shift
In the last century many cities were retrofitted and designed to accommodate automobile travel. Car travel will remain a preferred choice for some people on certain trips in the future, especially where cost-effective public transport options are not available. These cars should be as clean, fuel efficient, quiet, and safe as possible for both passengers and surrounding people.
Widening or adding roads in built up urban areas tends to damage local communities. More cars lead to greater congestion, pollution, fuel consumption, and greenhouse gas emissions. Cars consume too much road space to be viable for more than a fraction of total travel. If car travel keeps pace with population growth, gains from fuel efficiency and cleaner technologies will be countered by slow speeds—as drivers get stuck in traffic congestion.
3.8.1 Objective: The area of land used by motor vehicles is minimised
Car trips can be kept at levels that available roads can handle through parking policies, vehicle restrictions, user charges, and traffic cells that allow more direct access for transit vehicles and bicycles. These strategies can also be tailored to specifically encourage the use of cleaner and quieter vehicles. Better management of travel demand is critical for any city made for people, not cars. Appropriate parking requirements on the streets and private properties can have an important
17
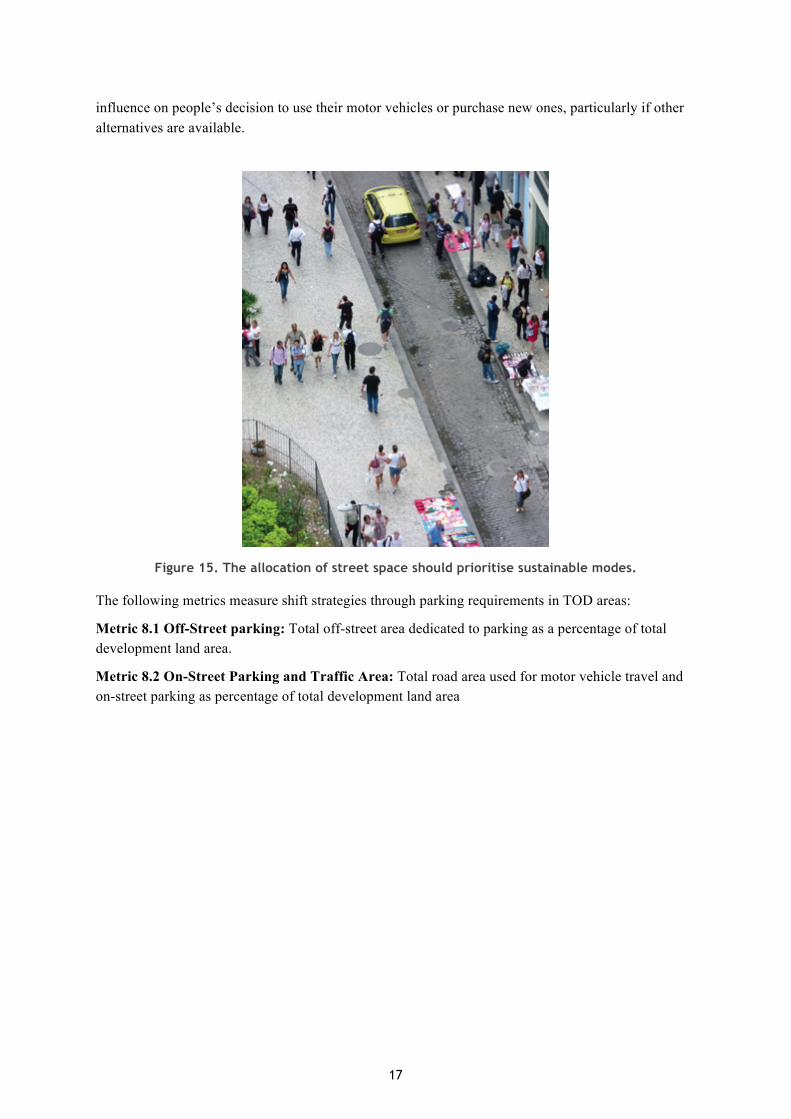
influence on people’s decision to use their motor vehicles or purchase new ones, particularly if other alternatives are available.
Figure 15. The allocation of street space should prioritise sustainable modes.
The following metrics measure shift strategies through parking requirements in TOD areas:
Metric 8.1 Off-Street parking: Total off-street area dedicated to parking as a percentage of total development land area.
Metric 8.2 On-Street Parking and Traffic Area: Total road area used for motor vehicle travel and on-street parking as percentage of total development land area
18
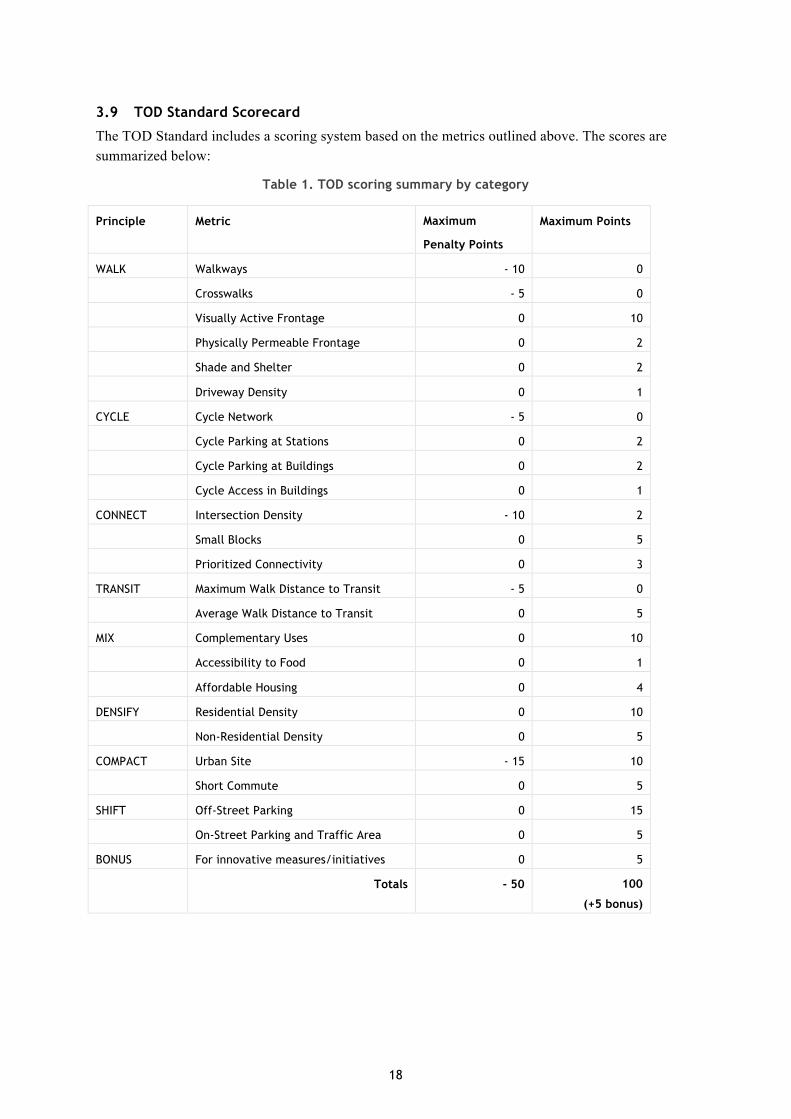
3.9 TOD Standard Scorecard
The TOD Standard includes a scoring system based on the metrics outlined above. The scores are summarized below:
Table 1. TOD scoring summary by category
Principle Metric Maximum
Penalty Points
Maximum Points
WALK Walkways - 10 0
Crosswalks - 5 0
Visually Active Frontage 0 10
Physically Permeable Frontage 0 2
Shade and Shelter 0 2
Driveway Density 0 1
CYCLE Cycle Network - 5 0
Cycle Parking at Stations 0 2
Cycle Parking at Buildings 0 2
Cycle Access in Buildings 0 1
CONNECT Intersection Density - 10 2
Small Blocks 0 5
Prioritized Connectivity 0 3
TRANSIT Maximum Walk Distance to Transit - 5 0
Average Walk Distance to Transit 0 5
MIX Complementary Uses 0 10
Accessibility to Food 0 1
Affordable Housing 0 4
DENSIFY Residential Density 0 10
Non-Residential Density 0 5
COMPACT Urban Site - 15 10
Short Commute 0 5
SHIFT Off-Street Parking 0 15
On-Street Parking and Traffic Area 0 5
BONUS For innovative measures/initiatives 0 5
Totals - 50 100
(+5 bonus)
19
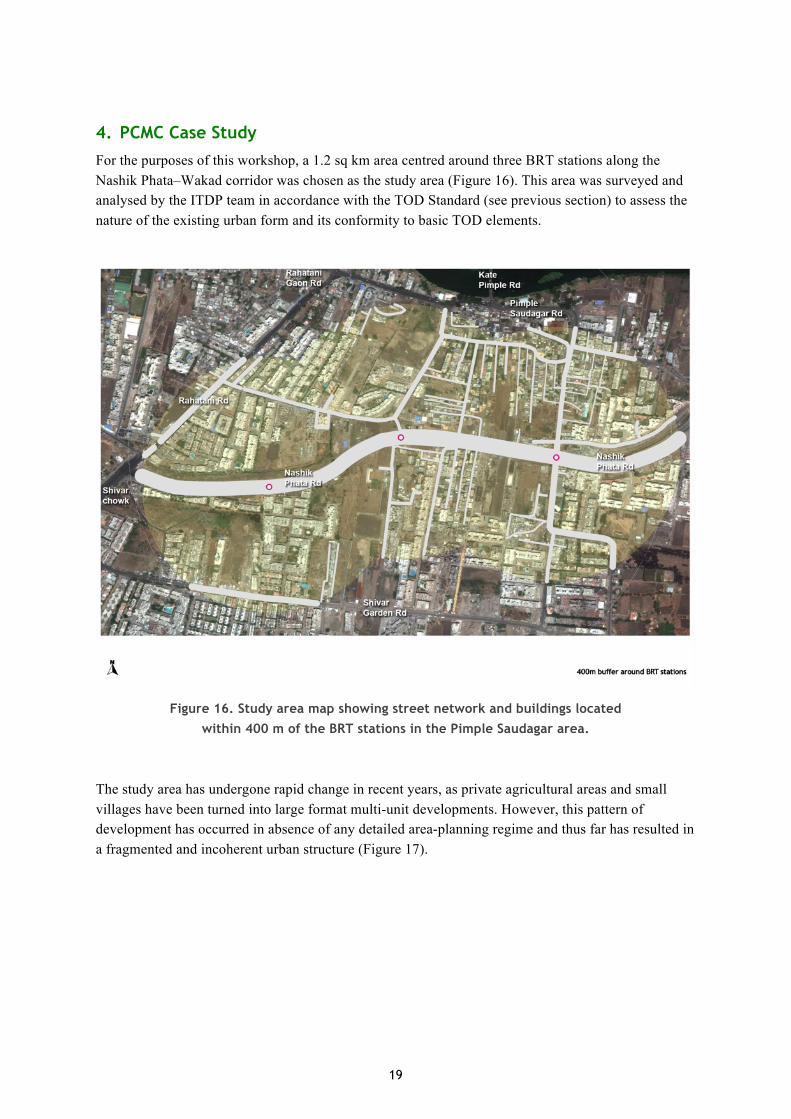
4. PCMC Case Study For the purposes of this workshop, a 1.2 sq km area centred around three BRT stations along the Nashik Phata–Wakad corridor was chosen as the study area (Figure 16). This area was surveyed and analysed by the ITDP team in accordance with the TOD Standard (see previous section) to assess the nature of the existing urban form and its conformity to basic TOD elements.
Figure 16. Study area map showing street network and buildings located within 400 m of the BRT stations in the Pimple Saudagar area.
The study area has undergone rapid change in recent years, as private agricultural areas and small villages have been turned into large format multi-unit developments. However, this pattern of development has occurred in absence of any detailed area-planning regime and thus far has resulted in a fragmented and incoherent urban structure (Figure 17).

20
Figure 17. Satellite images of the site from 2004, 2009, and 2012, revealing the rapid growth in the study area, without an underlying structural plan.
At the ground level, the case study site has many areas of opportunity, including a scenic river that runs through the north of the site and well located undeveloped parcels of land close to the BRT corridor that could be capitalised on, as the site attempts to ameliorate the existing conditions and arrive at an urban pattern more compatible with TOD requirements.

21
Figure 18. The view at the north end of the case study area over the bridge (top) and views from the BRT corridor (middle and bottom).
Given this context, the TOD Standard was applied to the study area surrounding the three BRT stations to identify what elements of the urban environment are supportive of public transport use as well as possible areas of improvement. Survey data collected through ground surveys were compiled and analysed using a GIS platform.
4.1 Walk
4.1.1 Objective: The pedestrian network is safe and complete
Metric 1.1: Walkways
In the study area, walkways that would meet the TOD Standard’s requirements do not exist in most parts. When they do exist, they are discontinuous and are not accessible to people with disabilities. Thus, on a score range of -10 to 0, the study area gets a score of -10.

22
Figure 19. Nature of existing sidewalks.
Metric 1.2 Crosswalks
Pedestrian safety must be ensured at street junctions through the presence of accessible crosswalks in all directions. Since the site lacks a defined pedestrian environment, it scores a -5 on a scale of -5 to 0.
Figure 20. Lack of pedestrian crossings and infrastructure.
Metric 1.3 Driveway Density
Neighbourhoods that promote walking should minimise the number of points where motor vehicle driveways interrupt the pedestrian realm. Given the large-format developments as well as the fact that the site is not completely developed, the driveway density is currently low at 0.497. This gives the site a score of 1 and provides an opportunity to keep the driveway density number low as the area develops further.

23
Figure 21. Pedestrian walkways are interrupted at gateways to large residential developments.
4.1.2 Objective: The pedestrian realm is active and vibrant
Metric 1.4 Visually Active Frontage
In order to create a pedestrian realm that is active, vibrant and safe, it is preferred to have at least 75 per cent of the buildings with visually active frontages. These could be in the form of actual openings and/or transparent frontages (windows/patios) that are visually penetrable and provide a means of passive surveillance. Since 67.1 per cent of building frontages in the study area relate to the street, the site scores 7 points out of a maximum of 10.
Figure 22. Streets with visually active frontages on public roads.
24
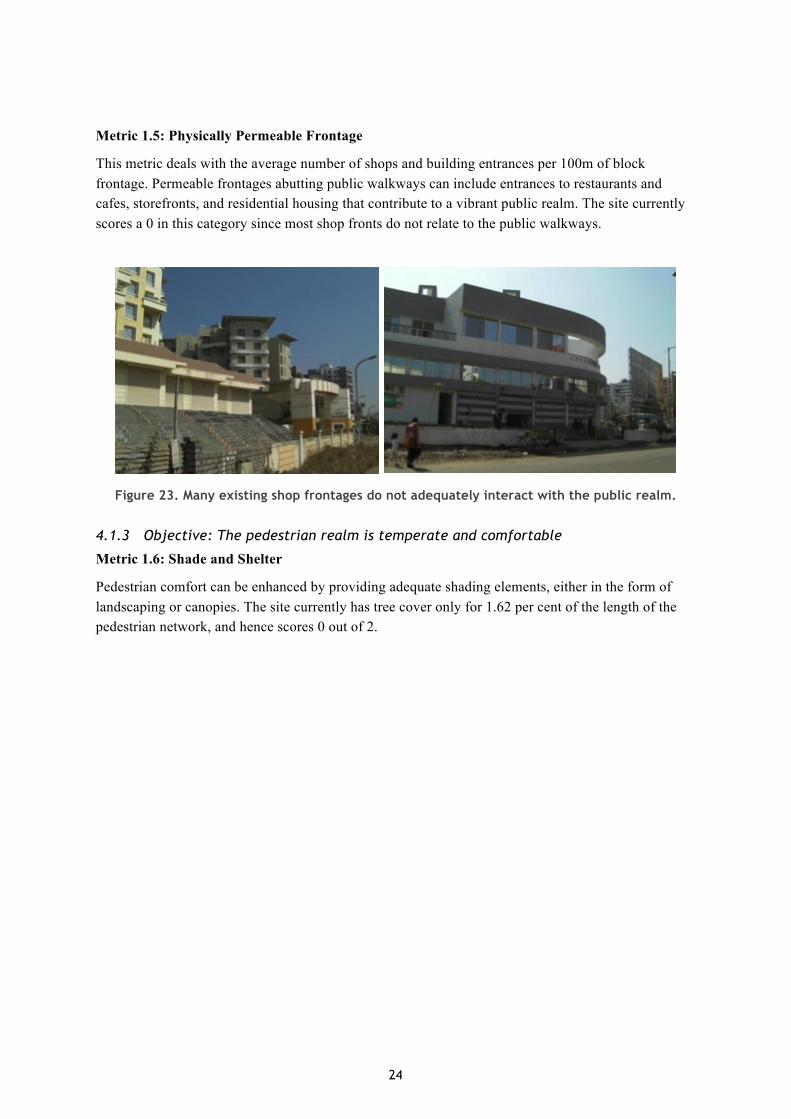
Metric 1.5: Physically Permeable Frontage
This metric deals with the average number of shops and building entrances per 100m of block frontage. Permeable frontages abutting public walkways can include entrances to restaurants and cafes, storefronts, and residential housing that contribute to a vibrant public realm. The site currently scores a 0 in this category since most shop fronts do not relate to the public walkways.
Figure 23. Many existing shop frontages do not adequately interact with the public realm.
4.1.3 Objective: The pedestrian realm is temperate and comfortable
Metric 1.6: Shade and Shelter
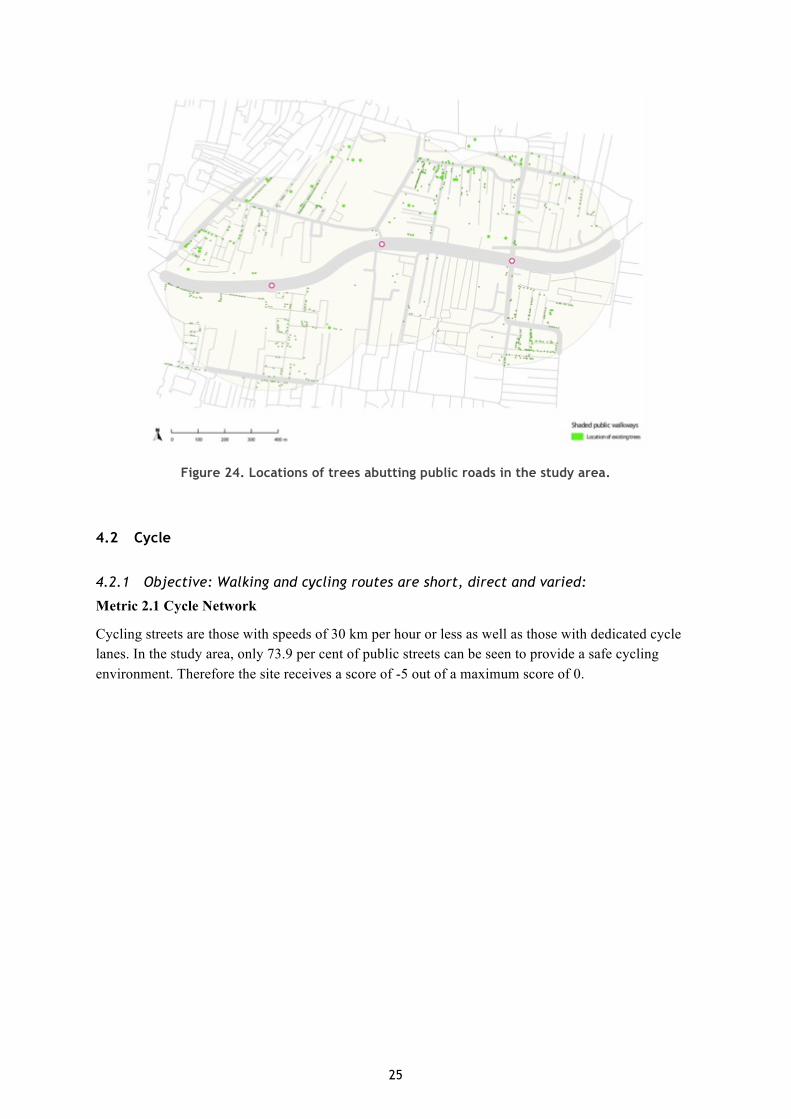
Pedestrian comfort can be enhanced by providing adequate shading elements, either in the form of landscaping or canopies. The site currently has tree cover only for 1.62 per cent of the length of the pedestrian network, and hence scores 0 out of 2.
25
Figure 24. Locations of trees abutting public roads in the study area.
4.2 Cycle
4.2.1 Objective: Walking and cycling routes are short, direct and varied:
Metric 2.1 Cycle Network
Cycling streets are those with speeds of 30 km per hour or less as well as those with dedicated cycle lanes. In the study area, only 73.9 per cent of public streets can be seen to provide a safe cycling environment. Therefore the site receives a score of -5 out of a maximum score of 0.

26
Figure 25. Cycle friendly streets.
Metric 2.2: Cycle Parking at Transit Stations
It is necessary to include secure cycle parking areas as part of the station design to encourage mode shifts from private motor vehicles to non-motorized transport. Since no cycle parking is mandated at BRT stations (or its vicinity) as per the current design proposal, the study area scores 0 out of a score range of 0 to 2.
Metric 2.3: Cycle parking at buildings
Increased use of cycles can occur only if adequate parking is provided not only at the stations, but also in the buildings that serve as trip origin or destination points. In the case of Pimple Saudagar, secure parking is available only in 19.3 per cent of the buildings, leading to a score of 0 out of maximum of 2 points. For the purpose of this calculation, buildings with parking floors at stilt and basement level are assumed to have cycle parking facilities.
Metric 2.4: Cycle Access in Buildings
This metric is a measure of cycle access in tenant-controlled spaces, as mandated by law. Since the Development Control Regulations of Pimpri Chinchwad mandate cycle parking in various land use categories, 1 point is awarded.
27
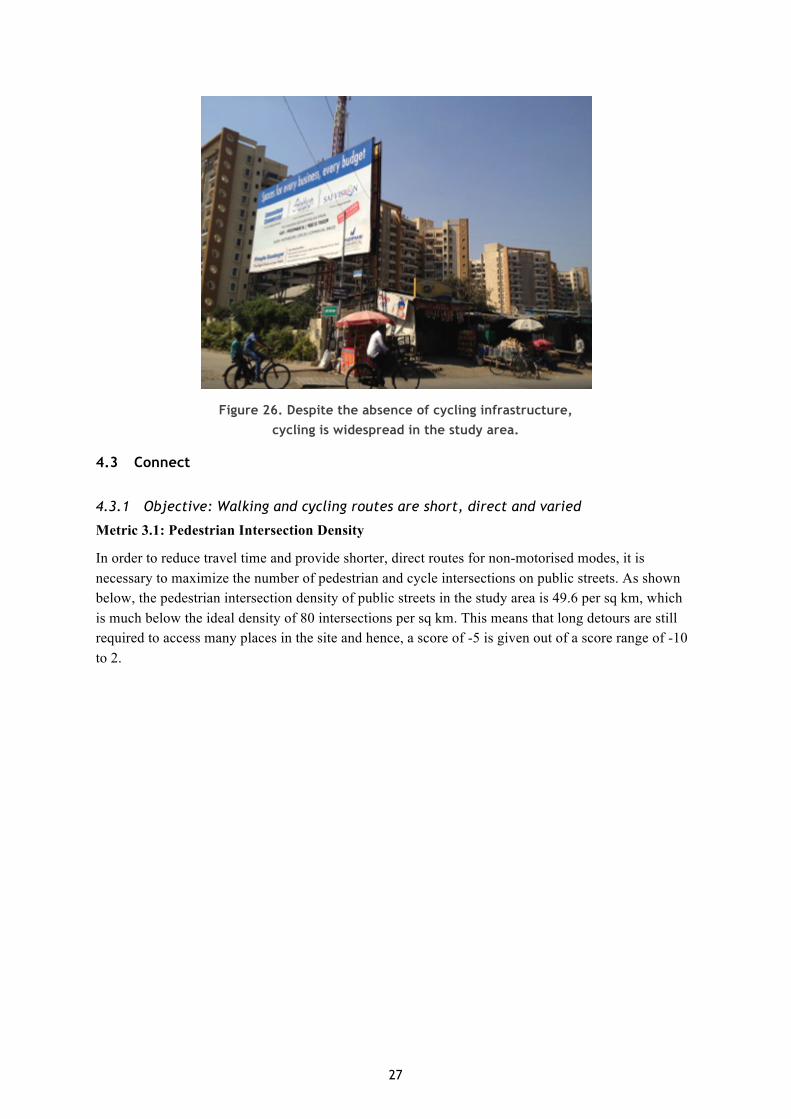
Figure 26. Despite the absence of cycling infrastructure, cycling is widespread in the study area.
4.3 Connect
4.3.1 Objective: Walking and cycling routes are short, direct and varied
Metric 3.1: Pedestrian Intersection Density
In order to reduce travel time and provide shorter, direct routes for non-motorised modes, it is necessary to maximize the number of pedestrian and cycle intersections on public streets. As shown below, the pedestrian intersection density of public streets in the study area is 49.6 per sq km, which is much below the ideal density of 80 intersections per sq km. This means that long detours are still required to access many places in the site and hence, a score of -5 is given out of a score range of -10 to 2.

28
Figure 27. Intersections of public streets.
Metric 3.2: Small Blocks
One means of improving connectivity is by encouraging smaller block sizes. In Pimple Saudagar, existing gated private developments reach up to 1,300 m in perimeter, rendering walking and cycling difficult and impractical.
Figure 28. A private development with block perimeter of 1,300 m.
This metric looks at the number of blocks that measure 150 m or less on the longest side of the block perimeter, resulting in a finer-grain urban fabric. As indicated in the map below, including blocks that

29
lie partially within the development, only 42 per cent satisfy this criterion and hence a score of 0 is given.
Figure 29. Blocks in the study area, with blocks with their longest side less than or equal to 150m highlighted in green.
4.3.2 Objective: Walking and cycling routes are shorter than motor vehicle routes
Metric 3.3: Prioritized connectivity
This metric looks at the number of pedestrian and cycle-only intersections as compared to the total number of all intersections. This area suffers from poor connectivity, resulting in a score of 0 for this metric.
Figure 30. Desire lines showing people’s need for better and shorter pedestrian connections.

30
4.4 Transit
4.4.1 Objective: High quality transit is accessible by foot
Metric 4.1: Percentage of Units Within Walk Distance to Transit Station
The poor network of public streets in the study area limits access to public transport. In Figure 31, the green area indicates the buildings that are within a 400 m walk of one of the three BRT stations. This area is much smaller than the ideal 400 m walking radius, shown in light yellow. Only 56.3 per cent of the total dwelling units are within a 5 minute walk of a BRT station.2 Thus there is a need to accommodate a larger number of people in denser developments located close to the BRT corridor and increase the density of pedestrian paths to reduce walking distances for existing residents.
Figure 31. Extent of the “REAL 400m walk” from the three BRT stations.
Metric 4.2: Average walk distance to transit
The weighted average walking distance to transit for Pimple Saudagar is 485 m. This means that the bulk of the population residing in the study area has to walk for more than 5 minutes to the nearest station. Hence the development, as it stands today, is not public transport friendly and gets a score of 1 out of 5.
4.5 Mix
2 Based on observed income levels and assumed dwelling unit sizes of 30 sq m per unit for lower income groups, 75 sq m per unit for middle income groups, and 140 sq m for high income groups.

31
4.5.1 Objective: Trip distances are reduced by providing diverse and complementary uses
Metric 5.1: Complementary uses
In order to reduce trip distances, there is a need to provide diverse and complementary uses within the development. In the study area, the development is assumed to be externally complementary due to the mix of land uses along the proposed BRT corridor. But within the study area, over 93.9 per cent of the developed floor area is used dedicated to residential uses (Figure 32). This means that the site is heavily biased towards residential space, creating imbalances in commute patterns to and from other regional job centres. Furthermore, this results in greater trip generation for shopping, entertainment and other daily necessities. Considering these factors, the site receives a total score of 5 out of 10.
Figure 32. The land use map reveals the predominance of residential uses in the study area.
Metric 5.2. Accessibility to food
Access to fresh food is a daily requirement and results in many generated local and citywide trips. This site enjoys relatively good access to local food, both in formal spaces as well as through informal street vending, resulting in a score of 1 out of 1.

32
Figure 33. Food outlets and shops are common in the study area.
4.5.2 Objective: Short commutes for lower income groups
Metric 5.3: Affordable housing
As shown below, coexistence of older developments in the study area on smaller plots along with large format gated private developments has ensured a good mix of income groups around the transit corridor. With affordable housing units constituting 18.8 per cent of the total number of dwelling units in the region, a score of 3 is earned out of 4. However, it must be noted that this is not through planning but due to historical reasons.
Figure 34. Income distribution across the study area.
33
4.6 Density
4.6.1 Objective: Residential and job densities support high quality transit and local services
Metric 6.1: Residential density
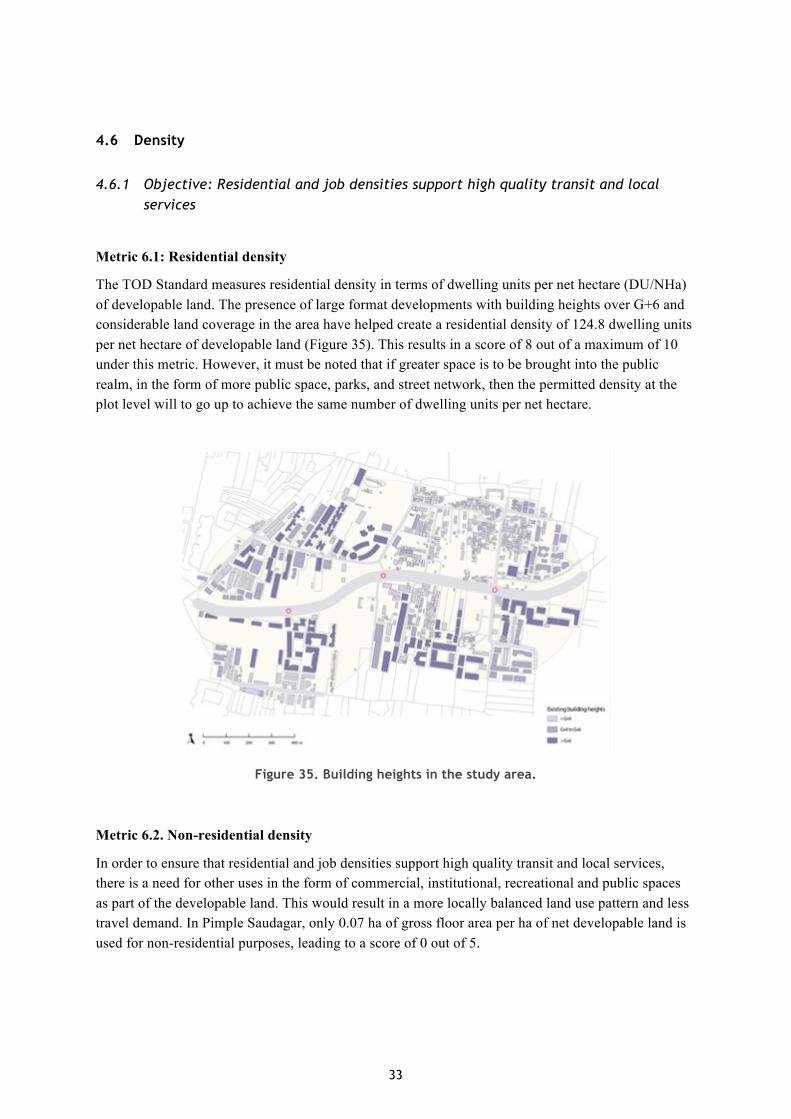
The TOD Standard measures residential density in terms of dwelling units per net hectare (DU/NHa) of developable land. The presence of large format developments with building heights over G+6 and considerable land coverage in the area have helped create a residential density of 124.8 dwelling units per net hectare of developable land (Figure 35). This results in a score of 8 out of a maximum of 10 under this metric. However, it must be noted that if greater space is to be brought into the public realm, in the form of more public space, parks, and street network, then the permitted density at the plot level will to go up to achieve the same number of dwelling units per net hectare.
Figure 35. Building heights in the study area.
Metric 6.2. Non-residential density
In order to ensure that residential and job densities support high quality transit and local services, there is a need for other uses in the form of commercial, institutional, recreational and public spaces as part of the developable land. This would result in a more locally balanced land use pattern and less travel demand. In Pimple Saudagar, only 0.07 ha of gross floor area per ha of net developable land is used for non-residential purposes, leading to a score of 0 out of 5.
34
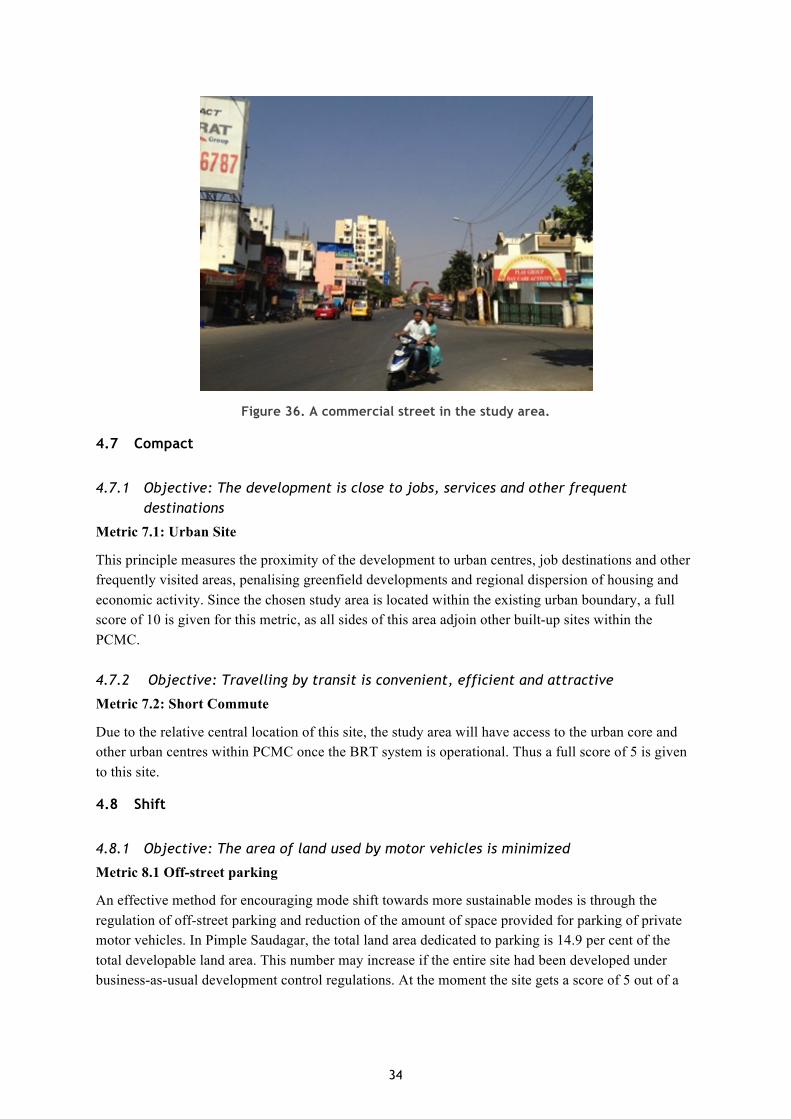
Figure 36. A commercial street in the study area.
4.7 Compact
4.7.1 Objective: The development is close to jobs, services and other frequent destinations
Metric 7.1: Urban Site
This principle measures the proximity of the development to urban centres, job destinations and other frequently visited areas, penalising greenfield developments and regional dispersion of housing and economic activity. Since the chosen study area is located within the existing urban boundary, a full score of 10 is given for this metric, as all sides of this area adjoin other built-up sites within the PCMC.
4.7.2 Objective: Travelling by transit is convenient, efficient and attractive
Metric 7.2: Short Commute
Due to the relative central location of this site, the study area will have access to the urban core and other urban centres within PCMC once the BRT system is operational. Thus a full score of 5 is given to this site.
4.8 Shift
4.8.1 Objective: The area of land used by motor vehicles is minimized
Metric 8.1 Off-street parking
An effective method for encouraging mode shift towards more sustainable modes is through the regulation of off-street parking and reduction of the amount of space provided for parking of private motor vehicles. In Pimple Saudagar, the total land area dedicated to parking is 14.9 per cent of the total developable land area. This number may increase if the entire site had been developed under business-as-usual development control regulations. At the moment the site gets a score of 5 out of a

35
maximum of 15 and there is an opportunity to maintain this score and build on it, if parking requirements are altered for TOD areas.
Figure 37. Off-Street parking provision in private developments.
Metric 8.2: On-street parking and traffic area
Currently in the study area, road space used for on-street parking and car travel account for 13.8 per cent of the total study area. While this gives the study area a score of 4 out of 5 according to the Standard, it must be noted that most streets are private and hence are not counted towards this score. Hence, the challenge will be to create a better public street network within the existing framework while further minimising space for motor vehicles.
4.9 Overall TOD score
Overall, the site scores 25 out of a score range of -50 to 100 points, with the scores for individual categories listed below.
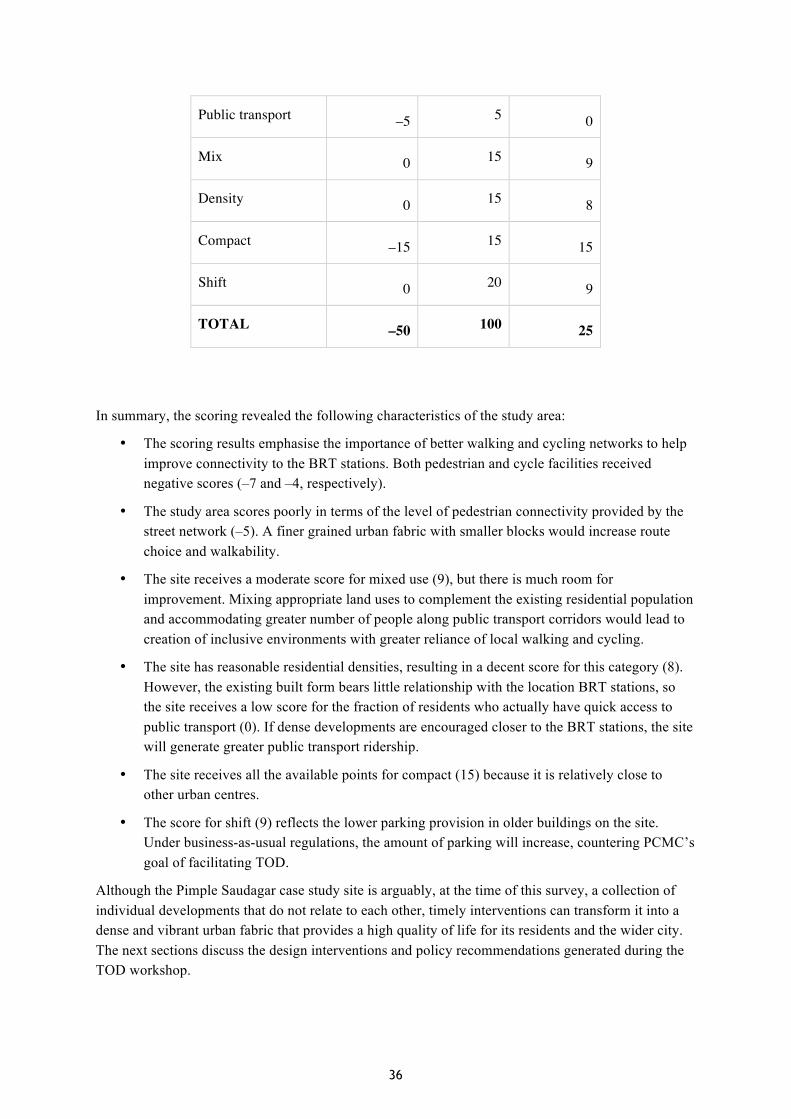
Table 2. TOD Standard scores for the Pimple Saudagar study area
Possible scores
Principle Min. Max. Study area score
Walk –15 15 –7
Cycle –5 5 –4
Connect –10 10 –5
36
Public transport –5 5 0
Mix 0 15 9
Density 0 15 8
Compact –15 15 15
Shift 0 20 9
TOTAL –50 100 25
In summary, the scoring revealed the following characteristics of the study area:
• The scoring results emphasise the importance of better walking and cycling networks to help improve connectivity to the BRT stations. Both pedestrian and cycle facilities received negative scores (–7 and –4, respectively).
• The study area scores poorly in terms of the level of pedestrian connectivity provided by the street network (–5). A finer grained urban fabric with smaller blocks would increase route choice and walkability.
• The site receives a moderate score for mixed use (9), but there is much room for improvement. Mixing appropriate land uses to complement the existing residential population and accommodating greater number of people along public transport corridors would lead to creation of inclusive environments with greater reliance of local walking and cycling.
• The site has reasonable residential densities, resulting in a decent score for this category (8). However, the existing built form bears little relationship with the location BRT stations, so the site receives a low score for the fraction of residents who actually have quick access to public transport (0). If dense developments are encouraged closer to the BRT stations, the site will generate greater public transport ridership.
• The site receives all the available points for compact (15) because it is relatively close to other urban centres.
• The score for shift (9) reflects the lower parking provision in older buildings on the site. Under business-as-usual regulations, the amount of parking will increase, countering PCMC’s goal of facilitating TOD.
Although the Pimple Saudagar case study site is arguably, at the time of this survey, a collection of individual developments that do not relate to each other, timely interventions can transform it into a dense and vibrant urban fabric that provides a high quality of life for its residents and the wider city. The next sections discuss the design interventions and policy recommendations generated during the TOD workshop.

37
5. Workshop findings
5.1 Workshop agenda
The primary purpose of the PCMC TOD workshop was to bring various government officials and other stakeholders together to discuss salient TOD planning concerns in the PCMC context. The case study site was used as a facilitation tool to generate spatial strategies that could be unpacked into specific policies and strategies that would be applicable to the PCMC’s corridors as well as other TOD sites. Given the complexity of this exercise, workshop participants formed three teams, each focusing on one facet of TOD planning (Figure 38):
1. Transit-oriented land use planning 2. Structure and design of the public realm 3. Built form and its impact on the public realm
Each group discussed a series of possible mechanisms to shape the development along the BRT corridors, focusing on interventions that facilitate the adoption of the eight TOD principles mentioned in the previous chapter. Facilitators from ITDP circulated among the groups, helping to highlight the essential inter-linkages among the respective themes being discussed by each group.
Figure 38. TOD planning process and workshop flow.
To facilitate the discussion process, the ITDP team presented examples of the TOD planning process, illustrating steps such as data collection, site analysis, design work, and the formulation of policy
38
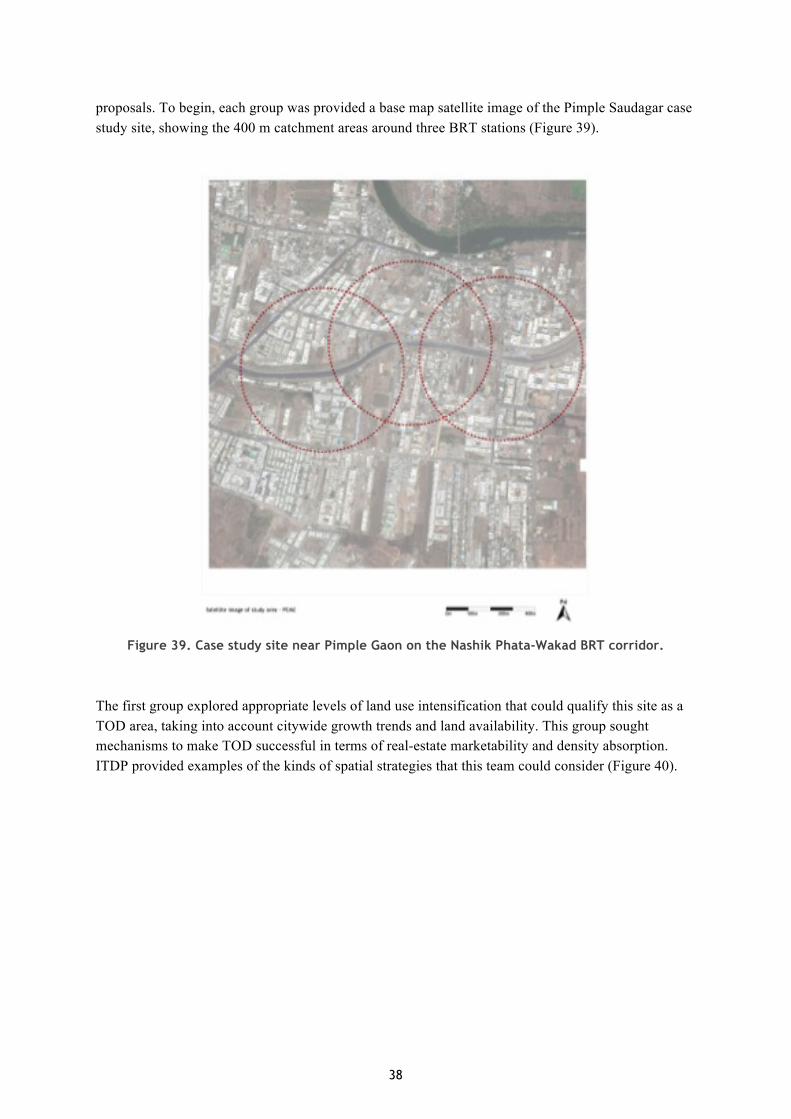
proposals. To begin, each group was provided a base map satellite image of the Pimple Saudagar case study site, showing the 400 m catchment areas around three BRT stations (Figure 39).
Figure 39. Case study site near Pimple Gaon on the Nashik Phata-Wakad BRT corridor.
The first group explored appropriate levels of land use intensification that could qualify this site as a TOD area, taking into account citywide growth trends and land availability. This group sought mechanisms to make TOD successful in terms of real-estate marketability and density absorption. ITDP provided examples of the kinds of spatial strategies that this team could consider (Figure 40).
39
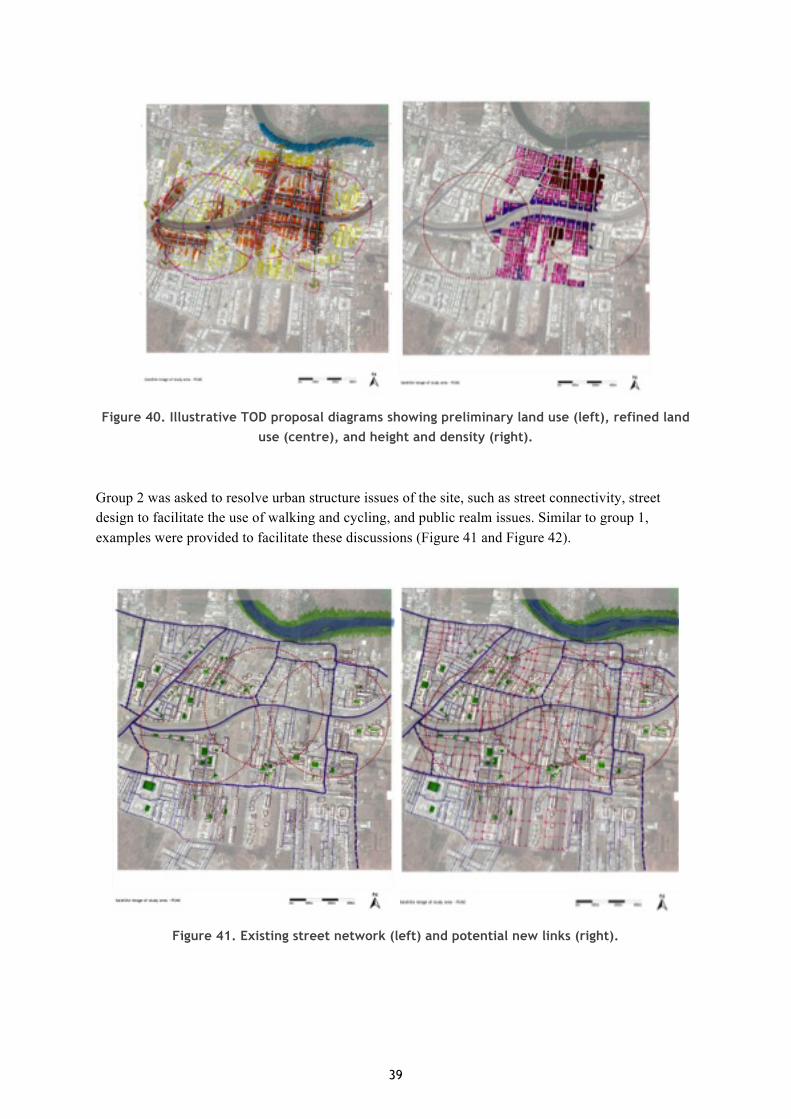
Figure 40. Illustrative TOD proposal diagrams showing preliminary land use (left), refined land use (centre), and height and density (right).
Group 2 was asked to resolve urban structure issues of the site, such as street connectivity, street design to facilitate the use of walking and cycling, and public realm issues. Similar to group 1, examples were provided to facilitate these discussions (Figure 41 and Figure 42).
Figure 41. Existing street network (left) and potential new links (right).

40
Figure 42. Possible pedestrian network (left) and cycling connections (right).
Finally, group 3 was asked to brainstorm on possible roles that private land owners and future developers can play in facilitating the transformation of the site. Critically, this group explored ways to create smaller blocks to improve pedestrian access (Figure 43). and mechanisms to bring more of the private open space in the study area into the public domain The group also discussed means of incentivising the creation of appropriate building typologies that are conducive to a safer and more vibrant public realm (Figure 44).
Figure 43. Creating smaller blocks given the alignment of existing lot boundaries (left). As redevelopment occurs, large blocks can be subdivided (new blocks in dark green, right).

41
Figure 44. Examples of building typologies that facilitate intensification while creating a safe, vibrant edge at street level (clockwise from top left): point towers on a podium base, row
housing, towers with interlinked pedestrian plazas, and mid-rise blocks.
The hope of the workshop was to also emulate the kind of analysis, design, and policymaking process that the city can pursue to produce successful and contextual TOD plans and strategies. These kinds of activities should be always integrated through interdepartmental coordination. An eventual outcome is the formulation of Detailed Development Plans (DDPs) for key TOD zones within the city. For this particular site, an example of a possible synthesis of these ideas into a plan and a vision was provided (Figure 45).

42
Figure 45. Example of a Detailed Development Plan map for the case study area.
During the workshop, ITDP facilitators moved from one group to another to encourage cross-pollination of ideas and greater synthesis of the policy proposals amongst the groups. At the end of the day, groups presented the culmination of their work to other participants and engaged in dialogue about the next steps for TOD planning. The following section provides a more detailed summary of the group discussions and policy proposals, while actions and strategies that can be taken on by the Corporation are provided in the next chapter.
5.2 Group 1: Transit oriented land use planning
At the city level, there is a need to facilitate the use of public transport through appropriate intensification of land uses within walking distance of mass rapid transit stations while restricting high-intensity development of areas not well served by public transport. In addition, appropriate mixing of land uses and income groups can help transform these station areas into vibrant public spaces. Group 1 discussed methods for achieving these land use patterns in PCMC.
5.2.1 Increasing population and job density near BRT and metro stations
The population of Pimpri Chinchwad is projected to increase by 43 per cent by 2021 (i.e. an increase of 7.4 lakh residents between 2011 and 2021). As an initial activity, this group calculated the additional floor area required to accommodate such a population increase within the existing TOD band of 100 m on either side of the 40 km length of BRT corridors in PCMC. The calculation considered both the direct residential space requirement as well as the accompanying commercial uses

43
based on the ratio of commercial to residential space in a typical urban area. Under the existing allowed base FSI of 1 plus transfer of development right (TDR) FSI of 1, very few of the 7.4 lakh new residents can be accommodated along the BRT corridors. Instead, they will be compelled to move to areas in PCMC that lack frequent, high quality public transport service. Thus, the group discussed ways to allow more of the expected growth to occur along the BRT corridors. The group observed that if FSI alone were adjusted in the existing 100 m buffer, an allowed FSI of 26 would be required to accommodate all of these residents near BRT. However, if the TOD zone were widened to 400 m on either side of the corridor, a more reasonable FSI of around 4 would accommodate the increase in population close to public transport. Therefore, the group concluded that the TOD zone should be expanded to a full 400 m buffer.
Table 3. Comparison of the average FSI and buildable area for BRT and Metro zones
BRT Metro Length of corridor (km) 10 10 Number of stations 20 10 Primary zone FSI 5 5 Primary zone dimension (m)* 200 300 Primary zone area (sq km) 4.0 2.8 Secondary zone FSI 3 3 Secondary zone dimension (m)** 400 450 Secondary zone area (sq km) 4.0 6.2 Total TOD zone area (sq km) 8.0 9.0 Average FSI in primary + secondary zones 4.0 3.6 Buildable area available (sq km) 32.0 32.7
The presence of multiple mass rapid transit modes in PCMC—metro and BRT—led the participants to debate the appropriate methodology for the delineation of the TOD area boundaries. Due to the proximity of the BRT stations to each other, the group decided to define the TOD zones along BRT corridors as a continuous band, 400 m on either side of the corridor. For the metro stations, the primary influence zone is a circular buffer with a radius of 400 m. The secondary zone consists of a continuous 600 m band on either side of the metro line. The group also calculated the capacity of the BRT versus the metro and came to the conclusion that BRT could have the same capacity as metro, provided that overtaking lanes and multiple sub-stops are provided along the BRT corridors. Since a wide ROW is available on the PCMC BRT corridors, participants agreed that passing lanes could be implemented throughout the network. Thus, a maximum FSI of 5 is proposed for both the BRT and metro primary TOD zones.

44
Figure 46. Passing lanes can expand the capacity of a BRT system.
In order to maximize the population situated close to the BRT corridor, it was proposed to provide graduated bands of FSI, with the highest densities closest to the BRT corridor (Figure 47):
• The inner 200 m band on either side of the corridor should have an FSI of 5. • The outer band up to 400 m on either side of the corridor should have an FSI of 2. • All other areas should have an FSI of 1.
Figure 47. Diagram of intensification along BRT corridors
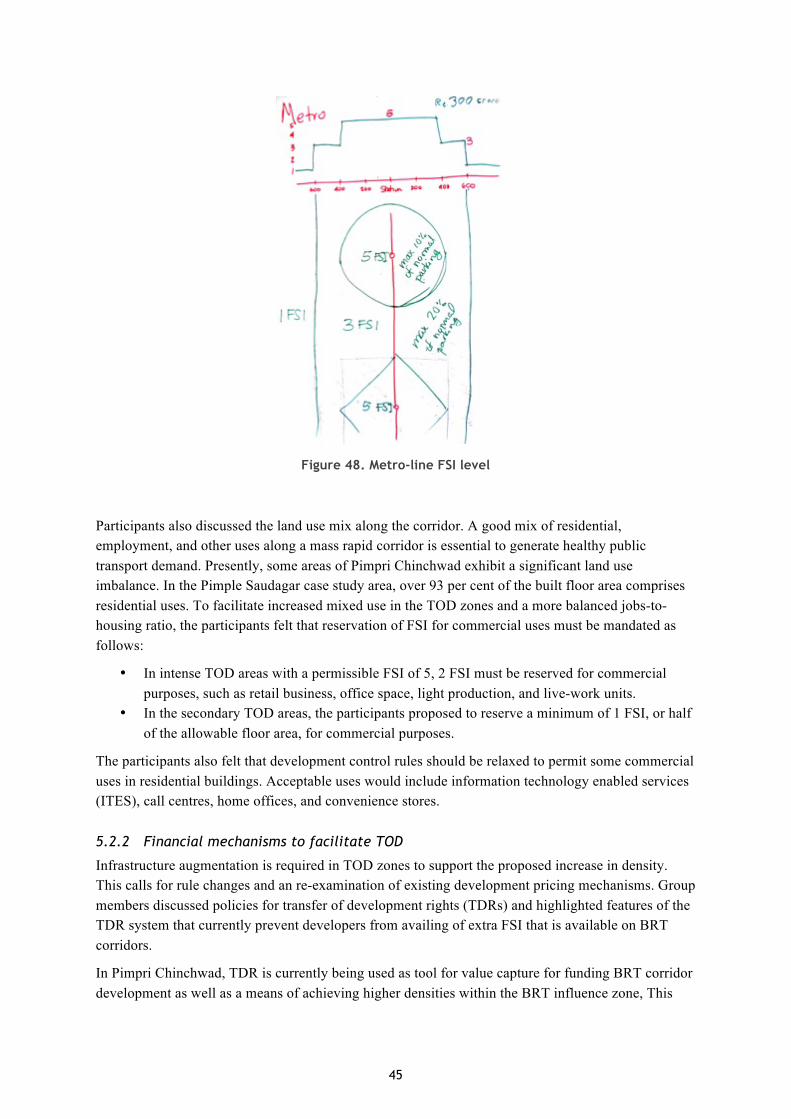
In the case of the metro corridor, it was decided that the inner influence area could take the form of a circular zone with a radius of 400 m centred on the metro station. This inner zone would have an FSI of 5, while the secondary influence zone, up to 600 m on either side of the metro corridor, will have an FSI of 3 (Figure 48). The outer areas would have an FSI of 1.
45
Figure 48. Metro-line FSI level
Participants also discussed the land use mix along the corridor. A good mix of residential, employment, and other uses along a mass rapid corridor is essential to generate healthy public transport demand. Presently, some areas of Pimpri Chinchwad exhibit a significant land use imbalance. In the Pimple Saudagar case study area, over 93 per cent of the built floor area comprises residential uses. To facilitate increased mixed use in the TOD zones and a more balanced jobs-to-housing ratio, the participants felt that reservation of FSI for commercial uses must be mandated as follows:
• In intense TOD areas with a permissible FSI of 5, 2 FSI must be reserved for commercial purposes, such as retail business, office space, light production, and live-work units.
• In the secondary TOD areas, the participants proposed to reserve a minimum of 1 FSI, or half of the allowable floor area, for commercial purposes.
The participants also felt that development control rules should be relaxed to permit some commercial uses in residential buildings. Acceptable uses would include information technology enabled services (ITES), call centres, home offices, and convenience stores.
5.2.2 Financial mechanisms to facilitate TOD
Infrastructure augmentation is required in TOD zones to support the proposed increase in density. This calls for rule changes and an re-examination of existing development pricing mechanisms. Group members discussed policies for transfer of development rights (TDRs) and highlighted features of the TDR system that currently prevent developers from availing of extra FSI that is available on BRT corridors.
In Pimpri Chinchwad, TDR is currently being used as tool for value capture for funding BRT corridor development as well as a means of achieving higher densities within the BRT influence zone, This
46
influence zone is considered to be a 100 m buffer on either site of the BRT corridor. Existing regulations allow a total FSI of 2 in this zone, inclusive of the following components:
• 1.0 FSI by right
• 0.4 reservation TDR
• 0.4 road widening TDR
• 0.2 slum developments TDR
PCMC is divided into zones A, B and C, where ‘A’ is the most congested and ‘C’ is the least developed. TDR from any of these zones across the city can be used in the BRT influence zone, subject to the following premium charges:
• Zone A: Rs. 3,000 per sq m
• Zone B: Rs. 6,000 per sq m
• Zone C: Rs. 9,000 per sq m for areas originally part of zone C, and Rs. 12,000 per sq m for new areas that are merged into this zone.
Participants were emphatic that the existing charges are prohibitively expensive and discourage the intensification of the BRT corridors. In addition, participants cited the additional parking requirement in the BRT corridors as an additional factor that increases the cost of development in the TOD zones. Participants recommended reducing the premium charges to 0.5 times the ready reckoner rate for the respective parcel.
Participants also clarified how developers can generate the higher FSI that is proposed for BRT corridors, taking a hypothetical average target FSI of 4 across the intense and secondary TOD zones. The existing base FSI of 1 would remain in place. Next, participants calculated the approximate amount of FSI that could be generated from land throughout the city that is reserved for open space and other public purposes in the Development Plan. The initial assessment suggested that this TDR could contribute development rights equivalent to approximately 1 FSI on vacant lands in the 400 m buffer along the BRT corridors. Finally, the remaining 2 FSI would come in the form of premium FSI, charged at 0.5 times the ready reckoner rate, as described above.
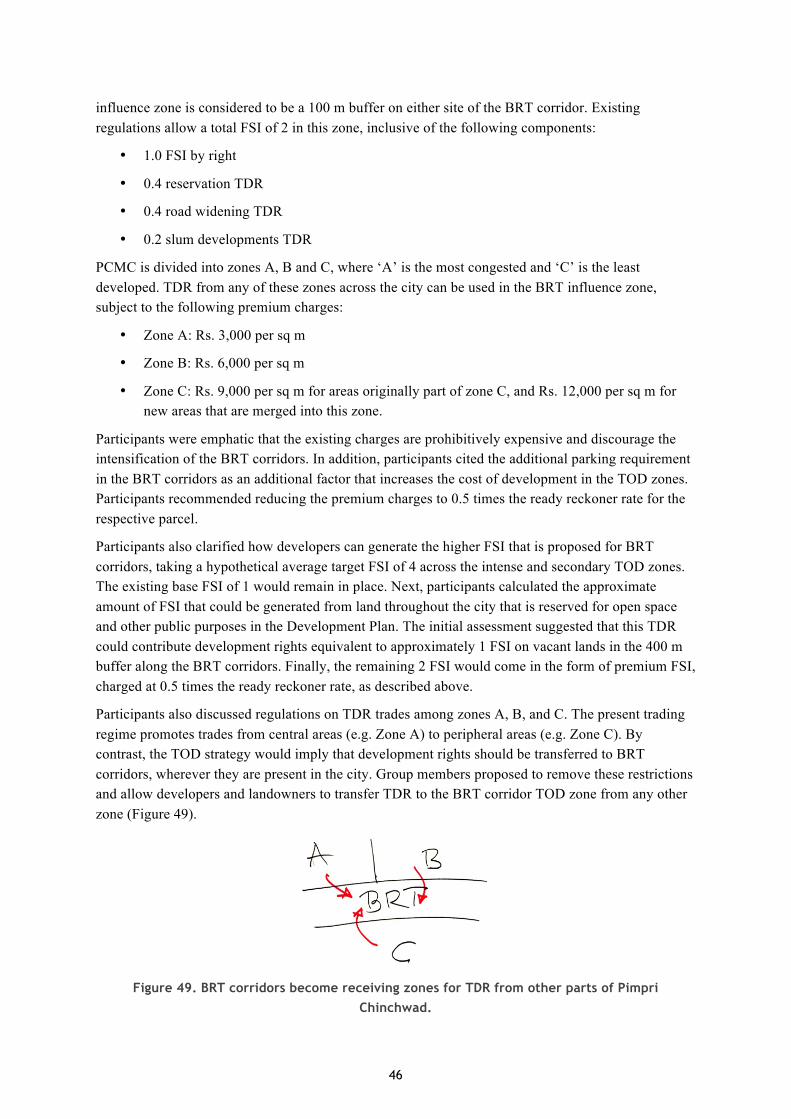
Participants also discussed regulations on TDR trades among zones A, B, and C. The present trading regime promotes trades from central areas (e.g. Zone A) to peripheral areas (e.g. Zone C). By contrast, the TOD strategy would imply that development rights should be transferred to BRT corridors, wherever they are present in the city. Group members proposed to remove these restrictions and allow developers and landowners to transfer TDR to the BRT corridor TOD zone from any other zone (Figure 49).
Figure 49. BRT corridors become receiving zones for TDR from other parts of Pimpri Chinchwad.
47
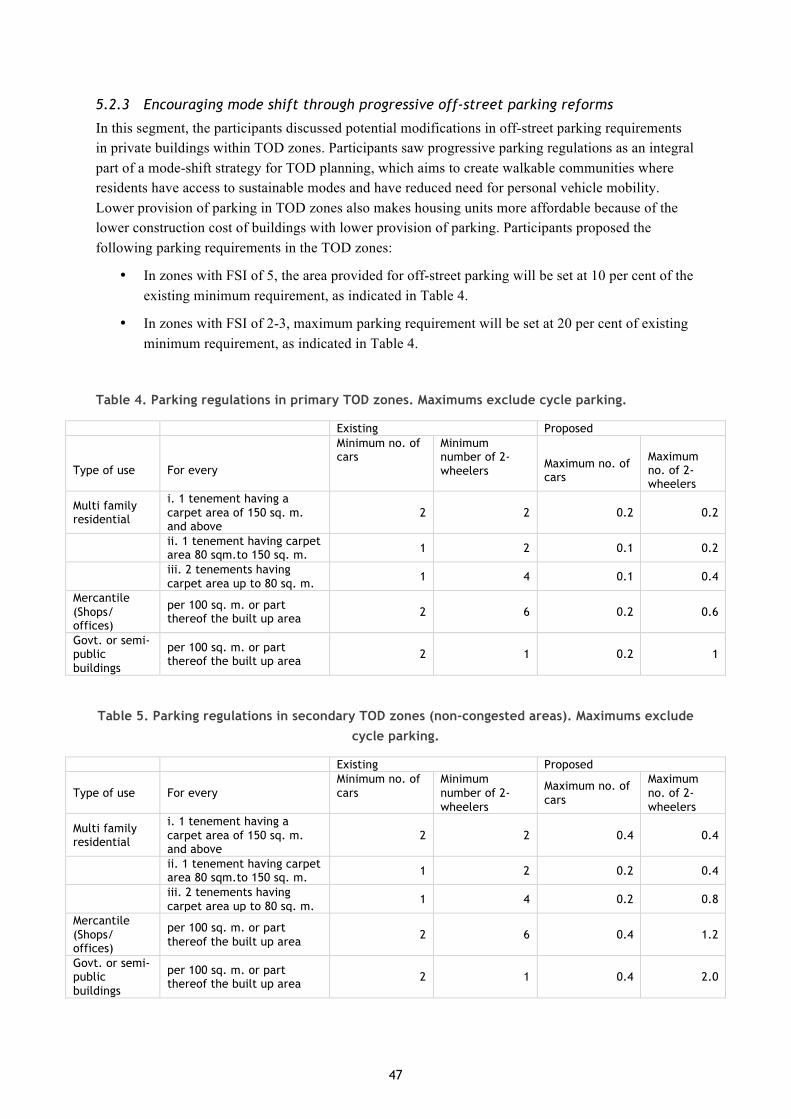
5.2.3 Encouraging mode shift through progressive off-street parking reforms In this segment, the participants discussed potential modifications in off-street parking requirements in private buildings within TOD zones. Participants saw progressive parking regulations as an integral part of a mode-shift strategy for TOD planning, which aims to create walkable communities where residents have access to sustainable modes and have reduced need for personal vehicle mobility. Lower provision of parking in TOD zones also makes housing units more affordable because of the lower construction cost of buildings with lower provision of parking. Participants proposed the following parking requirements in the TOD zones:
• In zones with FSI of 5, the area provided for off-street parking will be set at 10 per cent of the existing minimum requirement, as indicated in Table 4.
• In zones with FSI of 2-3, maximum parking requirement will be set at 20 per cent of existing minimum requirement, as indicated in Table 4.
Table 4. Parking regulations in primary TOD zones. Maximums exclude cycle parking.
Existing Proposed
Type of use For every
Minimum no. of cars
Minimum number of 2-wheelers
Maximum no. of cars
Maximum no. of 2-wheelers
Multi family residential
i. 1 tenement having a carpet area of 150 sq. m. and above
2 2 0.2 0.2
ii. 1 tenement having carpet area 80 sqm.to 150 sq. m. 1 2 0.1 0.2
iii. 2 tenements having carpet area up to 80 sq. m. 1 4 0.1 0.4
Mercantile (Shops/ offices)
per 100 sq. m. or part thereof the built up area 2 6 0.2 0.6
Govt. or semi-public buildings
per 100 sq. m. or part thereof the built up area 2 1 0.2 1
Table 5. Parking regulations in secondary TOD zones (non-congested areas). Maximums exclude cycle parking.
Existing Proposed
Type of use For every Minimum no. of cars
Minimum number of 2-wheelers
Maximum no. of cars
Maximum no. of 2-wheelers
Multi family residential
i. 1 tenement having a carpet area of 150 sq. m. and above
2 2 0.4 0.4
ii. 1 tenement having carpet area 80 sqm.to 150 sq. m. 1 2 0.2 0.4
iii. 2 tenements having carpet area up to 80 sq. m. 1 4 0.2 0.8
Mercantile (Shops/ offices)
per 100 sq. m. or part thereof the built up area 2 6 0.4 1.2
Govt. or semi-public buildings
per 100 sq. m. or part thereof the built up area 2 1 0.4 2.0
48
5.2.4 Enabling development of affordable housing within TOD areas In the last session for this group, the discussion revolved around the need to locate affordable housing along the TOD corridors to ensure that lower income residents can live close to mass rapid transit stations. Participants explored incentives such as FSI bonuses and a cap on dwelling unit sizes as means to encourage private developers to provide affordable housing units to lower income groups.
It was proposed that in areas with maximum allowable FSI of 5 with plots larger than 0.5 acre, minimum 30 per cent of the dwelling units must be less than or equal to 45 sq m. In the secondary TOD zone with an FSI limit of 2 to 3, the participants proposed that a minimum of 25 per cent of dwelling units must be less than or equal to 45 sq m for plots larger than 0.5 acre. It was also proposed that for FSI that goes toward affordable units, no premium will be charged. For those developers who provide more affordable units than the mandated minimum, the participants proposed a discount on the remaining premium charges.
5.3 Group 2: Structure and design of the public realm
The primary aim of this group was to guide the creation of a high quality public realm that prioritises access for pedestrians, cyclists and public transport customers. The group began by examining the existing street network—both public and private—to get a better sense of the challenges that have emerged in this site absent of any detailed street network planning. From there, the group began discussing policy and design issues.
5.3.1 Using street design guidelines to facilitate the creation of high quality facilities for cyclists and pedestrians
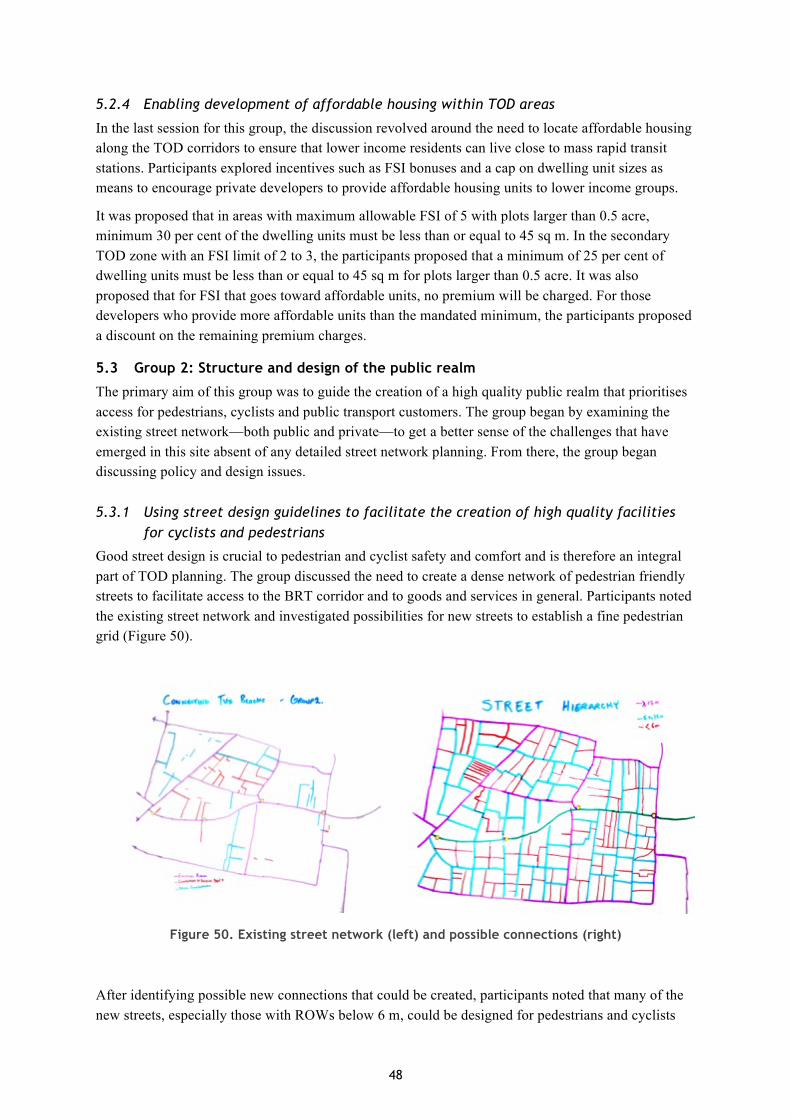
Good street design is crucial to pedestrian and cyclist safety and comfort and is therefore an integral part of TOD planning. The group discussed the need to create a dense network of pedestrian friendly streets to facilitate access to the BRT corridor and to goods and services in general. Participants noted the existing street network and investigated possibilities for new streets to establish a fine pedestrian grid (Figure 50).
Figure 50. Existing street network (left) and possible connections (right)
After identifying possible new connections that could be created, participants noted that many of the new streets, especially those with ROWs below 6 m, could be designed for pedestrians and cyclists

49
only. In general, group members felt that PCMC should adopt a street hierarchy policy that defines street types, standard sections, and street audit procedures. Groups identified three broad categories of streets:
• Streets with ROWs of 6 m or below would be open to pedestrians and cyclists only. They would have a unique surface treatment to distinguish them from streets that are open to motor vehicle (Figure 51).
• Streets with ROWs from 6 m to 12 m can be mixed traffic, but physical design would be employed to reduce motor vehicle volumes and speeds (i.e. below 15 km/h) so that the street space can be shared with pedestrian and cyclists safely (Figure 52).
• For streets that are wider than 12 m, a more formal complete street design can be applied, with segregation of modes, including dedicated cycle tracks and footpaths on both sides of the street. For the carriageway, participants agreed that lanes should be no more than 3 m wide, to create a slower, calmer environment (Figure 52).
Figure 51. Pedestrian and cycle only streets on ROWs <6m
Figure 52. Shared streets with ROWs between 6 m to 12 m (left) and segregation of different
modes (complete streets) on streets with ROWs above 12 m (right).

50
Given that large private developments often reduce the scope for creating a fine pedestrian grid, the group reached consensus that PCMC should set a maximum building footprint dimension of 45 m. Moreover, the widest dimension of private plots should not exceed 150 m on any side. These two measures would increase connectivity within a TOD (Figure 53). Finally, private walls should be discouraged around entire lots and, if constructed, should wrap around individual buildings within the lot, providing greater connectivity and transparency.
Figure 53. New public access lanes should be implemented through plots that are more than 150 m long.
5.3.2 Facilitating cycling through the provision of an integrated greenway and cycle track network and secure cycle parking
The group discussed the importance of cycling and non-motorised transportation to the overall success of TOD zones. Beyond the proposal for shared streets that could provide access for slower cyclist movement, serious cycle commutes require dedicated and relatively uninterrupted lanes for faster movement. Cycle tracks are already planned on the Nashik Phata-Wakad BRT corridor, but participants agreed that any street with a ROW of 18 m (i.e. with motor vehicle speeds above 30 km/h) and above should have dedicated cycle tracks.
In addition, the river on the north end of the site was seen as an area of opportunity, where PCMC can create a pedestrian and cycle greenway that could shorten east-west cycle commutes and serve as a recreational facility (Figure 54).
51
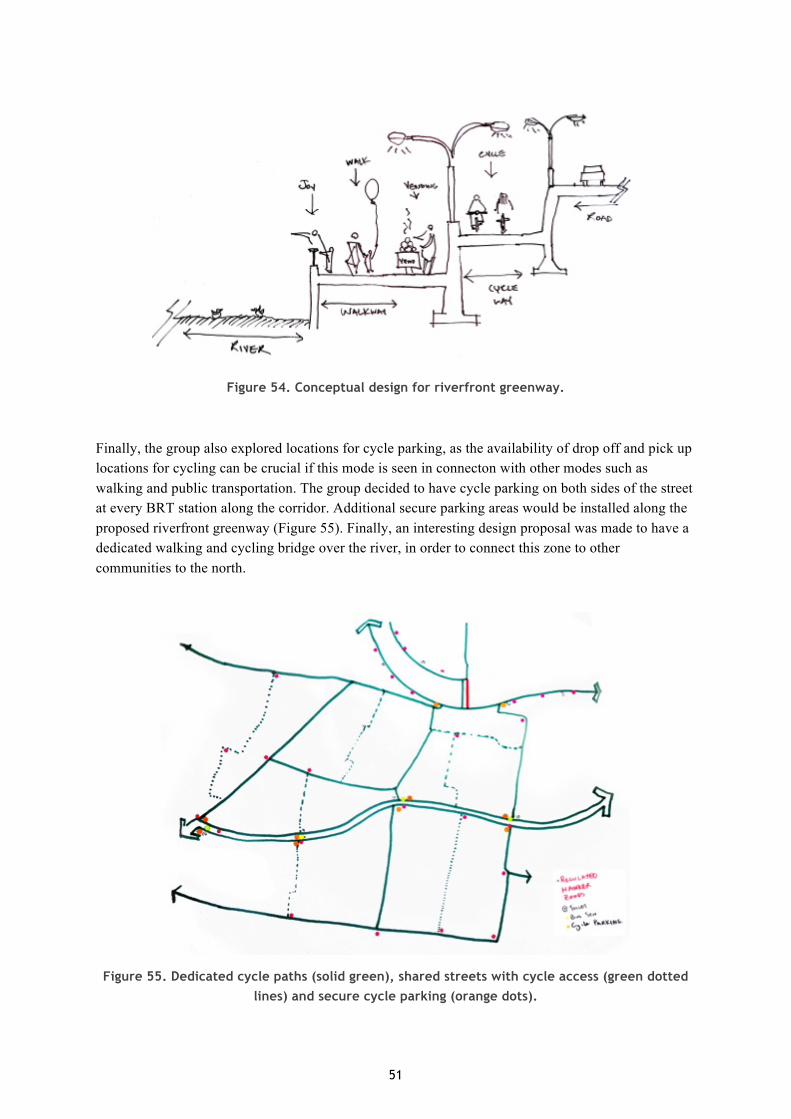
Figure 54. Conceptual design for riverfront greenway.
Finally, the group also explored locations for cycle parking, as the availability of drop off and pick up locations for cycling can be crucial if this mode is seen in connecton with other modes such as walking and public transportation. The group decided to have cycle parking on both sides of the street at every BRT station along the corridor. Additional secure parking areas would be installed along the proposed riverfront greenway (Figure 55). Finally, an interesting design proposal was made to have a dedicated walking and cycling bridge over the river, in order to connect this zone to other communities to the north.
Figure 55. Dedicated cycle paths (solid green), shared streets with cycle access (green dotted lines) and secure cycle parking (orange dots).
52
5.3.3 Identifying funding sources for street maintenance
The last session for Group 2 dealt with street maintenance and management. Participants discussed potential mechanisms to ensure that there are sustainable, long-term sources of funding for on-going street maintenance. One source of funding that also strategically aligns with TOD requirements is on-street parking. The group agreed on introducing fees for on-street parking in the entire TOD zone. While two-wheeler and four-wheeler parking should be charged, participants felt that PCMC should provide free parking for cyclists as a way to encourage the use of this sustainable mode. Moreover, the group decided that at least a quarter of the funds generated through parking fees should go to cycle infrastructure. In terms of operating this system, the group felt that it is best to form a partnership with a private operator and pay them a fixed fee for their services for collection and enforcement of on-street parking fees. This is a good practice and is in stark contrast to the common but poor practice of private operator paying a fixed fee to government, as a license fee, for the right to collect parking fee from users.
Another source of income that was considered by the group was street advertising. It was mentioned that the city currently gives permits to private advertisers and charges a fee. Given the higher density levels and economic activity that could potentially occur in TOD areas, the group felt it would be prudent to increase permit fees appropriately, while also identifying specific advertising locations near BRT stations that would be used solely by PCMC for its own public outreach campaigns. It is important to consider the market absorption capacity for advertising at the city level as well as the TOD areas, and limit overall quantity of advertising to generate higher rates in the TOD zones. The funds generated in the TOD areas should be used specifically for street projects in these areas.
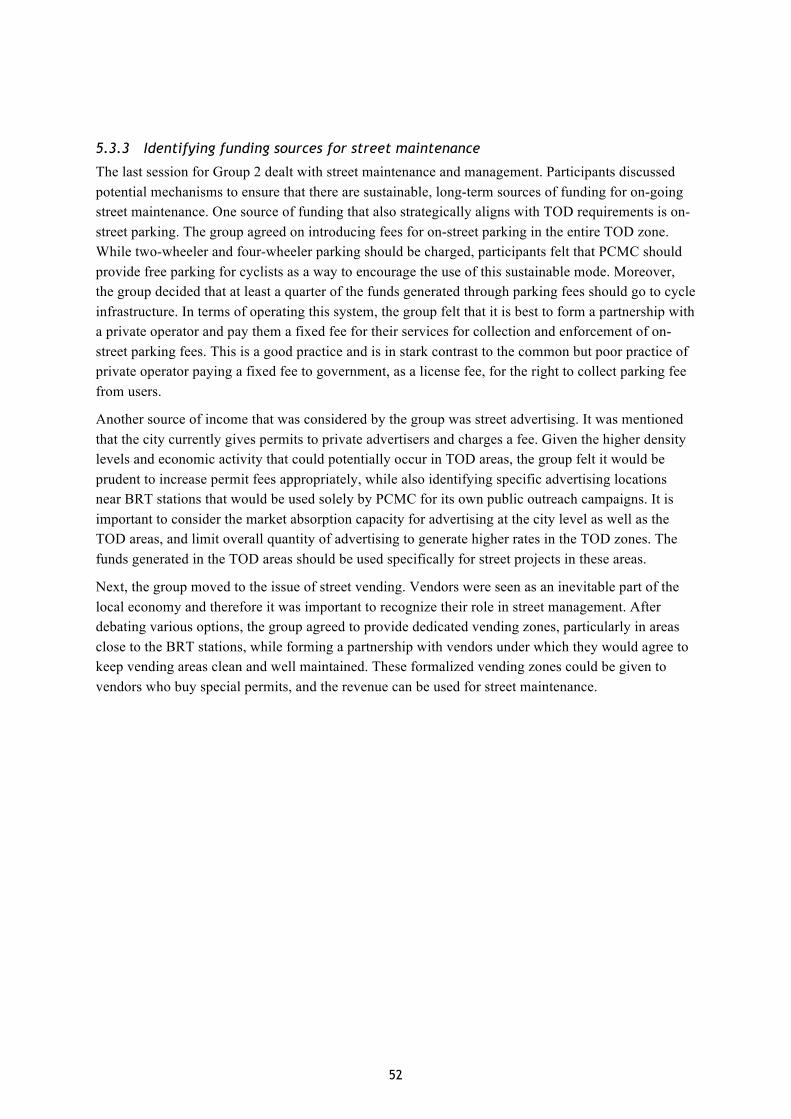
Next, the group moved to the issue of street vending. Vendors were seen as an inevitable part of the local economy and therefore it was important to recognize their role in street management. After debating various options, the group agreed to provide dedicated vending zones, particularly in areas close to the BRT stations, while forming a partnership with vendors under which they would agree to keep vending areas clean and well maintained. These formalized vending zones could be given to vendors who buy special permits, and the revenue can be used for street maintenance.
53
Figure 56. Proposed vending zones (pink dots) and toilets (white dots).
A final source of funding for streets in TOD zones could be the density premiums charged in these areas. The group felt that a portion of the funds should pay for the creation and maintenance of the public realm in these areas. In order to make these density premiums more enticing, it was suggested that the TOD zone’s depth could be increased, increasing places where density can be bought and hence increasing total premium income, while reducing the premium rates per unit floor area to increase demand. These funds that are collected under the Urban Transport Fund (UTF) could be specifically used for public realm improvements.
Beyond finding sources of funding, it was agreed that the municipal government cannot singlehandedly deliver on all the community’s needs. Local branding, seasonal beautification, festivals, and other street related activities that can add life and vitality to the public realm require the cooperation of shop owners, residents, and local NGOs. So far, PCMC has not engaged these groups as partners in maintaining streets and even street enforcement. Thus, as a first step, a public awareness and outreach campaign can be conducted to both engage the community and mobilize local shop owners and residents to take ownership of their streets and engage in active maintenance and programming of their area. In the long run, the city can encourage the formation of residents groups and local area shopping associations to build constructive partnerships with the community.
5.4 Group 3. Built form and its impact on the public realm
This group focused on the nature of developments in the private domain and how they can be shaped to create a safe, inclusive and accessible urban environment. Also in response to group two’s requirements of additional streets and pathways for walking and cycling, this group was tasked with the challenge of finding viable means of turning portions of the private lands into the public domain, while also compensating land owners accordingly. The broad topic areas discussed under this group, along with the recommendations are outlined below.

54
5.4.1 Identifying TOD zone extents and appropriate built-form typologies for high density, mixed use, public transport supportive buildings
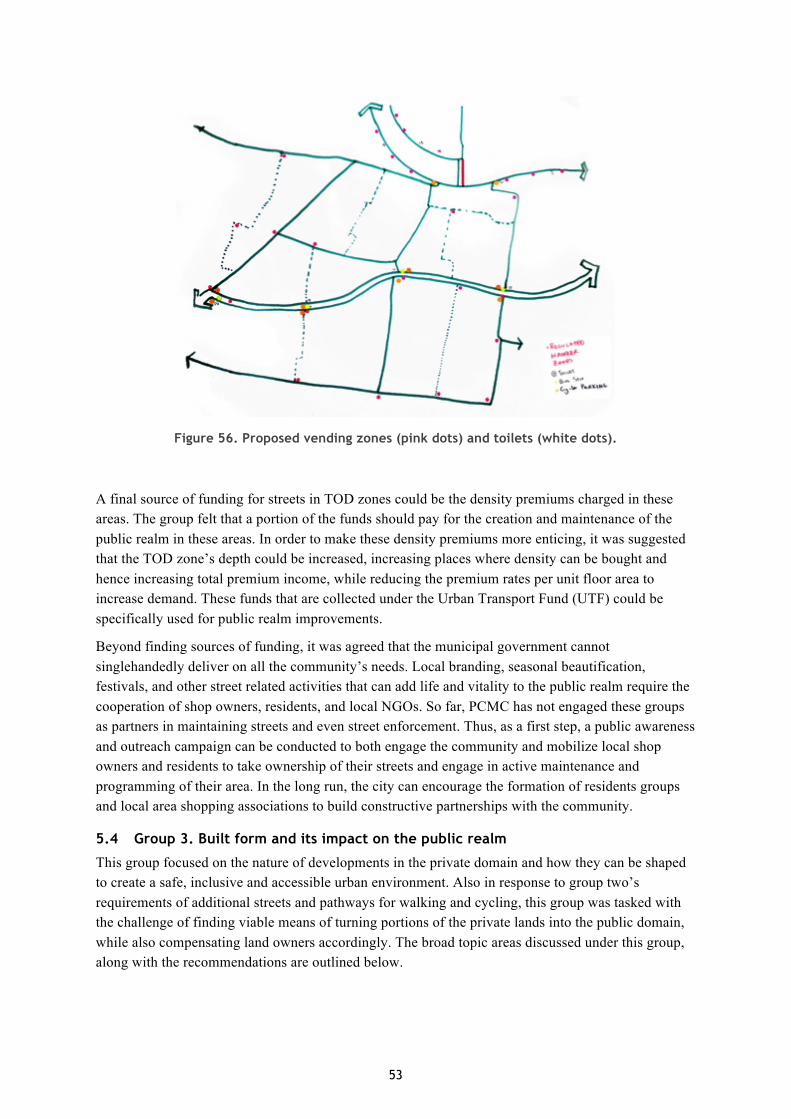
In the first session for this group, the discussion was focused on the extent of the TOD zones around the BRT corridors, and the practical issues pertaining to the delineation of boundaries for the planning and infrastructure provisions of these areas. With the goal of improving access to station areas through walking and cycling, general consensus was reached to set a band of 400 m on both sides of the corridor as the TOD focus area, with uniform FSI levels within this band. The actual boundaries of this band are to include all properties/ plots falling either wholly or partially within the conceptual 400 m buffer, something that would require further investigation by PCMC. Another option considered for boundary delineation was to take a significant physical feature (such as a main road or water body, etc) close to the imaginary 400 m line, as the boundary. A practical as well as clearly and transparently stated principle for delineation is to be decided by PCMC. In terms of the FSI levels allowable in the TOD zones, versus the rest of the city, the group reached consensus on the following (Figure 57):
• Base FSI of 1 at the city level, as of right. • FSI of 4 for areas falling under the influence of high capacity mass transit systems such as
BRT (this includes base FSI of 1 plus additional FSI of 1 allowed through TDRs along with premium FSI of 2 that could be purchased for development).
Figure 57. FSI distribution.
Figure 58. FSI Categories.

55
To accommodate lower income groups and allocate land for other public spaces while creating higher densities to achieve the said FSI, the group discussed the linkages between FSI, plot coverage, parking regulations and dwelling unit sizes and the means of regulating these aspects of development (Figure 59). For those plots directly abutting the BRT corridor, it was agreed to provide higher plot coverage, subject to a maximum of 50 per cent of plot area, with an FSI of 4.
Figure 59. Elements of the built form.
Providing greater coverage for plots abutting the BRT corridor and lesser coverage for outlying plots, can create enclosures of varying scales within the same FSI band. IT also allows for multiple types of built form typologies.
5.4.2 Developing a transit-oriented parking policy In order to promote the use of sustainable transport modes, the group considered ways to priorities access for pedestrians, cyclists, and public transport users within the station areas. General consensus was reached on the need to reduce personal motor vehicle parking within the 400 m influence zone on either side of the BRT corridor, while mandating free cycle parking at BRT stations. Groups also proposed running low-cost feeder services and reducing off-street parking requirements within the TOD area. For motor vehicle users, it was agreed to allow privately built, financed and operated parking structures at the periphery of the TOD zone (Figure 60). These would be built in response to user demand. These could also have cycle sharing facilities that enable easy transfer to BRT stations.
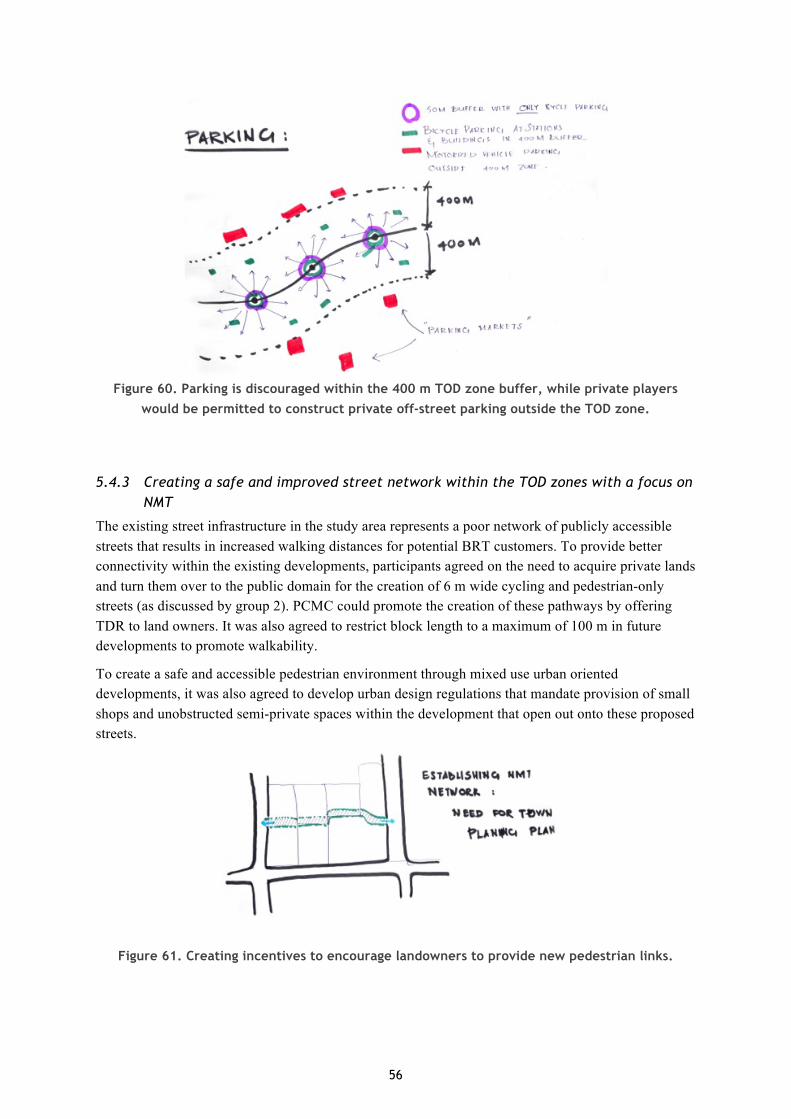
56
Figure 60. Parking is discouraged within the 400 m TOD zone buffer, while private players
would be permitted to construct private off-street parking outside the TOD zone.
5.4.3 Creating a safe and improved street network within the TOD zones with a focus on NMT
The existing street infrastructure in the study area represents a poor network of publicly accessible streets that results in increased walking distances for potential BRT customers. To provide better connectivity within the existing developments, participants agreed on the need to acquire private lands and turn them over to the public domain for the creation of 6 m wide cycling and pedestrian-only streets (as discussed by group 2). PCMC could promote the creation of these pathways by offering TDR to land owners. It was also agreed to restrict block length to a maximum of 100 m in future developments to promote walkability. To create a safe and accessible pedestrian environment through mixed use urban oriented developments, it was also agreed to develop urban design regulations that mandate provision of small shops and unobstructed semi-private spaces within the development that open out onto these proposed streets.
Figure 61. Creating incentives to encourage landowners to provide new pedestrian links.

57
5.4.4 Developing robust institutional mechanisms to enable TOD All of the topics discussed above require strong financial as well as legislative backing to turn them into reality. Participants therefore discussed regulatory and pricing mechanisms that could act as sources of revenue for infrastructure projects within the TOD zone. With the Development Plan for the region already in place, it was proposed to create a “TOD Plan and Regulations” that would serve as the roadmap to regulate future developments pending building approval. The TOD Plan would show the desired layout of the TOD Zone with the network of streets, footpaths, greenways, bicycle paths, etc. It would also include the urban design regulations, specifying block sizes, building footprints, height & bulk of buildings, building edges on the street front, on-street and off-street parking regulations, etc. Building approvals in TOD Zones would require compliance with these regulations.
Regarding the provision of a better street network in the area, the group proposed the use of Bombay Provincial Municipal Corporations (BPMC) Act, Clauses 210 and 213, which govern the acquisition of private lands for public use. This is to circumvent the need to revise the Development Plan while still achieving the objective of improving the circulation grid in the TOD area. The possibility of using Town Planning Scheme as a mechanism for planning and implementing the TOD area development strategy was discussed, but the participants felt that it would be impractical. It was felt that the use of the BPMC Act provisions along with TDR for compensation would be better.
(The BPMC Act, 1949, was enacted with a view to establish Municipal Corporations in the province of Bombay to enable better municipal governance. Among others, this Act empowers the Commissioner to restrict use of public streets for certain kinds of traffic, to acquire premise for improvement of public streets, prescribe street lines, and acquire open lands within the regular line of street. The Commissioner is also empowered to enter into agreement with any person for the making of a public street through the land of such person, either entirely at the expense of such person or partly at the expense of such person and partly at the expense of the Corporation. On completion, this road would remain with the Corporation.)
The importance of value gain-based pricing mechanisms for TDR was also discussed. The participants felt that the premium to be paid for TDR should be based on the difference in land value between the destination zone and the origin zone as recorded in the Ready Reckoner. This will make the rates reasonable in relation to the potential profits of the developer and thus enable off-take of the available TDR.
The group also discussed the means of routing revenue from the sale of development rights in the TOD zone for infrastructure spending. The group proposed to set up a separate TOD Fund under the care of a special purpose vehicle (to be set up under the Companies Act) that would earn revenue from the TOD areas and channel it to a dedicated escrow account that would only fund projects within the TOD area. It was also proposed to task the SPV with conducting quality control of the projects undertaken in these areas.
58
6. Action plan The TOD workshop resulted in considerable consensus around a wide range of policy strategies and immediate actions. While some nuances remain to be worked out, there is broad agreement on a vision of vibrant, walkable communities supported by public transport. Intensification of residential and commercial uses along the public transport corridors will help ensure that the majority of the new residents in Pimpri Chinchwad can live within walking distance of mass rapid transit station. This, when compounded with the creation of dense and safe network of streets and paths, will ensure that residents will be able to satisfy most of their daily needs through walking, cycling, and public transport. Strategically placed stations within a five-minute walk of most residents in the TOD areas would also serve to improve mobility and enable creation of station areas that are urban hubs, enriched by concentration of cultural and economic activities.
In order to make this future possible, it is suggested that TOD areas need to be carefully delineated and re-zoned with higher permissible floor space indexes, lower parking requirements and a good mix of uses. Area specific detailed development plans and accompanying urban design guidelines will spell out further detail about how the street network and private realm will take shape. TOD areas will be the predominant recipients of transfer of development rights (TDR) generated elsewhere in the city. In addition, purchasable density premiums can fund the infrastructure and public realm projects necessary for supporting increased density levels. A balance of housing units and job spaces can be achieved through specific FSI allocations in order to encourage mixed-use communities. Furthermore, income diversity can be achieved by accommodating low-income populations in new developments, while also maintaining the existing housing stock on smaller lots through incentives and minimum requirements for developers.
Creation of unified street design standards, combined with better street management practices and maintenance can benefit residents of the private developments as well as all other users of the public realm. Design guidelines and development control regulations should be developed to encourage private buildings to face the city’s public realm (rather putting their backs against it), thereby, contributing to the public life of the streets and greater public safety.
These recommendations are a synthesis of the group discussions and can serve as an action plan for the formulation of TOD policies. Furthermore, these discussion points can be used to engage other stakeholders, such as residents, developers, landowners, NGOs, and the political representatives to further develop a successful TOD strategy.
6.1 Delineation of TOD zones
The first step in TOD planning is to delineate appropriate boundaries for application of TOD related policies and actions, including density, land use, and other development control regulations. In PCMC, the following zones are suggested:
• BRT: Primary TOD zone in the form of a 200 m continuous band on either side of the corridor and secondary TOD zone extending 300 m beyond the primary TOD zone.
• Metro: Primary TOD zone in the form of a 200 m continuous band on either side of the corridor and secondary TOD zone extending 300 m beyond the primary TOD zone.
• Properties that do not fully fall within a TOD zone could avail of that zone’s policies if at least 50 per cent of the plot area is within the zone.

59
6.2 Intensification of residential and commercial uses in TOD zones
The population of PCMC is expected to grow by 7.4 lakh through 2021. Participants agreed that development regulations should allow for the construction of enough residential and employment space in the TOD zones to absorb most of this new growth. At the same time, land use policies should discourage urban expansion and dispersion in the periphery by keeping as-of-right FSI requirements low in remaining areas of the city. To achieve these aims, the following policies are proposed:
1. FSI/Bulk • For BRT zones, the city should implement a graduated FSI policy for the following
zones: o The primary TOD zone should have an FSI of 5 o The secondary TOD zone should have an FSI of 3
• For metro corridors, the city should implement a graduated FSI policy for the following zones:
o The primary TOD zone should have an FSI of 5 o The secondary TOD zones should have an FSI of 3.
• Along BRT corridors, there should not be any limit on plot coverage (subject to other requirements such as setback for ventilation etc).
• Maximum FSI in TOD Zones to be achieved as follows: o Base as-of-right FSI of 1.0 o Additional FSI of 0.4 through TDR from reservation lands across the entire city
to the site free of cost. Additional FSI of 0.6 through TDR for private plots at a price of 30% of the difference in land value between the destination zone and the origin zone as recorded in the Ready Reckoner.
o The remaining FSI could be purchased. • Premium FSI should be priced at 0.3 times the Ready Reckoner Rate for the area or the
lowest Ready Reckoner rate of any area in the city, whichever is higher. • TOD areas should be made as the default destination for all TDRs generated within
PCMC. • All other areas in the city should have a maximum FSI of 1.
2. Mixed Use • 10% of the permissible FSI in TOD areas should be reserved for commercial purposes. • DCRs should be readjusted and clarified regarding the various uses permitted in
residential zones including ITES, call centres, home offices, convenience stores etc. with the aim of creating a balance of jobs and housing.
• Ground level (or property front) FSI for commercial uses should be encouraged, while allowing for office and residential use in the rest of the units.
While general population and job numbers can be allocated to TOD areas with a broad city level policy, more detailed level land use regulation and density control is required in TOD areas to achieve these numbers.
6.3 Provision of affordable housing in TOD zones
Establishing a diverse community around station areas is important both in terms of equity and as a way to provide public transport access to demographic groups that are likely to use it. In order to encourage diversity at the same time that TOD zones densify, policies should explicitly encourage
60
low income and affordable housing in the area. The most practical mechanism for encouraging the provision of affordable housing is to set guidelines for allowed unit sizes in the TOD zones. The following recommendations emerged from the workshop deliberations:
• In primary TOD zones, at least 30 per cent of built up space utilized for residential use shall be for dwelling units of floor area less than or equal to 45 sq m.
• Premium for FSI utilized for dwelling units smaller than 45sqm shall be 30% of the normal applicable premium. No premium shall be charged for units smaller than 30sqm. The smaller units may be separated out as an independent building.
6.4 Creation of a dense network of streets
Successful TOD provides convenient pedestrian and cycle access to mass rapid transit stations. At present, the large block sizes in many areas of PCMC force pedestrians and cyclists to take circuitous routes, thereby discouraging the use of these modes. Participants suggested the following next steps to create a denser network of streets and paths:
• DDPs should be undertaken for all station areas along the BRT and metro corridors in PCMC. New pedestrian and cycle connections should be notified in the DDP maps. Each DDP should aim to reduce block perimeters for the pedestrian/cycle network to no more than 400 m and no one side exceeding 150m.
• The DCR should be amended to indicate a mechanism for compensating landowners for land taken for pedestrian streets.
• To supplement the street network, a high quality greenway for pedestrians and cyclists should be implemented along rivers and waterways in PCMC.
6.5 Development of complete streets with high quality walking and cycling facilities
To ensure consistent implementation of high quality footpaths and cycle tracks, the following steps should be pursued:
• PCMC already has initiated the process of developing a Non-Motorised Transport Policy to guide the implementation of complete streets throughout the PCMC area. The policy will help set design standards and minimum dimensions for street elements such as footpaths, pedestrian crossings, bus stops, and cycle tracks.
• To supplement the Non-Motorised Transport Policy, PCMC should develop a street development manual that specifies materials and construction techniques. The manual can help ensure uniform, high quality implementation across multiple projects and contractors.
• A street design cell should be established, distinct from the roads department or zonal offices whose primary job is to construct, in order to empower a dedicated group of town planners and engineers to oversee the design, implementation and maintenance of streets.
6.6 On-going management of street space
Once higher quality pedestrian and cycling facilities are created, proactive management of street space is essential to ensure that these facilities continue to remain available for their intended purpose. The following street management steps should be initiated:
• Parking management. Parking and no-parking areas should be delineated clearly through street design. Within designated on-street parking areas, pricing mechanisms should be used
61
to manage demand. Effective enforcement is necessary to ensure that pedestrian and cycle facilities are not encroached by parked vehicles. (For more discussion on parking, see the next section.)
• Advertising. Permit fees for prominent advertising boards in TOD areas should be increased. Some advertising locations near BRT stations can be set aside for public outreach. PCMC can study market absorption capacity for advertising at the city level as well as TOD areas, and accordingly limit total advertising in the city to increase demand for the TOD area advertising.
• Street vending. Formal vending zones should be introduced near BRT stations and along the proposed greenway. A permit system should be developed to regulate vending locations and to enforce cleanliness standards.
• Public toilets. PCMC should install dedicated female and male toilets close to the BRT/Metro station areas as well as other major streets. The toilets can be maintained on a PPP basis.
• Programming and oversight. PCMC should conduct public outreach with local businesses, residents and NGOs in each distinct TOD neighbourhood to form active partners for street management and maintenance. Public events can recognise individuals and organizations that are TOD champions.
• Revenue management. Revenue generated through street management activities should be deposited in the UTF and could be used to support sustainable transport initiatives in PCMC.
6.7 Parking management in TOD zones
Parking management is an important travel demand management mechanism in TOD zones. The following principles should guide the pricing of on-street parking:
• Four-wheelers should be charged 5 times the rate for two-wheelers, reflecting the amount of street space they occupy.
• The parking fee should be adjusted based on demand. Higher demand should result in higher price to discourage the marginal users from using personal motor vehicles.
• Parking fees can vary by time of day and location to reflect local demand levels.
• Cycle parking should be free. Secure, covered cycle parking should be provided on both sides of all BRT stations.
Off-street parking requirements should be updated to reflect the reduced need for off-street parking in TOD zones. The DCRs should be revised as per the following standards:
• In primary TOD zones, the maximum allowed parking area should be set as follows:
o Equivalent of 10 per cent of the building’s floor area for commercial developments
o 10 per cent for residential units of 45 sq m or smaller
o 15 per cent for residential units over 45 sq m
• In secondary TOD zones, the maximum allowed parking area should be set as follows:
o Equivalent of 10 per cent of the building’s floor area for commercial developments
62
o 10 per cent for residential units of 45 sq m or smaller
o 20 per cent for residential units over 45 sq m
• In both TOD zones, a minimum parking area equivalent to 5 per cent of the building floor area should be provided for cycles and vehicles used by the disabled.
• PCMC should define parking management zones to guide the provision of off-street parking. The maximum off-street parking supply in each zone should be determined based on the carrying capacity of the mixed traffic lanes of critical links in the zone. Once the zone has reached this parking supply limit, developers will need to decommission an equivalent parking area in order to create new off-street parking under the provisions mentioned above.
• Off-street parking outside TOD zones may be provided by the private sector, subject to the zonal caps described above. However, PCMC should not fund or subsidise such initiatives.
PCMC should consider providing low-cost feeder services around neighbourhoods and/or a cycle sharing system to provide alternatives to the use of personal motor vehicles.
6.8 Urban design reforms
Private developments make an important contribution to the overall quality of public space in TODs. Provision in the DCRs can help create a lively, safe and comfortable area for their own residents as well as people on the public streets. The following DCR revisions are suggested:
• Minimum build-to lines should be adopted to ensure that private buildings provide “eyes on the street.” The front set back shall be no more than 3m up to a height of 10m for at least 50% of the parcel street edge.
• For residential buildings, compound walls must be transparent above a height of 300 mm. For commercial building, the front set back should not be separated from the street with a compound wall.
• For parcels with frontage on more than one street, the main vehicle access should be provided from a side street, off of the main market street.
• There should be no stilt parking facing the street edge. • The need and extent of side and rear setbacks should be reviewed based on requirements such
as light, ventilation and safety.

63
7. Appendix: Workshop participants
Table 6. List of PCMC TOD Workshop participants.
Name Department Organisation
Gro
up I
Mr. Anil Suryawanshi PCNTDA PCMC
Mr. Ayyubkhan Pathan Engineer PCMC
Mr. Farroq Shaikh BRT Cell PCMC
Mr. Ganesh Chillal Town Planning PCMC
Mr. Rajan Patil BRT Cell PCMC
Mr. Ravindra Suryavanshi BRT Cell PCMC
Mr. Sameer Palparli JNNURM CELL CRISIL
Mr. Sanjay Kulkarni Environment PCMC
Mr. Shirish Poredi BRT Cell PCMC
Mr. Shrikant Biradar - -
Mr. Uday Kulkarni Architect Private firm
Mr. Waghmare Town Planning PCMC
Mr.Ravindra Dudhekar Roads & Buildings PCMC
Smt. Pratibha Bhadhane Town Planning PCMC
Gro
up II
Mr. Bhojane Town Planning PCMC
Mr. B.K.Gaikwad Traffic Cell PCMC
Mr. Dilip Gawade Community Development PCMC
Mr. Makrand Nikam Roads & Buildings PCMC
Mr. P.B.Shimpi Town Planning PCMC
Mr. Prabhakar Vasaikar PCNTDA PCMC
Mr. Pramod Bhosale BRT Cell PCMC
Mr. Pramod Ombhase PCNTDA PCMC
Mr. Sanjay Baglane Building Permission PCMC
Mr. Sanjay Bhosale BRT Cell PCMC
Mr. Shivaji Chaure Town Planning PCMC
Mr. Shrikant Savane BRT Cell PCMC
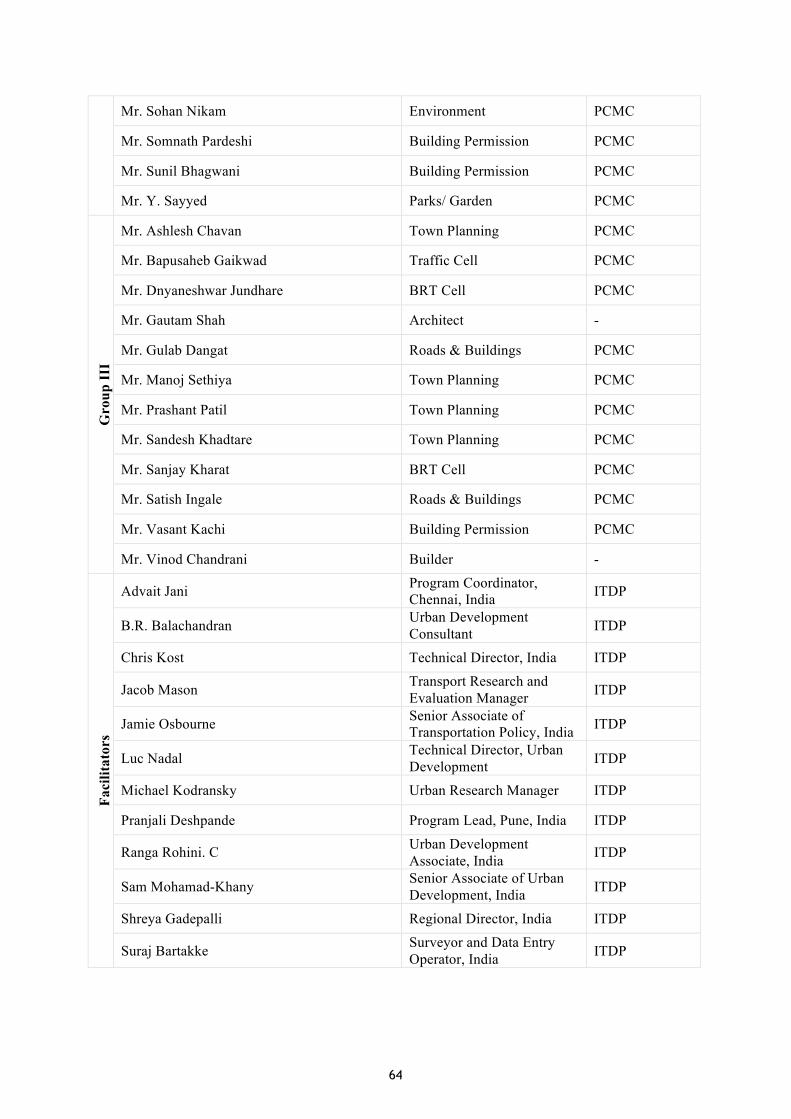
64
Mr. Sohan Nikam Environment PCMC
Mr. Somnath Pardeshi Building Permission PCMC
Mr. Sunil Bhagwani Building Permission PCMC
Mr. Y. Sayyed Parks/ Garden PCMC
Gro
up II
I
Mr. Ashlesh Chavan Town Planning PCMC
Mr. Bapusaheb Gaikwad Traffic Cell PCMC
Mr. Dnyaneshwar Jundhare BRT Cell PCMC
Mr. Gautam Shah Architect -
Mr. Gulab Dangat Roads & Buildings PCMC
Mr. Manoj Sethiya Town Planning PCMC
Mr. Prashant Patil Town Planning PCMC
Mr. Sandesh Khadtare Town Planning PCMC
Mr. Sanjay Kharat BRT Cell PCMC
Mr. Satish Ingale Roads & Buildings PCMC
Mr. Vasant Kachi Building Permission PCMC
Mr. Vinod Chandrani Builder -
Faci
litat
ors
Advait Jani Program Coordinator, Chennai, India ITDP
B.R. Balachandran Urban Development Consultant ITDP
Chris Kost Technical Director, India ITDP
Jacob Mason Transport Research and Evaluation Manager ITDP
Jamie Osbourne Senior Associate of Transportation Policy, India ITDP
Luc Nadal Technical Director, Urban Development ITDP
Michael Kodransky Urban Research Manager ITDP
Pranjali Deshpande Program Lead, Pune, India ITDP
Ranga Rohini. C Urban Development Associate, India ITDP
Sam Mohamad-Khany Senior Associate of Urban Development, India ITDP
Shreya Gadepalli Regional Director, India ITDP
Suraj Bartakke Surveyor and Data Entry Operator, India ITDP