Wireline Workshop
10
1 Issue 19 – September 2016 W W I I R R E E L L I I N N E E W W O O R R K K S S H H O O P P A BIMONTHLY BULLETIN FOR WIRELINE LOGGERS AND GEOSCIENTISTS ENGAGED IN MINING AND MINERAL EXPLORATION Borehole images The induction tool Log versus lab density Three-year anniversary edition 1. Overview - developments in borehole imaging technology In recent years, the advent of borehole imagery and the ability of computers to manage and process the much larger data sets involved, have revolutionised the mineral wireline logging industry. A continuous, orientated, high resolution representation of the borehole wall offers many advantages to the geologist. The data provide knowledge about geology, structure, fractures and stress orientation. Most of this knowledge might be gained by analysis of orientated drill-core but that option has proved to be time consuming, imprecise and costly. In this age of information technology, objective and precise data, captured in-situ, is transferred directly from borehole to computer where it can be stored, processed, analysed and disseminated, literally at the touch of a button. This is good for density, gamma ray and resistivity measurements. It is fantastic for borehole imagery, which uses all the functionality and capacity of a modern computer. It brings the formation to the geologist's desk. He loves his rocks, and has always been a little suspicious of those wiggly lines, but he has embraced the use of image data as a source of important and sometimes critical information. A Tadpole Plot Most logging technology, in both mineral and oilfield exploration, targets sedimentary formations and there has always been a need to measure dip and direction of strata. Twenty years ago, the resistivity Dipmeter was the answer...the correlation of three or four high resolution resistance logs whose depth and position on the borehole wall was known. The result was a tadpole plot, a braille-like representation of bedding dip orientation. In mineral logging, the advent of borehole televiewers has made dipmeter logging a rare and specialised event but the tadpole plot, as a means of displaying derived structures, has endured.
-
Upload
khangminh22 -
Category
Documents
-
view
4 -
download
0
Transcript of Wireline Workshop

1
Issue 19 – September 2016
WWIIRREELLIINNEE WWOORRKKSSHHOOPP A BIMONTHLY BULLETIN FOR WIRELINE LOGGERS AND GEOSCIENTISTS ENGAGED IN MINING AND MINERAL EXPLORATION
Borehole images
The induction tool
Log versus lab density
Three-year anniversary edition
1. OOvveerrvviieeww -- ddeevveellooppmmeennttss
iinn bboorreehhoollee iimmaaggiinngg
tteecchhnnoollooggyy
In recent years, the advent of borehole imagery and the ability of computers to manage and process the much larger data sets involved, have revolutionised the mineral wireline logging industry.
A continuous, orientated, high resolution representation of the borehole wall offers many advantages to the geologist. The data provide knowledge about geology, structure, fractures and stress orientation. Most of this knowledge might be gained by analysis of orientated drill-core but that option has proved to be time consuming, imprecise and costly.
In this age of information technology, objective and precise data, captured in-situ, is transferred directly from borehole to computer where it can be stored, processed, analysed and disseminated, literally at the touch of a button. This is good for density, gamma ray and resistivity measurements. It is fantastic for borehole imagery, which uses all the functionality and capacity of a modern computer. It brings the formation to the geologist's desk. He loves his rocks, and has always been a little suspicious of those wiggly lines, but he has embraced the use of image data as a source of important and sometimes critical information.
A Tadpole Plot
Most logging technology, in both mineral and oilfield exploration, targets sedimentary formations and there has always been a need to measure dip and direction of strata.
Twenty years ago, the resistivity Dipmeter was the answer...the correlation of three or four high resolution resistance logs whose depth and position on the borehole wall was known. The result was a tadpole plot, a braille-like representation of bedding dip orientation. In mineral logging, the advent of borehole televiewers has made dipmeter logging a rare and specialised event but the tadpole plot, as a means of displaying derived structures, has endured.

2
The Acoustic Televiewer logs the borehole wall in terms of hardness, measuring the amplitude of a high frequency reflected sonic pulse at very high resolution. It describes the borehole skin rather than the formation beyond. Hard rocks reflect high amplitude signals and soft rocks and fractures reflect low ones. The individual measurements of reflected amplitude are made continuously (send-receive cycles last a few hundred microseconds) by a rotating transducer or, more often in slim tools, a rotating sonic mirror aligned with a stationary transducer. The result is a map of the borehole wall with an individual resolution of about 2 millimetres in ideal conditions.
An acoustic televiewer log
The images on the right show what the log looks like. The borehole wall is unwrapped with the left edge of the resulting image aligned with magnetic north. Fractures and bedding planes appear as sinusoidal lines where the deepest point on the line is the direction of dip.
Reflection travel times (left image) for each cycle are measured and mapped in the same way as the reflected amplitudes (right image), resulting in a complete description of borehole cross-section. Tool centralisation is important to ensure similar travel time and signal strength in all directions. Resolution is reduced in large boreholes and/or drilling mud where signal dispersal is a problem.
Because the acoustic televiewer is sensitive to rock hardness and can measure fracture orientations and apertures (lost in drill-core), it has become an important geotechnical tool in both sedimentary and hard-rock environments.
A limitation of acoustic tools is that they only function in fluid-filled holes. If the geologist requires data from dry boreholes, the Optical Televiewer should be employed. It measures the colour and shade of reflected light. The borehole wall is lit by a ring of light emitting diodes (LEDs) on the tool and reflections are directed to a light-sensitive sensor via a conical mirror. Resolution is very high, with pixel sizes down to well below 1 millimetre at HQ borehole diameter..
The optical televiewer provides an orientated photograph of the borehole wall at high resolution and without perspective...like virtual drill-core. It is an excellent geological tool. The system does not offer a travel time image and log quality is dependent on clean borehole fluid if it is run below the water table. In slim holes, optical televiewer images can be of such high quality and value that it is usually worth cleaning the borehole wall and replacing dirty fluid before logging.
File size is very large by mineral logging standards which often makes data transmission over the internet problematic.
An optical televiewer image
It is sometimes difficult to decide whether to run an acoustic or an optical image. They offer slightly different information where the acoustic tool is an excellent descriptor of rock condition whereas the optical version provides more geological detail. It is not unusual to run both tools in order to maximise knowledge gained.

3
The humble dipmeter is now little used in mineral exploration but its descendent, the formation micro-scanner, has recently become available as a slim-hole tool (HQ or larger) for mapping borehole walls in terms of electrical resistance.
There are usually four caliper arms supporting micro-resistivity sensors arrayed across a focussing electrode. Where the dipmeter has just one sensor per arm, the micro-scanner has several. An image, orientated with left edge aligned with magnetic north, is created from multiple continuous measurements of formation resistance.
Complete lateral wall coverage is never achieved because, as the calipers open, the pads separate. That is not a major problem unless the sought after anomaly is aligned with the borehole axis.
Resistivity-based logging tools like the micro-scanner will only work below the water table. It is a much
larger tool than the televiewers. However, the scanner offers some significant advantages. It can produce good images in large diameter boreholes or holes that are filled with drilling mud. This is because its sensors are pressed against the borehole wall rather than being held in the centre of the bore.
The effect of the focussing electrode is to measure resistance within the formation rather than on the borehole skin, so the log suffers less from coarse borehole surfaces, rugosity and mud-cake, although poor pad contact in caved zones will damage the image, especially in saline fluids. Wherever large diameter boreholes are drilled, and in the mineral context this might apply to coalbed methane production wells for instance, the micro-scanner will have an advantage...especially in drilling mud.
A micro-scanner log (Robertson Geologging)
Data processing of all three image types, acoustic, optical and electrical, is normally performed in the same way. An empty structure log is placed over the image and populated by manually-picked orientations... sinusoids are fitted over selected events using a mouse. After picking and classifying (fracture, fault sedimentary bed, vein etc) is completed, the structure log is orientated with respect to horizontal and true north and displayed as a tadpole plot.
Micro-scanner resistance curves may be processed automatically to produce a traditional dipmeter log.
Each imaging tool has its advantages and disadvantages. The advent of the micro-scanner as a slim-hole logging tool has equipped the explorer with a comprehensive range of options, so that an image can be logged in any type of borehole. Borehole conditions play a big part in image quality and that is where the driller should be involved. It is important that the borehole be prepared to offer the best conditions for the selected methodology. That might mean, where possible, flushing and cleaning for the optical televiewer. In all cases, fresh water within smooth borehole walls works best.
From an article in GeoDrilling magazine (2014) sponsored by Robertson Geologging

4
22.. MMeeaassuurreemmeenntt FFooccuuss
A review of one wireline log measurement
The Inductive Conductivity (induction) Sonde
In issue 1 of this bulletin (September2013) we discussed the early days of wireline logging and the 1927 capture of a log of formation resistance in an oil well drilled at Péchelbronn in eastern France. Leader of the three-man team on site was Henri-Georges Doll, son-in-law of his mentor and employer Conrad Schlumberger. Having recorded one-metre spaced point measurements of electrical resistance between downhole and surface electrodes and joining up the dots with a pencil, Doll had created a borehole log and become the first wireline logging engineer.
That is not the end of the story, as far as Doll is concerned. Our hero went on to enjoy a forty year career in the research and development of wireline technology at Schlumberger, in the process filing more than seventy patents, improving the resistivity log measurement, discovering the SP effect and inventing, among things, the first dipmeter tool.
During the Second World War, Henri Doll developed an electro-magnetic mine detector that could be deployed on a jeep or similar vehicle. His pioneering work earned him a Certificate of Appreciation from the United States Government.
Despite this simoon of ideas and inventions, Doll concentrated throughout his career on the electrical measurements rather than radiation or sonic techniques. His experience in mine detection was put to good use after the war when he was confronted by the need to log formation resistance in non-conductive oil-based drilling mud. The standard electrical resistance systems would not bridge this non-conductive barrier within the borehole column and resistivity is a critical measurement for the oil logger.
---------------------------- Oil-based drilling mud is not normally used in mineral logging although it has applications in some potash boreholes where saltwater-based drilling fluid does not limit dissolution of bischofite-rich layers adequately.
Oil-based mud is commonly employed in oilfield exploration, where greater depth, pressure, heat and fluid salinity cause degradation of water-based muds as well as corrosion of equipment. It is difficult to work with and control without the right knowhow and equipment. There are safety and environmental issues when everything and everybody gets covered in it. ---------------------------
In 1947 Doll invented the electro-magnetic inductive conductivity measurement...the induction log. The system relies on induced rather than injected electric currents within conductive (saturated sedimentary) rock formations, so there are no electrodes on the sonde and borehole fluid properties do not normally play a part.
The system is graphically represented on the right.
5
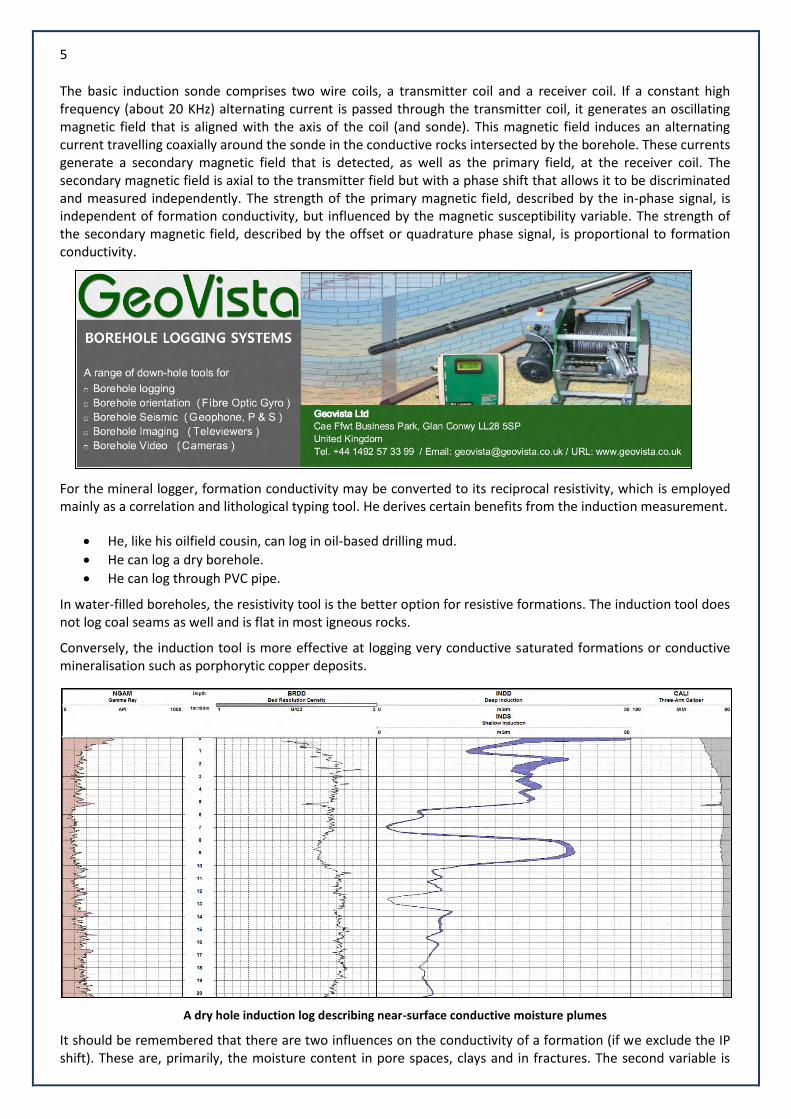
The basic induction sonde comprises two wire coils, a transmitter coil and a receiver coil. If a constant high frequency (about 20 KHz) alternating current is passed through the transmitter coil, it generates an oscillating magnetic field that is aligned with the axis of the coil (and sonde). This magnetic field induces an alternating current travelling coaxially around the sonde in the conductive rocks intersected by the borehole. These currents generate a secondary magnetic field that is detected, as well as the primary field, at the receiver coil. The secondary magnetic field is axial to the transmitter field but with a phase shift that allows it to be discriminated and measured independently. The strength of the primary magnetic field, described by the in-phase signal, is independent of formation conductivity, but influenced by the magnetic susceptibility variable. The strength of the secondary magnetic field, described by the offset or quadrature phase signal, is proportional to formation conductivity.
For the mineral logger, formation conductivity may be converted to its reciprocal resistivity, which is employed mainly as a correlation and lithological typing tool. He derives certain benefits from the induction measurement.
He, like his oilfield cousin, can log in oil-based drilling mud.
He can log a dry borehole.
He can log through PVC pipe.
In water-filled boreholes, the resistivity tool is the better option for resistive formations. The induction tool does not log coal seams as well and is flat in most igneous rocks.
Conversely, the induction tool is more effective at logging very conductive saturated formations or conductive mineralisation such as porphorytic copper deposits.
A dry hole induction log describing near-surface conductive moisture plumes
It should be remembered that there are two influences on the conductivity of a formation (if we exclude the IP shift). These are, primarily, the moisture content in pore spaces, clays and in fractures. The second variable is

6
the conductive properties of certain metallic minerals (including copper, zinc and magnetite) and graphite. Of course, both conditions can occur at the same site.
As discussed above, the induction log will be flat in hard rocks but will deflect noticeably in zones that include water-filled fractures and/or metallic ore.
A deep copper deposit logged by, from the left, gamma, the clients laboratory assay, IP, density, induction (shaded yellow), differential caliper, magnetic susceptibility and caliper.
The log above is from a metamorphosed sedimentary basin where the target is copper. Vital logs are density, IP and conductivity which, to varying degrees, describe the target. Despite the relatively good grade ore, the density log does not really define the ore, but consider IP and conductivity. Both describe the ore body well, albeit with some small differences.
Also interesting is the mineralisation detected in open fractures, described best by the juxtaposition of caliper and magnetic susceptibility on the right.
The induction sonde will do this in dry holes and through PVC casing. The induction log provides the logger and his client with an important extra option in PVC pipe (used to overcome risky wall conditions in holes of less than 200 metres in depth). His range of measurements that may describe the formation through PVC casing in a wet hole includes:
Natural (total) gamma ray
Spectral (K, U, Th) gamma ray
Inductive conductivity (induction)
Acoustic televiewer (discriminating the second reflection rather than the first)
Full waveform sonic (P and S fronts)
Gamma-gamma density (best in an angled hole and with casing suspended)
Neutron-neutron (used qualitatively due to the effect of chlorine in the PVC)
Magnetic susceptibility

7
That's the majority of the important logs. In fact the only significant measurements that may not be captured in some form in PVC pipe are those based on injected (via electrodes) electric current...resistivity, dipmeter and IP.
We should then consider the dry hole scenario. The sonic devices, FWS and televiewer cannot be logged. The induction sonde will describe conductive ore bodies well, especially in view of the fact that the ground will not normally be saturated with water. Logging soft porous or clay-rich rocks and overburden is less straightforward, especially if water was employed to drill the borehole. What are we measuring? Moisture, yes, but is the ground wet, damp or moist? Is the moisture introduced by the drilling process? Has it been raining? Is the moisture free water in pore spaces or bound in clay lattices? Is the moisture saline? It's a complex business.
A log of gamma, induction and density from a zinc deposit
The dry hole logging suite (no PVC) includes the following measurements.
Natural (total) gamma ray
Spectral (K, U, Th) gamma ray
Inductive conductivity (induction)
Optical televiewer
Gamma-gamma density
Neutron-neutron (used qualitatively)
Magnetic susceptibility
Inductive conductivity completes the range of measurements with only sonic being lost.
The induction log is a log of formation conductivity, no more. It will not differentiate between moisture and ore and it will not differentiate between different conductive ores in the same ore body.
The log at the top of this page describes a non-sulphide zinc deposit. The induction log seems to describe the ore zones rather well. Notice the low density and caving zones coinciding with the zinc ore. These layers are probably saturated making it difficult to determine whether we are measuring conductive ore or moisture or both.
The inductive conductivity log has its limitations but, if these are understood, it will add value to many exploration projects.
8
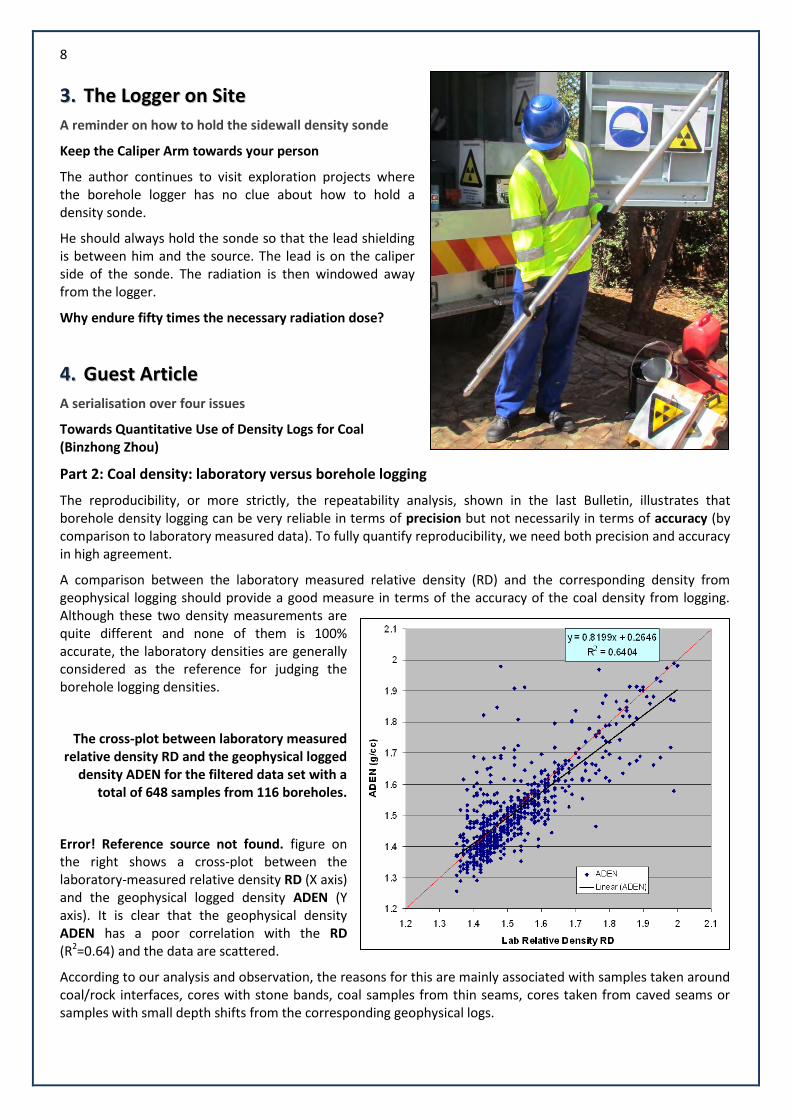
33.. TThhee LLooggggeerr oonn SSiittee
A reminder on how to hold the sidewall density sonde
Keep the Caliper Arm towards your person
The author continues to visit exploration projects where the borehole logger has no clue about how to hold a density sonde.
He should always hold the sonde so that the lead shielding is between him and the source. The lead is on the caliper side of the sonde. The radiation is then windowed away from the logger.
Why endure fifty times the necessary radiation dose?
44.. GGuueesstt AArrttiiccllee
A serialisation over four issues
Towards Quantitative Use of Density Logs for Coal (Binzhong Zhou)
Part 2: Coal density: laboratory versus borehole logging
The reproducibility, or more strictly, the repeatability analysis, shown in the last Bulletin, illustrates that borehole density logging can be very reliable in terms of precision but not necessarily in terms of accuracy (by comparison to laboratory measured data). To fully quantify reproducibility, we need both precision and accuracy in high agreement.
A comparison between the laboratory measured relative density (RD) and the corresponding density from geophysical logging should provide a good measure in terms of the accuracy of the coal density from logging. Although these two density measurements are quite different and none of them is 100% accurate, the laboratory densities are generally considered as the reference for judging the borehole logging densities.
The cross-plot between laboratory measured relative density RD and the geophysical logged
density ADEN for the filtered data set with a total of 648 samples from 116 boreholes.
Error! Reference source not found. figure on the right shows a cross-plot between the laboratory-measured relative density RD (X axis) and the geophysical logged density ADEN (Y axis). It is clear that the geophysical density ADEN has a poor correlation with the RD (R2=0.64) and the data are scattered.
According to our analysis and observation, the reasons for this are mainly associated with samples taken around coal/rock interfaces, cores with stone bands, coal samples from thin seams, cores taken from caved seams or samples with small depth shifts from the corresponding geophysical logs.
9
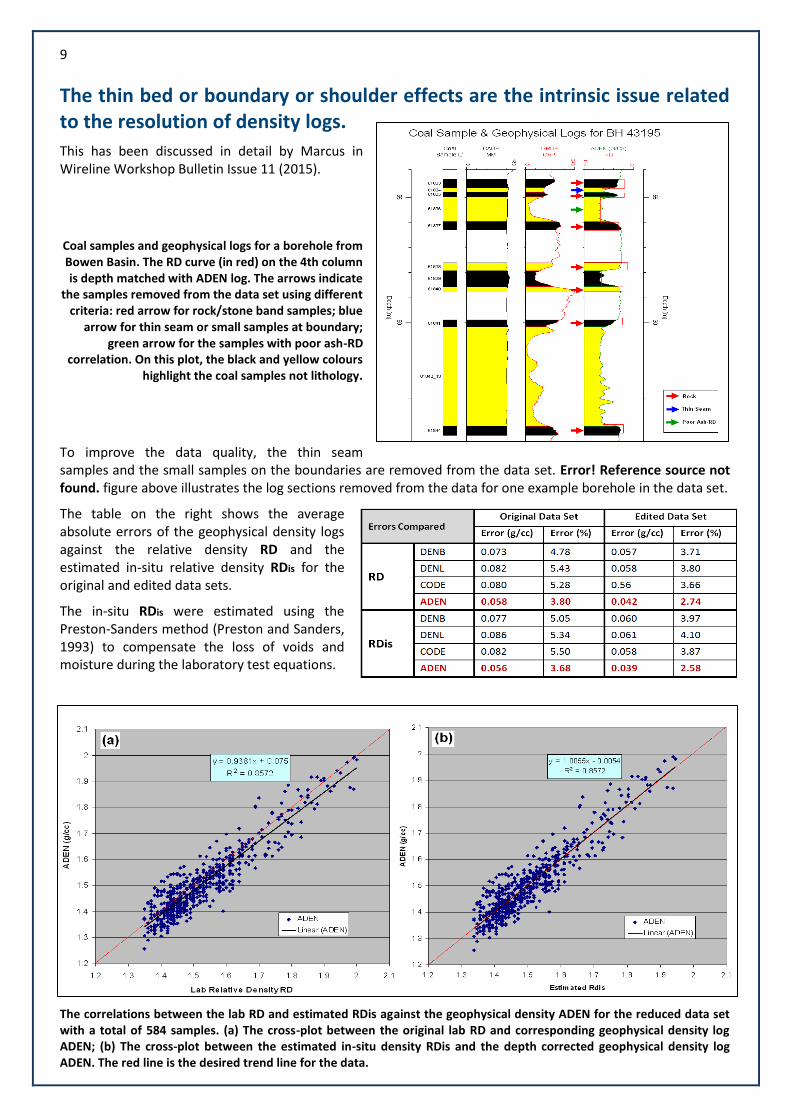
The thin bed or boundary or shoulder effects are the intrinsic issue related to the resolution of density logs.
This has been discussed in detail by Marcus in Wireline Workshop Bulletin Issue 11 (2015).
Coal samples and geophysical logs for a borehole from Bowen Basin. The RD curve (in red) on the 4th column is depth matched with ADEN log. The arrows indicate
the samples removed from the data set using different criteria: red arrow for rock/stone band samples; blue
arrow for thin seam or small samples at boundary; green arrow for the samples with poor ash-RD
correlation. On this plot, the black and yellow colours highlight the coal samples not lithology.
To improve the data quality, the thin seam samples and the small samples on the boundaries are removed from the data set. Error! Reference source not found. figure above illustrates the log sections removed from the data for one example borehole in the data set.
The table on the right shows the average absolute errors of the geophysical density logs against the relative density RD and the estimated in-situ relative density RDis for the original and edited data sets.
The in-situ RDis were estimated using the Preston-Sanders method (Preston and Sanders, 1993) to compensate the loss of voids and moisture during the laboratory test equations.
The correlations between the lab RD and estimated RDis against the geophysical density ADEN for the reduced data set with a total of 584 samples. (a) The cross-plot between the original lab RD and corresponding geophysical density log ADEN; (b) The cross-plot between the estimated in-situ density RDis and the depth corrected geophysical density log ADEN. The red line is the desired trend line for the data.

10
The removal of the thin seam samples and boundary samples largely improves the compatibility between the geophysical density log and the relative density (RD). Comparing with other geophysical density logs (DENB, DENL & CODE), we noticed that the VECTAR processed density log ADEN (a proprietary processing provided by Weatherford) has the smallest error against the RD and RDis with an error less than 3%.
In terms of overall errors, the estimated RDis does not help much for this data set. Nevertheless, the Preston-Sanders’ moisture compensation does bring the offset regression line in the above plot (a) to be overlaid with the desired one-to-one red line for the reduced data set (b).
This suggests the importance of Preston-Sanders’ moisture correction method, even the in-situ moisture estimation (not derived for this data set) from Fletcher and Sanders (2003) was used.
Given the close correlation between the wireline density logs and the refined RDis laboratory data, we can conclude that, given the right tooling and calibration discipline, it is possible to wireline log density within 3% accuracy.
Binzhong Zhou (CSIRO Energy)- email: [email protected]
The author referred to: Fletcher, I.S., and Sanders, R.H., 2003, Estimation of in-situ moisture of coal seams and product total moisture: Final Report for
ACARP Project C10041.Preston, K.B., 2005, Estimating the in-situ relative density of coal – old favourites and new developments: The Proceeding of Bowen
Basin Symposium 2005, 13-20. Preston, K.B. and Sanders, R.H., 1993, Estimating the in-situ relative density of coal: Australian Coal Geology, 9, 22-26.
Zhou, B. and Esterle, J., 2008, Toward improved coal density estimation from geophysical logs: Exploration Geophysics, 39, 124-132.Zhou, B., Fraser, S.,
Borsaru, M., Aizawa, T., Sliwa, R. and Hashimoto, T., 2005, New Approaches for Rock Strength Estimation from Geophysical Logs: Proceeding of Bowen
Basin Symposium, 12 – 14 October 2005, Yeppoon, Queensland, pp 151-164.
Next instalment (November 2016): Coal density and other quality parameters from geophysical logs
MMaarrccuuss CChhaattffiieelldd –– SSeepptteemmbbeerr 22001166
CCooppyyrriigghhttss aappppllyy:: wwwwww..wwiirreelliinneewwoorrkksshhoopp..ccoomm//bbuulllleettiinn//ccooppyyrriigghhtt
EEddiittoorr//ccoonnttaacctt:: wwiillnnaa@@wwiirreelliinneewwoorrkksshhoopp..ccoomm
FFoorr bbaacckk iissssuueess,, ggoo ttoo:: wwwwww..wwiirreelliinneewwoorrkksshhoopp..ccoomm//bbuulllleettiinn//aarrcchhiivvee