Patterns of Root Dynamics in Mangrove Forests Along Environmental Gradients in the Florida Coastal...
18
Patterns of Root Dynamics in Mangrove Forests Along Environmental Gradients in the Florida Coastal Everglades, USA Edward Castan ˜ eda-Moya, 1 * Robert R. Twilley, 1 Victor H. Rivera-Monroy, 1 Brian D. Marx, 2 Carlos Coronado-Molina, 3 and Sharon M. L. Ewe 4 1 Department of Oceanography and Coastal Sciences, School of the Coast and Environment, Louisiana State University, Baton Rouge, Louisiana 70803, USA; 2 Department of Experimental Statistics, Louisiana State University, Baton Rouge, Louisiana 70803, USA; 3 Wetland Watershed Sciences Department, South Florida Water Management District, West Palm Beach, Florida 33416, USA; 4 Ecology and Environment, Inc., West Palm Beach, Florida 33401, USA ABSTRACT Patterns of mangrove vegetation in two distinct basins of Florida Coastal Everglades (FCE), Shark River estuary and Taylor River Slough, represent unique opportunities to test hypotheses that root dynamics respond to gradients of resources, regu- lators, and hydroperiod. We propose that soil total phosphorus (P) gradients in these two coastal basins of FCE cause specific patterns in below- ground biomass allocation and net primary productivity that facilitate nutrient acquisition, but also minimize stress from regulators and hydrope- riod in flooded soil conditions. Shark River basin has higher P and tidal hydrology with riverine mangroves, in contrast to scrub mangroves of Taylor basin with more permanent flooding and lower P across the coastal landscape. Belowground biomass (0–90 cm) of mangrove sites in Shark River and Taylor River basins ranged from 2317 to 4673 g m -2 , with the highest contribution (62–85%) of roots in the shallow root zone (0–45 cm) compared to the deeper root zone (45–90 cm). Total root productivity did not vary significantly among sites and ranged from 407 to 643 g m -2 y -1 . Root production in the shallow root zone accounted for 57–78% of total produc- tion. Root turnover rates ranged from 0.04 to 0.60 y -1 and consistently decreased as the root size class distribution increased from fine to coarse roots, indicating differences in root longevity. Fine root biomass was negatively correlated with soil P density and frequency of inundation, whereas fine root turnover decreased with increasing soil N:P ratios. Lower P availability in Taylor River basin relative to Shark River basin, along with higher regulator and hydroperiod stress, confirms our hypothesis that interactions of stress from resource limitation and long duration of hydroperiod ac- count for higher fine root biomass along with lower fine root production and turnover. Because fine root production and organic matter accumulation are the primary processes controlling soil formation Received 4 March 2011; accepted 27 July 2011; published online 7 September 2011 Author Contributions: ECM designed the study, carried out field and laboratory work, performed data analysis, and wrote the paper with contributions from all other authors; RRT and VHRM designed the study, provided funding, carried out field work and data analysis; BDM con- tributed with data analysis; CCM and SMLE carried out field work and contributed to sample and data analyses. *Corresponding author; e-mail: [email protected] Ecosystems (2011) 14: 1178–1195 DOI: 10.1007/s10021-011-9473-3 Ó 2011 Springer Science+Business Media, LLC 1178
Transcript of Patterns of Root Dynamics in Mangrove Forests Along Environmental Gradients in the Florida Coastal...

Patterns of Root Dynamicsin Mangrove Forests Along
Environmental Gradients in theFlorida Coastal Everglades, USA
Edward Castaneda-Moya,1* Robert R. Twilley,1 Victor H. Rivera-Monroy,1
Brian D. Marx,2 Carlos Coronado-Molina,3 and Sharon M. L. Ewe4
1Department of Oceanography and Coastal Sciences, School of the Coast and Environment, Louisiana State University, Baton Rouge,
Louisiana 70803, USA; 2Department of Experimental Statistics, Louisiana State University, Baton Rouge, Louisiana 70803, USA;3Wetland Watershed Sciences Department, South Florida Water Management District, West Palm Beach, Florida 33416, USA;
4Ecology and Environment, Inc., West Palm Beach, Florida 33401, USA
ABSTRACT
Patterns of mangrove vegetation in two distinct
basins of Florida Coastal Everglades (FCE), Shark
River estuary and Taylor River Slough, represent
unique opportunities to test hypotheses that root
dynamics respond to gradients of resources, regu-
lators, and hydroperiod. We propose that soil total
phosphorus (P) gradients in these two coastal
basins of FCE cause specific patterns in below-
ground biomass allocation and net primary
productivity that facilitate nutrient acquisition, but
also minimize stress from regulators and hydrope-
riod in flooded soil conditions. Shark River basin
has higher P and tidal hydrology with riverine
mangroves, in contrast to scrub mangroves of
Taylor basin with more permanent flooding and
lower P across the coastal landscape. Belowground
biomass (0–90 cm) of mangrove sites in Shark
River and Taylor River basins ranged from 2317 to
4673 g m-2, with the highest contribution
(62–85%) of roots in the shallow root zone
(0–45 cm) compared to the deeper root zone
(45–90 cm). Total root productivity did not vary
significantly among sites and ranged from 407 to
643 g m-2 y-1. Root production in the shallow
root zone accounted for 57–78% of total produc-
tion. Root turnover rates ranged from 0.04 to
0.60 y-1 and consistently decreased as the root size
class distribution increased from fine to coarse
roots, indicating differences in root longevity. Fine
root biomass was negatively correlated with soil P
density and frequency of inundation, whereas fine
root turnover decreased with increasing soil N:P
ratios. Lower P availability in Taylor River basin
relative to Shark River basin, along with higher
regulator and hydroperiod stress, confirms our
hypothesis that interactions of stress from resource
limitation and long duration of hydroperiod ac-
count for higher fine root biomass along with lower
fine root production and turnover. Because fine
root production and organic matter accumulation
are the primary processes controlling soil formation
Received 4 March 2011; accepted 27 July 2011;
published online 7 September 2011
Author Contributions: ECM designed the study, carried out field and
laboratory work, performed data analysis, and wrote the paper with
contributions from all other authors; RRT and VHRM designed the study,
provided funding, carried out field work and data analysis; BDM con-
tributed with data analysis; CCM and SMLE carried out field work and
contributed to sample and data analyses.
*Corresponding author; e-mail: [email protected]
Ecosystems (2011) 14: 1178–1195DOI: 10.1007/s10021-011-9473-3
� 2011 Springer Science+Business Media, LLC
1178

and accretion in scrub mangrove forests, root
dynamics in the P-limited carbonate ecosystem of
south Florida have a major controlling role as to
how mangroves respond to future impacts of sea-
level rise.
Key words: root biomass; root productivity; root
turnover rates; belowground allocation; P avail-
ability; mangroves; Florida Coastal Everglades.
INTRODUCTION
Plants allocate new biomass to acquire limiting re-
sources that most strongly restrict growth of whole
plant (Chapin and others 1987; Gleeson and Til-
man 1992; Bazzaz 1997). Plants in nutrient-poor
soils tend to allocate more biomass to roots, thereby
maximizing efficiency for capturing the most
strongly limiting resource and increasing root:shoot
ratios that lead to a more favorable carbon:nutrient
balance (Chapin 1980; Tilman 1985; Chapin and
others 1987; Gleeson and Tilman 1992). Moreover,
biomass allocation has a functional role in con-
trolling ecological processes associated with carbon
budgets of forest and wetland ecosystems (Na-
delhoffer and others 1985; Jackson and others
1997; Chmura and others 2003; Bouillon and
others 2008). For instance, biomass allocation is
considered significant to soil formation and vertical
accretion (Chen and Twilley 1999a; Turner and
others 2004; McKee and others 2007), nutrient
cycling (Nadelhoffer and others 1985), and nutri-
ent uptake, transport, and storage (Eissenstat and
others 2000). It is estimated that fine roots account
for 10–30% of total forest tree biomass (Santanto-
nio and others 1977) and from 30 to 50% of total
net primary production in forest ecosystems
(Jackson and others 1997). Thus, resource limita-
tion of forested ecosystems may be significant in
the ecological patterns of carbon storage and soil
formation because plants respond differently to
short- and long-term changes in soil nutrients
according to species-specific evolutionary life his-
tory traits (Chapin and others 1987).
Mangroves are forested wetlands that are adap-
ted to a variety of environmental settings charac-
terized by stress gradients associated with
interactions among resources (that is, nutrients),
regulators (that is, soil salinity, sulfide), and hy-
droperiod (that is, frequency, duration, and depth
of flooding; Twilley and Rivera-Monroy 2005).
Mangrove species have the ability to adjust mor-
phological and physiological traits in response to
the interaction of these gradients as a mechanism
that determines trajectories in ecosystem structure
and function across the coastal landscape (Lugo
and Snedaker 1974; Feller and others 2003a, b,
2007; Lovelock and others 2004; Twilley and Ri-
vera-Monroy 2009). For example, simulation
models of organic matter content and bulk density
suggest that root production is a critical process in
controlling organic matter accumulation and dis-
tribution in mangrove soils in the neotropics (Chen
and Twilley 1999a). These models also predict that
variations in root turnover have a more significant
effect on these soil characteristics than variation in
litterfall, as has been observed in a few empirical
studies (McKee and Faulkner 2000; Middleton and
McKee 2001).
Mangrove species are capable of allocating a large
proportion (up to 40–60%) of their total biomass to
belowground roots in response to nutrient limitation
(Lugo 1990; Komiyama and others 2000; Khan and
others 2007; Naidoo 2009). Recent studies of carbon
allocation in mangrove wetlands around tropical
and subtropical latitudes suggest that scrub forests
allocate relatively more carbon to roots than do taller
mangroves in response to low nutrient availability
and anaerobic conditions (Lovelock 2008). The
allocation of biomass among mangrove species also
responds to changes in hydroperiod with distinct
growth, productivity, and species zonation patterns
along the intertidal zone (Twilley and others 1986;
Castaneda-Moya and others 2006). Yet, there are
few studies that have directly evaluated the influ-
ence of hydroperiod on mangrove root dynamics
(Cardona-Olarte and others 2006; Krauss and others
2006; McKee and others 2007).
In this study, we investigate landscape patterns
of belowground biomass and productivity of man-
groves at sites along two Florida Coastal Everglades
(FCE) basins, Shark River estuary and Taylor River
Slough, to test the generality of biomass allocation
models associated with distinct forest productivity
gradients (Ewe and others 2006). These two basins
have contrasting gradients in hydrology, regulators,
and nutrients resulting in distinct riverine and
scrub mangroves within an oligotrophic (that is,
P-limited) carbonate platform (Chen and Twilley
1999b; Mancera-Pineda and others 2009; Castan-
eda-Moya and others 2010). Mangroves along
Shark River basin are fertilized by sediment depo-
sition associated with tropical cyclones, resulting in
elevated aboveground productivity associated with
Mangrove Root Dynamics 1179
soil P availability that decreases with distance in-
land from the mouth of the estuary (Chen and
Twilley 1999a, b; Krauss and others 2006; Castan-
eda-Moya and others 2010). Mangrove forests
along Taylor River basin receive less inorganic
sediments during storm events due to a geologic
barrier called the ‘‘Buttonwood Ridge’’ that isolates
these mangrove forests from storm P deposits from
Florida Bay (Davis and others 2004; Castaneda-
Moya and others 2010). Furthermore, mangroves
along Shark River basin are tide-dominated, with
higher frequency, duration, and depth of flooding
in areas closer to the mouth of the estuary (Chen
and Twilley 1999b; Krauss and others 2006; Cas-
taneda 2010). In contrast, mangrove forests in
southeastern Everglades, including Taylor River,
are permanently flooded and have a negligible tidal
frequency (Castaneda 2010).
We hypothesized that belowground root alloca-
tion will increase in response to both P limitation and
permanently flooded conditions at the Taylor River
sites compared to Shark River sites. We expected that
mangrove forests along Taylor River basin would
have greater root biomass allocation and lower root
production due to increased root longevity as a result
of lower root turnover rates. We also expected
greater root biomass in the top 45 cm of the soil
profile because roots tend to concentrate where soil
nutrients are more abundant. We addressed the
following questions: (1) Are the spatial and temporal
patterns of belowground biomass and productivity
consistent with expected trends associated with
P-limited conditions of two basins in the FCE? (2)
What is the relative change in root biomass and
productivity with soil depth and root size distribu-
tion in response to nutrient, regulator and hydro-
period gradients of these two basins? (3) What is the
relative change in root turnover with root size in
response to gradients in soil nutrients, regulators,
and hydroperiod? (4) What is the relative response
of belowground biomass allocation, productivity,
and root turnover across gradients in soil nutrients
and hydroperiod? We focused only on sulfide as a
regulator gradient because salinity did not explain
the variation in community structure and function
across our Florida mangrove sites (Mancera-Pineda
and others 2009; Castaneda 2010).
MATERIALS AND METHODS
Study Site
This study was conducted in the southern region of
Everglades National Park (ENP; Figure 1) in a zone
referenced as the Florida Coastal Everglades (FCE).
Mangrove forests are distributed along the coastal
margin with an estimated total area of 144,447 ha
(Simard and others 2006), which represents
approximately two-thirds of all mangrove cover in
south Florida (Lodge 2005; see Chen and Twilley
(1999b) and Castaneda-Moya and others (2010) for
a full site description). In 2000, three mangrove
sites were established each along Shark River basin
(SRS-4, SRS-5, and SRS-6) and Taylor River basin
(TS/Ph-6, TS/Ph-7, and TS/Ph-8) as part of the FCE
Long Term Ecological Research (LTER) program
(Childers 2006; http://fcelter.fiu.edu/). In each site,
two 20 9 20 m permanent plots (20 m apart) were
established approximately between 30-50 m from
the shoreline to monitor forest structural attributes
and soil biogeochemical properties. Mangrove for-
ests along Shark River basin are considered riverine
consisting of Rhizophora mangle (L.), Avicennia ger-
minans (L.), Laguncularia racemosa (L.) Gaertn.f.,
and Conocarpus erectus L. SRS-6 is located approxi-
mately 4.1 km from the mouth of the estuary,
whereas SRS-5, and SRS-4 are approximately 9.9
and 18.2 km, respectively (Figure 1). Lower Shark
River sites (SRS-5 and SRS-6) are tide-dominated,
whereas SRS-4 is influenced by runoff although a
tidal influence is observed, particularly in the dry
season (Chen and Twilley 1999b; Castaneda 2010).
Mangrove sites along Taylor River basin (TS/Ph-7
and TS/Ph-6) are located approximately 1.5 and
4 km inland from Florida Bay. Mangrove zones are
dominated by R. mangle scrub forest (tree heights
£ 2 m) with clusters of C. erectus and freshwater
Cladium jamaicense-Eleocharis sp. TS/Ph-8 is located
near Snook Creek, a tributary of Joe Bay, east of
the Taylor River basin (Figure 1). This site supports
a mixed community of C. jamaicense and man-
groves, with mangrove tree heights about 3–4 m.
Rhizophora mangle dominates fringe areas and tidal
creeks, whereas C. erectus is found in the interior
parts (Ewe and others 2006). Mangrove waterways
of Taylor basin are non-tidal systems with flooded
conditions (mainly TS/Ph-6 and TS/Ph-7; Castan-
eda 2010) compared to tidal conditions of Shark
River basin. Flooded conditions of Taylor basin are
determined by the interactions of seasonal precip-
itation, upland runoff, and wind (Sutula 1999).
Root Biomass
We performed two separate field experiments to
estimate root biomass in all six mangrove sites of
both coastal basins. For the first experiment, root
cores were collected in December 2000 at the three
Shark River sites (SRS 4–6) and one Taylor River
site (TS/Ph-6); whereas the other two Taylor sites
1180 E. Castaneda-Moya and others

(TS/Ph-7 and TS/Ph-8) were sampled in May 2001.
Five sampling points (replicates) were established
in each site and treated as experimental units. Two
sampling points were established in opposite cor-
ners of the two permanent plots, and the fifth
sampling point was located in between the two
plots. Due to the physiognomy of the forest (<2 m
height) at two Taylor River sites (TS/Ph-6 and TS/
Ph-7), five scrub mangrove islands (formed by 2–5
trees) of similar size were selected and treated as
single sampling points; mangrove islands were
selected in the same fashion around the plots as
explained above. In each site, duplicate root cores
(that is, sampling units; 0–45 cm depth; shallow
root zone) were randomly collected as subreplicates
at each sampling point, using a PVC coring device
(10.2 cm diameter 9 45 cm length); at TS/Ph-6
and TS/Ph-7 root cores were collected at the edge of
each mangrove island. All root cores were stored
separately in bags at 4�C and brought to the labo-
ratory for further analyses. All root samples were
processed separately and initially rinsed with water
through 1-mm synthetic mesh screen to remove
soil particles. Live roots were separated by hand
picking those floating in fresh water, and sorted
into diameter size classes of less than 2 mm,
2–5 mm, and greater than 5 mm (fine, small, and
coarse roots, respectively). Coarse roots included
size classes between 5 and 20 mm; roots greater
than 20 mm in diameter were not included in this
study due to sampling limitations. Each root sample
was oven-dried at 60�C to a constant mass, and
weighed. Preliminary tests of root separation
techniques using fresh water and different con-
centrations (17, 11, and 6%) of a colloidal silica
solution (Ludox�) that separate live and dead roots
based on density differences (Robertson and Dixon
1993) indicated that using only fresh water to
process our samples was the most cost-efficient
technique for root separation.
For the second experiment, root cores were col-
lected in December 2002 at two Taylor River sites
(TS/Ph-7 and TS/Ph-8), and in May 2003 at the three
Shark River sites and remaining Taylor River site
(TS/Ph-6). In contrast to the first experiment, root
biomass was estimated at two depths, 0–45 cm
(shallow root zone) and 45–90 cm (deeper root
zone) in all sites by using the same PVC coring device
and sample processing as in the first experiment. In
the Shark River sites, two sampling points (repli-
cates) were established in opposite corners of the two
permanent plots as in the first experiment. At each
point, four cores (0–90 cm depth) were randomly
collected as subreplicates and divided into 0–45 and
45–90 cm to estimate biomass at each of the root
zones. At TS/Ph-6 and TS/Ph-7, mangrove islands of
similar size were selected at the outside corners of the
plots and treated as single sampling points as in the
first experiment. In TS/Ph-6, five mangrove islands
were selected and cores (0–90 cm depth) were col-
lected in two habitats (inland and edge) of each is-
land. Duplicate cores from each habitat were divided
into 0–45 and 45–90 cm. In TS/Ph-7, one mangrove
island was selected in the far left corner of each plot,
Figure 1. Location of the
study sites in the
Everglades National Park
(ENP), south Florida,
USA. SRS-4, SRS-5, and
SRS-6 along Shark River
estuary; TS/Ph-6, TS/Ph-7
along Taylor River
Slough, and TS/Ph-8 in
Joe Bay are part of the
Florida Coastal Everglades
Long-Term Ecological
Research (FCE-LTER)
program.
Mangrove Root Dynamics 1181
and four cores were collected at the inland and edge
habitats of each island; only two cores per habitat
(inland and edge) were saved and divided into 0–45
and 45–90 cm to estimate root biomass. In TS/Ph-8,
five sampling points were established around the
two permanent plots in the same fashion as in the
first experiment. In each point, four root cores
(0–90 cm depth) were collected but only two cores
(subreplicates) were randomly selected, saved and
divided into the two sampling depths. All samples
were processed for root biomass as described above
for the first experiment.
Root Productivity
We used the ingrowth core technique (Vogt and
others 1998) to estimate root productivity only in the
second experiment at all sites. Ingrowth cores
(10.2 cm diameter 9 45 cm length) made of flexible
synthetic mesh material and filled with pre-sieved
sphagnum peat moss were installed in each of the
cored holes formed during sampling of root biomass.
Commercial sphagnum peat moss had similar char-
acteristics to mangrove peat in our sites, including
bulk density (0.15 vs. 0.21 g cm-3), organic matter
content (AFDW: 97 vs. 75%), total C (470 vs.
330 mg g-1), and total N (11 vs. 13 mg g-1). In-
growth cores were retrieved at 1- and 3-year inter-
vals, and the subsequent root growth within the
ingrowth core was used to estimate annual root pro-
duction at two depths (0–45 and 45–90 cm) during
both time intervals. Cores were harvested during
December 2003 (1-year interval) and February 2006
(3-year interval) at TS/Ph-7 and TS/Ph-8, and during
May 2004 (1-year interval) and February 2006 (3-
year interval) at the Shark River sites and TS/Ph-6.
During each time interval, two ingrowth cores (four
in the case of TS/Ph-7) were retrieved as subreplicates
from each depth at each sampling point in all sites.
After each harvest, ingrowth cores were processed
individually following the sameprotocol as in the root
biomass section. Root turnover rate in the shallow
root zone (0–45 cm depth) was calculated as root
productivity divided by biomass (Eissenstat and Yanai
1997) of each root size class. Estimates of root turn-
over represent the average of root biomass cores and
ingrowth cores for each sampling point within each
site. Root longevity (turnover time) in the shallow
root zone was calculated as the inverse of root turn-
over rate (y-1) for each root size class.
Root Nutrient Content
We determined nutrient content of root biomass
samples (0–45 cm depth) for the first experiment.
Four oven-dried root core samples were randomly
selected from each site and considered as replicates;
the size classes of each root core were combined for
further nutrient analyses. It was not possible to
determine nutrient concentration of each root size
class due to small sample volumes. Total N con-
centrations of root material were determined on
two analytical replicates of each sample with an
ECS 4010 elemental analyzer (Costech Analytical
Technologies, Inc., Valencia, California). Total P
was extracted on duplicate analytical replicates
with 1 N HCl after combustion in a furnace at
550�C (Aspila and others 1976) and determined by
colorimetric analysis using a segmented flow anal-
ysis Flow Solution IV autoanalyzer (OI Analytical,
College Station, Texas). Root nutrient density was
express on a volume basis (mg cm-3) using the root
density per volume of soil. The N:P atomic ratio of
root tissue was used as an indicator of nutrient
limitation (N or P-limited). An N:P atomic ratio less
than 33 indicates N limitation, whereas N:P greater
than 33 suggests P limitation (Koerselman and
Meuleman 1996; Verhoeven and others 1996;
Darby and Turner 2008a, b).
Statistical Analyses
All statistical analyses were performed with PROC
MIXED (SAS Institute, Cary, North Carolina, USA).
The variation in root biomass and productivity was
not tested among size classes and estimates repre-
sent the sum of all size classes for each site. Root
biomass was tested for differences among sites (first
experiment) and sites and depth (second experi-
ment) using a one- and two-way ANOVA, respec-
tively. We used repeated measures ANOVA to test
for differences in root productivity among sites,
harvest, and depth (0–45 vs. 45–90 cm), with
harvest as the repeated measure. Differences in
total (0–90 cm) root biomass and productivity were
tested between mangrove island habitats (inland
vs. edge) and sites (TS/Ph-6 and TS/Ph-7) with a
two-way ANOVA. Variation in shallow (0–45 cm)
fine root biomass and productivity was tested
independently with a one-way ANOVA to deter-
mine differences among sites and regions (Shark
River vs. Taylor River). Root turnover in the shal-
low root zone was tested for differences among sites
and size classes using a two-way ANOVA. For TS/
Ph-6 and TS/Ph-7, we only used data collected in
the inland habitat of these mangrove islands to
examine the variation in shallow fine root biomass,
productivity, and root turnover across all sites. This
habitat represents more accurately patterns of root
biomass accumulation and production as these
mangrove islands grow in these two sites (see Fig-
1182 E. Castaneda-Moya and others

ure 2 in Ewe and others 2007). Root nutrient
content (total N and P) and N:P ratios of shallow
root biomass samples were analyzed independently
with one-way ANOVA to determine differences
among sites.
All effects were considered fixed. Sampling points
were nested within each site, considered random
effects, and treated as experimental units. Sampling
units (that is, root cores and ingrowth cores) were
also nested with each site and considered random
effects. The ANOVA design was unbalanced for most
of the variables analyzed due to differences in the
number of sampling points and total number of
observations per point in each site. The Kenward–
Roger procedure was used to adjust the degrees of
freedom of the F test statistics when the design was
unbalanced or when an unequal variance model was
significant (SAS Institute, Cary, North Carolina,
USA; Kenward and Roger 1997). Interaction effects
were considered for all analyses. Pairwise compari-
sons were performed with Fisher’s Least Significant
Differences (LSD) when significant differences
(P < 0.05) were observed within a main effect or
interaction. The assumption of normality was tested
using normal probability plots and ANOVA residu-
als. The assumption of homocedasticity was tested
using the ‘‘null model’’ likelihood ratio test of the
residual errors with a chi square distribution. All
variables were log-transformed (ln(x + 1)) prior to
analysis to meet the ANOVA assumptions, except
root turnover, root total N, and root N:P. Unless
otherwise stated, data presented are means (± 1 SE)
of untransformed data. Soil nutrient data (top
45 cm; Poret and others 2007; Castaneda 2010) in all
six FCE mangrove sites were used for regression
analyses with shallow fine root biomass, productiv-
ity, and turnover, and root nutrient content.
RESULTS
Root Biomass
Shallow (0–45 cm depth) root biomass did not differ
significantly (interaction site 9 experiment:
F5,132 = 1.95, P = 0.1) between the two experiments
(2000–2001 vs. 2002–2003) for any of the mangrove
sites. Thus, root data for both samplings were pooled
to obtain root estimates for the shallow root zone in
each site. These data and the root data for the deeper
(45–90 cm) root zone from the second experiment
were used to estimate the variation in root biomass
with depth at each of the six mangrove sites.
Root biomass was significantly different among
sites and between depths, and there was a signifi-
cant interaction between site and depth (Table 1).
Shallow root biomass was greater in TS/Ph-8
(3302 ± 591 g m-2) and SRS-5 (3176 ± 274 g m-2)
compared to SRS-6 (1973 ± 336 g m-2). In the
deeper root zone, TS/Ph-7 (1778 ± 575 g m-2) had
the highest root biomass and SRS-6 and TS/Ph-6
(560 ± 164 and 367 ± 60 g m-2, respectively)
showed the lowest estimates (Figure 2A). Overall,
mean root biomass was significantly higher in the
shallow root zone (2584 ± 249 g m-2) compared to
the deeper (45–90 cm) root zone (1008 ± 205 g m-2)
at all sites, except at TS/Ph-7 where root biomass
was not significantly different between the two
root zones (Table 1; Figure 2A).
Total (0–90 cm) root biomass ranged from
2317 ± 329 g m-2 (TS/Ph-6) to 4673 ± 401 g m-2
(TS/Ph-7), with the highest contribution (62–85%)
of roots in the shallow root zone at all sites. Taylor
River sites had both the high and low mean
estimates of total biomass, with the general trend
TS/Ph-7 > SRS-5 > TS/Ph-8 > SRS-4 > SRS-6 >
TS/Ph-6. There were no significant differences
(F1,35 = 0.32, P = 0.6) in mean total biomass
Table 1. Statistical Results of Belowground RootBiomass, Productivity, Turnover and Root NutrientContent in Mangrove Forests of the Florida CoastalEverglades
Source of variation df F P
Root biomass
Site 5, 28.5 6.1 ***
Depth 1, 73.6 119.4 ***
Site 9 depth 5, 46.9 3.3 *
Fine root biomass
Site 5, 99.6 2.7 *
Fine root productivity
Site 5, 80 2.7 *
Root productivity
Site 5, 17.9 1.5 ns
Harvest 1, 92 0.7 ns
Depth 1, 77.6 70.3 ***
Site 9 harvest 5, 91.9 2.2 ns
Site 9 depth 5, 77.4 4.2 **
Harvest 9 depth 1, 93.5 0.1 ns
Site 9 harvest 9 depth 5, 93.3 1.2 ns
Root turnover
Site 5, 47.7 7.0 ***
Size 2, 45.9 54.2 ***
Site 9 size 10, 45.9 4.4 ***
Root nutrient content
Total N (mg cm-3) 5, 18 6.4 **
Total P (mg cm-3) 5, 18 15.5 ***
Atomic N:P 5, 18 94.2 ***
Significance levels are indicated by *P < 0.05, **P < 0.01, ***P < 0.001.ns = not significant.
Mangrove Root Dynamics 1183

between the Taylor River sites (3811 ± 710 g m-2)
and Shark River sites (3368 ± 544 g m-2). Most of
the root biomass was distributed in the larger size
class for both root zones at all sites (Figure 2B). On
average, the less than 2 mm and 2–5 mm size classes
contributed 13 and 16% of the total live root biomass
in each root zone at all sites, whereas the greater
than 5 mm size class accounted for 71% of the total
biomass.
Total (0–90 cm) root biomass allocation also
varied between the inland and edge habitats of
mangrove islands at two Taylor River sites with
scrub mangrove forests (TS/Ph-6 and TS/Ph-7;
Table 2). Overall, the inland habitat (4661 ±
576 g m-2) of both sites had the highest root bio-
mass compared to the edge habitat (2220 ±
372 g m-2). The inland habitat (5975 ± 1333 g m-2)
of TS/Ph-7 had the highest root biomass, whereas
the edge habitat (1059 ± 203 g m-2) of TS/Ph-6
had the lowest (Table 2). In general, total (0–90 cm)
root biomass was significantly greater in the man-
grove islands of TS/Ph-7 (4677 ± 868 g m-2) com-
pared to TS/Ph-6 (2204 ± 356 g m-2). There was no
significant interaction between island habitats and
sites indicating that the variation in root biomass
between habitats is independent of site differences
(Table 2).
Variation in shallow (top 45 cm of soils) fine
(<2 mm) root biomass was also examined among
sites, given that this root size class distribution ac-
counts for most of nutrient uptake. Shallow fine
root biomass varied significantly among mangrove
sites and ranged from lowest value at a Shark River
site (253 ± 38 g m-2; SRS-6) to greatest value at
Taylor River site (540 ± 102 g m-2; TS/Ph-7;
Table 1; Figure 3A). There was no significant dif-
ference in fine root biomass in five of the six sites;
only the site at the mouth of Shark River (SRS-6)
had significantly lower fine root biomass. Along
Shark River basin, fine root biomass allocation in
the shallow root zone increased from the mouth of
the estuary with distance inland (Figure 3A). There
were significant (F1,105 = 5.1, P < 0.05) differ-
ences in mean shallow fine root biomass between
Shark River (354 ± 26 g m-2) and Taylor River
basins (474 ± 53 g m-2).
Figure 2. Total root biomass in the shallow (0–45 cm)
and deeper (45–90 cm) root zones (A) and root size class
distribution with depth (B) in mangrove forests of the
Florida Everglades. Asterisks indicate significant differ-
ences (P < 0.05) within each site. Means (± 1 SE) with
different capital letters are significantly different (P < 0.05)
among sites in the shallow root zone. Means (± 1 SE)
with different small letters are significantly different
(P < 0.05) among sites in the deeper root zone.
Table 2. Statistical Results of Root Biomass andProductivity (Integrated to a Depth of 90 cm) in theInland and Edge Habitats of Mangrove Islands atTS/Ph-6 and TS/Ph-7
Site Island
habitat
Biomass
(g m-2)
Productivity
(g m-2 y-1)
TS/Ph-6 Inland 3347 (408)b 703 (150)a
Edge 1172 (203)c 419 (30)b
TS/Ph-7 Inland 5975 (1333)a 491 (64)ab
Edge 3379 (638)b 323 (18)b
ANOVA source
Biomass Productivity
Site F1,24 = 16.2 (***) F1,4.5 = 1.9 (ns)
Habitat F1,24 = 15.8 (***) F1,27.9 = 9.2 (*)
Site 9 habitat F1,24 = 0.1 (ns) F1,27.9 = 0.6 (ns)
Means (± 1 SE) followed by different letters within each column are significantlydifferent (Fisher’s LSD post hoc test). ANOVA source with significance is indicatedby *P < 0.05, **P < 0.01, ***P < 0.001. ns = not significant.
1184 E. Castaneda-Moya and others

Root Productivity
Root productivity was not significantly different
among sites for both shallow and deeper root
zones. The shallow root zone ranged from
260 ± 40 g m-2 y-1 (TS/Ph-7) to 468 ± 78 g m-2
y-1 (SRS-5), compared to the lower range from
102 ± 32 g m-2 y-1 (SRS-6) to 210 ± 32 g m-2
y-1 (TS/Ph-8) in the deeper root zone (Table 1;
Figure 4A). Estimates of root productivity among
the six mangrove sites were similar (not signifi-
cantly different) based on either 1-year
(284 ± 23 g m-2 y-1) or 3-year harvest intervals
(231 ± 15 g m-2 y-1) due, in part, to high sample
variability (Table 1). However, there was a signifi-
cant interaction between site and depth effects,
with higher root productivity in the shallow root
zone (341 ± 22 g m-2 y-1) compared to the dee-
per root zone (166 ± 11 g m-2 y-1) at all sites,
except in TS/Ph-8 where root productivity esti-
mates were not significantly different between the
two root depths (Table 1; Figure 4A). Overall, total
(0–90 cm) root productivity ranged from
407 ± 23 g m-2 y-1 (TS/Ph-7) to 643 ± 93 g m-2
y-1 (SRS-5) with the highest root production
(57–78%) in the shallow root zone compared to
the deeper root zone. Fine roots contributed
21–50% of the total root productivity in each root
zone at all sites (Figure 4B). On average, the small
(2–5 mm) and coarse (>5 mm) roots accounted for
24 and 41% of the total root production in each
root zone at all sites, respectively.
Figure 3. Mean (± 1 SE) fine root biomass (A) and fine
root productivity (B) in the shallow (0–45 cm) root zone
in mangrove forests of the Florida Everglades. Different
letters indicate significant differences (P < 0.05) among
sites.
Figure 4. Total root productivity in the shallow
(0–45 cm) and deeper (45–90 cm) root zones (A) and
root size class distribution with depth (B) in mangrove
forests of the Florida Everglades. Asterisks indicate sig-
nificant differences (P < 0.05) within each site. Means
(± 1 SE) with different capital letters are significantly dif-
ferent (P < 0.05) among sites in the shallow root zone.
Means (± 1 SE) with different small letters are significantly
different (P < 0.05) among sites in the deeper root zone.
Mangrove Root Dynamics 1185

Total (0–90 cm) root productivity varied be-
tween habitats (inland vs. edge) of mangrove is-
lands at the two Taylor River scrub mangrove sites
(TS/Ph-6 and TS/Ph-7; Table 2). Overall, total root
productivity in the inland habitat (597 ± 106 g m-2
y-1) was significantly higher compared to the edge
habitat (371 ± 48 g m-2 y-1) of mangrove islands.
The inland habitat (703 ± 150 g m-2 y-1) of TS/
Ph-6 had the highest root productivity and the edge
habitat (323 ± 18 g m-2 y-1) of TS/Ph-7 the low-
est. There were no significant differences in total
root productivity among sites and no significant
interaction between island habitats and sites (Ta-
ble 2). The variation in shallow (0–45 cm depth)
fine (<2 mm) root productivity was significant
among mangrove sites, with the greatest root pro-
duction in all Shark River sites (Table 1; Fig-
ure 3B). Mean shallow fine root production
estimates were significantly higher in the Shark
River basin (144 ± 5 g m-2 y-1) compared to the
Taylor River basin (111 ± 12 g m-2 y-1; F1,84 =
4.6, P < 0.05).
Root Turnover and Longevity
Root turnover in the shallow (0–45 cm) root zone
differed significantly among sites and size class
distribution (Table 1). Root turnover rates consis-
tently decreased as the root size class increased
from less than 2 mm to greater than 5 mm for all
sites (Figure 5). Fine root turnover rates ranged
from 0.23 ± 0.03 y-1 (TS/Ph-6) to 0.60 ± 0.07 y-1
(SRS-6), from 0.07 ± 0.01 y-1 (TS/Ph-7) to
0.24 ± 0.05 y-1 (TS/Ph-6) for small roots, and
from 0.04 ± 0.01 y-1 (TS/Ph-7) to 0.15 ± 0.02 y-1
(TS/Ph-6) for coarse roots (Figure 5). There was a
significant interaction between sites and root size
classes (Table 1). Overall, mean turnover rates
were higher at the Shark River sites compared to
Taylor River sites for both fine (0.43 ± 0.09 and
0.24 ± 0.004 y-1) and small roots (0.18 ± 0.01
and 0.14 ± 0.05 y-1). In contrast, mean turnover
rates of coarse roots were fairly similar for both
Shark and Taylor River basins (0.09 ± 0.01 and
0.09 ± 0.03 y-1, respectively). Root longevity
estimates ranged from 1.7 to 4.4 years for fine
roots, from 4.1 to 15.4 years for small roots, and
from 6.6 to 24.8 years for coarse roots at all sites
(Table 3).
Root Nutrient Content
Root nutrient content of shallow root biomass dif-
fered significantly among sites (Table 3). Root N
content was significantly higher at the Taylor River
sites and SRS-6 compared to SRS-4 and SRS-5, and
ranged from 0.016 ± 0.001 mg cm-3 (SRS-4) to
0.034 ± 0.006 mg cm-3 (TS/Ph-7; Table 3). Root P
had the highest content at SRS-6 (1.74 ±
0.20 lg cm-3) and differed significantly from all
other sites (Table 3). Along Shark River basin, root
P content decreased significantly with distance in-
land from the mouth of the estuary. The atomic N:P
ratio of root tissue varied significantly from 33.3 ±
0.9 (SRS-6) to 125.6 ± 7.0 (TS/Ph-7) among sites,
indicating P limitation at all sites, except at SRS-6
(Table 3).
DISCUSSION
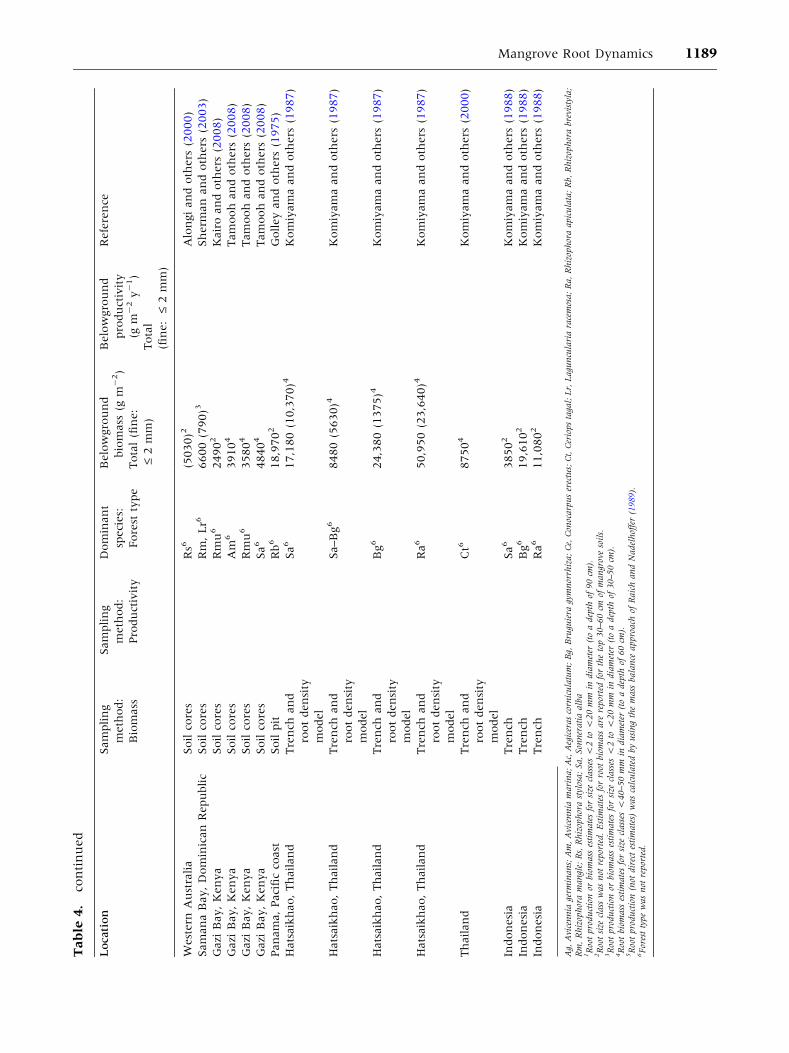
Total (0–90 cm) root biomass estimates are variable
across our study sites (range: 2400–4700 g m-2)
and within the range of values reported for man-
groves around the world (Table 4). Our estimates
are similar to values reported for mangroves in
Puerto Rico (Golley and others 1962), the Domin-
ican Republic (Sherman and others 2003), and
Kenya (Gazi Bay, Tamooh and others 2008) using
similar techniques and sampling depths (Table 4).
However, caution is needed when comparing glo-
bal trends because varying results of belowground
biomass can differ with methodological approaches
(Vogt and others 1998; Clark and others 2001;
Bouillon and others 2008). For instance, root esti-
mates based on soil cores are similar across multiple
mangrove regions, including our study site. But
these estimates are considerably lower relative to
soil pit and trench methods, which are the highest
Figure 5. Mean (± 1 SE) turnover rates (to a depth of
45 cm) of root size classes in mangrove forests of the
Florida Everglades. Different small letters indicate signifi-
cant differences (P < 0.05) among root size classes
within each site. Different capital letters indicate significant
differences (P < 0.05) in fine root turnover among sites.
1186 E. Castaneda-Moya and others

root estimates for mangroves (range: 18,970–
50,950 g m-2; Table 4). Some of these differences
may be due to the larger size class (>20 mm) of
roots included in these techniques and the more
extensive sampling depth. In contrast, soil cores
limit root size classes when sampling due to small
(<10 cm in diameter) core dimensions. In addi-
tion, confounding variables such as forest age,
species composition, history (planted vs. natural),
and local climate variation could influence biomass
allocation patterns resulting in observed differences
(Kairo and others 2008; Tamooh and others 2008).
Our results reveal a significant decrease in total
root biomass with soil depth across the FCE basins,
with most of the roots distributed (62–85%) in the
shallow root zone. This difference in root density
with depth has been measured in other mangroves
in the neotropics (Fiala and Hernandez 1993) and
Asia (Komiyama and others 2000; Tamooh and
others 2008). We also observed the highest root
production (57–78%) in the shallow root zone that
is comparable to other studies (Ruess and others
2003; Darby and Turner 2008b). Our root produc-
tivity estimates are also in agreement with the few
direct estimates reported for neotropical mangroves
(McKee and Faulkner 2000; Cahoon and others
2003; Giraldo 2005; McKee and others 2007; Ta-
ble 4). Moreover, fine root production was a sig-
nificant contributor (21–50%) to the total
(0–90 cm) belowground allocation. This is consis-
tent with previous studies suggesting that fine root
production accounts for one-third of the total an-
nual carbon allocation belowground in forest eco-
systems (Nadelhoffer and Raich 1992). The higher
biomass allocation to coarse roots (�70%) and
substantial fine root production in all our FCE sites
supports the hypothesis that belowground alloca-
tion is a significant contribution to soil carbon
storage in mangrove forests (Chmura and others
2003; Khan and others 2007).
Canopies of plant communities respond to lower
nutrient availability by increasing leaf longevity
and reducing nutrient loss through leaf fall, which
basically increases efficiency of intra-system recy-
cling (Chapin 1980). It is assumed that root
dynamics will exhibit similar intra-system recycling
patterns with nutrient limitation (Chapin 1980;
Ostertag 2001). We observed decreases in root P
content with increasing soil N:P ratios across FCE
basins, supporting the idea that root nutrient con-
tent can be used as an indicator of soil fertility in
mangrove sites (Figure 6A). The gradient in root P
storage for mangroves from west (SRS-6) to east
(TS/Ph-8) across the Everglades mangrove ecotone
region is similar to the pattern observed in foliar P
of Florida Bay seagrasses (Fourqurean and others
1992). This P availability gradient was invoked as a
variable controlling productivity and species com-
position of seagrass communities in this region
(Herbert and Fourqurean 2009), as has been sug-
gested for mangrove forests across FCE (Ewe and
others 2006; Rivera-Monroy and others 2011). The
N:P stoichiometry of root tissue across the two
mangrove basins also supports that hypothesis.
Overall, total root biomass increased with lower
P fertility across the two FCE basins, with the
exception of TS/Ph-6 in Taylor basin, which had
similar biomass allocation relative to the most fer-
Table 3. Root Longevity, Root Nutrient Content, and Root N:P Atomic Ratios in Mangrove Forests of theFlorida Coastal Everglades
Sites Root longevity (years) Root nutrient content
Fine (<2 mm) Small (2–5 mm) Coarse (>5 mm) Total N (mg cm-3) Total P (lg cm-3) Atomic N:P
SRS-4 3.4 6.5 15.0 0.016c 0.55c 63.1d
(0.001) (0.04) (1.2)
SRS-5 2.6 5.6 9.5 0.019c 0.80b 51.5e
(0.002) (0.07) (0.7)
SRS-6 1.7 4.9 10.1 0.026ab 1.74a 33.3f
(0.003) (0.20) (0.9)
TS/Ph-6 4.4 4.1 6.6 0.027ab 0.58c 102.8b
(0.002) (0.06) (4.3)
TS/Ph-7 4.1 15.4 24.8 0.034a 0.61c 125.6a
(0.006) (0.10) (7.0)
TS/Ph-8 4.2 8.3 11.3 0.029a 0.71b 89.5c
(0.001) (0.04) (2.3)
Means (± 1 SE) followed by different letters within each column are significantly different (Fisher’s LSD post hoc test). Significant levels are indicated by *P < 0.05,**P < 0.01, ***P < 0.001. ns = not significant.
Mangrove Root Dynamics 1187

Tab
le4.
Su
mm
ary
of
Belo
wgro
un
dB
iom
ass
an
dPro
du
ctiv
ity
of
Worl
dw
ide
Man
gro
ve
Fore
sts
Loca
tion
Sam
pli
ng
meth
od
:
Bio
mass
Sam
pli
ng
meth
od
:
Pro
du
ctiv
ity
Dom
inan
t
speci
es:
Fore
stty
pe
Belo
wgro
un
d
bio
mass
(gm
-2)
Tota
l(fi
ne:
£2
mm
)
Belo
wgro
un
d
pro
du
ctiv
ity
(gm
-2
y-
1)
Tota
l
(fin
e:
£2
mm
)
Refe
ren
ce
Sh
ark
Riv
er
(SR
S-4
),Flo
rida
(USA
)Soil
core
sIn
gro
wth
core
sR
m,
Lr,
Ce—
Riv
eri
ne
3198
(587)1
465
(206)1
Th
isst
udy
Sh
ark
Riv
er
(SR
S-5
),Flo
rida
(USA
)Soil
core
sIn
gro
wth
core
sR
m,
Lr,
Ag—
Riv
eri
ne
4389
(442)1
643
(210)1
Th
isst
udy
Sh
ark
Riv
er
(SR
S-6
),Flo
rida
(USA
)Soil
core
sIn
gro
wth
core
sR
m,
Lr,
Ag—
Riv
eri
ne
2532
(353)1
469
(183)1
Th
isst
udy
Taylo
rR
iver
(TS/P
h-6
),Flo
rida
(USA
)Soil
core
sIn
gro
wth
core
sR
m—
Scr
ub
2404
(324)1
561
(137)1
Th
isst
udy
Taylo
rR
iver
(TS/P
h-7
),Flo
rida
(USA
)Soil
core
sIn
gro
wth
core
sR
m–
Scr
ub
4673
(508)1
407
(130)1
Th
isst
udy
Taylo
rR
iver
(TS/P
h-8
),Flo
rida
(USA
)Soil
core
sIn
gro
wth
core
sR
m,
Ce—
Fri
nge
4358
(661)1
485
(164)1
Th
isst
udy
Utw
eR
iver,
Mic
ron
esi
aSoil
core
sIn
gro
wth
core
sB
g—
Basi
n720
2(1
20)3
Gle
aso
nan
dE
wel
(2002)
Okat
Riv
er,
Mic
ron
esi
aSoil
core
sIn
gro
wth
core
sSa—
Basi
n870
2(7
50)3
Gle
aso
nan
dE
wel
(2002)
Yela
Riv
er,
Mic
ron
esi
aSoil
core
sIn
gro
wth
core
sB
g,
Ra,
Sa—
Fri
nge
952
(151)3
(460)3
Corm
ier
(2003)
Yela
Riv
er,
Mic
ron
esi
aSoil
core
sIn
gro
wth
core
sB
g,
Ra,
Sa—
Inte
rior
1191
(185)3
(91)3
Corm
ier
(2003)
Yela
Riv
er,
Mic
ron
esi
aSoil
core
sIn
gro
wth
core
sB
g,
Ra,
Sa—
Riv
eri
ne
1424
(183)3
(100)3
Corm
ier
(2003)
Sapw
ala
pR
iver,
Mic
ron
esi
aSoil
core
sIn
gro
wth
core
sB
g,
Ra,
Sa—
Fri
nge
1368
(292)3
(63)3
Corm
ier
(2003)
Sapw
ala
pR
iver,
Mic
ron
esi
aSoil
core
sIn
gro
wth
core
sB
g,
Ra,
Sa—
Inte
rior
2640
(577)3
(119)c
Corm
ier
(2003)
Sapw
ala
pR
iver,
Mic
ron
esi
aSoil
core
sIn
gro
wth
core
sB
g,
Ra,
Sa—
Riv
eri
ne
449
(170)3
(95)3
Corm
ier
(2003)
Rookery
Bay
an
dN
aple
sB
ay,
Flo
rida
(USA
)Soil
core
sIn
gro
wth
core
sR
m—
Fri
nge
15,3
95
3(3
52)3
Gir
ald
o(2
005)
Rookery
an
dN
aple
sB
ays
Flo
rida
(USA
)Soil
core
sIn
gro
wth
core
sR
m,
Ag,
Lr—
Basi
n6704
3(3
14–378)3
Gir
ald
o(2
005)
Rookery
an
dN
aple
sB
ays
Flo
rida
(USA
)Soil
core
sIn
gro
wth
core
sR
m—
Scr
ub
6185
3(3
07)3
Gir
ald
o(2
005)
Win
dst
ar,
Flo
rida
(USA
)In
gro
wth
core
sLr,
Ag,
Rm
—B
asi
n(1
40–150)3
McK
ee
an
dFau
lkn
er
(2000)
Hen
ders
on
Cre
ek,
Flo
rida
(USA
)In
gro
wth
core
sLr,
Ag,
Rm
—B
asi
n(2
20–280)3
McK
ee
an
dFau
lkn
er
(2000)
Roata
nIs
lan
d,
Hon
du
ras
Ingro
wth
core
sR
m—
Fri
nge
265
(199)3
Cah
oon
an
doth
ers
(2003)
Roata
nIs
lan
d,
Hon
du
ras
Ingro
wth
core
sR
m,
Ag—
Basi
n302
(171)3
Cah
oon
an
doth
ers
(2003)
Tw
inC
ays,
Beli
zeIn
gro
wth
core
sR
m—
Fri
nge
525
(197)3
McK
ee
an
doth
ers
(2007)
Tw
inC
ays,
Belize
Ingro
wth
core
sR
m—
Tra
nsi
tion
394
(189)3
McK
ee
an
doth
ers
(2007)
Tw
inC
ays,
Beli
zeIn
gro
wth
core
sR
m—
Scr
ub
82
(43)3
McK
ee
an
doth
ers
(2007)
Beli
ze,
Flo
rida,
Pan
am
a,
Au
stra
lia,
New
Zeala
nd
Mass
bala
nce
Rm
,A
m,
Ag—
Fri
nge
337
5Lovelo
ck(2
008)
Beli
ze,
Flo
rida
Pan
am
a,
Au
stra
lia,
New
Zeala
nd
Mass
bala
nce
Rm
,A
m,
Ag—
Scr
ub
476
5Lovelo
ck(2
008)
Mayagu
ez,
Pu
ert
oR
ico
Soil
core
sR
m6
5000
(4000)4
Goll
ey
an
doth
ers
(1962)
Lan
eC
ove
Riv
er,
Au
stra
lia
Soil
core
sA
m6
14,7
30–16,0
30
2B
riggs
(1977)
Maja
na,
Cu
ba
Soil
core
sR
m—
Fri
nge
1710
(818)3
Fia
laan
dH
ern
an
dez
(1993)
Maja
na,
Cu
ba
Soil
core
sA
g—
Basi
n1080
(614)3
Fia
laan
dH
ern
an
dez
(1993)
Bri
sban
eR
iver,
Au
stra
lia
Soil
core
sA
m6
10,9
00–12,7
00
2M
ack
ey
(1993)
Haw
kesb
ury
Riv
er,
Au
stra
lia
Soil
core
sA
m6
4500–16,6
00
2Sain
tila
n(1
997a)
Haw
kesb
ury
Riv
er,
Au
stra
lia
Soil
core
sA
c63500–10,6
00
2Sain
tila
n(1
997a)
Mary
Riv
er,
Au
stra
lia
Soil
core
sA
m6
1500–6000
2Sain
tila
n(1
997b)
Mary
Riv
er,
Au
stra
lia
Soil
core
sA
c62500–8000
2Sain
tila
n(1
997b)
West
ern
Au
stra
lia
Soil
core
sA
m6
(1790)2
Alo
ngi
an
doth
ers
(2000)
1188 E. Castaneda-Moya and others
Tab
le4.
con
tin
ued
Loca
tion
Sam
pli
ng
meth
od:
Bio
mass
Sam
pli
ng
meth
od:
Pro
du
ctiv
ity
Dom
inan
t
speci
es:
Fore
stty
pe
Belo
wgro
un
d
bio
mass
(gm
-2)
Tota
l(fi
ne:
£2
mm
)
Belo
wgro
un
d
pro
du
ctiv
ity
(gm
-2
y-
1)
Tota
l
(fin
e:
£2
mm
)
Refe
ren
ce
West
ern
Au
stra
lia
Soil
core
sR
s6(5
030)2
Alo
ngi
an
doth
ers
(2000)
Sam
an
aB
ay,
Dom
inic
an
Repu
bli
cSoil
core
sR
m,
Lr6
6600
(790)3
Sh
erm
an
an
doth
ers
(2003)
Gazi
Bay,
Ken
ya
Soil
core
sR
mu
62490
2K
air
oan
doth
ers
(2008)
Gazi
Bay,
Ken
ya
Soil
core
sA
m6
3910
4Tam
ooh
an
doth
ers
(2008)
Gazi
Bay,
Ken
ya
Soil
core
sR
mu
63580
4Tam
ooh
an
doth
ers
(2008)
Gazi
Bay,
Ken
ya
Soil
core
sSa
64840
4Tam
ooh
an
doth
ers
(2008)
Pan
am
a,
Paci
fic
coast
Soil
pit
Rb
618,9
70
2G
oll
ey
an
doth
ers
(1975)
Hats
aik
hao,
Th
ail
an
dTre
nch
an
d
root
den
sity
model
Sa
617,1
80
(10,3
70)4
Kom
iyam
aan
doth
ers
(1987)
Hats
aik
hao,
Th
ail
an
dTre
nch
an
d
root
den
sity
model
Sa–B
g6
8480
(5630)4
Kom
iyam
aan
doth
ers
(1987)
Hats
aik
hao,
Th
ail
an
dTre
nch
an
d
root
den
sity
model
Bg
624,3
80
(1375)4
Kom
iyam
aan
doth
ers
(1987)
Hats
aik
hao,
Th
ail
an
dTre
nch
an
d
root
den
sity
model
Ra
650,9
50
(23,6
40)4
Kom
iyam
aan
doth
ers
(1987)
Th
ail
an
dTre
nch
an
d
root
den
sity
model
Ct6
8750
4K
om
iyam
aan
doth
ers
(2000)
Indon
esi
aTre
nch
Sa
63850
2K
om
iyam
aan
doth
ers
(1988)
Indon
esi
aTre
nch
Bg
619,6
10
2K
om
iyam
aan
doth
ers
(1988)
Indon
esi
aTre
nch
Ra
611,0
80
2K
om
iyam
aan
doth
ers
(1988)
Ag,
Avi
cen
nia
germ
inan
s;A
m,
Avi
cen
nia
mari
na;
Ac,
Aeg
icer
as
corn
icu
latu
m;
Bg,
Bru
guie
ragy
mn
orrh
iza;
Ce,
Con
ocarp
us
erec
tus;
Ct,
Cer
iops
taga
l;L
r,L
agu
ncu
lari
ara
cem
osa;
Ra,
Rh
izop
hor
aapic
ula
ta;
Rb,
Rh
izop
hor
abre
vist
yla;
Rm
,R
hiz
oph
ora
man
gle;
Rs,
Rh
izop
hor
ast
ylos
a;
Sa,
Son
ner
ati
aalb
a1R
oot
pro
du
ctio
nor
bio
mass
esti
mate
sfo
rsi
zecl
ass
es<
2to
<20
mm
india
met
er(t
oa
dep
thof
90
cm).
2R
oot
size
class
was
not
repor
ted.
Est
imate
sfo
rro
otbio
mass
are
repor
ted
for
the
top
30–60
cmof
man
grov
eso
ils.
3R
oot
pro
du
ctio
nor
bio
mass
esti
mate
sfo
rsi
zecl
ass
es<
2to
<20
mm
india
met
er(t
oa
dep
thof
30–50
cm).
4R
oot
bio
mass
esti
mate
sfo
rsi
zecl
ass
es<
40–50
mm
india
met
er(t
oa
dep
thof
60
cm).
5R
oot
pro
du
ctio
n(n
otdir
ect
esti
mate
s)w
as
calc
ula
ted
by
usi
ng
the
mass
bala
nce
appro
ach
ofR
aic
han
dN
adel
hof
fer
(1989).
6F
ores
tty
pe
was
not
repor
ted.
Mangrove Root Dynamics 1189

tile site in Shark River basin (SRS-6). Mangrove
forests in TS/Ph-6, in the more inland region of
Taylor basin, have the lowest forest productivity
and are the most P-limited (N:P = 109; Table 5)
compared to all other FCE sites (Castaneda 2010).
It was expected that root biomass allocation at
this site would be comparable to other Taylor
River sites. Yet, TS/Ph-6 had the lowest total root
biomass values compared to the other Taylor basin
sites (TS/Ph-7 and TS/Ph-8). Mangroves in TS/Ph-6
are young forests that recently colonized this region
and encroached inland approximately 1.5 km
from Florida Bay during the past 50 years (Ross
and others 2000). This encroachment trans-
formed previous freshwater wetlands dominated by
C. jamaicense- to brackish R. mangle-dominated
community. This mangrove succession in the upper
mangrove region of Taylor basin (TS/Ph-6) was
Figure 6. Variation in
root P content with soil
N:P ratios (A), shallow
fine root biomass (B) and
shallow fine root
productivity (C) with soil
P density, and fine root
turnover (D) with soil N:P
ratios in mangrove forests
of the Florida Everglades.
Standard parameters of
the linear regression
models are included.
Table 5. Comparison of Forest Structure (2001–2004), Aboveground Net Primary Productivity (ANPP:Lit-terfall + Wood Production; 2001–2004), Hydroperiod (2001–2006), and Soil Nutrients (to a depth of 45 cm;2000–2002) in Everglades Mangrove Forests
Sites Structure and productivity Hydroperiod Soil nutrients
Basal area
(m2 ha-1)
ANPP
(g m-2 y-1)
Flooding
duration
(h y-1)
Frequency of
inundation
(# tides y-1)
Total N
(mg cm-3)
Total P
(mg cm-3)
Atomic N:P
SRS-4 21.11 (1.3) 10911 (70) 3965 (163) 217 (16) 2.3 (0.12) 0.05 (0.004) 105 (6.2)
SRS-5 23.81 (1.6) 9731 (66) 4716 (168) 165 (7) 2.4 (0.10) 0.12 (0.006) 46 (3.5)
SRS-6 38.31 (1.8) 13981 (54) 5592 (433) 395 (70) 2.5 (0.30) 0.20 (0.009) 28 (1.3)
TS/Ph-6 – 3222 8566 (144) 12 (1) 1.7 (0.13) 0.03 (0.001) 109 (5.9)
TS/Ph-7 – 3782 8653 (150) 6 (2) 2.5 (0.19) 0.06 (0.004) 102 (5.8)
TS/Ph-8 1.21 (0.3) 3331 (24) 3541 (50) 48 (10) 2.4 (0.10) 0.10 (0.014) 66 (5.9)
Values are the mean (± 1 SE).1Data from Castaneda (2010).2Data from Ewe and others (2006).– Basal area was not calculated because mangrove tree heights <1.5 m.
1190 E. Castaneda-Moya and others
triggered by reductions in freshwater drainage into
this region along with a gradual increase in sea
level (Ross and others 2000). As a result, the
mangrove peat overlying marl at TS/Ph-6 is less
than 0.5 m depth, in contrast to peat depths greater
than 1 m at TS/Ph-7 and TS/Ph-8 (Ewe and others
2006). Hence, it appears that the age of soil for-
mation in this scrub forest growing in a P-limited
environment may be an additional variable in
comparing root biomass allocation among these
sites.
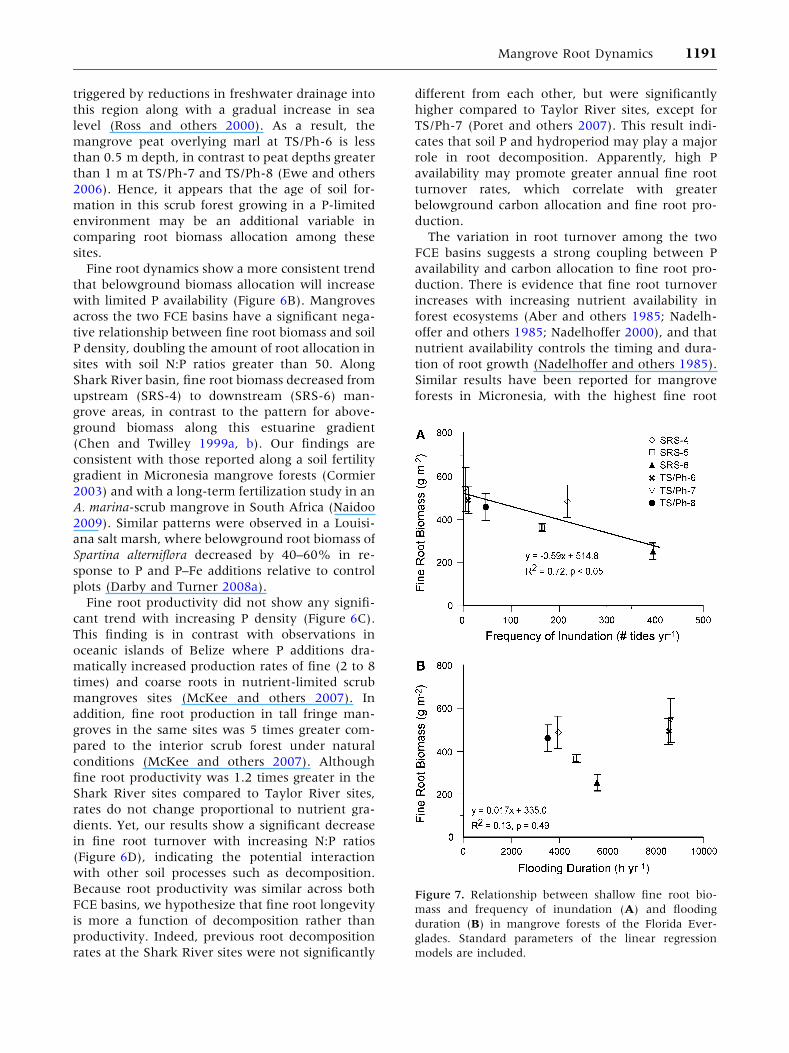
Fine root dynamics show a more consistent trend
that belowground biomass allocation will increase
with limited P availability (Figure 6B). Mangroves
across the two FCE basins have a significant nega-
tive relationship between fine root biomass and soil
P density, doubling the amount of root allocation in
sites with soil N:P ratios greater than 50. Along
Shark River basin, fine root biomass decreased from
upstream (SRS-4) to downstream (SRS-6) man-
grove areas, in contrast to the pattern for above-
ground biomass along this estuarine gradient
(Chen and Twilley 1999a, b). Our findings are
consistent with those reported along a soil fertility
gradient in Micronesia mangrove forests (Cormier
2003) and with a long-term fertilization study in an
A. marina-scrub mangrove in South Africa (Naidoo
2009). Similar patterns were observed in a Louisi-
ana salt marsh, where belowground root biomass of
Spartina alterniflora decreased by 40–60% in re-
sponse to P and P–Fe additions relative to control
plots (Darby and Turner 2008a).
Fine root productivity did not show any signifi-
cant trend with increasing P density (Figure 6C).
This finding is in contrast with observations in
oceanic islands of Belize where P additions dra-
matically increased production rates of fine (2 to 8
times) and coarse roots in nutrient-limited scrub
mangroves sites (McKee and others 2007). In
addition, fine root production in tall fringe man-
groves in the same sites was 5 times greater com-
pared to the interior scrub forest under natural
conditions (McKee and others 2007). Although
fine root productivity was 1.2 times greater in the
Shark River sites compared to Taylor River sites,
rates do not change proportional to nutrient gra-
dients. Yet, our results show a significant decrease
in fine root turnover with increasing N:P ratios
(Figure 6D), indicating the potential interaction
with other soil processes such as decomposition.
Because root productivity was similar across both
FCE basins, we hypothesize that fine root longevity
is more a function of decomposition rather than
productivity. Indeed, previous root decomposition
rates at the Shark River sites were not significantly
different from each other, but were significantly
higher compared to Taylor River sites, except for
TS/Ph-7 (Poret and others 2007). This result indi-
cates that soil P and hydroperiod may play a major
role in root decomposition. Apparently, high P
availability may promote greater annual fine root
turnover rates, which correlate with greater
belowground carbon allocation and fine root pro-
duction.
The variation in root turnover among the two
FCE basins suggests a strong coupling between P
availability and carbon allocation to fine root pro-
duction. There is evidence that fine root turnover
increases with increasing nutrient availability in
forest ecosystems (Aber and others 1985; Nadelh-
offer and others 1985; Nadelhoffer 2000), and that
nutrient availability controls the timing and dura-
tion of root growth (Nadelhoffer and others 1985).
Similar results have been reported for mangrove
forests in Micronesia, with the highest fine root
Figure 7. Relationship between shallow fine root bio-
mass and frequency of inundation (A) and flooding
duration (B) in mangrove forests of the Florida Ever-
glades. Standard parameters of the linear regression
models are included.
Mangrove Root Dynamics 1191

turnover in the most fertile (soil N:P < 15) site,
and the lowest rates at the nutrient limiting sites
with soil N:P greater than 45 (Cormier 2003). Thus,
the greater longevity of fine roots in the lower
fertility sites could reflect a physiological adapta-
tion of mangroves to nutrient-poor environments
(Nadelhoffer and others 1985).
Turnover rates of coarse roots in our mangrove
sites are lower compared to those of fine roots,
indicating that root longevity increases with larger
size class distribution, as in the case of terrestrial
forests (Table 3; Gill and Jackson 2000). Coarse
roots function as storage and structural support
(Eissenstat and Yanai 1997). In contrast, fine roots
have lower longevity due to their greater metabolic
activity (that is, respiration, high nutrient content)
and higher energy requirements (Eissenstat and
Yanai 1997; Norby and Jackson 2000). Turnover
rates of fine roots (0.23–0.60 y-1) observed in our
study are higher than those reported for mangrove
forests in Micronesia (Cormier 2003) and Florida
(Giraldo 2005), and considerably lower than rates
(range: 0.5–1.2 y-1) measured in terrestrial forests
(Burton and others 2000; Gill and Jackson 2000).
Because our study is the first to report contempo-
rary turnover and longevity rates for both small
and coarse roots, it is difficult to extrapolate the
contributing role of these size classes in total root
productivity patterns in other mangrove regions.
Nonetheless, this information will certainly help to
determine the relative importance and interaction
of biological and environmental variables when
assessing soil carbon storage in neotropical man-
grove forests.
Few studies have documented the effect of
hydroperiod on changes in biomass allocation in
mangroves (Krauss and others 2008). Our results
show that shallow fine root biomass correlated
negatively with frequency of inundation (Fig-
ure 7A), suggesting that higher tidal frequency at
the Shark River sites decreases root biomass allo-
cation due to less soil reducing conditions and
higher supply of P with tidal input (Krauss and
others 2006; Castaneda 2010). In fact, sulfide
concentrations in the Taylor River sites were sig-
nificantly higher (range: 0.86–1.6 mM) compared
to Shark River sites (range: 0.01–0.14 mM; Man-
cera-Pineda and others 2009; Castaneda 2010),
underscoring the regulatory effect of hydroperiod
on root biomass allocation patterns (Krauss and
others 2006). Sulfide concentrations have also been
considered an important factor in determining
carbon isotope discrimination between Shark River
and Taylor River mangrove sites (Mancera-Pineda
and others 2009). In addition, a previous study in
our mangrove sites suggests that root:shoot ratios
increase with increasing sulfide concentrations
(r2 = 0.73, P < 0.05; Castaneda 2010), and that
most of the variation (38–49%) in forest structure
(that is, basal area and wood biomass) and pro-
ductivity (that is, wood and litterfall production)
can be explained by changes in sulfide concentra-
tions (Castaneda 2010). Accordingly, the interac-
tion between hydroperiod and P availability
explains the higher fine root biomass and lower
fine root production of scrub mangroves in the
Everglades and in other neotropical scrub forests, as
a result of higher soil stress conditions (McKee
2001; McKee and others 2007).
Although fine root biomass was not correlated
with flood duration in our study (Figure 7B), pat-
terns in root biomass allocation can be associated
with the competitive ability of mangrove species
and their tolerance limit to flooding (Ball 1996;
Cardona-Olarte and others 2006; Krauss and others
2006). The lower P fertility (N:P = 102 to 109;
Table 5) and permanent flooding (�8600 h y-1;
Table 5) conditions in Taylor River basin (TS/Ph-6
and TS/Ph-7) compared to Shark River basin may
explain why R. mangle is the dominant species
(Koch 1997). Due to higher flooding tolerance, this
species out-competes L. racemosa and A. germinans,
which are generally restricted to flooding duration
regimes less than 50% of the year (Koch 1996;
Cardona-Olarte and others 2006). In contrast,
moderate hydroperiods (range: 4000–5600 h y-1;
Table 5) in Shark River sites allow the co-existence
of all three mangrove species, where L. racemosa is
the dominant species in the more fertile site (SRS-
6) and R. mangle dominates in the upstream
P-limited sites (SRS-4 and SRS-5; Chen and Twilley
1998, 1999b; Krauss and others 2006). Thus, the
lack of correlation between fine root biomass and
flood duration is not surprising because the com-
petitive ability of mangrove species and the mor-
phological adaptations to cope with soil stress
conditions determine species-specific biomass allo-
cation and spatial distribution patterns (Krauss and
others 2006).
Our findings provide evidence that stress condi-
tions coupled to mangrove species site-specific life
history traits are predictably related to habitat sta-
bility and productivity, and determine the degree of
plasticity in belowground allocation (Schlichting
1986). Thus, we conclude that mangroves in
nutrient-poor sites with long duration of flooding
and restricted tidal influence produce roots with
greater longevity as a mechanism to enhance
nutrient conservation. In contrast, sites with higher
nutrient content and tidal regimes produce short-
1192 E. Castaneda-Moya and others

lived roots with high nutrient uptake, rapid growth
rates, and higher turnover. These tradeoffs are
indicative of the strong link between belowground
processes and the phenotypic plasticity of man-
grove roots in response to the interactions among
gradients in nutrients, regulators, and hydroperiod
across the FCE landscape. These belowground
allocation patterns are ecologically significant given
that fine root production and organic matter
accumulation are the primary processes controlling
soil formation in scrub mangrove forests [for
example, Belize, McKee and others (2007)]. Thus,
the feedback of environmental gradients on man-
grove root dynamics in south Florida could have
tremendous implications as to how soil formation
and accretion serve as adaptations of mangroves to
future impacts from sea-level rise throughout the
Gulf of Mexico and the Caribbean region.
ACKNOWLEDGMENTS
This research was conducted as part of the Florida
Coastal Everglades Long-Term Ecological Research
(FCE-LTER) program funded by the National Sci-
ence Foundation (Grants #DBI-0620409 and
#DEB-9910514). We would like to thank Matthew
Heels, Leander J. Lavergne, Kim de Mutsert, and
Leigh Anne Sharp for laboratory assistance. Special
thanks to the Florida Bay Interagency Science
Center-Everglades National Park for logistic sup-
port during the study. The authors thank three
anonymous reviewers for constructive comments
on earlier versions of this manuscript.
REFERENCES
Aber JD, Melillo JM, Nadelhoffer KJ, McClaugherty CA, Pastor
J. 1985. Fine root turnover in forest ecosystems in relation to
quantity and form of nitrogen availability: a comparison of
two methods. Oecologia 66:317–21.
Alongi DM, Tirendi F, Clough BF. 2000. Below-ground decom-
position of organic matter in forests of the mangroves Rhizo-
phora stylosa and Avicennia marina along the arid coast of
Western Australia. Aquat Bot 68:97–122.
Aspila KI, Agemian H, Chau SY. 1976. A semi-automated
method for the determination of inorganic, organic and total
phosphate in sediments. Analyst 101:187–97.
Ball MC. 1996. Comparative ecophysiology of mangrove forests
and tropical lowland moist rainforest. In: Mulkey SS, Chazdon
RL, Smith AP, Eds. Tropical forest plant ecophysiology. New
York: Chapman and Hall. p 461–96.
Bazzaz FA. 1997. Allocation of resources in plants: state of the
science and critical questions. In: Bazzaz FA, Grace J, Eds.
Plant resource allocation. San Diego (CA): Academic Press.
p 1–37.
Bouillon S, Borges AV, Castaneda-Moya E, Diele K, Dittmar T,
Duke NC, Kristensen E, Lee SY, Marchand C, Middleburg JJ,
Rivera-Monroy V, Smith TJI, Twilley RR. 2008. Mangrove
production and carbon sinks: a revision of global budget
estimates. Global Biogeochem Cycles 22:GB2013.
doi:10.1029/2007GB003052.
Briggs SV. 1977. Estimates of biomass in a temperate mangrove
community. Aust J Ecol 2:369–73.
Burton AJ, Pregitzer KS, Hendrick RL. 2000. Relationships be-
tween fine root dynamics and nitrogen availability in Michi-
gan northern hardwood forests. Oecologia 125:389–99.
Cahoon DR, Hensel P, Rybczyk J, McKee KL, Proffitt E, Perez BC.
2003. Mass tree mortality leads to mangrove peat collapse at Bay
Islands, Honduras after Hurricane Mitch. J Ecol 91:1093–105.
Cardona-Olarte P, Twilley RR, Krauss KW, Rivera-Monroy VH.
2006. Responses of neotropical mangrove seedlings grown in
monoculture and mixed culture under treatments of hydro-
period and salinity. Hydrobiologia 569:325–41.
Castaneda E. 2010. Landscape patterns of community structure,
biomass and net primary productivity of mangrove forests in
the Florida Coastal Everglades as a function of resources,
regulators, hydroperiod, and hurricane disturbance. Ph.D.
Dissertation. Louisiana State University, Baton Rouge, LA.
Castaneda-Moya E, Rivera-Monroy VH, Twilley RR. 2006.
Mangrove zonation in the dry life zone of the Gulf of Fonseca,
Honduras. Estuaries Coasts 29:751–64.
Castaneda-Moya E, Twilley RR, Rivera-Monroy VH, Zhang K,
Davis SEIII, Ross M. 2010. Sediment and nutrient deposition
associated with Hurricane Wilma in mangroves of the Florida
Coastal Everglades. Estuaries Coasts 33:45–58.
Chapin FSI. 1980. The mineral nutrition of wild plants. Annu
Rev Ecol Syst 11:233–60.
Chapin FSI, Bloom AJ, Field CB, Waring RH. 1987. Plant re-
sponses to multiple environmental factors. Bioscience
37:49–57.
Chen R, Twilley RR. 1998. A gap dynamic model of mangrove
forest development along gradients of soil salinity and nutri-
ent resources. J Ecol 86:1–12.
Chen R, Twilley RR. 1999a. A simulation model of organic
matter and nutrient accumulation in mangrove wetland soils.
Biogeochemistry 44:93–118.
Chen R, Twilley RR. 1999b. Patterns of mangrove forest struc-
ture and soil nutrient dynamics along the Shark River Estu-
ary, Florida. Estuaries 22:955–70.
Childers DL. 2006. A synthesis of long-term research by the
Florida Coastal Everglades LTER Program. Hydrobiologia
569:531–44.
Chmura GL, Anisfeld SC, Cahoon DR, Lynch JC. 2003. Global
carbon sequestration in tidal, saline wetland soils. Global
Biogeochem Cycles 17:1111. doi:10.029/2002GB001917.
Clark DA, Brown S, Kicklighter DW, Chambers JQ, Thomlinson
JR, Ni J. 2001. Measuring net primary production in forests:
concepts and field methods. Ecol Appl 11:356–70.
Cormier N. 2003. Belowground productivity in mangrove forests
of Pohnpei and Kosrae, Federal States of Micronesia. M.S.
Thesis. Biology Department, Lafayette, LA, 99 p.
Darby FA, Turner RE. 2008a. Below- and aboveground biomass
of Spartina alterniflora: response to nutrient addition in a
Louisiana salt marsh. Estuaries Coasts 31:326–34.
Darby FA, Turner RE. 2008b. Below- and aboveground Spartina
alterniflora production in a Louisiana salt marsh. Estuaries
Coasts 31:223–31.
Davis SEI, Cable JE, Childers DL, Coronado-Molina C, Day JWJ,
Huttle CD, Madden CJ, Reyes E, Rudnick D, Sklar F. 2004.
Importance of storm events in controlling ecosystem structure
Mangrove Root Dynamics 1193
and function in a Florida Gulf coast estuary. J Coastal Res
20:1198–208.
Eissenstat DM, Wells CE, Yanai RD, Whitbeck JL. 2000. Building
roots in a changing environment: implications for root lon-
gevity. New Phytol 147:33–42.
Eissenstat DM, Yanai RD. 1997. The ecology of root lifespan. Adv
Ecol Res 27:1–60.
Ewe SML, Sternberg LdaSL, Childers DL. 2007. Seasonal plant
water uptake patterns in the saline southeast Everglades
ecotone. Oecologia 152:607–16.
Ewe SML, Gaiser EE, Childers DL, Iwaniec D, Rivera-Monroy V,
Twilley RR. 2006. Spatial and temporal patterns of above-
ground net primary productivity (ANPP) along two freshwa-
ter-estuarine transects in the Florida Coastal Everglades.
Hydrobiologia 569:459–74.
Feller IC, Lovelock CE, McKee KL. 2007. Nutrient addition dif-
ferentially affects ecological processes of Avicennia germinans in
nitrogen versus phosphorus limited mangrove ecosystems.
Ecosystems 10:347–59.
Feller IC, McKee KL, Whigham DF, O’Neill JP. 2003a. Nitrogen
vs. phosphorus limitation across an ecotonal gradient in a
mangrove forest. Biogeochemistry 62:145–75.
Feller IC, Whigham DF, McKee KL, Lovelock CE. 2003b.
Nitrogen limitation of growth and nutrient dynamics in a
disturbed mangrove forest, Indian River Lagoon, Florida.
Oecologia 134:405–14.
Fiala K, Hernandez L. 1993. Root biomass of a mangrove forest in
southwestern Cuba (Majana). Ekologia (Bratislava) 12:15–30.
Fourqurean JW, Zieman JC, Powell GVN. 1992. Phosphorus
limitation of primary production in Florida Bay: evidence
from C:N:P ratios of the dominant seagrass Thalassia testudi-
num. Limnol Oceanogr 37:162–71.
Gill RA, Jackson RB. 2000. Global patterns of root turnover for
terrestrial ecosystems. New Phytol 147:13–31.
Giraldo B. 2005. Belowground productivity of mangrove forests
in southwest Florida. Ph.D. Dissertation. Louisiana State
University, Baton Rouge, LA.
Gleason SM, Ewel KC. 2002. Organic matter dynamics on the
forest floor of a Micronesian mangrove forest: an investigation
of species composition shifts. Biotropica 34:190–8.
Gleeson SK, Tilman D. 1992. Plant allocation and the multiple
limitation hypothesis. Am Nat 139:1322–43.
Golley F, Odum HT, Wilson RF. 1962. The structure and
metabolism of a Puerto Rican red mangrove forest in May.
Ecology 43:9–19.
Golley FB, McGinnis JT, Clements RG, Child GI, Duever MJ.
1975. Mineral cycling in a tropical moist forest ecosystem.
Athens, GA: University of Georgia Press.
Herbert DA, Fourqurean JW. 2009. Phosphorus availability and
salinity control productivity and demography of the seagrass
Thalassia testudinum in Florida Bay. Estuaries Coasts 32:2
188–201.
Jackson RB, Mooney HA, Schulze ED. 1997. A global budget for
fine root biomass, surface area, and nutrient contents. Proc
Natl Acad Sciences USA 94:7362–6.
Kairo JG, Lang’at JKS, Dahdouh-Guebas F, Bosire J, Karachi M.
2008. Structural development and productivity of replanted
mangrove plantations in Kenya. For Ecol Manag 255:2670–7.
Kenward M, Roger J. 1997. Small sample inference for fixed
effects from restricted maximum likelihood. Biometrics
53:983–97.
Khan MNI, Suwa R, Hagihara A. 2007. Carbon and nitrogen
pools in a mangrove stand of Kandelia obovata (S., L.) Yong:
vertical distribution in the soil-vegetation system. Wetlands
Ecol Manage 15:141–53.
Koch MS. 1997. Rhizophora mangle L. seedling development into
the sapling stage across resource and stress gradients in sub-
tropical Florida. Biotropica 29:427–39.
Koch MS. 1996. Resource availability and abiotic effects on
Rhizophora mangle L. (Red Mangrove) development in South
Florida. Ph.D. Dissertation, Biology, Coral Gables, Miami.
Koerselman W, Meuleman AFM. 1996. The vegetation N:P ratio:
a new tool to detect the nature of nutrient limitation. J Appl
Ecol 33:1441–50.
Komiyama A, Havanond S, Srisawatt W, Mochida Y, Fujimoto
K, Ohnishi T, Ishihara S, Miyagi T. 2000. Top/root biomass
ratio of a secondary mangrove (Ceriops tagal (Perr.) C.B. Rob.)
forest. For Ecol Manag 139:127–34.
Komiyama A, Moriya H, Suhardjono H, Toma T, Ogino K. 1988.
Forest as an ecosystem, its structure and function. In: Ogino
K, Chihara M, Eds. Biological systems of mangroves. Ehime:
Ehime University. p 85–151.
Komiyama A, Ogino K, Aksornkoae S, Sabhasri S. 1987. Root
biomass of a mangrove forest in southern Thailand. 1. Esti-
mation by the trench method and the zonal structure of root
biomass. J Trop Ecol 3:97–108.
Krauss KW, Lovelock CE, McKee KL, Lopez-Hoffman L, Ewe
SML, Sousa WP. 2008. Environmental drivers in mangrove
establishment and early development: a review. Aquat Bot
89:105–27.
Krauss KW, Doyle TW, Twilley RR, Rivera-Monroy V, Sullivan
JK. 2006. Evaluating the relative contributions of hydroperiod
and soil fertility on growth of south Florida mangroves.
Hydrobiologia 569:311–24.
Lodge TE. 2005. The Everglades handbook: understanding the
ecosystem. Boca Raton (FL): CRC Press.
Lovelock CE. 2008. Soil respiration and belowground carbon
allocation in mangrove forests. Ecosystems 11:342–54.
Lovelock CE, Feller IC, McKee KL, Engelbrecht BM, Ball MC.
2004. The effect of nutrient enrichment on growth, photo-
synthesis and hydraulic conductance of dwarf mangroves in
Panama. Funct Ecol 18:25–33.
Lugo AE. 1990. Fringe wetlands. In: Lugo AE, Brinson M, Brown
S, Eds. Ecosystems of the World 15, Forested Wetlands.
Amsterdam: Elsevier. p 143–69.
Lugo AE, Snedaker SC. 1974. The ecology of mangroves. Annu
Rev Ecol Syst 5:39–64.
Mackey AP. 1993. Biomass of the mangrove Avicennia marina
(Forsk.) Vierh. near Brisbane, south-eastern Queensland.
Aust J Mar Freshw Res 44:721–5.
Mancera Pineda JE, Twilley RR, Rivera-Monroy VH. 2009.
Carbon (d13C) and nitrogen (d15N) isotopic discrimination in
mangroves in Florida Coastal Everglades as a function of
environmental stress. Contrib Mar Sci 38:109–29.
McKee KL. 2001. Root proliferation in decaying roots and old
root channels: a nutrient conservation mechanism in oligo-
trophic mangrove forests? J Ecol 89:876–87.
McKee KL, Cahoon DR, Feller IC. 2007. Caribbean mangroves
adjust to rising sea level through biotic controls on change in
soil elevation. Glob Ecol Biogeogr 16:545–56.
McKee KL, Faulkner P. 2000. Restoration of biogeochemical
function in mangrove forests. Restor Ecol 8:247–59.
1194 E. Castaneda-Moya and others

Middleton BA, McKee KL. 2001. Degradation of mangrove tis-
sues and implications for peat formation in Belizean island
forests. J Ecol 89:818–28.
Nadelhoffer KJ. 2000. The potential effects of nitrogen deposi-
tion on fine-root production in forest ecosystems. New Phytol
147:131–9.
Nadelhoffer KJ, Aber JD, Melillo JM. 1985. Fine roots, net pri-
mary production, and soil nitrogen availability: a new
hypothesis. Ecology 66:1377–90.
Nadelhoffer KJ, Raich JW. 1992. Fine root production estimates
and belowground carbon allocation in forest ecosystems.
Ecology 73:1139–47.
Naidoo G. 2009. Differential effects of nitrogen and phosphorus
enrichment on growth of dwarf Avicennia marina mangroves.
Aquat Bot 90:184–90.
Norby RJ, Jackson RB. 2000. Root dynamics and global change:
seeking an ecosystem perspective. New Phytol 147:3–12.
Ostertag R. 2001. Effects of nitrogen and phosphorus availability
on fine-root dynamics in Hawaiian montane forests. Ecology
82:485–99.
Poret N, Twilley RR, Rivera-Monroy VH, Coronado-Molina C.
2007. Belowground decomposition of mangrove roots in
Florida Coastal Everglades. Estuaries Coasts 30:1–6.
Raich JW, Nadelhoffer KJ. 1989. Belowground carbon allocation
in forest ecosystems: global trends. Ecology 70:1346–54.
Rivera-Monroy V, Twilley RR, Davis SEIII, Childers DL, Simard
M, Chambers JQ, Jaffe R, Boyer JN, Rudnick DT, Zhang K,
Castaneda-Moya E, Ewe SML, Price RM, Coronado-Molina C,
Ross M, Smith TJI, Michot B, Meselhe E, Nuttle W, Troxler
TG, Noe G. 2011. The role of the Everglades Mangrove Eco-
tone Region (EMER) in regulating nutrient cycling and wet-
land productivity in south Florida. Crit Rev Environ Sci
Technol 41:633–69.
Robertson AI, Dixon P. 1993. Separating live and dead fine roots
using colloidal silica: an example from mangrove forests. Plant
Soil 157:151–4.
Ross MS, Meeder JF, Sah JP, Ruiz PL, Telesnicki GJ. 2000. The
southeast saline Everglades revisited: 50 years of coastal veg-
etation change. J Veg Sci 11:101–12.
Ruess RW, Hendrick RL, Burton AJ, Pregitzer KS, Sveinbjorns-
son B, Allen MF, Maurer GE. 2003. Coupling fine root
dynamics with ecosystem carbon cycling in black spruce for-
ests of interior Alaska. Ecol Monogr 73:643–62.
Saintilan N. 1997a. Above- and below-ground biomasses of two
species of mangrove on the Hawkesbury River estuary, New
South Wales. Mar Freshw Res 48:147–52.
Saintilan N. 1997b. Above- and below-ground biomass of
mangroves in a sub-tropical estuary. Mar Freshw Res
48:601–4.
Santantonio D, Hermann RK, Overton WS. 1977. Root biomass
studies in forest ecosystems. Pedobiologia 17:1–31.
Schlichting CD. 1986. The evolution of phenotypic plasticity in
plants. Annu Rev Ecol Syst 17:667–93.
Sherman RE, Fahey TJ, Martinez P. 2003. Spatial patterns of
biomass and aboveground net primary productivity in a
mangrove ecosystem in the Dominican Republic. Ecosystems
6:384–98.
Simard M, Zhang K, Rivera-Monroy V, Ross MS, Ruiz PL,
Castaneda-Moya E, Twilley RR, Rodriguez E. 2006. Mapping
height and biomass of mangrove forests in Everglades
National Park with SRTM elevation data. Photogramm Eng
Remote Sens 72:299–311.
Sutula M. 1999. Processes controlling nutrient transport in the
southeastern Everglades wetlands. Ph.D. Dissertation. Louisi-
ana State University, Baton Rouge.
Tamooh F, Huxham M, Karachi M, Mencuccini M, Kairo JG,
Kirui B. 2008. Below-ground root yield and distribution in
natural and replanted mangrove forests at Gazi bay, Kenya.
For Ecol Manag 256:1290–7.
Tilman D. 1985. The resource-ratio hypothesis of plant succes-
sion. Am Nat 125:827–52.
Turner RE, Swenson EM, Milan CS, Lee JM, Oswald TA. 2004.
Below-ground biomass in healthy and impaired salt marshes.
Ecol Res 19:29–35.
Twilley RR, Lugo AE, Patterson-Zucca C. 1986. Litter production
and turnover in basin mangrove forests in southwest Florida.
Ecology 67:670–83.
Twilley RR, Rivera-Monroy V. 2005. Developing performance
measures of mangrove wetlands using simulation models of
hydrology, nutrient biogeochemistry, and community
dynamics. J Coastal Res 40:79–93.
Twilley RR, Rivera-Monroy V. 2009. Ecogeomorphic models of
nutrient biogeochemistry for mangrove wetlands. In: Perillo
GME, Wolanski E, Cahoon DR, Brinson MM, Eds. Coastal
wetlands: an integrated ecosystem approach. Amsterdam:
Elsevier. p 641–83.
Verhoeven JTA, Koerselman W, Meuleman AFM. 1996. Nitro-
gen- or phosphorus-limited growth in herbaceous, wet vege-
tation: relations with atmospheric inputs and management
regimes. TREE 11:494–7.
Vogt KA, Vogt DJ, Bloomfield J. 1998. Analysis of some direct
and indirect methods for estimating root biomass and pro-
duction of forests at an ecosystem level. Plant Soil 200:71–89.
Mangrove Root Dynamics 1195