Patterns of Epigenetic Diversity in Two Sympatric Fish Species
18
genes G C A T T A C G G C A T Article Patterns of Epigenetic Diversity in Two Sympatric Fish Species: Genetic vs. Environmental Determinants Laura Fargeot 1, * ,Géraldine Loot 2,3 ,Jérôme G. Prunier 1 , Olivier Rey 4 , Charlotte Veyssière 2 and Simon Blanchet 1,2, * Citation: Fargeot, L.; Loot, G.; Prunier, J.G.; Rey, O.; Veyssière, C.; Blanchet, S. Patterns of Epigenetic Diversity in Two Sympatric Fish Species: Genetic vs. Environmental Determinants. Genes 2021, 12, 107. https://doi.org/10.3390/ genes12010107 Received: 17 December 2020 Accepted: 13 January 2021 Published: 16 January 2021 Publisher’s Note: MDPI stays neutral with regard to jurisdictional claims in published maps and institutional affil- iations. Copyright: © 2021 by the authors. Licensee MDPI, Basel, Switzerland. This article is an open access article distributed under the terms and conditions of the Creative Commons Attribution (CC BY) license (https:// creativecommons.org/licenses/by/ 4.0/). 1 Centre National de la Recherche Scientifique (CNRS), Université Paul Sabatier (UPS), Station d’Ecologie Théorique et Expérimentale, UMR 5321, F-09200 Moulis, France; [email protected] 2 CNRS, UPS, École Nationale de Formation Agronomique (ENFA), UMR 5174 EDB (Laboratoire Évolution & Diversité Biologique), 118 route de Narbonne, F-31062 Toulouse CEDEX 4, France; [email protected] (G.L.); [email protected] (C.V.) 3 Université Paul Sabatier (UPS), Institut Universitaire de France (IUF), F-75231 Paris CEDEX 05, France 4 CNRS, Interaction Hôtes-Parasites-Environnements (IHPE), UMR 5244, F-66860 Perpignan, France; [email protected] * Correspondence: [email protected] (L.F.); [email protected] (S.B.); Tel.: +33-561040361 (S.B.) Abstract: Epigenetic components are hypothesized to be sensitive to the environment, which should permit species to adapt to environmental changes. In wild populations, epigenetic variation should therefore be mainly driven by environmental variation. Here, we tested whether epigenetic variation (DNA methylation) observed in wild populations is related to their genetic background, and/or to the local environment. Focusing on two sympatric freshwater fish species (Gobio occitaniae and Phoxinus phoxinus), we tested the relationships between epigenetic differentiation, genetic differentiation (using microsatellite and single nucleotide polymorphism (SNP) markers), and environmental distances between sites. We identify positive relationships between pairwise genetic and epigenetic distances in both species. Moreover, epigenetic marks better discriminated populations than genetic markers, especially in G. occitaniae. In G. occitaniae, both pairwise epigenetic and genetic distances were significantly associated to environmental distances between sites. Nonetheless, when controlling for genetic differentiation, the link between epigenetic differentiation and environmental distances was not significant anymore, indicating a noncausal relationship. Our results suggest that fish epigenetic variation is mainly genetically determined and that the environment weakly contributed to epigenetic variation. We advocate the need to control for the genetic background of populations when inferring causal links between epigenetic variation and environmental heterogeneity in wild populations. Keywords: genetic structure; empirical comparative study; DNA methylation; nongenetic heredity; population genomics; freshwater 1. Introduction Describing and understanding spatial patterns of intraspecific diversity in natural populations constitutes the basis for predicting the evolutionary dynamics of populations. So far, most studies have focused on spatial patterns of intraspecific genetic diversity [1,2], using neutral and/or nonneutral (or adaptive) molecular markers. Neutral markers are influenced by mutation, drift and gene flow, and are not directly associated to individual fitness. Nonneutral markers are influenced not only by the same processes but also by natural selection associated to the surrounding environment; they are hence associated to the fitness and adaptation of organisms [3]. Recently, there has been an increasing interest in documenting the distribution of intraspecific epigenetic diversity in wild populations because it may also have a role in adaptive potential of organisms [4]. Epigenetic variation is a major potential source of adaptive variation since it can be directly sensitive to the en- vironment and transmitted across generations [5–7]. In particular, epigenetic variation may Genes 2021, 12, 107. https://doi.org/10.3390/genes12010107 https://www.mdpi.com/journal/genes
-
Upload
khangminh22 -
Category
Documents
-
view
9 -
download
0
Transcript of Patterns of Epigenetic Diversity in Two Sympatric Fish Species
genesG C A T
T A C G
G C A T
Article
Patterns of Epigenetic Diversity in Two Sympatric Fish Species:Genetic vs. Environmental Determinants
Laura Fargeot 1,* , Géraldine Loot 2,3, Jérôme G. Prunier 1 , Olivier Rey 4 , Charlotte Veyssière 2 andSimon Blanchet 1,2,*
�����������������
Citation: Fargeot, L.; Loot, G.;
Prunier, J.G.; Rey, O.; Veyssière, C.;
Blanchet, S. Patterns of Epigenetic
Diversity in Two Sympatric Fish
Species: Genetic vs. Environmental
Determinants. Genes 2021, 12, 107.
https://doi.org/10.3390/
genes12010107
Received: 17 December 2020
Accepted: 13 January 2021
Published: 16 January 2021
Publisher’s Note: MDPI stays neutral
with regard to jurisdictional claims in
published maps and institutional affil-
iations.
Copyright: © 2021 by the authors.
Licensee MDPI, Basel, Switzerland.
This article is an open access article
distributed under the terms and
conditions of the Creative Commons
Attribution (CC BY) license (https://
creativecommons.org/licenses/by/
4.0/).
1 Centre National de la Recherche Scientifique (CNRS), Université Paul Sabatier (UPS), Station d’EcologieThéorique et Expérimentale, UMR 5321, F-09200 Moulis, France; [email protected]
2 CNRS, UPS, École Nationale de Formation Agronomique (ENFA), UMR 5174 EDB (Laboratoire Évolution &Diversité Biologique), 118 route de Narbonne, F-31062 Toulouse CEDEX 4, France;[email protected] (G.L.); [email protected] (C.V.)
3 Université Paul Sabatier (UPS), Institut Universitaire de France (IUF), F-75231 Paris CEDEX 05, France4 CNRS, Interaction Hôtes-Parasites-Environnements (IHPE), UMR 5244, F-66860 Perpignan, France;
[email protected]* Correspondence: [email protected] (L.F.); [email protected] (S.B.); Tel.: +33-561040361 (S.B.)
Abstract: Epigenetic components are hypothesized to be sensitive to the environment, which shouldpermit species to adapt to environmental changes. In wild populations, epigenetic variation shouldtherefore be mainly driven by environmental variation. Here, we tested whether epigenetic variation(DNA methylation) observed in wild populations is related to their genetic background, and/or to thelocal environment. Focusing on two sympatric freshwater fish species (Gobio occitaniae and Phoxinusphoxinus), we tested the relationships between epigenetic differentiation, genetic differentiation (usingmicrosatellite and single nucleotide polymorphism (SNP) markers), and environmental distancesbetween sites. We identify positive relationships between pairwise genetic and epigenetic distancesin both species. Moreover, epigenetic marks better discriminated populations than genetic markers,especially in G. occitaniae. In G. occitaniae, both pairwise epigenetic and genetic distances weresignificantly associated to environmental distances between sites. Nonetheless, when controlling forgenetic differentiation, the link between epigenetic differentiation and environmental distances wasnot significant anymore, indicating a noncausal relationship. Our results suggest that fish epigeneticvariation is mainly genetically determined and that the environment weakly contributed to epigeneticvariation. We advocate the need to control for the genetic background of populations when inferringcausal links between epigenetic variation and environmental heterogeneity in wild populations.
Keywords: genetic structure; empirical comparative study; DNA methylation; nongenetic heredity;population genomics; freshwater
1. Introduction
Describing and understanding spatial patterns of intraspecific diversity in naturalpopulations constitutes the basis for predicting the evolutionary dynamics of populations.So far, most studies have focused on spatial patterns of intraspecific genetic diversity [1,2],using neutral and/or nonneutral (or adaptive) molecular markers. Neutral markers areinfluenced by mutation, drift and gene flow, and are not directly associated to individualfitness. Nonneutral markers are influenced not only by the same processes but also bynatural selection associated to the surrounding environment; they are hence associated tothe fitness and adaptation of organisms [3]. Recently, there has been an increasing interestin documenting the distribution of intraspecific epigenetic diversity in wild populationsbecause it may also have a role in adaptive potential of organisms [4]. Epigenetic variationis a major potential source of adaptive variation since it can be directly sensitive to the en-vironment and transmitted across generations [5–7]. In particular, epigenetic variation may
Genes 2021, 12, 107. https://doi.org/10.3390/genes12010107 https://www.mdpi.com/journal/genes

Genes 2021, 12, 107 2 of 18
allow for the rapid adaptation of populations to changing environments, at a pace actuallyhigher than adaptation by natural selection on standing genetic variation [5,8–11]. In thiscontext, an important question concerns the spatial covariation that may exist betweengenetic and epigenetic diversity patterns in natural populations, i.e., whether genetic andepigenetic variants follow similar spatial patterns across landscapes or not. Answeringthis question allows testing whether these two markers carry distinct/complementarypieces of information, and speculating about their relative roles in the adaptive potential oforganisms across spatial scales. This question is not trivial, as the inherent characteristicsof genetic and epigenetic marks can lead to opposite predictions regarding the spatialcovariation of epigenetic and genetic diversity patterns.
On the one side, some epigenetic marks are directly sensitive to external environmentalcues (epimutations can be triggered by the surrounding environment at a lifetime scale),which may lead to uncorrelated genetic and epigenetic diversity patterns since geneticmutations are not directly sensitive to the environment. Indeed, environmental constraints(e.g., contaminants, diet, social stimuli, etc.) experienced by individuals along their lifecan alter the distribution of epigenetic marks across the whole genome [12–15]. Some ofthese marks induced by the environment can be transmitted across generations (inherited),and in that case, they are comparable to nonneutral genetic variance, except that (i) themutation rate of epigenetic markers is higher and (ii) these marks are less stable over thelong time [7,16–18]. Consequently, the epigenome (all of individual epigenetic marks onthe DNA sequence) could theoretically carry a footprint of the contemporary (biotic andabiotic) environment in which the last few generations have lived. Epigenetic marks arehence expected to transmit (environmental) information that is not necessarily transmittedby (and that is hence complementary to) genetic marks [19]. In this situation, we canpredict that spatial patterns of epigenetic diversity should deviate from those documentedfor neutral and nonneutral genetic markers. In particular, epigenetic diversity patternsshould be strongly linked to environmental heterogeneity, whereas this should be lessthe case for nonneutral genetic diversity patterns, and obviously not the case for neutralgenetic diversity.
On the other side, there is mounting evidence that alternative mechanisms can gen-erate correlated patterns of epigenetic and (neutral) genetic diversity across natural land-scapes. A first alternative hypothesis rests upon the assumption that epigenetic marksdepend (either completely or partially) on genetic variation rather than on environmentalvariation [20–22], since an individual transmitting a given genetic allele during mitosis alsotransmits the epigenetic information carried by this allele, i.e., the epiallele [20]. Therefore,there would be a physical link between alleles and epialleles. Moreover, different types ofgenetically encoded molecules are required to modulate the expression of genes, such asRNA or proteins [23,24]. These molecules are involved in the establishment and stability ofhistone tail modifications or DNA methylation across generations [16,25]. Consequently,the establishment and stability of epigenetic marks is allowed by genetic information.A second alternative hypothesis hence states that the same neutral processes (drift, mu-tation, and gene flow) can influence both genetic and epigenetic markers in a similardirection [26–28]. Indeed, epi-mutations have been reported to occur naturally in wildpopulations [29] and age-related methylation drift is known to reflect imperfect mainte-nance of epigenetic marks through cell renewal [30]. These two hypotheses both suggestthat, under certain circumstances, epigenetic and neutral genetic diversity patterns couldactually strongly covary spatially across natural landscapes.
Documenting and understanding the joint distribution of genetic and epigenetic marksin natural populations is essential to tease apart the potential role of epigenetic and geneticbackgrounds for the adaptive potential of populations, and a few studies have paved theway toward such an objective [26]. Up to now, these studies have led to contrasting andcontext-dependent results. For instance, a significant correlation was detected betweengenetic and epigenetic differentiation among natural population pairs of Hordeum brevi-subulatum [31], whereas it was not the case in Vitex negundo var. heterophylla [32]. These

Genes 2021, 12, 107 3 of 18
contrasted patterns have also been observed in animal species [33,34], although mostprevious studies have focused on plant populations. At a first glance, it therefore seemsthat no generalities can be drawn about the spatial covariation between epigenetic andgenetic diversity patterns in natural populations. We argue that an insightful way to tacklethis question is to study species living in sympatry within a single landscape. Indeed, by“controlling” for the common environment, it would become possible to test whether theepigenetic response of populations to the same local environment is species-dependent orpredictable across species, and to test the causal link between genetic and epigenetic marks.To date, these kinds of empirical comparative study are scarce [35,36], while they may bevery helpful for generalizing findings across species.
The general objective of this study was to generate novel insights into the spatialpatterns of genetic and epigenetic diversity of wild populations, and to empirically test thelink between epigenetic population structure and the local environment. We conductedan empirical “comparative” study involving two sympatric freshwater fish species (Gobiooccitaniae and Phoxinus phoxinus) in a common riverscape to gain insights into the linksbetween genetic diversity, epigenetic diversity, and the environment. By focusing on thesame set of sites for the two species, we tested the correlation between genetic and epige-netic diversity structure within each species by controlling for environmental covariation,and we compared this correlation between species. Furthermore, we used both supposedlyneutral (microsatellites) and nonneutral (single nucleotide polymorphism, SNP) geneticmarkers, to gain further insights into the processes sustaining patterns of epigenetic diver-sity in wild populations. Because the two fish species belong to the same trophic level anddisplay similar life history traits (similar generation time, for instance), we expected similarpatterns for the two species. In particular, assuming that epigenetic marks are under partialgenetic control [11,20,37], we predicted a positive and significant correlation between pair-wise genetic and epigenetic differentiation for the two species, irrespectively of the type(neutral or not) of genetic marker. An absence of significant correlation would indirectlyindicate that epigenetic diversity is controlled by other factors, i.e., the environment. Wefurther tested the correlation between pairwise epigenetic (and genetic) differentiation andenvironmental distances between sites to quantify to which extent epigenetic diversity wasdetermined by the local environment. For the two species, we expected that populationsliving in strongly distinct habitats would be highly differentiated epigenetically, whichshould not be observed for neutral (microsatellite) genetic differentiation, and only partiallyobserved in nonneutral (SNP) markers. Given their different ecological requirements, wefinally expected that the environmental component of epigenetic differentiation, if any,would not be driven by the same environmental factors in the two species.
2. Materials and Methods2.1. Sampling and Site Selection2.1.1. Biological Models
The two focal fish species belong to the cyprinidae family: Gobio occitaniae (the Occitangudgeon) and Phoxinus phoxinus (the European minnow). These two species are phyloge-netically related, they belong to the same trophic level, they have a similar generation time(2–3 years), and they face similar selective pressures as they coexist in sympatry in manyareas [38]. Nonetheless, they slightly differ ecologically since G. occitaniae is ubiquitousover a large part of the whole upstream-downstream gradient in rivers, whereas P. phoxinusis more specialized and lives preferentially in upstream areas. In addition, and despitethe fact that they are both insectivorous, G. occitaniae feeds preferentially on the bottom,whereas P. phoxinus feeds mainly in the water column. Finally, G. occitaniae is larger inbody length than P. phoxinus (mean body length at adult size is ~80–150 and ~50–90 mm,respectively).
Genes 2021, 12, 107 4 of 18
2.1.2. Study Area and Sampling
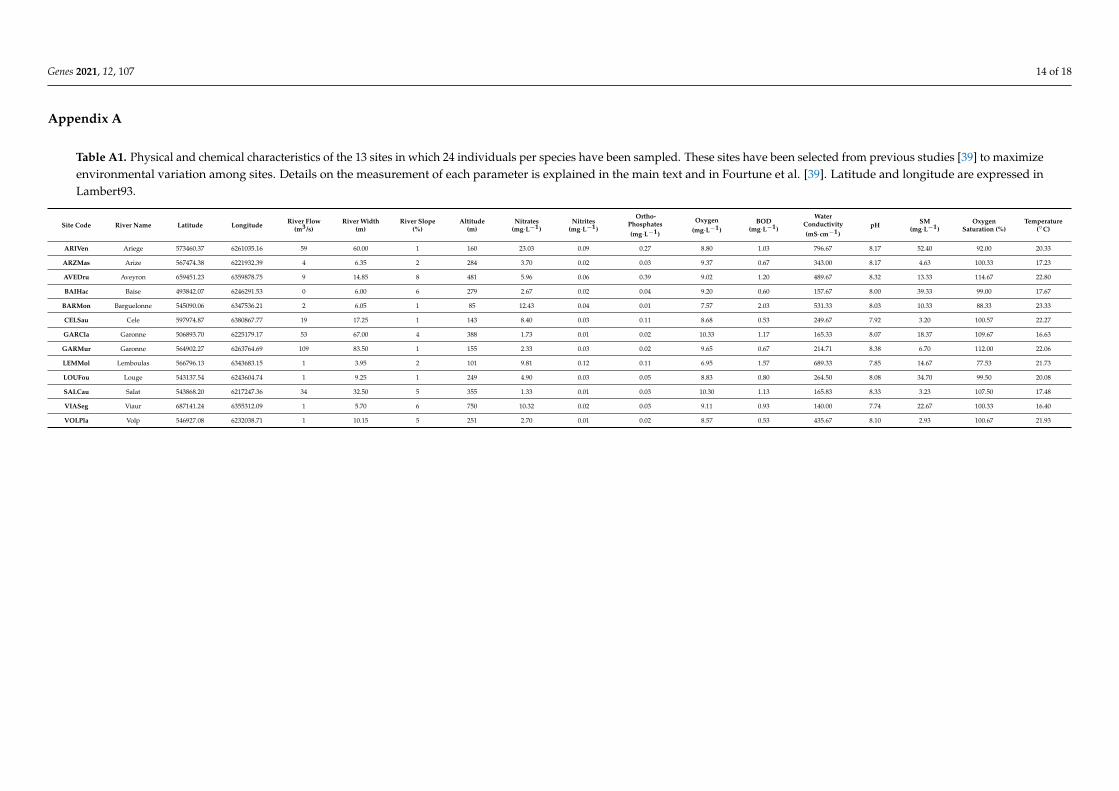
Based on a priori knowledge [39], we sampled the two fish species in 13 sites fromthe Garonne River basin (South-Western France, Figure 1). Sites varied according to keyabiotic factors to optimize the likelihood of detecting unique epigenetic marks in thesepopulations. In particular, we selected sites varying according to two key environmentalvariables directly affecting fish fitness and populations [39–41]: mean annual temperature(ranging from 16.4 to 23.3 ◦C, Table A1, see also Figure 1) and oxygen saturation (rangingfrom 77.5% to 114.7%, Table A1). Electric fishing was conducted during summer 2014 andperformed under the authorization of “Arrêté Préfectoraux” delivered by the “DirectionDépartementale des Territoires” of each administrative department (Ariège, Aveyron,Haute-Garonne, Hautes-Pyrénées, Lot and Tarn et Garonne). We sampled 24 fish perspecies in each site, leading to a total of 312 individuals per species (n = 624). Fish weretreated in accordance to the European Communities Council Directive (2010/63/EU)regarding the use of animals in Research, French Law for Animal Protection R214-87 toR214-137. Although DNA methylation diversity can show tissue-specific differences withinan individual [42–44], we favored a non-lethal approach and hence a small piece of pelvicfin was sampled on each individual. It is noteworthy that, in fish, the shape and colorof fins can be linked to abiotic environmental conditions [45,46]. All individuals wereanaesthetized using benzocaine before fin clips. Each fin tissue was preserved in 70%ethanol for further genetic and epigenetic analyses. All individuals were released in theirrespective sampling site.
Genes 2021, 12, x FOR PEER REVIEW 4 of 20
bottom, whereas P. phoxinus feeds mainly in the water column. Finally, G. occitaniae is
larger in body length than P. phoxinus (mean body length at adult size is ~80–150 and ~50–
90 mm, respectively).
2.1.2. Study Area and Sampling
Based on a priori knowledge [39], we sampled the two fish species in 13 sites from
the Garonne River basin (South-Western France, Figure 1). Sites varied according to key
abiotic factors to optimize the likelihood of detecting unique epigenetic marks in these
populations. In particular, we selected sites varying according to two key environmental
variables directly affecting fish fitness and populations [39–41]: mean annual temperature
(ranging from 16.4 to 23.3 °C, Table A1, see also Figure 1) and oxygen saturation (ranging
from 77.5% to 114.7%, Table A1). Electric fishing was conducted during summer 2014 and
performed under the authorization of “Arrêté Préfectoraux” delivered by the “Direction
Départementale des Territoires” of each administrative department (Ariège, Aveyron,
Haute-Garonne, Hautes-Pyrénées, Lot and Tarn et Garonne). We sampled 24 fish per spe-
cies in each site, leading to a total of 312 individuals per species (n = 624). Fish were treated
in accordance to the European Communities Council Directive (2010/63/EU) regarding the
use of animals in Research, French Law for Animal Protection R214-87 to R214-137. Alt-
hough DNA methylation diversity can show tissue-specific differences within an individ-
ual [42–44], we favored a non-lethal approach and hence a small piece of pelvic fin was
sampled on each individual. It is noteworthy that, in fish, the shape and color of fins can
be linked to abiotic environmental conditions [45,46]. All individuals were anaesthetized
using benzocaine before fin clips. Each fin tissue was preserved in 70% ethanol for further
genetic and epigenetic analyses. All individuals were released in their respective sampling
site.
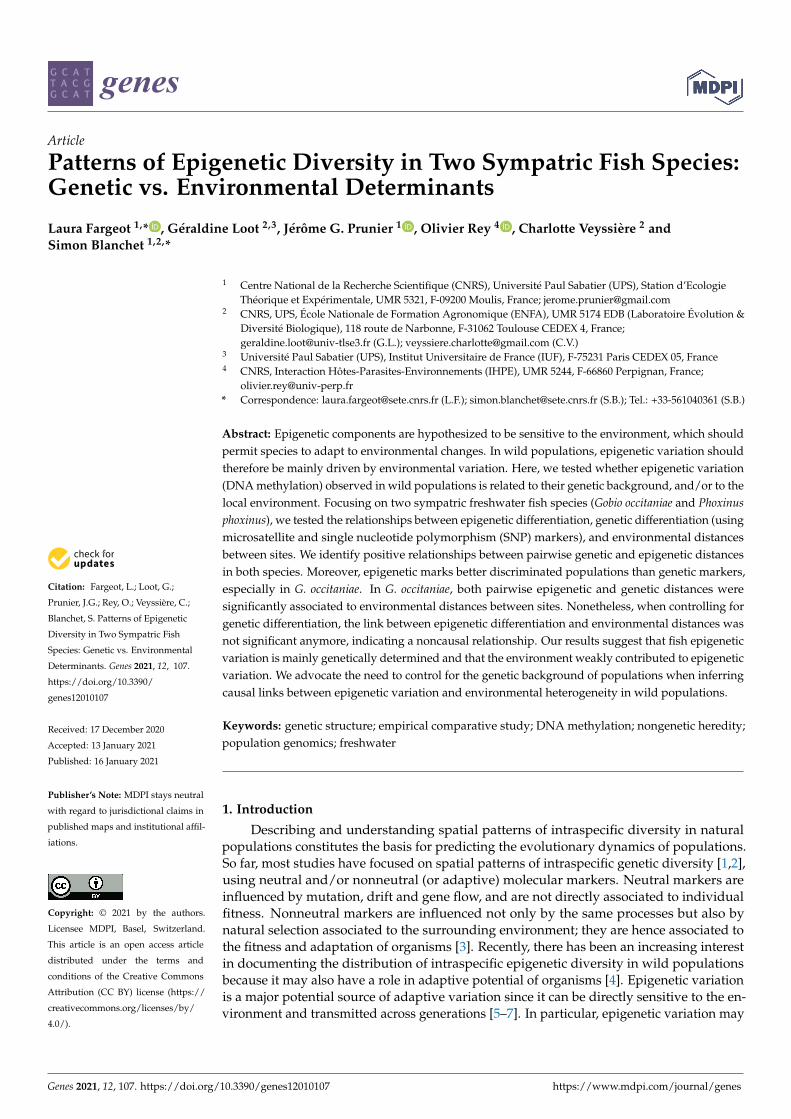
Figure 1. Distribution of the 13 sampling sites in the Garonne river basin. Names and localization are highlighted in bold.Twenty-four individuals per site and per species (Gobio occitaniae and Phoxinus phoxinus) have been sampled. Color of circlesindicates mean water temperature (◦C).
2.2. Environmental Data
All sites were characterized for 14 variables related to physicochemical characteristics(overall water quality) and river topography so as to test for association between epigenetic

Genes 2021, 12, 107 5 of 18
(and genetic) markers and environment (see Table A1). Topographical variables includedriver flow (m3·s−1), river width (m), river slope (%), and altitude (m) and were retrievedfrom the French Theoretical Hydrological Network (RHT) [47]. Physicochemical charac-teristics included concentrations in nitrate, nitrite, orthophosphate, and oxygen (mg·L−1),biological oxygen demand (BOD, mg·L−1), water conductivity (mS.cm−1), pH, suspendedmatter (SM, mg·L−1), oxygen saturation (%), and temperature (◦C). They were obtainedfrom the databases of the Water Information System of the Adour Garonne basin (SIEAG“Système d’Information sur l’Eau du Bassin Adour Garonne”; http://adour-garonne.eaufrance.fr). Here, we used values measured in July from 2013 to 2015, to take intoaccount interannual variability and potential measurement errors. Values were averaged(for each parameter) across this period. July was chosen as the reference month since thisis a period in which environmental constraints are likely to be strong on fish fauna (lowwater level, hyperthermia, hypoxia, etc.) and because it is the most informed month in theSIEAG database. All these variables are known to affect dynamics of fish populations andproperly characterize the environmental conditions encountered by fish [38,48].
A principal component analysis (PCA) was performed on the 14 environmentalvariables using the R package “ade4” [49], to synthetize data into orthogonal variables.The three first axes represented 71.96% of the total variance (Table 1 for details), andwere hence retained as synthetic environmental variables. The first axis, defined by astrong contribution of (in decreasing order) oxygen concentration, water conductivity,nitrite concentration, oxygen saturation, and nitrate concentration (Table 1), stands for aeutrophication gradient. Sites with positive values along this axis were characterized by alow concentration of oxygen, a high conductivity and high concentrations in nitrate andnitrite (i.e., the more eutrophic sites). The second axis, defined by a strong contribution ofriver flow, river width, and pH (Table 1), stands for an upstream–downstream gradient.Sites with positive values along this axis were characterized by a large river bed (highwater flow) and high pH values. The third axis is defined by a strong contribution oforthophosphate concentration, slope, altitude, and suspended matter (Table 1). Sites withpositive values along this axis were characterized by high altitude sites with a steep slopeand high values of nutrient and suspended matter.
Table 1. Characteristics of the three first principal components from the principal component analysis (PCA) ran on the 14environmental variables and used to characterize each of the 13 sampling sites. The part of the total environmental variance(%) and the contribution of each variable to each component are shown. The variables that contributed significantly to theaxis are shown in bold. BOD = biological oxygen demand; SM = suspended matter.
– Component 1 Component 2 Component 3
Part of totalvariance (%) 37.03 20.87 14.06
River flow −0.273 0.888 −0.056River width −0.295 0.864 0.037
Slope −0.434 −0.407 0.614Altitude −0.538 −0.442 0.596
Conductivity 0.878 0.258 0.212BOD 0.555 −0.020 0.045MS 0.262 0.060 0.529
Nitrate 0.748 0.166 0.344Nitrite 0.855 0.199 0.266
Orthophosphate 0.354 0.303 0.757Oxygen −0.903 0.267 0.191
pH −0.341 0.719 0.075Oxygen saturation −0.848 0.304 0.238
Temperature 0.577 0.339 −0.208
Global characteristic Oligotrophic water–Eutrophic water Small river–Large river Low altitude and nutrient–
High altitude and nutrient
Genes 2021, 12, 107 6 of 18
2.3. Genetic and Epigenetic Data2.3.1. Genetic Data
The DNA of all individuals (n = 624) was extracted using a salt-extraction protocol [50].Individual genetic data consisted in both microsatellite (supposedly neutral) and SNPmarkers (potentially nonneutral).
Microsatellites data (13 and 17 loci for G. occitaniae and P. phoxinus, respectively)were obtained from a previous study [39]. Details on accession numbers, conditions forpolymerase chain reactions (PCRs), and preliminary analyses (e.g., search for null alleles orpossible linkage disequilibrium between loci) are provided in Fourtune et al. [39].
SNP markers (1892 and 1244 in G. occitaniae and P. phoxinus, respectively) were ob-tained from the restriction site-associated DNA (RAD) sequencing of pooled DNAs at thesite and species levels [51], using laboratory and bioinformatic procedures described inPrunier et al. [52]. As the DNA of individuals was pooled at the site level, we were unableto retrieve individual genotypes (contrary to microsatellite markers) and we therefore usedthe frequencies of alleles (from each SNP) at the population level as raw genomic data forthe SNPs.
2.3.2. Epigenetic Data
Individuals were then genotyped using Methylation-Sensitive-AFLP (MS-AFLP). MS-AFLP allows identifying “genome-wide” methylation patterns. This is a modified versionof standard AFLP (Amplified Fragment Length Polymorphism) technique [53] that is wellsuited for nonmodel species (without a reference genome) and useful to assess epigeneticdiversity for large sample sizes (>200) [37]. MS-AFLP relies on two separate doubledigestions with EcoRI (rare cutter, on 5’G|AATTC restriction site) and either one of twomethylation-sensitive restriction enzymes (HpaII and MspI, frequent cutters, on 5’CC|GGrestriction site). Because HpaII and MspI have different cytosine methylation sensitivities,comparison of the two digestion fragment profiles (EcoRI/MspI and EcoR1/HpaII) leadsto the distinction of four methylation conditions for each DNA fragment: Condition I= fragments are present in both profiles, indicating an unmethylated state; Condition II= fragments are present only in EcoRI/MspI profile indicating an hemimethylation ofinternal cytosine (HMeCG-sites) or a full methylation of (both) internal cytosines (MeCG-sites); Condition III = fragments are present only in EcoRI/HpaII profile indicating anhemimethylation of external cytosine (HMeCCG-sites); Condition IV = fragments are absentin both profiles, indicating an uninformative state [54]. This last case can have multipleorigins such as full methylation on external cytosine (MeCCG-), hemimethylation of bothcytosines (HMeCHMeCG-sites), full-methylation of both cytosines (MeCMeCG-sites), or morerarely genetic mutation leading to polymorphism of the restriction site.
2.3.3. MS-AFLP Protocol
The first step consists in two separate double digest reactions of 3 µL of extractionproduct (30–40 ng·µL−1) with 0.5 µL of FastDigest EcoRI (1 FDU·µL−1) and 0.5 µL of eitherFastDigest MspI (1 FDU·µL−1) or FastDigest HpaII (1 FDU·µL−1) isoschizomers. DNA wasdigested at 37 ◦C for 15 min. Double-stranded adaptors (see Table A2 for details) [32,55,56]were then ligated onto the sticky end of all the digestion products (10 µL) with 0.3 µL ofa T4 DNA ligase (5 U/µL, Thermo Scientific) and 1 µL of each adaptor (EcoRI adaptors2.5 µM; MspI/HpaII adaptor 0.25 µM) at 25 ◦C for 1 h. After a step of enzyme killing, theproduct was subjected to two rounds of increasingly selective PCR amplification (PCR1and PCR2). Preselective amplification (PCR1, see Appendix C for details) was performedin a total volume of 25 µL using 5 µL of 5× buffer, 1.5 µL of dNTP (10 mM), 2 µL of eachpreselective primer (10 µM, see Table A2 for sequences), 0.3 µL of Taq DNA polymerase(5 U/µL Thermo Scientific®), and 2 µL of ligation product. Preamplified products werethen diluted to 1:50 in sterile water. Selective amplification (PCR2, see Appendix C fordetails) was then performed under the same conditions (reagents and total volume) thanthe preselective amplification, except that three specific selective primers couples were

Genes 2021, 12, 107 7 of 18
used (see Table A2 for sequences). Primers for selective PCRs were chosen among a setof 24 and 23 primers for G. occitaniae and P. phoxinus, respectively, that we previouslytested for optimal conditions (number of loci amplified per primer, not shown). Amplifiedproducts were then diluted to 1:15 in sterile water and 2.2 µL of this mix was added in7.8 µL of a mix composed of 800 µL of Hi-Di formamide (Applied Biosystems®) and 15 µLof ROX500 (Applied Biosystems®) prior to analyzing and sizing the fragments. Fragmentanalysis was performed on an ABI PRISM 3730 capillary sequencer (Applied Biosystems®,Foster City, CA, USA) at the Génopôle Toulouse Midi-Pyrénées.
Fragment profiles were analyzed with GENEMAPPER 5.0® and we scored fragments(loci) between 150 and 500 bp to avoid homoplasy [57]. Binning of fragments was per-formed using a peak height threshold at 750 Relative Fluorescence Units (RFU) to excludeall ambiguous peaks. Manual verification permitted to eliminate false positive such aspeaks just above or below the threshold set, fluorescence blobs, or peaks too close one fromthe other to be correctly resolved by automated analysis. Absence and presence of data ateach locus were then converted into Conditions I, II, II, or IV as explained above [54]. Allloci that contained Condition IV (i.e., uninformative state) for more than 95% of the individ-uals were excluded from further analyses. This resulted in a total of 251 polymorphic locifor G. occitaniae and 274 polymorphic loci for P. phoxinus, respectively (see the number ofloci per primer in Table A2). We considered each of the four conditions as carrying uniqueinformation, and we therefore ran statistical analyses directly on a four-state data matrix,which permitted us to keep all the information contained in the dataset.
2.4. Statistical Analyses
To test the part of the molecular variance that was explained by the between-populationcomponent, an analysis of molecular variance (AMOVA; Excoffier et al. 1992) was performedon either genetic or epigenetic markers and for each species separately (“poppr.amova”function from the poppr R package). Regarding genetic markers, only microsatellitesmarkers were considered here, because we did not have the within-population component(individual genotypes) in our SNPs dataset (see above). If epigenetic marks are more sensi-tive to the environment, they should be more discriminant and the between-populationcomponent should be higher for epigenetic markers than for genetic markers.
We then estimated measures of genetic (for both marker types separately) and epige-netic differentiation (for each species separately) by calculating the Gst” index of differenti-ation between each pair of populations. We preferred this metric of differentiation overother metrics (e.g., Fst, Gst, Jost’s D, etc.) as it has been shown to be robust to variations inmutation rates and sample sizes [58,59].
To test whether pairwise epigenetic differentiation was dependent upon genetic dif-ferentiation (i.e., whether epigenetic differentiation was genetically determined), a simpleMantel test was first performed between pairwise genetic and epigenetic distances for eachspecies separately and for each genetic marker type separately (“mantel.rtest” functionfrom the ade4 R package). Simple Mantel tests were also used to assess the significance ofthe correlation between pairwise differentiation measured from microsatellite markers anddifferentiation measured from SNP markers.
To test whether epigenetic differentiation between populations resulted from environ-mental differences among sites (i.e., whether epigenetic differentiation was environmentallydetermined), simple Mantel tests were also performed between either genetic or epige-netic pairwise distances and each of the three environmental distance matrices computedfrom retained principal components (Euclidian distances) and a geographical distancematrix based on riparian distance between sites (to control for a potential confoundingspatial effect and to test for patterns of isolation-by-distance). To further investigate therelationship between epigenetic pairwise differentiation and environmental or geographi-cal distance matrices, multiple regressions on distance matrices (MRM, “MRM” functionfrom the ecodist R package) were then performed. MRM is an extension of partial Man-tel test allowing to test the relationship between a response matrix and any number of

Genes 2021, 12, 107 8 of 18
explanatory matrices, where each matrix contains distance or similarities (Smouse et al.1986). For each species, the pairwise matrix of epigenetic differentiation was the responsevariable, and explanatory variables where the three environmental distance matrices, thegeographical distance matrix, and the pairwise matrix of genetic differentiation based onSNP markers to account for a possible genetic determinism of epigenetic marks. For thesake of simplicity, we did not include the pairwise matrix of genetic differentiation basedon microsatellites, although results were very similar whether we integrated it or not in themodels (not shown).
3. Results3.1. Genetic and Epigenetic Discrimination
Molecular analysis of variance (AMOVA) revealed that a significant part of the genetic(microsatellite markers) and epigenetic variance was attributed to the between-populationcomponent, for both species (p-value < 0.001; permutation tests with 1000 repetitions). ForG. occitaniae, the part of the total variance explained by the between-population componentwas twice as high for epigenetic markers as it was for genetic markers (20.15% and 10.34%,respectively, see Table 2). For P. phoxinus, a similar trend was observed although lesspronounced (19.59% and 16.75%, respectively, see Table 2). This suggests that, in bothspecies, epigenetic markers were more powerful to discriminate among populations thangenetic markers.
Table 2. Outputs of analyses of molecular variance (AMOVA) aiming at testing the part of the molecular variance thatwas explained by the between-population component (the within-population component is not shown here). Results arepresented for the two fish species (G. occitaniae and P. phoxinus) and the two molecular marker types (genetic and epigeneticmarkers) separately. For the genetic marker, only microsatellite markers have been considered in this analysis (see the textfor details). The percentages of the total variance (“Variation”) explained by the between-population component (and theassociated Phi-st values) are presented, as well as the respective p-values based on permutation tests with 1000 repetitions.
Degrees ofFreedom Sum of Squares Variance
Components Variation (%) Phi-st p-value
G. occitaniae
Genetic markers 12 217.182 0.481 10.34 0.103 <0.001Epigenetic markers 12 5726.943 17.210 20.15 0.202 <0.001
P. phoxinusGenetic markers 12 484.297 1.160 16.75 0.168 <0.001
Epigenetic markers 12 6369.97 19.478 19.59 0.196 <0.001
3.2. Simple Associations between Epigenetic, Genetic, and Environmental Distances
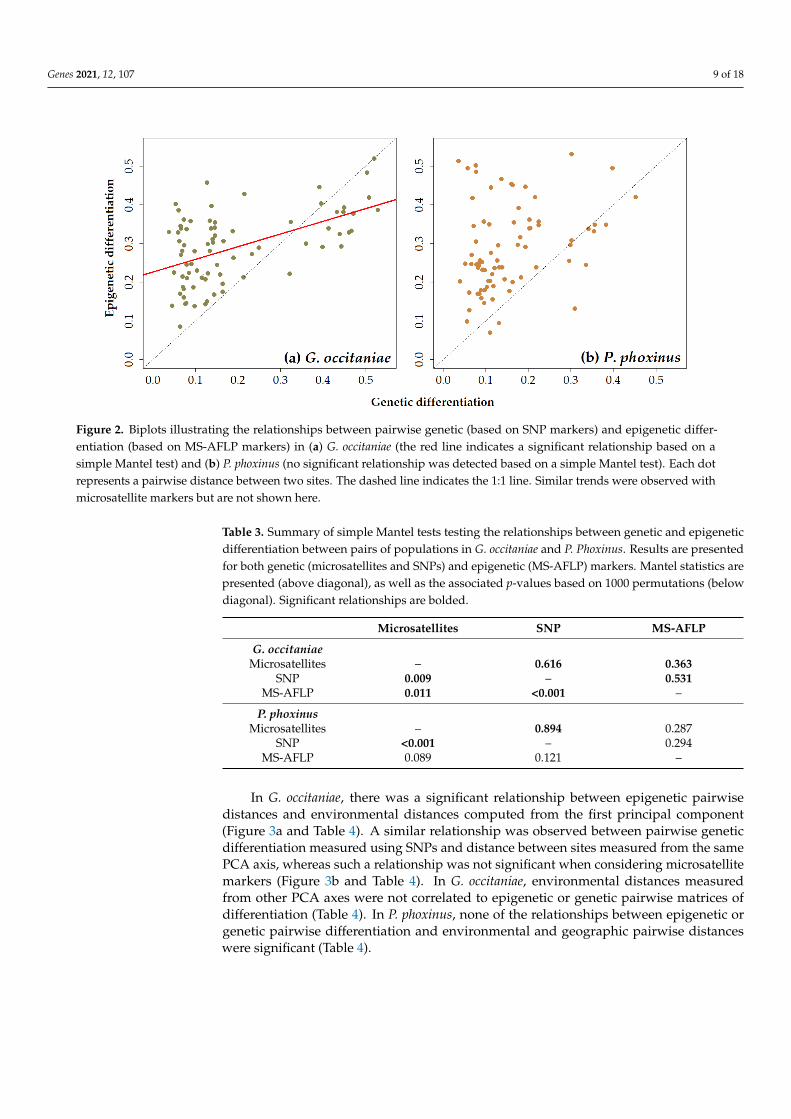
Simple Mantel tests demonstrated that there was a significant correlation betweenpairwise genetic and epigenetic distance matrices in G. occitaniae for both microsatelliteand SNP markers (r = 0.363, p-value < 0.05 and r = 0.531, p-value < 0.001, for microsatellitesand SNPs, respectively; Figure 2a and Table 3). In P. phoxinus, although the same tendencywas observed, the correlation was not significant (r = 0.287, p-value = 0.089 and r = 0.294,p-value = 0.121 for microsatellites and SNPs, respectively; Figure 2b and Table 3). Moreover,most Gst” values measured using epigenetic markers were above the 1:1 line, indicating thatthe mean pairwise differentiation among populations was higher when using epigeneticmarkers than when using genetic markers (Figure 2a,b). As expected, relationships betweenpairwise genetic distances measured using microsatellites in the one hand and SNPs on theother hand were strong and highly significant (Table 3).
Genes 2021, 12, 107 9 of 18
Genes 2021, 12, x FOR PEER REVIEW 9 of 20
Epigenetic
markers 12 6369.97 19.478 19.59 0.196 <0.001
3.2. Simple Associations between Epigenetic, Genetic, and Environmental Distances
Simple Mantel tests demonstrated that there was a significant correlation between
pairwise genetic and epigenetic distance matrices in G. occitaniae for both microsatellite
and SNP markers (r = 0.363, p-value < 0.05 and r = 0.531, p-value < 0.001, for microsatellites
and SNPs, respectively; Figure 2a and Table 3). In P. phoxinus, although the same tendency
was observed, the correlation was not significant (r = 0.287, p-value = 0.089 and r = 0.294,
p-value = 0.121 for microsatellites and SNPs, respectively; Figure 2b and Table 3). Moreo-
ver, most Gst’’ values measured using epigenetic markers were above the 1:1 line, indi-
cating that the mean pairwise differentiation among populations was higher when using
epigenetic markers than when using genetic markers (Figure 2a,b). As expected, relation-
ships between pairwise genetic distances measured using microsatellites in the one hand
and SNPs on the other hand were strong and highly significant (Table 3).
Figure 2. Biplots illustrating the relationships between pairwise genetic (based on SNP markers) and epigenetic differen-
tiation (based on MS-AFLP markers) in (a) G. occitaniae (the red line indicates a significant relationship based on a simple
Mantel test) and (b) P. phoxinus (no significant relationship was detected based on a simple Mantel test). Each dot repre-
sents a pairwise distance between two sites. The dashed line indicates the 1:1 line. Similar trends were observed with
microsatellite markers but are not shown here.
Table 3. Summary of simple Mantel tests testing the relationships between genetic and epigenetic
differentiation between pairs of populations in G. occitaniae and P. Phoxinus. Results are presented
for both genetic (microsatellites and SNPs) and epigenetic (MS-AFLP) markers. Mantel statistics
are presented (above diagonal), as well as the associated p-values based on 1000 permutations
(below diagonal). Significant relationships are bolded.
Microsatellites SNP MS-AFLP
G. occitaniae
Microsatellites – 0.616 0.363
SNP 0.009 – 0.531
MS-AFLP 0.011 <0.001 –
P. phoxinus
Microsatellites – 0.894 0.287
SNP <0.001 – 0.294
MS-AFLP 0.089 0.121 –
Figure 2. Biplots illustrating the relationships between pairwise genetic (based on SNP markers) and epigenetic differ-entiation (based on MS-AFLP markers) in (a) G. occitaniae (the red line indicates a significant relationship based on asimple Mantel test) and (b) P. phoxinus (no significant relationship was detected based on a simple Mantel test). Each dotrepresents a pairwise distance between two sites. The dashed line indicates the 1:1 line. Similar trends were observed withmicrosatellite markers but are not shown here.
Table 3. Summary of simple Mantel tests testing the relationships between genetic and epigeneticdifferentiation between pairs of populations in G. occitaniae and P. Phoxinus. Results are presentedfor both genetic (microsatellites and SNPs) and epigenetic (MS-AFLP) markers. Mantel statistics arepresented (above diagonal), as well as the associated p-values based on 1000 permutations (belowdiagonal). Significant relationships are bolded.
Microsatellites SNP MS-AFLP
G. occitaniaeMicrosatellites – 0.616 0.363
SNP 0.009 – 0.531MS-AFLP 0.011 <0.001 –
P. phoxinusMicrosatellites – 0.894 0.287
SNP <0.001 – 0.294MS-AFLP 0.089 0.121 –
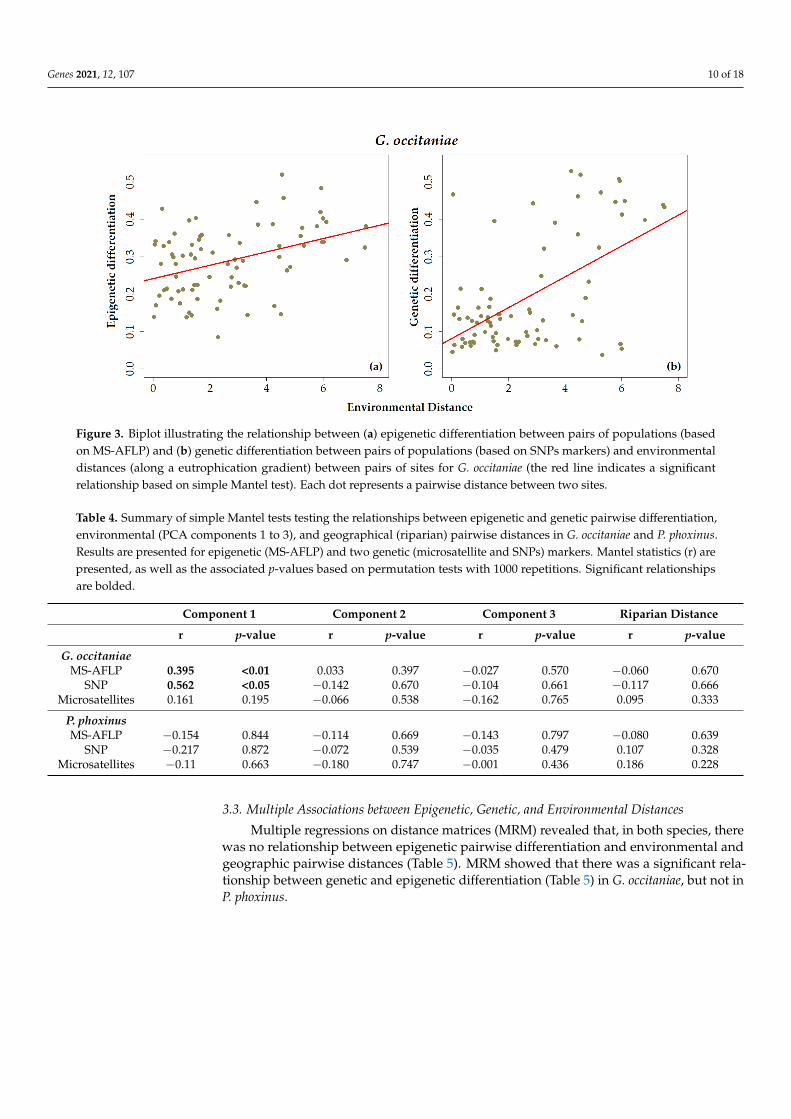
In G. occitaniae, there was a significant relationship between epigenetic pairwisedistances and environmental distances computed from the first principal component(Figure 3a and Table 4). A similar relationship was observed between pairwise geneticdifferentiation measured using SNPs and distance between sites measured from the samePCA axis, whereas such a relationship was not significant when considering microsatellitemarkers (Figure 3b and Table 4). In G. occitaniae, environmental distances measuredfrom other PCA axes were not correlated to epigenetic or genetic pairwise matrices ofdifferentiation (Table 4). In P. phoxinus, none of the relationships between epigenetic orgenetic pairwise differentiation and environmental and geographic pairwise distanceswere significant (Table 4).
Genes 2021, 12, 107 10 of 18
Genes 2021, 12, x FOR PEER REVIEW 10 of 20
In G. occitaniae, there was a significant relationship between epigenetic pairwise dis-
tances and environmental distances computed from the first principal component (Figure
3a and Table 4). A similar relationship was observed between pairwise genetic differenti-
ation measured using SNPs and distance between sites measured from the same PCA axis,
whereas such a relationship was not significant when considering microsatellite markers
(Figure 3b and Table 4). In G. occitaniae, environmental distances measured from other
PCA axes were not correlated to epigenetic or genetic pairwise matrices of differentiation
(Table 4). In P. phoxinus, none of the relationships between epigenetic or genetic pairwise
differentiation and environmental and geographic pairwise distances were significant
(Table 4).
Figure 3. Biplot illustrating the relationship between (a) epigenetic differentiation between pairs of populations (based on
MS-AFLP) and (b) genetic differentiation between pairs of populations (based on SNPs markers) and environmental dis-
tances (along a eutrophication gradient) between pairs of sites for G. occitaniae (the red line indicates a significant relation-
ship based on simple Mantel test). Each dot represents a pairwise distance between two sites.
Table 4. Summary of simple Mantel tests testing the relationships between epigenetic and genetic
pairwise differentiation, environmental (PCA components 1 to 3), and geographical (riparian)
pairwise distances in G. occitaniae and P. phoxinus. Results are presented for epigenetic (MS-AFLP)
and two genetic (microsatellite and SNPs) markers. Mantel statistics (r) are presented, as well as
the associated p-values based on permutation tests with 1000 repetitions. Significant relationships
are bolded.
Component 1 Component 2 Component 3 Riparian Distance
r p-value r p-value r p-va-
lue r p-value
G. occitaniae
MS-AFLP 0.395 <0.01 0.033 0.397 −0.027 0.570 −0.060 0.670
SNP 0.562 <0.05 −0.142 0.670 −0.104 0.661 −0.117 0.666
Microsatellites 0.161 0.195 −0.066 0.538 −0.162 0.765 0.095 0.333
P. phoxinus
MS-AFLP −0.154 0.844 −0.114 0.669 −0.143 0.797 −0.080 0.639
SNP −0.217 0.872 −0.072 0.539 −0.035 0.479 0.107 0.328
Microsatellites −0.11 0.663 −0.180 0.747 −0.001 0.436 0.186 0.228
3.3. Multiple Associations between Epigenetic, Genetic, and Environmental Distances
Figure 3. Biplot illustrating the relationship between (a) epigenetic differentiation between pairs of populations (basedon MS-AFLP) and (b) genetic differentiation between pairs of populations (based on SNPs markers) and environmentaldistances (along a eutrophication gradient) between pairs of sites for G. occitaniae (the red line indicates a significantrelationship based on simple Mantel test). Each dot represents a pairwise distance between two sites.
Table 4. Summary of simple Mantel tests testing the relationships between epigenetic and genetic pairwise differentiation,environmental (PCA components 1 to 3), and geographical (riparian) pairwise distances in G. occitaniae and P. phoxinus.Results are presented for epigenetic (MS-AFLP) and two genetic (microsatellite and SNPs) markers. Mantel statistics (r) arepresented, as well as the associated p-values based on permutation tests with 1000 repetitions. Significant relationshipsare bolded.
Component 1 Component 2 Component 3 Riparian Distance
r p-value r p-value r p-value r p-value
G. occitaniaeMS-AFLP 0.395 <0.01 0.033 0.397 −0.027 0.570 −0.060 0.670
SNP 0.562 <0.05 −0.142 0.670 −0.104 0.661 −0.117 0.666Microsatellites 0.161 0.195 −0.066 0.538 −0.162 0.765 0.095 0.333
P. phoxinusMS-AFLP −0.154 0.844 −0.114 0.669 −0.143 0.797 −0.080 0.639
SNP −0.217 0.872 −0.072 0.539 −0.035 0.479 0.107 0.328Microsatellites −0.11 0.663 −0.180 0.747 −0.001 0.436 0.186 0.228
3.3. Multiple Associations between Epigenetic, Genetic, and Environmental Distances
Multiple regressions on distance matrices (MRM) revealed that, in both species, therewas no relationship between epigenetic pairwise differentiation and environmental andgeographic pairwise distances (Table 5). MRM showed that there was a significant rela-tionship between genetic and epigenetic differentiation (Table 5) in G. occitaniae, but not inP. phoxinus.
Genes 2021, 12, 107 11 of 18
Table 5. Summary of multiple regression on distance matrices (MRM) testing the relationships between epigeneticdifferentiation, genetic differentiation (based on SNP markers), environmental (PCA components 1 to 3), and geographical(riparian) distances between sites in G. occitaniae and P. phoxinus. Parameters associated to each explanatory variable areshown, together with their p–values (1000 permutations). Significant relationships are bolded.
G. occitaniae P. phoxinus
Coefficients p-value Coefficients p-value
Intercept 0.197 0.945 0.312 0.362Component 1 0.007 0.317 −0.008 0.370Component 2 0.006 0.473 −0.006 0.672Component 3 <0.001 0.925 −0.009 0.559Riparian Dist. <0.001 0.817 −0.001 0.534
Genetics (SNP) 0.290 0.003 0.307 0.220
4. Discussion
Although patterns of genetic and epigenetic structure in natural populations have al-ready been investigated in plants [26], the relative role of genetic and epigenetic variation indriving the adaptive potential of animal populations remains unclear. Here, we comparedthe epigenetic structure of two sympatric freshwater fish species along the same environ-mental gradient, and tested the relationship between genetic diversity, epigenetic diversity,and the environment. Our results suggest that epigenetic diversity is mostly influenced bythe genetic background of organisms and weakly influenced by environmental variation.
We found a tendency toward a positive correlation between pairwise genetic andepigenetic distance matrices in both species, although the correlation was significant only inone of the two species (G. occitaniae). This suggests that epigenetic diversity might be partlygenetically controlled and/or that similar processes operate in the same manner on thesetwo molecular markers (genetic and epigenetic). Indeed, consistent with our hypothesis,there was spatial congruency between pairwise genetic and epigenetic differentiation in G.occitaniae, irrespective of the type (microsatellites or SNP) of genetic marker used to assessgenetic differentiation. A similar tendency, yet not significant, was observed in P. phoxinus,indicating that the strength of the positive association between genetic and epigeneticdifferentiation might slightly differ among species from the same ecological guild. A veryfew comparative studies in wild populations have been performed so far, and it is henceextremely difficult to draw general conclusions. In two plants species (Spartina alternifloraand Borrichia frutescens) sharing the same habitats, a positive correlation between pairwisegenetic and epigenetic differentiation have been highlighted in one species (S. alterniflora)and not in the other (B. frutescens) [35]. This latter study and our findings suggest thatpatterns of covariation between genetic and epigenetic diversity in wild populations islikely to be species-dependent and hard to predict.
In G. occitaniae, the association between genetic and epigenetic differentiation wasparticularly strong when genetic differentiation was calculated using SNP markers. SNPmarkers (or some of them) are supposedly nonneutral and hence are significantly affectedby natural selection, whereas microsatellites are supposedly neutral and hence mainlyaffected by drift and dispersal. Beyond these characteristics, epigenetic markers consid-ered here, MS-AFLP, are likely to be more similar to SNP than to microsatellite markersin terms of the amount of evolutionary information they reveal about wild populationsof fish species. Indeed, microsatellite markers are known to have a faster mutation rateand thus a higher level of polymorphism [60] than MS-AFLP and SNP markers. Conse-quently, the impact of neutral processes such as mutation, genetic drift, or gene flow areprobably more similar between MS-AFLP and SNP markers than between MS-AFLP andmicrosatellite markers. In order to test the association between genetic and epigeneticdifferentiation, comparison between different genetic markers have previously been donein a few studies [26,31,61–65]. These studies also found different patterns according to thetype of genetic markers that was used to estimate genetic differentiation, which confirms

Genes 2021, 12, 107 12 of 18
that the different regions of the genome are not affected by neutral processes in the samemanner [66–68] and strongly suggests that estimating genetic differentiation based on asingle marker type can potentially lead to imprecise conclusions, especially, if this latterdiffers in mutation rate and polymorphism level compared to epigenetic marks.
We found a significant link between epigenetic variation and environmental hetero-geneity in G. occitaniae, but not in P. phoxinus. Nonetheless, when we controlled for theunderlying genetic structure of populations, this link was no longer significant, suggestinga non-causal (spurious) association [69]. This indicates that, in G. occitaniae, the associationbetween epigenetic diversity and environment actually occurred because of an actual causalrelationship between genetic diversity and environment and a covariation at the genomelevel between epigenetic and genetic marks. On the contrary in P. phoxinus, none of theseassociations between environment, genetic diversity, and epigenetic diversity was uncovered.The strong and significant association between the environment and genetic diversity ob-served in G. occitaniae and the absence of such association in P. phoxinus is in agreement withprevious findings that phenotypic differentiation between sites is strongly associated withthe environment in G. occitaniae but not in P. phoxinus [39]. In particular, oxygen saturationwas strongly associated with phenotypic divergence among G. occitaniae, and complemen-tary analyses (Commonality Analysis, not shown) also revealed that oxygen concentrationwas the most impacting environmental variable associated to genetic (SNPs) differentiation.Overall, these findings are consistent with the hypothesis of natural selection, triggered byenvironmental stress—here oxygen—and modulated by genetic marks, resulting in a localphenotypic adaptation of G. occitaniae [11,39,70]. To sum up, the epigenetic-environmentassociation found in G. occitaniae was actually spurious, which stresses the importanceof controlling for the genetic background of populations to infer the causal link betweenepigenetic variations and environmental heterogeneity in wild populations.
In both species, our results highlighted that epigenetic marks were more powerfulto discriminate populations than the two genetic markers. Indeed, in both species, theAMOVA revealed that the variance measured among populations was higher when usingepigenetic markers than when using microsatellite markers. Moreover, using the samemetric of differentiation (Gst”), we found that the mean pairwise differentiation amongpopulations was higher when using epigenetic markers than when using genetic markers(either microsatellites or SNPs, see Figure 2; most Gst” values measured using epigeneticmarks are above the 1:1 line). In other words, environmentally -and geographically- distantpopulations were more different epigenetically than genetically. This result suggests thatalthough a part of the epigenetic marks seems to be genetically controlled, epigeneticdiversity also contained information that seems independent from genetic variation andthat allows discriminating populations further. This strong discriminative power of epige-netic marks is unlikely to be mainly driven by the sensitivity of epigenetic marks to theenvironment as we found little evidence that, in these species, the epigenetic structure ofpopulations was causally linked to the environment (see above). Rather, we can speculatethat the inherent characteristics of epigenetic marks (in particular, higher mutation rates)and their sensitivity to neutral processes (drift and dispersal) make them extremely rele-vant as natural markers for population discrimination. This strong discriminative abilitymight be highly relevant for species conservation, for instance, to identify ecologicallyand evolutionary isolated populations (and hence Evolutionary Significant Units) [71–73]and/or infer connectivity among populations [4].
Finally, we want to address some methodological limitations to our work. First, weworked on fin tissue to favor a non-lethal approach, supported by the fact that the shapeof the fin and its coloration can be linked to abiotic environmental conditions [45,46].In this context, the fin appears to be a good compromise between both scientific andethical concerns. However, given that DNA methylation diversity can show tissue-specificdifferences within an individual [42–44], this choice is not trivial. The fin is likely not thetissue that responds the most, at the molecular level, to environmental conditions, and isconsequently probably less linked to fitness than other tissues. Our results might have been

Genes 2021, 12, 107 13 of 18
different with other tissues like muscle [33,74–76], blood [34,77,78], liver [79,80], or gilltissue [81]. Some authors made different choices to avoid tissue-specific differences suchas gonads [56] or even whole organism when it is relatively small in body size [36,82–84].Second, we used a MS-AFLP protocol, which is currently the most widely used approachfor inferring epigenetic diversity in wild populations [37,78,81,85]. Although MS-AFLP hasseveral advantages, such as being efficient and economical to assess epigenetic diversity forlarge sample sizes, this method only provides anonymous and dominant markers leadingto a fragment analysis that is subject to homoplasy (i.e., two fragments of the same sizebut with different sequence) [57]. Consequently, DNA methylation marks are difficult tolink to the functional context or to compare directly with genetic data [78,86]. Promisingapproaches based on reduced representation bisulfite sequencing (RRBS) approach andnext-generation sequencing (NGS) might partly solve these issues [87,88], particularlyby allowing the identification of the specific loci potentially implied in the response tothe environment. RRBS should be explicitly compared to MS-AFLP to isolate further thepotential limits of MS-AFLP approaches and to gain novel insights into the loci underlyingadaptation to the local environment [89].
5. Conclusions
To conclude, our study provided an attempt to link epigenetic variation in wild popu-lations to the surrounding environment, a work that has been almost always carried out inplants and much more rarely in animals [20,90]. In our empirical comparative study, weshowed that, contrary to expectations, there was no link between epigenetic variation andenvironmental constraints in G. occitaniae and P. phoxinus. This suggests that epigenetic di-versity might be poorly associated to adaptation in these two species. Nonetheless, in bothcases, epigenetic variation seems to be genetically determined, indicating a genetic controlof epigenetic variation, as suspected in previous works [20–22]. Interestingly, epigeneticdifferentiation was linked (or show a tendency to be linked) to microsatellites (i.e., neutral)genetic differentiation, reinforcing the idea of an impact of the same neutral processeson genetic and epigenetic variation [26–28]. This implies that, in the species we inves-tigated, epigenetic variation is more likely driven by neutral than nonneutral processes.Nonetheless, epigenetic marks are still more efficient than genetic markers to discriminatepopulations and can hence provide a tool to improve conservation strategies of endangeredpopulations [4]. Future works should hence consider the dual use of genetic and epigeneticmarks to inform conservation strategies, such as the delimitation of significant units ofconservation or the quantification of biological connectivity in fragmented landscapes.
Author Contributions: Conceptualization, L.F., O.R., and S.B.; methodology, L.F., C.V., and G.L.;software, L.F., J.G.P., and G.L.; validation, J.G.P., G.L., and S.B.; formal analysis, L.F., J.G.P., and S.B.; in-vestigation, L.F. and S.B.; resources, S.B. and G.L.; data curation, L.F., C.V., and G.L.; writing—originaldraft preparation, L.F.; writing—review and editing, S.B.; visualization, L.F. and S.B.; supervision,S.B.; project administration, S.B.; funding acquisition, S.B. and G.L. All authors have read and agreedto the published version of the manuscript.
Funding: This research was funded by the Agence Nationale de la Recherche, grant numbersANR-10LABX and ANR 18-CE02-0006.
Institutional Review Board Statement: Not applicable.
Informed Consent Statement: Not applicable.
Data Availability Statement: The data presented in this study are openly available in (FigShare) at(https://doi.org/10.6084/m9.figshare.13580534.v1), reference number (13580534).
Acknowledgments: We thank Héloïse Bossuat, Lisa Fourtune, Christelle Leung, and all other col-leagues who help at different stages of the work.
Conflicts of Interest: The authors declare no conflict of interest. The funders had no role in the designof the study; in the collection, analyses, or interpretation of data; in the writing of the manuscript; orin the decision to publish the results.
Genes 2021, 12, 107 14 of 18
Appendix A
Table A1. Physical and chemical characteristics of the 13 sites in which 24 individuals per species have been sampled. These sites have been selected from previous studies [39] to maximizeenvironmental variation among sites. Details on the measurement of each parameter is explained in the main text and in Fourtune et al. [39]. Latitude and longitude are expressed inLambert93.
Site Code River Name Latitude Longitude River Flow(m3/s)
River Width(m)
River Slope(%)
Altitude(m)
Nitrates(mg·L−1)
Nitrites(mg·L−1)
Ortho-Phosphates(mg·L−1)
Oxygen(mg·L−1)
BOD(mg·L−1)
WaterConductivity(mS·cm−1)
pH SM(mg·L−1)
OxygenSaturation (%)
Temperature(◦C)
ARIVen Ariege 573460.37 6261035.16 59 60.00 1 160 23.03 0.09 0.27 8.80 1.03 796.67 8.17 52.40 92.00 20.33
ARZMas Arize 567474.38 6221932.39 4 6.35 2 284 3.70 0.02 0.03 9.37 0.67 343.00 8.17 4.63 100.33 17.23
AVEDru Aveyron 659451.23 6359878.75 9 14.85 8 481 5.96 0.06 0.39 9.02 1.20 489.67 8.32 13.33 114.67 22.80
BAIHac Baise 493842.07 6246291.53 0 6.00 6 279 2.67 0.02 0.04 9.20 0.60 157.67 8.00 39.33 99.00 17.67
BARMon Barguelonne 545090.06 6347536.21 2 6.05 1 85 12.43 0.04 0.01 7.57 2.03 531.33 8.03 10.33 88.33 23.33
CELSau Cele 597974.87 6380867.77 19 17.25 1 143 8.40 0.03 0.11 8.68 0.53 249.67 7.92 3.20 100.57 22.27
GARCla Garonne 506893.70 6225179.17 53 67.00 4 388 1.73 0.01 0.02 10.33 1.17 165.33 8.07 18.37 109.67 16.63
GARMur Garonne 564902.27 6263764.69 109 83.50 1 155 2.33 0.03 0.02 9.65 0.67 214.71 8.38 6.70 112.00 22.06
LEMMol Lemboulas 566796.13 6343683.15 1 3.95 2 101 9.81 0.12 0.11 6.95 1.57 689.33 7.85 14.67 77.53 21.73
LOUFou Louge 543137.54 6243604.74 1 9.25 1 249 4.90 0.03 0.05 8.83 0.80 264.50 8.08 34.70 99.50 20.08
SALCau Salat 543868.20 6217247.36 34 32.50 5 355 1.33 0.01 0.03 10.30 1.13 165.83 8.33 3.23 107.50 17.48
VIASeg Viaur 687141.24 6355312.09 1 5.70 6 750 10.32 0.02 0.03 9.11 0.93 140.00 7.74 22.67 100.33 16.40
VOLPla Volp 546927.08 6232038.71 1 10.15 5 251 2.70 0.01 0.02 8.57 0.53 435.67 8.10 2.93 100.67 21.93
Genes 2021, 12, 107 15 of 18
Appendix B
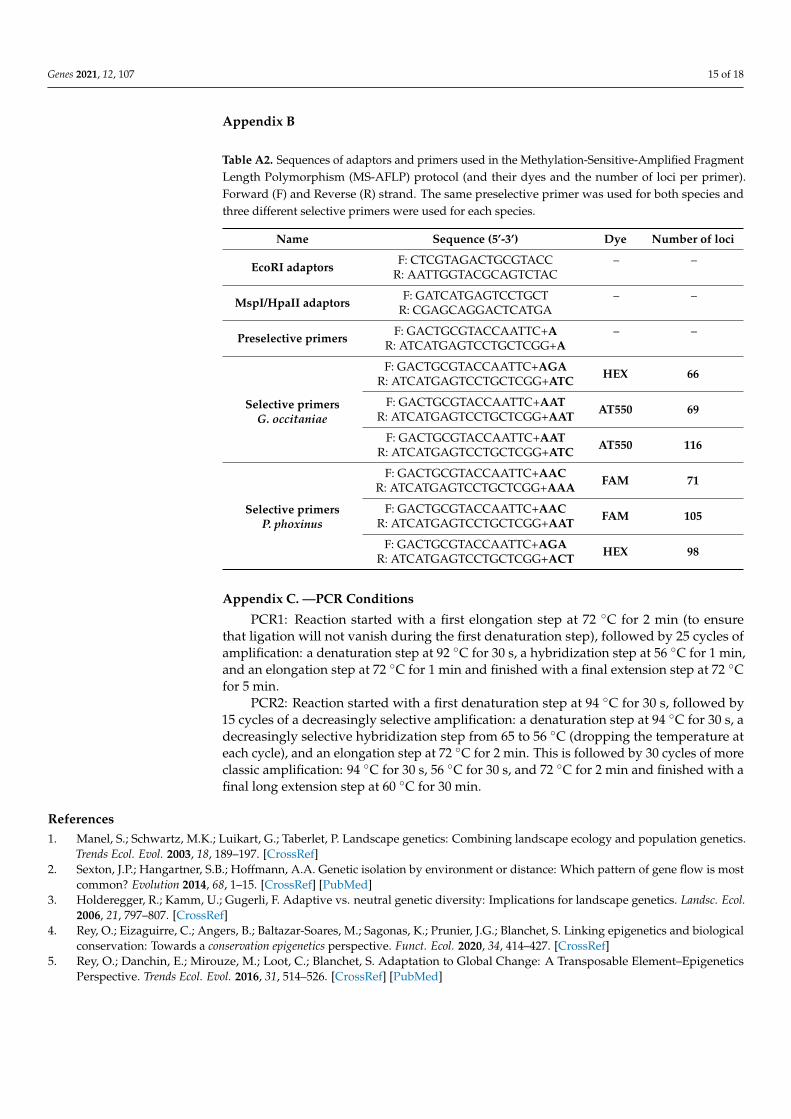
Table A2. Sequences of adaptors and primers used in the Methylation-Sensitive-Amplified FragmentLength Polymorphism (MS-AFLP) protocol (and their dyes and the number of loci per primer).Forward (F) and Reverse (R) strand. The same preselective primer was used for both species andthree different selective primers were used for each species.
Name Sequence (5’-3’) Dye Number of loci
EcoRI adaptors F: CTCGTAGACTGCGTACCR: AATTGGTACGCAGTCTAC
– –
MspI/HpaII adaptors F: GATCATGAGTCCTGCTR: CGAGCAGGACTCATGA
– –
Preselective primers F: GACTGCGTACCAATTC+AR: ATCATGAGTCCTGCTCGG+A
– –
Selective primersG. occitaniae
F: GACTGCGTACCAATTC+AGAR: ATCATGAGTCCTGCTCGG+ATC HEX 66
F: GACTGCGTACCAATTC+AATR: ATCATGAGTCCTGCTCGG+AAT AT550 69
F: GACTGCGTACCAATTC+AATR: ATCATGAGTCCTGCTCGG+ATC AT550 116
Selective primersP. phoxinus
F: GACTGCGTACCAATTC+AACR: ATCATGAGTCCTGCTCGG+AAA FAM 71
F: GACTGCGTACCAATTC+AACR: ATCATGAGTCCTGCTCGG+AAT FAM 105
F: GACTGCGTACCAATTC+AGAR: ATCATGAGTCCTGCTCGG+ACT HEX 98
Appendix C. —PCR Conditions
PCR1: Reaction started with a first elongation step at 72 ◦C for 2 min (to ensurethat ligation will not vanish during the first denaturation step), followed by 25 cycles ofamplification: a denaturation step at 92 ◦C for 30 s, a hybridization step at 56 ◦C for 1 min,and an elongation step at 72 ◦C for 1 min and finished with a final extension step at 72 ◦Cfor 5 min.
PCR2: Reaction started with a first denaturation step at 94 ◦C for 30 s, followed by15 cycles of a decreasingly selective amplification: a denaturation step at 94 ◦C for 30 s, adecreasingly selective hybridization step from 65 to 56 ◦C (dropping the temperature ateach cycle), and an elongation step at 72 ◦C for 2 min. This is followed by 30 cycles of moreclassic amplification: 94 ◦C for 30 s, 56 ◦C for 30 s, and 72 ◦C for 2 min and finished with afinal long extension step at 60 ◦C for 30 min.
References1. Manel, S.; Schwartz, M.K.; Luikart, G.; Taberlet, P. Landscape genetics: Combining landscape ecology and population genetics.
Trends Ecol. Evol. 2003, 18, 189–197. [CrossRef]2. Sexton, J.P.; Hangartner, S.B.; Hoffmann, A.A. Genetic isolation by environment or distance: Which pattern of gene flow is most
common? Evolution 2014, 68, 1–15. [CrossRef] [PubMed]3. Holderegger, R.; Kamm, U.; Gugerli, F. Adaptive vs. neutral genetic diversity: Implications for landscape genetics. Landsc. Ecol.
2006, 21, 797–807. [CrossRef]4. Rey, O.; Eizaguirre, C.; Angers, B.; Baltazar-Soares, M.; Sagonas, K.; Prunier, J.G.; Blanchet, S. Linking epigenetics and biological
conservation: Towards a conservation epigenetics perspective. Funct. Ecol. 2020, 34, 414–427. [CrossRef]5. Rey, O.; Danchin, E.; Mirouze, M.; Loot, C.; Blanchet, S. Adaptation to Global Change: A Transposable Element–Epigenetics
Perspective. Trends Ecol. Evol. 2016, 31, 514–526. [CrossRef] [PubMed]
Genes 2021, 12, 107 16 of 18
6. Richards, C.L.; Alonso, C.; Becker, C.; Bossdorf, O.; Bucher, E.; Colomé-Tatché, M.; Durka, W.; Engelhardt, J.; Gaspar, B.;Gogol-Döring, A.; et al. Ecological plant epigenetics: Evidence from model and non-model species, and the way forward. Ecol.Lett. 2017, 20. [CrossRef] [PubMed]
7. Danchin, E.; Pocheville, A.; Rey, O.; Pujol, B.; Blanchet, S. Epigenetically facilitated mutational assimilation: Epigenetics as a hubwithin the inclusive evolutionary synthesis: Epigenetics as a hub for genetic assimilation. Biol. Rev. 2019, 94, 259–282. [CrossRef]
8. Greer, E.L.; Maures, T.J.; Ucar, D.; Hauswirth, A.G.; Mancini, E.; Lim, J.P.; Benayoun, B.A.; Shi, Y.; Brunet, A. Transgenerationalepigenetic inheritance of longevity in Caenorhabditis elegans. Nature 2011, 479, 365–371. [CrossRef]
9. Nicotra, A.B.; Segal, D.L.; Hoyle, G.L.; Schrey, A.W.; Verhoeven, K.J.F.; Richards, C.L. Adaptive plasticity and epigenetic variationin response to warming in an Alpine plant. Ecol. Evol. 2015, 5, 634–647. [CrossRef]
10. Verhoeven, K.J.F.; vonHoldt, B.M.; Sork, V.L. Epigenetics in ecology and evolution: What we know and what we need to know.Mol. Ecol. 2016, 25, 1631–1638. [CrossRef]
11. Hu, J.; Barrett, R.D.H. Epigenetics in natural animal populations. J. Evol. Biol. 2017, 30, 1612–1632. [CrossRef] [PubMed]12. Feil, R.; Fraga, M.F. Epigenetics and the environment: Emerging patterns and implications. Nat. Rev. Genet. 2012, 13, 97–109.
[CrossRef] [PubMed]13. Nilsson, E.; Larsen, G.; Manikkam, M.; Guerrero-Bosagna, C.; Savenkova, M.I.; Skinner, M.K. Environmentally Induced Epigenetic
Transgenerational Inheritance of Ovarian Disease. PLoS ONE 2012, 7, e36129. [CrossRef] [PubMed]14. Alvarado, S.; Fernald, R.D.; Storey, K.B.; Szyf, M. The Dynamic Nature of DNA Methylation: A Role in Response to Social and
Seasonal Variation. Integr. Comp. Biol. 2014, 54, 68–76. [CrossRef] [PubMed]15. Lillycrop, K.A.; Burdge, G.C. Maternal diet as a modifier of offspring epigenetics. J. Dev. Orig. Health Dis. 2015, 6, 88–95.
[CrossRef]16. Berger, S.L.; Kouzarides, T.; Shiekhattar, R.; Shilatifard, A. An operational definition of epigenetics. Genes Dev. 2009, 23, 781–783.
[CrossRef]17. Jablonka, E.; Raz, G. Transgenerational Epigenetic Inheritance: Prevalence, Mechanisms, and Implications for the Study of
Heredity and Evolution. Q. Rev. Biol. 2009, 84, 131–176. [CrossRef]18. Bollati, V.; Baccarelli, A. Environmental epigenetics. Heredity 2010, 105, 105–112. [CrossRef]19. Danchin, É.; Charmantier, A.; Champagne, F.A.; Mesoudi, A.; Pujol, B.; Blanchet, S. Beyond DNA: Integrating inclusive inheritance
into an extended theory of evolution. Nat. Rev. Genet. 2011, 12, 475–486. [CrossRef]20. Richards, E.J. Inherited epigenetic variation—Revisiting soft inheritance. Nat. Rev. Genet. 2006, 7, 395–401. [CrossRef]21. Dubin, M.J.; Zhang, P.; Meng, D.; Remigereau, M.-S.; Osborne, E.J.; Paolo Casale, F.; Drewe, P.; Kahles, A.; Jean, G.; Vilhjálmsson,
B.; et al. DNA methylation in Arabidopsis has a genetic basis and shows evidence of local adaptation. eLife 2015, 4, e05255.[CrossRef] [PubMed]
22. Taudt, A.; Colomé-Tatché, M.; Johannes, F. Genetic sources of population epigenomic variation. Nat. Rev. Genet. 2016, 17, 319–332.[CrossRef] [PubMed]
23. Heo, J.B.; Lee, Y.-S.; Sung, S. Epigenetic regulation by long noncoding RNAs in plants. Chromosome Res. 2013, 21, 685–693.[CrossRef] [PubMed]
24. Harvey, Z.H.; Chen, Y.; Jarosz, D.F. Protein-Based Inheritance: Epigenetics beyond the Chromosome. Mol. Cell 2018, 69, 195–202.[CrossRef] [PubMed]
25. Norouzitallab, P.; Baruah, K.; Vanrompay, D.; Bossier, P. Can epigenetics translate environmental cues into phenotypes? Sci. TotalEnviron. 2019, 647, 1281–1293. [CrossRef]
26. Herrera, C.M.; Medrano, M.; Bazaga, P. Comparative spatial genetics and epigenetics of plant populations: Heuristic value and aproof of concept. Mol. Ecol. 2016, 25, 1653–1664. [CrossRef] [PubMed]
27. Trucchi, E.; Mazzarella, A.B.; Gilfillan, G.D.; Lorenzo, M.T.; Schönswetter, P.; Paun, O. BsRADseq: Screening DNA methylation innatural populations of non-model species. Mol. Ecol. 2016, 25, 1697–1713. [CrossRef]
28. Richards, C.L.; Bossdorf, O.; Verhoeven, K.J.F. Understanding natural epigenetic variation: Commentary. New Phytol. 2010, 187,562–564. [CrossRef]
29. Cubas, P.; Vincent, C.; Coen, E. An epigenetic mutation responsible for natural variation in floral symmetry. Nature 1999, 401,157–161. [CrossRef]
30. Issa, J.-P. Aging and epigenetic drift: A vicious cycle. J. Clin. Investig. 2014, 124, 24–29. [CrossRef]31. Shan, X.H.; Li, Y.D.; Liu, X.M.; Wu, Y.; Zhang, M.Z.; Guo, W.L.; Liu, B.; Yuan, Y.P. Comparative analyses of genetic/epigenetic
diversities and structures in a wild barley species (Hordeum brevisubulatum) using MSAP, SSAP and AFLP. Genet. Mol. Res.2012, 11, 2749–2759. [CrossRef] [PubMed]
32. Lele, L.; Ning, D.; Cuiping, P.; Xiao, G.; Weihua, G. Genetic and epigenetic variations associated with adaptation to heterogeneoushabitat conditions in a deciduous shrub. Ecol. Evol. 2018, 8, 2594–2606. [CrossRef] [PubMed]
33. Liu, S.; Sun, K.; Jiang, T.; Ho, J.P.; Liu, B.; Feng, J. Natural epigenetic variation in the female great roundleaf bat (Hipposiderosarmiger) populations. Mol. Genet. Genom. 2012, 287, 643–650. [CrossRef] [PubMed]
34. Sheldon, E.L.; Schrey, A.; Andrew, S.C.; Ragsdale, A.; Griffith, S.C. Epigenetic and genetic variation among three separateintroductions of the house sparrow (Passer domesticus) into Australia. R. Soc. Open Sci. 2018, 5, 172185. [CrossRef] [PubMed]
Genes 2021, 12, 107 17 of 18
35. Foust, C.M.; Preite, V.; Schrey, A.W.; Alvarez, M.; Robertson, M.H.; Verhoeven, K.J.F.; Richards, C.L. Genetic and epigeneticdifferences associated with environmental gradients in replicate populations of two salt marsh perennials. Mol. Ecol. 2016, 25,1639–1652. [CrossRef] [PubMed]
36. Ni, P.; Li, S.; Lin, Y.; Xiong, W.; Huang, X.; Zhan, A. Methylation divergence of invasive Ciona ascidians: Significant populationstructure and local environmental influence. Ecol. Evol. 2018, 8, 10272–10287. [CrossRef]
37. Bossdorf, O.; Richards, C.L.; Pigliucci, M. Epigenetics for ecologists. Ecol. Lett. 2007, 11, 106–115. [CrossRef]38. Fourtune, L.; Paz-Vinas, I.; Loot, G.; Prunier, J.G.; Blanchet, S. Lessons from the fish: A multi-species analysis reveals common
processes underlying similar species-genetic diversity correlations. Freshw. Biol. 2016, 61, 1830–1845. [CrossRef]39. Fourtune, L.; Prunier, J.G.; Mathieu-Begne, E.; Canto, N.; Veyssiere, C.; Loot, G.; Blanchet, S. Intraspecific genetic and phenotypic
diversity: Parallel processes and correlated patterns? BioRxiv 2018, arXiv:288357. [CrossRef]40. Buisson, L.; Blanc, L.; Grenouillet, G. Modelling stream fish species distribution in a river network: The relative effects of
temperature versus physical factors. Ecol. Freshw. Fish 2008, 17, 244–257. [CrossRef]41. Crispo, E.; Chapman, L.J. Population genetic structure across dissolved oxygen regimes in an African cichlid fish: POPULATION
STRUCTURE ACROSS OXYGEN REGIMES. Mol. Ecol. 2008, 17, 2134–2148. [CrossRef] [PubMed]42. Gama-Sosa, M.A.; Midgett, R.M.; Slagel, V.A.; Githens, S.; Kuo, K.C.; Gehrke, C.W.; Ehrlich, M. Tissue-specific differences in DNA
methylation in various mammals. Biochim. Biophys. Acta Gene Struct. Expr. 1983, 740, 212–219. [CrossRef]43. Sun, Y.; Hou, R.; Fu, X.; Sun, C.; Wang, S.; Wang, C.; Li, N.; Zhang, L.; Bao, Z. Genome-Wide Analysis of DNA Methylation in
Five Tissues of Zhikong Scallop, Chlamys farreri. PLoS ONE 2014, 9, e86232. [CrossRef] [PubMed]44. Yang, C.; Zhang, Y.; Liu, W.; Lu, X.; Li, C. Genome-wide analysis of DNA methylation in five tissues of sika deer (Cervus nippon).
Gene 2018, 645, 48–54. [CrossRef]45. Blanchet, S.; Páez, D.J.; Bernatchez, L.; Dodson, J.J. An integrated comparison of captive-bred and wild Atlantic salmon (Salmo
salar): Implications for supportive breeding programs. Biol. Conserv. 2008, 141, 1989–1999. [CrossRef]46. Paez, D.J.; Hedger, R.; Bernatchez, L.; Dodson, J.J. The morphological plastic response to water current velocity varies with age
and sexual state in juvenile Atlantic salmon, Salmo salar. Freshw. Biol. 2008, 53, 1544–1554. [CrossRef]47. Pella, H.; Lejot, J.; Lamouroux, N.; Snelder, T. Le réseau hydrographique théorique (RHT) français et ses attributs environnemen-
taux. Géomorphologie Relief Process. Environ. 2012, 18, 317–336. [CrossRef]48. Prunier, J.G.; Dubut, V.; Loot, G.; Tudesque, L.; Blanchet, S. The relative contribution of river network structure and anthropogenic
stressors to spatial patterns of genetic diversity in two freshwater fishes: A multiple-stressors approach. Freshw. Biol. 2018, 63,6–21. [CrossRef]
49. Dray, S.; Dufour, A.-B. The ade4 Package: Implementing the Duality Diagram for Ecologists. J. Stat. Soft. 2007, 22. [CrossRef]50. Aljanabi, S. Universal and rapid salt-extraction of high quality genomic DNA for PCR- based techniques. Nucleic Acids Res. 1997,
25, 4692–4693. [CrossRef]51. Schlötterer, C.; Tobler, R.; Kofler, R.; Nolte, V. Sequencing pools of individuals—mining genome-wide polymorphism data
without big funding. Nat. Rev. Genet. 2014, 15, 749–763. [CrossRef] [PubMed]52. Prunier, J.G.; Chevalier, M.; Raffard, A.; Loot, G.; Poulet, N.; Blanchet, S. Contemporary loss of genetic diversity in wild fish
populations reduces biomass stability over time. BioRxiv 2019, arXiv:884734. [CrossRef]53. Vos, P.; Hogers, R.; Bleeker, M.; Reijans, M.; van de Lee, T.; Hornes, M.; Friters, A.; Pot, J.; Paleman, J.; Kuiper, M.; et al. AFLP: A
new technique for DNA fingerprinting. Nucleic Acids Res. 1995, 23, 4407–4414. [CrossRef] [PubMed]54. Schulz, B.; Eckstein, R.L.; Durka, W. Scoring and analysis of methylation-sensitive amplification polymorphisms for epigenetic
population studies. Mol. Ecol. Res. 2013, 13, 642–653. [CrossRef] [PubMed]55. Xiong, L.Z.; Zhang, Q. Patterns of cytosine methylation in an elite rice hybrid and its parental lines, detected by a methylation-
sensitive amplification polymorphism technique. Mol. Gen. Genet. MGG 1999, 261, 439–446. [CrossRef]56. Smith, T.A.; Martin, M.D.; Nguyen, M.; Mendelson, T.C. Epigenetic divergence as a potential first step in darter speciation. Mol.
Ecol. 2016, 25, 1883–1894. [CrossRef]57. Caballero, A.; Quesada, H.; Rolán-Alvarez, E. Impact of Amplified Fragment Length Polymorphism Size Homoplasy on the
Estimation of Population Genetic Diversity and the Detection of Selective Loci. Genetics 2008, 179, 539–554. [CrossRef]58. Meirmans, P.G.; Hedrick, P.W. Assessing population structure: FST and related measures: Invited technical review. Mol. Ecol. Res.
2011, 11, 5–18. [CrossRef]59. Prunier, J.G.; Poesy, C.; Dubut, V.; Veyssière, C.; Loot, G.; Poulet, N.; Blanchet, S. Quantifying the individual impact of artificial
barriers in freshwaters: A standardized and absolute genetic index of fragmentation. Evol. Appl. 2020, 13, 2566–2581. [CrossRef]60. Ellegren, H. Microsatellites: Simple sequences with complex evolution. Nat. Rev. Genet. 2004, 5, 435–445. [CrossRef]61. Gutiérrez-Velázquez, M.V.; Almaraz-Abarca, N.; Herrera-Arrieta, Y.; Ávila-Reyes, J.A.; González-Valdez, L.S.; Torres-Ricario, R.;
Uribe-Soto, J.N.; Monreal-García, H.M. Comparison of the phenolic contents and epigenetic and genetic variability of wild andcultivated watercress (Rorippa nasturtium var. aquaticum L.). Electron. J. Biotechnol. 2018, 34, 9–16. [CrossRef]
62. Avramidou, E.V.; Ganopoulos, I.V.; Doulis, A.G.; Tsaftaris, A.S.; Aravanopoulos, F.A. Beyond population genetics: Naturalepigenetic variation in wild cherry (Prunus avium). Tree Genet. Genomes 2015, 11, 95. [CrossRef]
63. Herrera, C.M.; Medrano, M.; Bazaga, P. Comparative epigenetic and genetic spatial structure of the perennial herb Helleborusfoetidus: Isolation by environment, isolation by distance, and functional trait divergence. Am. J. Bot. 2017, 104, 1195–1204.[CrossRef] [PubMed]
Genes 2021, 12, 107 18 of 18
64. Roy, N.; Choi, J.-Y.; Lim, M.-J.; Lee, S.-I.; Choi, H.-J.; Kim, N.-S. Genetic and epigenetic diversity among dent, waxy, and sweetcorns. Genes Genom. 2015, 37, 865–874. [CrossRef]
65. Guo, W.; Hussain, N.; Wu, R.; Liu, B. High hypomethylation and epigenetic variation in fragmented populations of wild barley(Hordeum brevisubulatum). Pak. J. Bot. 2018, 50, 1379–1386.
66. Duchemin, W.; Anselmetti, Y.; Patterson, M.; Ponty, Y.; Bérard, S.; Chauve, C.; Scornavacca, C.; Daubin, V.; Tannier, E. DeCoSTAR:Reconstructing the Ancestral Organization of Genes or Genomes Using Reconciled Phylogenies. Genome Biol. Evol. 2017, 9,1312–1319. [CrossRef]
67. DeFaveri, J.; Viitaniemi, H.; Leder, E.; Merilä, J. Characterizing genic and nongenic molecular markers: Comparison of microsatel-lites and SNPs. Mol. Ecol. Resour. 2013, 13, 377–392. [CrossRef]
68. Nosil, P.; Funk, D.J.; Ortiz-Barrientos, D. Divergent selection and heterogeneous genomic divergence. Mol. Ecol. 2009, 18, 375–402.[CrossRef]
69. Fourtune, L.; Prunier, J.G.; Paz-Vinas, I.; Loot, G.; Veyssière, C.; Blanchet, S. Inferring Causalities in Landscape Genetics: AnExtension of Wright’s Causal Modeling to Distance Matrices. Am. Nat. 2018, 191, 491–508. [CrossRef]
70. Smith, G.; Ritchie, M.G. How might epigenetics contribute to ecological speciation? Curr. Zool. 2013, 59, 686–696. [CrossRef]71. McMahon, B.J.; Teeling, E.C.; Ho, J. How and why should we implement genomics into conservation? Evol. Appl. 2014, 7,
999–1007. [CrossRef] [PubMed]72. Shafer, A.B.A.; Wolf, J.B.W.; Alves, P.C.; Bergström, L.; Bruford, M.W.; Brännström, I.; Colling, G.; Dalén, L.; De Meester, L.;
Ekblom, R.; et al. Genomics and the challenging translation into conservation practice. Trends Ecol. Evol. 2015, 30, 78–87.[CrossRef] [PubMed]
73. Eizaguirre, C.; Baltazar-Soares, M. Evolutionary conservation-evaluating the adaptive potential of species. Evol. Appl. 2014, 7,963–967. [CrossRef]
74. Massicotte, R.; Angers, B. General-Purpose Genotype or How Epigenetics Extend the Flexibility of a Genotype. Genet. Res. Int.2012, 2012, 1–7. [CrossRef] [PubMed]
75. Jiang, Q.; Li, Q.; Yu, H.; Kong, L.-F. Genetic and epigenetic variation in mass selection populations of Pacific oyster Crassostreagigas. Genes Genom. 2013, 35, 641–647. [CrossRef]
76. Zhang, X.; Li, Q.; Kong, L.; Yu, H. Epigenetic variation of wild populations of the Pacific oyster Crassostrea gigas determined bymethylation-sensitive amplified polymorphism analysis. Fish. Sci. 2018, 84, 61–70. [CrossRef]
77. Liebl, A.L.; Schrey, A.W.; Richards, C.L.; Martin, L.B. Patterns of DNA Methylation Throughout a Range Expansion of anIntroduced Songbird. Integr. Comp. Biol. 2013, 53, 351–358. [CrossRef]
78. Schrey, A.W.; Alvarez, M.; Foust, C.M.; Kilvitis, H.J.; Lee, J.D.; Liebl, A.L.; Martin, L.B.; Richards, C.L.; Robertson, M. EcologicalEpigenetics: Beyond MS-AFLP. Integr. Comp. Biol. 2013, 53, 340–350. [CrossRef]
79. Wenzel, M.A.; Piertney, S.B. Fine-scale population epigenetic structure in relation to gastrointestinal parasite load in red grouse(Lagopus lagopus scotica). Mol. Ecol. 2014, 23, 4256–4273. [CrossRef]
80. Wogan, G.O.U.; Yuan, M.L.; Mahler, D.L.; Wang, I.J. Genome-wide epigenetic isolation by environment in a widespread Anolislizard. Mol. Ecol. 2020, 29, 40–55. [CrossRef]
81. Johnson, K.M.; Kelly, M.W. Population epigenetic divergence exceeds genetic divergence in the Eastern oyster Crassostrea virginicain the Northern Gulf of Mexico. Evol. Appl. 2020, 13, 945–959. [CrossRef] [PubMed]
82. Baldanzi, S.; Watson, R.; McQuaid, C.D.; Gouws, G.; Porri, F. Epigenetic variation among natural populations of the South Africansandhopper Talorchestia capensis. Evol. Ecol. 2017, 31, 77–91. [CrossRef]
83. Watson, R.G.A.; Baldanzi, S.; Pérez-Figueroa, A.; Gouws, G.; Porri, F. Morphological and epigenetic variation in mussels fromcontrasting environments. Mar. Biol. 2018, 165, 50. [CrossRef]
84. Hawes, N.A.; Amadoru, A.; Tremblay, L.A.; Pochon, X.; Dunphy, B.; Fidler, A.E.; Smith, K.F. Epigenetic patterns associated withan ascidian invasion: A comparison of closely related clades in their native and introduced ranges. Sci. Rep. 2019, 9, 14275.[CrossRef] [PubMed]
85. Banerjee, A.K.; Guo, W.; Huang, Y. Genetic and epigenetic regulation of phenotypic variation in invasive plants—linking researchtrends towards a unified framework. NB 2019, 49, 77–103. [CrossRef]
86. Robertson, M.; Richards, C. Opportunities and challenges of next-generation sequencing applications in ecological epigenetics.Mol. Ecol. 2015, 24, 3799–3801. [CrossRef] [PubMed]
87. Schield, D.R.; Walsh, M.R.; Card, D.C.; Andrew, A.L.; Adams, R.H.; Castoe, T.A. EpiRADseq: Scalable analysis of genomewidepatterns of methylation using next-generation sequencing. Methods Ecol. Evol. 2016, 7, 60–69. [CrossRef]
88. van Gurp, T.P.; Wagemaker, N.C.A.M.; Wouters, B.; Vergeer, P.; Ouborg, J.N.J.; Verhoeven, K.J.F. epiGBS: Reference-free reducedrepresentation bisulfite sequencing. Nat. Methods 2016, 13, 322–324. [CrossRef]
89. Paun, O.; Verhoeven, K.J.F.; Richards, C.L. Opportunities and Limitations of Reduced Representation Bisulfite Sequencing inPlant Ecological Epigenomics. New Phytol. 2019, 221, 738–742. [CrossRef]
90. Hirsch, S.; Baumberger, R.; Grossniklaus, U. Epigenetic Variation, Inheritance, and Selection in Plant Populations. Cold SpringHarb. Symp. Quant. Biol. 2012, 77, 97–104. [CrossRef]