Pattern-Sensitive Epilepsy. I: A Demonstration of a Spatial Frequency Selective Epileptic Response...
12
Epilepsia, 21:301-312, 1980. Raven Press, New York Pattern-Sensitive Epilepsy. I: A Demonstration of a Spatial Frequency Selective Epileptic Response to Gratings *Michael J. Soso, Ettore Lettich, and tJack H. Belgum Division oj Electroencephalography and Clinical Neurophysiology , Department of Laboratory Medicine, and Departments of PhysiologylBiophysics and Psychology, University oj Washington. Seattle, Washington 981 95 Summary: Rare individuals suffer epileptic seizures when they view certain images, particularly stripes. Contrast-threshold functions (the ability to see faint stripes of various widths) were determined for two pattern-sensitive brothers, and the epileptogenicity of various patterns was assessed for one of them. Sine wave grating contrast-detection thresholds for the two subjects were essentially normal, with lowest thresholds at approximately 2 cycles/ degree (cldeg). Epileptiform discharges occurred maximally at 5 cldeg with a I-octave 50% bandwidth. Pattern epileptogenicity was increased by the addi- tion of a third harmonic sine wave grating to its fundamental, but was unaf- fected by the phase relation of the two gratings. The frequency selectivity of epileptic responsiveness was quantitatively similar to a “spatial frequency channel.” Inhibitory interactions were not present. The findings suggest rela- tions between the phenomena of pattern-sensitive epilepsy and hypothesized spatial frequency channels which merit further exploration. Pattern-sensitive epilepsy is charac- terized by seizures precipitated by visual patterns, particularly stripes. This was first described by Bickford et al. (1953).’ Cha- trian et al. (1970a,b) qualitatively studied pattern epileptogenicity (the ability of pat- tern presentation to induce EEG discharge) for their Case 1 by systematically varying grating distance or the separation of grating lines. At the 10 distances tested, their grat- ing produced spatial frequencies ranging from 1.4 to 14 cycles/degree (c/deg). Maximum epileptogenicity occurred be- tween 2.8 and 5.6 c/deg. Varying the line separation produced gratings with spatial frequencies of 1.0, 1.5, 2.4,4.8,7.2, and 14 Received November 16, 1979; revised March 4, 1980. Key words: Pattern-sensitive epilepsySpatia1 frequency channelsSine and square wave gratings. * Present address: Department of Medicine, Resident, Presbyterian University Hospital, Pittsburgh, Pennsyl- t Present address: Department of Physiology, Medical Science Building, The University of Michigan, Ann Presented in part at the Western Electroencephalography Society Meeting in Salt Lake City, Utah, February A bibliography of publications on pattern-sensitive epilepsy is available from the first author. vania 15213. Arbor, Michigan 48104. 17, 1978. 301
-
Upload
independent -
Category
Documents
-
view
2 -
download
0
Transcript of Pattern-Sensitive Epilepsy. I: A Demonstration of a Spatial Frequency Selective Epileptic Response...

Epilepsia, 21:301-312, 1980. Raven Press, New York
Pattern-Sensitive Epilepsy. I: A Demonstration of a Spatial Frequency Selective Epileptic
Response to Gratings
*Michael J. Soso, Ettore Lettich, and tJack H. Belgum
Division o j Electroencephalography and Clinical Neurophysiology , Department of Laboratory Medicine, and Departments of
PhysiologylBiophysics and Psychology, University oj Washington. Seattle, Washington 981 95
Summary: Rare individuals suffer epileptic seizures when they view certain images, particularly stripes. Contrast-threshold functions (the ability to see faint stripes of various widths) were determined for two pattern-sensitive brothers, and the epileptogenicity of various patterns was assessed for one of them. Sine wave grating contrast-detection thresholds for the two subjects were essentially normal, with lowest thresholds at approximately 2 cycles/ degree (cldeg). Epileptiform discharges occurred maximally at 5 cldeg with a I-octave 50% bandwidth. Pattern epileptogenicity was increased by the addi- tion of a third harmonic sine wave grating to its fundamental, but was unaf- fected by the phase relation of the two gratings. The frequency selectivity of epileptic responsiveness was quantitatively similar to a “spatial frequency channel.” Inhibitory interactions were not present. The findings suggest rela- tions between the phenomena of pattern-sensitive epilepsy and hypothesized spatial frequency channels which merit further exploration.
Pattern-sensitive epilepsy is charac- terized by seizures precipitated by visual patterns, particularly stripes. This was first described by Bickford et al. (1953).’ Cha- trian et al. (1970a,b) qualitatively studied pattern epileptogenicity (the ability of pat- tern presentation to induce EEG discharge) for their Case 1 by systematically varying
grating distance or the separation of grating lines. At the 10 distances tested, their grat- ing produced spatial frequencies ranging from 1.4 to 14 cycles/degree (c/deg). Maximum epileptogenicity occurred be- tween 2.8 and 5.6 c/deg. Varying the line separation produced gratings with spatial frequencies of 1.0, 1.5, 2.4,4.8,7.2, and 14
Received November 16, 1979; revised March 4, 1980. Key words: Pattern-sensitive epi lepsySpat ia1 frequency channelsSine and square wave gratings. * Present address: Department of Medicine, Resident, Presbyterian University Hospital, Pittsburgh, Pennsyl-
t Present address: Department of Physiology, Medical Science Building, The University of Michigan, Ann
Presented in part at the Western Electroencephalography Society Meeting in Salt Lake City, Utah, February
A bibliography of publications on pattern-sensitive epilepsy is available from the first author.
vania 15213.
Arbor, Michigan 48104.
17, 1978.
301

302 M . J . SOSO ET AL.
c/deg. The largest response occurred at 4.8 and 7.2 c/deg.
Fourier analysis of the patterns employed by Chatrian et al. (1970~) (Soso, 1975) suggested important interactions between grating fundamentals and their harmonics. For example, they employed a highly epileptogenic square grating with a funda- mental spatial frequency of 8.72 c/deg, a 3f harmonic of 26.2 c/deg, and a 5f harmonic of 43.6 c/deg. The 5f harmonic was proba- bly below threshold. Rectangular grating A of their figure 6 had a fundamental of 14.0 c/deg, a 2f harmonic of 28 c/deg, and a 3f harmonic of 42 c/deg; this was nonepilep- togenic.
Rectangular grating E of their figure 6 had a fundamental spatial frequency of 8.38 c/deg with 2f, 3f, and 4f harmonics of 16.8, 25.1, and 33.5, respectively. This also was not epileptogenic. When a 4.8 cldeg rectan- gular grating was defocused, which lowers the relative amplitude of the higher har- monics , epi leptogenici ty dec reased markedly.
This analysis suggests the epileptogenic- ity depends on a strong fundamental near 5 c/deg and/or a favorable relation between the fundamental and the harmonics (cf. the 8.72 c/deg square grating to pattern A-the harmonics are similar, but the fundamentals differ; cf. the 8.72 c/deg square grating to pattern E-the fundamentals are similar, but the upper harmonics differ; cf. the fo- cused and unfocused rectangular grating).
Their Case 4 was tested with gratings having spatial frequencies from 0.370 to 4.2 c/deg. Responses consistently occurred at 2.7 c/deg and also, although erratically, at 3.4 and 4.2 cldeg but did not occur at or below 2.0 c/deg (Chatrian and Lettich, per- sonal communication).
Wilkins et al. (1979) have contributed the most extensive study of the effect of spatial frequency on pattern epileptogenicity. All of their subjects responded maximally to patterns with spatial frequencies between 1 and 4 c/deg. Four of their subjects re-
sponded to relatively narrow ranges of spa- tial frequency.
The above resul ts suggest spatial- frequency selectivity. The following three sets of experiments represent a progressive analysis, using the techniques of visual psychophysics, of the pattern sensitivity of Case 1 of Chatrian et al. (1970a,b). The first series of experiments involve mea- surements of the ability to see faint stripes, a test widely considered to be a powerful method for assessing visual function (Sekuler, 1974) and analogous to modem methods for testing optical systems and many types of transducers. In the second set of experiments, pattern epileptogenicity was tested as a function of two variables, spatial frequency and contrast, in order to determine if their e'ffects are consistent with predictions based on the prior findings dis- cussed above. Finally, experiments are de- scribed which use complex gratings (grat- ings composed of two or more sine gratings) in order to test certain predictions about their effects.
METHODS Subjects
Our subjects were Cases 1 and 2 of Cha- trian et al. (1970a,b). The reader is referred to their paper for detailed histories of these patients. Pertinent recent details are de- scribed here.
Case I A 25-year-old male continued to have
several generalized seizures each year. The frequency of his staring spells was reduced by increasing his daily dosage of primidone (Mysoline) from 250 mg twice daily to 250 mg 4 times daily. His daily regimen in- cluded paramethadione (Paradione), 900 mg; primidone (Mysoline), lo00 mg; phe- nytoin (Dilantin), 100 mg; and, occasion- ally, phenobarbital, 60 mg at bedtime. Re- peated general and neurological examina- tions (Dr. R. J. Wilkus) were within normal
Epilepsia, Vol. 21, June 1980

PATTERN-SENSITIVE EPILEPSY. I 303
limits. The patient continued to have a low-grade astigmatism (O.D.: -0.20 + S O
20/20). On his current medications, Case 1 was no longer sensitive to intermittent pho- tie stimulation, but retained his pattern sensitivity. He was extremely cooperative throughout the extended present studies.
Case 2 The 16-year-old brother of Case 1 had a
normal general and neurological examina- tion (Dr. R. L. Matthews). He had a mild myopia (O.D.: -1.50 = 20/20; O.S.: -2.00 x 50 = 20/20). The patient, resenting his clinical diagnosis of pattern-sensitive epilepsy, refused medications for over a year without any ill effects until he suffered a generalized pattern-induced seizure sev- eral days before examination. He cooper- ated adequately during testing.
Both subjects, were consenting, remun- erated volunteers, participating with in- stitutional approval. Their safety was in- sured by continuous EEG monitoring and by restricting pattern presentation times to 10 sec, except under special circumstances, at which time additional precautions were taken. At no time did the subjects exhibit any clinical symptoms (including staring, eyelid flutter, or clonic jerking), despite, at times, large electrographic activity.
The control subjects were a 25-year-old male who wore clinically fitted contact lenses to correct a myopic cortdition and a 24-year-old emmetropic male. Both sub- j e c t s w e r e e x p e r i e n c e d w i t h v i sua l psychophysics experiments.
Equipment Visual stimuli were produced on an os-
cilloscope by the method of Campbell and Green (1965). The x- and y-axes were mod- ulated by waveform generators to form a raster, which was then modulated by z-axis input. Low-contrast sine gratings (stripes with a horizontal sinusoidal luminance pro- file) were generated by modulating the z-
x 180 = 20/20; O.S.: -.25 + .50 X 135 =
axis (brightness) of a Tektronix 602 oscil- loscope with a sine-wave generator. A voltage-controlled wave generator was used to modulate the z-axis in order to gen- erate high-contrast square gratings and phase-locked harmonic sine gratings. The generator outputs were applied to the axis through an operational amplifiedmixer. The space-averaged luminance (L) of the grat- ing, 68.5 candles/m*, was measured daily with a photometer. Percentage contrast, defined as (Lmax - LmiJWmax + LmiJ X loo%, was measured by vernier-scanning a magnified image of the grating with a photomultiplier photometer.
The oscilloscope gratings were viewed binocularly from a distance of 135 cm ex- cept where otherwise indicated. All grating presentations contained a minimum of 10 cycles of stripes. The display was framed by a 7.3 x 10.5 cm, similarly colored ( y e l l o w - g r e e n ) , b u t d a r k e r ( 0 . 3 4 3 candledm,) background. The position of each subject’s head was maintained with head and chin rests.
EEG recordings were obtained with a 16-channel e lectroencephalograph via electrodes placed according to the Interna- tional 10-20 system, secured with collodion, and filled with conducting jelly.
Electrodes usually included those desig- nated 01, P3, CI, 0,, P4 and C4, with each hemisphere referenced to the contralateral earlobe A, or A,. Additional periorbital electrodes recorded electro-oculograms. Other channels were employed to monitor pa t te rn presenta t ions and subject re- sponses. The system bandpass was 0.5-70- Hz (-3 dB) at the inkwriters and 0.5-625 Hz (-3 dB) when recorded on an FM mag- netic tape recorder.
Procedures Contrast-Detection Thresholds
The ability of the subjects to detect grat- ings was determined by a modification of the method of limits. As each subject viewed the oscilloscope screen, the con-
Epilepsie, Vol. 21, June 1980
304 M . J . SOSO ET AL.
trast of the sinusoidal gratings was in- creased at variable rates until they were detected. Data were obtained by giving subjects a brief, low-contrast “preview” of the grating and then obtaining mea- surements from 2 “preliminary” trials (dis- carded) and 4 to 5 actual trials. This process was repeated for several spatial frequen- cies. Case 1 participated in 1,234 practice trials before data were collected.
Additional thresholds were obtained for Case 1 by the method of temporal 2- alternative forced-choice (Green and Swets, 1966). A pair of 1,000-Hz tones, 2 sec in duration and separated by 0.9 sec, indicated the trial. A low-contrast 5 c/deg sine grating was presented during one of the tone intervals, and the subject’s task was to identify which interval of the pair coincided with pattern presentation. Following a brief training period, 562 measurements were made utilizing pattern contrast ranging from .078% to .83% contrast.
Pattern Epileptogenicity While Case 1 viewed the oscilloscope
screen with a steady gaze, a faint sine or square grating (stripes with blurred or sharp edges, respectively) was presented for 10 sec, five times in succession, with interpre- sentation intervals of 10 to I5 sec. After each series of 5 presentations, contrast was raised by 3 dB until the limit of scope con- trast linearity, approximately 85%, was at- tained. This process was performed at spa- tial frequencies of 2, 5 , 7, and 9 c/deg and occasionally at 1 and 10 c/deg. All gratings were vertical and stationary. Epileptiform discharges in the form of spikes or multiple spikes, alone or associated with slow waves, occurring in the 6 EEG leads during the 5 presentations were totaled and con- stitute the data presented in the following graphs and tables. The spikes counted were transients larger in amplitude than the background activity with a total duration of 20 to 70 msec (Chatrian et al., 1974). Every spike occurring in the 6 electrode tracings was identified by two observers (M. J. S.
and E. L.) and tabulated. Typical dis- charges are illustrated in Fig. 2.
Responses to Complex Gratings Complex gratings consist of two or more
superimposed sine gratings. By this defini- tion, a square grating is a complex grating composed of an infinite series of sine grat- ings. The relationships among sine, square, and complex (5 + 15 c/deg) gratings were examined with three types of tests. On some experimental days, spike discharges in response to both sine and square gratings equalized for peak-to-peak contrast were collected in the manner described above. In the second type of test, vertical sine grat- ings of 5 and 15 c/deg were superimposed in a subtractive (“square”) phase relation, with the amplitude, of the 15 c/deg grating equal to % that of the 5 c/deg grating. This complex grating constitutes the first two components of a square grating. Series of 5 presentations of this complex grating were alternated with 5 presentations of the fun- damental alone. This test was an approxi- mate comparison of sine and square grat- ings equalized for contrast of their funda- mentals. In the third type of test, the phase relations between the third harmonic and the fundamental were varied so that the peaks either subtracted (square wave con- figuration) or added (“triangle” wave con- figuration). Detection thresholds for the two phase relations were determined by the method of 2-alternative forced-choice. The epileptic discharges produced by the two phase relations were examined by alter- nating the two conditions every other, every second, or every fifth presentation.
RESULTS Contrast-Detection Thresholds
For Case 1 and the control subject (Fig. 1), linearly increasing spatial frequency (decreasing stripe width) required an ap- proximately logarithmic increase of con- trast to permit detection. Case 1, however, required 10 to 12 dB more contrast (ap- proximately 4 times as much contrast) at
Epilepsia, Vol. 27, June 7980
PATTERN-SENSITIVE EPILEPSY. 1 305
: I I NOV.
::2 OCT.
26.00 - \
L 8
8.20 - (I, T 2.60 - 2 8 0-82 -
0.26 -
I I I I I J 5 10 15 20
SPATIAL FREQUENCY (c/deg)
FIG. 1. Contrast detection and discharge thresholds. Thresholds for pattern detection and epileptogenesis are plotted as a function of spatial frequency and contrast of a vertical grating presented at a distance of 135 cm except for 17.5.20, and 25 c/deg, which were obtained at 270 cm. The bottom curve (A) presents the thresholds for detection of a sine grating by a control subject (94 determinations). The upper curve (0) presents the thresholds of Case 1 (205 determinations). The tilled square and triangle represent the 2-alternative forced-choice thresholds for Case 1 and the control subject, respectively, determined for 5 c/deg. The smaller upper curves represent the onset of epileptiform discharges in the EEG of Case 1 as contrast was increased (see text). On 11 Nov. and 2 Oct., thresholds for discharge at 9 c/deg were not reached, and this is indicated by upgoing dashed lines.
each spatial frequency before his criterion for detection was met. Thresholds for Case 2 were similar to those of the control sub- jects.
The criterion-free method of 2-alternative forced-choice was employed to determine how much of the threshold difference be- tween Case 1 and the control subjects was
FIG. 2. Effect of contrast changes. EEG tracings recorded during the presentation of vertical square gratings demonstrate the effects of increasing contrast from 15 to 82%. The line labeled "pattern" represents a gating voltage which turned on pattern presentation.
Epilepsia, Vol. 21, June 1980

306 M . J . SOSO ET AL.
SOUARE GRATINOS
- . - - - a . . - . . . . - - . - - _ . -
due to criterion rather than ability to detect faint gratings (Kelly and Savoie, 1973). Threshold (75% correct) occurred at 0.36% contrast. The control subject’s threshold was 0.23% contrast. Thus, Case 1 required 4 dB (1.58 times) as much contrast to detect the stripes as did the control subject.
Pattern Epileptogenicity It is worth noting that “occasional, ap-
parently spontaneous” discharges were ob- served by Chatrian et al. (1970a,b). At that time, Case 1 was new to the clinic and his medication regimen had not yet been opti- mally adjusted. In the present study, occa- sional spontaneous discharges occurred in the EEG while the subject viewed a blank oscilloscope screen. These discharges were present mostly in the occipital electrodes (01 and 0,) with a few in P4. On October 1, 2,838 spikes occurred during grating pre- sentation and 3 spikes (0.11%) occurred with the screen blank. This was typical of other experimental days, except for November 12, when he was unusually ac- tive: 4,397 spikes were recorded during stimulation and 125 (2.8%) occurred spon- taneously. Therefore, spontaneous epilep- tiform activity formed only a small part of the total epileptiform discharges.
As pattern contrast was increased, epileptiform discharges eventually ap- peared in the EEG. The top four lines of Fig. 1 represent the contrast thresholds of Case 1 for electrographic epileptic dis- charge in response to square-grating pre- sentations on 4 different days. The criterion for threshold was a total of 20 spikes during the 5 presentations. The results indicate that less contrast was necessary for dis- charge at 5 and 7 c/deg than at the other spatial frequencies.
The EEG tracings depicted in Fig. 2 show epileptiform discharges as a function of contrast. Figure 3A (Nov. 12) presents an overview of epileptiform discharges as a function of contrast and spatial frequency of square gratings. The rapid rise of dis- charge count in response to increasing contrast of a 5 c/deg square wave grating is particularly prominent. The 5 c/deg gratings produced the largest spike response at each electrode site. In addition, a tendency to- wards decreased epileptic aclivity at the highest levels of contrast is evident. Simi- larly, Fig. 3B represents the results ob- tained on November 11. Overall activity was greatly reduced, but the larger re- sponse at 5 c/deg with a high-contrast roll- off is still apparent. In general, results ob-
Epilepsia, Vol. 27, June 1980
600.L
400'.
P , . 2 -.J
0
2 0 0 7
PATTERN-SENSITIVE EPILEPSY. I
'*
307
C X I011
SINE GRATINGS
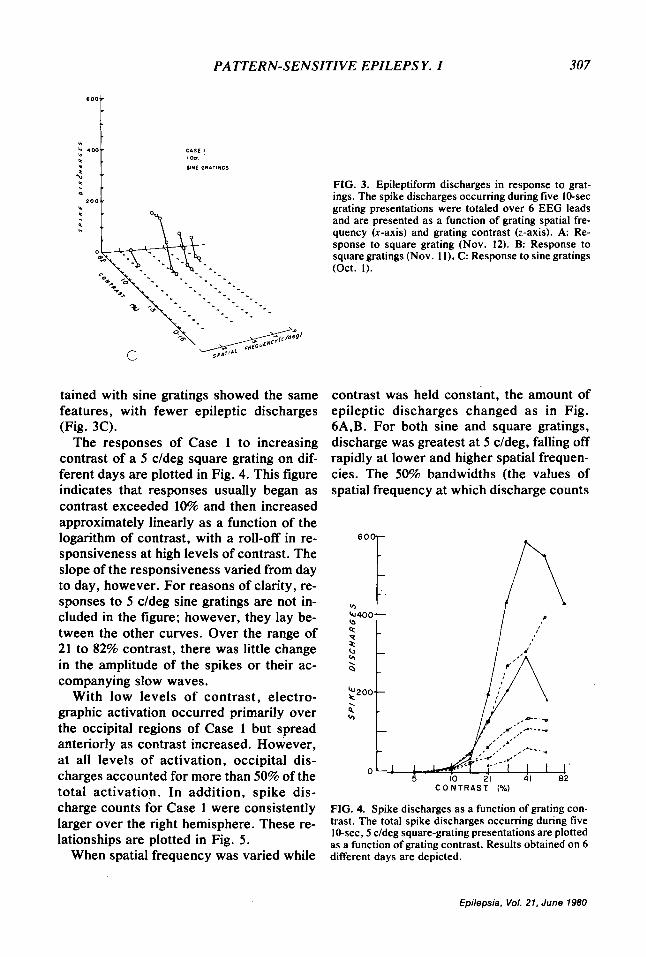
FIG. 3. Epileptiform discharges in response to grat- ings. The spike discharges occurring during five 10-sec grating presentations were totaled over 6 EEG leads and are presented as a function of grating spatial fre- quency (x-axis) and grating contrast (z-axis). A: Re- sponse to square grating (Nov. 12). B: Response to square gratings (Nov. 1 l ) , C: Response to sine gratings (Oct. 1).
tained with sine gratings showed the same features, with fewer epileptic discharges (Fig. 3C).
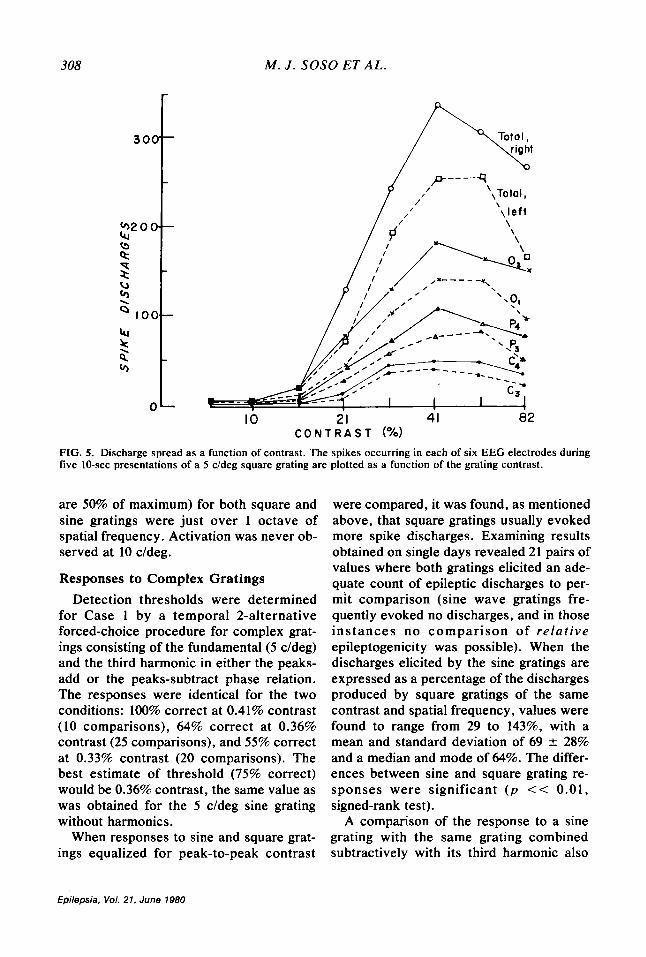
The responses of Case 1 to increasing contrast of a 5 c/deg square grating on dif- ferent days are plotted in Fig. 4. This figure indicates that responses usually began as contrast exceeded 10% and then increased approximately linearly as a function of the logarithm of contrast, with a roll-off in re- sponsiveness at high levels of contrast. The slope of the responsiveness varied from day to day, however. For reasons of clarity, re- sponses to 5 c/deg sine gratings are not in- cluded in the figure; however, they lay be- tween the other curves. Over the range of 21 to 82% contrast, there was little change in the amplitude of the spikes or their ac- companying slow waves.
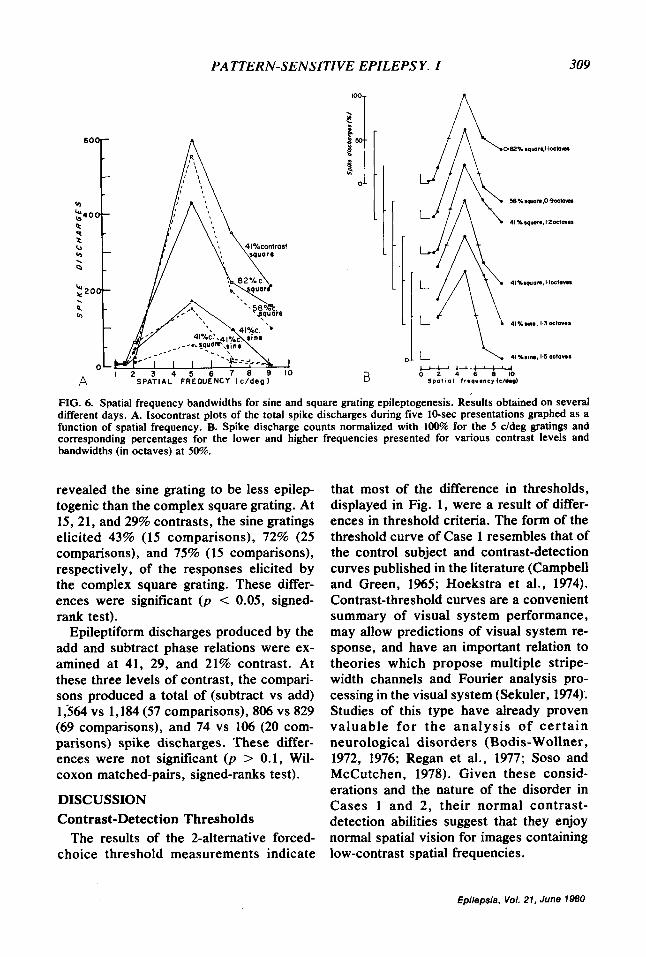
With low levels of contrast, electro- graphic activation occurred primarily over the occipital regions of Case 1 but spread anteriorly as contrast increased. However, at all levels of activation, occipital dis- charges accounted for more than 50% of the total activation. In addition, spike dis- charge counts for Case 1 were consistently larger over the right hemisphere. These re- lationships are plotted in Fig. 5 .
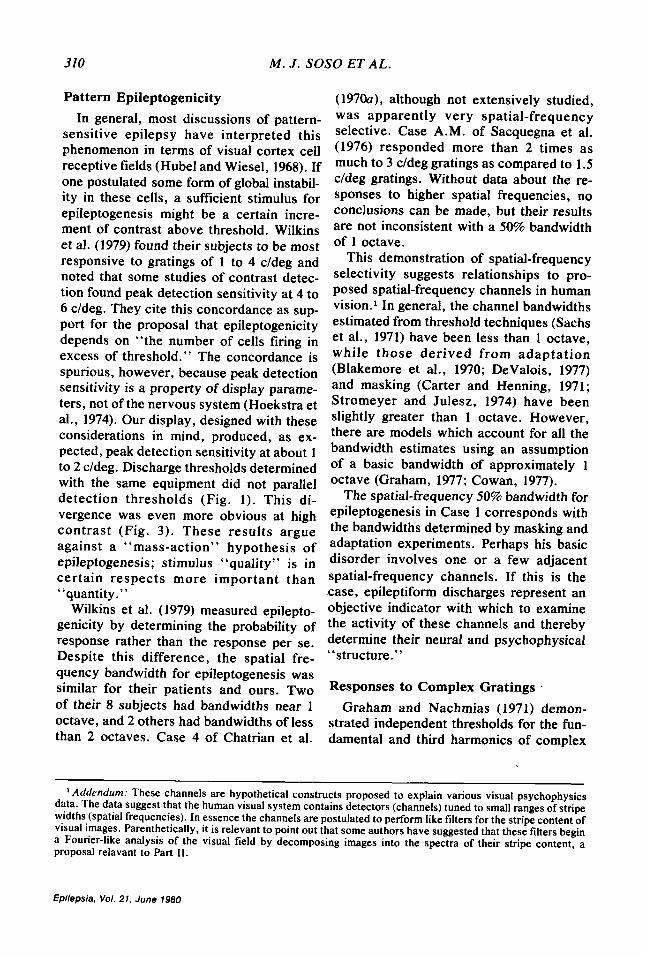
When spatial frequency was varied while
contrast was held constant, the amount of epileptic discharges changed as in Fig. 6A,B. For both sine and square gratings, discharge was greatest at 5 c/deg, falling off rapidly at lower and higher spatial frequen- cies. The 50% bandwidths (the values of spatial frequency at which discharge counts
FIG. 4. Spike discharges as a function of grating con- trast. The total spike discharges occurring during five 10-sec, 5 c/deg square-grating presentations are plotted as a function of grating contrast. Results obtained on 6 different days are depicted.
Epilepsia, Vol. 21, June 1980
308 M . J . SOSO ET AL.
p----4, ,Total, ‘,left
C O N T R A S T (%I FIG. 5. Discharge spread as a function of contrast. The spikes occurring in each of six EEG electrodes during five 10-sec presentations of a 5 c/deg square grating are plotted as a function of the grating contrast.
are 50% of maximum) for both square and sine gratings were just over 1 octave of spatial frequency. Activation was never ob- served at 10 c/deg.
Responses to Complex Gratings Detection thresholds were determined
for Case 1 by a temporal 2-alternative forced-choice procedure for complex grat- ings consisting of the fundamental (5 c/deg) and the third harmonic in either the peaks- add or the peaks-subtract phase relation. The responses were identical for the two conditions: 100% correct at 0.41% contrast (10 comparisons), 64% correct at 0.36% contrast (25 comparisons), and 55% correct at 0.33% contrast (20 comparisons). The best estimate of threshold (75% correct) would be 0.36% contrast, the same value as was obtained for the 5 c/deg sine grating without harmonics.
When responses to sine and square grat- ings equalized for peak-to-peak contrast
were compared, it was found, as mentioned above, that square gratings usually evoked more spike discharges. Examining results obtained on single days revealed 21 pairs of values where both gratings elicited an ade- quate count of epileptic discharges to per- mit comparison (sine wave gratings fre- quently evoked no discharges, and in those instances no comparison of relative epileptogenicity was possible). When the discharges elicited by the sine gratings are expressed as a percentage of the discharges produced by square gratings of the same contrast and spatial frequency, values were found to range from 29 to 143%, with a mean and standard deviation of 69 ? 28% and a median and mode of 64%. The differ- ences between sine and square grating re- sponses were significant (p << 0.01, signed-rank test).
A comparison of the response to a sine grating with the same grating combined subtractively with its third harmonic also
Epilepsia, Vol. 21, June 1980
PATTERN-SENSITIVE EPILEPSY. I
‘“T
309
A
FIG. 6. Spatial frequency bandwidths for sine and square grating epileptogenesis. Results obtained on several different days. A. Isocontrast plots of the total spike discharges during five 10-sec presentations graphed as a function of spatial frequency. B. Spike discharge counts normalized with 100% for the 5 c/deg gratings and corresponding percentages for the lower and higher frequencies presented for various contrast levels and bandwidths (in octaves) at 50%.
revealed the sine grating to be less epilep- that most of the difference in thresholds, togenic than the complex square grating. At displayed in Fig. 1, were a result of differ- 15,21, and 29% contrasts, the sine gratings ences in threshold criteria. The form of the elicited 43% (15 comparisons), 72% (25 threshold curve of Case 1 resembles that of comparisons), and 75% (15 comparisons), the control subject and contrast-detection respectively, of the responses elicited by curves published in the literature (Campbell the complex square grating. These differ- and Green, 1%5; Hoekstra et al., 1974). ences were significant (p < 0.05, signed- Contrast-threshold curves are a convenient rank test). summary of visual system performance,
Epileptiform discharges produced by the may allow predictions of visual system re- add and subtract phase relations were ex- sponse, and have an important relation to amined at 41, 29, and 21% contrast. At theories which propose multiple stripe- these three levels of contrast, the compari- width channels and Fourier analysis pro- sons produced a total of (subtract vs add) cessing in the visual system (Sekuler, 1974): 1,564 vs 1,184 (57 comparisons), 806 vs 829 Studies of this type have already proven (69 comparisons), and 74 vs 106 (20 com- valuable for the analysis of cer ta in parisons) spike discharges. These differ- neurological disorders (Bodis- Wollner , ences were not significant (p > 0.1, Wil- 1972, 1976; Regan et al., 1977; Soso and coxon matched-pairs, signed-ranks test). McCutchen, 1978). Given these consid-
erations and the nature of the disorder in Cases 1 and 2, their normal contrast- DISCUSSION
Contrast-Detection Thresholds detection abilities suggest that they enjoy The results of the 2-alternative forced- normal spatial vision for images containing
choice threshold measurements indicate low-contrast spatial frequencies.
Epilepsie, Vol. 21, June 1980
310 M . J . SOSO ET AL.
Pattern Epileptogenicity In general, most discussions of pattern-
sensitive epilepsy have interpreted this phenomenon in terms of visual cortex cell receptive fields (Hubel and Wiesel, 1968). If one postulated some form of global instabil- ity in these cells, a sufficient stimulus for epileptogenesis might be a certain incre- ment of contrast above threshold. Wilkins et al. (1979) found their subjects to be most responsive to gratings of 1 to 4 c/deg and noted that some studies of contrast detec- tion found peak detection sensitivity at 4 to 6 c/deg. They cite this concordance as sup- port for the proposal that epileptogenicity depends on “the number of cells firing in excess of threshold.” The concordance is spurious, however, because peak detection sensitivity is a property of display parame- ters, not of the nervous system (Hoekstra et al., 1974). Our display, designed with these considerations in mind, produced, as ex- pected, peak detection sensitivity at about 1 to 2 c/deg. Discharge thresholds determined with the same equipment did not parallel detection thresholds (Fig. 1). This di- vergence was even more obvious at high contrast (Fig. 3). These results argue against a “mass-action” hypothesis of epileptogenesis; stimulus “quality” is in certain respects more important than “quantity.”
Wilkins et al. (1979) measured epilepto- genicity by determining the probability of response rather than the response per se. Despite this difference, the spatial fre- quency bandwidth for epileptogenesis was similar for their patients and ours. Two of their 8 subjects had bandwidths near 1 octave, and 2 others had bandwidths of less than 2 octaves. Case 4 of Chatrian et al.
(197Oa), although not extensively studied, was apparently very spatial-frequency selective. Case A.M. of Sacquegna et al. (1976) responded more than 2 times as much to 3 c/deg gratings as compared to 1.5 c/deg gratings. Without data about the re- sponses to higher spatial frequencies, no conclusions can be made, but their results are not inconsistent with a 50% bandwidth of 1 octave.
This demonstration of spatial-frequency selectivity suggests relationships to pro- posed spatial-frequency channels in human vision.’ In general, the channel bandwidths estimated from threshold techniques (Sachs et al., 1971) have been less than 1 octave, while those derived from adaptation (Blakemore et al., 1970; DeValois, 1977) and masking (Carter and Henning, 1971; Stromeyer and Julesz, 1974) have been slightly greater than 1 octave. However, there are models which account for all the bandwidth estimates using an assumption of a basic bandwidth af approximately 1 octave (Graham, 1977; Cowan, 1977).
The spatial-frequency 50% bandwidth for epileptogenesis in Case 1 corresponds with the bandwidths determined by masking and adaptation experiments. Perhaps his basic disorder involves one or a few adjacent spatial-frequency channels. If this is the case, epileptiform discharges represent an objective indicator with which to examine the activity of these channels and thereby determine their neural and psychophysical “structure. ”
Responses to Complex Gratings . Graham and Nachmias (1971) demon-
strated independent thresholds for the fun- damental and third harmonics of complex
Addendum: These channels are hypothetical constructs proposed to explain various visual psychophysics data. The data suggest that the human visual system contains detectors (channels) tuned to small ranges of stripe widths (spatial frequencies). In essence the channels are postulated to perform like filters for the stripe content of visual images. Parenthetically, it is relevant to point out that some authors have suggested that these filters begin a Fourier-like analysis of the visual field by decomposing images into the spectra of their stripe content, a proposal relavant to Part 11.
Epilepsia, Vol. 21. June 1980

PATTERN-SENSITIVE EPILEPSY. I 311
gratings. Case 1 also detects the compo- nents of a complex (5 + 15 c/deg) grating independently. Above threshold, however, the components were not independent, since the addition of a normally ineffective 15 c/deg sine grating greatly enhanced the epileptogenicity of a 5 c/deg sine grating. This increased epileptogenicity was not af- fected by the phase of the third harmonic; perhaps pattern epileptogenicity is related to the root-mean-square contrast.
The increased epileptogenesis caused by the third harmonic is consistent with a re- cent report of a facilitatory interaction be- tween spatial-frequency channels separated by 1 to 2 octaves (DeValois, 1977; Tolhurst and Barfield, 1978). Alternatively, the third harmonic excitation may represent one as- pect of the as yet unknown fundamental disorder in the visual system of Case 1 which predisposes him to pattern-induced seizures.
The intent of these experiments was to delineate the relationships, if any, between pattern-sensitive epilepsy and multiple spatial-frequency channels in human vi- sion. The findings of a spatial-frequency selective phenomena suggests that further study of pattern-sensitive epilepsy will pro- vide insight into the processes of vision and epilepsy.
ACKNOWLEDGMENT We gratefully acknowledge the following
contributions. Dr. Gian Emilio Chatrian provided laboratory facilities, invaluable assistance, and data from previous studies; Dr. Robert J. Wilkus attended the patients during their hospitalization for these studies; Dr. Davida Y. Teller gave critical encouragement in the early stages of the project and, along with Dr. Janusz J. Kulikowski, contributed many valuable suggestions. This work was supported in part by NINCDS Grant 11563-01, an Epilepsy Foundation of America Grant, NIH Clinical Research Center Grant RR-37, NIH Grant NS0453, and PHS Training Grant 5T01 GM 666.
REFERENCES Bickford RG, Daly D, and Keith M. Convulsive effects
of light stimulation in children. Am J Dis Child
Blakemore C, Nachmias J , and Sutton P. The per- ceived spatial frequency shift: Evidence for frequency-selective neurons in the human brain. J Physiol (Lond) 210:727-750, 1970.
Bodis-Wollner 1. Visual acuity and contrast sensitivity in pa t i en t s wi th ce reb ra l l e s ions . S c i e n c e
Bodis-Wollner I. Vulnerability of spatial frequency channels in cerebral lesions. Nature 261:309-311, 1976.
Campbell FW and Green DG. Optical and retinal fac- tors affecting visual resolution. J Physiol (Lond)
Carter BE and Henning GB. Thc detection of gratings in narrow-band visual noise. J Physiol (Lond)
Chatrian GE, Lettich E , Miller LH, and Green JR. Pattern-sensitive epilepsy. 1 . An electrographic s tudy of i ts mechanisms. Epi leps ia ( A m s t )
Chatrian GE, Lettich E, Miller LH, Green JR, and Kupfer C. Pattern-sensitive epilepsy. 2. Clinical changes, tests of responsiveness and motor output, alterations of evoked potentials and therapeutic measures. Epilepsia (Amst) 11:151- 162, 197oh.
Chatrian GE, Bergamini L, Dondey M, Klass DW, Lennox-Buchthal M, and Petersen I. A glossary of terms most commonly used by clinical elec- troencephalographers. Elecfroencephalogr Clin Neurophysicil 37538-548, 1974.
Cowan JD. Some remarks on channel bandwidths for visual contrast detection. In: Poppel E, Held R, and Dowling J E (Eds), Neurcinal Mechanisms in Visual Perception, Neurosciences Research Pro- gram Bull 1977, 15:492-517.
DeValois K. Spatial frequency adaptation can enhance contrast sensitivity. Vision Res 17: 1057- 1065, 1977.
Graham N. Visual detection of aperiodic spatial stimuli by probability summation along narrow band channels. Vision Res 17:634-652, 1977.
Graham N and Nachmias J . Detection of grating pat- terns containing two spatial frequencies: A com- parison of single-channel and multiple channel model. Vision Res 11:251-259, 1971.
Green DM and Swets JA. Signal Detection Theory and Psychophysics. Wiley, New York, 1966, 428 pp.
Hoekstra J, van der Groot DPJ, van den Brink G, and Bilsen FA. The influence of the number of cycles upon the visual contrast threshold for spatial sine wave patterns. Vision Res 14:365-369, 1974.
Hubel HD and Wiesel TN. Receptive fields and func- tional architecture of monkey striate cortex. J Physiol (Lond) 195:215-243, 1968.
Kelly DH and Savoie RE. A study of sine-wave con- trast sensitivity by two psychophysical methods. Percept Psychophys 14:313-318, 1973.
Regan D, Silver R, and Murray TJ. Visual acuity and contrast sensitivity in multiple sclerosis-hidden vi- sual loss. Brain 100563-579, 1977.
86:170-178, 1953.
978:769-77 1 , 1972.
18 1576-593, 1965.
2 19:355 - 365, 1971.
1 1 : 125 - 149, 19700.
Epilepsia, Vol. 21, June 1980
312 M . J . SOSO ET AL.
Sachs MB, Nachmias J , and Robson JG. Spatial- frequency channels in human vision. J Opt Soc Am
Sacquegna T, Passaglia P, Ambrosetto G, Forti A, and Rossi PG. Epilessia riflessa autoindotta da fis- sazione di supertici finemente strutturate (Pattern- sensitive epilepsy). Riv Neurol46:431-440, 1976.
Sekuler, R. Spatial vision. A n n u Rev Psycho1
Soso MJ. Pattern-sensitive epilepsy and spatial fre- quency channels in the human visual system. Electroencephalogr Clin Neurophysiol 3855 I , 1975.
Soso MJ and McCutchen CM. Grating contrast detec- tion perimetry in a patient with occipital lobe epilepsy. Neitrology 28:870-873, 1978.
Stromeyer CF and Julesz B. Spatial-frequency mask- ing in vision: Critical bands and spread of masking. J Opt Soc Am 62: 1221 - 1232, 1972.
Tolhurst DJ and Barfield LP. Interactions between spa t ia l f requency c h a n n e l s . V i s i o n R e s
W i l k i n s A J , D a r b y C E , a n d B i n n i e C D . Neurophysiological aspects of pattern-sensitive epilepsy. Bruin 102:l-25, 1979.
61 : 1 176- I 186, 1971.
25:195-232, 1974.
18:951-958, 1978.
RESUMEN De manera excepcional, hay personas que pueden
tener ataques epilkpticos cuando ven ciertas imfigenes, particularmente rayas. Se determinaron 10s umbrales para contrastes (la capacidad de ver rayas de diversas anchuras y muy tenues) en dos hermanos sensibles a patrones y se establecid la epileptogeneidad de diversos patrones en uno de ellos. Los umbrales para contrastes fueron esencialmente normales en 10s dos sujetos cuando se utiliz6 una rejilla hecha con ondas sinusoidales, siendo el umbra1 inferior unos 2 ciclosl grado (c/deg). Descargas epileptiformes tuvieron lugar de mod0 mfiximo a 5 c/deg con una amplitud de banda del 50% de una octava. la capacidad epileptogknica del patr6n aument6 cuando se afladi6 una tercera sinusoide arm6nica a la rejilla base pero esa capacidad no se vi6 alterada por la relaci6n de fase entre las dos rejillas. La selectividad de la frecuencia de la respuesta epileptogknica fue cuantitativamente similar a1 “canal de frecuencia espacial” . No se observaron interac- ciones inhibitorias. Los hallazgos sugieren que hay relaciones entre la epilepsia secundaria a patrones visuales y 10s hipotkticos canales de frecuencia espacial, lo cual merece mfis investigacibn.
(A. Portera Sanchez, Madrid)
ZUSAMMENFASSUNG Selten leiden Patienten unter epileptischen Anfallen,
wenn sie bestimmte Bilder, insbesondere Streifen sich
anschauen. Die Schwellenfunktion gegeniiber Kon- trasten (die Fahigkeit blasse Streifen verschiedener Weiten zu sehen) wurden bei 2 musterempfindlichen Briidern bestimmt und die Epileptogenitat der ver- schiedenen Muster bei einem von ihnen ermittelt. Die Erkennungsschwelle fiir Sinuswellen-Kon- trastgitter bei den beiden Patienten war vdlig normal; die niedrigsten Schwellen betrugen annahernd 2 Schwingungen pro Grad (c/deg). Die epileptischen Entladungen ereigneten sich maximal bei 5 c/deg mit einer 50 prozentigen Bandweite fiir eine Oktave. Die Epileptogenitat des Musters wurde vermehrt durch Addition eines 3 . harmonischen Sinuswellenrasters, blieb aber durch die Phasenbeziehung der beiden Raster unbeeinflusst. Die selektive Haufigkeit der epileptischen Antwort war quantitativ ahnlich einem “raumlichen Frequenzkanal”. Inhibitionen kamen nicht vor. Die Befunde lassen Beziehungen vermuten zwischen dem Phanomen der Musterepilepsie und hypothetischen rtiumlichen Kanalfrequenzen, die weiter untersucht werden milssen.
(D. Scheffner, Heidelberg)
RESUME
Quelques individus presentent des crises d’epilepsie quand ils regardent certaines images et en particulier des rayures. Nous avons determines le seuil de con- traste (c’est-A-dire la possibilite de discerner les rayures peu contrastees de diffkrentes largeurs) chez deux frkres tres sensibles A ce genre d’image; pour I’un d’entre eux, nous avons kgalement determine le seuil Cpileptogene A de telles images. Chez les 2 sujets, les seuils de detection des contrastes de grilles variant de faCon sinusoidale Ctaient sensiblement normaux, avec cependant les seuils les plus bas pour approximativement deux cycles par degrt. Les decharges epileptiforrnes apparaissent de faqon maxi- male A 5 cycles/”, avec une largeur de bande A 50% de I octave. Le pouvoir epileptogene des figures etait augment6 si on ajoutait A la grille de variation sinusoidale la 3eme harmonique du fondamental, mais le pouvoir kpileptogene n’etait pas modifid en faisant varier les relations de phase des 2 grilles. La suscep- tibilitk epileptogene en fonction de la sklectivitk de frequence etait quantitativement semblable A un “canal de frequence spatiale”. II n’existait pas d:inter- reaction inhibitrice. Ces resultats suggerent qu’il existe des relations entre I’epilepsie induite par des images et d’hypothefiques “canaux de frequence spa- tiale” qui mkriteraient les investigations ulterieures.
(J. Corriol, Marseilles)
Epilepsia, Vol. 27, June 1980