Participation of Children with Disabilities in Taiwan: The Gap between Independence and Frequency
19
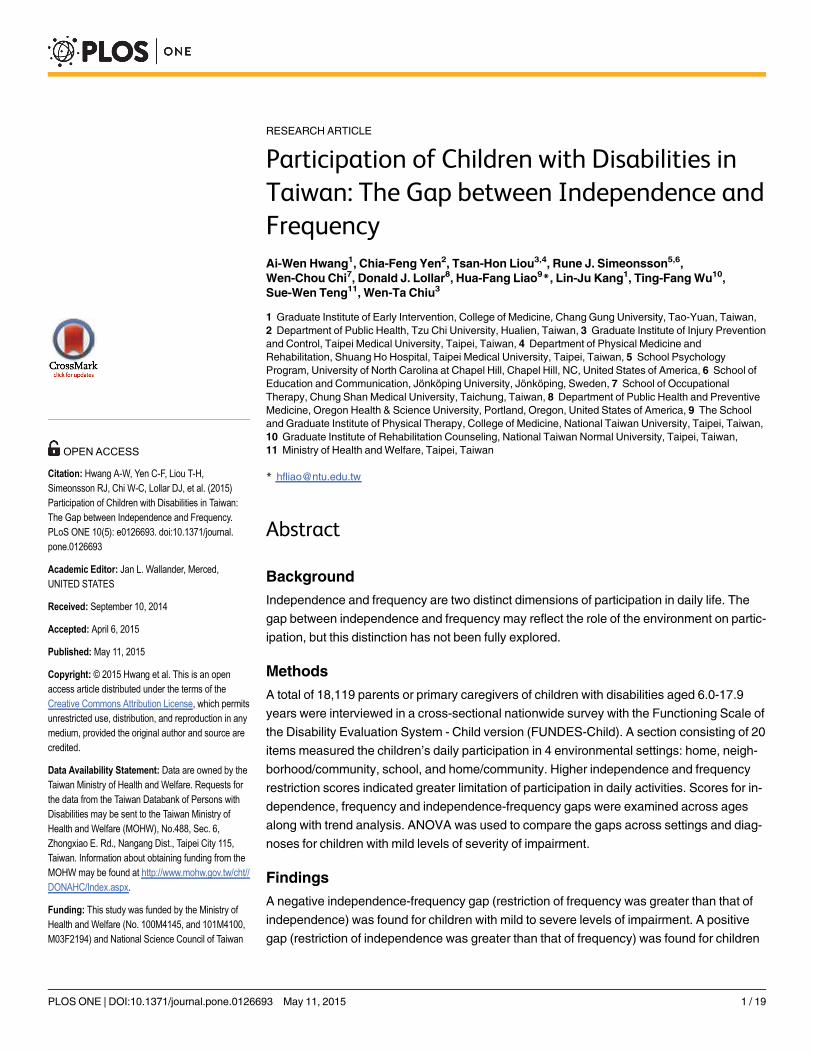
RESEARCH ARTICLE Participation of Children with Disabilities in Taiwan: The Gap between Independence and Frequency Ai-Wen Hwang 1 , Chia-Feng Yen 2 , Tsan-Hon Liou 3,4 , Rune J. Simeonsson 5,6 , Wen-Chou Chi 7 , Donald J. Lollar 8 , Hua-Fang Liao 9 *, Lin-Ju Kang 1 , Ting-Fang Wu 10 , Sue-Wen Teng 11 , Wen-Ta Chiu 3 1 Graduate Institute of Early Intervention, College of Medicine, Chang Gung University, Tao-Yuan, Taiwan, 2 Department of Public Health, Tzu Chi University, Hualien, Taiwan, 3 Graduate Institute of Injury Prevention and Control, Taipei Medical University, Taipei, Taiwan, 4 Department of Physical Medicine and Rehabilitation, Shuang Ho Hospital, Taipei Medical University, Taipei, Taiwan, 5 School Psychology Program, University of North Carolina at Chapel Hill, Chapel Hill, NC, United States of America, 6 School of Education and Communication, Jönköping University, Jönköping, Sweden, 7 School of Occupational Therapy, Chung Shan Medical University, Taichung, Taiwan, 8 Department of Public Health and Preventive Medicine, Oregon Health & Science University, Portland, Oregon, United States of America, 9 The School and Graduate Institute of Physical Therapy, College of Medicine, National Taiwan University, Taipei, Taiwan, 10 Graduate Institute of Rehabilitation Counseling, National Taiwan Normal University, Taipei, Taiwan, 11 Ministry of Health and Welfare, Taipei, Taiwan * [email protected] Abstract Background Independence and frequency are two distinct dimensions of participation in daily life. The gap between independence and frequency may reflect the role of the environment on partic- ipation, but this distinction has not been fully explored. Methods A total of 18,119 parents or primary caregivers of children with disabilities aged 6.0-17.9 years were interviewed in a cross-sectional nationwide survey with the Functioning Scale of the Disability Evaluation System - Child version (FUNDES-Child). A section consisting of 20 items measured the children’s daily participation in 4 environmental settings: home, neigh- borhood/community, school, and home/community. Higher independence and frequency restriction scores indicated greater limitation of participation in daily activities. Scores for in- dependence, frequency and independence-frequency gaps were examined across ages along with trend analysis. ANOVA was used to compare the gaps across settings and diag- noses for children with mild levels of severity of impairment. Findings A negative independence-frequency gap (restriction of frequency was greater than that of independence) was found for children with mild to severe levels of impairment. A positive gap (restriction of independence was greater than that of frequency) was found for children PLOS ONE | DOI:10.1371/journal.pone.0126693 May 11, 2015 1 / 19 OPEN ACCESS Citation: Hwang A-W, Yen C-F, Liou T-H, Simeonsson RJ, Chi W-C, Lollar DJ, et al. (2015) Participation of Children with Disabilities in Taiwan: The Gap between Independence and Frequency. PLoS ONE 10(5): e0126693. doi:10.1371/journal. pone.0126693 Academic Editor: Jan L. Wallander, Merced, UNITED STATES Received: September 10, 2014 Accepted: April 6, 2015 Published: May 11, 2015 Copyright: © 2015 Hwang et al. This is an open access article distributed under the terms of the Creative Commons Attribution License, which permits unrestricted use, distribution, and reproduction in any medium, provided the original author and source are credited. Data Availability Statement: Data are owned by the Taiwan Ministry of Health and Welfare. Requests for the data from the Taiwan Databank of Persons with Disabilities may be sent to the Taiwan Ministry of Health and Welfare (MOHW), No.488, Sec. 6, Zhongxiao E. Rd., Nangang Dist., Taipei City 115, Taiwan. Information about obtaining funding from the MOHW may be found at http://www.mohw.gov.tw/cht// DONAHC/Index.aspx. Funding: This study was funded by the Ministry of Health and Welfare (No. 100M4145, and 101M4100, M03F2194) and National Science Council of Taiwan
-
Upload
independent -
Category
Documents
-
view
0 -
download
0
Transcript of Participation of Children with Disabilities in Taiwan: The Gap between Independence and Frequency
RESEARCH ARTICLE
Participation of Children with Disabilities inTaiwan: The Gap between Independence andFrequencyAi-Wen Hwang1, Chia-Feng Yen2, Tsan-Hon Liou3,4, Rune J. Simeonsson5,6,Wen-Chou Chi7, Donald J. Lollar8, Hua-Fang Liao9*, Lin-Ju Kang1, Ting-FangWu10,Sue-Wen Teng11, Wen-Ta Chiu3
1 Graduate Institute of Early Intervention, College of Medicine, Chang Gung University, Tao-Yuan, Taiwan,2 Department of Public Health, Tzu Chi University, Hualien, Taiwan, 3 Graduate Institute of Injury Preventionand Control, Taipei Medical University, Taipei, Taiwan, 4 Department of Physical Medicine andRehabilitation, Shuang Ho Hospital, Taipei Medical University, Taipei, Taiwan, 5 School PsychologyProgram, University of North Carolina at Chapel Hill, Chapel Hill, NC, United States of America, 6 School ofEducation and Communication, Jönköping University, Jönköping, Sweden, 7 School of OccupationalTherapy, Chung Shan Medical University, Taichung, Taiwan, 8 Department of Public Health and PreventiveMedicine, Oregon Health & Science University, Portland, Oregon, United States of America, 9 The Schooland Graduate Institute of Physical Therapy, College of Medicine, National Taiwan University, Taipei, Taiwan,10 Graduate Institute of Rehabilitation Counseling, National Taiwan Normal University, Taipei, Taiwan,11 Ministry of Health andWelfare, Taipei, Taiwan
Abstract
Background
Independence and frequency are two distinct dimensions of participation in daily life. The
gap between independence and frequency may reflect the role of the environment on partic-
ipation, but this distinction has not been fully explored.
Methods
A total of 18,119 parents or primary caregivers of children with disabilities aged 6.0-17.9
years were interviewed in a cross-sectional nationwide survey with the Functioning Scale of
the Disability Evaluation System - Child version (FUNDES-Child). A section consisting of 20
items measured the children’s daily participation in 4 environmental settings: home, neigh-
borhood/community, school, and home/community. Higher independence and frequency
restriction scores indicated greater limitation of participation in daily activities. Scores for in-
dependence, frequency and independence-frequency gaps were examined across ages
along with trend analysis. ANOVA was used to compare the gaps across settings and diag-
noses for children with mild levels of severity of impairment.
Findings
A negative independence-frequency gap (restriction of frequency was greater than that of
independence) was found for children with mild to severe levels of impairment. A positive
gap (restriction of independence was greater than that of frequency) was found for children
PLOSONE | DOI:10.1371/journal.pone.0126693 May 11, 2015 1 / 19
OPEN ACCESS
Citation: Hwang A-W, Yen C-F, Liou T-H,Simeonsson RJ, Chi W-C, Lollar DJ, et al. (2015)Participation of Children with Disabilities in Taiwan:The Gap between Independence and Frequency.PLoS ONE 10(5): e0126693. doi:10.1371/journal.pone.0126693
Academic Editor: Jan L. Wallander, Merced,UNITED STATES
Received: September 10, 2014
Accepted: April 6, 2015
Published: May 11, 2015
Copyright: © 2015 Hwang et al. This is an openaccess article distributed under the terms of theCreative Commons Attribution License, which permitsunrestricted use, distribution, and reproduction in anymedium, provided the original author and source arecredited.
Data Availability Statement: Data are owned by theTaiwan Ministry of Health and Welfare. Requests forthe data from the Taiwan Databank of Persons withDisabilities may be sent to the Taiwan Ministry ofHealth and Welfare (MOHW), No.488, Sec. 6,Zhongxiao E. Rd., Nangang Dist., Taipei City 115,Taiwan. Information about obtaining funding from theMOHW may be found at http://www.mohw.gov.tw/cht//DONAHC/Index.aspx.
Funding: This study was funded by the Ministry ofHealth and Welfare (No. 100M4145, and 101M4100,M03F2194) and National Science Council of Taiwan
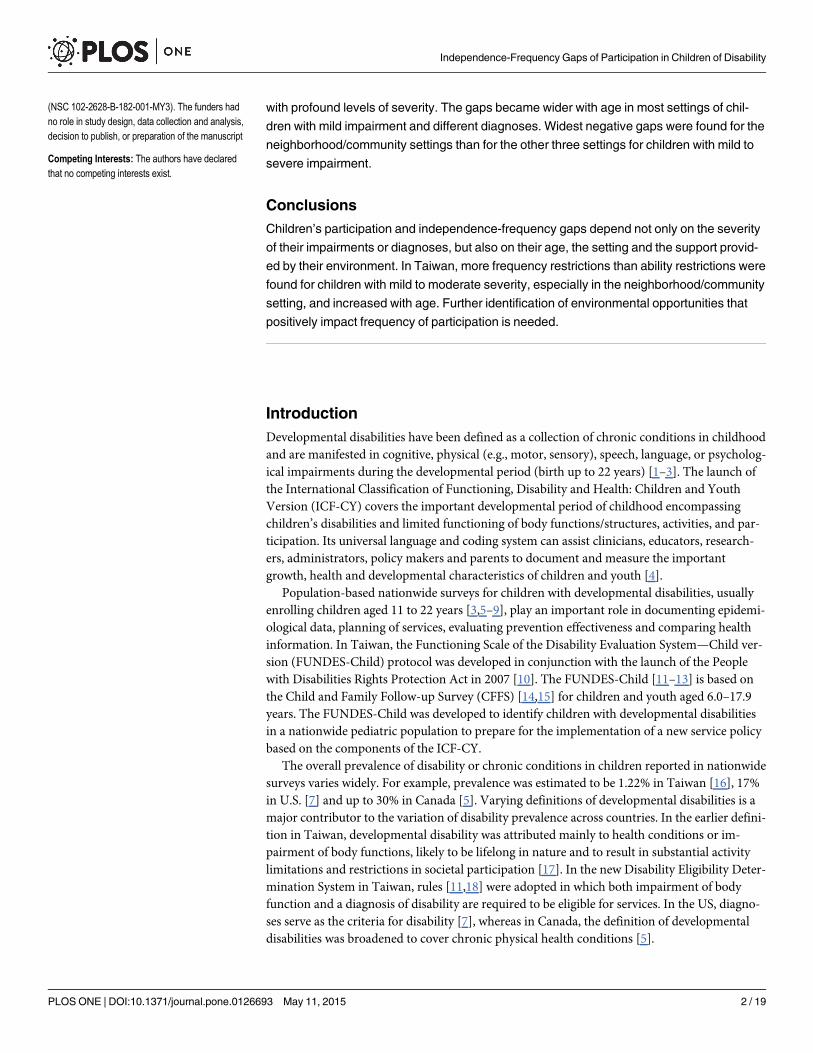
with profound levels of severity. The gaps became wider with age in most settings of chil-
dren with mild impairment and different diagnoses. Widest negative gaps were found for the
neighborhood/community settings than for the other three settings for children with mild to
severe impairment.
Conclusions
Children’s participation and independence-frequency gaps depend not only on the severity
of their impairments or diagnoses, but also on their age, the setting and the support provid-
ed by their environment. In Taiwan, more frequency restrictions than ability restrictions were
found for children with mild to moderate severity, especially in the neighborhood/community
setting, and increased with age. Further identification of environmental opportunities that
positively impact frequency of participation is needed.
IntroductionDevelopmental disabilities have been defined as a collection of chronic conditions in childhoodand are manifested in cognitive, physical (e.g., motor, sensory), speech, language, or psycholog-ical impairments during the developmental period (birth up to 22 years) [1–3]. The launch ofthe International Classification of Functioning, Disability and Health: Children and YouthVersion (ICF-CY) covers the important developmental period of childhood encompassingchildren’s disabilities and limited functioning of body functions/structures, activities, and par-ticipation. Its universal language and coding system can assist clinicians, educators, research-ers, administrators, policy makers and parents to document and measure the importantgrowth, health and developmental characteristics of children and youth [4].
Population-based nationwide surveys for children with developmental disabilities, usuallyenrolling children aged 11 to 22 years [3,5–9], play an important role in documenting epidemi-ological data, planning of services, evaluating prevention effectiveness and comparing healthinformation. In Taiwan, the Functioning Scale of the Disability Evaluation System—Child ver-sion (FUNDES-Child) protocol was developed in conjunction with the launch of the Peoplewith Disabilities Rights Protection Act in 2007 [10]. The FUNDES-Child [11–13] is based onthe Child and Family Follow-up Survey (CFFS) [14,15] for children and youth aged 6.0–17.9years. The FUNDES-Child was developed to identify children with developmental disabilitiesin a nationwide pediatric population to prepare for the implementation of a new service policybased on the components of the ICF-CY.
The overall prevalence of disability or chronic conditions in children reported in nationwidesurveys varies widely. For example, prevalence was estimated to be 1.22% in Taiwan [16], 17%in U.S. [7] and up to 30% in Canada [5]. Varying definitions of developmental disabilities is amajor contributor to the variation of disability prevalence across countries. In the earlier defini-tion in Taiwan, developmental disability was attributed mainly to health conditions or im-pairment of body functions, likely to be lifelong in nature and to result in substantial activitylimitations and restrictions in societal participation [17]. In the new Disability Eligibility Deter-mination System in Taiwan, rules [11,18] were adopted in which both impairment of bodyfunction and a diagnosis of disability are required to be eligible for services. In the US, diagno-ses serve as the criteria for disability [7], whereas in Canada, the definition of developmentaldisabilities was broadened to cover chronic physical health conditions [5].
Independence-Frequency Gaps of Participation in Children of Disability
PLOS ONE | DOI:10.1371/journal.pone.0126693 May 11, 2015 2 / 19
(NSC 102-2628-B-182-001-MY3). The funders hadno role in study design, data collection and analysis,decision to publish, or preparation of the manuscript
Competing Interests: The authors have declaredthat no competing interests exist.
However, severity of body function impairments and diagnoses can only partly reflect par-ticipation restriction of children in daily activities [5,6,19]. The framework of the ICF-CY de-scribes a dynamic interaction between the components of health conditions, body functions/structures, environmental and personal factors that contribute to children’s participation [4].
Based on the United Nations’ Convention on the Rights of the Child, participation has beendescribed as the child’s right to be respected [20] and is considered an ultimate outcome for re-habilitation services based on the framework of ICF/ICF-CY [4,21]. Participation is known tobe context-dependent as it describes the functioning of an individual’s social role. Therefore,settings, such as home, school, and community where children participate in daily activitiesshould be identified in the investigation of children’s participation patterns. Recently, research-ers have found that children with developmental disabilities face various environmental barri-ers that restrict their participation in home, school and community contexts [22–28].
In the ICF model (parent to the ICF-CY), Activity is defined as the execution of a task or ac-tion by an individual and Participation is defined by involvement in a life situation [4]. Thecomponent of Activity and Participation contains two constructs, “Performance” and “Capaci-ty” [4]. However, participation of children has been defined with varied terms and multipleperspectives across measurement tools [29]. The construct of “Performance” describes what anindividual “actually does or does do” in his or her current environment. In other words, “Per-formance” is viewed as “life experience” and is highly context dependent [4]. On the otherhand, the construct of “Capacity” is defined as the full ability of an individual assessed in astandardized environment or uniform environment to neutralize the impact of different envi-ronments on the ability of the individual [4]. As such it may define what the child “can do inan ideal environment”, usually presented with the basic ability of developmental domains inchildren. Therefore, the “Capacity” construct identified in ICF is unsuitable to measure “Partic-ipation” because “Participation” refers to involvement in a “life situation” rather than in a“standardized” or “uniform” environment.
There is an array of measurable dimensions under the construct of participation in recentlydeveloped measures [29]. To explain the abilities in life situations, some researchers proposedthe term “Capability” as a construct to clarify and operationalize the measurable dimensions ofchildren’s “independence” or “range of possible functioning” in participation [29–31]. Morrisdefines capability as “the child’s predicament in the life they lead, taking into account their ca-pacity and available resources, social and physical environment”[32]. Therefore, capability re-fers to what the child “can do in real life” in contrast to performance as “does do in real life”. Inthe FUNDES-Child, “capability” or “independence” describes the children’s abilities expectedin life situation or in achieving a task or activities as assessed by a caregiver [11,12,14].
Another measurable dimension of participation used in the FUNDES-Child is “frequency”,referring to the extent to which a specific task or activity was carried out [29,33–35]. In thisstudy, “Independence” refers to what a child “can do in real life” in contrast to “Frequency”which describes what a child “does do in real life”. The FUNDES-Child was designed to captureboth independence and frequency of children’s participation in daily life as measured by theperspective of parents or primary caregivers [7–9,11–13,36,37].
The gap between “independence” and “frequency” is presumed to reflect the role of con-textual facilitators and barriers on functioning and participation in that the environmentoften provides the context for the difference in what the child “can do” and “does do” [4,21].However, there has been no clear evidence to support the associations between the indepen-dence-frequency gap and other ICF-CY components (heath conditions, body functions, andcontextual factors). Furthermore, children of school age face a transition from preschool toschool settings, or from home to community contexts, a process that generates new life expe-riences. For children with disabilities, functional change across the life span, particularly in
Independence-Frequency Gaps of Participation in Children of Disability
PLOS ONE | DOI:10.1371/journal.pone.0126693 May 11, 2015 3 / 19
participation, is critically important for adaptation and could be reasonably regarded as moreimportant than the emergence of basic developmental skills. This distinction is important be-cause the patterns of participation for varying age groups in population-based surveys shouldbe taken into account when making social service policy to identify children’s needs and po-tential policy interventions.
Participation patterns in varying settings and across ages provide guidance for parents todescribe their children’s needs in daily life. The concept of an independence-frequency gap canhelp in the development of policies and strategies to meet the needs of the children and theirfamilies. The purpose of this study was to explore the patterns of gaps in participation betweenindependence and frequency as a function of severity of body functions and structures, diag-nosed health conditions, settings and age.
Materials and MethodsThis study utilized a national disability register based on a cross-sectional design of nationwidedata collection in Taiwan. This national disability register provided the database of compre-hensive profiles of participation in children aged 6.0–17.9 years. A 3-step data analysis was ap-plied. Step 1 used all enrolled children covering a broad range of children to show the globalprofile of independence and frequency across age and setting in different severity groups. Tocontrol for possible confounders, Step 2 limited the children to the ones who had only one ofthe most frequent diagnoses to examine the effects of severity, setting and diagnosis on the in-dependence-frequency gaps. Step 3 narrowed from Step 2 to include only children with mildlevel of impairment because of its large sample size that would provide adequate statisticalpower for each of the 12 age subgroups for trend analysis of frequency, independence andgaps in different diagnosis.
The study populationThis study sample consisted of parents or caregivers of 18,119 children aged 6.0–17.9 years,who were interviewed between July 2012 and January 2014 following the official launch of theDisability Evaluation System (DES) [11,18,38]. The DES is a three-stage evaluation process: (1)medical examination (body functions/structures), (2) functional assessment (participation andenvironment), and (3) needs assessment [11,38]. Demographic data and health characteristicsof the sample are presented in Table 1. The mean ages for the three data analysis steps were12.1 (SD = 3.5) years, 12.0 (SD = 3.4) years, and 11.9 (SD = 3.4) years respectively. The num-bers of children for each year age group were evenly distributed except for a higher percentagein the 12-year old group. The five largest diagnostic groups were intellectual disability (ID),autistic spectrum disorder (ASD), language delay, cerebral palsy (CP), and hearing im-pairment. The five diagnostic groups were collapsed into four categories in terms of functionallimitations [1–3]: cognitive impairment (ID group), psychological impairment (ASD group),language/hearing impairments (LH group), and physical impairments (CP group) for statisti-cal analysis at Steps 2 and 3 in this study.
Ethics approvalEthics approval was obtained from Taipei Medical University- Joint Institutional ReviewBoard. This study utilized the de-identified database of Taiwan Databank of Persons with Dis-abilities (TDPD). The children were assigned a diagnosis with specific codes of the Internation-al Classification of Disease, 9th Revision, Clinical Modification (ICD-9-CM) (http://www.cdc.gov/nchs/icd/icd9cm.htm) to be eligible for the DES.
Independence-Frequency Gaps of Participation in Children of Disability
PLOS ONE | DOI:10.1371/journal.pone.0126693 May 11, 2015 4 / 19
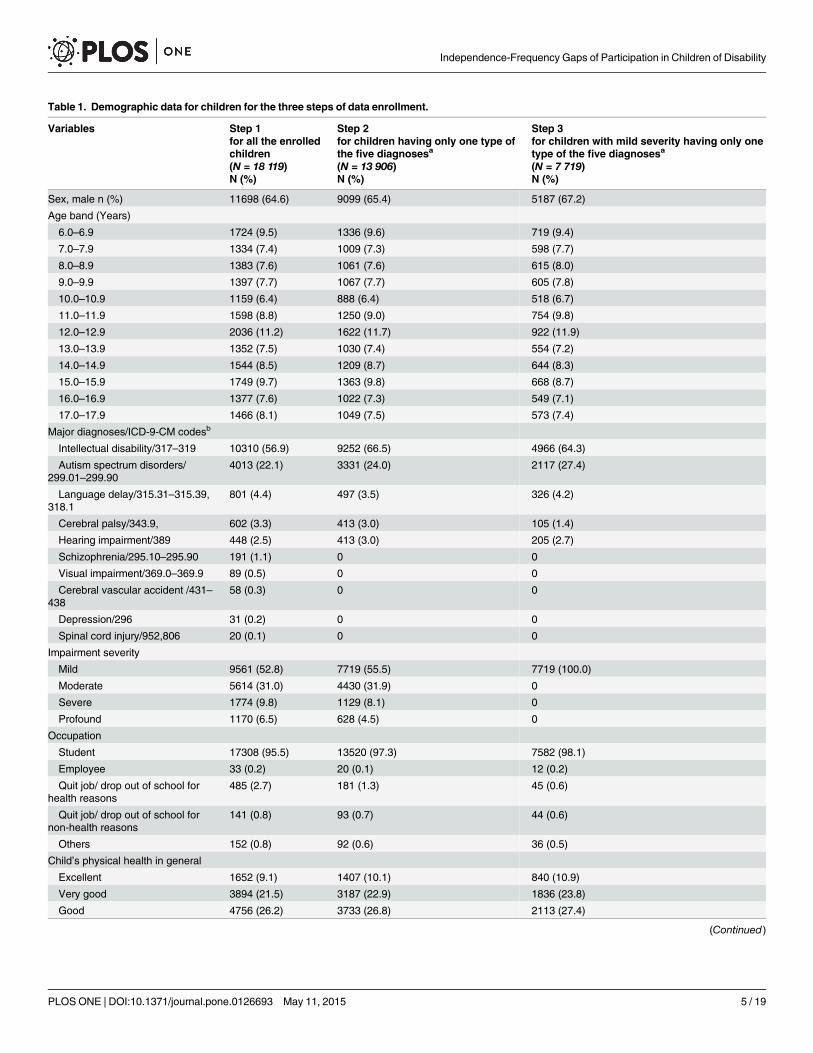
Table 1. Demographic data for children for the three steps of data enrollment.
Variables Step 1 Step 2 Step 3for all the enrolledchildren
for children having only one type ofthe five diagnosesa
for children with mild severity having only onetype of the five diagnosesa
(N = 18 119) (N = 13 906) (N = 7 719)N (%) N (%) N (%)
Sex, male n (%) 11698 (64.6) 9099 (65.4) 5187 (67.2)
Age band (Years)
6.0–6.9 1724 (9.5) 1336 (9.6) 719 (9.4)
7.0–7.9 1334 (7.4) 1009 (7.3) 598 (7.7)
8.0–8.9 1383 (7.6) 1061 (7.6) 615 (8.0)
9.0–9.9 1397 (7.7) 1067 (7.7) 605 (7.8)
10.0–10.9 1159 (6.4) 888 (6.4) 518 (6.7)
11.0–11.9 1598 (8.8) 1250 (9.0) 754 (9.8)
12.0–12.9 2036 (11.2) 1622 (11.7) 922 (11.9)
13.0–13.9 1352 (7.5) 1030 (7.4) 554 (7.2)
14.0–14.9 1544 (8.5) 1209 (8.7) 644 (8.3)
15.0–15.9 1749 (9.7) 1363 (9.8) 668 (8.7)
16.0–16.9 1377 (7.6) 1022 (7.3) 549 (7.1)
17.0–17.9 1466 (8.1) 1049 (7.5) 573 (7.4)
Major diagnoses/ICD-9-CM codesb
Intellectual disability/317–319 10310 (56.9) 9252 (66.5) 4966 (64.3)
Autism spectrum disorders/299.01–299.90
4013 (22.1) 3331 (24.0) 2117 (27.4)
Language delay/315.31–315.39,318.1
801 (4.4) 497 (3.5) 326 (4.2)
Cerebral palsy/343.9, 602 (3.3) 413 (3.0) 105 (1.4)
Hearing impairment/389 448 (2.5) 413 (3.0) 205 (2.7)
Schizophrenia/295.10–295.90 191 (1.1) 0 0
Visual impairment/369.0–369.9 89 (0.5) 0 0
Cerebral vascular accident /431–438
58 (0.3) 0 0
Depression/296 31 (0.2) 0 0
Spinal cord injury/952,806 20 (0.1) 0 0
Impairment severity
Mild 9561 (52.8) 7719 (55.5) 7719 (100.0)
Moderate 5614 (31.0) 4430 (31.9) 0
Severe 1774 (9.8) 1129 (8.1) 0
Profound 1170 (6.5) 628 (4.5) 0
Occupation
Student 17308 (95.5) 13520 (97.3) 7582 (98.1)
Employee 33 (0.2) 20 (0.1) 12 (0.2)
Quit job/ drop out of school forhealth reasons
485 (2.7) 181 (1.3) 45 (0.6)
Quit job/ drop out of school fornon-health reasons
141 (0.8) 93 (0.7) 44 (0.6)
Others 152 (0.8) 92 (0.6) 36 (0.5)
Child’s physical health in general
Excellent 1652 (9.1) 1407 (10.1) 840 (10.9)
Very good 3894 (21.5) 3187 (22.9) 1836 (23.8)
Good 4756 (26.2) 3733 (26.8) 2113 (27.4)
(Continued)
Independence-Frequency Gaps of Participation in Children of Disability
PLOS ONE | DOI:10.1371/journal.pone.0126693 May 11, 2015 5 / 19
Measurement of body functionThe severity of body functions/structures was assessed in the first stage of the DES. RelevantICF/ICF-CY categories for specific diagnoses were coded by physicians trained in using a quali-fier scale from 0 to 4 points presenting no problem (0), mild (1), moderate (2), severe (3), andprofound (4). A final severity level of body function was assessed on the basis of decision rules[39] for combining levels of severity of individual codes of body functions/structures. In thissample, half of the children were classified at mild levels of severity (Table 1).
Measurement of participationChild participation was assessed using the FUNDES-Child Section II that contains 20 items tomeasure 2 dimensions, frequency and independence of participation [12]. The items from theIndependence dimension were translated and modified from the Child and Adolescent Scale ofParticipation (CASP) [15], one part of the CFFS. The Frequency dimension has been designedby the Taiwan ICF team and added to each item of the FUNDES-Child Section II [11]. Itemsare scored by the 4 domains describing settings (home with 6 items, neighborhood and com-munity with 4 items, school with 5 items, and home/community living activities [HCLA] with5 items)[12].
The four domains present categories of activities children would experience in the four set-tings. Activities in the home setting include social, play or leisure activities, chores, self-care ac-tivities, communication and moving around at home; community setting activities includesocial, play or leisure activities, structured events, moving around and communicating withothers in community; school setting activities include educational (academic) activities, social,play or leisure activities, moving around, and using educational material in schools;HCLA ac-tivities include household tasks, shopping and managing money, managing schedule, usingtransportation to get around, and work activities and responsibility in home and in transitionto community. The following are examples of items for specific settings: “Communicating withother children and adults at home” (home), “Social, play or leisure activities with friends in the
Table 1. (Continued)
Variables Step 1 Step 2 Step 3for all the enrolledchildren
for children having only one type ofthe five diagnosesa
for children with mild severity having only onetype of the five diagnosesa
(N = 18 119) (N = 13 906) (N = 7 719)N (%) N (%) N (%)
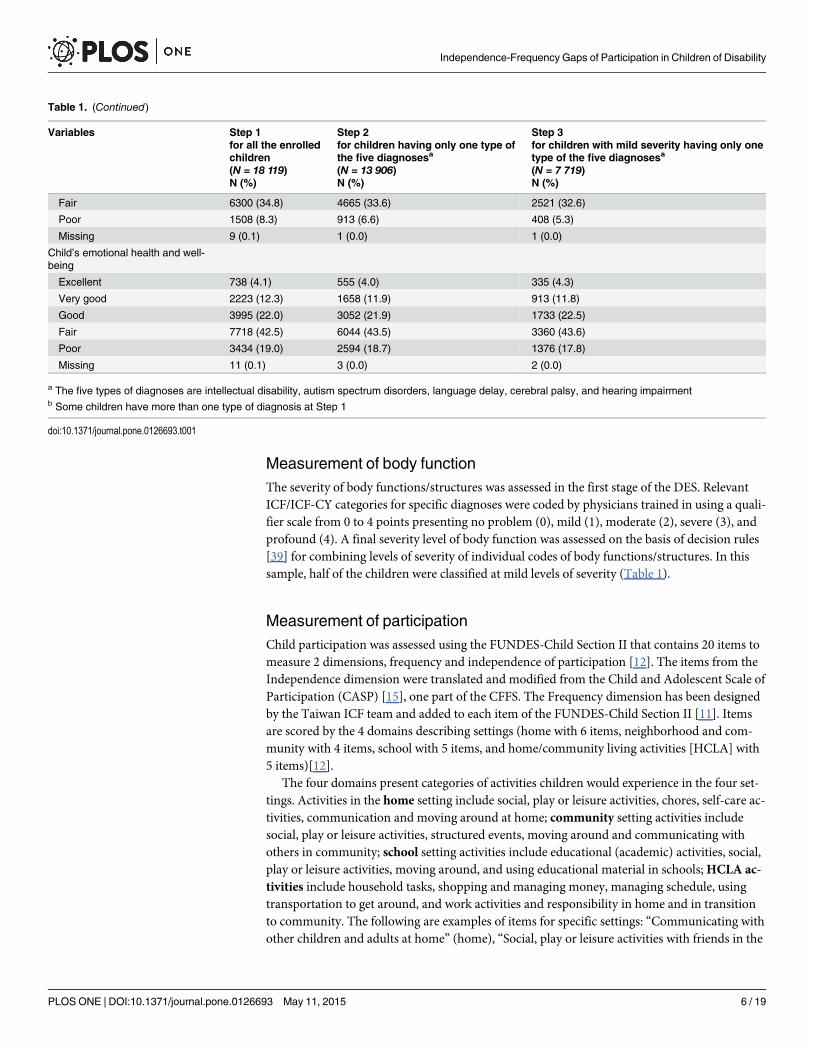
Fair 6300 (34.8) 4665 (33.6) 2521 (32.6)
Poor 1508 (8.3) 913 (6.6) 408 (5.3)
Missing 9 (0.1) 1 (0.0) 1 (0.0)
Child’s emotional health and well-being
Excellent 738 (4.1) 555 (4.0) 335 (4.3)
Very good 2223 (12.3) 1658 (11.9) 913 (11.8)
Good 3995 (22.0) 3052 (21.9) 1733 (22.5)
Fair 7718 (42.5) 6044 (43.5) 3360 (43.6)
Poor 3434 (19.0) 2594 (18.7) 1376 (17.8)
Missing 11 (0.1) 3 (0.0) 2 (0.0)
a The five types of diagnoses are intellectual disability, autism spectrum disorders, language delay, cerebral palsy, and hearing impairmentb Some children have more than one type of diagnosis at Step 1
doi:10.1371/journal.pone.0126693.t001
Independence-Frequency Gaps of Participation in Children of Disability
PLOS ONE | DOI:10.1371/journal.pone.0126693 May 11, 2015 6 / 19
neighborhood and community” (neighborhood and community), “Using educational materialsand equipment that are available to other children in his or her classroom that have been modi-fied for your child” (school), and “Shopping and managing money” (HCLA) [40].
The FUNDES-Child utilizes a proxy format in which parents or caregivers answer questionsabout their child’s activities in the previous 6 months. In keeping with the format used in theFUNDES-Adult interview [11,38], flash cards with scoring options were used to assist parentsin answering questions.
In the training manual and video of the FUNDES-Child, independence was defined as thechi1d’s current level of ability to participate compared to that of other children of his or her agein the same community. For each item, independence was rated as: 0 (independent), 1 (with su-pervision/ mild assistance), 2 (with moderate assistance), 3 (with full assistance). Frequency ofparticipation was rated with reference to age as: 0 (the same or more than expected for age), 1(somewhat less than expected for age), 2 (much less than expected for age), and 3 (never does).A response of not applicable (a child would not be expected to do that activity as peers of thesame age and in the same community) was allowed for both dimensions. All items were ratedunder the condition that children used assistive devices as usual. As each item was on the sameordinal scale with the same anchor points at the extreme end (0–3 points), the two dimensionswere comparable based on age-expected independence and frequency.
Items rated as "not applicable” were omitted in the scoring [40]. The mean scores for eachof the 4 settings of FUNDES-Child Section II are thus the sum of scores all “applicable” itemsdivided by the number of applicable items and then converted to a 0–100 scale. The certifiedtesters could therefore interpret the scores within the same directional framework (higherscores represented greater restriction).
Training of FUNDES testersCertified testers associated with 255 DES hospitals in Taiwan administered the FUNDES-Childby interviewing children’s parents or caregivers [41]. The certified testers were professionals li-censed as physical therapists, occupational therapists, speech therapists, social workers, clinicalpsychologists, counseling psychologists, nurses, audiologists, special education teachers, andvocational evaluators. The training programs for certified interviewers covered the proceduresof the DES and regulations (30 minutes), introduction to ICF and ICF-CY (30 mins), introduc-tion to assessment instruments (FUNDES-Adult [60 mins], FUNDES-Child [40 mins]), prac-tice of assessment instruments (200 mins), and the web-based platform for entry and storage ofdata (30 mins). At the end of each training course, a paper-and-pencil test was administered tocertify the attending professionals [41].
Data collectionChildren with disabilities were identified and recruited when they entered the DES system ac-companied by his/ her caregiver or parents. The first step was usually a visit with one physicianfollowed by the FUNDES-Child assessment with a certified tester in a room in an authorizedhospital. The interview and rating of the FUNDES-Child lasted about 40–60 minutes.
Data entry and analysisTo ensure data quality, all the assessment records were entered by the officers in hospitals intothe TDPD, a nationwide web-based information system, and checked by the officer of the localdepartment of health. The physician and the FUNDES qualified tester who completed the dis-ability assessment report were required to enter their names into the information system. The
Independence-Frequency Gaps of Participation in Children of Disability
PLOS ONE | DOI:10.1371/journal.pone.0126693 May 11, 2015 7 / 19
self-detection mechanism of the information system prevented data errors and missing re-sponses. The data were then exported to statistical packages periodically.
According to the flow of the three steps of data reduction and analysis (Fig 1), the strategiesof analysis are described below.
In Step 1, we included all the enrolled children (n = 18,119) to illustrate the global pictureof the changes of independence, frequency and the gaps between them with age as a functionas severity and settings. The mean scores for independence and frequency were plotted ondual Y coordinates (from age expected to most restricted based on a 0–100 scale), indicatingthe discrepancy between independence and frequency grouped by severity and settings acrossage (Fig 2).
In Step 2, we included the children seen only in one of the more frequent diagnostic groups(n = 13,906) to avoid the issue of comorbidity. The independence-frequency gaps were definedas the scores of independence restriction minus the scores of frequency restriction. If the inde-pendence-frequency gap was positive, it meant that restriction of independence was greaterthan that of frequency (or doing frequency exceeded doing ability); if the gap was negative, itmeant that restriction of frequency was greater than that of independence (or doing ability ex-ceeded doing frequency). The gap, discrepancy between independence and frequency, is widerif the values of the positive gap increase or the negative gap values decrease.
The independence-frequency gaps were first derived for 4 severity levels by 4 settings to ex-plore the effects of severity and setting on the gaps. Then, for each severity level, the gaps wereanalyzed for diagnostic groups by settings to explore the effects of diagnosis and setting on thegaps. Distribution of the severity levels of the majority of the participants (n = 13,906, 76.7%)classified on the basis of the four major diagnostic groups is listed in Table 1. The mean gaps(positive gaps are shown with bold characters and numbers in Table 2) were analyzed acrossdiagnosis/severity with ANOVA, and across setting with repeated measures ANOVA, followedby Scheffé's post hoc analyses (Table 2). Considering the significant discrepancy of samplesizes between diagnostic/severity groups that could contribute to variance inequality, Leven’stest for homogeneity was conducted before ANOVA. Welch ANOVA and Games-Howell posthoc analyses were performed if the data failed to meet the equal variance assumption. The rela-tionship between independence and frequency were analyzed with Pearson’s correlation infour settings for each severity level with alpha set at 0.05 (2-tailed).
In Step 3, only the children with mild severity (n = 7,719) were included to examine the na-ture of the independence-frequency gap as a function of the age by diagnosis/setting interactionwith linear trend analysis. Trends were plotted by age on dual Y coordinates, contrasting thediscrepancy between independence and frequency (Fig 3). Linear trends analyses with the sig-nificance level set at 0.05 (2-tailed) were conducted for independence, frequency, and the gapsacross ages (Table 3). The significance of the linear trend was tested by ANOVA for 12 agegroups, and the between-groups sum of squares for the effect of age was partitioned into a line-ar trend and higher order trends. The linear trend component was tested by an F-ratio (themean square for linear trend/error term). The statistical analyses in Step 2 and Step 3 were per-formed with SPSS 20.0 (IBM SPSS, Chicago, Illinois, 2013).
ResultsFor Step 1, among the 18,119 children, 1,106 (6%) children had two of the four diagnoses, andonly 16 (< 0.1%) children had more than two diagnoses. Among the children diagnosed withan intellectual disability (n = 10,310) (Table 1), 650 children (6%) were also diagnosed withASD, 264 (3%) with language/hearing impairments, and 154 (1%) children with cerebral palsy.Furthermore, there was significant association between impairment severity and the number of
Independence-Frequency Gaps of Participation in Children of Disability
PLOS ONE | DOI:10.1371/journal.pone.0126693 May 11, 2015 8 / 19
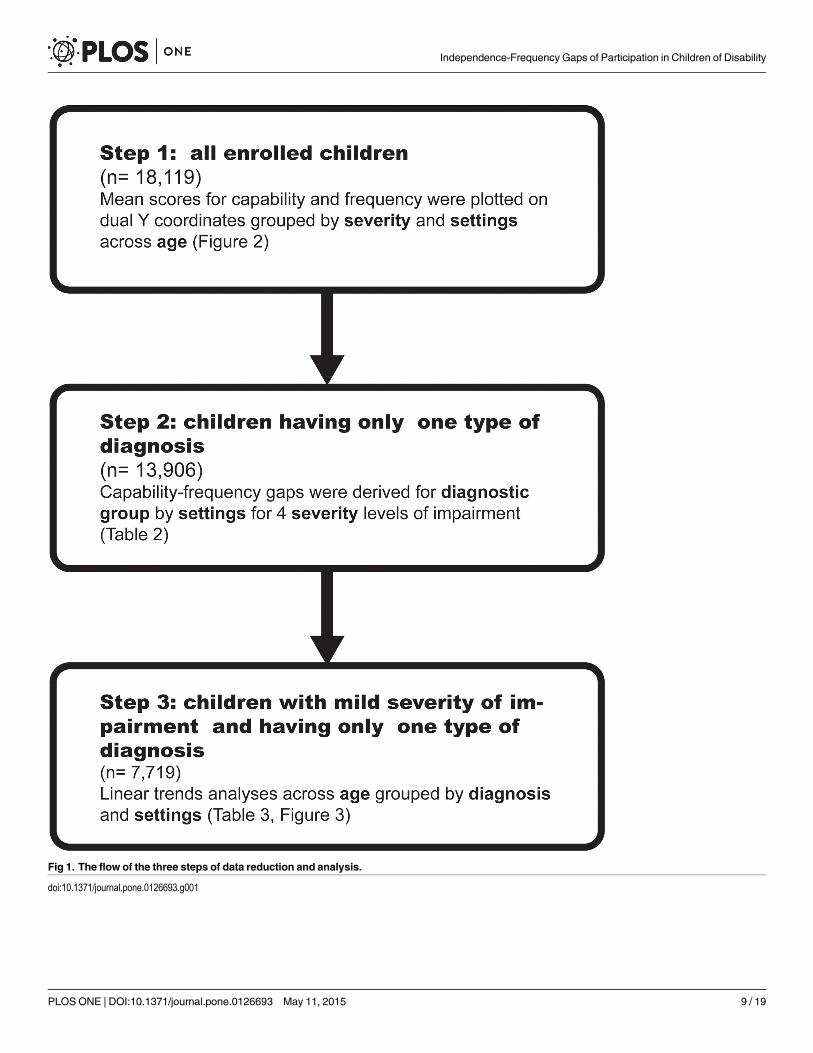
Fig 1. The flow of the three steps of data reduction and analysis.
doi:10.1371/journal.pone.0126693.g001
Independence-Frequency Gaps of Participation in Children of Disability
PLOS ONE | DOI:10.1371/journal.pone.0126693 May 11, 2015 9 / 19
comorbid conditions (Chi-square = 1145.38, P<0.001). Of the 9,561children with mild severi-ty, 7,720 children (81%) had only one diagnosis, while of the 1,170 children with profound se-verity, 540 children (46%) had two or more diagnoses. Of the 18,119 children, 45% lived in thenorthern part of Taiwan, which has the highest level of urbanization, 21% in the central part,27% in the southern part, with 7% in the western part and some remote islands, which have thelowest level of urbanization.
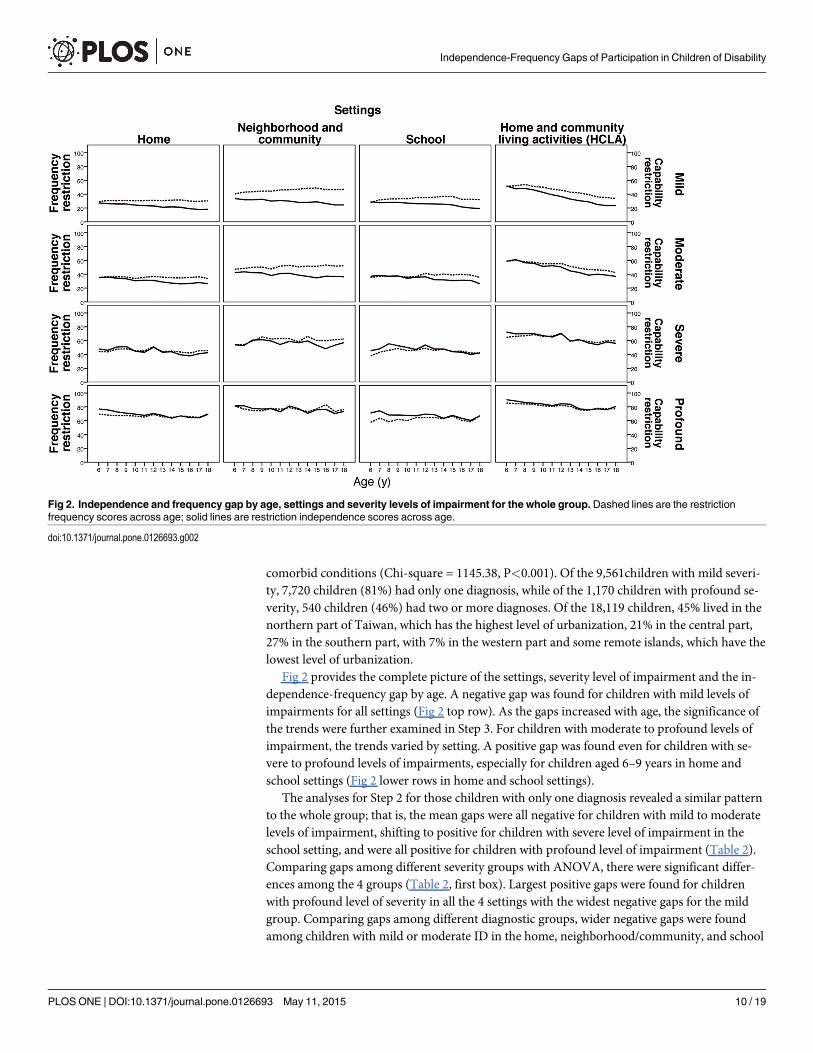
Fig 2 provides the complete picture of the settings, severity level of impairment and the in-dependence-frequency gap by age. A negative gap was found for children with mild levels ofimpairments for all settings (Fig 2 top row). As the gaps increased with age, the significance ofthe trends were further examined in Step 3. For children with moderate to profound levels ofimpairment, the trends varied by setting. A positive gap was found even for children with se-vere to profound levels of impairments, especially for children aged 6–9 years in home andschool settings (Fig 2 lower rows in home and school settings).
The analyses for Step 2 for those children with only one diagnosis revealed a similar patternto the whole group; that is, the mean gaps were all negative for children with mild to moderatelevels of impairment, shifting to positive for children with severe level of impairment in theschool setting, and were all positive for children with profound level of impairment (Table 2).Comparing gaps among different severity groups with ANOVA, there were significant differ-ences among the 4 groups (Table 2, first box). Largest positive gaps were found for childrenwith profound level of severity in all the 4 settings with the widest negative gaps for the mildgroup. Comparing gaps among different diagnostic groups, wider negative gaps were foundamong children with mild or moderate ID in the home, neighborhood/community, and school
Fig 2. Independence and frequency gap by age, settings and severity levels of impairment for the whole group.Dashed lines are the restrictionfrequency scores across age; solid lines are restriction independence scores across age.
doi:10.1371/journal.pone.0126693.g002
Independence-Frequency Gaps of Participation in Children of Disability
PLOS ONE | DOI:10.1371/journal.pone.0126693 May 11, 2015 10 / 19
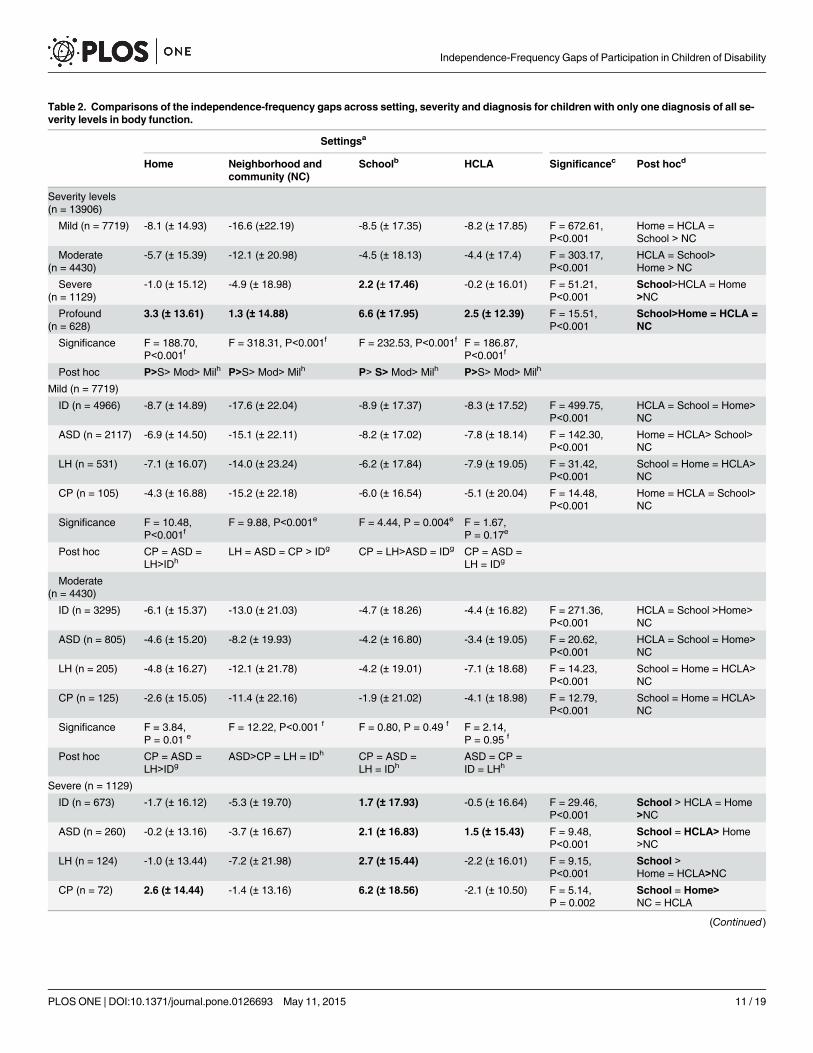
Table 2. Comparisons of the independence-frequency gaps across setting, severity and diagnosis for children with only one diagnosis of all se-verity levels in body function.
Settingsa
Home Neighborhood andcommunity (NC)
Schoolb HCLA Significancec Post hocd
Severity levels(n = 13906)
Mild (n = 7719) -8.1 (± 14.93) -16.6 (±22.19) -8.5 (± 17.35) -8.2 (± 17.85) F = 672.61,P<0.001
Home = HCLA =School > NC
Moderate(n = 4430)
-5.7 (± 15.39) -12.1 (± 20.98) -4.5 (± 18.13) -4.4 (± 17.4) F = 303.17,P<0.001
HCLA = School>Home > NC
Severe(n = 1129)
-1.0 (± 15.12) -4.9 (± 18.98) 2.2 (± 17.46) -0.2 (± 16.01) F = 51.21,P<0.001
School>HCLA = Home>NC
Profound(n = 628)
3.3 (± 13.61) 1.3 (± 14.88) 6.6 (± 17.95) 2.5 (± 12.39) F = 15.51,P<0.001
School>Home = HCLA =NC
Significance F = 188.70,P<0.001f
F = 318.31, P<0.001f F = 232.53, P<0.001f F = 186.87,P<0.001f
Post hoc P>S> Mod> Milh P>S> Mod> Milh P> S> Mod> Milh P>S> Mod> Milh
Mild (n = 7719)
ID (n = 4966) -8.7 (± 14.89) -17.6 (± 22.04) -8.9 (± 17.37) -8.3 (± 17.52) F = 499.75,P<0.001
HCLA = School = Home>NC
ASD (n = 2117) -6.9 (± 14.50) -15.1 (± 22.11) -8.2 (± 17.02) -7.8 (± 18.14) F = 142.30,P<0.001
Home = HCLA> School>NC
LH (n = 531) -7.1 (± 16.07) -14.0 (± 23.24) -6.2 (± 17.84) -7.9 (± 19.05) F = 31.42,P<0.001
School = Home = HCLA>NC
CP (n = 105) -4.3 (± 16.88) -15.2 (± 22.18) -6.0 (± 16.54) -5.1 (± 20.04) F = 14.48,P<0.001
Home = HCLA = School>NC
Significance F = 10.48,P<0.001f
F = 9.88, P<0.001e F = 4.44, P = 0.004e F = 1.67,P = 0.17e
Post hoc CP = ASD =LH>IDh
LH = ASD = CP > IDg CP = LH>ASD = IDg CP = ASD =LH = IDg
Moderate(n = 4430)
ID (n = 3295) -6.1 (± 15.37) -13.0 (± 21.03) -4.7 (± 18.26) -4.4 (± 16.82) F = 271.36,P<0.001
HCLA = School >Home>NC
ASD (n = 805) -4.6 (± 15.20) -8.2 (± 19.93) -4.2 (± 16.80) -3.4 (± 19.05) F = 20.62,P<0.001
HCLA = School = Home>NC
LH (n = 205) -4.8 (± 16.27) -12.1 (± 21.78) -4.2 (± 19.01) -7.1 (± 18.68) F = 14.23,P<0.001
School = Home = HCLA>NC
CP (n = 125) -2.6 (± 15.05) -11.4 (± 22.16) -1.9 (± 21.02) -4.1 (± 18.98) F = 12.79,P<0.001
School = Home = HCLA>NC
Significance F = 3.84,P = 0.01 e
F = 12.22, P<0.001 f F = 0.80, P = 0.49 f F = 2.14,P = 0.95 f
Post hoc CP = ASD =LH>IDg
ASD>CP = LH = IDh CP = ASD =LH = IDh
ASD = CP =ID = LHh
Severe (n = 1129)
ID (n = 673) -1.7 (± 16.12) -5.3 (± 19.70) 1.7 (± 17.93) -0.5 (± 16.64) F = 29.46,P<0.001
School > HCLA = Home>NC
ASD (n = 260) -0.2 (± 13.16) -3.7 (± 16.67) 2.1 (± 16.83) 1.5 (± 15.43) F = 9.48,P<0.001
School = HCLA> Home>NC
LH (n = 124) -1.0 (± 13.44) -7.2 (± 21.98) 2.7 (± 15.44) -2.2 (± 16.01) F = 9.15,P<0.001
School >Home = HCLA>NC
CP (n = 72) 2.6 (± 14.44) -1.4 (± 13.16) 6.2 (± 18.56) -2.1 (± 10.50) F = 5.14,P = 0.002
School = Home>NC = HCLA
(Continued)
Independence-Frequency Gaps of Participation in Children of Disability
PLOS ONE | DOI:10.1371/journal.pone.0126693 May 11, 2015 11 / 19
settings, and children with mild ASD in the school setting (Table 2, 2nd and 3rd box). A signifi-cantly greater positive gap was found only for the profound children with CP in home setting(Table 2, 5th box).
Across the four settings, the widest negative gap was found significantly in the setting ofneighborhood/community for the four diagnostic groups of children with mild to severe levelof impairments based on the post hoc analysis (Table 2). For children with a profound level ofimpairment, the largest positive gaps were in the school setting, especially for children with IDand ASD (Table 2, 5th box).
The correlations between independence and performance for the four settings were moder-ate (r = 0.59–0.70, P<0.001) for children with mild severity, were moderate to high (r = 0.66–0.76, P<0.001) for children with moderate severity, were high for both severe (r = 0.77–0.84,P<0.001) and profound groups (r = 0.75–0.84, P<0.001).
The results of the Step 3 analysis are shown in Table 3, with mean values of frequency, inde-pendence, gap and the corresponding trends with age for children with mild severity and
Table 2. (Continued)
Settingsa
Home Neighborhood andcommunity (NC)
Schoolb HCLA Significancec Post hocd
Significance F = 2.25,P = 0.08 f
F = 2.47, P = 0.06 f F = 1.38, P = 0.25 e F = 2.29,P = 0.77 e
Post hoc CP = ASD = ID= LHh
CP = ASD = ID = LH h ID = ASD =LH = CPg
ASD = ID = CP= LHg
Profound (n = 628)
ID (n = 318) 3.0 (± 14.22) 0.9 (± 15.89) 6.0 (± 18.53) 2.2 (± 12.46) F = 6.68,P<0.001
School>Home =HCLA>NC
ASD (n = 149) 1.9 (± 11.58) 0.4 (± 13.10) 4.9 (± 14.17) 3.7 (± 13.42) F = 4.55,P = 0.004
School> HCLA = Home =NC
LH (n = 50) 2.0 (± 13.90) 2.7 (± 14.36) 8.5 (± 20.36) 1.0 (± 8.24) F = 2.81,P = 0.060
School = NC = Home =HCLA
CP (n = 111) 6.7 (± 13.85) 3.3 (± 14.28) 10.6 (± 20.00) 2.24 (± 12.16) F = 8.02,P<0.001
School = Home> NC =HCLA
Significance F = 2.97,P = 0.03 e
F = 0.98, P = 0.40 e F = 1.88, P = 0.14 f F = 0.91,P = 0.44 f
Post hoc CP> ID = LH =ASDg
CP = LH = ID = ASDh CP = LH =ID = ASDh
ASD = CP =ID = LHh
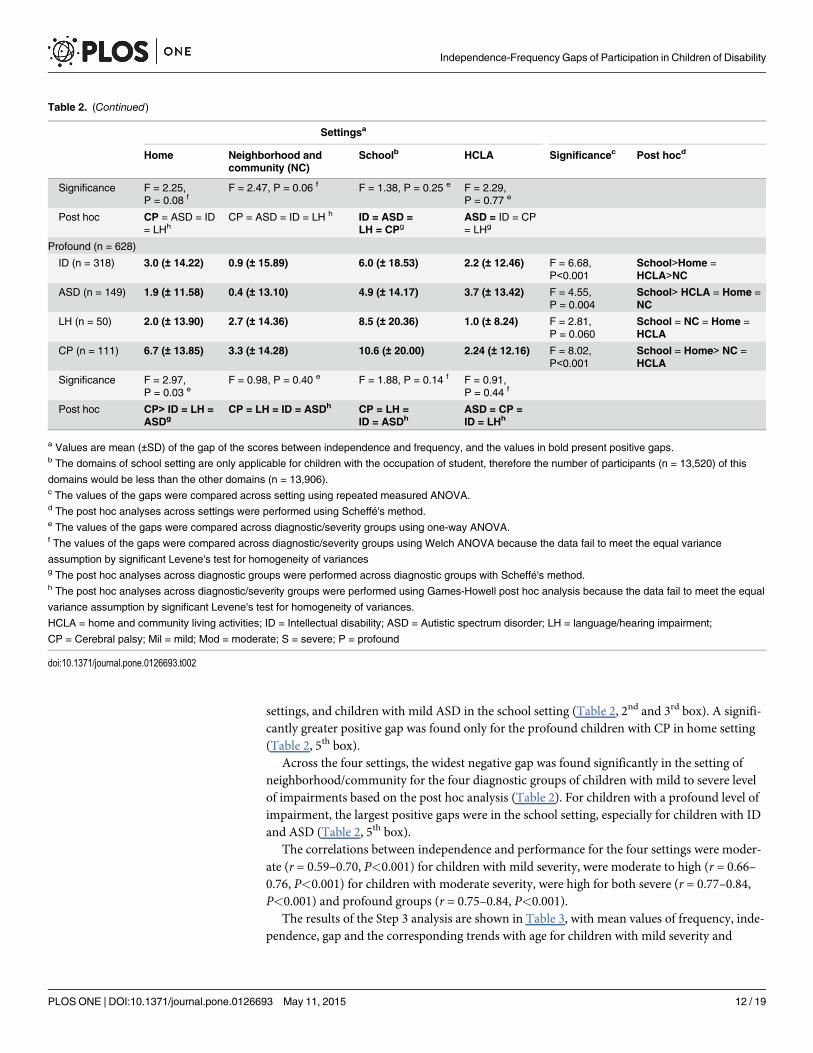
a Values are mean (±SD) of the gap of the scores between independence and frequency, and the values in bold present positive gaps.b The domains of school setting are only applicable for children with the occupation of student, therefore the number of participants (n = 13,520) of this
domains would be less than the other domains (n = 13,906).c The values of the gaps were compared across setting using repeated measured ANOVA.d The post hoc analyses across settings were performed using Scheffé's method.e The values of the gaps were compared across diagnostic/severity groups using one-way ANOVA.f The values of the gaps were compared across diagnostic/severity groups using Welch ANOVA because the data fail to meet the equal variance
assumption by significant Levene's test for homogeneity of variancesg The post hoc analyses across diagnostic groups were performed across diagnostic groups with Scheffé's method.h The post hoc analyses across diagnostic/severity groups were performed using Games-Howell post hoc analysis because the data fail to meet the equal
variance assumption by significant Levene's test for homogeneity of variances.
HCLA = home and community living activities; ID = Intellectual disability; ASD = Autistic spectrum disorder; LH = language/hearing impairment;
CP = Cerebral palsy; Mil = mild; Mod = moderate; S = severe; P = profound
doi:10.1371/journal.pone.0126693.t002
Independence-Frequency Gaps of Participation in Children of Disability
PLOS ONE | DOI:10.1371/journal.pone.0126693 May 11, 2015 12 / 19
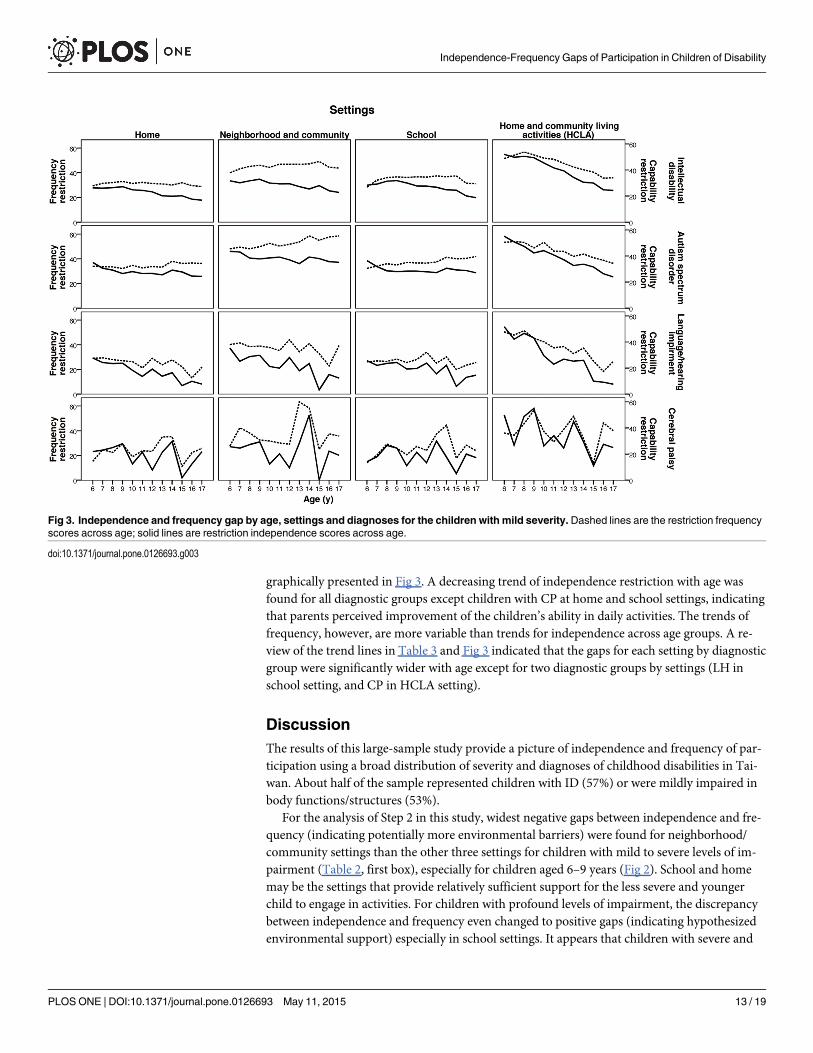
graphically presented in Fig 3. A decreasing trend of independence restriction with age wasfound for all diagnostic groups except children with CP at home and school settings, indicatingthat parents perceived improvement of the children’s ability in daily activities. The trends offrequency, however, are more variable than trends for independence across age groups. A re-view of the trend lines in Table 3 and Fig 3 indicated that the gaps for each setting by diagnosticgroup were significantly wider with age except for two diagnostic groups by settings (LH inschool setting, and CP in HCLA setting).
DiscussionThe results of this large-sample study provide a picture of independence and frequency of par-ticipation using a broad distribution of severity and diagnoses of childhood disabilities in Tai-wan. About half of the sample represented children with ID (57%) or were mildly impaired inbody functions/structures (53%).
For the analysis of Step 2 in this study, widest negative gaps between independence and fre-quency (indicating potentially more environmental barriers) were found for neighborhood/community settings than the other three settings for children with mild to severe levels of im-pairment (Table 2, first box), especially for children aged 6–9 years (Fig 2). School and homemay be the settings that provide relatively sufficient support for the less severe and youngerchild to engage in activities. For children with profound levels of impairment, the discrepancybetween independence and frequency even changed to positive gaps (indicating hypothesizedenvironmental support) especially in school settings. It appears that children with severe and
Fig 3. Independence and frequency gap by age, settings and diagnoses for the children with mild severity. Dashed lines are the restriction frequencyscores across age; solid lines are restriction independence scores across age.
doi:10.1371/journal.pone.0126693.g003
Independence-Frequency Gaps of Participation in Children of Disability
PLOS ONE | DOI:10.1371/journal.pone.0126693 May 11, 2015 13 / 19
profound disabilities receive more support in school settings (Table 2, 1st and 4th-5th boxes).Previous studies have shown that children with disabilities experience barriers for participationin different settings, especially with regard to physical demands and needs in school. Theseareas were largely unmet in accommodations of special computer equipment, adapted furni-ture or accessibility of school buildings [24,42–44]. In this study, however, the children with IDor ASD with mild severity were even less supported than children with physical disability in so-cial participation (Table 2, 2nd boxes).
Social and institutional barriers have been identified as the most significant environmentalbarriers in studies of children with disabling conditions in Canadian communities [26,45]. Pa-rents reported that their children encountered greater barriers to participate in school andwork environments, and the barriers included problems with service, assistance, attitude, andpolicy. Poorly designed barrier-free community facilities, difficulty getting information aboutservices and programs, the vague process of applying to schools, and negative attitudes wereparticipation challenges faced by children in these studies [26,45]. The attitudes and abilities ofteachers to modify courses and instruction were also important influential factors on the extentof children’s participation [26,45].
Further statistical analyses in Step 3 indicated that the independence restriction to participatein daily activities decreased significantly with age among the children with mild severity, exceptfor children with CP in home and school settings. The trend of frequency with age, however,
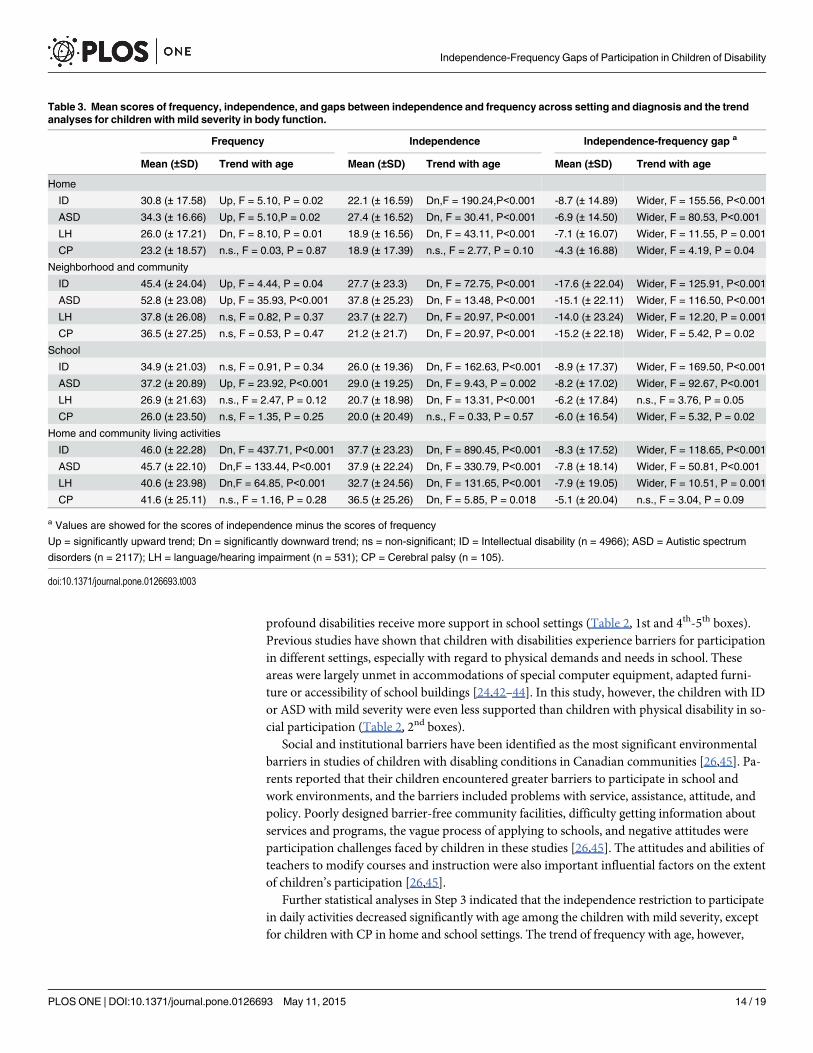
Table 3. Mean scores of frequency, independence, and gaps between independence and frequency across setting and diagnosis and the trendanalyses for children with mild severity in body function.
Frequency Independence Independence-frequency gap a
Mean (±SD) Trend with age Mean (±SD) Trend with age Mean (±SD) Trend with age
Home
ID 30.8 (± 17.58) Up, F = 5.10, P = 0.02 22.1 (± 16.59) Dn,F = 190.24,P<0.001 -8.7 (± 14.89) Wider, F = 155.56, P<0.001
ASD 34.3 (± 16.66) Up, F = 5.10,P = 0.02 27.4 (± 16.52) Dn, F = 30.41, P<0.001 -6.9 (± 14.50) Wider, F = 80.53, P<0.001
LH 26.0 (± 17.21) Dn, F = 8.10, P = 0.01 18.9 (± 16.56) Dn, F = 43.11, P<0.001 -7.1 (± 16.07) Wider, F = 11.55, P = 0.001
CP 23.2 (± 18.57) n.s., F = 0.03, P = 0.87 18.9 (± 17.39) n.s., F = 2.77, P = 0.10 -4.3 (± 16.88) Wider, F = 4.19, P = 0.04
Neighborhood and community
ID 45.4 (± 24.04) Up, F = 4.44, P = 0.04 27.7 (± 23.3) Dn, F = 72.75, P<0.001 -17.6 (± 22.04) Wider, F = 125.91, P<0.001
ASD 52.8 (± 23.08) Up, F = 35.93, P<0.001 37.8 (± 25.23) Dn, F = 13.48, P<0.001 -15.1 (± 22.11) Wider, F = 116.50, P<0.001
LH 37.8 (± 26.08) n.s, F = 0.82, P = 0.37 23.7 (± 22.7) Dn, F = 20.97, P<0.001 -14.0 (± 23.24) Wider, F = 12.20, P = 0.001
CP 36.5 (± 27.25) n.s, F = 0.53, P = 0.47 21.2 (± 21.7) Dn, F = 20.97, P<0.001 -15.2 (± 22.18) Wider, F = 5.42, P = 0.02
School
ID 34.9 (± 21.03) n.s, F = 0.91, P = 0.34 26.0 (± 19.36) Dn, F = 162.63, P<0.001 -8.9 (± 17.37) Wider, F = 169.50, P<0.001
ASD 37.2 (± 20.89) Up, F = 23.92, P<0.001 29.0 (± 19.25) Dn, F = 9.43, P = 0.002 -8.2 (± 17.02) Wider, F = 92.67, P<0.001
LH 26.9 (± 21.63) n.s., F = 2.47, P = 0.12 20.7 (± 18.98) Dn, F = 13.31, P<0.001 -6.2 (± 17.84) n.s., F = 3.76, P = 0.05
CP 26.0 (± 23.50) n.s, F = 1.35, P = 0.25 20.0 (± 20.49) n.s., F = 0.33, P = 0.57 -6.0 (± 16.54) Wider, F = 5.32, P = 0.02
Home and community living activities
ID 46.0 (± 22.28) Dn, F = 437.71, P<0.001 37.7 (± 23.23) Dn, F = 890.45, P<0.001 -8.3 (± 17.52) Wider, F = 118.65, P<0.001
ASD 45.7 (± 22.10) Dn,F = 133.44, P<0.001 37.9 (± 22.24) Dn, F = 330.79, P<0.001 -7.8 (± 18.14) Wider, F = 50.81, P<0.001
LH 40.6 (± 23.98) Dn,F = 64.85, P<0.001 32.7 (± 24.56) Dn, F = 131.65, P<0.001 -7.9 (± 19.05) Wider, F = 10.51, P = 0.001
CP 41.6 (± 25.11) n.s., F = 1.16, P = 0.28 36.5 (± 25.26) Dn, F = 5.85, P = 0.018 -5.1 (± 20.04) n.s., F = 3.04, P = 0.09
a Values are showed for the scores of independence minus the scores of frequency
Up = significantly upward trend; Dn = significantly downward trend; ns = non-significant; ID = Intellectual disability (n = 4966); ASD = Autistic spectrum
disorders (n = 2117); LH = language/hearing impairment (n = 531); CP = Cerebral palsy (n = 105).
doi:10.1371/journal.pone.0126693.t003
Independence-Frequency Gaps of Participation in Children of Disability
PLOS ONE | DOI:10.1371/journal.pone.0126693 May 11, 2015 14 / 19
varied across the impairment by diagnosis clusters (Table 3). The trend of gaps showed that themean frequency restriction of participation was higher than mean independence across settingsand diagnoses and the mean independence-frequency gap became progressively wider with ageacross settings (Fig 3). This may suggest that children with mild severity have fewer opportuni-ties to do tasks than they are capable of doing as they transition to adulthood.
It should be noted that for children with mild severity of impairment, data for independenceand frequency for children with ID and ASD were relatively more restricted than for childrenwith CP or LH (Table 3). The negative gap was also more obvious in children with mild ratherthan severe impairment (Table 2). This may be due to the social nature of participation and thefact that the children with ID or with mild impairment face more environmental barriers (sug-gested by negative gaps) than other diagnoses or more severe groups.
In the past, eligibility for financial or social support in Taiwan was based on either im-pairment or diagnosis, and the children with more severe levels of impairment or with moreobservable diagnoses such as motoric (e.g., cerebral palsy) or sensory deficits (e.g., hearing lossor visual impairments) were eligible for packaged services (especially pension or assistive tech-nology or home services) matched to specific diagnoses and impairment levels.
Resource distribution, however, should be based on the consideration that children with so-cial/emotional as well as less severe impairments also need tailored services (such as personalsupport and care)[11] aimed at the goal of optimal participation as framed by ICF-CY and con-sistent with age-appropriate milestones. The joint impairment-participation decision for theDisability Evaluation System, particularly for the large population of individuals with mild in-tellectual disability is now under construction in Taiwan [18]. The results of this study provideevidence to inform policy and decision making for the DES.
Overall, based on the profiles of independence and frequency among children with disabilitiesprovided by Step 1 (Fig 2), restriction of independence in daily participation decreased with agewhereas restriction of participation frequency varied across setting and diagnosis. These datasuggest that frequency, defined as the performance dimension of participation, what children didin the past 6 months, is a more useful variable and context-dependent measure of participationthan independence. The negative gap between independence-frequency became wider with age,especially in neighborhood and community settings and in children with mild impairment. Chil-dren with mild levels of impairments are probably more often in neighborhood and communitysettings and thus exposed to more complex and less adapted environments. A positive gap forparticipation was found for children with severe to profound levels of impairment in home andschool settings especially children aged 6–9 years of age. It may be that families and schools pro-vide more support to children of a younger age and with more severe impairment levels.
A group of children sharing the same diagnosis, such as CP, may show a wide range of dis-ability/functioning in daily life and some may not have limitations in mobility. Children withvarious diagnoses may also share common limitations of functioning, especially for participa-tion in specific settings because of the environmental support or barriers encountered.
Children’s participation provides valuable information beyond diagnoses for assessing chil-dren’s needs [46] in all education settings (classroom settings as well as school-related clinicalsettings) with implications for continuity in the transitions from one educational level to thenext and into work and employment [47]. Further analysis of environmental factors other thanphysical settings is needed, such as parents’ perspective on the provision of opportunities foractivities. Continued research on the social as well as physical factors of the environment isneeded to identify the conditions and opportunities that can promote the participation of chil-dren with disabilities.
Several limitations of this study need to be considered. First, the distribution of childrenacross levels of severity, diagnoses, and ages was not even. This resulted in varied mean scores
Independence-Frequency Gaps of Participation in Children of Disability
PLOS ONE | DOI:10.1371/journal.pone.0126693 May 11, 2015 15 / 19
as shown in Fig 3 especially for the children with CP and in a specific age range. Second, the co-morbidity issue is an inevitable challenge in data analysis for the effects of diagnoses on func-tional outcomes. Therefore, we only performed statistical analysis for Step 2 and 3 wherechildren with more than one type of diagnosis were excluded. Third, the FUNDES-Child wasdesigned to obtain caregiver’s or parents’ perceptions of children’s independence and frequen-cy of engaging in activities. Thus, all the information was based on ratings by caregivers or pa-rents within the scope of the report format of the FUNDES-Child in Taiwan. Caregivers orparents may not be as familiar with children’s participation in the school setting as in thehome. Self-rating of participation by children was not feasible in that children often wouldhave difficulty comprehending the questions.
Parents rating for measuring children’ participation has been seen as a valid approach to ex-plore the patterns of participation in different settings and ages [48,49]. For children capable ofanswering survey questions, they should respond for themselves [9] as the integration of thechild’s perspective and choice is especially important for full participation in life as an activelearner [32,50]. Future studies of FUNDES-Child will prioritize self-ratings of participation bychildren, perhaps using pictures of the activities. Fourth, the independence-frequency gap maybe only one of several ways to conceptualize the role of the environment. While we believe thisis one reasoned approach, others may emerge as these concepts develop over time. The rela-tions between gaps and environmental factors need further studies.
ConclusionIn conclusion, this large-sample study of participants drawn from a disability register systemencompassing a broad range of disabilities, demographic characteristics, and ages provides arather comprehensive picture of functional characteristics/limitations of children with develop-mental disabilities in Taiwan. Diagnoses, physical conditions and related severity of impair-ments and limitations of functioning and participation have been differentiated with the ICF/ICF-CY model [4,21] and validated with empirical data [5,17]. Findings for this study indicatethat children’s participation depends not only on the severity of their impairments or diagno-ses, but also on their age, the settings and supports provided by their environments. A priorityfor future research is thus further identification of environmental opportunities that positivelyimpact frequency of participation in daily activities for children withdevelopmental disabilities.
AcknowledgmentsWe thank all the children and parents that participated in the study. We also thank the ICFteam member: Ben-Shang Chang, Shu-Jen Lu, Kwang-Hwa Chang.
Author ContributionsConceived and designed the experiments: AWHHFL THL SWTWTC. Performed the experi-ments: AWHHFL THL SWTWTC CFYWCC LJK TFW. Analyzed the data: AWH CFYWCC. Contributed reagents/materials/analysis tools: HFL AWH LJK CFY TFW. Wrote thepaper: AWH HFL RJS DJL CFY LJK. Research project organization: HFL THL SWTWTC. Re-search project execution: HFL THL AWH.
References1. Winter S, Autry A, Boyle C, Yeargin-Allsopp M (2002) Trends in the prevalence of cerebral palsy in a
population-based study. Pediatrics 110: 1220–1225. PMID: 12456922
Independence-Frequency Gaps of Participation in Children of Disability
PLOS ONE | DOI:10.1371/journal.pone.0126693 May 11, 2015 16 / 19
2. Crocker AC, Rubin IL (1989) The spectrum of medical care for developmental disabilities. In: CrockerAC, editor. Developmental disabilities: Delivery of medical care for children and adult. Philadelphia,PA: Lea and Febiger. pp. 10.
3. Simeonsson RJ, Carlson D, Huntington GS, McMillen JS, Brent JL (2001) Students with disabilities: Anational survey of participation in school activities. Disabil Rehabil 23: 49–63. PMID: 11214716
4. World Health Organization (2007) International Classification of Functioning, Disability and Health:Children & Youth Version (ICF-CY). Geneva: WHO.
5. McDougall J, King G, deWit DJ, Miller LT, Hong S, Offord DR, et al. (2004) Chronic physical health con-ditions and disability among Canadian school-aged children: A national profile. Disabil Rehabil 26: 35–45. PMID: 14660197
6. Lollar DJ, Hartzell MS, Evans MA (2012) Functional difficulties and health conditions among childrenwith special health needs. Pediatrics 129: e714–e722. doi: 10.1542/peds.2011-0780 PMID: 22371461
7. Boyle CA, Boulet S, Schieve LA, Cohen RA, Blumberg SJ, Yeargin-Allsopp M, et al. (2011) Trends inthe prevalence of developmental disabilities in US children, 1997–2008. Pediatrics 127: 1034–1042.doi: 10.1542/peds.2010-2989 PMID: 21606152
8. Boyle CA, Decoufle P, Yeargin-Allsopp M (1994) Prevalence and health impact of developmental dis-abilities in US children. Pediatrics 93: 399–403. PMID: 7509480
9. Newacheck PW (1998) Prevalence and impact of disabling chronic conditions in childhood. AJPH 88:610–617.
10. Ministry of Health andWelfare (2007) People with Disabilities Rights of Protection Act. Taiwan. Avail-able: http://law.moj.gov.tw/Eng/LawClass/LawContent.aspx?PCODE=D0050046. Accessed 30 July2014.
11. ChiuWT, Yen CF, Teng SW, Liao HF, Chang KH, Chi WC, et al. (2013) Implementing disability evalua-tion and welfare services based on the framework of the international classification of functioning, dis-ability and health: Experiences in Taiwan. BMCHealth Serv Res 13: 416. doi: 10.1186/1472-6963-13-416 PMID: 24125482
12. Hwang AW, Liou TH, Bedell GM, Kang LJ, ChenWC, Yen CF, et al. (2013) Psychometric properties ofthe Child and Adolescent Scale of Participation—Traditional Chinese Version. Int J Rehabil Res 36:211–220. doi: 10.1097/MRR.0b013e32835d0b27 PMID: 23328815
13. Liao HF, Yen CF, Hwang AW, Liou TH, Chang BS, Wu TF, et al. (2013) Introduction to the applicationof the Functioning Scale of the Disability Evaluation System. Formosan J Med 17: 317–331.
14. Bedell G (2004) Developing a follow-up survey focused on participation of children and youth with ac-quired brain injuries after discharge from inpatient rehabilitation. NeuroRehabilitation 19: 191–205.PMID: 15502253
15. Bedell G (2009) Further validation of the Child and Adolescent Scale of Participation (CASP). Dev Neu-rorehabil 12: 342–351. doi: 10.3109/17518420903087277 PMID: 20477563
16. Ministry of Health andWelfare (2014) Disability statistics. Taiwan. Available: http://www.mohw.gov.tw/cht/DOS/Statistic.aspx?f_list_no=312&fod_list_no=4198. Accessed 30 July 2014.
17. Van Naarden Braun K, Yeargin-Allsopp M, Lollar D (2009) Activity limitations among young adults withdevelopmental disabilities: A population-based follow-up study. Res Dev Disabil 30: 179–191. doi: 10.1016/j.ridd.2008.02.004 PMID: 18455365
18. Chi WC, Liou TH, HuangWNW, Yen CF, Teng SW, Chang IC (2013) Developing a disability determina-tion model using a decision support system in Taiwan: A pilot study. J Formos Med Assoc 112: 473–481. doi: 10.1016/j.jfma.2013.06.005 PMID: 23871551
19. Law M, Finkelman S, Hurley P, Rosenbaum P, King S, King G, et al. (2004) Participation of childrenwith physical disabilities: Relationship with diagnosis, physical function, and demographic variables.Scand J Occup Ther 11: 156–162.
20. United Nations (1989) Convention on the Rights of the Child (UNCRC) (Article 7, 8, 12, 13, 17, 23).
21. World Health Organization (2001) International Classification of Functioning, Disability and Health: ICF.Geneva: WHO.
22. Bedell G, Dumas HM (2004) Social participation of children and youth with acquired brain injuries dis-charged from inpatient rehabilitation: A follow-up study. Brain Inj 18: 65–82. PMID: 14660237
23. Eriksson L (2005) The relationship between school environment and participation for students with dis-abilities. Pediatr Rehabil 8: 130–139. PMID: 16089253
24. Galvin J, Froude EH, McAleer J (2010) Children's participation in home, school and community life afteracquired brain injury. Aust Occup Ther J 57: 118–126. doi: 10.1111/j.1440-1630.2009.00822.x PMID:20854577
Independence-Frequency Gaps of Participation in Children of Disability
PLOS ONE | DOI:10.1371/journal.pone.0126693 May 11, 2015 17 / 19
25. Kang LJ, Palisano RJ, Orlin MN, Chiarello LA, King GA, Polansky M (2010) Determinants of social par-ticipation with friends and others who are not family members for youths with cerebral palsy. Phys Ther90: 1743–1757. doi: 10.2522/ptj.20100048 PMID: 20930051
26. Law M, Haight M, Milroy B, Willms D, Stewart D, Rosenbaum P (1999) Environmental factors affectingthe occupations of children with physical disabilities. J Occup Sci 6: 102–110.
27. Bedell G (2013) Community participation, supports, and barriers of school-age children with and withoutdisabilities. Arch Phys Med Rehabil 94: 315–323. doi: 10.1016/j.apmr.2012.09.024 PMID: 23044364
28. Coster W, LawM, Bedell G, Liljenquist K, Kao YC, Khetani M, et al. (2013) School participation, sup-ports and barriers of students with and without disabilities. Child Care Health Dev 39: 535–543. doi: 10.1111/cch.12046 PMID: 23763254
29. Hwang AW, Granlund M, Liao HF, Kang LJ (2013) Measures of “Participation” in school children withdisabilities. FJPT 38: 37–49.
30. Whiteneck G, Dijkers MP (2009) Difficult to measure constructs: Conceptual and methodological issuesconcerning participation and environmental factors. Arch Phys Med Rehabil 90: S22–35. doi: 10.1016/j.apmr.2009.06.009 PMID: 19892071
31. Holsbeeke L, Ketelaar M, Schoemaker MM, Gorter JW (2009) Capacity, capability, and performance:Different constructs or three of a kind? Arch Phys Med Rehabil 90: 849–855. doi: 10.1016/j.apmr.2008.11.015 PMID: 19406307
32. Morris C (2009) Measuring participation in childhood disability: How does the capability approach im-prove our understanding? Dev Med Child Neurol 51: 92–94. doi: 10.1111/j.1469-8749.2009.03461.xPMID: 19740215
33. Palisano RJ, Chiarello LA, Orlin M, Oeffinger D, Polansky M, Maggs J, et al. (2010) Determinants of in-tensity of participation in leisure and recreational activities by children with cerebral palsy. Dev MedChild Neurol 53: 142–149. doi: 10.1111/j.1469-8749.2010.03819.x PMID: 20964676
34. Palisano RJ, Orlin M, Chiarello LA, Oeffinger D, Polansky M, Maggs J, et al. (2011) Determinants of in-tensity of participation in leisure and recreational activities by youth with cerebral palsy. Arch Phys MedRehabil 92: 1468–1476. doi: 10.1016/j.apmr.2011.04.007 PMID: 21878219
35. Fauconnier J, Dickinson HO, Beckung E, Marcelli M, McManus V, Michelsen SI, et al. (2009) Participa-tion in life situations of 8–12 year old children with cerebral palsy: Cross sectional European study. BMJ(Online) 338: 1116–1121.
36. Tucker C, Escorpizo R, Cieza A, Lai J, Stucki G, Ustun TB, et al. (2014) Mapping the content of the Pa-tient-Reported Outcomes Measurement Information System (PROMIS) using the International Classifi-cation of Functioning, Health and Disability. Qual Life Res 2014 Apr 24. [Epub ahead of print].
37. Tucker CA, Cieza A, Riley AW, Stucki G, Lai JS, Bedirhan Ustun T, et al. (2014) Concept analysis ofthe Patient Reported Outcomes Measurement Information System (PROMIS) and the InternationalClassification of Functioning, Disability and Health (ICF). Qual Life Res 23: 1677–1686. doi: 10.1007/s11136-014-0622-y PMID: 24500657
38. Teng SW, Yen CF, Liao HF, Chang KH, Chi WC,Wang TH, et al. (2013) Evolution of system for disabili-ty assessment based on the International Classification of Functioning, Disability, and Health: A Tai-wanese study. J Formos Med Assoc 112: 691–698. doi: 10.1016/j.jfma.2013.09.007 PMID: 24099681
39. Ministry of Health andWelfare The classification, categories, grades of disability and standards in dis-ability evaluation system. Taiwan. Available: http://law.moj.gov.tw/Law/LawSearchResult.aspx?p=A&t=A1A2E1F1&k1=%E9%91%91%E5%AE%9A%E5%90%91%E5%BA%A6. Accessed 30 July2014.
40. Bedell G (2011) The Child and Family Follow-up Survey (CFFS)-Administration and Scoring Guidelines[Unpublished Manual].
41. Liao HF, Fan CJ, Liou TH, Yen CF, Wu TF, Chang BS, et al. (2013) Training programs for testers of theFunctioning Scale of the Disability Evaluation System in Taiwan and their outcomes. Formosan J Med17: 368–380.
42. Palisano RJ, Tieman BL, Walter SD, Bartlett DJ, Rosenbaum PL, Russell D, et al. (2003) Effect of envi-ronmental setting on mobility methods of children with cerebral palsy. Dev Med Child Neurol 45: 113–120. PMID: 12578237
43. Tieman B, Palisano RJ, Rosenbaum P (2003) The impact of environmental setting on the mobility ofchildren with crebral palsy: Research findings and clinical implications. CanChild Centre for ChildhoodDisability Research.
44. Imms C (2008) Children with cerebral palsy participate: A review of the literature. Disabil Rehabil 30:1867–1884. doi: 10.1080/09638280701673542 PMID: 19037780
Independence-Frequency Gaps of Participation in Children of Disability
PLOS ONE | DOI:10.1371/journal.pone.0126693 May 11, 2015 18 / 19
45. Law M, Petrenchik T, King G, Hurley P (2007) Perceived environmental barriers to recreational, com-munity, and school participation for children and youth with physical disabilities. Arch Phys Med Rehabil88: 1636–1642. PMID: 18047879
46. Almqvist L, Granlund M (2005) Participation in school environment of children and youth with disabili-ties: A person-oriented approach. Scand J Psychol 46: 305–314. PMID: 15842421
47. World Health Organization (2013) How to use the ICF: A practical manual for using the InternationalClassification of Functioning, Disability and Health (ICF). Geneva: WHO.
48. McDougall J, Bedell G, Wright V (2013) The youth report version of the Child and Adolescent Scale ofParticipation (CASP): Assessment of psychometric properties and comparison with parent report. ChildCare Health Dev 39: 512–522. doi: 10.1111/cch.12050 PMID: 23763252
49. Scorza P, Stevenson A, Canino G, Mushashi C, Kanyanganzi F, Munyanah M, et al. (2013) Validationof the "World Health Organization Disability Assessment Schedule for Children, WHODAS-Child" inRwanda. PLoS One 8: e57725. doi: 10.1371/journal.pone.0057725 PMID: 23505437
50. Morris C (2007) Measuring children’s participation. Dev Med Child Neurol 49: 645–645. PMID:17718817
Independence-Frequency Gaps of Participation in Children of Disability
PLOS ONE | DOI:10.1371/journal.pone.0126693 May 11, 2015 19 / 19