Parsing of algebraic expressions by experienced users of mathematics
37
This article was downloaded by: [Monash University Library] On: 26 February 2014, At: 18:11 Publisher: Routledge Informa Ltd Registered in England and Wales Registered Number: 1072954 Registered office: Mortimer House, 37-41 Mortimer Street, London W1T 3JH, UK European Journal of Cognitive Psychology Publication details, including instructions for authors and subscription information: http://www.tandfonline.com/loi/pecp20 Parsing of algebraic expressions by experienced users of mathematics Anthony R. Jansen a , Kim Marriott a & Greg W. Yelland b a School of Computer Science and Software Engineering , Monash University , Victoria, Australia b Department of Psychology , Monash University , Victoria, Australia Published online: 22 Jan 2007. To cite this article: Anthony R. Jansen , Kim Marriott & Greg W. Yelland (2007) Parsing of algebraic expressions by experienced users of mathematics, European Journal of Cognitive Psychology, 19:2, 286-320, DOI: 10.1080/09541440600709955 To link to this article: http://dx.doi.org/10.1080/09541440600709955 PLEASE SCROLL DOWN FOR ARTICLE Taylor & Francis makes every effort to ensure the accuracy of all the information (the “Content”) contained in the publications on our platform. However, Taylor & Francis, our agents, and our licensors make no representations or warranties whatsoever as to the accuracy, completeness, or suitability for any purpose of the Content. Any opinions and views expressed in this publication are the opinions and views of the authors, and are not the views of or endorsed by Taylor & Francis. The accuracy of the Content should not be relied upon and should be independently verified with primary sources of information. Taylor and Francis shall not be liable for any losses, actions, claims, proceedings, demands, costs, expenses, damages, and other liabilities whatsoever or howsoever caused arising directly or indirectly in connection with, in relation to or arising out of the use of the Content.
Transcript of Parsing of algebraic expressions by experienced users of mathematics
This article was downloaded by: [Monash University Library]On: 26 February 2014, At: 18:11Publisher: RoutledgeInforma Ltd Registered in England and Wales Registered Number: 1072954Registered office: Mortimer House, 37-41 Mortimer Street, London W1T 3JH,UK
European Journal of CognitivePsychologyPublication details, including instructions for authorsand subscription information:http://www.tandfonline.com/loi/pecp20
Parsing of algebraic expressionsby experienced users ofmathematicsAnthony R. Jansen a , Kim Marriott a & Greg W. Yellandb
a School of Computer Science and SoftwareEngineering , Monash University , Victoria, Australiab Department of Psychology , Monash University ,Victoria, AustraliaPublished online: 22 Jan 2007.
To cite this article: Anthony R. Jansen , Kim Marriott & Greg W. Yelland (2007) Parsingof algebraic expressions by experienced users of mathematics, European Journal ofCognitive Psychology, 19:2, 286-320, DOI: 10.1080/09541440600709955
To link to this article: http://dx.doi.org/10.1080/09541440600709955
PLEASE SCROLL DOWN FOR ARTICLE
Taylor & Francis makes every effort to ensure the accuracy of all theinformation (the “Content”) contained in the publications on our platform.However, Taylor & Francis, our agents, and our licensors make norepresentations or warranties whatsoever as to the accuracy, completeness, orsuitability for any purpose of the Content. Any opinions and views expressedin this publication are the opinions and views of the authors, and are not theviews of or endorsed by Taylor & Francis. The accuracy of the Content shouldnot be relied upon and should be independently verified with primary sourcesof information. Taylor and Francis shall not be liable for any losses, actions,claims, proceedings, demands, costs, expenses, damages, and other liabilitieswhatsoever or howsoever caused arising directly or indirectly in connectionwith, in relation to or arising out of the use of the Content.

This article may be used for research, teaching, and private study purposes.Any substantial or systematic reproduction, redistribution, reselling, loan, sub-licensing, systematic supply, or distribution in any form to anyone is expresslyforbidden. Terms & Conditions of access and use can be found at http://www.tandfonline.com/page/terms-and-conditions
Dow
nloa
ded
by [
Mon
ash
Uni
vers
ity L
ibra
ry]
at 1
8:11
26
Febr
uary
201
4

Parsing of algebraic expressions by experienced users
of mathematics
Anthony R. Jansen and Kim Marriott
School of Computer Science and Software Engineering, Monash University,
Victoria, Australia
Greg W. Yelland
Department of Psychology, Monash University, Victoria, Australia
The present study investigates how experienced users of mathematics parsealgebraic expressions. The main issues examined are the order in which the symbolsin an expression are scanned and the duration of fixation. Two experiments trackedthe order in which the symbols of an expression were scanned. The results wereanalysed using Markov Chain models of the scanpath data and provided strongsupport for the hypothesised scanning order: a left-to-right, top-to-bottom syntax-based scanning order. Length of fixation was also analysed in the first experiment.When reading text, readers pause significantly longer at the end of clauses andsentences. A similar pattern was found for mathematical expressions: Symbols atthe end of a phrasal constituent were fixated upon for significantly longer thansymbols at the start or middle of the phrasal constituent. These results suggest thatthe parsing of algebraic expressions has marked similarities with the way in whichsentences of natural language are processed and reinforces the importance of syntaxin their comprehension.
Mathematical notation and natural language share many common features.
Both have a well-defined syntax and semantics, and both make use of
recursive rules which allow an infinite number of lawful expressions to be
composed. However, an important difference is that the layout of
mathematical notation is two dimensional in nature, relying on both
horizontal and vertical adjacency relationships between the symbols to
provide the meaning. This two-dimensional aspect to their layout means that
Correspondence should be addressed to Kim Marriott, School of Computer Science and
Software Engineering, Monash University, VIC 3800, Australia.
E-mail: [email protected]. monash.edu.au
The authors wish to thank the tireless efforts of the participants, and also Claire Byrne for
helpful assistance with the use of data analysis software. Anthony Jansen’s research was supported
by an Australian Postgraduate Award scholarship.
EUROPEAN JOURNAL OF COGNITIVE PSYCHOLOGY
2007, 19 (2), 286�320
# 2006 Psychology Press, an imprint of the Taylor and Francis Group, an informa business
http://www.psypress.com/ecp DOI: 10.1080/09541440600709955
Dow
nloa
ded
by [
Mon
ash
Uni
vers
ity L
ibra
ry]
at 1
8:11
26
Febr
uary
201
4

mathematical notations are visual languages, relating them to other visual
notations such as chemical structural formulae.While much is known about how the one-dimensional notations of
written languages are processed, much less is known about how we
comprehend two-dimensional notations such as those of mathematics. In
this study, we are interested in the scanning processes used by experienced
users of mathematics when parsing mathematical expressions. (Experienced
users of mathematics refers to people who have not only studied mathe-
matics at a high level but who also use mathematical expressions frequently.)
In particular, we are interested in the order in which the symbols of anexpression are processed, the duration of fixation upon the symbols, and
how this compares to existing evidence on the processing of written text. We
restrict the scope of this study to algebraic expressions, since they are
routinely used in fields from engineering to economics, but still have a two
dimensional structure.
Research into how mathematical notations are processed has been
fragmentary. Kirshner (1989) examined the role of spatial information,
using tasks in which algebraic notation was replaced by two differentnotations, one of which maintained the spacing found in algebraic notation,
and one in which spacing was eliminated. Participants performed better
using the notation with spacing, suggesting that spatial information plays a
role in processing mathematical notations.
Ranney (1987) demonstrated that participants could more readily identify
the category of a symbol (whether it was a variable or a numeral), if that
symbol belonged to a string that formed a syntactically valid algebraic
expression, as opposed to a string that did not form a syntactically validalgebraic expression. More recently, Jansen, Marriott, and Yelland (2003)
have investigated the internal representations used by experienced users of
mathematics to encode algebraic expressions. A series of memory recognition
tasks were used to investigate the role of mathematical syntax and phrasal
structure in the encoding of algebraic expressions. They found that
participants could more readily identify those parts of a previously seen
expression that were syntactically well formed, than those that were not well
formed, suggesting that syntax plays an important role. Indeed, the findingsfurther indicated that algebraic expressions were encoded into components
that represent the phrasal constituents of the expression. Given these findings
that the encoding of algebraic expressions by experienced users of mathe-
matics appears to be guided primarily by syntax, this naturally raises the
question of how algebraic expressions are parsed; that is, how the syntactic
structure of an expression is obtained from its visual representation.
In contrast to our understanding of how mathematical notations are
processed, the comprehension of sentences of natural language is compara-tively well understood. In particular, the important role of syntax in relation
PARSING OF ALGEBRAIC EXPRESSIONS 287
Dow
nloa
ded
by [
Mon
ash
Uni
vers
ity L
ibra
ry]
at 1
8:11
26
Febr
uary
201
4
to natural language has been recognised for many decades now, and has led
to the use of transformational grammars to understand how humans parse
natural language sentences (for example, see Borsley, 1999; Frederici &
Meyer, 2004; Haskell & MacDonald, 2005). Such grammars use phrase
structure rules to reveal the structure of a sentence, enabling it to be broken
up into constituents such as noun and verb phrases.
A key difference between mathematical expressions and written forms of
natural language is that the latter are inherently sequential in nature,
reflecting their basis on spoken language where sounds are deployed in a
specific order over time. Not surprisingly then, written forms of natural
language are read in specific directions, with occasional backtracks to
regions of the text that have already been scanned (Rayner, 1998). This
contrasts with two-dimensional mathematical notation, for which there can
be multiple ways to sequence the elements in a given expression.
Thus, in order to understand how experienced users of mathematics parse
algebraic expressions, it is necessary to first identify the order in which the
symbols in an expression are processed. This can be done by determining the
order in which they are visually scanned. Also of interest is where people
pause when parsing an algebraic expression, and how much time is needed
for processing different types of ‘‘lexical’’ units.
Two experiments were performed to identify the order in which
experienced users of mathematics scan algebraic expressions. In both
experiments participants were required to read and memorise complete
algebraic expressions and then answer questions about those expressions.
The order in which a participant scanned the symbols of an expression was
tracked during the tasks and analysed using Markov Chain analysis. The
time spent focusing upon individual symbols was also measured and
analysed.
THE HYPOTHESISED SCANNING ORDER
In Jansen, Marriott, and Yelland (2003) it was seen that algebraic
expressions are encoded into phrasal constituents by experienced users of
mathematics. This indicates that the scanning order of an algebraic
expression is influenced by that expression’s syntactic structure. For example,
consider the simple algebraic expression, 3y2�/7x. The parse tree for this
expression is shown in Figure 1, with the phrasal constituents appearing in
the dashed boxes.
Algebraic expressions rarely contain redundant symbols (that is, symbols
that can be omitted from the expression without any loss of information).
Thus, when scanning an algebraic expression, each symbol needs to be
visited. There are 720 different possible symbol orders for processing the six
288 JANSEN, MARRIOTT, YELLAND
Dow
nloa
ded
by [
Mon
ash
Uni
vers
ity L
ibra
ry]
at 1
8:11
26
Febr
uary
201
4

symbols of the example expression (assuming there is no backtracking and
each symbol is visited exactly once).1
A reasonable assumption is that any scanning order which reflects
syntactic structure will involve the processing of all elements in each phrasal
constituent before moving on to a new constituent. Note that this does not
dictate the order in which elements within a particular constituent are
visited. We call such a scanning order syntax-based. For instance, consider
the expression in Figure 1. There are 48 valid syntax-based sequences for
processing the six symbols in this expression. Examples of these are:
1 In reality of course, backtracks will occur when an expression is read; however, we will ignore
this issue until empirical scanning models are developed in Experiment 1.
3 y 2 + 7 x
y2
3y2 7x
3y2 + 7x
Figure 1. Parse tree for the expression 3y2�/7x.
PARSING OF ALGEBRAIC EXPRESSIONS 289
Dow
nloa
ded
by [
Mon
ash
Uni
vers
ity L
ibra
ry]
at 1
8:11
26
Febr
uary
201
4
Note that the symbols that form a phrasal constituent of the expression must
form a subsequence of the overall syntax-based sequence (as indicated by the
grey boxes). For example, since 7x is a phrasal constituent, each syntax-
based sequence must contain either the subsequence 70/x or x0/7.
While syntax-based scanning greatly restricts the number of valid symbol
scanning sequences, it does not determine a unique scanning sequence. It is
reasonable to hypothesise that experienced users of mathematics scan the
symbols of an algebraic expression in a consistent manner. In particular, for
each type of phrasal constituent, we expect the symbols of that constituent
to be processed in a specific unique order.
Much of the work during the development of mathematical notations (and
particularly in Europe) was in Latin (Cajori, 1928). As a result, the layout of
algebraic notations is closely related to the layout of written Latin text. Also,
the experienced users of mathematics considered in this paper are proficient
users of English. Both Latin and English text are written and read in a left-to-
right, top-to-bottom direction. Thus, it is reasonable to hypothesise that the
syntactic elements of algebraic expressions are also primarily processed in a
left-to-right, top-to-bottom manner by experienced users of mathematics, at
least those who are also proficient readers of English.
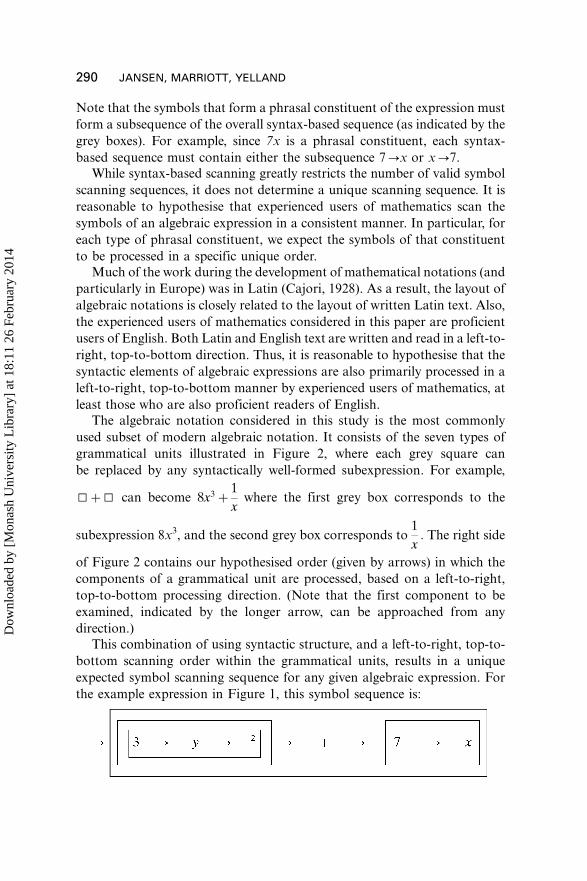
The algebraic notation considered in this study is the most commonly
used subset of modern algebraic notation. It consists of the seven types of
grammatical units illustrated in Figure 2, where each grey square can
be replaced by any syntactically well-formed subexpression. For example,
I�/I can become 8x3�1
xwhere the first grey box corresponds to the
subexpression 8x3, and the second grey box corresponds to1
x: The right side
of Figure 2 contains our hypothesised order (given by arrows) in which the
components of a grammatical unit are processed, based on a left-to-right,
top-to-bottom processing direction. (Note that the first component to be
examined, indicated by the longer arrow, can be approached from any
direction.)
This combination of using syntactic structure, and a left-to-right, top-to-
bottom scanning order within the grammatical units, results in a unique
expected symbol scanning sequence for any given algebraic expression. For
the example expression in Figure 1, this symbol sequence is:
290 JANSEN, MARRIOTT, YELLAND
Dow
nloa
ded
by [
Mon
ash
Uni
vers
ity L
ibra
ry]
at 1
8:11
26
Febr
uary
201
4

We call this unique ordering of the symbols in an algebraic expression the
syntax�lrtb ordering (where lrtb stands for left-to-right, top-to-bottom).
Our hypothesis is that experienced users of mathematics scan the symbols
of an algebraic expression in a syntax�lrtb ordering. We performed two
experiments to test this hypothesis. In both experiments participants were
required to read and memorise algebraic expressions. The order in which a
participant scanned the symbols of an expression was tracked during the
tasks and then analysed using Markov Chain analysis. For completeness, a
brief introduction to this technique is provided in the next section.
MARKOV CHAINS AND MODEL ANALYSIS
Scanpath data records the sequence in which the elements of a stimulus are
examined. A variety of techniques have been developed for the analysis of
scanpath data, involving methods ranging from comparisons using string
edit distance measures (Brandt & Stark, 1997), to the use of probabilistic
grammars (Salvucci, 1999). For the purposes of this study, however, Markov
Chain analysis is particularly well suited.
Markov Chains are used to compute the probability of a sequence of
transitions. In the context of this study, a transition is a shift in attention
Subtraction
Addition
Equals
Brackets
Fraction
Product
Exponent
)()(
Figure 2. Grammatical units for the algebraic notation considered in this paper, and the predicted
order in which the elements of the units are scanned.
PARSING OF ALGEBRAIC EXPRESSIONS 291
Dow
nloa
ded
by [
Mon
ash
Uni
vers
ity L
ibra
ry]
at 1
8:11
26
Febr
uary
201
4

from one symbol in an expression to another symbol. Markov Chains
belong to a more general class of methods known as Markov Models. Thesehave been widely used in fields ranging from Computer Science (for example,
Arnold & Guessarian, 1996; Rabiner, 1989) to Biology (for example, Baldi,
Chauvin, Hunkapiller, & McClure, 1994; Durbin, Eddy, Krogh, & Mitch-
ison, 1998). However, their use is not common in the analysis of scanpath
data. Notable exceptions include the work of Rosbergen, Wedel, and Pieters
(1997), Salvucci and Anderson (1998), and Stark and Ellis (1981). Of these,
the work of Rosbergen et al., which looks at how print advertisements are
viewed, is most similar to the approach used here.A Markov Chain can be based on either actual transition data, or on a
hypothesised scanning order model. For example, consider the following
hypothetical model: When an experienced user of mathematics is viewing a
particular symbol in an expression, they are twice as likely to shift their
attention to the symbol immediately to the right of the current symbol,
than to any other symbol. This would mean that, for the example expression
3x�/7, one would expect twice as many transitions from 3 to x than from 3
to �/ or from 3 to 7 (transitions from a symbol to itself are ignored). Table 1gives an example of a Markov Chain capturing this model (presented as a
matrix). Note that in the last row, each of the three possible transitions all
have equal probability as there are no symbols to the right of the 7. Also
note that for each row of the Markov Chain, the probabilities must sum to 1.
Given a Markov Chain model, M, it is possible to determine how
probable a given symbol sequence, S is. It is simply the product of the
probabilities of the transitions in S. For example, if S is the sequence
0 3 0x0 3 0x0�0 7
and M is the Markov Chain given in Table 1, the resulting probability
will be:
Pr(S½M)�0:5�0:25�0:5�0:5�0:5�0:015625
To determine the probability, Pr(DjM), of a particular set of observed
sequences, D, for a particular Markov Chain model of the hypothesised
scanning order, M, the probabilities calculated for the individual sequences(for a specific Markov Chain), are simply multiplied together to give the
overall probability. This probability, Pr(DjM), is referred to as the likelihood
of the model M, given the data D.
The Markov Chain model given in Table 1 encodes the hypothesis that
transitions are twice as likely to go to the symbol to the immediate right of a
given symbol, than to any other symbol. While it seems reasonable to
consider a model that favours a left-to-right scanning direction, choosing
transitions to the immediate right to be exactly twice as probable as others is
292 JANSEN, MARRIOTT, YELLAND
Dow
nloa
ded
by [
Mon
ash
Uni
vers
ity L
ibra
ry]
at 1
8:11
26
Febr
uary
201
4

clearly arbitrary. It may be more appropriate to make transitions to the
immediate right, say, three or four times as probable.
To get around this problem we use models that contain parameters. For
example, consider the Markov Chain given in Table 2. In this model, the
probability of a transition from a given symbol to the symbol on its
immediate right is not explicitly given. Instead, it is represented by a
parameter, a. Other possible transition probabilities (represented by dots)
are also not explicitly given, as their values will depend on the value of a.
Note that each row must sum to exactly 1.
Using a parameter, a, allows the model to be fine tuned by parameter
adjustment. In this study, the values for the parameters of a model will be
determined using the principle of maximum likelihood. This principle states
that the best model is the one which best predicts the observed data. In terms
of model parameters, this means that the best parameter settings are those
that maximise the likelihood value of the model.
It should be noted that, before parameter estimation is done, the available
data is split into two subsets: training and test data. Estimation of the
parameters of a model is conducted using only the training data, with the
parameters inferred from the training data then used with the test data to
examine how well that model performs with respect to other competing
models. This technique is known as cross-validation (Stone, 1974). Using
TABLE 2Markov Chain based on a left-to-right scanning model that uses parameters
To
From 3 x �/ 7
3 0 a �/ �/x �/ 0 a �/�/ �/ �/ 0 a
7 �/ �/ �/ 0
TABLE 1Markov Chain based on a scanning model favouring left-to-right transitions
To
From 3 x �/ 7
3 0.00 0.50 0.25 0.25
x 0.25 0.00 0.50 0.25
�/ 0.25 0.25 0.00 0.50
7 0.33 0.33 0.33 0.00
PARSING OF ALGEBRAIC EXPRESSIONS 293
Dow
nloa
ded
by [
Mon
ash
Uni
vers
ity L
ibra
ry]
at 1
8:11
26
Febr
uary
201
4

separate sets of data for parameter estimation and the assessment of model
performance prevents the accuracy of a model from being overestimated.Through the use of Markov Chains it is possible to develop various
scanning models, and to determine how well they predict transition data.
However, in comparing competing models, it is not sufficient only to look at
model performance. Consideration must also be given to the principle of
parsimony, which states that, given two models that both perform equally well,
the model that provides the simplest explanation of the data should be chosen.
While these two factors, model performance and model complexity, provide
a logical criterion for model selection, balancing them is a difficult task. Forexample, should a complex model with good predictive performance be
preferred over a simpler model that gives only reasonable performance?
Many different methods of model selection have been developed, some of
which are specific to certain model types or problems domains, while others
are more generally applicable (for an overview of model selection criteria, see
Ghosh & Samanta, 2001). This study will make use of two of the most well-
known and commonly used statistical rules for model selection: Akaike’s
Information Criterion (AIC; Akaike, 1973), and Schwarz’s BayesianInformation Criterion (BIC; Schwarz, 1978). These methods provide a score
for each model, indicating how suitable the model is given the sample data.
When calculating a score for a given model, both of these methods
consider model performance (in the form of the natural logarithm of that
model’s likelihood2), and both have a penalty for model complexity. It is in
the penalty component that the two methods differ. AIC only considers the
number of free parameters (degrees of freedom) of a model when
determining the penalty for model complexity. BIC however, considersboth the number of free parameters of a model, and the number of
observations that make up the data. If a specific model, Mi, has pi free
parameters, and the data, D, is composed of n observations, then the scores
for the two methods are calculated as follows.
AIC��2 log Pr(D j Mi)�2pi
BIC��2 log Pr(D j Mi)�pi log n
For both of these methods, the lower the score the better the model for a
given data sample. Also, for either criterion, two models can be compared bycalculating the score difference between the models. This reveals not only
which model is more appropriate (the model with the lowest score), but the
difference also indicates how much better suited a model is than the
competing model. A model is considered to be statistically significantly
2 Logarithms are used to make the data analysis more tractable.
294 JANSEN, MARRIOTT, YELLAND
Dow
nloa
ded
by [
Mon
ash
Uni
vers
ity L
ibra
ry]
at 1
8:11
26
Febr
uary
201
4

better than a competing model if the score difference is greater than 2
(Sakamoto, Ishiguro, & Kitagawa, 1986).
In general, for large samples, BIC will select for simpler models, with AIC
being biased towards more complex models because it does not take into
account the number of observations in the data (Ghosh & Samanta, 2001).
In order to ensure robust results, both AIC and BIC will be used in this
paper in the comparison of models. A model will only be considered superior
to a competing model if both methods indicate that it is significantly better.
COLLECTING SCANPATH DATA
Markov Chain analysis requires scanpath data that allows reliable identifica-
tion of the order in which individual symbols are examined. The most
common approach to collecting scanpath data is to use eye-tracking
equipment. However, for the purpose of identifying fixations in algebraic
expressions standard eye-tracking equipment has the disadvantage that,
because the symbols are relatively small and close together, it is often difficult
to identify exactly which symbol in the algebraic expression is being examined.
This difficulty is compounded by the fact that most eye-tracking equipment
suffers from gradual loss of calibration. Thus we have chosen to use another
tool called the Restricted Focus Viewer (Blackwell, Jansen, & Marriott, 2000;
Jansen, Blackwell, & Marriott, 2003) to collect the scanpath data.
The Restricted Focus Viewer (RFV) is a computer-based tool that takes an
image of a stimulus, blurs it, and display it on a computer monitor, allowing
the participant to see only a small region of the image in focus at any time.
The region in focus can be moved using the computer mouse. To ensure that
the border of the focus region does not contrast too sharply with the blurred
image, the focus region consists of a small inner focus box (in which the
stimulus is in full focus), and around this is an outer transition region in
which the stimulus is only mildly blurred. The RFV also has a motion blur
feature, meaning that full focus of the focus region is only achieved when the
mouse is stationary or moving very slowly. When the mouse is moved quickly,
only the outer transition region is seen. The RFV records what the participant
is focusing on at any point in time, allowing it to collect scanpath data in a
form similar to that obtained by eye-tracking equipment.
For the purpose of this study, the main advantage of the RFV over eye-
tracking equipment is that it is more accurate at tracking which symbols in
an algebraic expression are being fixated upon since the focus box can be
made just large enough to contain a single symbol. Furthermore, by its very
nature it cannot lose calibration since no calibration is required.Of course one concern is whether the RFV effects the high-level strategy
used by participants. We note that this issue is not just confined to the
PARSING OF ALGEBRAIC EXPRESSIONS 295
Dow
nloa
ded
by [
Mon
ash
Uni
vers
ity L
ibra
ry]
at 1
8:11
26
Febr
uary
201
4

RFV: Repeated calibrations and headgear may influence the strategies used
by participants when eye-tracking data is used to collect scanpath data.Experimental data from Jansen, Blackwell, and Marriott (2003) suggests
that the RFV does not effect high-level focus of attention strategies, at least
for participants who are comfortable with using a mouse. We also note that
restricting the visual field in order to better identify regions of focus is not
new. Research on reading the number of characters that can be processed in
one fixation has been examined by using visual restrictions (Osaka & Oda,
1994; Rayner & Pollatsek, 1989), image blurring has been used to under-
stand how people view software manuals (Ummelen, 1997), artificialscotomas have been used to disrupt visual processing (Henderson, McClure,
Pierce, & Schrock, 1997), and a movable window has been used to examine
visual search (Stark et al., 1992).
EXPERIMENT 1
The main aim of this experiment is to use the RFV to track the order in
which the symbols of an algebraic expression are scanned by experienced
users of mathematics, and to use this data to assess various scanning models,
using the Markov Chain techniques described in the previous section. Other
aspects of the parsing of algebraic expressions are also of interest. Thus, data
about how long symbols are fixated on, and what factors influence fixationdurations, is also collected.
Method
Participants. The participants used in both experiments discussed in thispaper were either students (graduate or undergraduate) or staff members
from the School of Computer Science and Software Engineering at Monash
University. All were competent mathematicians for whom mathematics
formed a substantial component of their undergraduate training, and they
all frequently worked with algebra. All were extremely competent with using
a computer mouse. All participants were volunteers who were native
speakers and readers of English, aged between 18 and 35 years, with normal
or corrected-to-normal vision. Twenty-four participants successfully com-pleted this experiment. Data from one additional participant was excluded
due to an excessive error rate.
Materials and design. Forty algebraic expressions were constructed, all
consisting of exactly 11 characters. The expressions were divided into eight
groups, each containing five expressions. Although each of the expressions
within a group was unique, they all shared a similar form. Table 3 details the
form of the expressions in each group, as well as giving an example
296 JANSEN, MARRIOTT, YELLAND
Dow
nloa
ded
by [
Mon
ash
Uni
vers
ity L
ibra
ry]
at 1
8:11
26
Febr
uary
201
4

expression. The letter v indicates where a variable (x, y, or z) can be used,
the letter d indicates where a digit (1 to 9; zero not included) can be used, and
the letter o indicates a plus or minus operator (�/ or �/).
The expressions were presented one at a time for participants to read,
using the RFV tool. To determine whether the expressions were accurately
processed by the participants, a statement that could be either true or false
was designed for each expression. Half of the expressions had
true statements, with false statements being developed for the other half.
The statements varied in how difficult it was to judge their correctness. Some
were simple, requiring the participant only to determine if a particular
symbol was present in the expression. Others were more difficult, requiring
the expression to be used in a calculation. Thus, only accurate comprehen-
sion of the expression could guarantee good performance in the task. Table 4
gives examples of statements created and their corresponding expressions.
To avoid biasing the results by always starting with the mouse cursor at
the same initial position, two versions of the experiment were developed. In
the first version, the initial mouse cursor position was on the left side of the
screen, and in the second version the mouse cursor was initially positioned
on the right side of the screen. The expression always appeared in the centre
of the screen. All 40 expressions were presented for each version of the
experiment. Five additional expressions and statements were constructed as
practice items. Half the participants did the first version of the experiment,
TABLE 3The expression form used for each group in Experiment 1, along with example
expressions where v indicates a variable, o an operator, and d a digit
Group Expression form Example expression
1/
(vd o d)v o d
d/
(x2 � 1)y�7
4
2 /
d
(vd o d)v o d /
4
(y2 � 9)x�8
3 /v odv o d
d o vd/x�
4y � 1
9 � x2
4 /
dv o d
d o vdo v /
4x � 8
1 � z2�x
5 /d(vd o dv)do d /7(x4�2z)2�3
6 /d o d(vd o dv)d/9�5(z2�8y)3
7 /vd o v o dvd o dv /x7�y�5y8�4z
8 /(v o d)d(v o d) /(y�7)3(y�3)
PARSING OF ALGEBRAIC EXPRESSIONS 297
Dow
nloa
ded
by [
Mon
ash
Uni
vers
ity L
ibra
ry]
at 1
8:11
26
Febr
uary
201
4

and half did the second version, with the expressions in each version being
presented in a different pseudo-random order for each participant.
Procedure. Participants were initially presented with written and verbal
instructions, which gave examples of the sort of expressions and statements
involved in the experiment. Items were displayed in black on a white
background on a 20-inch monitor at a resolution of 1024�/768, controlled
by an IBM compatible computer running Version 2.1 of the RFV program.3
Participants were seated comfortably at a viewing distance from the monitor
of approximately 50 cm. The average width of the algebraic expressions in
pixels was 138 (range 111�167) with an average height of 41 (range 22�58).
The RFV inner focus box had an edge length of 16 pixels, while the
outermost transition region had an edge length of 30 pixels. This allowed
one symbol to be viewed in full focus at a time, as can be seen in the
examples in Figure 3. The onset of motion blur occurred at a mouse speed of
150 pixels per second, requiring the mouse to be stopped or moving very
slowly in order for full focus to be maintained.
The only interface mechanism used by the participants was a standard
computer mouse. Progress was self-paced, with each trial initiated by a single
click with the mouse on a button which contained the prompt ‘‘Click the
button to continue’’. The button was located either at the far left or far right
of the screen, depending on the version of the experiment. This action
started the timer (to provide a reference time for the rest of that trial), and a
blurred image of the expression appeared in the centre of the screen. The
participant could move the window of focus over different symbols in the
expression by moving the mouse, allowing the expression to be read. They
were initially given five practice items to allow them to become familiar with
the RFV program, followed by the 40 experimental items.
3 This version of the RFV program can be found at http://www.csse.monash.edu.au/projects/
RFV/ along with the user’s manual and tutorial (Jansen, 2001).
TABLE 4Examples of the expressions and corresponding statements used in Experiment 1,
and whether those statements were correct
Expression Statement Correct
/
(x2 � 1)y�7
4
There were exactly two different variables in the expression True
/y�8x � 3
1 � y3The expression contained the sub-expression 8�/y3 False
/(y�1)2(z�6) The expression expands to (y�1)(y�1)(z�6) True
298 JANSEN, MARRIOTT, YELLAND
Dow
nloa
ded
by [
Mon
ash
Uni
vers
ity L
ibra
ry]
at 1
8:11
26
Febr
uary
201
4

Once the participants had read an expression, they single clicked the
mouse button. This stopped the timer and made the (blurred) expression
disappear, replaced by the statement about the expression (which was not
blurred). The participants were required to determine if the statement was
true or false with respect to the expression that immediately preceded it.
Beneath the statement were two buttons, a green one labelled ‘‘TRUE’’ and a
red one labelled ‘‘FALSE’’. When the participant had decided on the validity
of the statement, they single clicked on the appropriate button. The program
recorded the response given, and the participant was then given feedback. If
the response was correct, then the word ‘‘Correct’’ appeared on the screen,
along with the statement response time. Otherwise, the word ‘‘Incorrect’’
appeared on the screen by itself.Participants were instructed to try and read the algebraic expressions as
quickly as possible, while still ensuring that they did not to make too many
errors when determining the validity of the statements. The experiment took
approximately 15 minutes to complete.
Data treatment. The purpose of the statements was to force the
participants to carefully read the expressions. Therefore the time taken to
determine if a statement was correct is not analysed. Rather, the data of
interest is the RFV data that reveals how the expressions were scanned. Data
from participants with an overall error rate of more than 30% were excluded
from the final analysis. One participant failed to correctly judge more than
70% of the statements, and thus was excluded from further analysis.
The RFV data was converted into fixation protocols for each trial.
Rectangular bounding boxes were used to enclose each symbol, with each
fixation representing the duration of time that the centre of the focus
window was inside the bounding box of a symbol, with the window in full
focus (that is, without motion blur). If the same symbol was fixated on twice
in succession, the two fixations were collapsed into a single fixation whose
duration was the sum of the two original fixation times. The transition data
was then obtained from the fixation sequences.
Results and discussion
Figure 4 gives an example of a typical scanpath and its associated fixation
protocol taken from the RFV data. Each fixation in the protocols is
Figure 3. Examples of the focus window over two different regions of the expression shown on the
left.
PARSING OF ALGEBRAIC EXPRESSIONS 299
Dow
nloa
ded
by [
Mon
ash
Uni
vers
ity L
ibra
ry]
at 1
8:11
26
Febr
uary
201
4
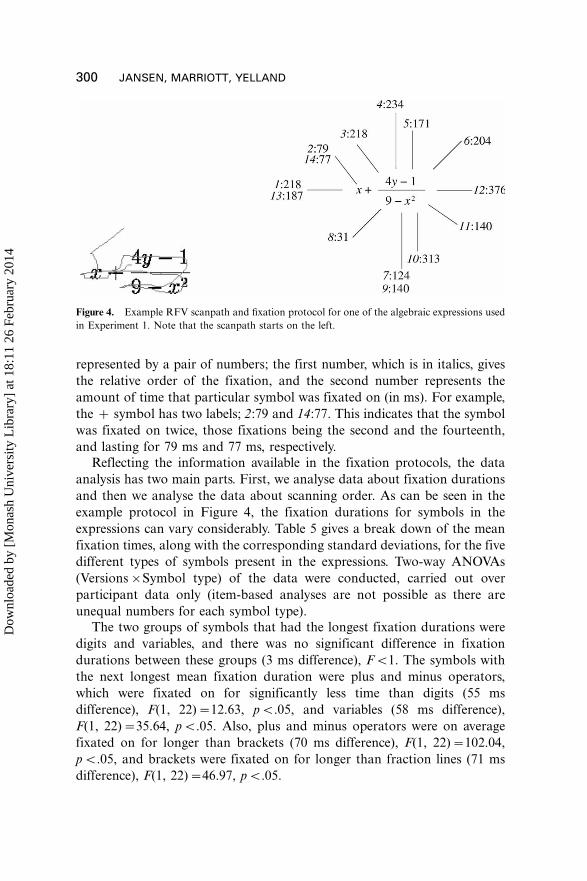
represented by a pair of numbers; the first number, which is in italics, gives
the relative order of the fixation, and the second number represents the
amount of time that particular symbol was fixated on (in ms). For example,
the �/ symbol has two labels; 2:79 and 14:77. This indicates that the symbol
was fixated on twice, those fixations being the second and the fourteenth,
and lasting for 79 ms and 77 ms, respectively.
Reflecting the information available in the fixation protocols, the data
analysis has two main parts. First, we analyse data about fixation durations
and then we analyse the data about scanning order. As can be seen in the
example protocol in Figure 4, the fixation durations for symbols in the
expressions can vary considerably. Table 5 gives a break down of the mean
fixation times, along with the corresponding standard deviations, for the five
different types of symbols present in the expressions. Two-way ANOVAs
(Versions�/Symbol type) of the data were conducted, carried out over
participant data only (item-based analyses are not possible as there are
unequal numbers for each symbol type).
The two groups of symbols that had the longest fixation durations were
digits and variables, and there was no significant difference in fixation
durations between these groups (3 ms difference), FB/1. The symbols with
the next longest mean fixation duration were plus and minus operators,
which were fixated on for significantly less time than digits (55 ms
difference), F(1, 22)�/12.63, pB/.05, and variables (58 ms difference),
F(1, 22)�/35.64, pB/.05. Also, plus and minus operators were on average
fixated on for longer than brackets (70 ms difference), F(1, 22)�/102.04,
pB/.05, and brackets were fixated on for longer than fraction lines (71 ms
difference), F(1, 22)�/46.97, pB/.05.
Figure 4. Example RFV scanpath and fixation protocol for one of the algebraic expressions used
in Experiment 1. Note that the scanpath starts on the left.
300 JANSEN, MARRIOTT, YELLAND
Dow
nloa
ded
by [
Mon
ash
Uni
vers
ity L
ibra
ry]
at 1
8:11
26
Febr
uary
201
4

These results can be partially explained by considering the different roles
played by the different types of symbol used in algebraic expressions.
Brackets, for example, are used to explicitly specify the order of precedence
in which certain operations must take place. Thus, brackets primarily play a
syntactic role, and, as they do not represent either a value or an operation,
they convey less information than symbols that do represent values and
operations. Thus, it seems reasonable that brackets would need to be fixated
on for less time. In contrast, the longest mean fixation durations occur for
digits and variables, both of which represent values (either known or
unknown) in algebraic expressions. This result has similarities with how
natural language text is read, where content words such as nouns and verbs
are typically fixated on for longer than function words such as articles and
prepositions (Just & Carpenter, 1987).
The second explanation for the different fixation durations may reflect a
key difference between algebraic notation and natural language text, namely
that the former is a visual language with a two-dimensional structure. As a
result, spatial layout adds an extra cue that can be used to identify an
operator before the symbol for that operator has been explicitly fixated upon.
This may explain why fraction lines require such short fixations. Being the
only operations in the expressions used in this experiment whose components
are arranged with a vertical layout, the presence of a fraction in an expression
is usually easy to detect. Visual cues can also assist in the recognition of plus
and minus symbols, which have more space surrounding them than other
horizontally adjacent symbols, making them visually more distinct (as can be
seen for example, with the plus symbol in the expression 9x�/2y4). Thus,
spatial cues appear to assist the processing of algebraic expressions.
It has been shown that the chunking of sentences of natural language is
guided by syntax, with individual chunks conforming to grammatically
defined units (Johnson, 1968, 1970). Associated with this form of chunking
is the observation that, when reading a passage of text, readers pause
significantly longer at the end of clauses and sentences (Just & Carpenter,
1980; Mitchell & Green, 1978). The purpose of this longer fixation is to
TABLE 5Mean symbol fixation times (ms) and standard deviation (in parentheses) as a
function of symbol type for Experiment 1
Symbol type Examples Fixation time (ms)
Brackets (,) 160 (36)
Digits 1,2,3, . . . 9 285 (108)
Variables x , y, z 288 (82)
Fraction lines ** 89 (37)
Plus and minus �/, �/ 230 (57)
PARSING OF ALGEBRAIC EXPRESSIONS 301
Dow
nloa
ded
by [
Mon
ash
Uni
vers
ity L
ibra
ry]
at 1
8:11
26
Febr
uary
201
4

allow the components of a grammatically defined unit to be encoded
together as a chunk in working memory. Jansen, Marriott, and Yelland(2003) suggested that experienced users of mathematics also encode
algebraic expressions into chunks that conform to grammatically defined
units. Given the similarities between the encoding of sentences of natural
language and mathematical expressions, it is reasonable to consider that
experienced users of mathematics might also pause longer at the last symbol
in each ‘‘phrasal subexpression’’ where a phrasal subexpression is under-
stood to be any syntactic subexpression in the parse tree containing more
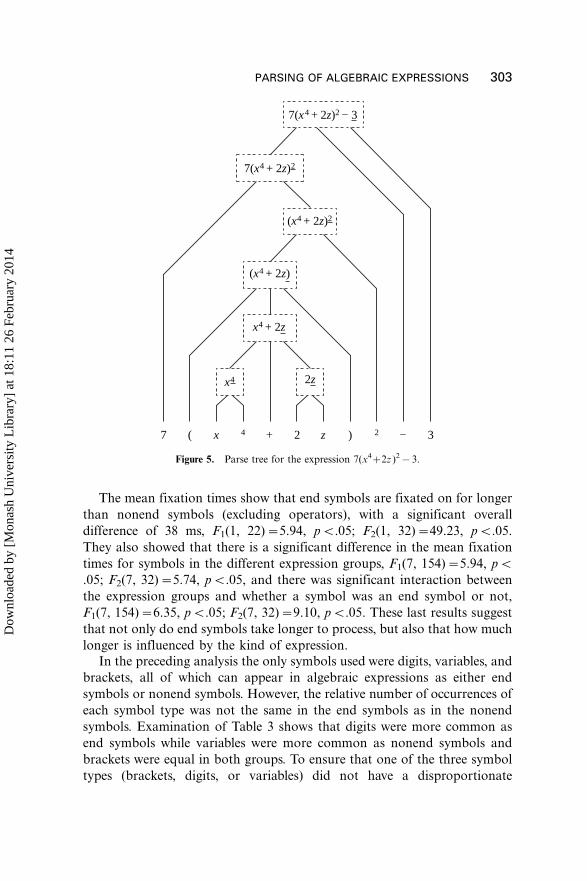
than one symbol.To determine if this is true, the symbols in the expressions used in this
experiment were divided into two categories; those that represented the last
symbol of a phrasal subexpression, and those symbols that did not. For
example, consider the following expression, which was used in the experi-
ment.
7(x4�2z)2�3
In this example, the five underlined symbols are the last symbol of a phrasalsubexpression, while the remaining symbols are not (based on a syntax�lrtb
ordering of the symbols). The role of these symbols in the syntactic structure
of the expression can be more clearly seen by examining the expression’s
parse tree, shown in Figure 5. The underlined symbols each correspond to
the last symbol in a phrasal sub-expression of the parse tree (shown in the
dashed boxes). Note that it is possible for a symbol (such as the z symbol in
the example) to be the last symbol of more than one phrasal subexpression.
The hypothesis is that the last symbol in each phrasal subexpression willbe fixated on for longer than other symbols. One possible cause for concern
is that it was seen in Table 5 that operators are fixated on for significantly
less time than symbols such as digits and variables. This is important,
because the operators that are used in this experiment never appear as the
last symbol in a phrasal subexpression. To avoid biasing the outcome, we
therefore do not include duration times for operators in the analysis, so
nonend symbols are restricted to only include those symbol types that could
also act as end symbols.Table 6 gives the mean fixation times, along with the standard deviations
(in parentheses), for both symbols that are the last element of a phrasal
subexpression (end symbols), and for all those that are not (nonend
symbols) restricted to only include those symbol types that could also act
as end symbols (that is, excluding operators), for each of the eight groups of
expressions. Three-way ANOVAs (Versions�/Expression group�/Symbol
type) of the data were conducted, carried out separately over participant and
item data.
302 JANSEN, MARRIOTT, YELLAND
Dow
nloa
ded
by [
Mon
ash
Uni
vers
ity L
ibra
ry]
at 1
8:11
26
Febr
uary
201
4
The mean fixation times show that end symbols are fixated on for longer
than nonend symbols (excluding operators), with a significant overall
difference of 38 ms, F1(1, 22)�/5.94, pB/.05; F2(1, 32)�/49.23, pB/.05.
They also showed that there is a significant difference in the mean fixation
times for symbols in the different expression groups, F1(7, 154)�/5.94, pB/
.05; F2(7, 32)�/5.74, pB/.05, and there was significant interaction between
the expression groups and whether a symbol was an end symbol or not,
F1(7, 154)�/6.35, pB/.05; F2(7, 32)�/9.10, pB/.05. These last results suggest
that not only do end symbols take longer to process, but also that how much
longer is influenced by the kind of expression.
In the preceding analysis the only symbols used were digits, variables, and
brackets, all of which can appear in algebraic expressions as either end
symbols or nonend symbols. However, the relative number of occurrences of
each symbol type was not the same in the end symbols as in the nonend
symbols. Examination of Table 3 shows that digits were more common as
end symbols while variables were more common as nonend symbols and
brackets were equal in both groups. To ensure that one of the three symbol
types (brackets, digits, or variables) did not have a disproportionate
7 ( x 4 + 2 z ) 2 − 3
7(x4 + 2z)2
7(x4 + 2z)2 − 3
(x4 + 2z)2
(x4 + 2z)
x4 + 2z
x4 2z
Figure 5. Parse tree for the expression 7(x4�/2z )2�/ 3.
PARSING OF ALGEBRAIC EXPRESSIONS 303
Dow
nloa
ded
by [
Mon
ash
Uni
vers
ity L
ibra
ry]
at 1
8:11
26
Febr
uary
201
4

influence on the outcome of the preceding analysis, we conducted individual
analyses for each of them. As not all of the expression groups contained
both end and nonend examples of these symbols, only two-way ANOVAs
were performed (Versions�/End/nonend symbol), and carried out over
participant data only. The results indicated that on average, end brackets
were fixated on for significantly longer than nonend brackets (24 ms
difference), F(1, 22)�/9.11, pB/.05, end digits were fixated on for signifi-
cantly longer than nonend digits (45 ms difference), F(1, 22)�/6.49, pB/.05,
and end variables were fixated on for significantly longer than non end
variables (46 ms difference), F(1, 22)�/5.19, pB/.05. Thus, these results
indicate that, as with the parsing of natural language text, the parsing of
algebraic expressions is indeed influenced by syntactic boundaries, with
experienced users of mathematics pausing at the last symbol of each phrasal
subexpression (according to a syntax�lrtb ordering) in order to integrate the
preceding symbols into a phrasal unit.
In the second part of our data analysis for Experiment 1 we consider the
scanning order. An important question to ask is: Where in an expression
does the scanning begin? Based on the hypothesis, one would expect
scanning to begin at the first symbol of an expression, as determined by
the syntax�lrtb order. For the expressions used in this experiment, this is the
leftmost symbol, or if the expression begins with a fraction, the leftmost
symbol in the numerator of that fraction. Thus, the next part of the data
analysis examines if the symbols initially fixated on by the participants are
the expected ones.
Since each expression is blurred when presented by the RFV, participants
often need one or two navigational fixations to correctly establish the
TABLE 6Mean fixation times (ms) and standard deviation (in parentheses) for symbols thatare the last element of a phrasal subexpression (end symbols) and the nonoperator
symbols that are not (nonend symbols, excluding operators), as a function ofexpression group for Experiment 1
Fixation time (ms)
Expression
group
End
symbols
Nonend symbols
(excluding operators)
1 247 (97) 223 (70)
2 241 (110) 259 (79)
3 273 (119) 257 (66)
4 301 (128) 243 (60)
5 315 (156) 224 (57)
6 284 (110) 257 (83)
7 318 (155) 260 (65)
8 264 (125) 210 (88)
304 JANSEN, MARRIOTT, YELLAND
Dow
nloa
ded
by [
Mon
ash
Uni
vers
ity L
ibra
ry]
at 1
8:11
26
Febr
uary
201
4

bounds of the expression. Allowance is made for this by considering the first
three fixations, rather than just the first fixation. Table 7 shows the
proportion of trials for which the initial symbol of an expression (as
determined by the syntax�lrtb order) is one of the first three symbols fixated
on, for each expression group. Overall, the initial symbol is one of the first
three fixations in 0.86 of the trials, suggesting that experienced users of
mathematics generally begin at the initial symbol of an expression (as
determined by the syntax�lrtb order). However, for two of the expression
groups (1 and 8), the proportion is much lower than for the others.
The initial symbol in expression groups 1 and 8 are open brackets,
whereas the initial symbol for the other expression groups are digits or
variables. A comparison of the data using a two-way ANOVA (Version�/
Initial symbol type) over both participant and item data, shows that when
the initial symbol is a bracket, then it is one of the first three fixations in a
significantly lower proportion of trials than if the initial symbol is another
symbol type (a 0.24 difference), F1(1, 22)�/43.23, pB/.05; F2(1, 8)�/104.73,
pB/.05. However, if for expression groups 1 and 8 the initial bracket is
ignored, and the initial symbol is instead defined as being the symbol to the
immediate right of the initial bracket, then the proportion of trials for which
the initial symbol was one of the first three symbol fixations becomes 0.97
and 0.99 for expression groups 1 and 8 respectively. This difference indicates
that experienced users of mathematics tend to initially fixate on the first
symbol in an algebraic expression that conveys semantic information (as
determined by the syntax�lrtb order). It appears that brackets, playing
primarily a syntactic role, are often not explicitly fixated.
Given the new definition of an initial symbol (being the first symbol that
conveys semantic information, as determined by the syntax�lrtb order), a
further comparison of the data was conducted using a two-way ANOVA
(Versions�/Expression group). The analysis showed that the experiment
version (that is, whether the mouse cursor was originally placed to the left or
to the right of the expression), did not significantly influence the proportion
of trials for which the initial symbol was one of the first three symbols
fixated (a .01 difference), F1B/1; F2B/1. This result suggests that experienced
users of mathematics scan in a manner that is independent of the side of the
expression to which their visual attention is initially directed.
TABLE 7The proportion of trials for which the initial symbol (as determined by the syntacticstructure) was one of the first three symbol fixations, as a function of expression
group for Experiment 1
Expression group 1 2 3 4 5 6 7 8
Proportion of trials where the initial
symbol is one of the first three fixations
0.62 0.85 0.93 0.89 0.96 0.94 0.97 0.75
PARSING OF ALGEBRAIC EXPRESSIONS 305
Dow
nloa
ded
by [
Mon
ash
Uni
vers
ity L
ibra
ry]
at 1
8:11
26
Febr
uary
201
4

However, the proportion of trials for which the initial symbol was one of
the first three symbols fixated was influenced by the different expressiongroups, F1(7, 154)�/3.97, pB/.05; F2(7, 56)�/5.32, pB/.05. A further break-
down of these results indicated that the initial symbol is one of the first three
fixations in a significantly lower proportion of trials if the expression begins
with a fraction (groups 1, 2, and 4), than if it does not (a .06 difference),
F1(1, 22)�/9.73, pB/.05; F2(1, 8)�/12.74, pB/.05. Thus, while experienced
users of mathematics tend to initially fixate on the first symbol in an
algebraic expression that conveys semantic information (as determined by
the syntax�lrtb order), certain features, such as fractions, also have someinfluence on how an expression is scanned.
Understanding which symbol experienced users of mathematics prefer to
start at when scanning an algebraic expression, although important, is only
the first step in understanding how such expressions are scanned. The
primary aim of this experiment is to develop a Markov Chain model of the
scanning order.
To begin with, a naive scanning model is considered which is simply based
on the distance between symbols. It is reasonable to consider that transitionsbetween neighbouring symbols are more likely to occur than transitions
between more distant symbols. This idea can be represented using a Markov
Chain model, by defining the probability of each transition as being
inversely proportional to the Euclidean distance4 between the symbols.
This model is denoted by MID (where ID stands for inverse distance). For
this analysis, the distance between any two symbols is defined as the distance
between the centre of the bounding boxes of the two symbols, and is
measured in pixels. The only exception to this distance measure is in the caseof fraction lines. Since fraction lines can be quite wide, the distance between
a fraction line and a symbol in either the denominator or numerator of that
fraction is simply the vertical distance from the centre of that symbol to the
fraction line. Consider the following expression which was used in this
experiment.
4
(y2 � 9)x�8
For the version of this expression viewed by the participants, the distance
between the symbol 4 and the fraction line was 19 pixels, the distance
between the 4 and the �/ symbol was 38 pixels, while the distance between
the 4 and the y was 57 pixels. Thus, according to the Inverse Distance Model,
a transition from the 4 to the fraction line would be twice as likely as a
4 If one symbol is located at (x1, y1) and another is located at (x2, y2), then the Euclidean
distance between them is
ffiffiffiffiffiffiffiffiffiffiffiffiffiffiffiffiffiffiffiffiffiffiffiffiffiffiffiffiffiffiffiffiffiffiffiffiffiffiffiffiffiffiffi(x1�x2)
2�(y1�y2)2
q.
306 JANSEN, MARRIOTT, YELLAND
Dow
nloa
ded
by [
Mon
ash
Uni
vers
ity L
ibra
ry]
at 1
8:11
26
Febr
uary
201
4

transition from the 4 to the �/ symbol, and three times as likely as a
transition from the 4 to the y. Note that as the distance between symbols forany expression is fixed, this model contains no parameters.
In this analysis, the Inverse Distance Model represents a null hypothesis
against which other models can be compared. The other models of interest
are syntax-based models in which the probabilities of the transitions from
one symbol to another reflect a syntax�lrtb ordering. If the syntax-based
models perform significantly better at predicting the transition data than the
Inverse Distance Model, this would provide support for the hypothesis that
experienced users of mathematics scan the elements of algebraic expressionsusing a syntax�lrtb order.
The syntax-based models all contain parameters. In the data analysis the
transition data was split into two subsets: training and test data. The
training data consists of the transition data for 12 of the participants, which
contains 7433 transitions, and is used for parameter estimation for the
scanning models that contain parameters. The test data consists of the
transition data for the remaining 12 participants, which contains 7861
transitions, and is used for assessing the performance of the models beingconsidered.
The syntax-based models are built around the following parameters.
First, the probability of a transition from one symbol to the next in a
syntax�lrtb order is given by the parameter a. An example of such a
transition, for the simple expression 8x2�/5, is from the symbol �/ to the 5.
Second, as well as moving forward to the next symbol in the syntax�lrtb
order, the transition data also suggests that participants often backtracked,
and that when they did so they most frequently went back by only onesymbol in the order (such as a transition from the symbol x to the 8 in the
above example). The probability for such a transition is given by the
parameter b in the syntax-based models. Furthermore, the transition data
indicates that when scanning in a forward direction, frequently a symbol was
skipped over (such as a jump from the symbol 2 to the 5). These transition
probabilities are given by the parameter g. Table 8 gives an example of which
transitions these three parameters apply to in a Markov Chain for the
example expression 8x2�/5.While the transition data suggests that these three parameters, a, b, and g,
model important aspects about how experienced users of mathematics scan
algebraic expressions, it is not clear whether the best scanning model should
include all or only some of these parameters. Including more parameters
would most likely improve the predictive performance of a model, but at the
cost of adding to that model’s complexity. Thus, four syntax-based models
were initially created. All of the models incorporated the a parameter,
since the transition data indicates that most of the scanning was done in asyntax�lrtb order. They varied however, in which of the other two
PARSING OF ALGEBRAIC EXPRESSIONS 307
Dow
nloa
ded
by [
Mon
ash
Uni
vers
ity L
ibra
ry]
at 1
8:11
26
Febr
uary
201
4

parameters they included. Syntax Model I incorporated the a parameter
only. As backtracking was the next most common feature of the transition
data, Syntax Model II had both the a and b parameters. Syntax Model III
had only the parameters a and g, while Syntax Model IV had all three
parameters, a, b, and g.
The RFV fixation protocols indicate that there was occasionally some
random scanning of the expressions. This is not unexpected, with possible
causes including navigation difficulties (due to inexperience with the RFV
perhaps), or simply indecision by the participant. When such scanning
occurred, the resulting transitions were biased in favour of transitions to
neighbouring symbols rather than to more distant symbols (an observation
that formed the basis of the Inverse Distance Model). Thus, for each syntax-
based model, the probabilities of the transitions that are not represented by a
parameter will be weighted according the inverse distance between the
symbols, such that transitions between spatially close symbols will be more
probable than transitions between more distant symbols (as was the case for
the Inverse Distance Model). For example, consider the last row of the
Markov Chain for the expression 8x2�/5, shown in Table 8. The last row
represents transitions from the symbol 5. The probability of the transition
from the 5 to the �/ symbol will be set to the value of b; based on the relative
distances between the symbols, the transition from the 5 to the 2 will be more
probable than the transition from the 5 to the x, which in turn will be more
probable than the transition from the 5 to the 8 (since the symbol 2 is closer
to the 5 than the symbol x, which in turn is closer than the symbol 8). If the
b parameter is set to 0.4, then the other three possible transitions must have
probabilities that sum to 0.6 (since all the probabilities in a Markov Chain
row must sum to exactly 1).For Syntax Models I, II, III, and IV, the optimal parameter settings
inferred using the training data, Dtraining, are shown in Table 9.
It can be seen from these parameter values that the a parameter is far
more important than the others, as it represents transitions that are far more
TABLE 8Markov Chain for the example expression 8x2�/5, showing the role of the three
parameters, a, b, and g, in the syntax-based models
To
From 8 x 2 �/ 5
8 0 a g �/ �/x b 0 a g �/2 �/ b 0 a g�/ �/ �/ b 0 a5 �/ �/ �/ b 0
308 JANSEN, MARRIOTT, YELLAND
Dow
nloa
ded
by [
Mon
ash
Uni
vers
ity L
ibra
ry]
at 1
8:11
26
Febr
uary
201
4
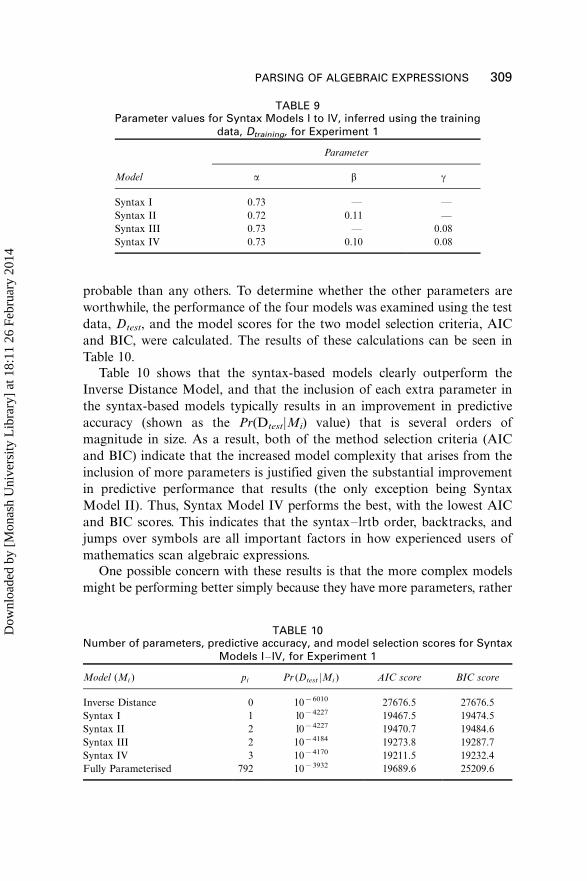
probable than any others. To determine whether the other parameters are
worthwhile, the performance of the four models was examined using the test
data, Dtest, and the model scores for the two model selection criteria, AIC
and BIC, were calculated. The results of these calculations can be seen in
Table 10.
Table 10 shows that the syntax-based models clearly outperform the
Inverse Distance Model, and that the inclusion of each extra parameter in
the syntax-based models typically results in an improvement in predictive
accuracy (shown as the Pr(DtestjMi) value) that is several orders of
magnitude in size. As a result, both of the method selection criteria (AIC
and BIC) indicate that the increased model complexity that arises from the
inclusion of more parameters is justified given the substantial improvement
in predictive performance that results (the only exception being Syntax
Model II). Thus, Syntax Model IV performs the best, with the lowest AIC
and BIC scores. This indicates that the syntax�lrtb order, backtracks, and
jumps over symbols are all important factors in how experienced users of
mathematics scan algebraic expressions.
One possible concern with these results is that the more complex models
might be performing better simply because they have more parameters, rather
TABLE 9Parameter values for Syntax Models I to IV, inferred using the training
data, Dtraining, for Experiment 1
Parameter
Model a b g
Syntax I 0.73 * *Syntax II 0.72 0.11 *Syntax III 0.73 * 0.08
Syntax IV 0.73 0.10 0.08
TABLE 10Number of parameters, predictive accuracy, and model selection scores for Syntax
Models I�IV, for Experiment 1
Model (Mi ) pi Pr (Dtest jMi ) AIC score BIC score
Inverse Distance 0 10�6010 27676.5 27676.5
Syntax I 1 l0�4227 19467.5 19474.5
Syntax II 2 l0�4227 19470.7 19484.6
Syntax III 2 10�4184 19273.8 19287.7
Syntax IV 3 10�4170 19211.5 19232.4
Fully Parameterised 792 10�3932 19689.6 25209.6
PARSING OF ALGEBRAIC EXPRESSIONS 309
Dow
nloa
ded
by [
Mon
ash
Uni
vers
ity L
ibra
ry]
at 1
8:11
26
Febr
uary
201
4

than because they better model the processes used by experienced users of
mathematics to parse algebraic expressions. Thus, it is instructive to considerhow a fully parameterised model performs; that is, a model that has the
maximum possible number of parameters. In such a model, nearly every single
transition in the Markov Chain has its own parameter to specify its
probability. (Note that there cannot be a parameter for every transition*the probabilities in each row of a Markov Chain must sum to exactly one,
meaning that one of the transitions in each row must have a probability that is
dependent on the values given for all the other transition probabilities in
that row.)The fully parameterised model (denoted by MFP, where FP stands for
fully parameterised) determines the probability of a transition from symbol a
to symbol b as the proportion of times that transitions from symbol a (in the
training data) ended up going to symbol b. The only modification to this
calculation was made for possible transitions that did not actually occur in
the training data. Rather than giving these transitions a probability of zero
(which essentially declares that they are impossible for the given model),
these transitions were given the small probability of .01 as they might occurin the test data. If a transition matrix row in the training data did contain
zeros, the values of the other probabilities were adjusted accordingly (so that
the probabilities in each row still summed to exactly one).
The performance of the fully parameterised model can be seen in that last
row of Table 10. The model has 792 parameters (8 expression types, each
with 11 symbols, each with 9 degrees of freedom for transition probabilities).
As was expected with such a large number of parameters, the likelihood of
the model is superior to that of any of the other models considered(Pr(DtestjMFP)�/10�3932). However, all of the syntax-based models out-
performed the fully parameterised model when compared using the AIC and
BIC model selection criteria. This indicates that the predictive performance
of the fully parameterised model does not make up for its high cost in terms
of model complexity, and thus it represents an inferior explanation of the
data when compared to the syntax-based models. As a result, we can be
more confident that the syntax-based models are performing well because
they actually reflect the way in which experienced users of mathematics scanalgebraic expressions, with the best model examined thus far being Syntax
Model IV, which is based on a syntax�lrtb order, backtracks, and forward
jumps over symbols.
Continuing our exploration of syntax-based parsing models, further
observation of the transition data suggested that the forward jumps over
symbols (represented previously by the parameter g) did not occur
uniformly. Specifically, the symbols that were more likely to be skipped
over appeared to be exponents, operators, and brackets. Thus, furthermodels were developed in which the g parameter was abandoned, and
310 JANSEN, MARRIOTT, YELLAND
Dow
nloa
ded
by [
Mon
ash
Uni
vers
ity L
ibra
ry]
at 1
8:11
26
Febr
uary
201
4

instead two new parameters were included: d to represent skips over brackets
and operators (plus and minus symbols as well as fraction lines), and o to
represent skips over exponents. Skips over other symbols were ignored, while
the parameters a and b were retained. Table 11 gives an example of which
transitions these new parameters apply to in a Markov Chain for the
expression 9(y3�/1).
While the transition data suggests that the two new parameters, d and o, are
important, it is not clear if the best scanning model should include both or
only one of them. Thus, three new models were created. Syntax Model V
contained the parameter d, Syntax Model VI contained the parameter o, while
Syntax Model VII incorporated both d and o. All three models included the
parameters a and b. The optimal parameter settings inferred for Syntax
Models V, VI, and VII, using the training data, Dtraining, are shown in Table 12.
The performance of the three models, using the test data, Dtest, and scores
for the AIC and BIC model selection methods are given in Table 13. Both
Syntax Model V and Syntax Model VII outperformed Syntax Model IV.
Syntax Model VII clearly represents the best scanning model of all the
models considered in this experiment, with the lowest AIC score and also the
lowest BIC score.
For the skips over exponent symbols (represented in Syntax Model VII by
the parameter o), it is likely that the cause is in part due to the smaller size of
these symbols. The size of the RFV focus window is designed to comfortably
fit standard sized symbols. This means it is possible for exponent symbols to
be at least partially viewed in the focus window, and thus identified, without
the centre of the focus window being over the symbol. Thus, it is likely that
skips over exponent symbols do not actually reflect the way in which
experienced users of mathematics scan algebraic expressions, but rather
reflect limitations of the RFV.
TABLE 11Markov Chain for the example expression 9(y3�/1), showing the role of the four
parameters, a, b, d, and o, in the syntax-based models
To
From 9 ( y 3 �/ 1 )
9 0 a d �/ �/ �/( b 0 a �/ �/ �/ �/y �/ b 0 a o �/ �/3 �/ �/ b 0 a d �/�/ �/ �/ �/ b 0 a �/1 �/ �/ �/ �/ b 0 a) �/ �/ �/ �/ �/ b 0
PARSING OF ALGEBRAIC EXPRESSIONS 311
Dow
nloa
ded
by [
Mon
ash
Uni
vers
ity L
ibra
ry]
at 1
8:11
26
Febr
uary
201
4

For brackets and operators however, this is not the reason since these are
standard sized symbols. As discussed previously, skips over operators are
most likely due to the fact that there are strong visual cues that hint at
the identity of the symbol, meaning that an explicit fixation may often not
be necessary. And in the case of brackets, because they only convey syntactic
information about precedence, rather than true semantic information,
as long as a reader is aware of them, they need not be explicitly fixated
upon.
Data analysis of the scanning order therefore provides provide strong
support for the hypothesis that experienced users of mathematics use a
syntax�lrtb scanning order when comprehending algebraic expressions.
However, there is another plausible nonsyntax-based scanning model that is
consistent with the data. As we have previously noted mathematical notation
has a bias towards left-to-right, top-to-bottom layout. One side effect of this
fact is that, for many algebraic expressions, a syntax�lrtb scanning order is
similar or even identical to a simple left-to-right (and where appropriate, top-
to-bottom) scanning order. Indeed, examination of Table 3 shows that,
depending exactly upon how left-to-right is defined, this was the case for the
expressions used in Experiment 1. As a result, it is not clear if syntactic
structure actually was an important factor in the scanning order used by the
participants in Experiment 1, or if instead a simple nonsyntax based left-to-
right, top-to-bottom scanning order was being used. We therefore conducted
a second experiment to clarify this issue.
TABLE 13Number of parameters, predictive accuracy, and model selection scores for Syntax
Models V�VII, for Experiment 1
Model (Mi ) pi Pr(Dtest jMi) AIC score BIC score
Syntax V 3 10�4170 19207.6 19228.5
Syntax VI 3 10�4213 19409.5 19430.4
Syntax VII 4 10�41S6 19146.4 19174.3
TABLE 12Parameter values for Syntax Models V�VII, inferred using the training data, Dtraining,
for Experiment 1
Parameter
Model a b d o
Syntax V 0.72 0.11 0.08 *Syntax VI 0.72 0.11 * 0.09
Syntax VII 0.72 0.11 0.08 0.09
312 JANSEN, MARRIOTT, YELLAND
Dow
nloa
ded
by [
Mon
ash
Uni
vers
ity L
ibra
ry]
at 1
8:11
26
Febr
uary
201
4

EXPERIMENT 2
To compare the two possible scanning models, a task similar to the one used
in Experiment 1 was constructed for Experiment 2. The main difference isthat the expressions of interest were designed such that the syntax�lrtb
ordering of the symbols is different from a purely left-to-right, top-to-
bottom ordering of the symbols (from here on referred to as an lrtb
ordering). These expressions contain two or three fractions, separated only
by minus operations. Since the minus symbols between fractions are level
with the fraction lines, all the symbols in the numerators of the fractions
form an uninterrupted horizontal sequence, as do all the symbols in the
denominators of the fractions. In between these two sequences is a row ofhorizontal lines consisting of fractions lines and minus symbols, which acts
as a strong visual boundary. Thus, if the scanning of algebraic expressions
was biased towards an lrtb�symbol order, then it would be expected that all
of the numerator symbols would be processed first, followed by the row of
horizontal lines (made up of fraction lines and minus symbols), and finally
all of the denominator symbols. For example, consider the following
expression.
x2 � 1
7�
4
3y
The syntax�lrtb ordering of the symbols in this expression is as follows.
0x020�0 1 0*0 7 0�0 4 0*0 3 0y
In contrast, the lrtb ordering of the symbols is the following.
0x020�0 1 0 4 0*0�0*0 7 0 3 0y
Again, the Restricted Focus Viewer (RFV) is used to track the order in
which the symbols of each expression are scanned, and Markov Chains are
used to compare the competing scanning models. The aim is to determine if
the best performing model in Experiment 2 (Syntax Model VII) is indeed a
syntax-based model, or instead is based purely on a left-to-right (and top-to-
bottom) scanning model. Based on the hypothesis, the syntax-based model is
expected to perform significantly better.
Method
Participants. Twelve participants successfully completed this experi-
ment. No data from any participant was excluded as none had an overall
error rate of more than 30%.
Materials and design. Eighteen algebraic expressions were constructed
for this experiment. Six of the expressions were designed such that the
PARSING OF ALGEBRAIC EXPRESSIONS 313
Dow
nloa
ded
by [
Mon
ash
Uni
vers
ity L
ibra
ry]
at 1
8:11
26
Febr
uary
201
4
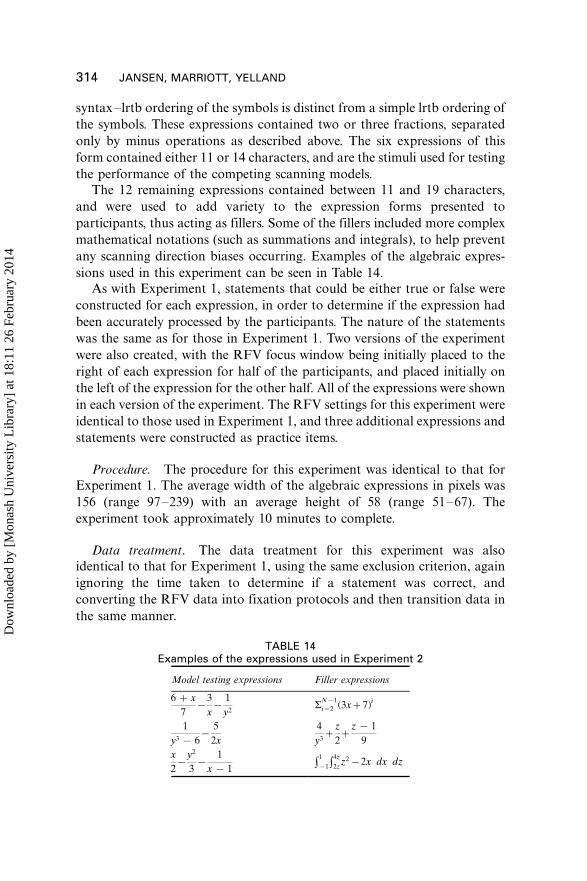
syntax�lrtb ordering of the symbols is distinct from a simple lrtb ordering of
the symbols. These expressions contained two or three fractions, separated
only by minus operations as described above. The six expressions of this
form contained either 11 or 14 characters, and are the stimuli used for testing
the performance of the competing scanning models.
The 12 remaining expressions contained between 11 and 19 characters,
and were used to add variety to the expression forms presented to
participants, thus acting as fillers. Some of the fillers included more complex
mathematical notations (such as summations and integrals), to help prevent
any scanning direction biases occurring. Examples of the algebraic expres-
sions used in this experiment can be seen in Table 14.As with Experiment 1, statements that could be either true or false were
constructed for each expression, in order to determine if the expression had
been accurately processed by the participants. The nature of the statements
was the same as for those in Experiment 1. Two versions of the experiment
were also created, with the RFV focus window being initially placed to the
right of each expression for half of the participants, and placed initially on
the left of the expression for the other half. All of the expressions were shown
in each version of the experiment. The RFV settings for this experiment were
identical to those used in Experiment 1, and three additional expressions and
statements were constructed as practice items.
Procedure. The procedure for this experiment was identical to that for
Experiment 1. The average width of the algebraic expressions in pixels was
156 (range 97�239) with an average height of 58 (range 51�67). The
experiment took approximately 10 minutes to complete.
Data treatment. The data treatment for this experiment was also
identical to that for Experiment 1, using the same exclusion criterion, again
ignoring the time taken to determine if a statement was correct, and
converting the RFV data into fixation protocols and then transition data in
the same manner.
TABLE 14Examples of the expressions used in Experiment 2
Model testing expressions Filler expressions
/
6 � x
7�
3
x�
1
y2/a
N�1
i�2 (3x�7)i
/
1
y3 � 6�
5
2x/
4
y3�
z
2�
z � 1
9
/
x
2�
y2
3�
1
x � 1/f
1
�1f
4z
2zz2�2x dx dz
314 JANSEN, MARRIOTT, YELLAND
Dow
nloa
ded
by [
Mon
ash
Uni
vers
ity L
ibra
ry]
at 1
8:11
26
Febr
uary
201
4

Results and discussion
The aim of this experiment is to determine if the best performing model in
Experiment 1 is indeed a syntax-based model, or instead is based on a left-to-
right (and top-to-bottom) scanning model. In Experiment 1, the best
performing model was Syntax Model VII, which is based on a syntax�lrtb
ordering of the symbols in each expression, and has four parameters, a, b, d,
and o. The a parameter represented transitions to the next symbol in the
specified order, with the b parameter representing transitions to the previous
symbol in the specified order. The d parameter represented transitions that
skipped forward over brackets or operators, while the o parameter represented
forward skips over exponents. All transitions not represented by a parameter
are weighted according to the inverse of the distance between the symbols.
Syntax Model VII is one of the two models that will be used to examine
the transition data from this experiment. The other model will be referred to
as Left-to-Right Model VII. This model uses the same four parameters as
Syntax Model VII, as well as weighting other transitions according to the
inverse distance between symbols. However, it is based around an lrtb
ordering of the symbols in each expression, rather than a syntax�lrtb
ordering. Note that in Experiment 1, since there was no difference between
the syntax�lrtb ordering and the lrtb ordering of the symbols in the
expressions, all of the syntax-based models in effect also represented a
left-to-right based scanning model. Thus, for the expressions used in
Experiment 1, there would have been no difference between Left-to-Right
Model VII and Syntax Model VII.
The RFV fixation protocols for the 12 participants over the six
model testing expressions, provide a total of 1276 transitions. As with
Experiment 1, the data was split into two subsets: training and test data. The
training data consists of the transition data for six of the participants, which
contains 581 transitions, and is used for parameter estimation for the
scanning models. The test data consists of the transition data for the
remaining six participants, which contains 695 transitions, and is used for
assessing the performance of the models being considered.
For Syntax Model VII and Left-to-Right Model VII, the optimal
parameter settings inferred using the training data, Dtraining, are shown in
Table 15. The parameter settings for Syntax Model VII from Experiment 1
are also included for comparison.
From the parameter settings, it can be seen that Syntax Model VII is
far more consistent with the settings of the corresponding model in
Experiment 1, than is Left-to-Right Model VII. Some differences between
the settings for the two experiments were expected, due to differences
between the expressions used in this experiment and those used in
Experiment 1.
PARSING OF ALGEBRAIC EXPRESSIONS 315
Dow
nloa
ded
by [
Mon
ash
Uni
vers
ity L
ibra
ry]
at 1
8:11
26
Febr
uary
201
4

The performance of the two models was examined using the test data,
Dtest, and the model scores for the two model selection criterion, AIC and
BIC, were calculated. Also, to serve as a naive comparison, the performance
of the Inverse Distance Model (which was described in Experiment 1) was
also examined using the test data from this experiment. The results of these
analyses can be seen in Table 16.
Table 16 shows that Syntax Model VII clearly outperforms both the
Inverse Distance Model and Left-to-Right Model VII, with a predictive
performance that is over 100 orders of magnitude better than the other two
models, and the lowest AIC and BIC scores. Surprisingly, the performance
of Left-to-Right Model VII is significantly worse than that of the Inverse
Distance Model. This provides strong support for the hypothesis that the
scanning order used by experienced users of mathematics is based on syntax.
SUMMARY
The findings of Jansen, Marriott, and Yelland (2003) indicate that the
encoding of algebraic expressions by experienced users of mathematics
strongly relies on a knowledge of mathematical syntax. Thus, we hypothe-
sised that the symbols of an algebraic expression are scanned in a syntax�lrtb order (as determined by the expression’s syntactic structure). Two
TABLE 15Parameter values for the Experiment 2 models, inferred using the training data,
Dtraining, along with the values inferred for the corresponding model in Experiment 1
Parameter
Model a b d o
Experiment 2
Syntax VII 0.63 0.10 0.13 0.15
Left-to-Right VII 0.23 0.08 0.01 0.11
Experiment 1
Syntax VII 0.72 0.11 0.08 0.09
TABLE 16Number of parameters, predictive accuracy, and model selection scores as a
function of model type for Experiment 2
Model (Mi ) pi Pr (Dtest jMi ) AIC score BIC score
Inverse Distance 0 10�587 2703.3 2703.3
Syntax VII 4 10�468 2164.2 2182.3
Left-to-Right VII 4 10�618 2855.8 2874.0
316 JANSEN, MARRIOTT, YELLAND
Dow
nloa
ded
by [
Mon
ash
Uni
vers
ity L
ibra
ry]
at 1
8:11
26
Febr
uary
201
4

experiments were performed to evaluate this hypothesis. In both experiments
participants were shown algebraic expressions and asked to memorise them.The order in which symbols in the expressions were scanned was recorded
using the Restricted Focus Viewer (RFV). Using Markov Chain models to
analyse the order in which the symbols of an expression were fixated, the
data was found to support the hypothesis.
For the data from Experiment 1 the length of time that symbols in the
algebraic expressions were fixated upon was analysed. This revealed marked
similarities between the way in which experienced users of mathematics
parse algebraic expressions, and the way in which sentences of naturallanguage are processed. When processing a sentence, content words are
typically fixated on more often and for longer than function words (Just &
Carpenter, 1987). Similarly the analysis indicated that algebraic symbols that
convey semantic information are fixated on more often and for longer than
symbols that play a more functional role. Also, it has been shown that when
reading natural language text, people pause for longer at the ends of
sentences and clauses, indicating that the scanning of words is being
influenced by the syntactic structure of the sentence (Just & Carpenter,1980; Mitchell & Green, 1978). Data analysis indicates that longer pauses at
the end of phrasal constituents occurs for algebraic expressions too.
Although some similarities were expected between the processing of
natural language and the processing of algebraic notations, the two-
dimensional structure of algebraic expressions suggested that there might
also be substantial differences. However, the results of the experiments in
this study reveal considerable similarity between the processing of sentences
of natural language, and the parsing of algebraic expressions by experiencedusers of mathematics.
The results of the experiments have also indicated possible directions for
further research into how algebraic expressions are parsed. For example, the
participants in this study were all native speakers and readers of English,
which is read in a left-to-right direction. This may have influenced their
using a syntax�lrtb scanning order when parsing algebraic expressions. It
would be interesting to investigate whether native speakers and readers of
languages that are read in other directions also scan algebraic expressionsusing a syntax�lrtb order.
Also, while the focus of this study has been limited to the most commonly
used subset of algebraic notation, some of the filler expressions used in
Experiment 2 did contain examples of notations that represent more
complex mathematical concepts (specifically, summations and definite
integrals). Although these expressions were not the focus of data analysis
in this study, they do represent areas in which the research described in this
study could be extended. As an example, Figure 6 gives RFV scanpaths fromtwo participants over an expression that contains a double summation.
PARSING OF ALGEBRAIC EXPRESSIONS 317
Dow
nloa
ded
by [
Mon
ash
Uni
vers
ity L
ibra
ry]
at 1
8:11
26
Febr
uary
201
4

Interestingly, the scanpaths for these more complex mathematical
expressions show considerable variation among different individuals,
especially when compared with the simpler algebraic expressions that havebeen the focus of this study. It is possible that this is in part due to a greater
variance in the amount of experience that the different participants had with
the notations used in these expressions but the scanpaths also suggest that
certain participants were flexible in the way that they process such
expressions. For example, the scanpath on the left of Figure 6 shows that
the participant scanned the first summation from top to bottom, before
moving to the second summation, which was then scanned in a bottom to
top direction. Another common feature of the scanpaths is that manyregions are fixated on multiple times. Thus, this leaves plenty of scope for
further research into understanding how more complex mathematical
notations are processed and understood by experienced users of mathe-
matics.
Original manuscript received August 2004
Revised manuscript received March 2006
First published online 5 July 2006
REFERENCES
Akaike, H. (1973). Information theory and an extension of the maximum likelihood principle. In B.
N. Petrov & F. Czaki (Eds.), Proceedings of the second international symposium on information
theory (pp. 267�281). Budapest, Hungary: Akademiai Kiado.
Arnold, A., & Guessarian, I. (1996). Mathematics for computer science. New York: Prentice Hall.
Baldi, P., Chauvin, Y., Hunkapiller, T., & McClure, M. A. (1994). Hidden Markov models of
biological primary sequence information. Proceedings of the National Academy of Sciences,
USA, 91, 1059�1063.
Blackwell, A. F., Jansen, A. R., & Marriott, K. (2000). Restricted Focus Viewer: A tool for tracking
visual attention. In M. Anderson, P. Cheng, & V. Haarslev (Eds.), Theory and application of
diagrams: Lecture notes in artificial intelligence (LNAI) 1889 (pp. 162�177). Berlin: Springer-
Verlag.
Borsley, R. (1999). Syntactic theory: A unified approach (2nd ed.). New York: Arnold.
Brandt, S. A., & Stark, L. W. (1997). Spontaneous eye movements during visual imagery reflect the
content of the visual scene. Journal of Cognitive Neuroscience, 9(1), 27�38.
Cajori, F. (1928). A history of mathematical notations (Vols. 1 and 2). Chicago: Open Court
Publishing Company.
Figure 6. Example RFV scanpaths from two participants over an expression with a double
summation used in Experiment 2. Note scanpath starts on the left.
318 JANSEN, MARRIOTT, YELLAND
Dow
nloa
ded
by [
Mon
ash
Uni
vers
ity L
ibra
ry]
at 1
8:11
26
Febr
uary
201
4

Durbin, R., Eddy, S. R., Krogh, A., & Mitchison, G. (1998). Biological sequence analysis:
Probabilisitic models of proteins and nucleic acids. Cambridge: Cambridge University Press.
Frederici, A., & Meyer, M. (2004). The brain knows the difference: Two types of grammatical
violations. Brain Research, 1000, 72�77.
Ghosh, J. K., & Samanta, T. (2001). Model selection*an overview. Current Science, 80(9), 1135�1144.
Haskell, T., & MacDonald, M. (2005). Constituent structure and linear order in language
production: Evidence from subject-verb agreement. Journal of Experimental Psychology:
Learning, Memory, and Cognition, 31(5), 891�904.
Henderson, J. M., McClure, K. K., Pierce, S., & Schrock, G. (1997). Object identification without
foveal vision: Evidence from an artificial scotoma paradigm. Perception and Psychophysics,
59(3), 323�346.
Jansen, A. R. (2001). Restricted Focus Viewer (RFV) Version 2.1 User’s manual and tutorial (Tech.
Rep. No. 2001/87). School of Computer Science and Software Engineering, Monash University,
Victoria, Australia.
Jansen, A. R., Blackwell, A. F., & Marriott, K. (2003). A tool for tracking visual attention: The
Restricted Focus Viewer. Behavior Research Methods, Instruments, and Computers, 35(1), 57�69.
Jansen, A. R., Marriott, K., & Yelland, G. W. (2003). Comprehension of algebraic expressions by
experienced users of mathematics. Quarterly Journal of Experimental Psychology, 56A(1), 3�30.
Johnson, N. F. (1968). The influence of grammatical units on learning. Journal of Verbal Learning
and Verbal Behaviour, 7, 236�240.
Johnson, N. F. (1970). Chunking and organization in the process of recall. In G. H. Bower (Ed.),
The psychology of learning and motivation (Vol. 4, pp. 171�247). New York: Academic Press.
Just, M. A., & Carpenter, P. A. (1980). A theory of reading: From eye fixations to comprehension.
Psychological Review, 87, 329�354.
Just, M. A., & Carpenter, P. A. (1987). The psychology of reading and language comprehension.
Boston, MA: Allyn & Bacon.
Kirshner, D. (1989). The visual syntax of algebra. Journal for Research in Mathematics Education,
20(3), 274�287.
Mitchell, D. C., & Green, D. W. (1978). The effects of context and content on immediate processing
in reading. Quarterly Journal of Experimental Psychology, 30, 609�636.
Osaka, N., & Oda, K. (1994). Moving window generator for reading experiments. Behavior
Research Methods, Instruments, and Computers, 26(1), 49�53.
Rabiner, L. R. (1989). A tutorial on hidden Markov models and selected applications in speech
recognition. Proceedings of the IEEE, 77(2), 257�285.
Ranney, M. (1987). The role of structural context in perception: Syntax in the recognition of
algebraic expressions. Memory and Cognition, 15(1), 29�41.
Rayner, K. (1998). Eye movements in reading and information processing: 20 years of research.
Psychological Bulletin, 124(3), 372�422.
Rayner, K., & Pollatsek, A. (1989). The psychology of reading. Englewood Cliffs, NJ: Prentice Hall.
Rosbergen, E., Wedel, M., & Pieters, R. (1997). Analyzing visual attention to repeated print
advertising using scanpath theory (Tech. Rep. No. 97B32). Research Institute SOM (Systems,
Organizations and Management), University of Groningen, The Netherlands.
Sakamoto, Y., Ishiguro, M., & Kitagawa, G. (1986). Akaike information criterion statistics. Tokyo,
Japan: KTK Scientific Publishers.
Salvucci, D. D. (1999). Inferring intent in eye-movement interfaces: Tracing user actions with
process models. In Human factors in computing systems: CHI ’99 conference proceedings (pp.
254�261). New York: ACM Press.
PARSING OF ALGEBRAIC EXPRESSIONS 319
Dow
nloa
ded
by [
Mon
ash
Uni
vers
ity L
ibra
ry]
at 1
8:11
26
Febr
uary
201
4

Salvucci, D. D., & Anderson, J. R. (1998). Tracing eye movement protocols with cognitive process
models. In M. Gernsbacher & S. Derry (Eds.), Proceedings of the twentieth annual conference of
the Cognitive Science Society (pp. 923�928). Hillsdale, NJ: Lawrence Erlbaum Associates, Inc.
Schwarz, G. (1978). Estimating the dimension of a model. The Annals of Statistics, 6(2), 461�464.
Stark, L., & Ellis, S. R. (1981). Scanpaths revisited: Cognitive models direct active looking. In D. F.
Fisher, R. A. Monty, & J. W. Senders (Eds.), Eye movements: Cognition and visual perception
(pp. 193�226). Hillsdale, NJ: Lawrence Erlbaum Associates, Inc.
Stark, L. W., Ezumi, K., Nguyen, T., Paul, R., Tharp, G., & Yamashita, H. I. (1992). Visual search
in virtual environments. In B. E. Rogowitz (Ed.), Proceedings of the SPIE: Human Vision,
Visual Processing, and Digital Display III, 1666 (pp. 577�589). Bellingham, WA: SPIE.
Stone, M. (1974). Cross-validatory choice and assessment of statistical predictions. Journal of the
Royal Statistical Society, Series B (Methodological), 36(2), 111�147.
Ummelen, N. (1997). Procedural and declarative information in software manuals: Effects on
information use, task performance and knowledge. Amsterdam: Rodopi.
320 JANSEN, MARRIOTT, YELLAND
Dow
nloa
ded
by [
Mon
ash
Uni
vers
ity L
ibra
ry]
at 1
8:11
26
Febr
uary
201
4